


Highlights
What are the main findings?
- Coherence Global 1-year interferometric coherence composites significantly outperform backscatter for permanent water detection in arid environments.
- Minimal overlap in detection failures proves strong complementarity between coherence and backscatter across all test sites.
What are the implications of the main findings?
- Integrating coherence datasets will directly enhance the performance of global water monitoring services.
- Upcoming NISAR Analysis Ready Data (ARD) will drastically simplify integration into existing operational pipelines.
Abstract
Synthetic Aperture Radar (SAR) backscatter serves as a key tool for tracking surface water dynamics; however, single-source data dependencies introduce systematic bias tied to the specific physical limitations of the signal. A primary challenge in SAR analysis is the backscatter ambiguity created by ‘water look-alike’ surfaces, which frequently result in false-positive water detections. We show that integrating interferometric repeat-pass coherence significantly enhances the robustness of hydrological mapping in environments where backscatter is prone to signal ambiguity. Using global-scale C-band Sentinel-1 (S1) VV-polarized one-year mosaics (December 2019 to November 2020), we first analyzed normalized backscatter and coherence signatures across major land cover and land use (LULC) classes. To benchmark the complementary value of these data streams, a tile-based minimum-error thresholding approach was applied to detect permanent water surfaces across five challenging global test sites. This evaluation was conducted without post-processing or masking to isolate the fundamental strengths of each dataset. The results indicate that coherence is an optimal complement to backscatter in arid and bare soil regions, where it vastly outperforms backscatter in mapping inland water surfaces. Crucially, since the spatial overlap of False Positives and False Negatives between datasets is minimal, the inherent complementarity of the datasets is proven here via a logical AND fusion rule, which significantly mitigates commission errors and yields substantial improvements in the aggregated F1-score and IoU performance. Analysis-ready L-band NISAR products could contribute to a more comprehensive approach for operational, large-scale surface water assessments.
1. Introduction
Over the last decades, the Earth’s water cycle has reached new levels of erratic behavior [1]. Surface water storage is steadily declining in many regions, and extremes like floods and droughts are becoming more frequent [2]. Our ability to observe these shifts and take informed action now stems primarily from satellite sensors, which have revolutionized our monitoring capabilities by providing a truly synoptic view of the hydrology of the globe [3].
The use of Synthetic Aperture Radar (SAR) is now an established practice for mapping and monitoring surface water dynamics [4]. This is evidenced by a range of currently active operational services, such as the Dynamic Surface Water eXtent (DSWx) product [5] and the Global Flood Monitoring (GFM) system [6]. These advancements are closely linked to the new era of Earth Observation (EO) sparked by the European Copernicus initiative’s Sentinel program, which introduced frequent, open-access and high-resolution observations [7].
However, it is vital to remark that the detectability of surface features is ultimately governed by the physical limitations unique to each sensing technology. While SAR provides critical all-weather monitoring, unlike optical sensors which cannot penetrate cloud cover, SAR-based water detection is often susceptible to high commission errors. Water-lookalike features like smooth, dry surfaces or wet snow can attenuate the radar return, creating a low-backscatter response that is nearly indistinguishable from that of a water body [8]. Optical data offer a viable means to mitigate backscatter-related biases [9], but cloud cover remains a fundamental constraint that hinders the prompt acquisition of surface observations. To avoid these constraints and improve the robustness of inland water mapping, interferometric coherence can serve as a critical complementary data source [10].
InSAR (Interferometric SAR) coherence quantifies the similarity between two SAR acquisitions based on phase stability. This metric ranges from 0, indicating no phase correlation between images, to 1, representing perfect phase correlation. Beyond its dependence on interferometric baseline length, system noise and incidence angle, coherence is strongly influenced by temporal changes in the scattering surface between acquisitions, affecting both geometric and dielectric properties. The use of InSAR coherence has been proven useful for LULC mapping [11,12,13] and for characterizing complex hydrological environments, such as monitoring wetland dynamics [14], tracking soil moisture changes [15] and detecting floods in urban areas [16,17,18] and in desert areas [19].
In this study, we evaluate the relevance of integrating interferometric coherence into a global hydrological mapping framework by utilizing a comprehensive annual dataset (2019–2020) of S1 backscatter and coherence, provided by [20]. First, we computed the global annual mean for both VV backscatter and 12-day coherence. By comparing global average distributions of the two datasets across a normalized common range, we assessed whether coherence offers enhanced contrast for isolating permanent water surfaces across different LULC types. Finally, our analysis focused on targeting regions where backscatter-based water mapping traditionally struggles, such as arid and desert environments. We implemented and applied a scene-adaptive bimodal thresholding approach where thresholds derived from bimodal sub-tiles are aggregated into a robust scene-adaptive threshold for water detection across five global sites. By omitting any post-processing or masking, we isolate and perform an evaluation of the specific contribution of coherence in permanent water detection accuracy, compared to backscatter. The scope of this study is to provide a foundational baseline analysis of a targeted one-year dataset by evaluating the relationship between radar backscatter and interferometric coherence. Ultimately, this work lays the necessary groundwork for possible future large-scale InSAR applications, focusing specifically on integrating interferometric data into operational, backscatter-based services for inland surface water monitoring.
2. Materials and Methods
2.1. Global Coherence and Backscatter Data
The global seasonal S1 C-band SAR interferometric coherence and backscatter datasets generated by [20] were deployed as the base for this study. Both datasets encompass a full year (1 December 2019 to 30 November 2020) and have global coverage (N: 82, S: −78, E: 180, W: −180) and a resolution of up to 3 arc-seconds. The radiometric terrain-corrected (RTC) gamma nought () backscatter is aggregated into 4 seasonal means and includes all 4 dual-polarimetric combinations available (VV, VH, HH, and HV). In contrast to the backscatter dataset, the interferometric coherence is aggregated into median seasonal composites (to account for outliers) and was processed for different repeat intervals (6, 12, 18, 24, 36, and 48 days) with co-polarization only.To align this dataset with the study’s focus on hydrological mapping and ensure global consistency, we selected seasonal composites of VV-polarized backscatter and coherence. This polarization was chosen for its proven efficacy in water-related applications [8,21]. Furthermore, we restricted the coherence analysis to the 12-day repeat cycle. Although shorter intervals are available, the 12-day cycle provides the most uniform global coverage, whereas longer intervals are often compromised by significant temporal coherence decay.
2.2. Auxiliary Datasets
To examine the backscatter and coherence datasets across various LULC classes, we utilized the Copernicus Global Land Cover 100m (Collection 3) map for 2019 [22]. Derived primarily from PROBA-V sensor data, this product provides a discrete global classification at a 100 m resolution. For the validation of permanent water body mapping, we employed the Joint Research Centre (JRC) Global Surface Water (GSW) dataset [23]. Specifically, we used the 30 m resolution Yearly Classification layer for 2020 to isolate inland permanent water surface pixels (detected throughout all months of the year). This layer, produced from optical Landsat imagery, serves as an independent baseline to estimate the accuracy of backscatter-based and coherence-based water extent mapping. All auxiliary datasets, including the Global Aridity Index v3 [24] for site characterization, were aligned to the common Equi7 grid (see next Section) and processed locally over each tile footprint for the permanent water detection experiments.
2.3. Annual Compositing, Correlation Analysis and Water Detection
To capture the permanent state of water bodies worldwide, we aggregated the original seasonal datasets into annual composites. For backscatter (VV), the annual composite was derived by calculating the mean of the 4 seasonal means in the linear power domain and converting them to dB, while for interferometric coherence (12-day VV), we computed the median of the four seasonal medians. To facilitate a direct, cross-layer comparison between these distinct signal types, we performed a Min–Max normalization on the linear backscatter data clipped to the 98th percentile of the linear intensity distribution. This procedure resulted in rescaling the values to a [0, 1] range, thereby aligning it with the native scale of the coherence products. These initial processing steps were maintained in the original geographic coordinate system (Lat/Lon).
Further, we tested the efficacy of backscatter and coherence for water detection across five diverse global sites, prioritizing areas where backscatter-based detection is challenging. Specifically, we performed the following:
- We reprojected the annual composite datasets into the Equi7 Grid [25] at a 500 m pixel sampling and then selected five T3 Equi7 tiles ( km) overlapping our study areas to obtain a constant spatial extent and equal pixel count across all sites. Equi7 was selected for its ability to preserve geometric accuracy and minimize data oversampling across diverse latitudes.
- Each input tile was subdivided into a regular grid of 128 × 128 pixel sub-tiles, and candidate sub-tiles exhibiting bimodal distributions were identified using Sarle’s bimodality coefficient [26] and Ashman’s D statistic [27]. A sub-tile is accepted here if or , preserving small water bodies with weak secondary modes. Ashman’s D was derived from a 128-bin histogram using modal widths for standard deviations. For each accepted bimodal sub-tile, a local threshold was estimated via the Kittler–Illingworth minimum-error criterion [28], which fits two Gaussian distributions to the histogram and finds the threshold minimizing total misclassification error. A robust global threshold was then derived using a 10% trimmed mean (active when ≥11 sub-tiles are accepted, defaulting to an arithmetic mean otherwise), and pixels below were classified as water.
3. Results
3.1. Global Coherence and Backscatter Signatures for Land Cover Classes
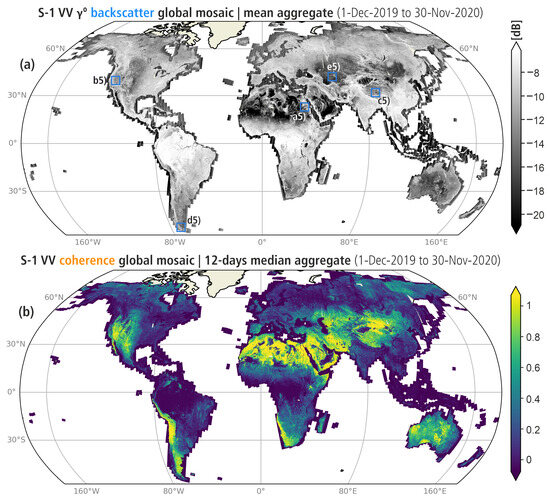
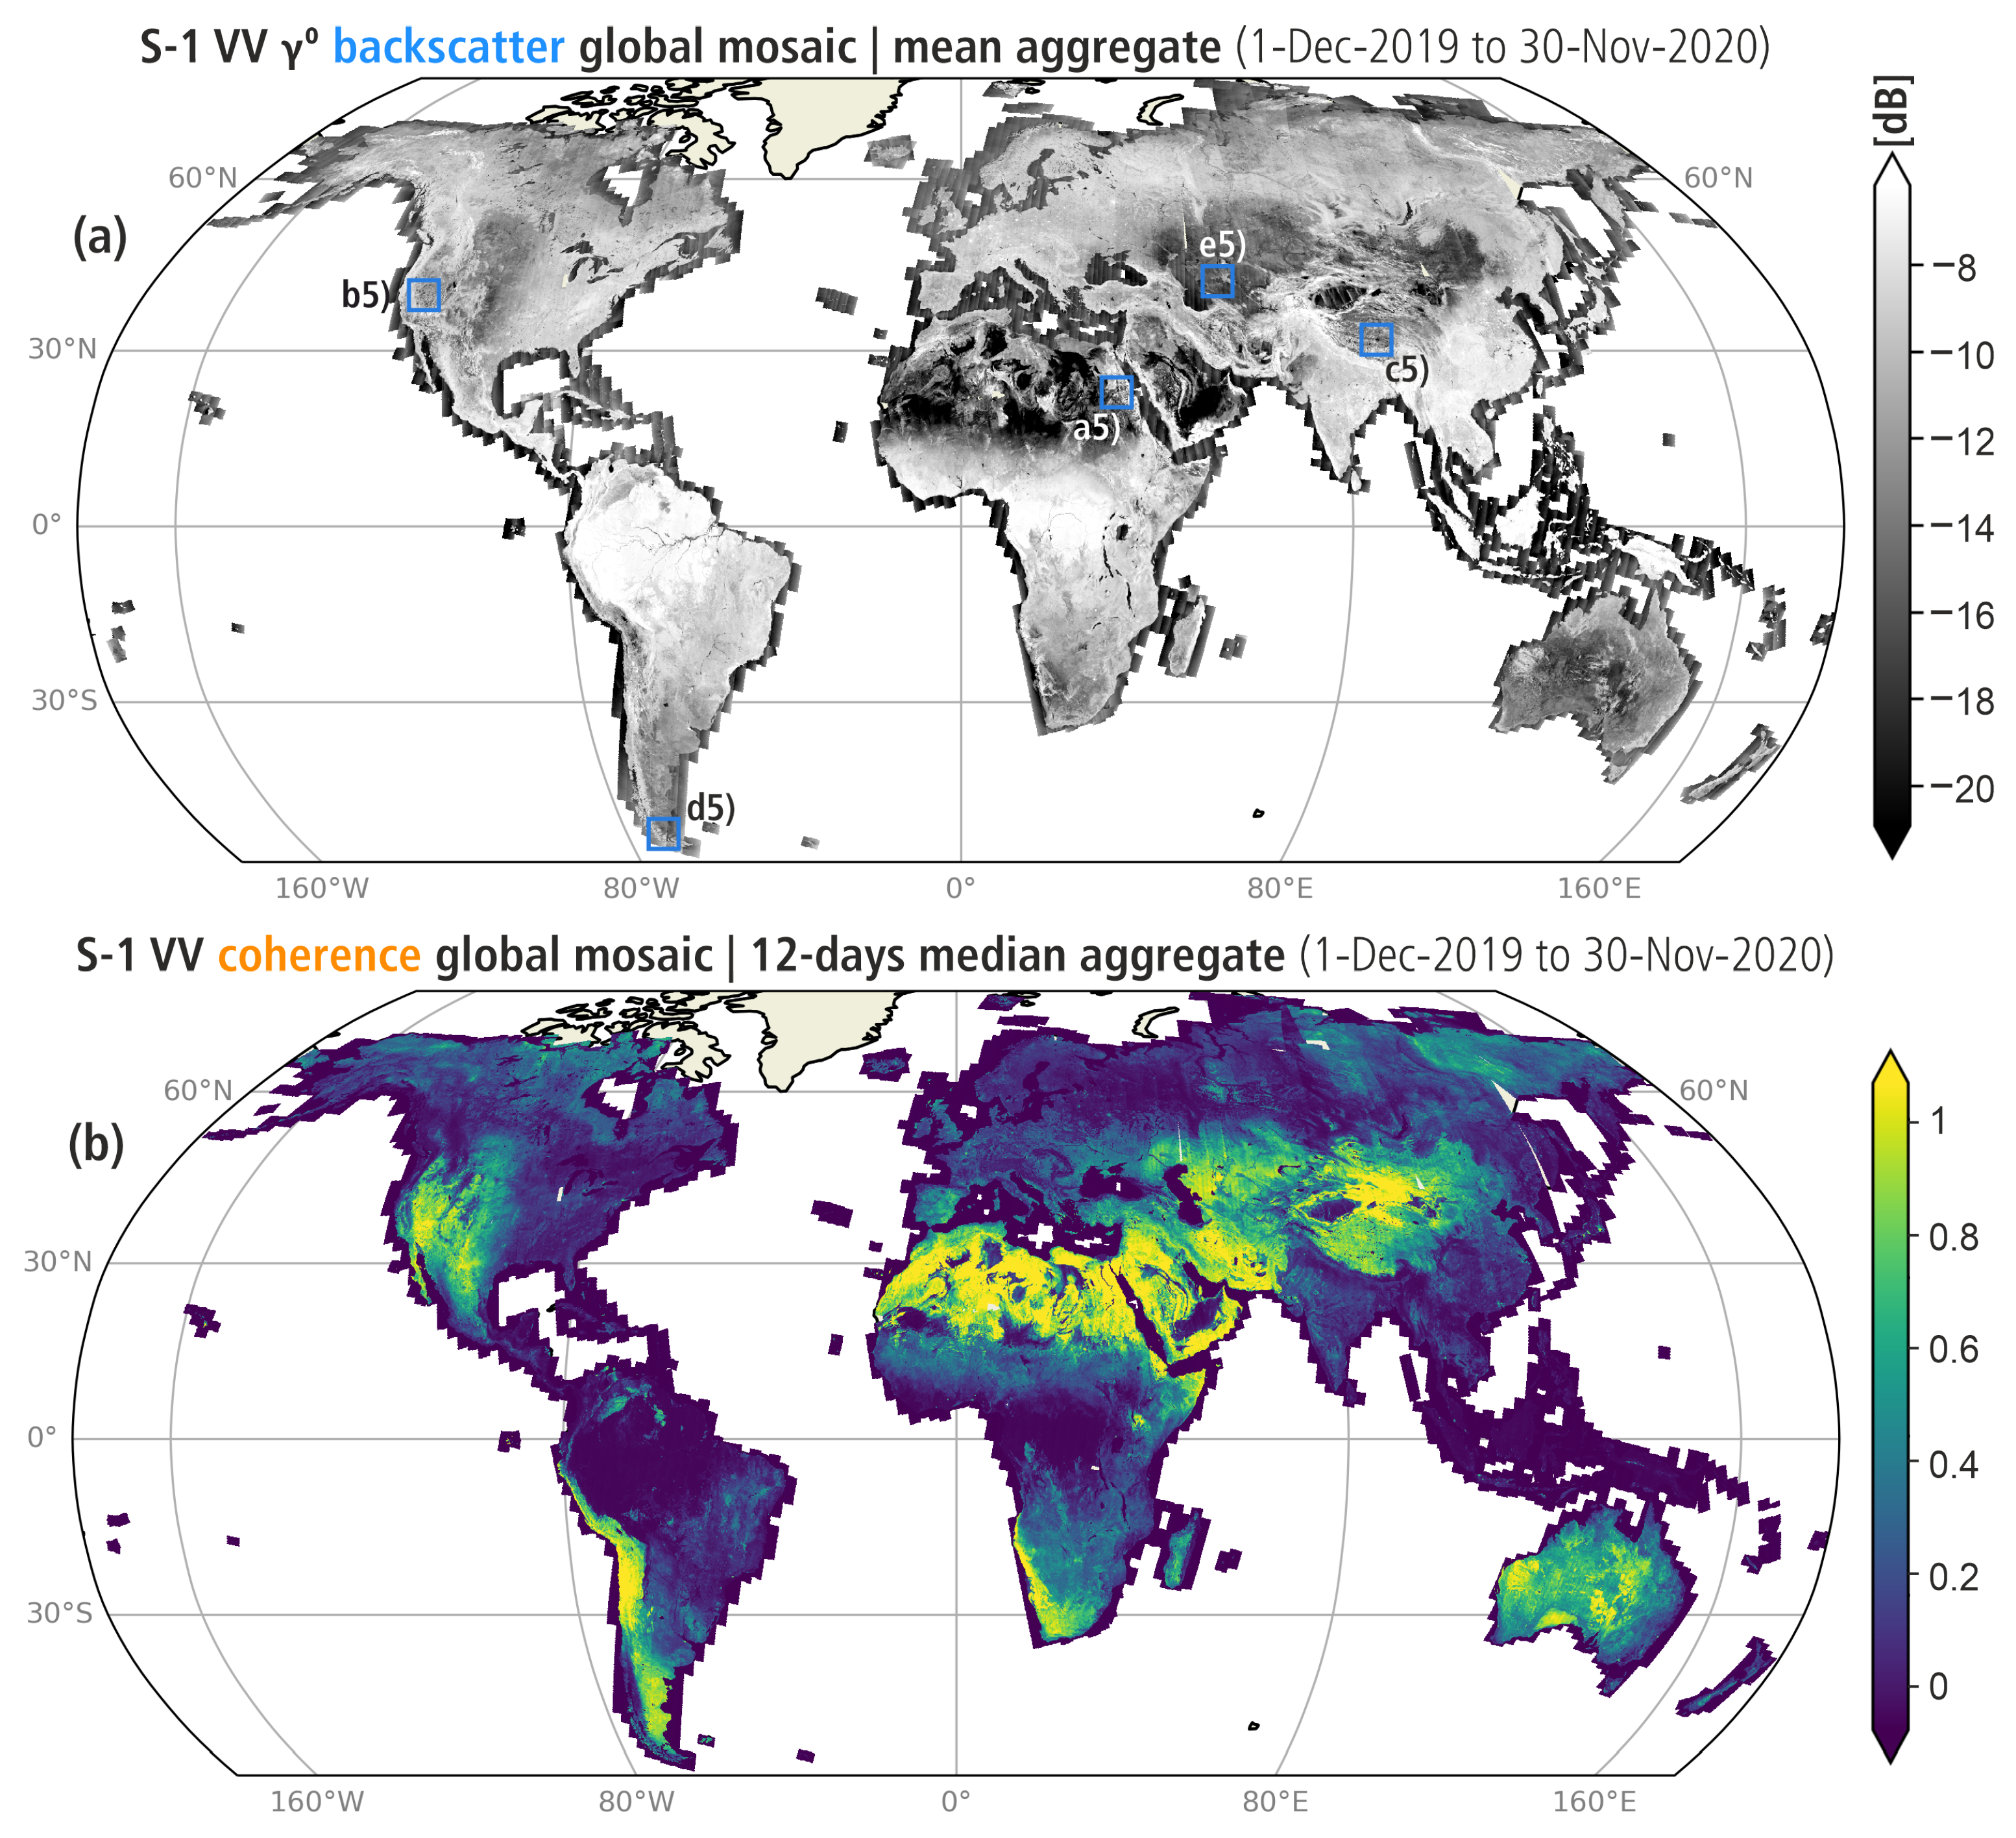
The final global mosaics depicting one year of mean S1 VV-polarized backscatter and median 12-day VV-polarized interferometric coherence are shown in Figure 1a,b. Distinct patterns emerge across different land surface types: desert regions (e.g., the African Sahara) typically exhibit high coherence in correspondence with low regional backscatter, whereas forested areas (e.g., the Amazon) display the opposite trend, with volume scattering mechanisms increasing backscatter. As expected, permanent water bodies show consistently low values for both variables.
Figure 1.
Mean and median composites of global (a) backscatter and (b) coherence spanning 1 December 2019 to 30 November 2020, derived from seasonal datasets by [20]. The geographic locations of water mapping study sites are shown in (a).
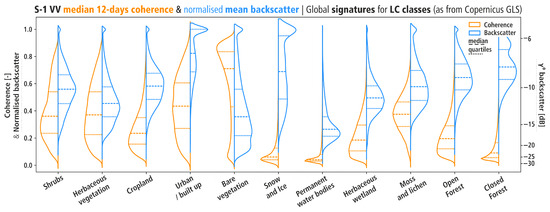
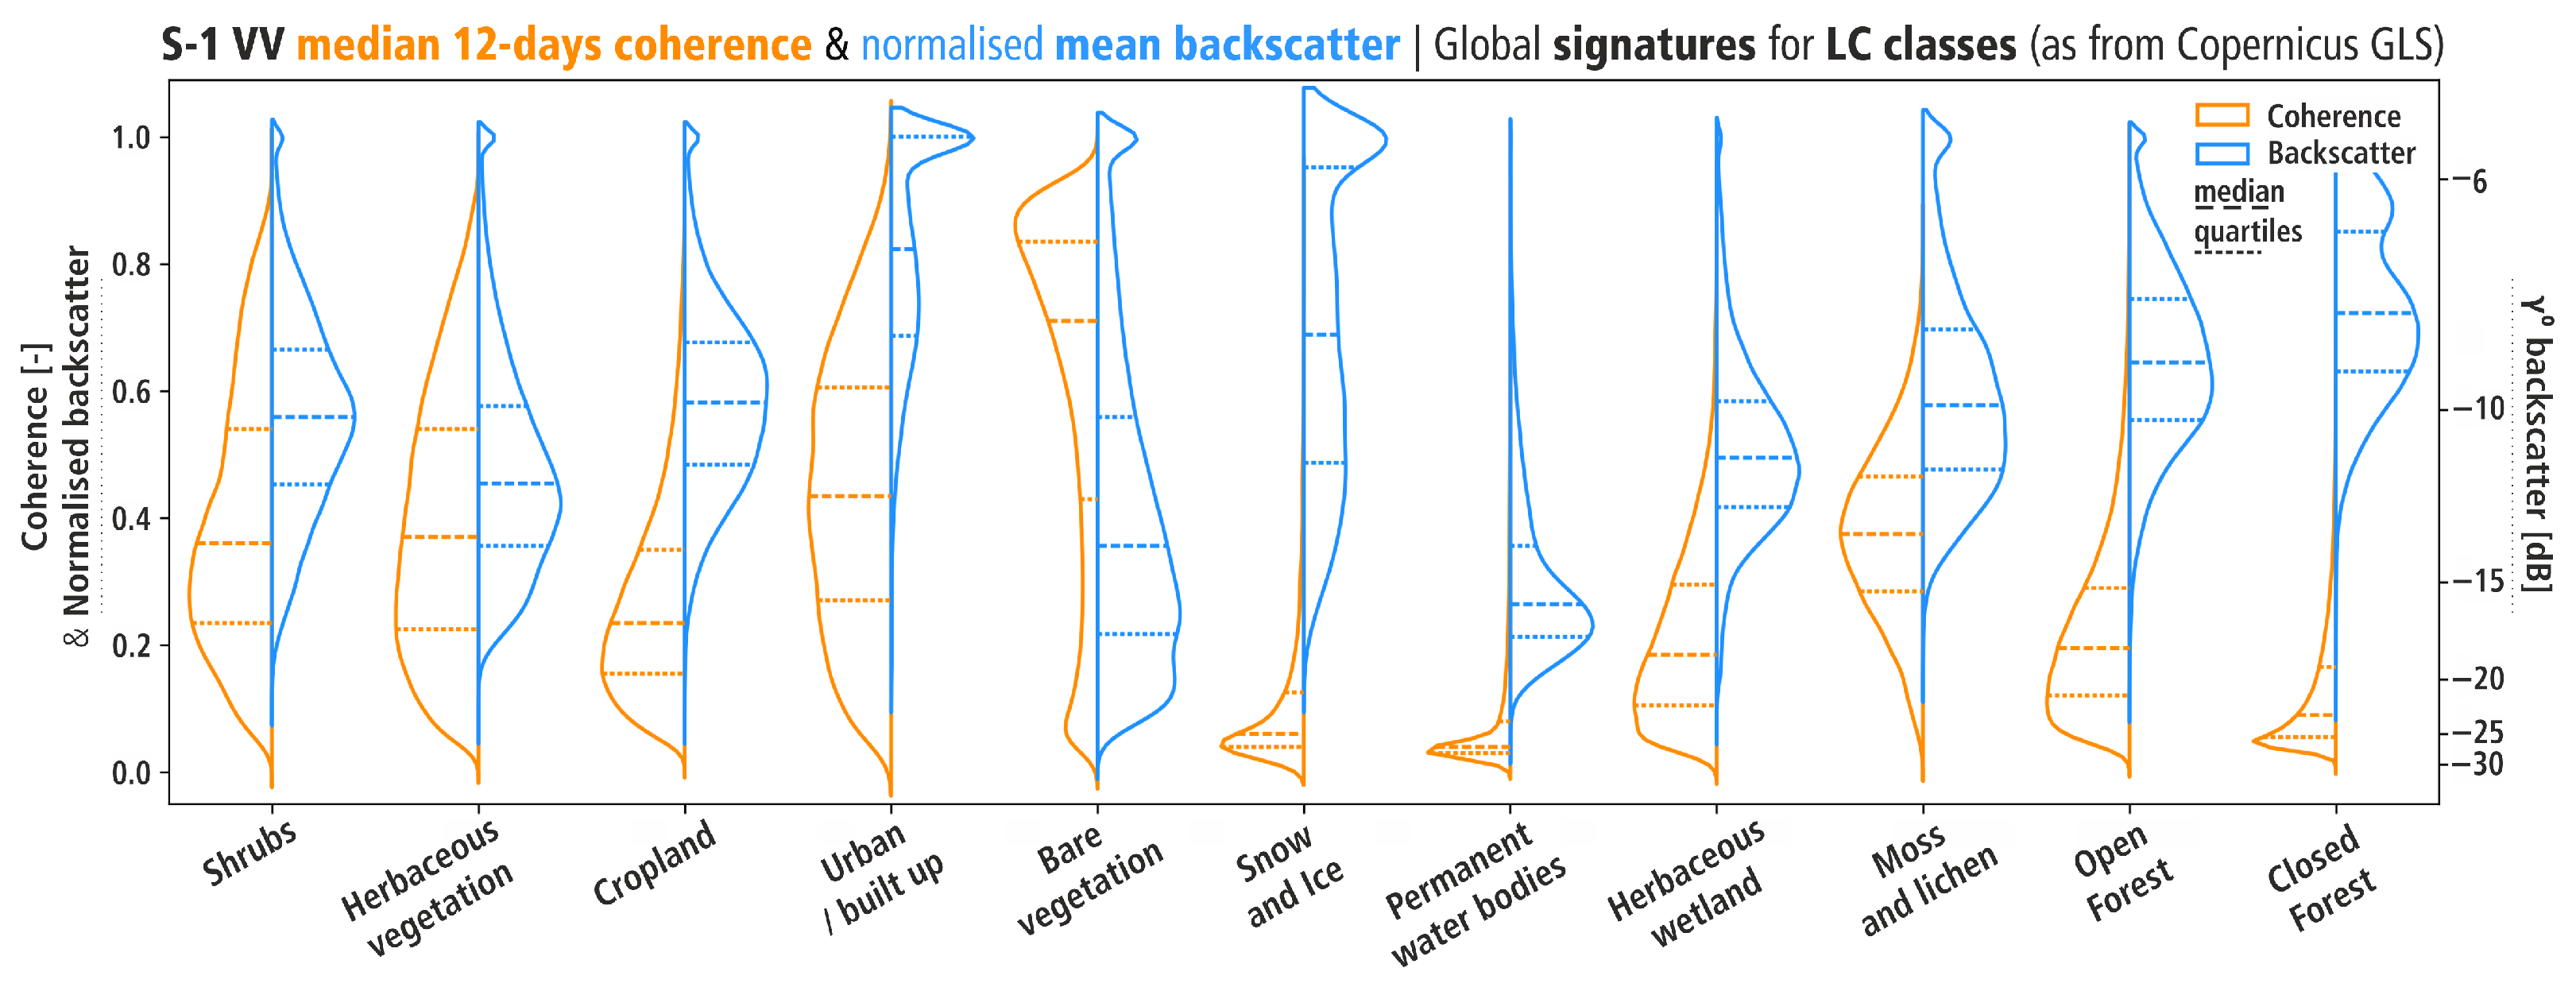
The violin plots in Figure 2 display the probability densities of both coherence and backscatter (normalized to the unit interval [0, 1]) for each LULC class. Over bare soils and over forest (both open and closed), the two signals exhibit an inverse behavior, occupying opposite ends of the normalized range and reflecting their differing sensitivity to surface and volume scattering. In the case of bare vegetation (i.e., arid environments), backscatter intensity is extremely low as a function of the soil’s dielectric properties and generally increases with soil moistureand roughness while coherence remains exceptionally high owing to the high temporal stability and correlation of SAR pairs over non-vegetated terrain. While this generally holds true, it is important to note (see also Figure 1b) that there are exceptions: sand dunes can exhibit very low coherence values [29] due to the constant wind-driven movement of these landforms, while anomalous high backscatter phenomena seem to be widespread also in arid settings, arising from sub-surface scattering effects due to the presence of bare rocks or stones [30]. Conversely, for forested surfaces, backscatter returns are significantly skewed toward high values due to volume scattering, while coherence is centered on low values due to vegetation-induced decorrelation. A similar, though less pronounced, trend appears in croplands. The Snow and Ice class is characterized by rather dispersed backscatter values, reflecting highly variable conditions such as rapid fluctuations in snow/ice extent and the presence of meltwater. This class poses challenges for establishing reliable annual trend estimates (especially considering that the permanent ice sheets of Antarctica and Greenland are not covered by the two datasets). Finally, classes such as Shrubs, Herbaceous Vegetation, and Wetlands show significant distributional overlap. Most importantly for hydrological applications, while both signals are consistently low for Permanent Water Bodies, their divergence across other land classes provides a critical advantage. This ensures that where one signal faces class ambiguity, the other can provide the necessary statistical contrast to ensure a more robust water detection power.
Figure 2.
Global signatures of LULC classes for yearly mean VV normalized backscatter and median 12-day VV coherence.
3.2. Assessing SAR Backscatter and Coherence for Water Mapping in Arid Areas
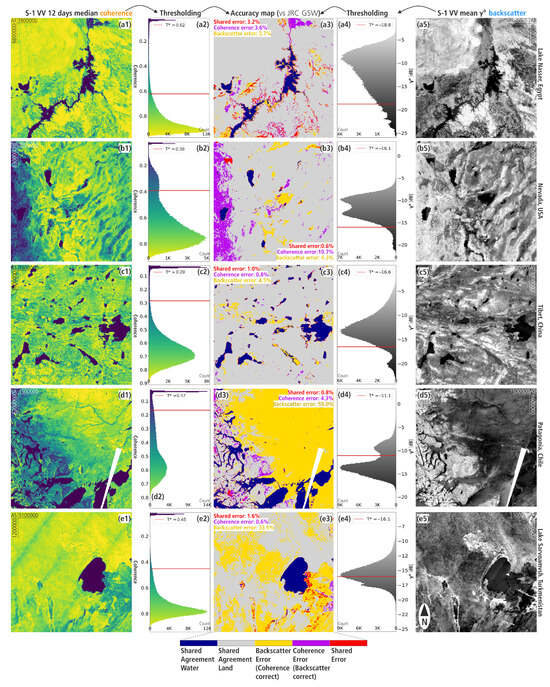
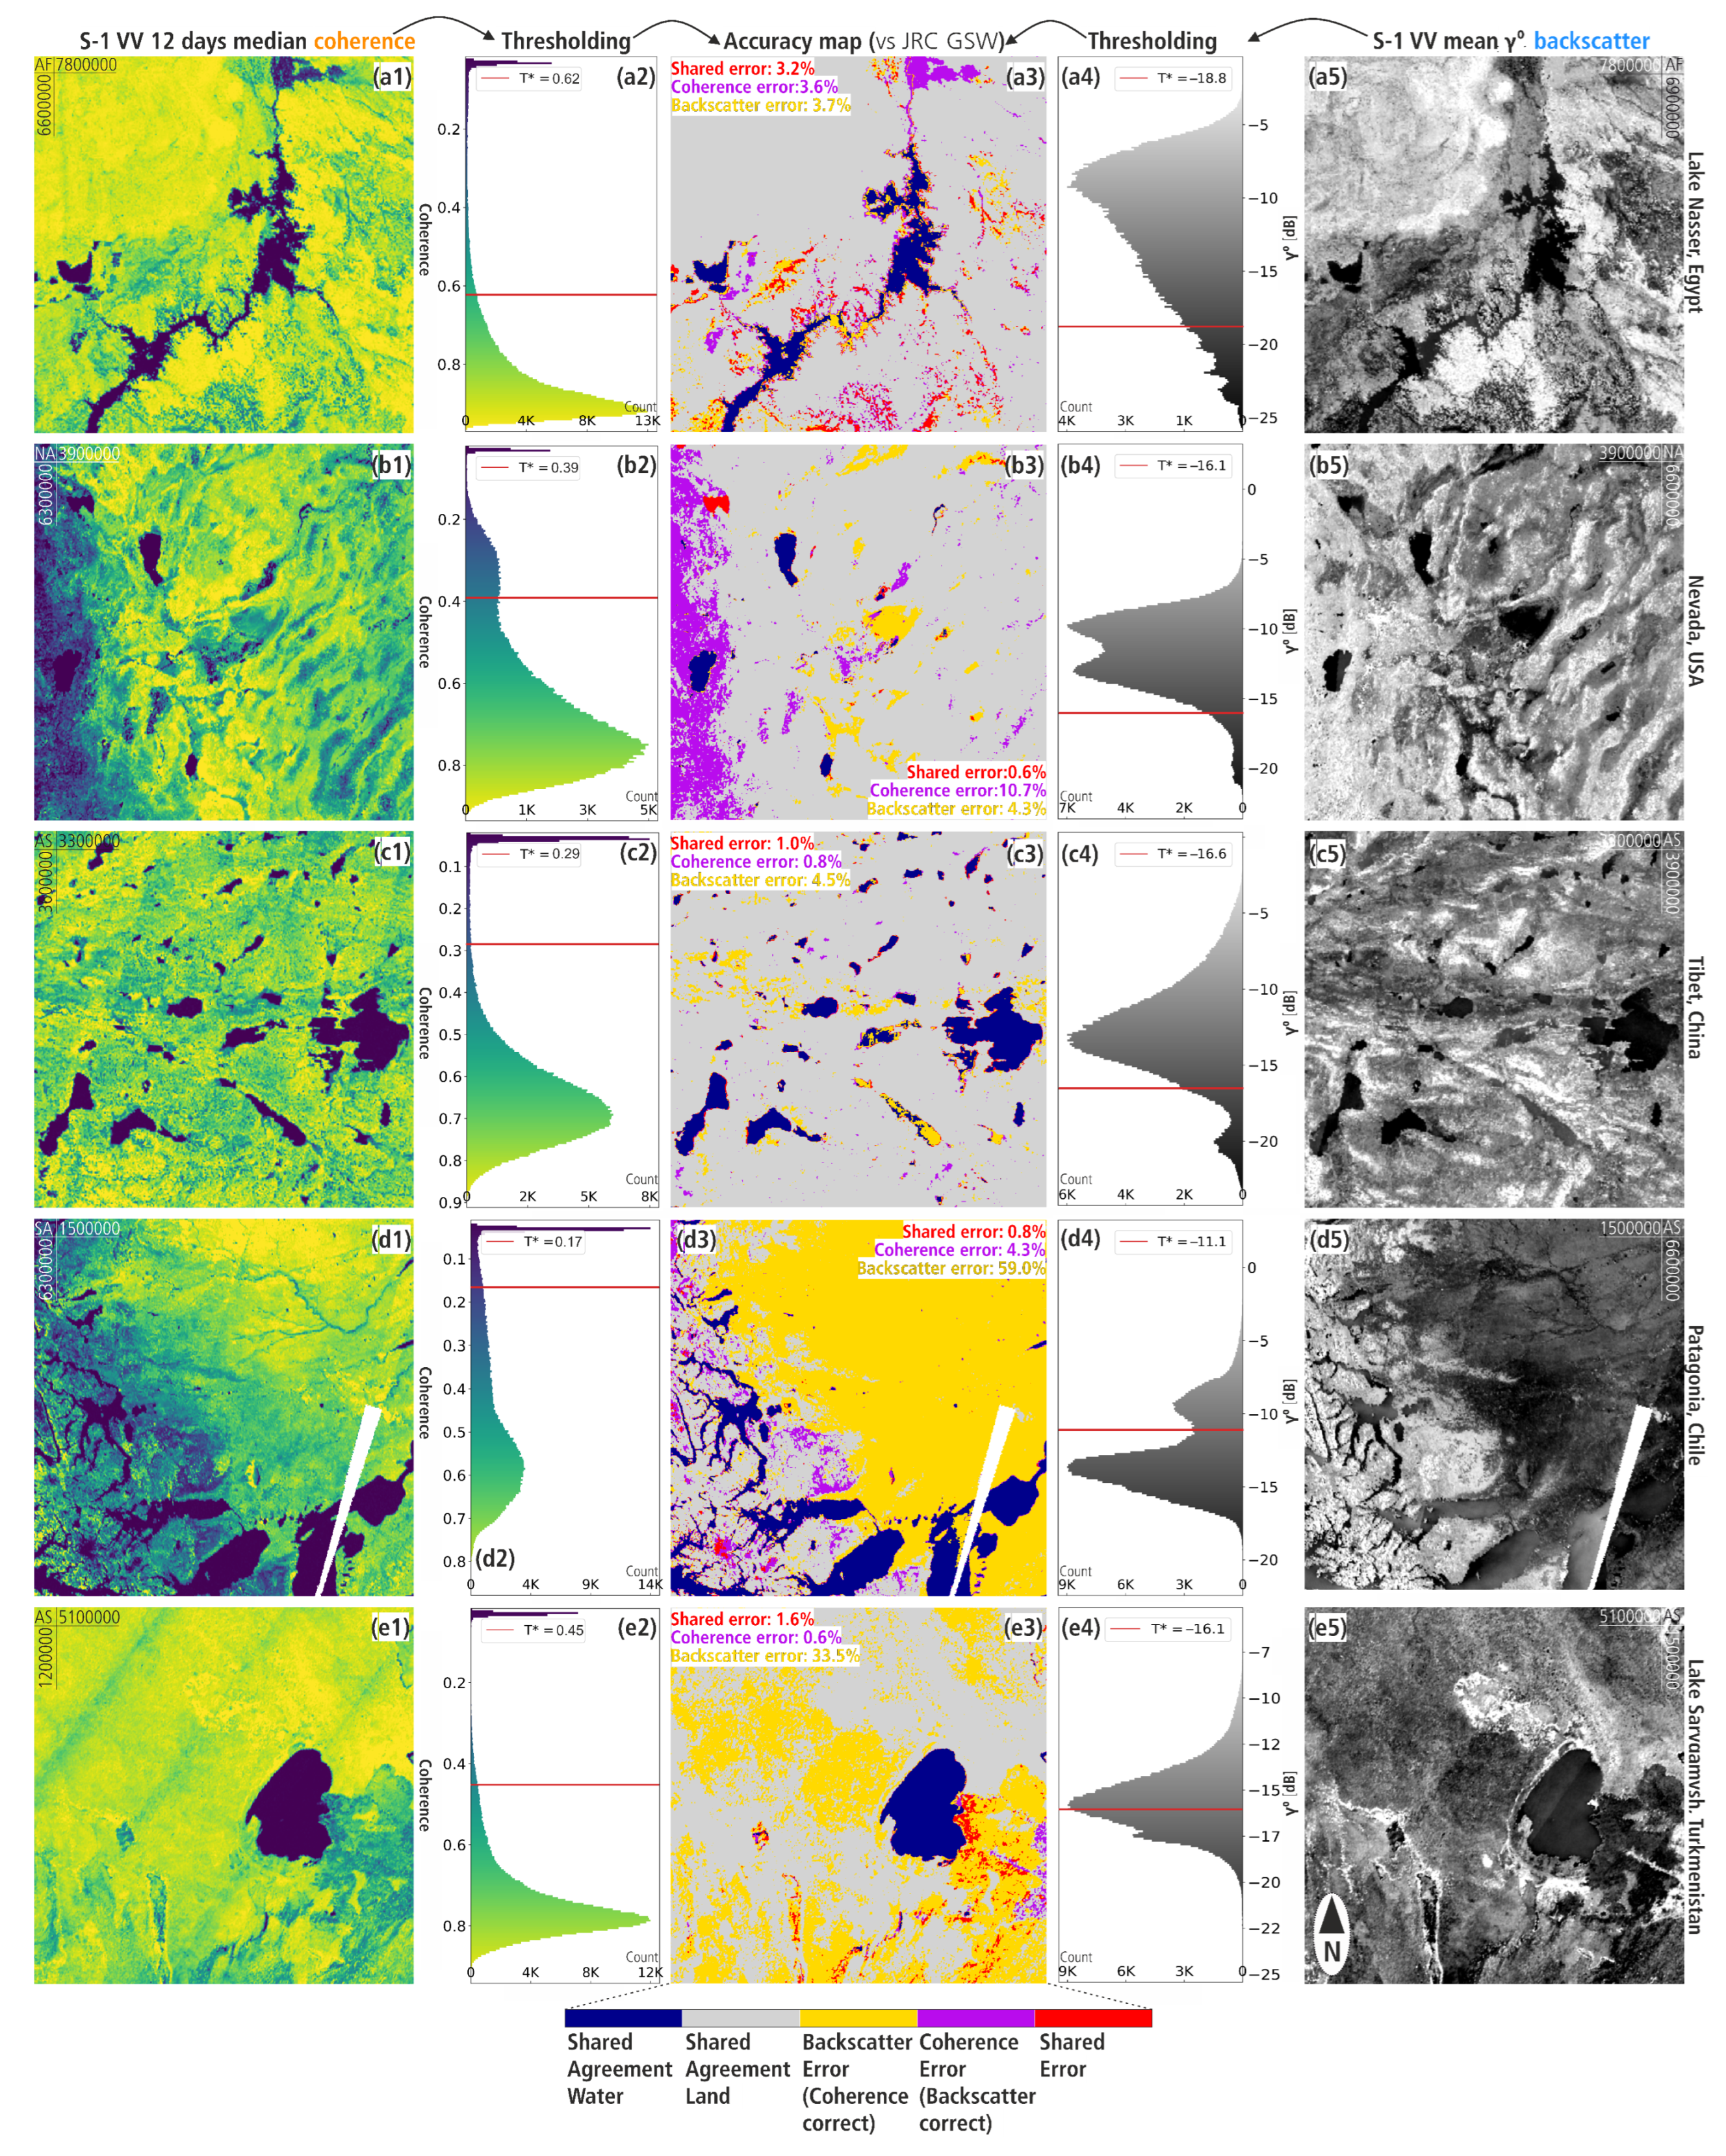
To assess whether coherence could provide an effective solution for improving the accuracy of backscatter-based water detection methods, we evaluated five test cases encompassing sites with varying proportions of dry lands, arid, and desert environments (Figure 3). In four out of five cases, coherence consistently demonstrated superior accuracy, while backscatter-based water mapping was superior only in the USA case study (Figure 3(b3)), where the prevailing vegetation land cover in proximity to water bodies (see Table 1) reduced the contrast needed for effective coherence-based water detection. In this case, the amount of total pixels of the tile where coherence holds either False Positives (FP) or False Negatives (FN) and backscatter holds contemporary True Positives (TP) is 10.7% (indicated in Figure 3 as Coherence Error), while the Backscatter Error (FP and FN for backscatter and contemporary TP for coherence) is 4.3%. For the Turkmenistan and Chile case studies, the Backscatter Error reaches very high figures, namely 33.5% and 59.0%, respectively (Figure 3(d3,e3)).
Figure 3.
Accuracy map comparing the single-source threshold-based permanent water detections using SAR backscatter and interferometric coherence (VV polarization), demonstrated across five case studies in arid environments.
Table 1.
Location (centroid of the considered Equi7 tiles) and environmental characteristics of the five test sites. Aridity Index from the Global Aridity Index database v3 [24], while aridity classes follow the UNEP convention. The land cover classes are from Copernicus Global Land Cover [22].
Shared detection errors (both FP and FN) between backscatter and coherence rarely overlapped spatially. The Egypt study site (Figure 3(a3)) exhibited the highest shared error among all test sites, yet this accounted for only 3.2% of the total pixels. However, because permanent water represents a minor fraction of the total pixels in these arid environments, shared detection errors impact both land and water surfaces. Considering this error structure, we evaluated whether simple logical fusion rules (logical AND and logical OR applied to binarized retrievals) could outperform single-source baselines across all case studies in terms of precision, recall, F1-score, Intersection over Union (IoU), and overall accuracy (Table 2).
Table 2.
Micro-averaged accuracy metrics across all regional case studies, for the two single-source retrievals and the two fusion rules (logical AND and logical OR).
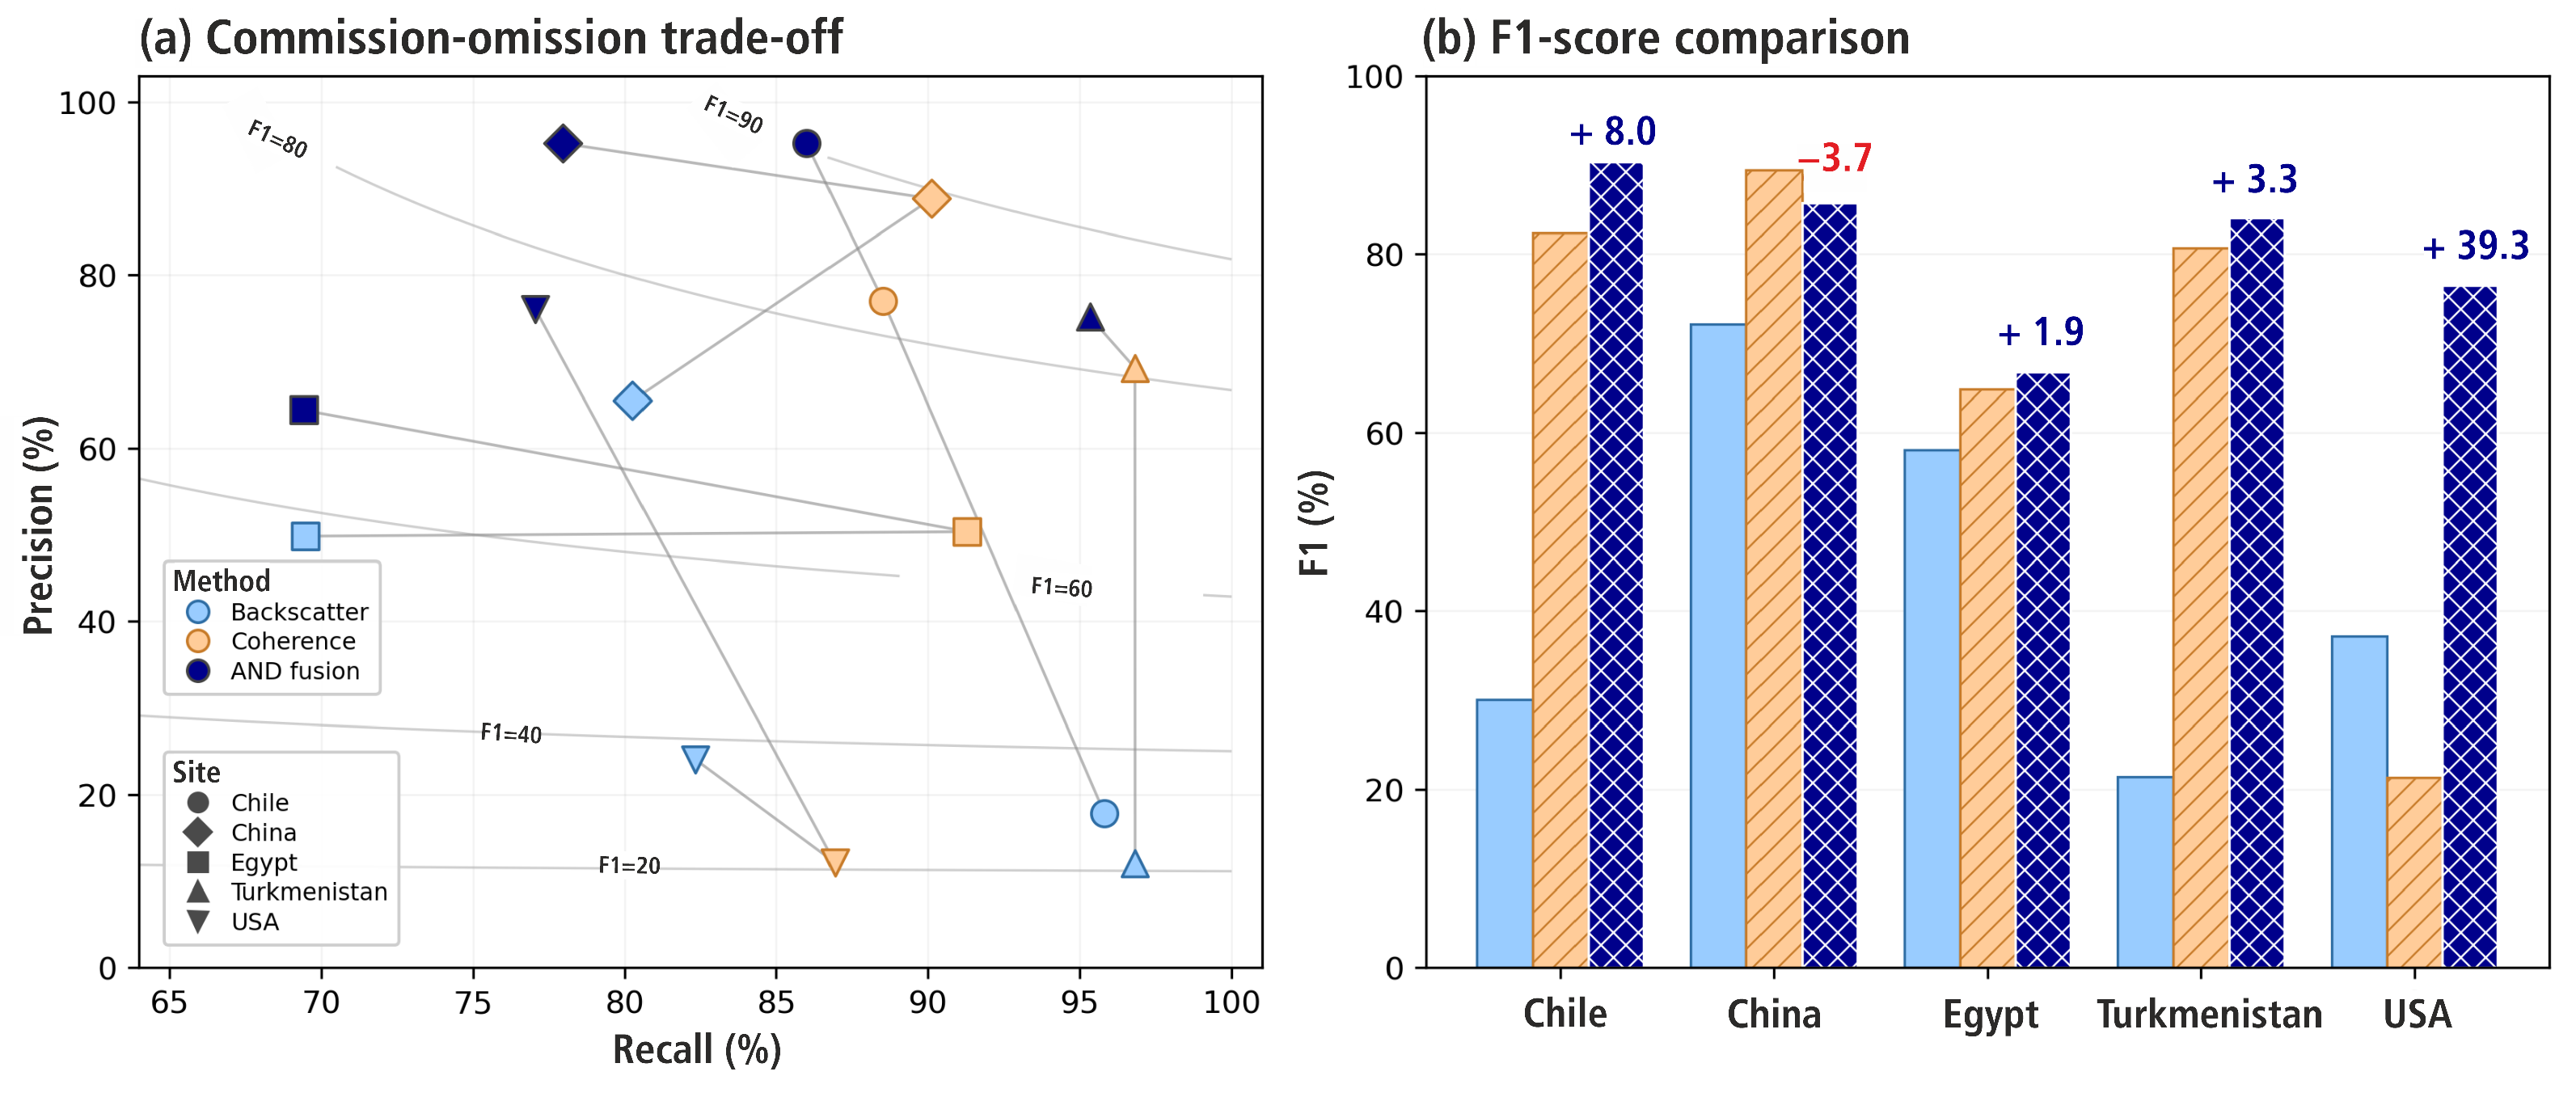
The logical AND fusion (coherence AND backscatter) increases the aggregated F1-score from 70.3% to 82.9% and IoU from 54.3% to 70.7% relative to the best single source (i.e., coherence). This performance gain is driven entirely by commission error reduction: precision rises from 57.5% to 84.1% , while recall drops modestly from 90.5% to 81.7% . By contrast, the logical OR rule follows the predicted error pattern and while it achieves high recall (95.2%), it also severely degrades the F1-score to 34.9% , performing worse than either single source.
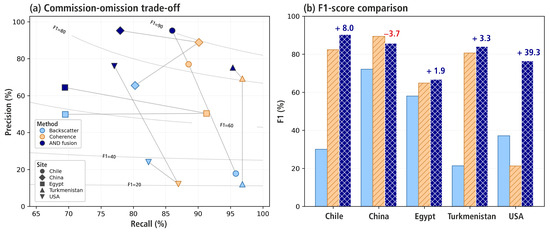
Figure 4 illustrates this behavior by site, comparing single source retrievals (i.e., coherence and backscatter) with the fused retrievals (logical AND). Panel (a) highlights that for each location, the AND fusion consistently exchanges a modest recall penalty for a substantial precision gain. Panel (b) shows that the fused retrieval outperforms the better single source at four of the five sites, yielding major F1-score improvements, with the largest gain occurring at the USA site (+39.3% points). The China site is the sole exception (–3.7% points) because its coherence retrieval was already well-balanced (88.8% precision, 90.1% recall). Here, the logical AND fusion yields negligible commission reduction while restricting the overall recall to the weaker source’s level (backscatter, with 80.3%).
Figure 4.
(a) Commission–omission trade-off plots with grey lines connecting the retrievals of each case site and contours indicating iso-F1 levels. (b) Comparison of F1-scores (with score gains or losses compared to the best single source retrieval) for backscatter only (light blue colored bars), coherence only (orange colored bars), and fused retrievals with the logical AND rule (dark blue colored bars).
4. Discussion
According to [31], dry lands now account for approximately 41% of the Earth’s land surface, a figure that has increased significantly in recent decades. Despite their vast geographical extent, arid regions remain under-researched because they are often remote and poorly populated [30]. Interferometric coherence data can offer significant untapped potential for advancing global LC change detection in those areas. The sharp contrast between stable, highly coherent terrain and the decorrelated signal of water makes coherence a source of essential information for mapping both permanent water bodies and characterizing inland surface water dynamics, especially in sparsely vegetated areas, where no or only few pieces of in situ data are available.
Conversely, as illustrated in Figure 3(b3,d3), coherence is also severely challenged in detecting water outside of arid environments, particularly in vegetated areas. Since temporal decorrelation can result from various sources, low coherence values should not be unambiguously assigned to a particular phenomenon without careful consideration. Integration of coherence is recommended alongside primary data sources such as SAR backscatter, since it remains an established standard for hydrological monitoring. Coherence may be most valuable in arid environments, where the causes of temporal decorrelation are limited and can therefore be controlled.
Advanced techniques were not explored here, as methodological innovation lies beyond the scope of this study. Although a key limitation of our thresholding scheme is its reliance on sub-tile availability, our comparative findings remain valid because both coherence- and backscatter-based retrievals were evaluated on an identical grid. To expand beyond these initial test cases, future work should explore alternative methods across diverse aridity and vegetation regimes to establish operational boundaries. We also report that the 500 m resampling used in this study may fragment sub-pixel water bodies and prevents direct comparison with higher resolution benchmarks. However, using identical grid centers across all layers affects each dataset equally, ensuring the relative comparison remains unbiased. Finally, we state that the present results concern the steady-state delineation of permanent water and not the detection of inundation dynamics. Permanent water masks form the static baseline on which change-based flood services depend, and improving them is of direct operational value.
Traditionally, the primary bottleneck in using interferometric coherence has been the high computational cost and processing time required for its generation in acceptable time frames. However, with the launch of NISAR and specifically the Level-2 L-band NISAR GUNW products [32], coherence will become a more accessible asset for a wider array of Earth observation applications. Standard Level-2 GUNW products offer a nominal latency of 1 to 3 days and feature 12-day repeat-pass co-polarized interferograms (HH or VV). By providing a 20 m and 80 m normalized coherence posting [33], these products will support both high-precision surface detection at the finer scale and regional-scale analysis at the coarser resolution. Finally, it is also worth noting that L-band coherence offers advantages over the S1 data examined in this study, since longer wavelengths have demonstrated greater resilience against vegetation-induced decorrelation [34].
5. Conclusions
The presented study shows that interferometric coherence provides valuable complementary data to SAR backscatter for inland surface water mapping in arid environments. After assembling a global annual mosaic of backscatter mean and coherence median (both VV-pol) from 2019 to 2020, we analyzed LC signatures from both signals and analyzed their hydrological mapping implications for permanent water detection. A tile-based thresholding approach was applied to both datasets for five different geographic locations, without using any post-processing or masks. Coherence demonstrated superiority in mapping permanent surface water over arid and bare soil regions, while revealing limitations in vegetated areas. Since we find that FP and FN errors from backscatter and coherence rarely overlap in our cases, we argue that a combined approach can effectively mitigate single-source SAR monitoring ambiguities. With the upcoming analysis-ready interferometric coherence products becoming freely accessible from the L-band NISAR mission, coherence can potentially become an essential enabler for resolving some backscatter inherent limits, in the framework of inland surface water mapping.
Author Contributions
Conceptualization, D.F. and W.W.; methodology, D.F.; software, D.F.; validation, D.F.; formal analysis, D.F.; investigation, D.F., M.H., and F.R.; resources, W.W.; data curation, D.F.; writing—original draft preparation, D.F.; writing—review and editing, D.F., F.R., M.H., and W.W.; visualization, D.F.; supervision, W.W.; project administration, W.W.; funding acquisition, W.W. All authors have read and agreed to the published version of the manuscript.
Funding
The authors acknowledge TU Wien Bibliothek for financial support through its Open Access Funding Programme.
Data Availability Statement
The raw data supporting the conclusions of this article are open-source and described within the manuscript. Derived data supporting our analysis will be made available by the authors on request.
Acknowledgments
During the preparation of this manuscript, the author Davide Festa used different large language models to improve the readability and language of the manuscript. The authors have reviewed and edited the output and take full responsibility for the content of this publication.
Conflicts of Interest
The authors declare no conflicts of interest.
Abbreviations
The following abbreviations are used in this manuscript:
| SAR | Synthethic Aperture Radar |
| S1 | Sentinel-1 |
| LC | Land Cover |
| DSWx | Dynamic Surface Water eXtent |
| GFM | Global Flood Monitoring |
| EO | Earth Observation |
| InSAR | Interferometric SAR |
| LULC | Land use/land cover |
| RTC | Radiometric terrain-corrected |
| JRC | Joint Research Center |
| GSW | Global Surface Water |
| FP | False Positive |
| FN | False Negative |
| TP | True Positive |
| TN | True Negative |
References
- World Meteorological Organization. State of Global Water Resources 2024; Technical report; World Meteorological Organization: Geneva, Switzerland, 2025. [Google Scholar] [CrossRef] [Scilit]
- Chandanpurkar, H.A.; Famiglietti, J.S.; Gopalan, K.; Wiese, D.N.; Wada, Y.; Kakinuma, K.; Reager, J.T.; Zhang, F. Unprecedented Continental Drying, Shrinking Freshwater Availability, and Increasing Land Contributions to Sea Level Rise. Sci. Adv. 2025, 11, eadx0298. [Google Scholar] [CrossRef] [Scilit]
- McCabe, M.F.; Rodell, M.; Alsdorf, D.E.; Miralles, D.G.; Uijlenhoet, R.; Wagner, W.; Lucieer, A.; Houborg, R.; Verhoest, N.E.C.; Franz, T.E.; et al. The Future of Earth Observation in Hydrology. Hydrol. Earth Syst. Sci. 2017, 21, 3879–3914. [Google Scholar] [CrossRef] [Scilit]
- Tottrup, C.; Druce, D.; Meyer, R.P.; Christensen, M.; Riffler, M.; Dulleck, B.; Rastner, P.; Jupova, K.; Sokoup, T.; Haag, A.; et al. Surface Water Dynamics from Space: A Round Robin Intercomparison of Using Optical and SAR High-Resolution Satellite Observations for Regional Surface Water Detection. Remote Sens. 2022, 14, 2410. [Google Scholar] [CrossRef] [Scilit]
- OPERA. OPERA Dynamic Surface Water Extent from Sentinel-1 Version 1; NASA Physical Oceanography Distributed Active Archive Center (PO.DAAC): Pasadena, CA, USA, 2024. [Google Scholar] [CrossRef]
- Wagner, W.; Bauer-Marschallinger, B.; Roth, F.; Raiger-Stachl, T.; Reimer, C.; McCormick, N.; Matgen, P.; Chini, M.; Li, Y.; Martinis, S.; et al. The Fully-Automatic Sentinel-1 Global Flood Monitoring Service: Scientific Challenges and Future Directions. Remote Sens. Environ. 2026, 333, 115108. [Google Scholar] [CrossRef] [Scilit]
- Showstack, R. Sentinel Satellites Initiate New Era in Earth Observation. EoS Trans. 2014, 95, 239–240. [Google Scholar] [CrossRef] [Scilit]
- Bauer-Marschallinger, B.; Cao, S.; Tupas, M.E.; Roth, F.; Navacchi, C.; Melzer, T.; Freeman, V.; Wagner, W. Satellite-Based Flood Mapping through Bayesian Inference from a Sentinel-1 SAR Datacube. Remote Sens. 2022, 14, 3673. [Google Scholar] [CrossRef] [Scilit]
- Festa, D.; Hassaan, M.; Wagner, W. SAR and Optical Imagery for Dynamic Global Surface Water Monitoring: Addressing Sensor-Specific Uncertainty for Data Fusion. SSRN 2026. preprint. [Google Scholar] [CrossRef] [Scilit]
- Jacob, A.W.; Vicente-Guijalba, F.; Lopez-Martinez, C.; Lopez-Sanchez, J.M.; Litzinger, M.; Kristen, H.; Mestre-Quereda, A.; Ziolkowski, D.; Lavalle, M.; Notarnicola, C.; et al. Sentinel-1 InSAR Coherence for Land Cover Mapping: A Comparison of Multiple Feature-Based Classifiers. IEEE J. Sel. Top. Appl. Earth Obs. Remote Sens. 2020, 13, 535–552. [Google Scholar] [CrossRef] [Scilit]
- Engdahl, M.; Hyyppa, J. Land-Cover Classification Using Multitemporal ERS-1/2 Insar Data. IEEE Trans. Geosci. Remote Sens. 2003, 41, 1620–1628. [Google Scholar] [CrossRef] [Scilit]
- Nikaein, T.; Iannini, L.; Molijn, R.A.; Lopez-Dekker, P. On the Value of Sentinel-1 InSAR Coherence Time-Series for Vegetation Classification. Remote Sens. 2021, 13, 3300. [Google Scholar] [CrossRef] [Scilit]
- Santoro, M.; Askne, J.I.; Wegmuller, U.; Werner, C.L. Observations, Modeling, and Applications of ERS-ENVISAT Coherence Over Land Surfaces. IEEE Trans. Geosci. Remote Sens. 2007, 45, 2600–2611. [Google Scholar] [CrossRef] [Scilit]
- Gondwe, B.R.N.; Hong, S.H.; Wdowinski, S.; Bauer-Gottwein, P. Hydrologic Dynamics of the Ground-Water-Dependent Sian Ka’an Wetlands, Mexico, Derived from InSAR and SAR Data. Wetlands 2010, 30, 1–13. [Google Scholar] [CrossRef] [Scilit]
- Walker, R.Z.; Boyd, D.S.; Andersen, R.; Large, D.J. InSAR Coherence Linked to Soil Moisture, Water Level and Precipitation on a Blanket Peatland in Scotland. Remote Sens. 2025, 17, 3507. [Google Scholar] [CrossRef] [Scilit]
- Pulvirenti, L.; Chini, M.; Pierdicca, N.; Boni, G. Use of SAR Data for Detecting Floodwater in Urban and Agricultural Areas: The Role of the Interferometric Coherence. IEEE Trans. Geosci. Remote Sens. 2016, 54, 1532–1544. [Google Scholar] [CrossRef] [Scilit]
- Li, Y.; Martinis, S.; Wieland, M.; Schlaffer, S.; Natsuaki, R. Urban Flood Mapping Using SAR Intensity and Interferometric Coherence via Bayesian Network Fusion. Remote Sens. 2019, 11, 2231. [Google Scholar] [CrossRef] [Scilit]
- Zhang, X.; Chan, N.W.; Pan, B.; Ge, X.; Yang, H. Mapping Flood by the Object-Based Method Using Backscattering Coefficient and Interference Coherence of Sentinel-1 Time Series. Sci. Total Environ. 2021, 794, 148388. [Google Scholar] [CrossRef] [Scilit]
- Garg, S.; Dasgupta, A.; Motagh, M.; Martinis, S.; Selvakumaran, S. Unlocking the Full Potential of Sentinel-1 for Flood Detection in Arid Regions. Remote Sens. Environ. 2024, 315, 114417. [Google Scholar] [CrossRef] [Scilit]
- Kellndorfer, J.; Cartus, O.; Lavalle, M.; Magnard, C.; Milillo, P.; Oveisgharan, S.; Osmanoglu, B.; Rosen, P.A.; Wegmüller, U. Global Seasonal Sentinel-1 Interferometric Coherence and Backscatter Data Set. Sci. Data 2022, 9, 73. [Google Scholar] [CrossRef] [Scilit]
- Twele, A.; Cao, W.; Plank, S.; Martinis, S. Sentinel-1-Based Flood Mapping: A Fully Automated Processing Chain. Int. J. Remote Sens. 2016, 37, 2990–3004. [Google Scholar] [CrossRef] [Scilit]
- Copernicus Land Monitoring Service; Copernicus Land Monitoring Service Helpdesk. Land Cover 2015-2019 (Raster 100 m), Global, Annual—Version 3. 2015. Available online: https://doi.org/10.2909/C6377C6E-76CC-4D03-8330-628A03693042 (accessed on 1 August 2026).
- Pekel, J.F.; Cottam, A.; Gorelick, N.; Belward, A.S. High-Resolution Mapping of Global Surface Water and Its Long-Term Changes. Nature 2016, 540, 418–422. [Google Scholar] [CrossRef] [Scilit]
- Trabucco, A.; Zomer, R. Global Aridity Index and Potential Evapotranspiration (ET0) Database: Version 3, 2022. Available online: https://doi.org/10.6084/M9.FIGSHARE.7504448.V5 (accessed on 1 August 2026).
- Bauer-Marschallinger, B.; Sabel, D.; Wagner, W. Optimisation of Global Grids for High-Resolution Remote Sensing Data. Comput. Geosci. 2014, 72, 84–93. [Google Scholar] [CrossRef] [Scilit]
- Pfister, R.; Schwarz, K.A.; Janczyk, M.; Dale, R.; Freeman, J.B. Good Things Peak in Pairs: A Note on the Bimodality Coefficient. Front. Psychol. 2013, 4, 700. [Google Scholar] [CrossRef] [Scilit]
- Ashman, K.A.; Bird, C.M.; Zepf, S.E. Detecting Bimodality in Astronomical Datasets. Astron. J. 1994, 108, 2348. [Google Scholar] [CrossRef] [Scilit]
- Kittler, J.; Illingworth, J. Minimum Error Thresholding. Pattern Recognit. 1986, 19, 41–47. [Google Scholar] [CrossRef] [Scilit]
- Havivi, S.; Amir, D.; Schvartzman, I.; August, Y.; Maman, S.; Rotman, S.R.; Blumberg, D.G. Mapping Dune Dynamics by InSAR Coherence. Earth Surf. Process. Landf. 2018, 43, 1229–1240. [Google Scholar] [CrossRef] [Scilit]
- Wagner, W.; Lindorfer, R.; Melzer, T.; Hahn, S.; Bauer-Marschallinger, B.; Morrison, K.; Calvet, J.C.; Hobbs, S.; Quast, R.; Greimeister-Pfeil, I.; et al. Widespread Occurrence of Anomalous C-band Backscatter Signals in Arid Environments Caused by Subsurface Scattering. Remote Sens. Environ. 2022, 276, 113025. [Google Scholar] [CrossRef] [Scilit]
- Prăvălie, R. Drylands Extent and Environmental Issues. A Global Approach. Earth-Sci. Rev. 2016, 161, 259–278. [Google Scholar] [CrossRef] [Scilit]
- Meyer, F.J.; Rosen, P.A.; Fattahi, H.; Hogenson, K.; Albright, R.W.; Wagner, C.; Short, G.; Kristenson, K.; Kennedy, J.H.; Kristenson, H. Making NISAR Data Accessible to the Community. In Proceedings of the 15th European Conference on Synthetic Aperture Radar, Munich, Germany, 23–26 April 2024; pp. 1107–1111. [Google Scholar]
- Geocoded Unwrapped Interferogram—NISAR Data User Guide. Available online: https://nisar-docs.asf.alaska.edu/gunw/ (accessed on 1 August 2026).
- Takeuchi, S.; Oguro, Y. A Comparative Study of Coherence Patterns in C-band and L-band Interferometric SAR from Tropical Rain Forest Areas. Adv. Space Res. 2003, 32, 2305–2310. [Google Scholar] [CrossRef] [Scilit]

Disclaimer/Publisher’s Note: The statements, opinions and data contained in all publications are solely those of the individual author(s) and contributor(s) and not of MDPI and/or the editor(s). MDPI and/or the editor(s) disclaim responsibility for any injury to people or property resulting from any ideas, methods, instructions or products referred to in the content. |
© 2026 by the authors. Licensee MDPI, Basel, Switzerland. This article is an open access article distributed under the terms and conditions of the Creative Commons Attribution (CC BY) license.