


Highlights
What are the main findings?
- An urban-oriented ICESat-2 photon processing workflow was developed for complex built-up environments.
- Tree canopy height samples were extracted in urban areas by integrating ICESat-2 photons with crown polygons, yielding estimates with R2 = 0.55 and RMSE = 2.71 m.
What are the implications of the main findings?
- ICESat-2 can provide sparse but reliable individual tree canopy height samples in urban built-up environments after targeted processing.
- These samples can serve as an independent height reference to complement, evaluate, and improve regional urban canopy height products.
Abstract
Urban forests play a crucial role in sustaining habitable urban environments, and tree canopy height (TCH) is a key parameter for characterizing urban forest structure and ecological functions. However, accurate TCH retrieval using spaceborne lidar remains challenging in urban built-up areas because of the high spatial heterogeneity of urban land cover. This study proposes an urban-oriented method for ICESat-2 data processing and TCH extraction and evaluates it in Peoria, Illinois, USA. By integrating spectral constraints with photon spatial distribution patterns, the method further separates non-ground photons into vegetation photons and building photons. Individual tree crown polygons are then introduced as spatial constraints for TCH extraction, helping to overcome the limitations of regular grids in representing both the laser footprint scale and fine urban landscape detail. In addition, a non-exclusive photon-to-crown assignment strategy based on energy weighting allowed each photon to contribute to multiple crowns in proportion to the footprint energy intercepted by each crown. Among the 1391 crowns associated with vegetation photons, 286 met the thresholds for both total and high-weight photon counts and were retained for accuracy assessment. Validation against canopy heights derived from airborne laser scanning (ALS) reference data shows that the proposed method achieves an R2 of 0.55 and an RMSE of 2.71 m. Further analysis indicates that retrieval accuracy is primarily controlled by beam strength: strong beams yield higher accuracy (R2 ≈ 0.60), whereas daytime and nighttime observations differ only slightly. Overall, after targeted processing, ICESat-2 can provide a set of individual tree canopy height samples in urban built-up areas, which may support local calibration and serve as potential labels for subsequent regional canopy height mapping.
1. Introduction
Both the United Nations 2030 Agenda for Sustainable Development and Urban Forests: A Global Perspective emphasize that urban forests constitute an important nature-based solution (NBS) for enhancing carbon sequestration, strengthening urban resilience, and improving the quality of the living environment [1,2]. Tree canopy height (TCH) is a core parameter for characterizing forest structure and ecological function. Accurate TCH retrieval is essential for revealing the spatial patterns of urban forest canopies and quantifying the effectiveness of NBS implementation [3,4]. Against the backdrop of continued global urbanization, developing low-cost and efficient methods for retrieving TCH in urban forests is of great significance for promoting green equity and sustainable urban development [5].
For urban forests, airborne laser scanning (ALS) remains the primary approach for retrieving TCH information [6,7]. Owing to its high-precision three-dimensional measurements, ALS can accurately characterize canopy structural attributes at both the individual-tree and stand scales [8]. However, the acquisition and sharing of ALS data are often constrained by cost, policy restrictions, and data security concerns, limiting their use for sustained cross-regional observations [9]. In contrast, spaceborne remote sensing platforms provide broad spatial coverage and short revisit intervals, making them well suited for characterizing vertical structure across the land surface [10,11,12]. In recent years, researchers have increasingly integrated spaceborne lidar observations with other remote sensing data sources, such as optical imagery and synthetic aperture radar (SAR), and combined these data with machine learning and deep learning methods to generate large-scale and even global canopy height products [13,14]. Representative examples include the canopy height map for the conterminous United States developed by Malambo and Popescu [15], the 30 m global forest canopy height product generated by Potapov et al. [16], and the higher resolution 10 m global product reported by Lang et al. [17]. Despite these advances, such products were developed mainly for natural forests rather than for complex urban environments. However, Dong et al. showed that these large-scale canopy height products exhibit limited performance in urban areas, partly because the spaceborne lidar observations used to train or calibrate these products may contain greater uncertainty in heterogeneous urban environments [18]. Accordingly, further work is needed to assess the applicability of spaceborne lidar to urban forest TCH retrieval and to develop optimized strategies for urban environments.
The spaceborne lidar systems that are currently in operation and publicly available mainly include GEDI, a full waveform system, and ICESat-2, a photon counting system. Previous studies have shown that GEDI generally achieves higher accuracy than ICESat-2 in TCH retrieval, whereas ICESat-2 performs better in terrain measurement [19,20]. In urban settings, however, GEDI has mainly been used for medium- to low-resolution extraction of building height rather than for estimating urban forest TCH [21,22]. A major challenge in urban TCH retrieval is the strong spatial heterogeneity of urban surfaces, where a single laser footprint often contains multiple targets, including ground, buildings, and tree crowns. As a full waveform system, GEDI has difficulty separating such mixed returns accurately, which limits its applicability to urban forest TCH retrieval [23]. By contrast, ICESat-2 records individual photon events independently and therefore offers greater potential for target discrimination. Its footprint diameter is only about 11 m, making it the smallest footprint among current spaceborne lidar systems and better matched to the typical 5 to 10 m spatial variability of urban landscapes [24,25]. Several studies have already attempted to estimate urban forest TCH using ICESat-2 data. For instance, Ağca et al. [26] verified the feasibility of ICESat-2-based TCH retrieval in the urban area of Izmir, Turkey, and Xu et al. [27] combined 4 m along-track ICESat-2 elevations with GaoFen-2 imagery to generate a 4 m urban canopy height map for Nanchang, China. Nevertheless, these studies mainly rely on land cover data to screen canopy points and have not fully exploited the object recognition potential of the ICESat-2 photon point cloud.
Since the public release of ICESat-2 data, a variety of denoising and classification algorithms have been developed for photon processing. The DRAGANN denoising algorithm used by NSIDC to generate ATL08 products, together with a multi-rule point cloud classification method based on median smoothing filters, remains the most widely used scheme. However, validation studies of ATL08 data have shown that this approach performs poorly in areas with complex terrain and dense vegetation, and that in urban areas it tends to represent surface structure height rather than pure canopy height [28,29,30]. To improve photon classification and TCH extraction under different terrain and vegetation conditions, various enhanced algorithms have been proposed. For example, Wang et al. developed the Sectional Photon Denoising to Plain Forest Segments (SPDPF) algorithm to improve photon denoising and classification, which in turn improved TCH extraction in sparse forests [31]; Xie et al. developed the Density Based Adaptive Model (DBAM), which introduces slope adaptive ellipses and a noise density homogenization mechanism to achieve higher accuracy than ATL08 in areas with steep slopes and interlaced vegetation [32]; and Tian and Shan proposed the Gravity Density Weighted Iterative Thresholding (GRADWIT) method, which jointly uses strong and weak beam photon density information together with directional region growing and weighted iterative median filtering, and achieves higher classification and canopy height retrieval accuracy in areas with complex terrain and dense vegetation cover [33]. However, these algorithms were mainly designed for natural environments, and dedicated point cloud classification and TCH extraction strategies for urban areas remain lacking.
Against this background, this study develops an urban-oriented ICESat-2 photon-processing framework for extracting tree canopy height samples in built-up environments. The main methodological contributions are as follows: (1) non-ground photons are further separated into vegetation and building photons by integrating spectral constraints with photon spatial structure; (2) individual crown polygons are introduced as object-based extraction units to reduce the spatial mismatch between ICESat-2 footprints and fragmented urban vegetation; and (3) a non-exclusive, energy-weighted photon-to-crown assignment strategy is adopted, allowing a photon to contribute to multiple intersected crowns according to the proportion of footprint energy intercepted by each crown. This treatment better represents the sampling geometry of ICESat-2 footprints than exclusive photon assignment. Because ICESat-2 provides discrete along-track photon profiles, the proposed framework is designed to derive screened TCH samples that can support local validation and calibration and serve as potential training labels for regional mapping, rather than to produce wall-to-wall maps.
2. Materials and Methods
2.1. Study Area
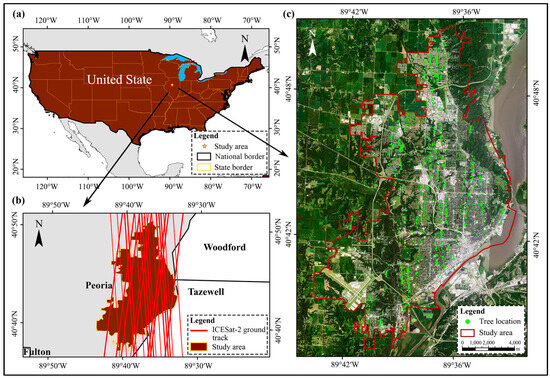
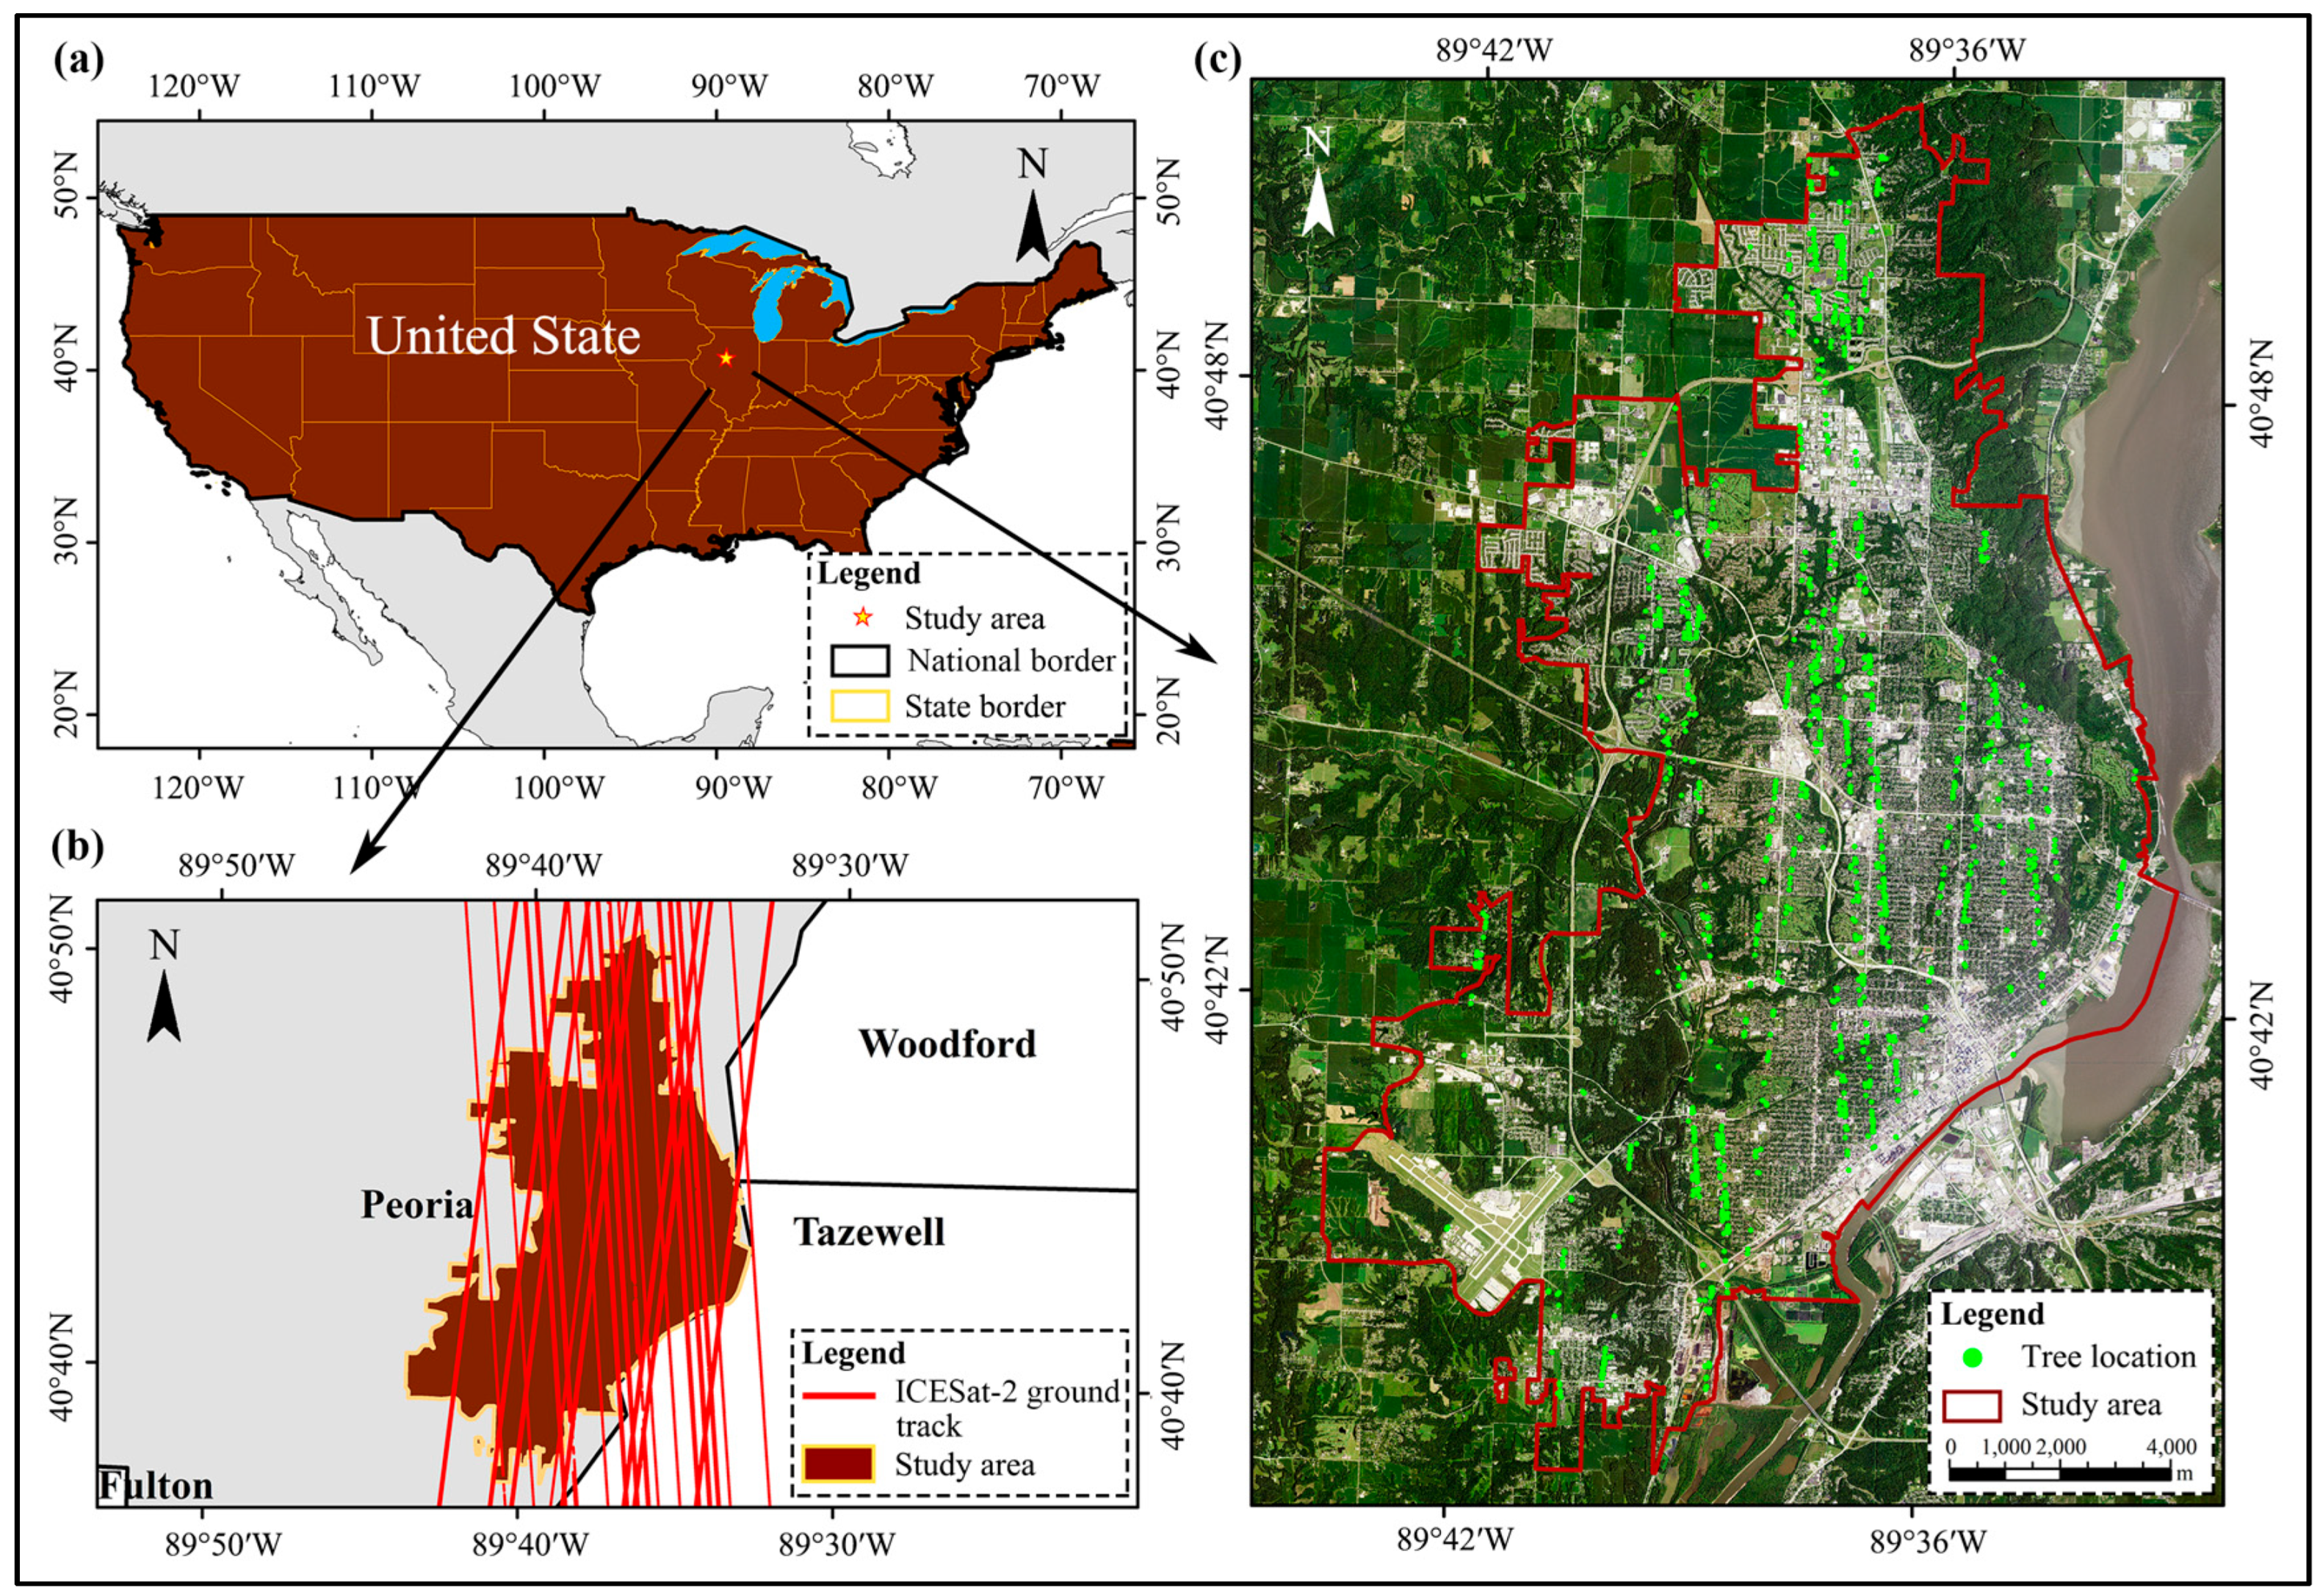
Peoria, Illinois, USA (40°41′N–40°45′N, 89°33′W–89°38′W), was selected as the study area (Figure 1). Within the built-up area of Peoria, urban vegetation is mainly distributed along roads, in parks and green spaces, and within residential areas. The urban trees are dominated by temperate deciduous broadleaf species, and canopy heights are generally low to moderate. As a typical North American city of medium size, Peoria is characterized by relatively compact built structures and a highly heterogeneous spatial mixture of impervious surfaces and tree crowns, making it a representative setting for TCH extraction in urban environments.
Figure 1.
Study area, ICESat-2 tracks, and detected individual trees. (a) Geographic location of the study area; (b) extent of the built-up area of Peoria and distribution of ICESat-2 tracks; (c) locations of individual trees detected along the ICESat-2 tracks.
2.2. Data Collection
2.2.1. ICESat-2 Data
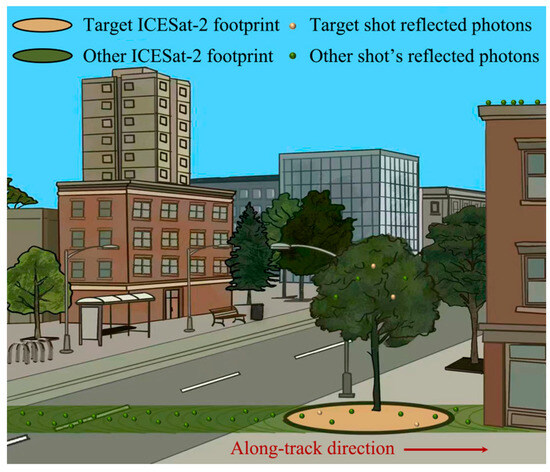
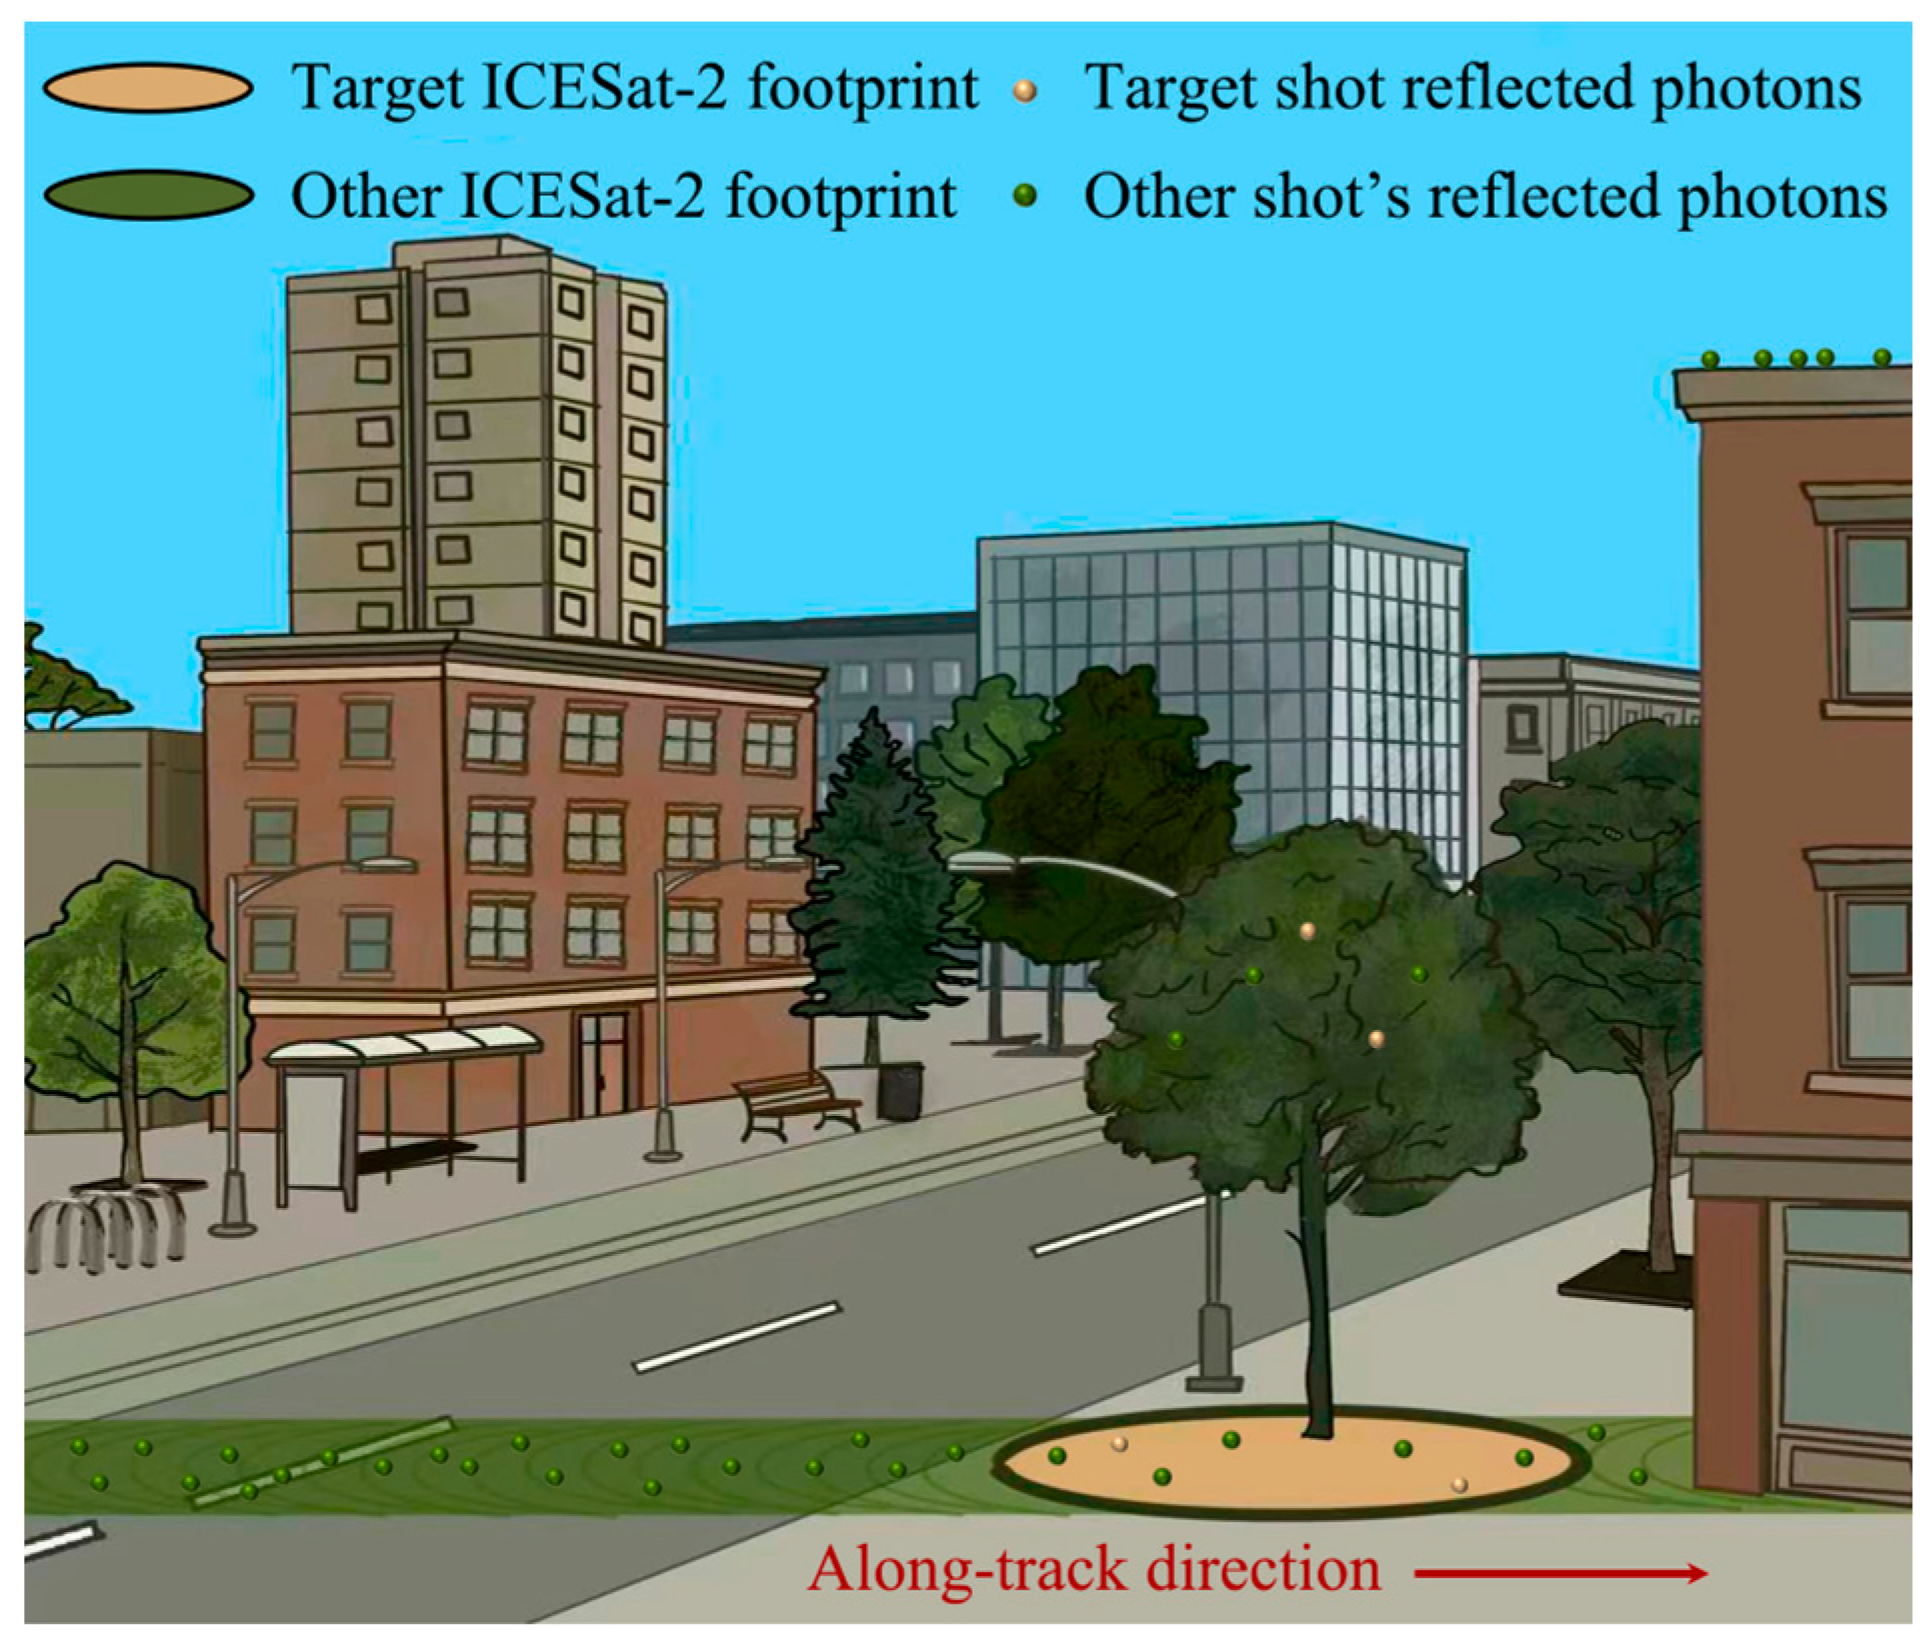
The ICESat-2 satellite is equipped with the Advanced Topographic Laser Altimeter System (ATLAS; NASA Goddard Space Flight Center, Greenbelt, MD, USA), a photon-counting LiDAR instrument that can provide high-precision measurements of surface elevation and vegetation vertical structure [34]. During operation, ATLAS emits 532 nm green laser pulses, which are split into six beams arranged in three pairs. Each beam samples the Earth’s surface along track at intervals of approximately 0.7 m, creating a nearly continuous overlapping footprint with a diameter of approximately 11 m (Figure 2) [35]. After each laser pulse illuminates the surface, a small number of return photons reflected from any interface within the footprint are detected by the receiver [36]. By recording the travel time of each detected photon and combining this information with precise orbit and timing corrections, the system determines its three-dimensional position. The National Snow and Ice Data Center (NSIDC) provides a series of standard ICESat-2 products derived from ATLAS observations. In this study, ATL03, which contain photon-level geolocation, ellipsoidal elevation, and signal-to-noise information, were used as the primary data source for analysis. The corresponding ATL08 product, which provides terrain, canopy, and related quality control information for fixed 100 m along-track segments, was used as an auxiliary dataset for track quality screening and as the standard ICESat-2 land vegetation product used for comparison [29,37]. All available ATL03 and ATL08 data covering the study area from April 2020 to April 2024 were obtained from the NASA Earthdata Search platform.
Figure 2.
Schematic of ICESat-2 laser footprints and photon reflections.
2.2.2. Validation Data
ALS data and derived products for the Peoria area, released by the Illinois State Geological Survey (ISGS), were used as validation data. The data were acquired in 2022 and meet the USGS 3DEP Quality Level 2 (QL2) standard, with an average point density of at least 4 points m−2. The original point cloud has a vertical accuracy of RMSEz ≤ 10 cm according to the ASPRS Positional Accuracy Standards for Digital Geospatial Data, Edition 1, Version 1.0 [38], and a horizontal accuracy better than ±0.73 m at the 95% confidence level. The derived DTM and DSM have a spatial resolution of 1.5 ft, approximately 0.46 m, and were originally referenced to NAD83(2011)/State Plane Illinois West and NAVD88. To ensure consistency with ICESat-2 data processing, all validation data were reprojected to UTM Zone 16N, and both planar coordinates and elevations were converted to meters.
2.2.3. Auxiliary Data
Several auxiliary datasets were also used to support crown delineation, vegetation and building separation, and vertical datum unification. Individual tree crown polygons were derived from the Tolan 1 m global canopy height product by applying Gaussian smoothing (σ = 2 m) to the distance-transform surface, detecting local maxima with a minimum separation of 5 m, and performing marker-controlled watershed segmentation [39]. The resulting polygons were then visually inspected and manually corrected where necessary. Sentinel-2 Level-2A surface reflectance images acquired during the 2022 growing season were processed in Google Earth Engine using cloud masking and temporal median compositing. The resulting composite was used to calculate MSAVI2, which provided a spectral constraint for identifying non-vegetated areas. To unify vertical datums, the XGM2019e_2159 global gravity field model was used to convert ICESat-2 ATL03 ellipsoidal heights to NAVD88 heights. In addition, high-resolution NAIP aerial imagery was used as reference data for checking and correcting individual tree crown boundaries in complex urban environments.
2.3. Methodology
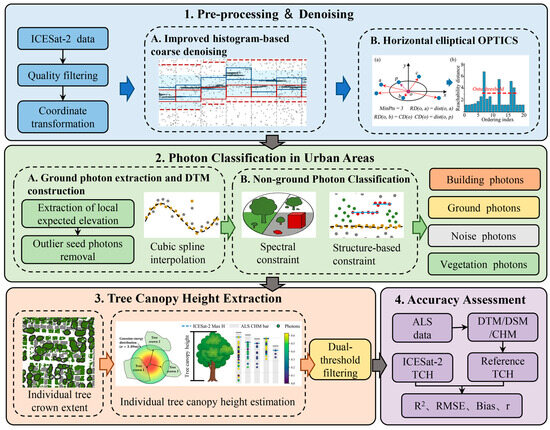
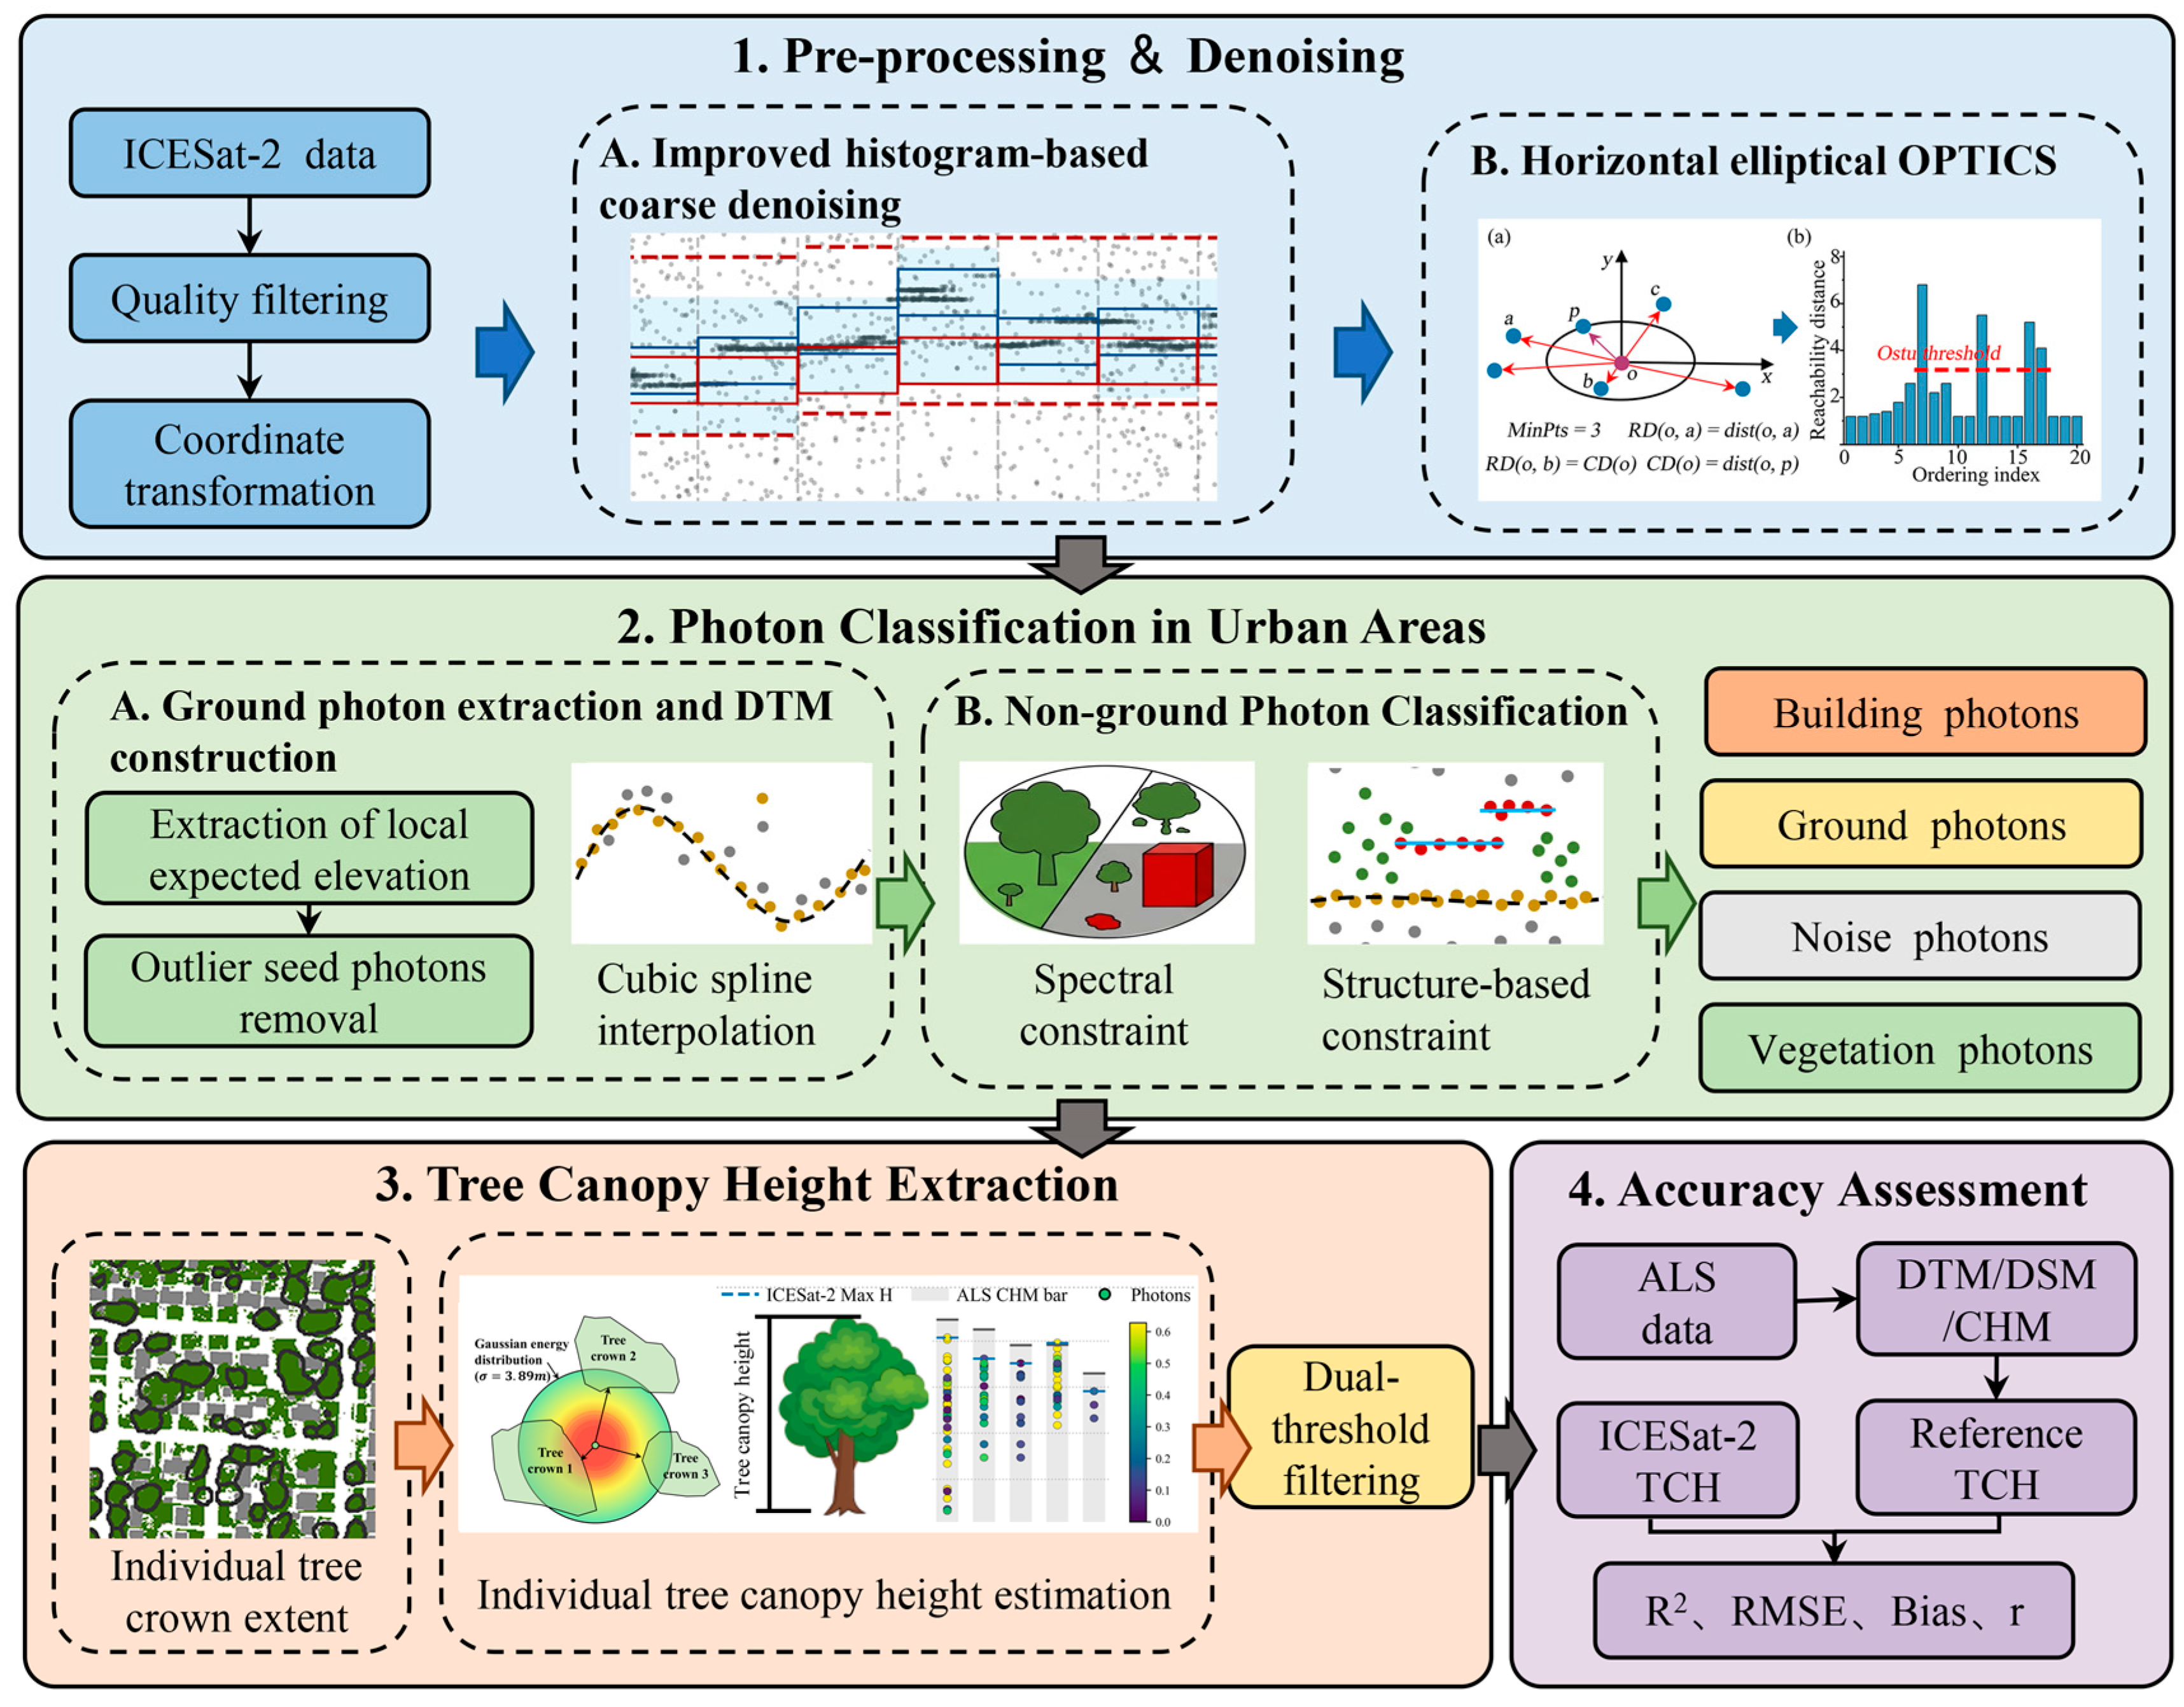
Before analysis, ATL03 photon data were first screened using cloud impact flags, signal-to-noise information, and related quality control parameters provided in ATL08 to identify track segments suitable for analysis. The retained data were then processed through coordinate transformation, vertical datum unification, and along-track distance calculation. The proposed method consists of three main parts: denoising, photon classification, and TCH extraction. The overall workflow is shown in Figure 3.
Figure 3.
Workflow of the ICESat-2 based TCH extraction method for urban environments.
2.3.1. Denoising
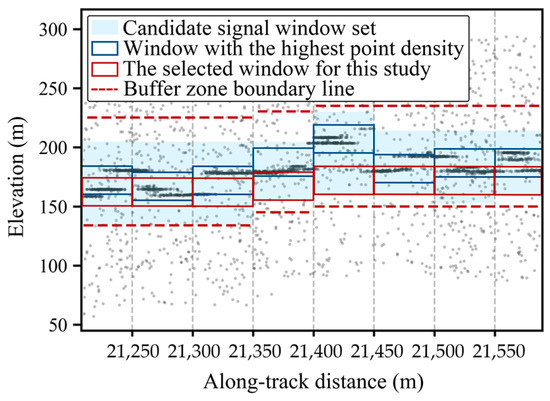
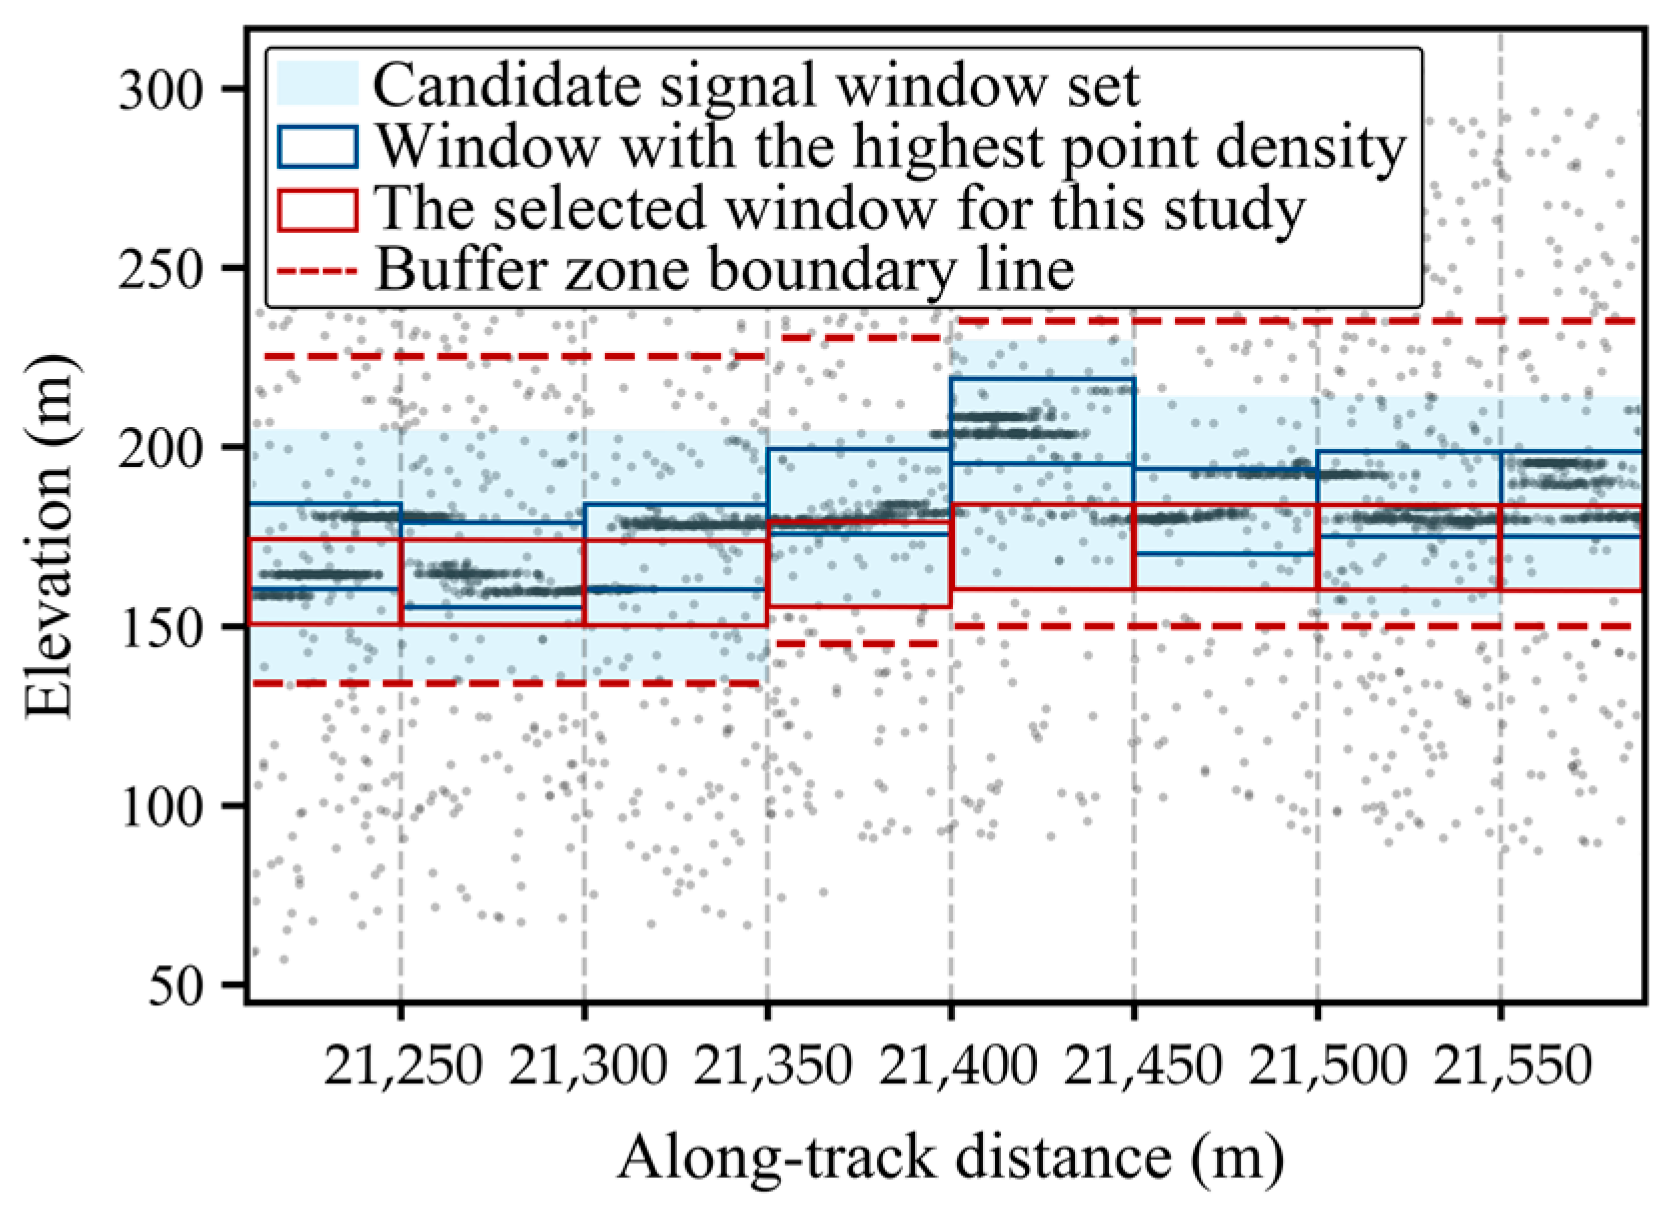
Built-up areas in cities generally have relatively flat terrain, and therefore a horizontal elliptical OPTICS method was adopted to separate signal photons from noise [40,41]. In urban environments, however, continuous roof returns may dominate the local photon density distribution and interfere with the identification of the terrain-related photon band. To mitigate this effect, an improved sliding window histogram method was first applied for coarse denoising before horizontal elliptical OPTICS, aiming to rapidly reduce the data volume while constraining the photon cloud to a vertically reasonable height range (Figure 4).
Figure 4.
Schematic of the improved sliding window histogram-based coarse denoising method.
In general, the original photon cloud was divided into 50 m along-track units. Within each unit, photon counts were calculated using a 25 m vertical window moving in 5 m steps to characterize the local vertical photon density distribution. Rather than directly selecting the window with the highest photon count, all windows with photon counts no lower than 40% of the maximum count in the current unit were retained as candidates. The selected window for each unit was then determined as the candidate with the smallest vertical difference from the window identified in the previous unit. This continuity-based constraint allowed the selected windows to follow the smooth terrain trend and reduced abrupt vertical shifts caused by dense roof returns or other high-reflectance objects. The selected window was then expanded by 10 m downward and 30 m upward to preserve terrain photons and photons from the overlying vegetation structure. Photons within this expanded range were retained as preliminary valid signal photons, whereas the remaining photons were removed as background noise. These retained photons were then used as the input for the subsequent horizontal elliptical OPTICS-based denoising step.
2.3.2. Photon Classification in Urban Areas
This study extends the conventional classification framework by further separating non-ground photons into vegetation photons and building photons. By integrating terrain reconstruction, spectral constraints, and photon spatial structure analysis, the proposed strategy classifies photons into four categories: noise, ground, vegetation, and building photons.
Ground Photon Extraction and Along-Track Terrain Reconstruction
Ground photon identification is the primary task in ICESat-2 photon classification. In urban built-up areas, ground returns are often affected by both vegetation canopies and artificial structures, especially where buildings block laser penetration and lead to local loss of terrain information. To address this issue, a ground extraction method designed for urban conditions was developed for along-track terrain reconstruction. A 10 m sliding window was first constructed along the track, and photons within the 10–50% elevation quantile range were retained as ground candidates. In each segment, the photon closest to the local mean elevation estimated with a Gaussian kernel was selected as the initial ground seed. Residual outliers and false ground seeds from roofs or low noise were then removed using a local extrema filter, in which local prominence was calculated within a 50 m neighborhood and abnormal peaks or valleys were iteratively rejected while preserving true terrain changes. The filtered seeds were used to fit an initial terrain model with a spline function. Remaining photons were iteratively added to the ground set when their elevation residual was less than 0.9 m and sufficient local support from existing ground photons was available. After each update, the terrain model was refitted until no additional ground photons were identified. Finally, key ground control points were selected using a Gaussian weighted criterion, and cubic spline interpolation was applied to reconstruct the final continuous along-track terrain profile.
Non-Ground Photon Classification: Vegetation vs. Buildings
After terrain reconstruction, non-ground photons below the terrain line were removed as low outliers, and the remaining non-ground photons were further classified into vegetation and building photons. Because ICESat-2 lacks spectral information, Sentinel-2 imagery was introduced as an external constraint. The Modified Soil Adjusted Vegetation Index (MSAVI2) was calculated from the red and near-infrared bands as:
Considering previous studies and the comparative performance of candidate thresholds in the study area, an empirical MSAVI2 threshold of 0.2 was adopted [42]. To further evaluate the threshold selection, candidate values of 0.1, 0.2, and 0.3 were compared using a small manually interpreted validation subset from representative scenes within the study area. The corresponding mean Intersection over Union (mIoU) values were 27.8%, 87.3%, and 41.3%, respectively, indicating that 0.2 provided the best balance between vegetation retention and non-vegetation suppression among the tested values. Non-ground photons associated with MSAVI2 values below this threshold were classified as building photons, whereas the remaining photons were provisionally retained as vegetation candidates.
For spectrally ambiguous areas where buildings and vegetation were intermingled, the spatial structure of the photon cloud was further analyzed. Building roofs usually form stable and continuous photon sequences along the track, whereas vegetation photons are more vertically scattered. Therefore, photons were scanned layer by layer in the elevation direction, and continuous segments were identified within each layer. A segment was classified as a roof-like structure when it had a length greater than 3 m, more than 3 photons, and an elevation variation smaller than 0.5 m. These criteria were selected to capture locally continuous and near-horizontal photon structures, while their exact values may require adjustment under different sampling conditions. These photons were labeled as building photons, while the remaining photons were retained as vegetation candidates. Finally, DBSCAN was used to remove isolated vegetation candidates near building photons, improving the completeness of building photon identification. The final photon classes included noise, ground, vegetation, and building photons.
2.3.3. Tree Canopy Height Extraction
Existing ICESat-2 canopy height products are commonly provided in raster form at spatial resolutions of 10 or 30 m. In urban environments, where vegetation and buildings are closely intermingled, finer spatial detail is often required. The ICESat-2 footprint diameter is about 11 m, and direct matching to smaller pixels can therefore introduce substantial spatial mismatch. To reduce this mismatch, TCH was estimated using individual tree crown polygons as object-based spatial units.
Due to the operational characteristics of ICESat-2, vegetation photons representing the height of a given tree crown may originate from any footprint that spatially overlaps that crown polygon. To approximate footprint coverage, a circular buffer with a radius of 5.5 m was constructed around each vegetation photon, and its spatial relationship with each crown polygon was evaluated. When the buffer intersected a crown polygon, the corresponding photon was considered a potential contributor to the TCH estimation of that crown. Because a single footprint may overlap multiple crowns, photons were not forced to be assigned to only one crown. Instead, a weight for photon-to-crown assignment was introduced to quantify the strength of association between each photon and each intersected crown.
The weight for photon-to-crown assignment was defined under the assumption that the origin of a detected photon is controlled by both incident energy and surface reflectance within the footprint. Since most photons from artificial targets had been removed and reflectance differences among vegetation targets were assumed to be relatively small, the photon-to-crown association was considered to be mainly controlled by the incident energy intercepted by each crown. Therefore, the proportion of the total footprint incident energy intercepted by a crown was used as the weight. To quantify this proportion, the energy distribution of a single ICESat-2 footprint was idealized as a two-dimensional Gaussian function with a standard deviation of σ = 3.89 m, based on the 1/e criterion, to represent an energy envelope with an effective diameter of approximately 11 m at the ground surface:
In Equation (2), (x, y) denote the planar offsets of an integration point relative to the footprint center, and σ is the Gaussian standard deviation. The incident energy intercepted by a given crown was then calculated by integrating over the spatial intersection region Ω between the photon buffer and the crown polygon:
In Equation (3), (, ) represents the footprint center. Because the Gaussian function is normalized over the entire plane, the integrated energy E can be directly taken as the weight for photon-to-crown assignment:
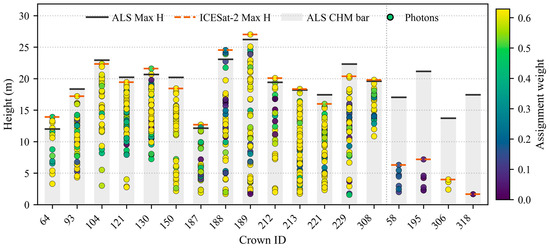
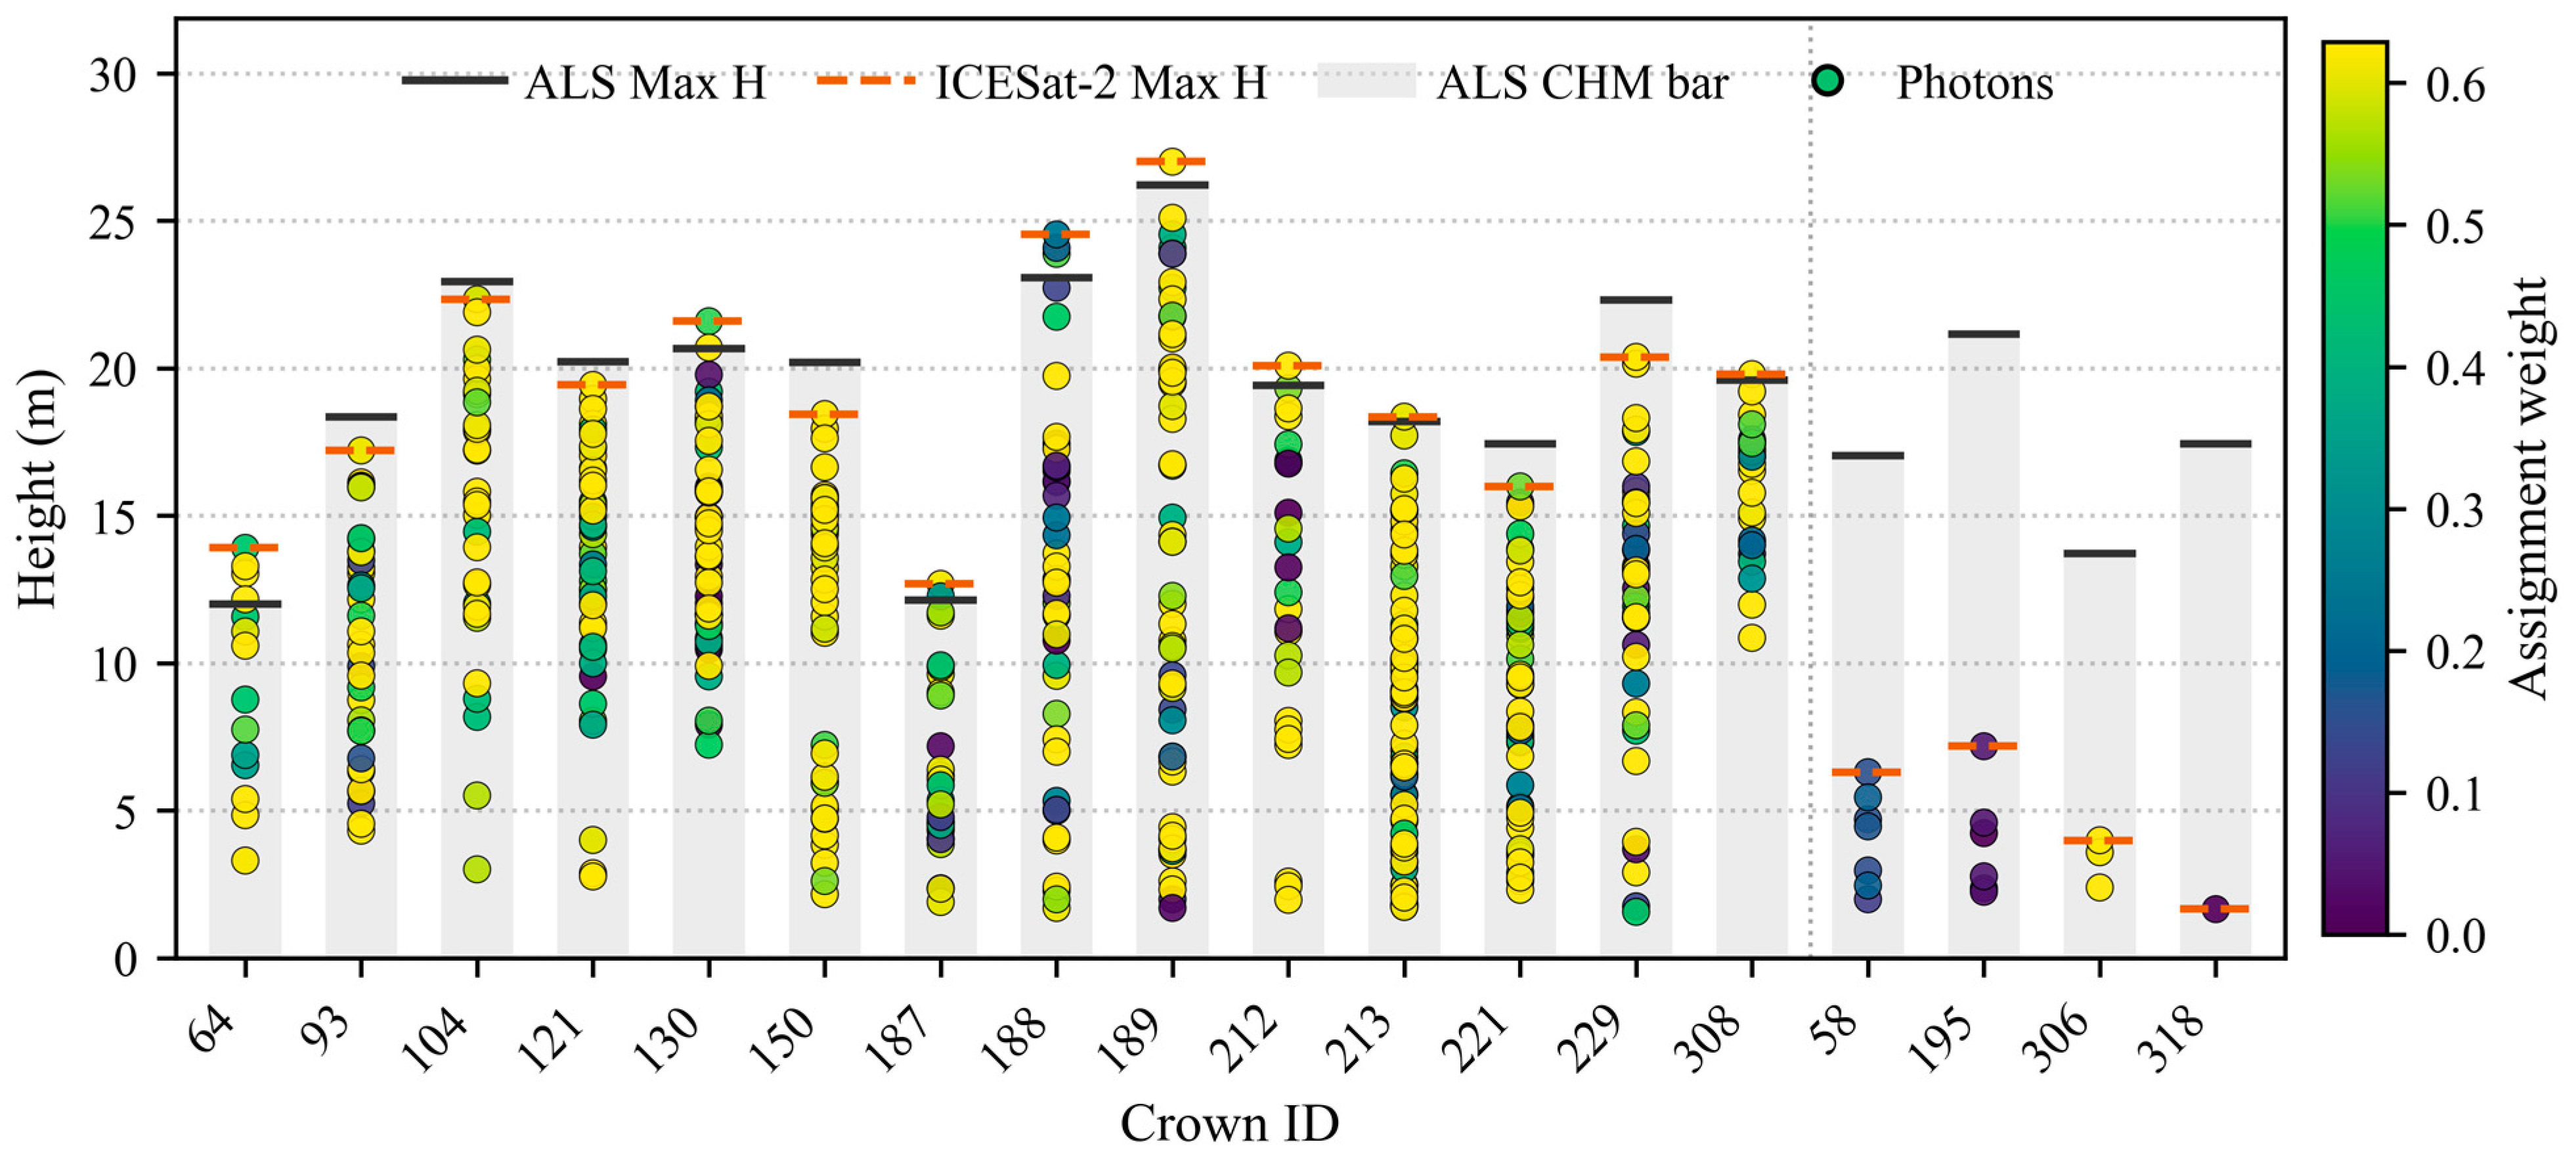
On this basis, a photon-to-crown-height response plot was constructed for each individual tree (Figure 5). The x axis represents crown ID, the y axis represents photon height relative to the fitted terrain surface, and color brightness indicates the magnitude of the weight. Inspection of these plots showed that TCH estimates supported by more high-weight photons were generally more reliable. The total number of vegetation photons associated with a crown also affected estimation stability, with crowns matched to more vegetation photons tending to yield more accurate results. Therefore, a dual-threshold screening strategy was applied using the total photon number and the number of high-weight photons (W > 0.5). Separate thresholds were used for strong and weak beams because of their different photon detection capabilities. For strong beams, a crown estimate was retained only when at least three high-weight photons and at least six photons in total were associated with that crown. For weak beams, the corresponding thresholds were at least one high-weight photon and at least three photons in total. The Gaussian footprint model, the definition of high-weight photons (W > 0.5), and the subsequent photon-count thresholds constitute a coupled screening configuration. These settings were used to calibrate the level of photon support required for crown-level retrieval rather than to define independently optimized universal thresholds. The adopted photon-count criteria were selected by balancing retrieval accuracy against sample retention. A sensitivity analysis using progressively stricter photon-count criteria is provided in Appendix B (Table A2). Photon matching and screening were performed independently for each ICESat-2 beam, so repeated observations of the same crown did not result in photon pooling across acquisitions.
Figure 5.
Schematic of the photon–crown height response relationship and assignment weights.
After photon screening, the maximum relative height among the vegetation photons associated with a given crown was taken as the TCH estimate for that individual tree.
2.3.4. Accuracy Assessment
Using ALS data as reference, this study evaluated the results in terms of denoising accuracy, terrain reconstruction accuracy, and TCH retrieval accuracy. For denoising validation, DTM and DSM data derived from ALS data were used to construct along-track reference terrain and surface lines following Huang et al. [43]. Considering the approximately 11 m ICESat-2 footprint diameter, DTM and DSM statistics were calculated within a 10 m × 11 m along-track window, using the median DTM and maximum DSM values. The fitted DSM line was used as the upper boundary, and a 1 m buffer below the DTM line was used as the lower boundary. Photons between these two boundaries were labeled as signal photons, whereas photons outside them were labeled as noise photons. Recall, precision, accuracy, and F1 score were then calculated to assess denoising performance:
Here, TP, FP, TN, and FN denote the numbers of true positives, false positives, true negatives, and false negatives, respectively.
For terrain extraction and TCH retrieval, accuracy was assessed using the coefficient of determination (R2), root mean square error (RMSE), bias, and Pearson correlation coefficient (r). For terrain validation, the DTM line derived from ALS data was used as the reference, and terrain elevations were sampled every 10 m along the track. For TCH validation, each crown polygon was treated as the evaluation unit, and the maximum CHM value within the polygon was used as the reference TCH, where CHM was calculated as DSM minus DTM. The metrics were calculated as follows:
where and denote the reference and ICESat-2 estimated values, and represent the means of the reference and estimated value series, and n indicates the total number of samples.
3. Results
3.1. Validation of the Urban-Oriented ICESat-2 Processing Method
Before evaluating the retrieval accuracy of individual tree canopy height, the proposed urban-oriented ICESat-2 processing method was assessed in terms of denoising, along-track terrain reconstruction, and photon classification under complex built-up conditions.
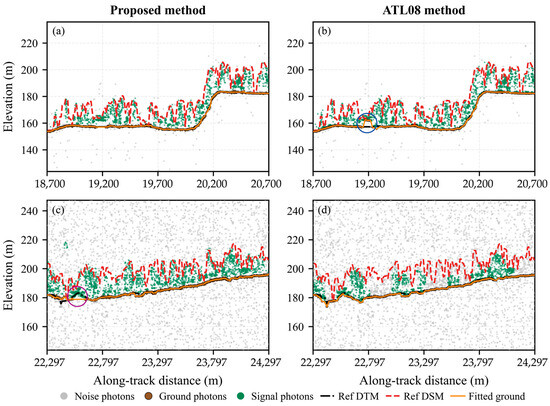
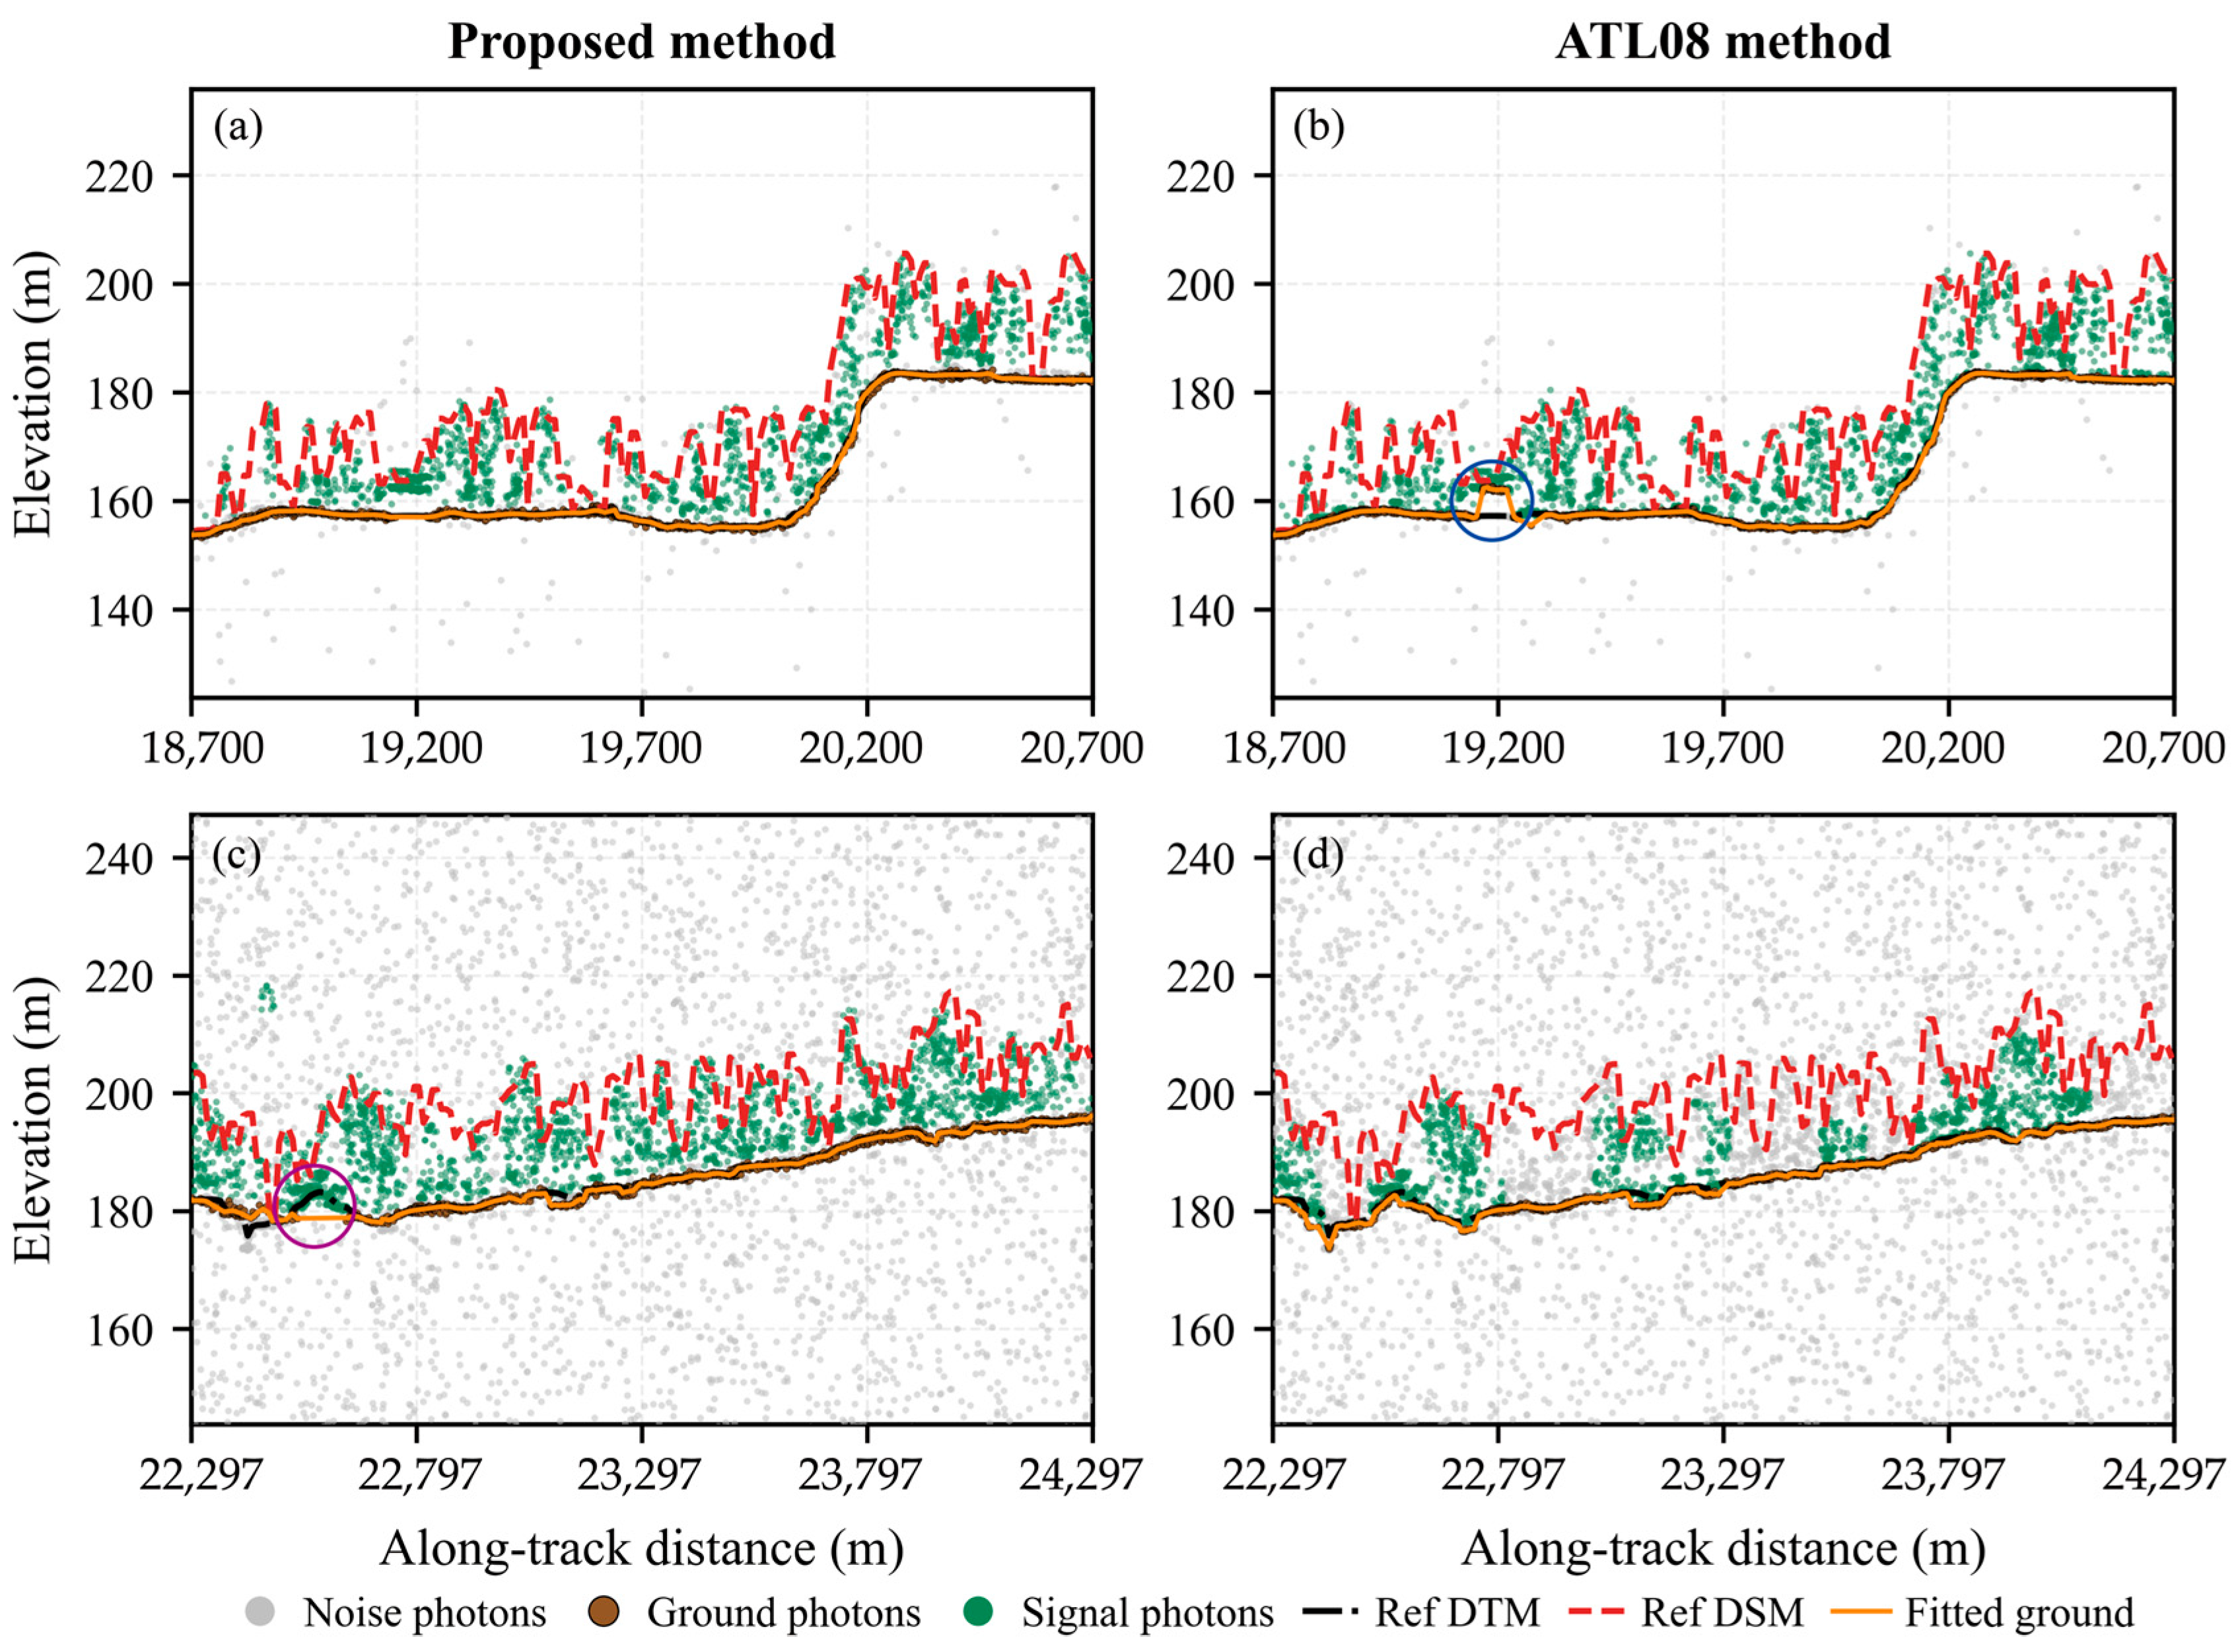
For denoising, the proposed method achieved accuracy values of 0.70–0.94, precision values of 0.80–0.98, recall values of 0.66–0.95, and F1 scores of 0.76–0.95 across all samples, with detailed results provided in Table A1. Most track segments showed high precision, whereas recall was relatively conservative, indicating that the method tends to prioritize the purity of retained signal photons under high-noise urban conditions. Figure 6 compares the denoising and terrain extraction results of the proposed method and the ATL08 method for two track segments. In the first track segment, where background noise is relatively low, both methods capture the main terrain and canopy signal features (Figure 6a,b). However, under higher-noise conditions, the proposed method shows a stronger capability to retain signal information, preserving more valid signal photons while suppressing background noise (Figure 6c,d). For terrain extraction, the proposed method reduces terrain misclassification caused by building interference (Figure 6a,b). However, in some local areas with complex terrain, its ability to follow natural terrain undulations decreases (Figure 6c,d). Using the reference terrain profile derived from ALS data as the benchmark, the accuracy of the extracted terrain profiles was evaluated by sampling at 10 m intervals. Across 35,543 validation points, the proposed method achieved an R2 value of 0.99, an RMSE of 2.73 m, and a bias of −0.09 m. Although the R2 was high, it mainly reflected agreement in the broad along-track elevation trend, whereas the RMSE indicated that notable local terrain deviations remained. These deviations were likely partly associated with dense built-up sections, where residual building photons may have caused local terrain overestimation or outliers [44]. Because such locations generally contained no vegetation crowns and did not directly contribute to crown-level TCH retrieval, the full-profile RMSE should not be interpreted as the terrain error beneath each retained crown.
Figure 6.
Comparison of denoising and terrain extraction results between the proposed method and the ATL08 method. (a) Results of the proposed method for a relatively low-noise track segment; (b) results of the ATL08 method for the same segment; (c) results of the proposed method for a higher-noise track segment; (d) results of the ATL08 method for the same segment. The blue circle in (b) highlights local terrain misclassification caused by building interference, whereas the purple circle in (c) indicates a local deviation from the natural terrain profile.
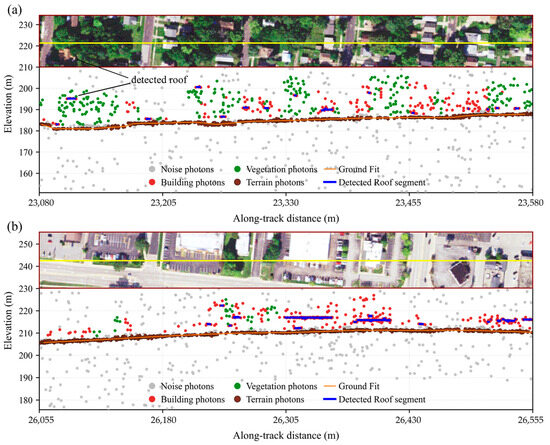
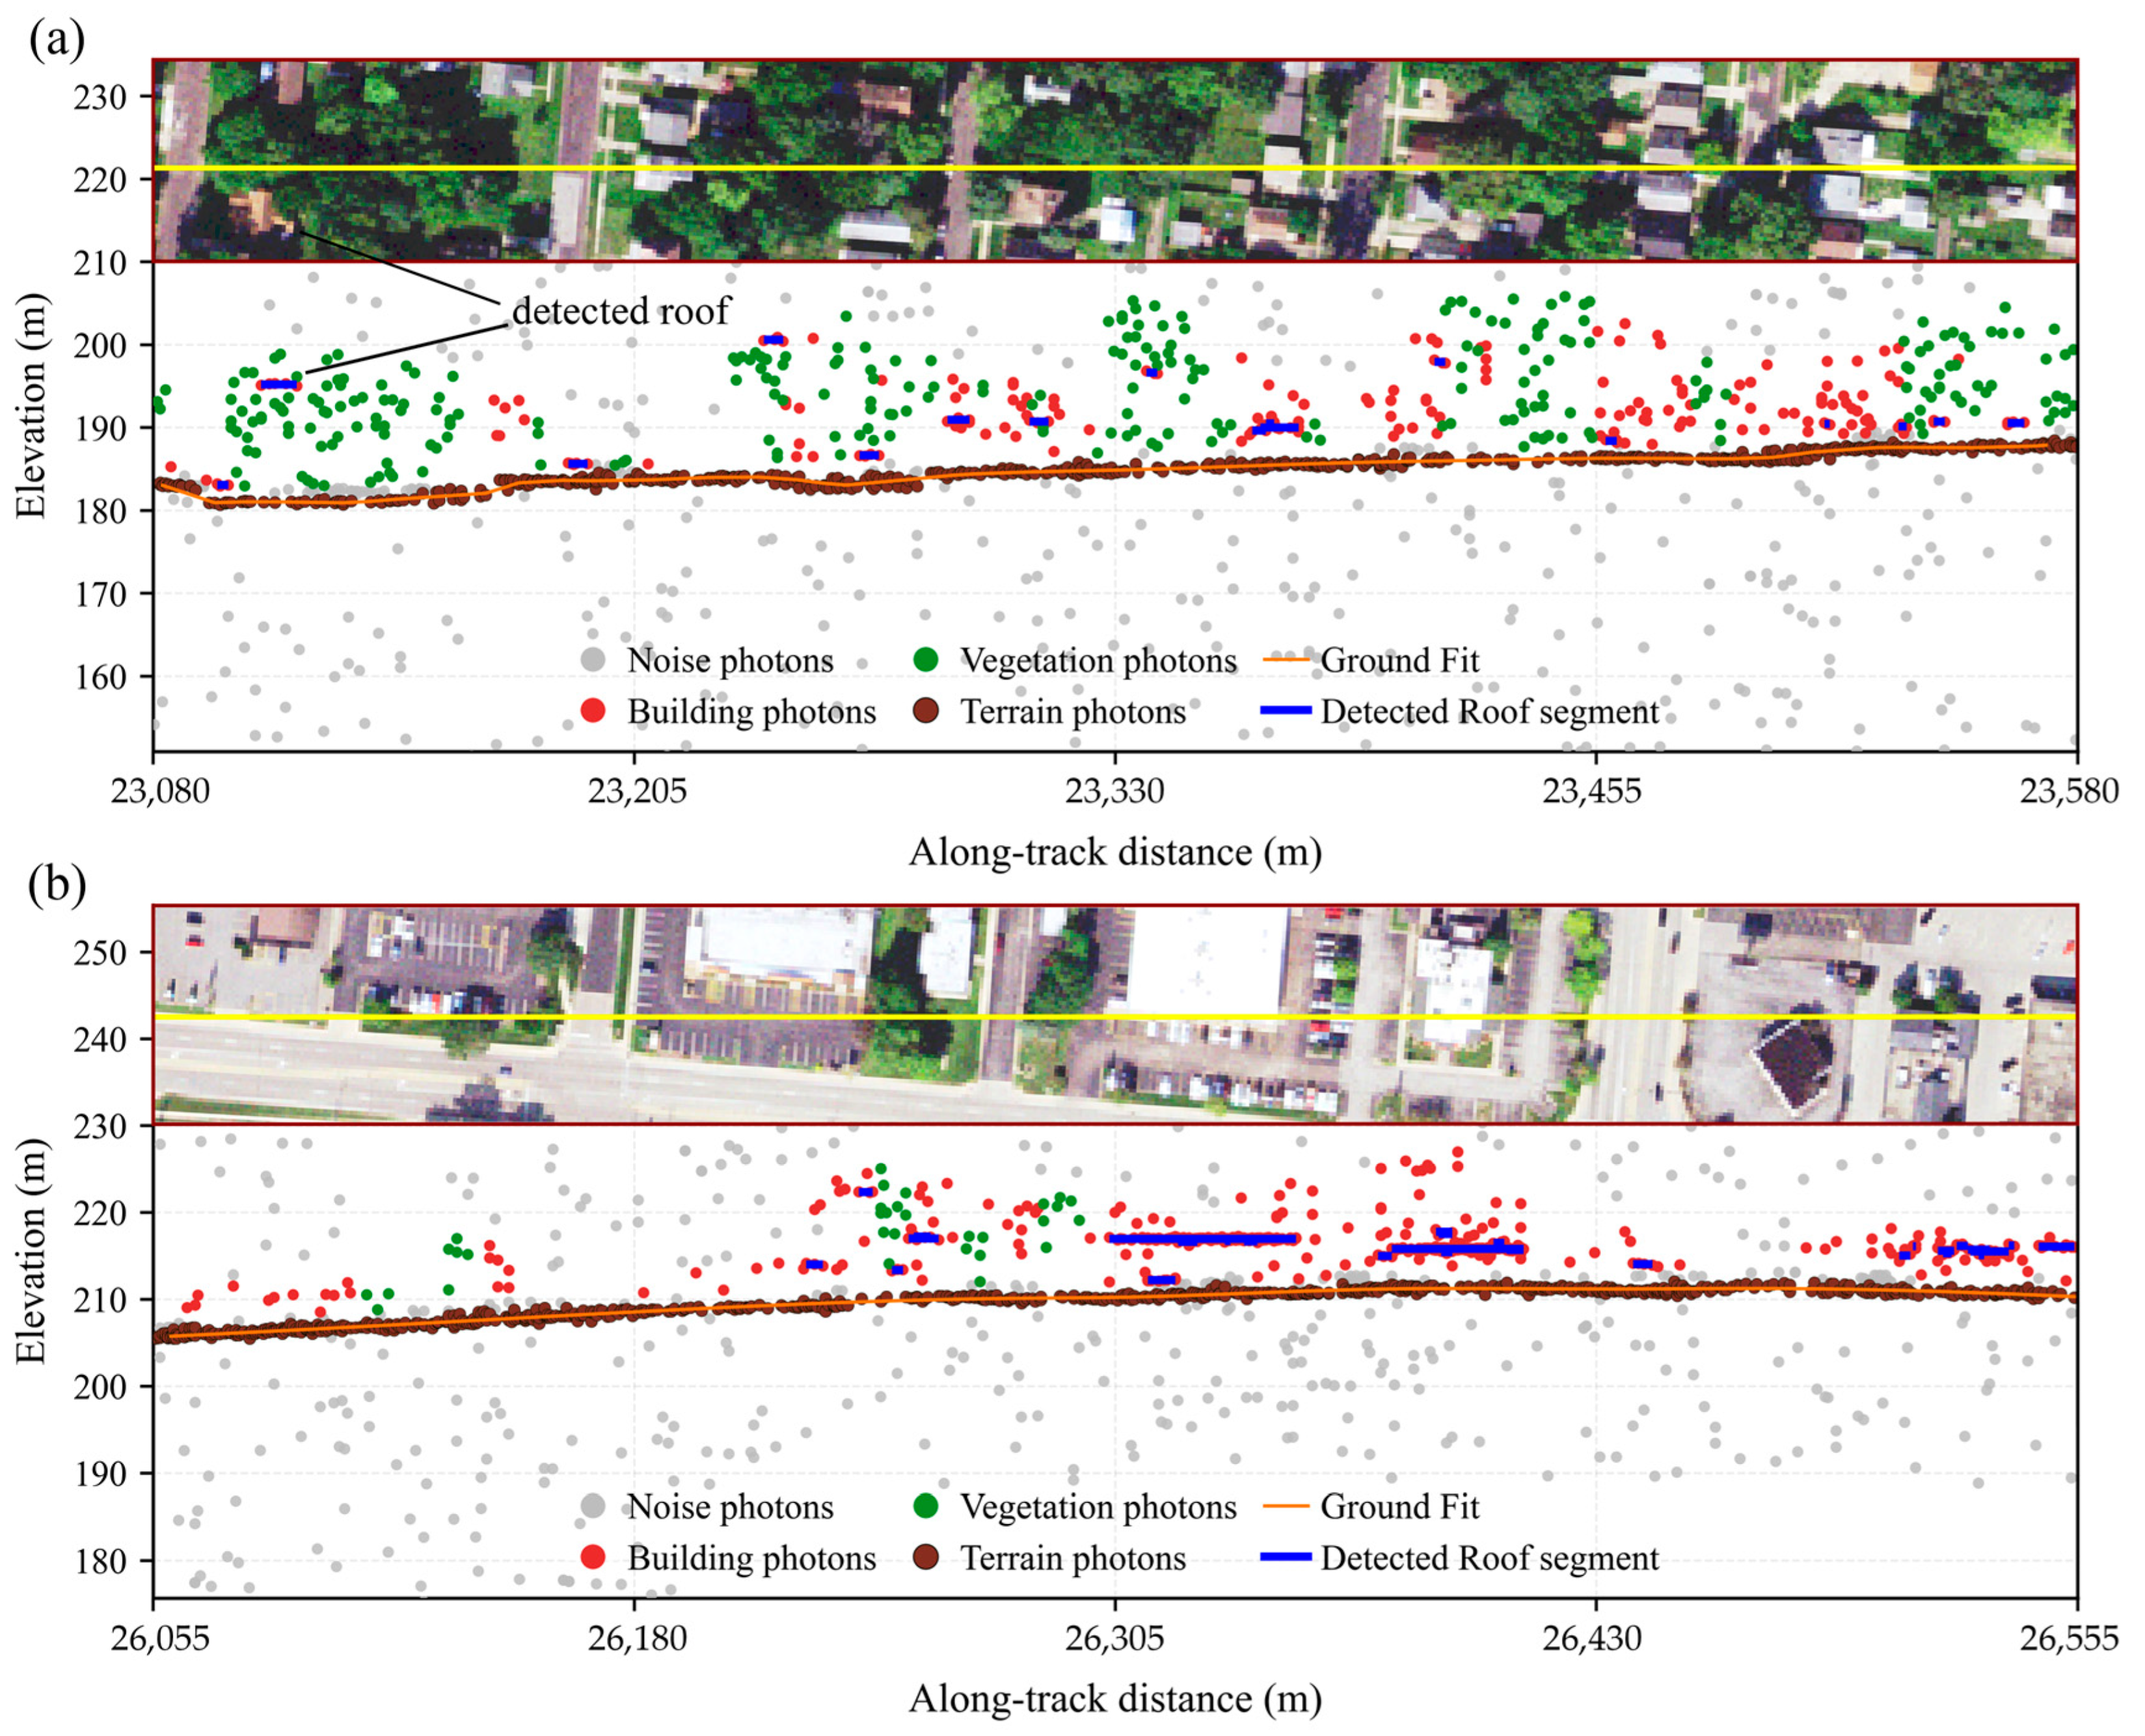
Figure 7 shows the photon classification patterns for two representative scenarios: vegetation-dominated and building-dominated areas. In Figure 7a, where vegetation cover is relatively continuous, most non-ground photons spatially associated with the apparent canopy are classified as vegetation, whereas photons associated with roads, buildings, and other impervious surfaces are predominantly assigned to the building class. A small number of photons near apparent vegetation–building boundaries are also assigned to the building class, reflecting the relatively conservative behavior of the screening strategy. Such conservative screening is intended to reduce the likelihood of building-related returns entering the subsequent TCH estimation. Figure 7b illustrates the classification pattern in a building-dominated area with relatively sparse vegetation. Localized groups of photons associated with vegetation are retained within the predominantly built-up background, while many horizontally distributed returns over building surfaces are assigned to the building class. These patterns illustrate how the spatial–structure constraint complements the spectral screening in mixed urban scenes. However, these representative profiles are intended only as qualitative illustrations of the observed classification patterns rather than as an independent quantitative assessment of photon-level classification accuracy, because independent photon-level reference labels are unavailable in mixed crown–building scenes.
Figure 7.
Examples of photon classification results. (a) Vegetation-dominated area; (b) building-dominated area. The yellow lines indicate the ICESat-2 ground tracks corresponding to the photon profiles shown below.
3.2. Accuracy of Urban Tree Canopy Height Estimation
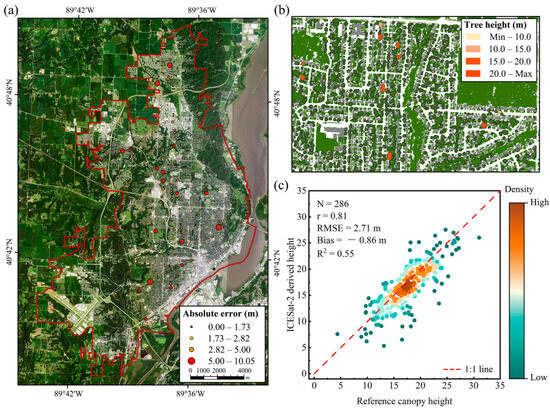
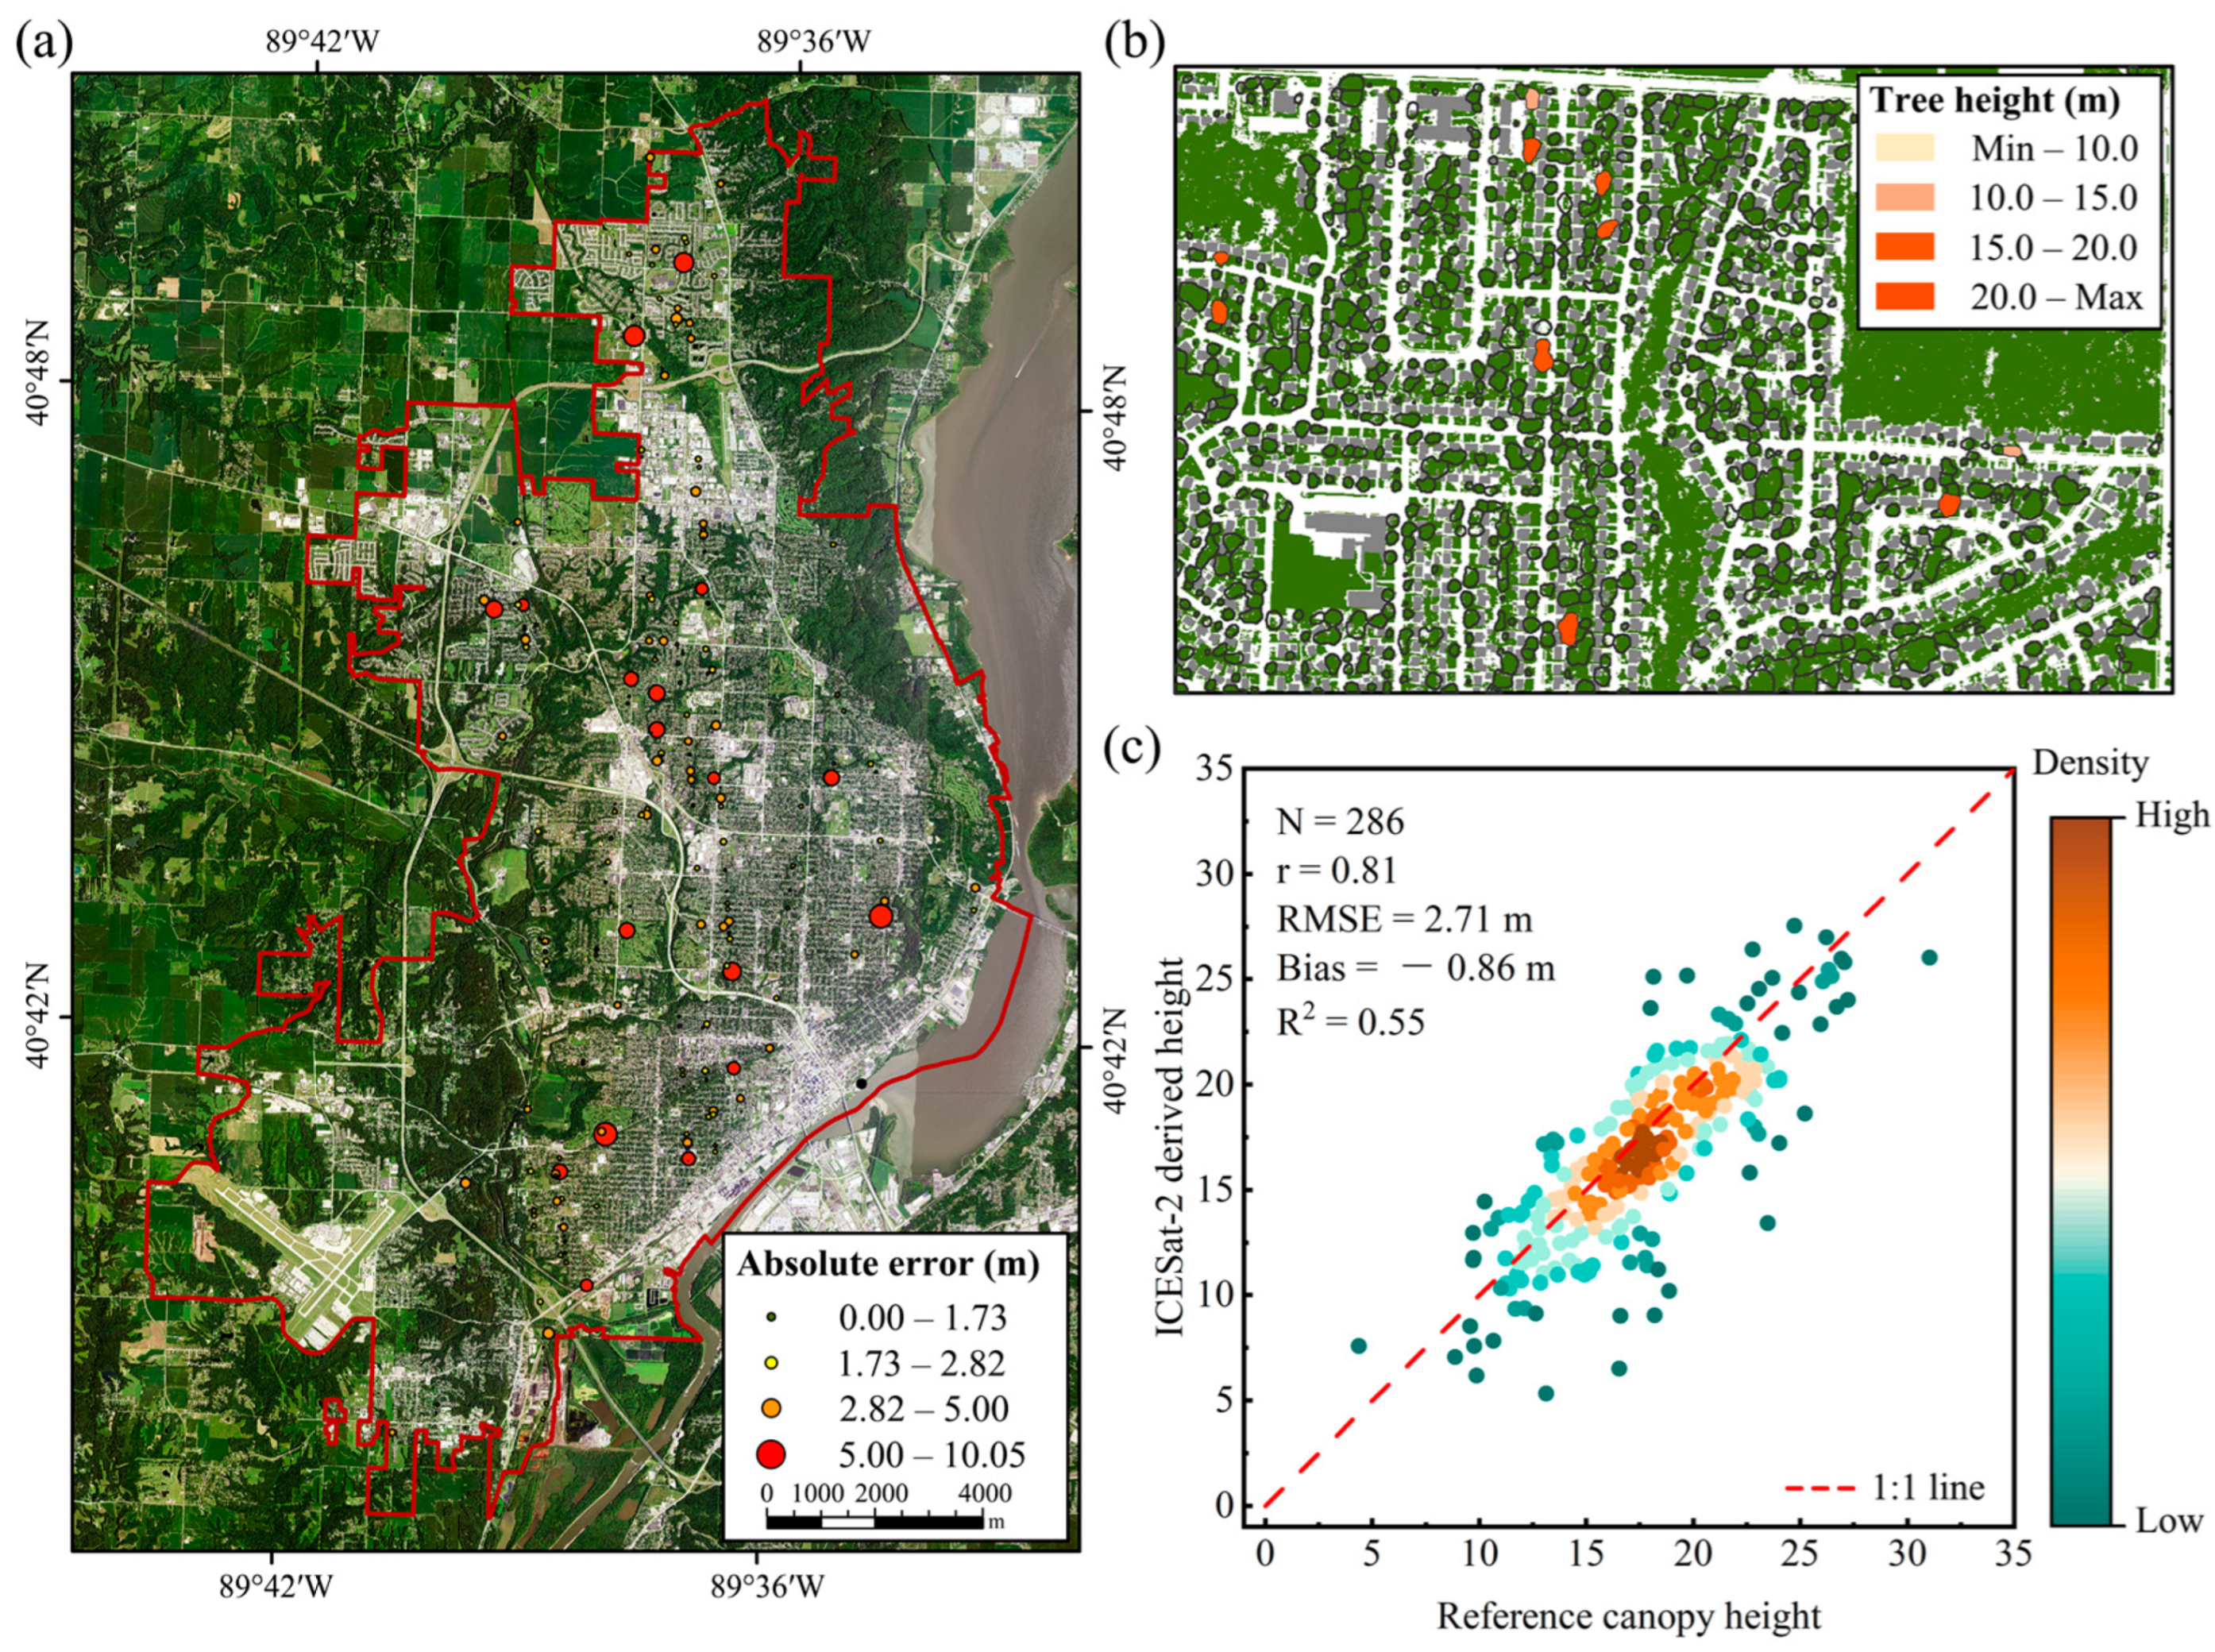
After denoising, along-track terrain reconstruction, and removal of building photons, the retrieval accuracy of individual tree canopy height in urban areas was further evaluated. A total of 1391 individual trees were detected within the study area. After dual-threshold screening, 286 trees were retained, accounting for 20.6% of all detected trees. The retained samples achieved R2 = 0.55, r = 0.81, RMSE = 2.71 m, and bias = −0.86 m (Figure 8c). As shown in Figure 8a, the spatial distribution of errors showed no obvious clustering. Figure 8b presents local individual tree segmentation results and the corresponding canopy height rendering, indicating that the proposed method can represent TCH at the individual-tree scale. Figure 8c shows that the screened samples were generally distributed around the 1:1 line, although noticeable scatter remained at both ends of the TCH range.
Figure 8.
Results of urban individual tree canopy height extraction and error distribution. (a) Sampled tree locations and absolute error distribution; (b) local rendering of canopy height; (c) scatterplot of ICESat-2-estimated TCH versus reference height.
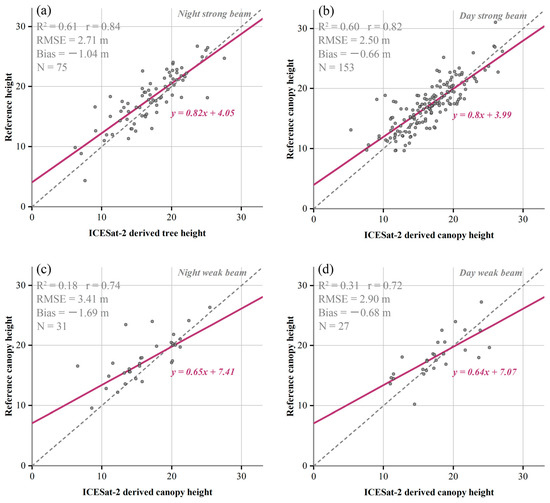
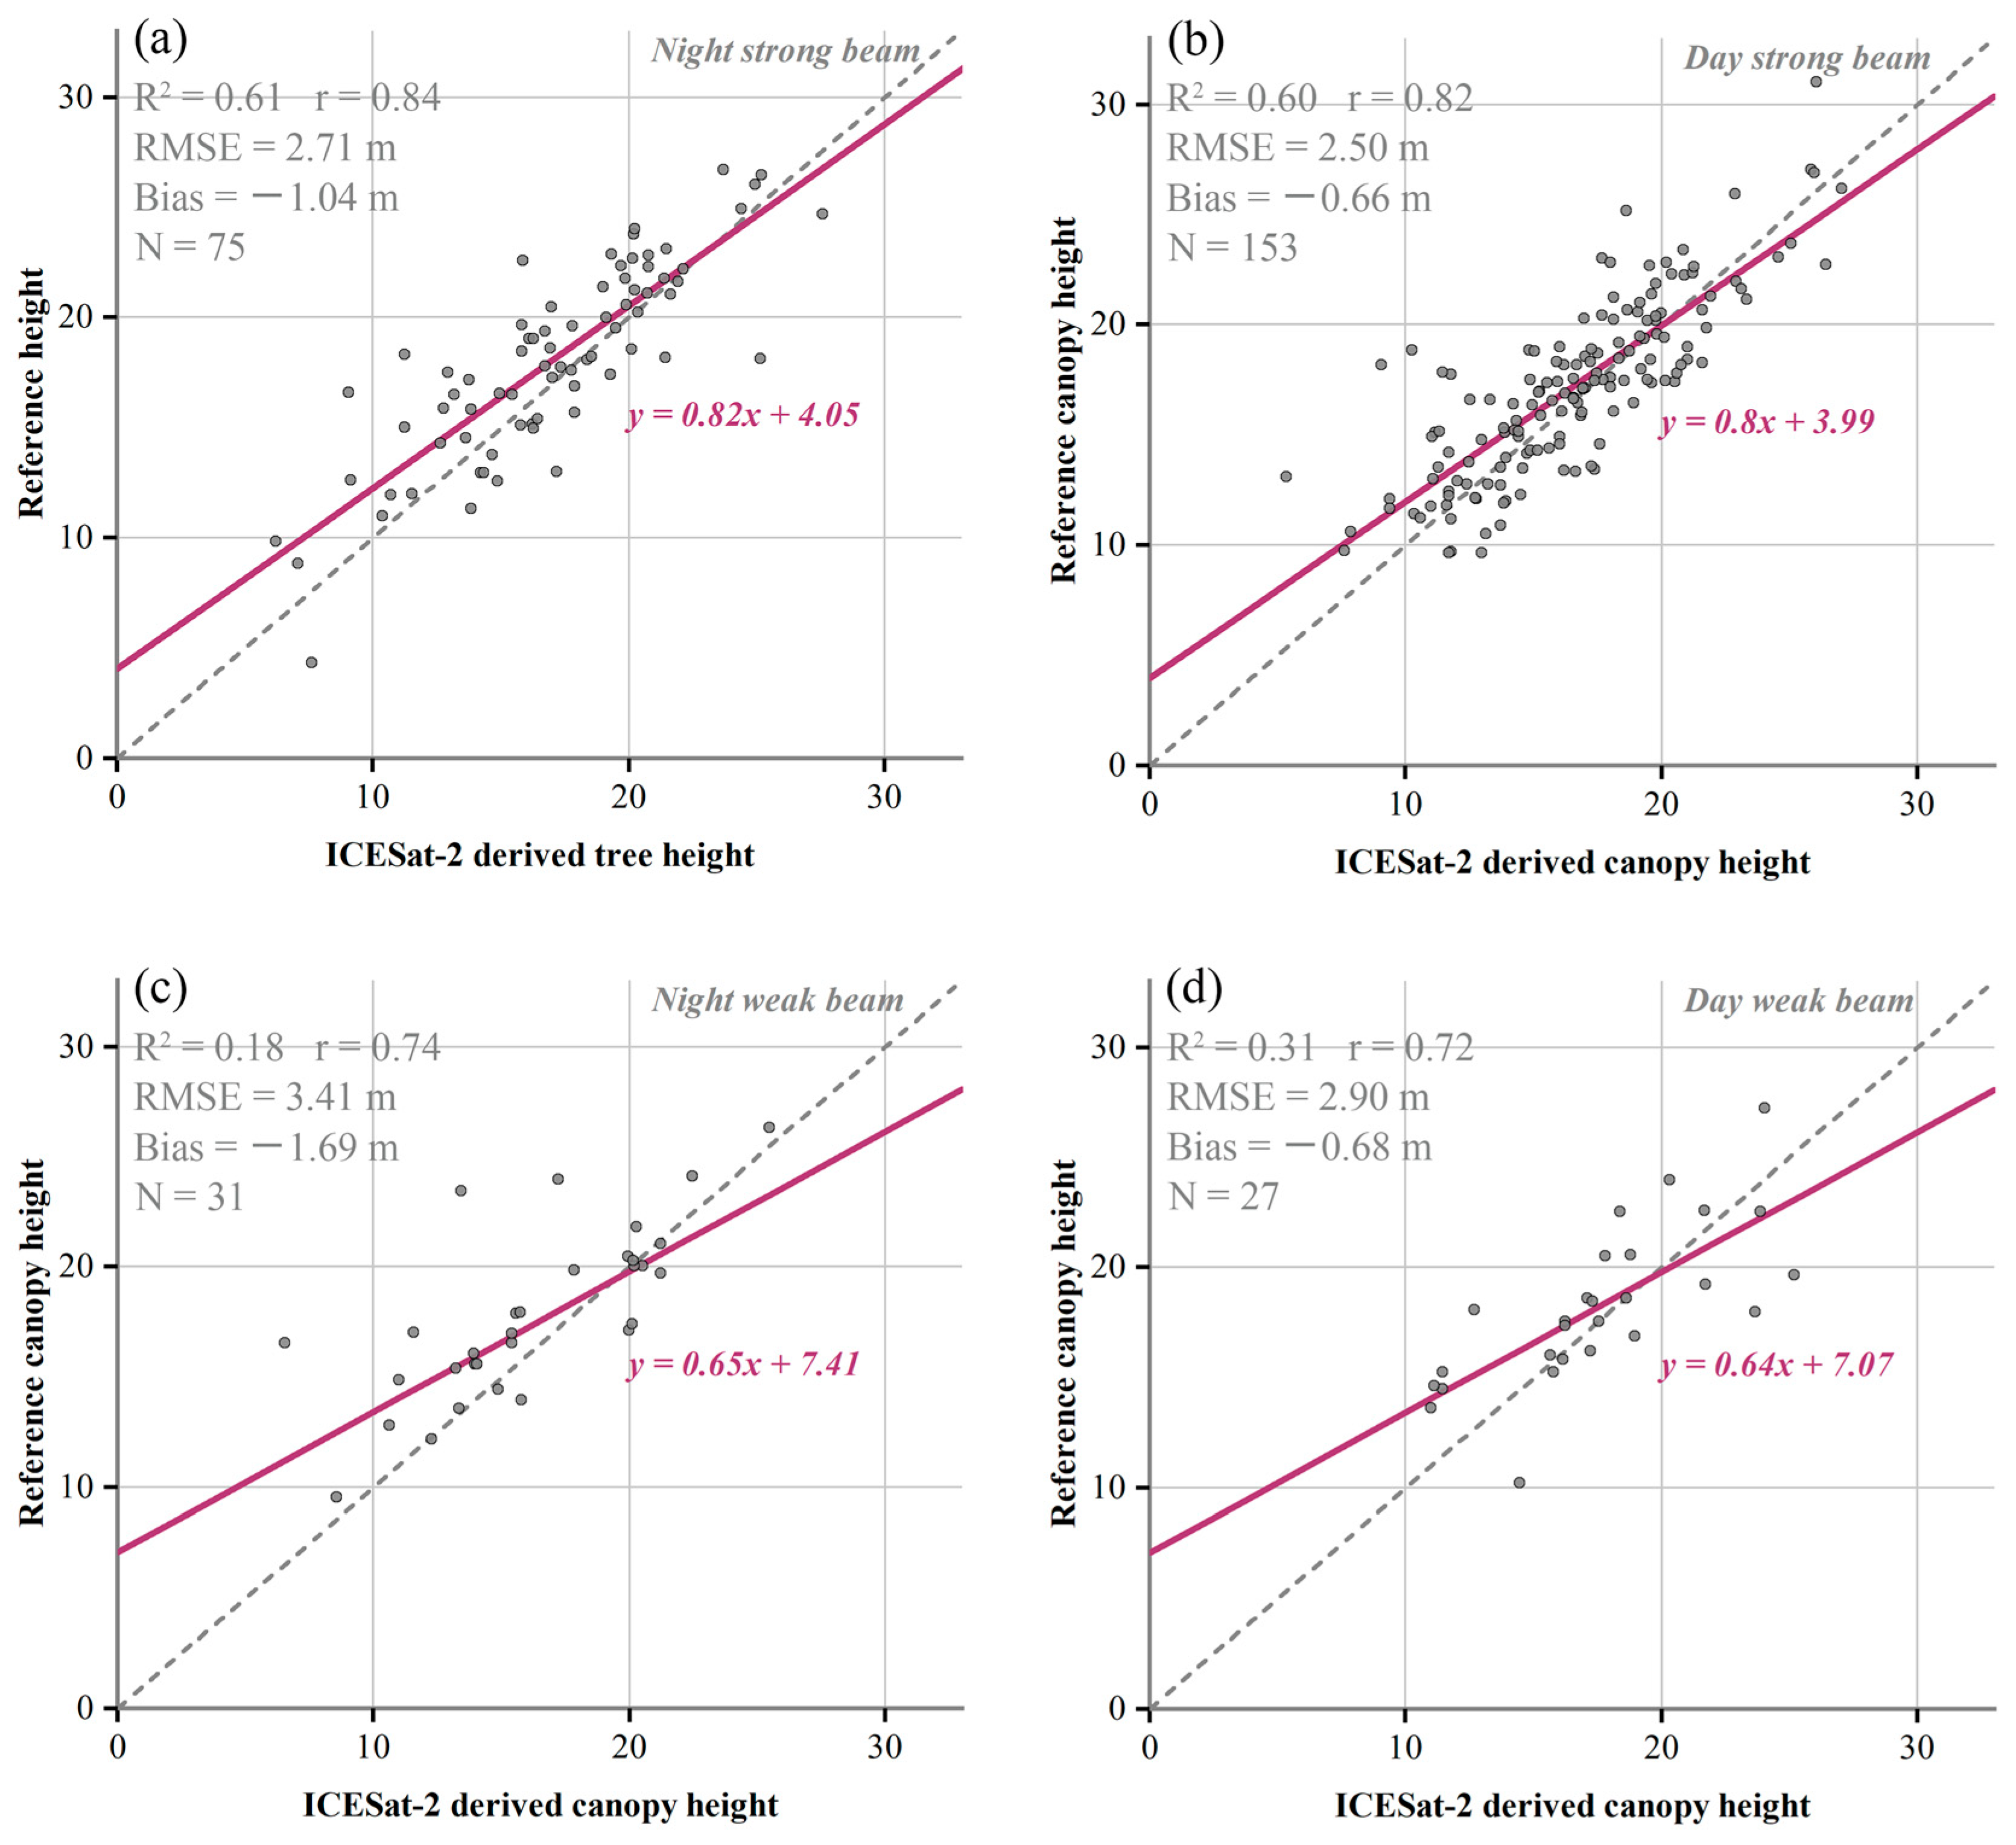
To examine the source of accuracy differences, the retained observations were grouped according to the beam strength and day/night condition of their corresponding ICESat-2 acquisitions. The results show that retrieval accuracy under strong beam conditions is higher than that under weak beam conditions (Figure 9). Nighttime strong beam samples achieved R2 = 0.61, RMSE = 2.71 m, bias = −1.04 m, whereas daytime strong beam samples achieved R2 = 0.60, RMSE = 2.50 m, bias = −0.66 m. By contrast, nighttime weak beam samples achieved R2 = 0.18, RMSE = 3.41 m, bias = −1.69 m, whereas daytime weak beam samples achieved R2 = 0.31, RMSE = 2.90 m, bias = −0.68 m. Within the same beam type, the difference in correlation coefficients between daytime and nighttime samples was less than 0.03. This suggests that, under the current processing and sample screening strategy, beam strength has a greater influence on the results than acquisition time.
Figure 9.
Scatterplots of TCH retrieval accuracy under different beam strengths and day/night conditions. (a) Nighttime strong beam; (b) daytime strong beam; (c) nighttime weak beam; (d) daytime weak beam.
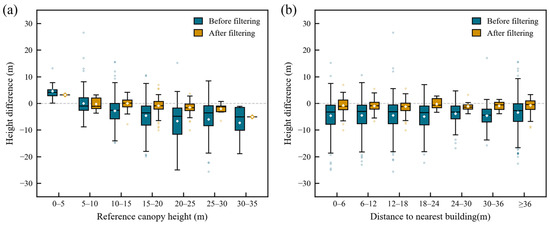
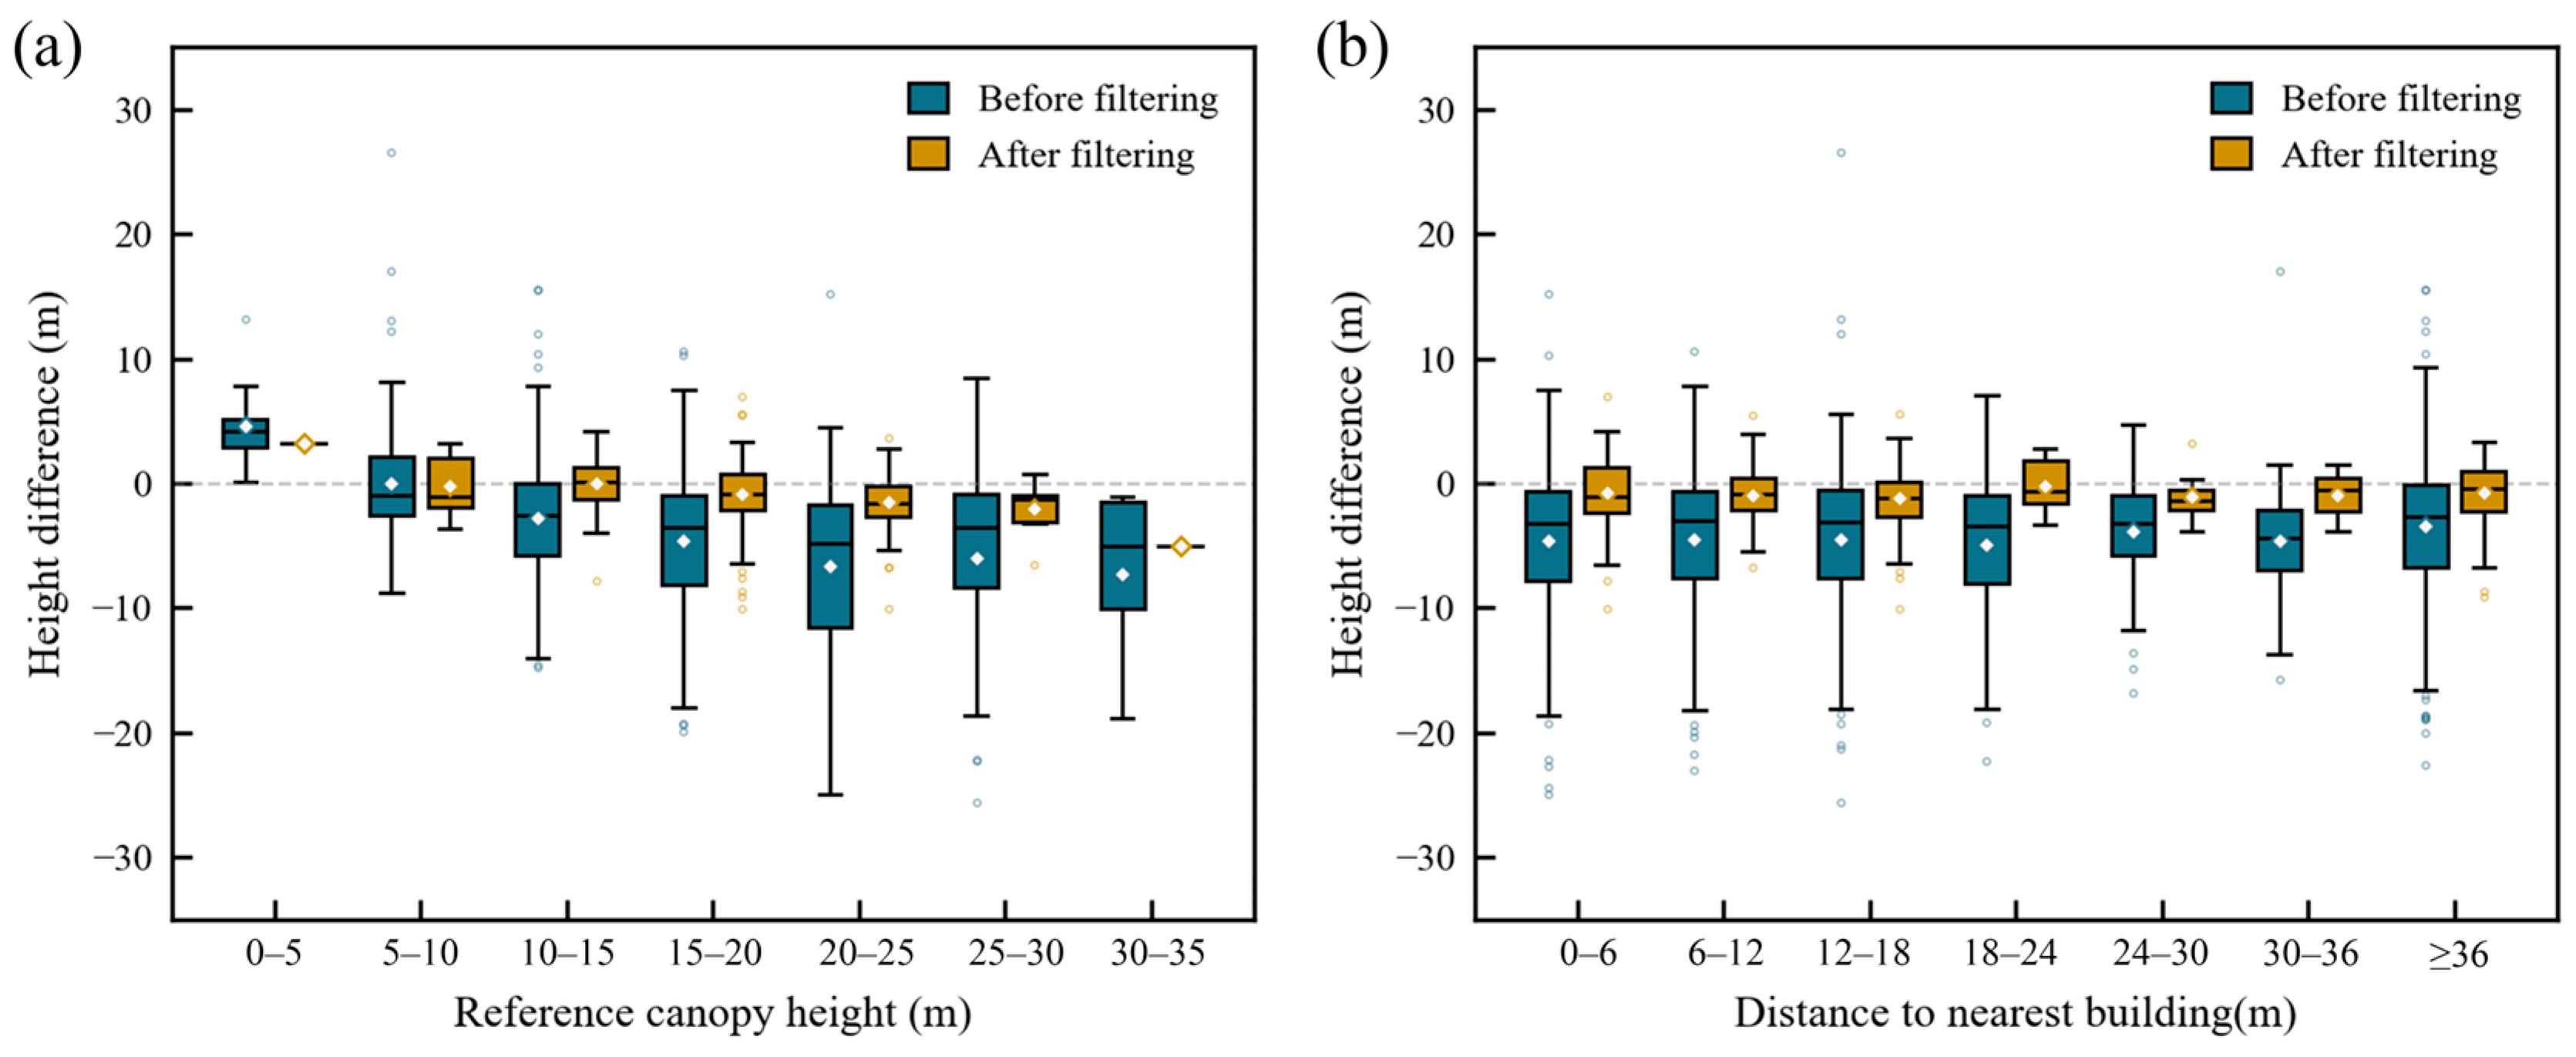
Further error analysis showed that tree height and local urban context also affected retrieval stability (Figure 10). Before dual-threshold screening, residuals tended to increase with tree height, whereas this trend weakened after screening. Distance to the nearest building did not show a clear monotonic relationship with error, but outliers remained more common in building-adjacent zones, suggesting that residual building reflections and mixed footprint effects still influenced some samples.
Figure 10.
Distribution of TCH residuals. (a) Grouped by tree height interval; (b) grouped by distance to the nearest building.
3.3. Characteristics of Retained and Excluded Crowns
To characterize the potential differences introduced by the sample-screening procedure, crown attributes of the retained and excluded samples were compared (Table 1). The retained crowns had a larger median crown area than the excluded crowns (39.16 vs. 24.25 m2). Their median ALS-derived canopy height was also slightly greater (17.53 vs. 16.51 m), although the height distributions of the two groups showed substantial overlap. The median distance to the nearest building was 11.88 m for the retained samples and 14.05 m for the excluded samples, indicating no apparent tendency for the screening procedure to preferentially retain crowns farther from buildings. Overall, the retained subset was descriptively characterized by larger crown areas, whereas differences in canopy height and building proximity were comparatively limited.
Table 1.
Comparison of crown and photon characteristics between retained and excluded samples.
4. Discussion
4.1. Comparison with Existing Canopy Height Products
From an application perspective, ICESat-2 is not well suited to directly supporting continuous and comprehensive individual tree inventories in urban areas. The limited sample size obtained in this study further indicates that ICESat-2 observations from a single city are insufficient on their own to develop a robust urban-scale extrapolation model, particularly given the strong spatial heterogeneity of urban forests. Nevertheless, the 286 retained samples showed useful agreement with the ALS reference heights within the evaluated sample set. The accuracy of the retrieved TCH was comparable to tree height accuracies previously reported using ICESat-2 in forest environments with relatively simple or flat terrain, such as the RMSE of 2.9 m and correlation coefficient of 0.84 reported by Queinnec et al. [45].
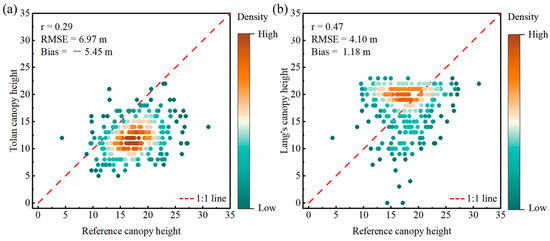
The comparison with existing canopy height products further illustrates the potential application value of these samples. In this study, canopy height values from the Tolan 1 m product and the Lang 10 m product were extracted within the 286 valid ICESat-2 sampled crowns. ATL08 was not included in the crown-level quantitative comparison because an ATL08 along-track segment in an urban environment typically contains multiple crowns and other surface objects, and its canopy height estimate cannot therefore be uniquely assigned to a specific crown. For the Tolan product, the maximum value within each individual tree crown polygon was extracted, whereas for the Lang product, the pixel value intersecting each crown polygon was used. Because the crown polygons were initially delineated from the Tolan product, the comparison with Tolan is not fully independent and is therefore interpreted as a local assessment of product correspondence and bias within the selected crown units. The results show that both products exhibited systematic bias in the study area (Figure 11). Specifically, the Tolan product tended to underestimate tree height, whereas the Lang product tended to overestimate it. In contrast, after urban-oriented photon processing and sample screening, the ICESat-2-derived samples showed closer agreement with ALS reference heights. After mean error correction using the extracted ICESat-2 samples, the RMSE of the Tolan product decreased from 6.97 m to 4.44 m, while that of the Lang product decreased from 4.10 m to 4.02 m. Because this comparison was restricted to the same 286 retained crowns, these results represent a local assessment of product bias and the effect of sample-based mean correction rather than evidence of general calibration capability. Nevertheless, the screened ICESat-2-derived samples may serve as supplementary local reference data for product evaluation in areas with sufficient photon support.
Figure 11.
Scatterplots of heights from existing canopy height products against ALS reference heights. (a) Tolan 1 m product; (b) Lang 10 m product.
4.2. Uncertainty Analysis and Method Limitations
Although the proposed method achieved reasonable accuracy for urban individual-tree TCH retrieval, several sources of uncertainty remain. These uncertainties can be broadly grouped into three categories: those arising from the inherent observation characteristics of ICESat-2, those associated with methodological choices in the current workflow, and those related to the auxiliary datasets and their processing.
Uncertainties arising from the inherent observation characteristics of ICESat-2 were first considered. The most persistent uncertainty was systematic underestimation. Bias values were negative across all observation groups, indicating that ICESat-2-derived TCH estimates tended to be lower than ALS reference heights. This is mainly related to the observation characteristics of photon-counting lidar, where detected vegetation photons often originate from within the upper canopy rather than from the absolute canopy top. Therefore, the highest detected vegetation photon may still be lower than the true maximum tree height, especially when the canopy top is sparsely sampled. Observation conditions also affected retrieval stability. Strong beams provided more usable vegetation photons and produced more robust TCH estimates, whereas weak beams showed greater error scatter because of limited photon availability. Differences between daytime and nighttime observations were relatively small, suggesting that the denoising and screening procedures reduced the influence of background radiation to some extent. Local urban complexity introduced additional uncertainty because vegetation and nearby built surfaces may be simultaneously sampled within the footprint, particularly in building-adjacent environments.
A second source of uncertainty is associated with methodological choices in the current workflow. The use of the maximum relative vegetation-photon height as the TCH estimator provides a direct and physically interpretable representation of the detected canopy top, but it may be sensitive to residual high photons and may still underestimate tree height when the true canopy apex is not sampled. Alternative estimators, such as upper height percentiles or energy-weighted upper quantiles, may provide greater robustness under sparse or uneven photon sampling. The comparison between retained and excluded crowns further showed that the screening procedure introduced sample selection: retained crowns had larger crown areas, whereas differences in ALS canopy height and building proximity were comparatively limited (Table 1). Moreover, increasingly strict photon-count criteria generally improved retrieval accuracy but substantially reduced sample retention (Table A2). The adopted thresholds therefore represent a compromise between accuracy and sample coverage, and the reported accuracy should be interpreted as the performance of the screened, photon-supported subset rather than of all detected urban tree crowns.
A third source of uncertainty arises from the auxiliary datasets and their processing. The performance of the current workflow depends partly on the accuracy of crown-boundary extraction, because these boundaries directly affect footprint–crown overlap, photon weights, and whether a crown satisfies the subsequent screening criteria. The crown polygons used in this study were generated from the 1 m canopy height product of Tolan et al. and were therefore inevitably affected by errors in the source product and by errors arising from individual tree crown segmentation [39]. Although the corresponding polygons were manually refined with reference to NAIP imagery to improve the spatial correspondence between crown objects and actual trees, this process introduced operator dependence, thereby limiting the reproducibility and scalability of the current implementation. An ablation analysis based on the nighttime strong-beam subset quantified this effect. Due to under-segmentation, the uncorrected crown polygons retained more samples; however, r dropped from 0.84 to 0.74, and the RMSE increased from 2.71 m to 3.93 m. Nevertheless, the proposed framework is not restricted to the Tolan product or to manual editing; in future applications, the crown-boundary extraction module can be replaced by more accurate and automatically generated crown-boundary data. In addition, temporal inconsistency among ICESat-2 observations, auxiliary datasets, and ALS reference data may introduce uncertainty, particularly because multi-year ICESat-2 observations are often needed to obtain sufficient urban samples. Future work should test the method across more cities, improve automatic crown polygon generation and quality control, and further refine photon classification in building-adjacent areas.
5. Conclusions
This study developed an urban-oriented method for TCH extraction from ICESat-2 photon data in the built-up area of Peoria, Illinois. The main methodological contribution is an urban-oriented, object-based ICESat-2 workflow that integrates vegetation–building photon separation with crown-based TCH extraction. By introducing a non-exclusive, energy-weighted photon-to-crown assignment, the method allows overlapping crowns to share photon information according to intercepted footprint energy, thereby reducing spatial mismatch and better representing ICESat-2 footprint sampling in fragmented urban vegetation.
Using ALS as the reference data, the 286 crowns (20.6% of the 1391 crowns associated with vegetation photons) that met the selected photon-support thresholds achieved R2 = 0.55, RMSE = 2.71 m, and bias = −0.86 m. These results indicate that the proposed workflow can support the extraction of sparse individual-tree TCH samples from ICESat-2 observations in urban built-up areas. Further grouped analysis showed that retrieval accuracy was influenced mainly by beam strength and tree height, while acquisition time and distance to the nearest building also had some effects.
From an application perspective, ICESat-2 is unlikely to support continuous or comprehensive TCH mapping in urban areas, but it can provide a sparse set of locally reliable canopy height samples. Such samples may be useful for local validation, local calibration, and as reference data for subsequent regional canopy height mapping. Future work should further test the proposed method across different urban settings and explore how sparse ICESat-2 samples and the associated processing strategy can support regional canopy height mapping.
Author Contributions
Conceptualization, X.Z.; methodology, F.C., X.Z. and L.L.; validation, C.Z., Y.S. and Z.Z.; resources, X.Z. and F.W.; data curation, F.C. and Z.Z.; writing—original draft preparation, F.C.; writing—review and editing, F.C., X.Z. and Y.S.; visualization, F.C. and C.Z.; supervision, X.Z., L.L. and F.W.; funding acquisition, L.L. All authors have read and agreed to the published version of the manuscript.
Funding
This work was supported by the National Natural Science Foundation of China (Grant Nos. 42501577 and 42301505), the Deep Earth Probe and Mineral Resources Exploration—National Science and Technology Major Project (Grant No. 2025ZD1006800), and the National Key Research and Development Program of China (Grant No. 2024YFF0807701).
Data Availability Statement
The ICESat-2 ATL03 and ATL08 data are publicly available from NSIDC DAAC through NASA Earthdata Search. The ALS validation data are available from the Illinois State Geological Survey. Sentinel-2 imagery was accessed and processed through Google Earth Engine. NAIP aerial imagery is publicly available from the National Agriculture Imagery Program. The processed data and workflow materials supporting the findings of this study, including sample results, auxiliary data products, and processing scripts, are publicly available on Zenodo under the CC-BY license: https://doi.org/10.5281/zenodo.19858495.
Acknowledgments
The authors thank the NASA National Snow and Ice Data Center Distributed Active Archive Center (NSIDC DAAC) and NASA Earthdata Search for providing access to the ICESat-2 ATL03 and ATL08 data. The authors also thank the Illinois State Geological Survey for providing the airborne LiDAR data, Google Earth Engine and the Copernicus Sentinel-2 program for supporting access to and processing of Sentinel-2 imagery, and the National Agriculture Imagery Program for providing aerial imagery.
Conflicts of Interest
The authors declare no conflicts of interest.
Abbreviations
The following abbreviations are used in this manuscript:
| ALS | Airborne laser scanning |
| ATLAS | Advanced Topographic Laser Altimeter System |
| CHM | Canopy height model |
| DBSCAN | Density-Based Spatial Clustering of Applications with Noise |
| DSM | Digital surface model |
| DTM | Digital terrain model |
| ICESat-2 | Ice, Cloud, and land Elevation Satellite-2 |
| LiDAR | Light detection and ranging |
| MSAVI2 | Modified Soil Adjusted Vegetation Index 2 |
| NAIP | National Agriculture Imagery Program |
| OPTICS | Ordering Points To Identify the Clustering Structure |
| SAR | Synthetic aperture radar |
| UTM | Universal Transverse Mercator |
| TCH | Tree canopy height |
| NBS | Nature-based solution |
| NSIDC | National Snow and Ice Data Center |
Appendix A
Table A1.
Denoising accuracy of all ICESat-2 beams used in this study.
Appendix B
Table A2.
Sensitivity of canopy height retrieval performance to photon-count screening thresholds. Bold values indicate the configuration adopted in this study and its corresponding results.
References
- Food Agriculture Organization of the United Nations. Urban Forests: A Global Perspective; FAO: Rome, Italy, 2020. [Google Scholar]
- United Nations. Transforming Our World: The 2030 Agenda for Sustainable Development; United Nations: New York, NY, USA, 2015. [Google Scholar]
- He, T.; Hu, Y.; Guo, A.; Chen, Y.; Yang, J.; Li, M.; Zhang, M. Quantifying the impact of urban trees on land surface temperature in global cities. ISPRS J. Photogramm. Remote Sens. 2024, 210, 69–79. [Google Scholar] [CrossRef] [Scilit]
- Zhao, J.; Yang, X.; Liu, X.; Ma, Y.; Li, X.; Yang, J. Assessing the potential of large-scale urban forest projects as a natural climate solution. Nat.-Based Solut. 2024, 6, 100153. [Google Scholar] [CrossRef] [Scilit]
- World Bank. Urban Population (% of Total Population); World Bank: Washington, DC, USA, 2025. [Google Scholar]
- Song, Y.; Imanishi, J.; Sasaki, T.; Ioki, K.; Morimoto, Y. Estimation of broad-leaved canopy growth in the urban forested area using multi-temporal airborne LiDAR datasets. Urban For. Urban Green. 2016, 16, 142–149. [Google Scholar] [CrossRef] [Scilit]
- Zhou, L.; Meng, R.; Tan, Y.; Lv, Z.; Zhao, Y.; Xu, B.; Zhao, F. Comparison of UAV-based LiDAR and digital aerial photogrammetry for measuring crown-level canopy height in the urban environment. Urban For. Urban Green. 2022, 69, 127489. [Google Scholar] [CrossRef] [Scilit]
- Bast, A.; Hobi, M.L.; Ginzler, C.; Piermattei, L.; Fischer, C.; Nikolova, P.S.; Bührle, L.J.; Kalt, T.; Graf, F. An approach to detect and map forest canopy layers in Swiss mountain forests using nationwide airborne laser scanning data. Int. J. Appl. Earth Obs. Geoinf. 2025, 145, 104986. [Google Scholar] [CrossRef] [Scilit]
- Campbell, M.J.; Cutler, S.L.; Dennison, P.E. A singular, broadly-applicable model for estimating on- and off-path walking travel rates using airborne lidar data. Sci. Rep. 2024, 14, 21393. [Google Scholar] [CrossRef] [Scilit] [PubMed]
- Ling, Q.; Chen, Y.; Feng, Z.; Pei, H.; Wang, C.; Yin, Z.; Qiu, Z. Monitoring Canopy Height in the Hainan Tropical Rainforest Using Machine Learning and Multi-Modal Data Fusion. Remote Sens. 2025, 17, 966. [Google Scholar] [CrossRef] [Scilit]
- Renshaw, M.; Guenther, E.; Magruder, L.; Neuenschwander, A. Assessing ICESat-2’s Capability for Global Mangrove Forest Canopy Measurements. Remote Sens. 2025, 18, 117. [Google Scholar] [CrossRef] [Scilit]
- Zhao, Y.; Wu, B.; Kong, G.; Zhang, H.; Wu, J.; Yu, B.; Wu, J.; Fan, H. Generating high-resolution DEMs in mountainous regions using ICESat-2/ATLAS photons. Int. J. Appl. Earth Obs. Geoinf. 2025, 138, 104461. [Google Scholar] [CrossRef] [Scilit]
- Liu, C.; Gong, W.; Shi, S.; Wang, T.; Xu, T.; Shi, Z.; Niu, J. Deep learning-driven forest canopy height mapping in boreal regions through multi-source remote sensing fusion: Integrating Sentinel-1/2, PALSAR, and ICESat-2/LVIS data. Int. J. Appl. Earth Obs. Geoinf. 2025, 143, 104766. [Google Scholar] [CrossRef] [Scilit]
- Liu, X.; Su, Y.; Hu, T.; Yang, Q.; Liu, B.; Deng, Y.; Tang, H.; Tang, Z.; Fang, J.; Guo, Q. Neural network guided interpolation for mapping canopy height of China’s forests by integrating GEDI and ICESat-2 data. Remote Sens. Environ. 2022, 269, 112844. [Google Scholar] [CrossRef] [Scilit]
- Malambo, L.; Popescu, S. Mapping vegetation canopy height across the contiguous United States using ICESat-2 and ancillary datasets. Remote Sens. Environ. 2024, 309, 114226. [Google Scholar] [CrossRef] [Scilit]
- Potapov, P.; Li, X.; Hernandez-Serna, A.; Tyukavina, A.; Hansen, M.C.; Kommareddy, A.; Pickens, A.; Turubanova, S.; Tang, H.; Silva, C.E.; et al. Mapping global forest canopy height through integration of GEDI and Landsat data. Remote Sens. Environ. 2021, 253, 112165. [Google Scholar] [CrossRef] [Scilit]
- Lang, N.; Jetz, W.; Schindler, K.; Wegner, J.D. A high-resolution canopy height model of the Earth. Nat. Ecol. Evol. 2023, 7, 1778–1789. [Google Scholar] [CrossRef] [Scilit] [PubMed]
- Dong, H.; Xu, Z.; Wu, J.; Lan, T.; Wang, L.; Shao, G.; Tang, L. High-precision airborne LiDAR remains essential for urban forestry: Revealing the limitations of recent large-scale canopy height products in urban contexts. Int. J. Appl. Earth Obs. Geoinf. 2025, 143, 104791. [Google Scholar] [CrossRef] [Scilit]
- Fu, L.; Shu, Q.; Yang, Z.; Xia, C.; Zhang, X.; Zhang, Y.; Li, Z.; Li, S. Accuracy assessment of topography and forest canopy height in complex terrain conditions of Southern China using ICESat-2 and GEDI data. Front. Plant Sci. 2025, 16, 1547688. [Google Scholar] [CrossRef] [Scilit] [PubMed]
- Pronk, M.; Eleveld, M.; Ledoux, H. Assessing Vertical Accuracy and Spatial Coverage of ICESat-2 and GEDI Spaceborne Lidar for Creating Global Terrain Models. Remote Sens. 2024, 16, 2259. [Google Scholar] [CrossRef] [Scilit]
- Chen, P.; Huang, H.; Qin, P.; Liu, X.; Wu, Z.; Zhao, F.; Liu, C.; Wang, J.; Li, Z.; Cheng, X.; et al. Characterizing dynamics of built-up height in China from 2005 to 2020 based on GEDI, Landsat, and PALSAR data. Remote Sens. Environ. 2025, 325, 114776. [Google Scholar] [CrossRef] [Scilit]
- Ma, X.; Zheng, G.; Xu, C.; Moskal, L.M.; Gong, P.; Guo, Q.; Huang, H.; Li, X.; Liang, X.; Pang, Y.; et al. A global product of 150-m urban building height based on spaceborne lidar. Sci. Data 2024, 11, 1387. [Google Scholar] [CrossRef] [Scilit] [PubMed]
- Fang, J.; Qiang, S.; Wang, Y. A High-Precision LiDAR Full-Waveform Echo Decomposition Method for Parameter Extraction. IEEE Trans. Instrum. Meas. 2025, 74, 6507511. [Google Scholar] [CrossRef] [Scilit]
- Lian, W.; Zhang, G.; Cui, H.; Chen, Z.; Wei, S.; Zhu, C.; Xie, Z. Extraction of high-accuracy control points using ICESat-2 ATL03 in urban areas. Int. J. Appl. Earth Obs. Geoinf. 2022, 115, 103116. [Google Scholar] [CrossRef] [Scilit]
- Strahler, A.H. The Factor of Scale in Remote Sensing. Remote Sens. Environ. 1987, 21, 311–332. [Google Scholar] [CrossRef] [Scilit]
- Ağca, M.; Kaya, E.; Daloğlu, A.İ.; Yücel, A.; Yalçınkaya, S. Kentsel alanlarda ağaç yükseklik bilgilerinin ICESat-2/ATLAS ve İHA verilerinden elde edilmesi. Geomatik 2024, 9, 86–96. [Google Scholar] [CrossRef] [Scilit]
- Xu, X.; Zhang, Y.; Fu, P.; Dang, C.; Cai, B.; Zhuang, Q.; Shao, Z.; Li, D.; Ding, Q. Synergistic mapping of urban tree canopy height using ICESat-2 data and GF-2 imagery. Int. J. Appl. Earth Obs. Geoinf. 2025, 136, 104348. [Google Scholar] [CrossRef] [Scilit]
- Liu, A.; Cheng, X.; Chen, Z. Performance evaluation of GEDI and ICESat-2 laser altimeter data for terrain and canopy height retrievals. Remote Sens. Environ. 2021, 264, 112571. [Google Scholar] [CrossRef] [Scilit]
- Neuenschwander, A.; Pitts, K.; Jelley, B.; Robbins, J.; Markel, J.; Popescu, S.; Nelson, R.; Harding, D.; Pederson, D.; Klotz, B.; et al. Ice, Cloud, and Land Elevation Satellite (ICESat-2) Project Algorithm Theoretical Basis Document (ATBD) for Land—Vegetation Along-Track Products (ATL08); Version 6; NASA Goddard Space Flight Center: Greenbelt, MD, USA, 2022.
- Neuenschwander, A.; Guenther, E.; White, J.C.; Duncanson, L.; Montesano, P. Validation of ICESat-2 terrain and canopy heights in boreal forests. Remote Sens. Environ. 2020, 251, 112110. [Google Scholar] [CrossRef] [Scilit]
- Wang, R.; Lu, Y.; Lu, D.; Li, G. Improving extraction of forest canopy height through reprocessing ICESat-2 ATLAS and GEDI data in sparsely forested plain regions. GISci. Remote Sens. 2024, 61, 2396807. [Google Scholar] [CrossRef] [Scilit]
- Xie, H.; Ye, D.; Xu, Q.; Sun, Y.; Huang, P.; Tong, X.; Guo, Y.; Liu, X.; Liu, S. A Density-Based Adaptive Ground and Canopy Detecting Method for ICESat-2 Photon-Counting Data. IEEE Trans. Geosci. Remote Sens. 2022, 60, 4411813. [Google Scholar] [CrossRef] [Scilit]
- Tian, X.; Shan, J. Detection of Signal and Ground Photons From ICESat-2 ATL03 Data. IEEE Trans. Geosci. Remote Sens. 2023, 61, 5700314. [Google Scholar] [CrossRef] [Scilit]
- Markus, T.; Neumann, T.; Martino, A.; Abdalati, W.; Brunt, K.; Csatho, B.; Farrell, S.; Fricker, H.; Gardner, A.; Harding, D.; et al. The Ice, Cloud, and land Elevation Satellite-2 (ICESat-2): Science requirements, concept, and implementation. Remote Sens. Environ. 2017, 190, 260–273. [Google Scholar] [CrossRef] [Scilit]
- Magruder, L.; Brunt, K.; Alonzo, M. Early ICESat-2 on-orbit Geolocation Validation Using Ground-Based Corner Cube Retro-Reflectors. Remote Sens. 2020, 12, 3653. [Google Scholar] [CrossRef] [Scilit]
- Neuenschwander, A.L.; Magruder, L.A. Canopy and Terrain Height Retrievals with ICESat-2: A First Look. Remote Sens. 2019, 11, 1721. [Google Scholar] [CrossRef] [Scilit]
- Neumann, T.A.; Brenner, A.; Hancock, D.; Robbins, J.; Gibbons, A.; Lee, J.; Harbeck, K.; Saba, J.; Luthcke, S.; Rebold, T. Ice, Cloud, and Land Elevation Satellite (ICESat-2) Project Algorithm Theoretical Basis Document (ATBD) for Global Geolocated Photons (ATL03); Version 6; NASA Goddard Space Flight Center: Greenbelt, MD, USA, 2022.
- Abdullah, Q. The ASPRS Positional Accuracy Standards, Edition 2: The Geospatial Mapping Industry Guide to Best Practices. Photogramm. Eng. Remote Sens. 2023, 89, 581–588. [Google Scholar] [CrossRef] [Scilit]
- Tolan, J.; Yang, H.-I.; Nosarzewski, B.; Couairon, G.; Vo, H.V.; Brandt, J.; Spore, J.; Majumdar, S.; Haziza, D.; Vamaraju, J.; et al. Very high resolution canopy height maps from RGB imagery using self-supervised vision transformer and convolutional decoder trained on aerial lidar. Remote Sens. Environ. 2024, 300, 113888. [Google Scholar] [CrossRef] [Scilit]
- Wang, L.; Zhang, X.; Zhang, Y.; Chen, F.; Dang, S.; Sun, T. A Density-Based Multilevel Terrain-Adaptive Noise Removal Method for ICESat-2 Photon-Counting Data. Sensors 2023, 23, 9742. [Google Scholar] [CrossRef] [Scilit] [PubMed]
- Zhu, X.; Nie, S.; Wang, C.; Xi, X.; Wang, J.; Li, D.; Zhou, H. A Noise Removal Algorithm Based on OPTICS for Photon-Counting LiDAR Data. IEEE Geosci. Remote Sens. Lett. 2021, 18, 1471–1475. [Google Scholar] [CrossRef] [Scilit]
- Baldin, C.M.; Casella, V.M. Vegetative Index Intercalibration Between PlanetScope and Sentinel-2 Through a SkySat Classification in the Context of “Riserva San Massimo” Rice Farm in Northern Italy. Remote Sens. 2024, 16, 3921. [Google Scholar] [CrossRef] [Scilit]
- Huang, J.; Xing, Y.; Shuai, Y.; Zhu, H. A Novel Noise Filtering Evaluation Criterion of ICESat-2 Signal Photon Data in Forest Environments. IEEE Geosci. Remote Sens. Lett. 2022, 19, 7003805. [Google Scholar] [CrossRef] [Scilit]
- Li, B.; Xie, H.; Liu, S.; Sun, Y.; Xu, Q.; Tong, X. Correction of ICESat-2 terrain within urban areas using a water pump deployment criterion with the vertical contour of the terrain. Remote Sens. Environ. 2023, 298, 113817. [Google Scholar] [CrossRef] [Scilit]
- Queinnec, M.; White, J.C.; Coops, N.C. Comparing airborne and spaceborne photon-counting LiDAR canopy structural estimates across different boreal forest types. Remote Sens. Environ. 2021, 262, 112510. [Google Scholar] [CrossRef] [Scilit]

Disclaimer/Publisher’s Note: The statements, opinions and data contained in all publications are solely those of the individual author(s) and contributor(s) and not of MDPI and/or the editor(s). MDPI and/or the editor(s) disclaim responsibility for any injury to people or property resulting from any ideas, methods, instructions or products referred to in the content. |
© 2026 by the authors. Licensee MDPI, Basel, Switzerland. This article is an open access article distributed under the terms and conditions of the Creative Commons Attribution (CC BY) license.