


Highlights
What are the main findings?
- A multispectral imager for Earth Observation in the Mid-Infrared based on Compressive Sensing is designed and its performances are evaluated.
- The proposed instrument features super-resolution capabilities and good data quality.
What are the implications of the main findings?
- High-temperature phenomena can be observed with enhanced spatial resolution and some limitations like saturation can be mitigated.
- Compressive Sensing instruments acquires already compressed data and carefully tailored reconstruction algorithm can reconstruct image data with low distortion.
Abstract
High Temperature Events (HTE) are relevant in Earth Observations (EO) and their study would benefit from high-spatial-resolution data in the Mid-Wave Infrared (MWIR) range. However, this presents technological challenges, particularly regarding the availability of large focal plane arrays. In this paper, we present the design of an optical payload for Earth Observation (EO) based on the Compressive Sensing (CS) paradigm and operating in the MWIR with spatial super-resolution capabilities. The proposed payload aims to enhance Ground Sampling Distance (GSD) and mitigate limitations such as saturation and blooming which impair the observation of high-temperature phenomena including wildfires, lava flows, and other thermal hotspots. The core of the instrumental concept relies on a Spatial Light Modulator (SLM), a device comprising an array of electronically actuated micromirrors. By integrating the SLM with the CS framework, the instrument offers several key advantages: enhanced ground spatial resolution without increasing the number of detector pixels; reduced blooming and saturation effects during hotspot observations; and direct acquisition of compressed data, eliminating the need for an onboard compression unit.
1. Introduction
The importance of remote sensing observations in the mid and long wave infrared (MWIR-LWIR) spectral region has long been recognized across a range of application domains. Data products derived from observations in these spectral bands are widely applicable, including in agriculture, meteorological, climatic studies, and the monitoring of both natural and anthropogenic hazards. International discussions have emphasized the relevance of multispectral observations (ideally comprising at least three bands) with high spatial resolution in MWIR and LWIR regions [1,2]. In particular, observation in the MWIR-LWIR region with spatial resolutions between 50 and 100 m and an adequate number of spectral bands [2,3,4,5,6,7] are crucial for applications such as the characterization of volcanic gas emissions [3], quantification of CO2 released during biomass combustion in wild fires [4], and the detection and analysis of High Temperature Events (HTE) [5,6,7]. In this context, investigating the feasibility of developing instruments operating in the MWIR region with enhanced spatial resolution capabilities is of significant interest.
To meet these needs, two emerging technological approaches such as super-resolution and Compressive Sensing (CS) offer promising avenues for improving ground spatial sampling (Ground Sampling Distance–GSD) and mitigating detrimental effects such as sensor saturation and blooming. These effects often hinder the quality of observations, especially in cases involving extreme thermal phenomena such as wildfires, lava flows, or other hotspots with surface temperatures exceeding 1200 K [5].
At the core of these technologies (CS and super-resolution) is the Spatial Light Modulator (SLM). The latter can be implemented with an advanced optoelectronic device composed of an array of electronically actuated micromirrors, known as MicroMirror Array (MMA). Super-resolution techniques aim to reconstruct images with spatial resolution exceeding the nominal limit imposed by the detector. One classical approach involves applying interpolation functions to low-resolution images [8], while more recent developments have adopted machine learning and deep learning algorithms for increasing the spatial resolution of the acquired image [9,10].
In the approach presented here, super-resolution is achieved through the use of an SLM containing N × N times more elements than the detector pixels. Each N × N group of SLM elements correspond to a single detector pixel. The image focused on the SLM is modulated through appropriate binary coding masks at the SLM plane, and each detector pixel integrates the light from a corresponding group of micromirrors, enabling sampling at an effective spatial resolution N times finer than the native resolution of the detector. When all N × N modulation patterns are applied, such a procedure, using appropriate reconstruction algorithms, allows the reconstruction of the image with the same resolution as that on the focal plane at the SLM (no data compression occurs). However, if fewer modulation patterns are used, the result is a compressed acquisition (Compressive Sensing) [11,12]. CS theory leverages prior knowledge about the sparsity of a signal to reconstruct it from a significantly reduced number of measurements [12]. A signal is generally sparse in at least one domain, either the acquisition domain itself or a transformed one (e.g., discrete cosine transform, wavelet domain) [13]. Numerous CS algorithms have been developed to reconstruct high-quality images from a limited number of measurements [14,15,16,17]. These approaches enable the acquisition of compressed data with a spatial resolution N times higher than that of the physical detector, thereby surpassing the performance limits of commercial off-the-shelf (COTS) devices. As a result, this methodology enhances GSD and allows for the observation of finer spatial details, offering significant benefits for application products across multiple domains [18,19,20]. Super-resolution and CS techniques have already seen successful adoption in fields such as optical microscopy [21], and image projectors [22,23], though their application in the aerospace sector remains under active investigation. The European Space Agency (ESA) has supported various studies to assess the potential of CS for spaceborne applications. Among the earliest initiatives was the development of a CS-based hyperspectral imaging laboratory prototype for Earth Observation [24]. Another ESA-funded project, OCS-Tech, investigated CS-based sensing techniques across a broad range of application domains, also investigating different spectral regions from ultraviolet (UV) to Terahertz. The OCS-Tech project particularly highlighted the advantages of CS in spectral regions where large-format focal plane arrays (FPAs) are either technically challenging or cost-prohibitive to produce [25,26]. For instance, the CS testbed developed by Mahalanobis et al. [20] demonstrated experimentally that high-resolution spatial information in the MWIR range can be retrieved from data collected using a small FPA [27]. The potential of CS technology for EO, both in visible and MWIR spectral range, was also investigated within the EU 2020 project SURPRISE [28,29].
In this paper, we present the design of a CS-based multispectral imaging spectrometer operating in the MWIR range (3–5 µm) from Low Earth Orbit platform, with high-spatial-resolution capabilities, and the tailoring of existing reconstruction algorithm to the specific kind of data acquired by such instrument. Its potential to improve the detection, characterization, and understanding of high-temperature phenomena was thoroughly evaluated, marking a relevant step toward operational CS instruments for Earth Observation.
2. Materials and Methods
2.1. Measurement Concept
SISSI (Spettrometro a Immagine a Super-risoluzione Spaziale nel medio Infrarosso) instrument is based on an integrated approach that combines super-resolution and CS, offering several advantages. Primarily, it enables an improvement in the GSD of the payload. Specifically, the proposed imaging spectrometer architecture is capable of enhancing the GSD by a factor of four compared to the resolution typically achievable with the native pixel count of the detector. Simultaneously, it supports the acquisition of 4 to 8 spectral bands in the MWIR region. In addition, the adoption of CS techniques contributes to the mitigation of blooming and single-pixel saturation effects, which are common in conventional sensors when imaging high-temperature hotspots such as wildfires.
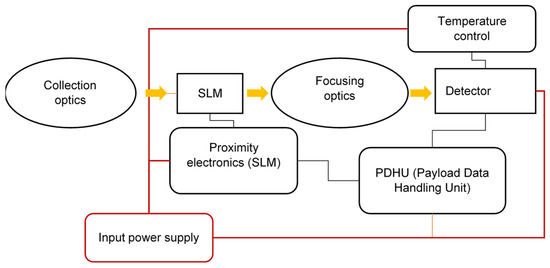
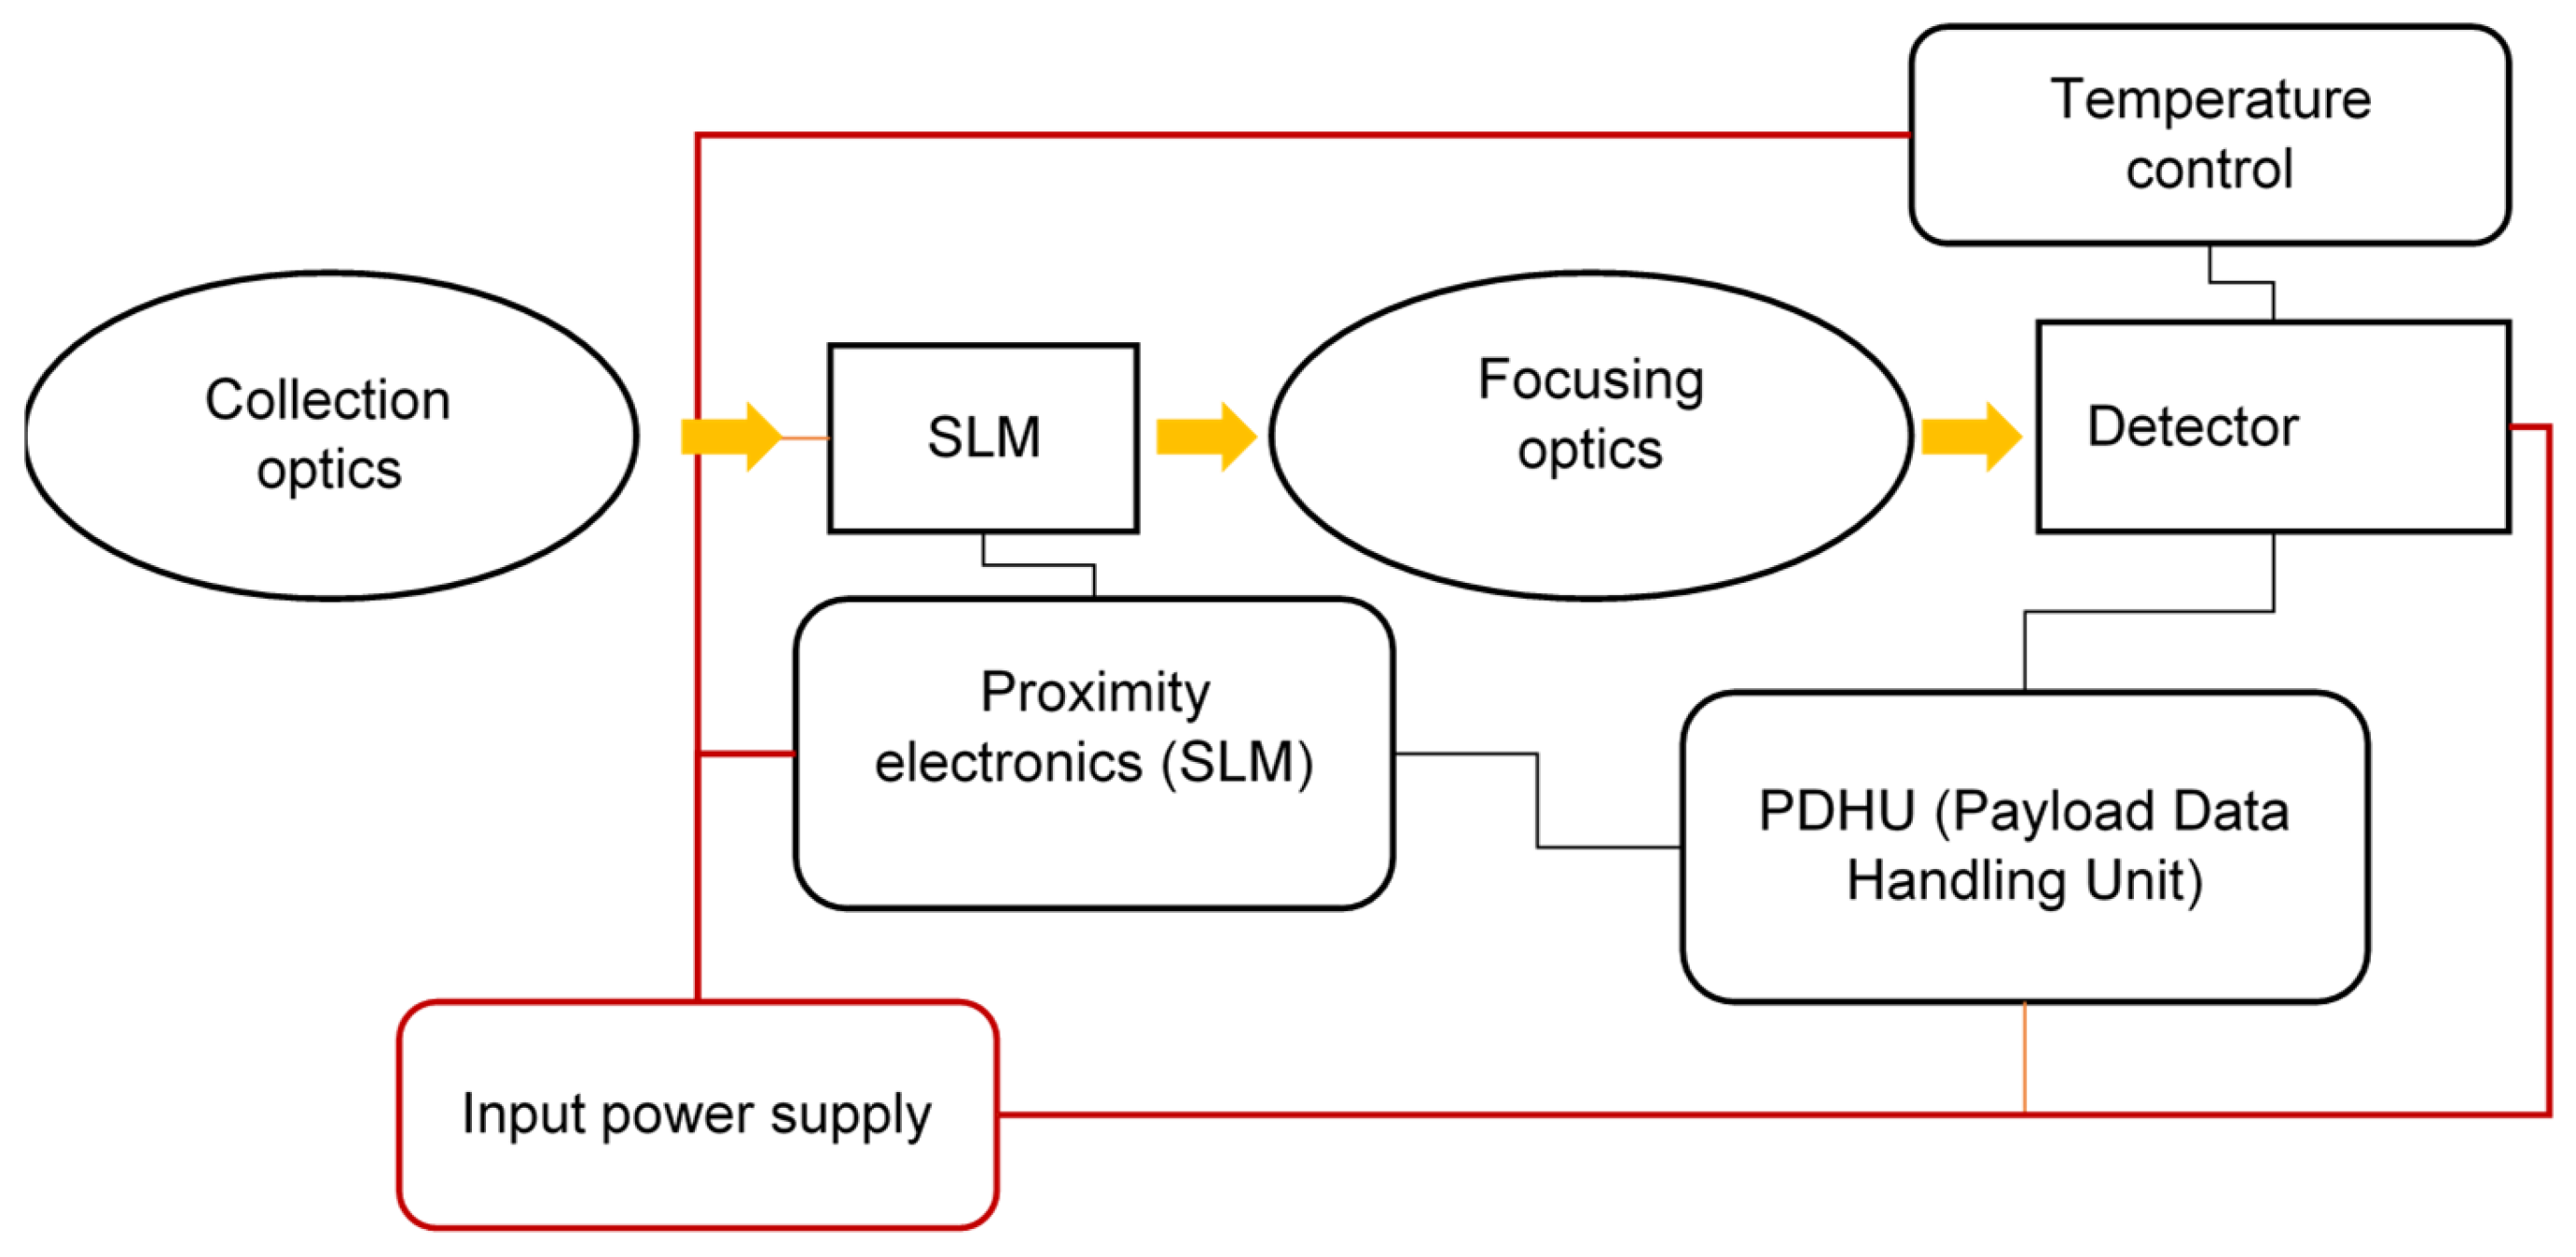
A block diagram of the SISSI instrument is provided in Figure 1. In the diagram, the red lines represent power supply connections, the black lines indicate control interfaces between hardware components, and the yellow arrows trace the optical path of the incoming light through the system.
Figure 1.
Scheme architecture of SISSI instrument: red lines represent power supply connections, black lines the control interfaces between hardware components, and the yellow arrows the light rays optical path.
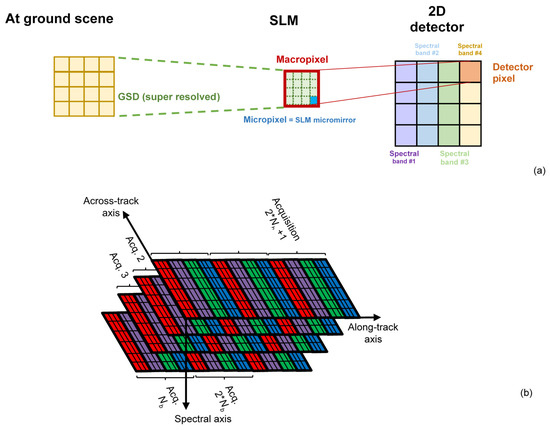
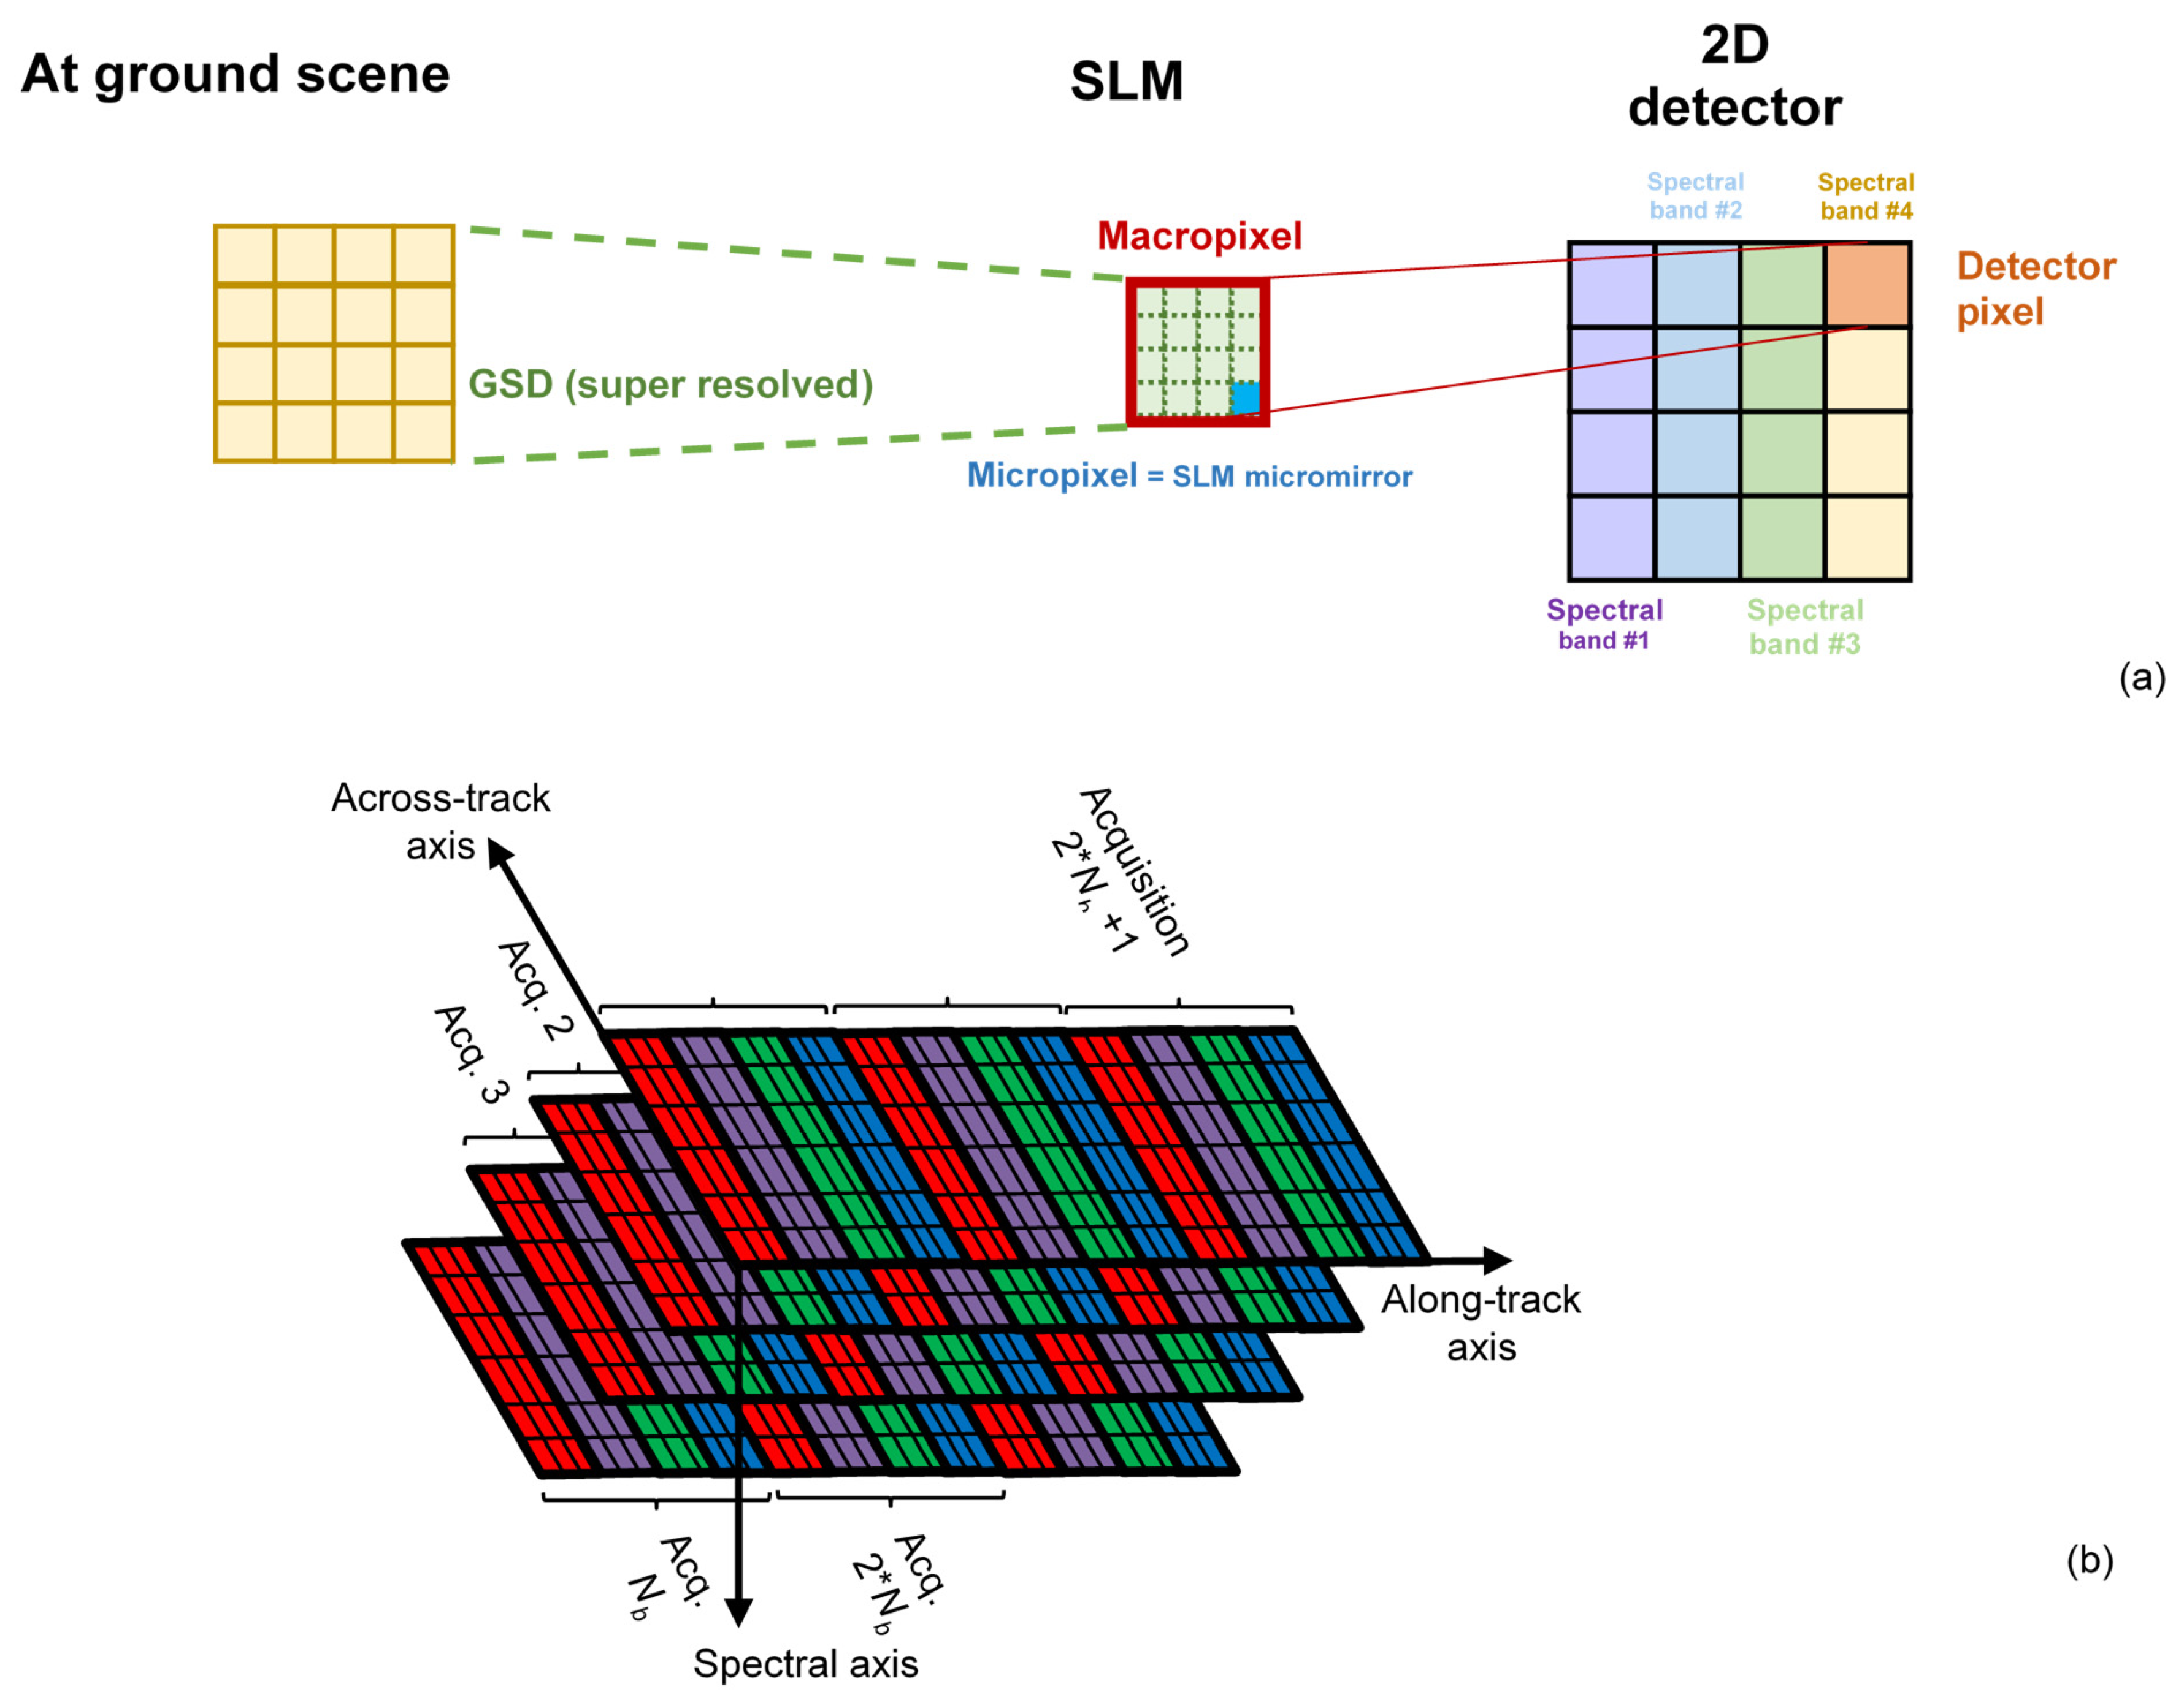
The operating principle of the SISSI instrument is inspired by the concept of the single-pixel camera [11]. However, in this implementation, the system performs parallel acquisition across multiple M × M groups of adjacent micromirrors on the SLM. Each group (macropixel) consists of N × N micromirrors (micropixels) appropriately encoded by a binary mask, different for each frame. Each of the M × M elements of the detector acquires the signal coming from one of the M × M macropixels. The generic detector element corresponds to a macropixel on the SLM that is super-resolved by N × N micropixels, each micropixel corresponding to a micromirror of the SLM. As a result, the N × N value defines the super-resolution factor of the instrument: each pixel of the detector subtends, on the ground, an area corresponding to an SLM macropixel, and each micropixel subtends, inside such area, a ground portion corresponding to the super-resolved GSD (Figure 2a).
Figure 2.
SISSI super-resolved acquisition working as parallel single-pixel cameras: (a) the macropixel corresponds to a single detector element, and is made up of N × N micropixels providing super-resolved GSD at ground. (b) Slitless push-broom acquisition by means of spectral filters on multiple contiguous rows of the detector: the apparent motion of the scene across the filters allows the reconstruction of each spectral band.
In particular, in Figure 2a, a single pixel of the detector acquires the portion of the scene corresponding to an area of the DMD consisting of 4 × 4 micromirrors. The super-resolution of the scene (resolution at the micropixel level) is achieved by acquiring a series of measurements with different spatial encodings for each macropixel which is spatially integrated by each element of the detector. The series of measurements (acquired by applying a different coding mask for each measurement at the macropixel level) is used to reconstruct—using an ad hoc algorithm—an image of the scene with a GSD equal to that of the projection on the ground of the dimensions of the single micropixel. In our case, the acquisition of multiple spatial encodings of 256 macropixels allows the reconstruction of 1024 micropixels (super-resolution factor equal to 4 × 4). A super-resolution greater than the one ensured by the detector is reached via an SLM ensuring the coding at macropixel level. An exact reconstruction of the super-resolved scene requires N × N measurements (i.e., N × N corresponding modulation masks encoded on the SLM). CS paradigm allows the reconstruction of the scene with a number of measurements lower than N × N, achieving an intrinsic data compression at acquisition time.
The acquisition of the same scene across multiple spectral bands, resulting in a hyperspectral data cube, is enabled by the integration of spectral filters directly on the detector (Figure 2b). These filters are arranged along the across-track direction of the scene, spanning multiple contiguous rows of the detector array. Due to the apparent along-track motion of the observed scene within the instrument’s field of view, the scene sequentially traverses the contiguous detector rows, enabling a slitless push-broom acquisition scheme. In this way, the spatially resolved scene (with a GSD equal to that determined by the micropixel) passes through each spectral band on the detector, allowing, row after row, the reconstruction of the spatially resolved image in each spectral band.
The main technical specifications of SISSI instrument are summarized in Table 1.
Table 1.
SISSI instrument main technical specifications.
2.2. Optical Design
As shown in Figure 1, SISSI instrument consists of four main core elements: Spatial Light Modulator (SLM), Detector, Collection optics, and Focusing optics. Each subsystem is described in the following sections.
2.2.1. Spatial Light Modulator
A key component of the SISSI payload design is the SLM, which determines the instrument’s operating principle, the optical architecture, and the sizing of the associated system components. Among the various available SLM technologies, a Digital Micromirror Device (DMD®) produced by Texas Instruments Inc. (TI) (Dallas, TX, USA) and commercially available off-the-shelf (COTS) was selected. Some DMD models from TI offer a high technological readiness level (TRL), having undergone qualification testing for space missions, including ESA’s EUCLID space mission [30]. Similarly, NASA has conducted extensive investigations and laboratory testing to raise the technological readiness level (TRL) of DMD technology for potential use in space applications [31].
None of the DMDs currently produced by TI is specifically designed to operate in the MWIR spectral region. Most available models are optimized for use in the visible (VIS), near-infrared (NIR), or short-wave infrared (SWIR) ranges, primarily due to the material used for the device’s optical window. This limitation can be addressed by replacing the standard optical window with one of appropriate material suitable for MWIR transmission [32]. However, working beyond 2.5 µm, diffractive effects become significant and could affect the DMD performances. For this reason, such effects were thoroughly analyzed during the design phase of the SISSI payload.
From a wave optics perspective, the DMD can be modeled as a two-dimensional blazed diffraction grating [33]. Each micromirror acts as a reflective element with a fixed tilt angle, and the periodic arrangement of mirrors introduces a spatial phase modulation that governs the diffraction behavior of the device. The blaze condition, which maximizes diffraction efficiency into a specific order, is satisfied when the deflection angle and mirror pitch are tuned such that the blaze wavelength fulfills the relation:
where is the grid constant and is the mirror tilt angle. The grid constant g is equal to for diagonal tilting DMDs, where p is the micromirrors pitch.
At wavelengths shorter than , diffraction efficiency remains relatively high due to constructive interference in the first diffraction order. However, for wavelengths exceeding , efficiency decreases primarily because the zeroth-order diffraction begins to dominate. This is not only due to the angular dispersion of the higher orders, but also to the increasing amount of the zeroth-order component reflected towards the collection optics. This captures a larger proportion of the reflected light that is no longer modulated by the mirrors. This phenomenon leads to a reduced contrast between ON and OFF states, thereby degrading the modulation depth and the overall system performance.
To quantify these effects, Fourier optics simulations were performed, evaluating the diffraction efficiency as a function of wavelength for various micromirror pitches. Crucially, these simulations accounted for the fact that the incident light on the DMD is not collimated but focused by the collection optics. As such, the spatial distribution of the incoming wavefront must be modeled using the Point Spread Function (PSF) of the optical system, which, for a circular aperture, follows the Airy disk profile. The Airy disk defines the spatial extent of the focused light on the DMD surface and depends on both the wavelength and the F-number of the collection optics. Its diameter, given by , determines how many micromirrors are illuminated by a single point in the scene. This has a direct impact on the diffraction behavior of the system, as the effective modulation introduced by the micromirror tilt is convolved with the spatial intensity distribution of the PSF.
Neglecting this aspect would lead to an inaccurate estimation of the diffraction efficiency, especially in the MWIR range where the Airy disk can span multiple micromirrors. Therefore, the simulations incorporated the full wavefront modulation, including the phase profile induced by the micromirror tilt and the amplitude distribution of the Airy disk, followed by a Fourier transform to evaluate the resulting diffraction pattern.
In Table 2, the wavelength of the first diffraction order for different available pitches are reported.
Table 2.
Wavelength of the first diffraction order (λm=1) for different available pitches.
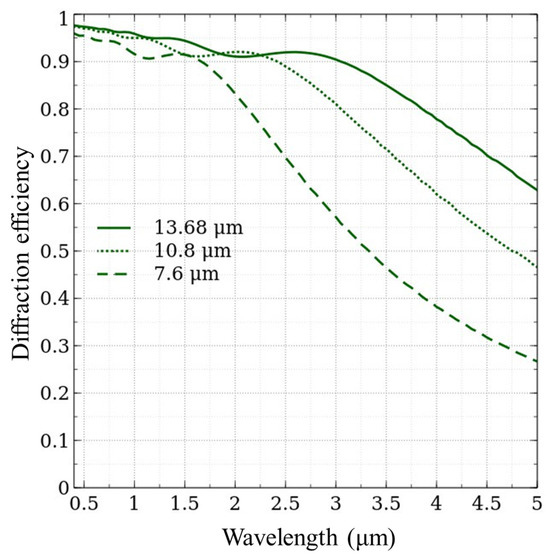
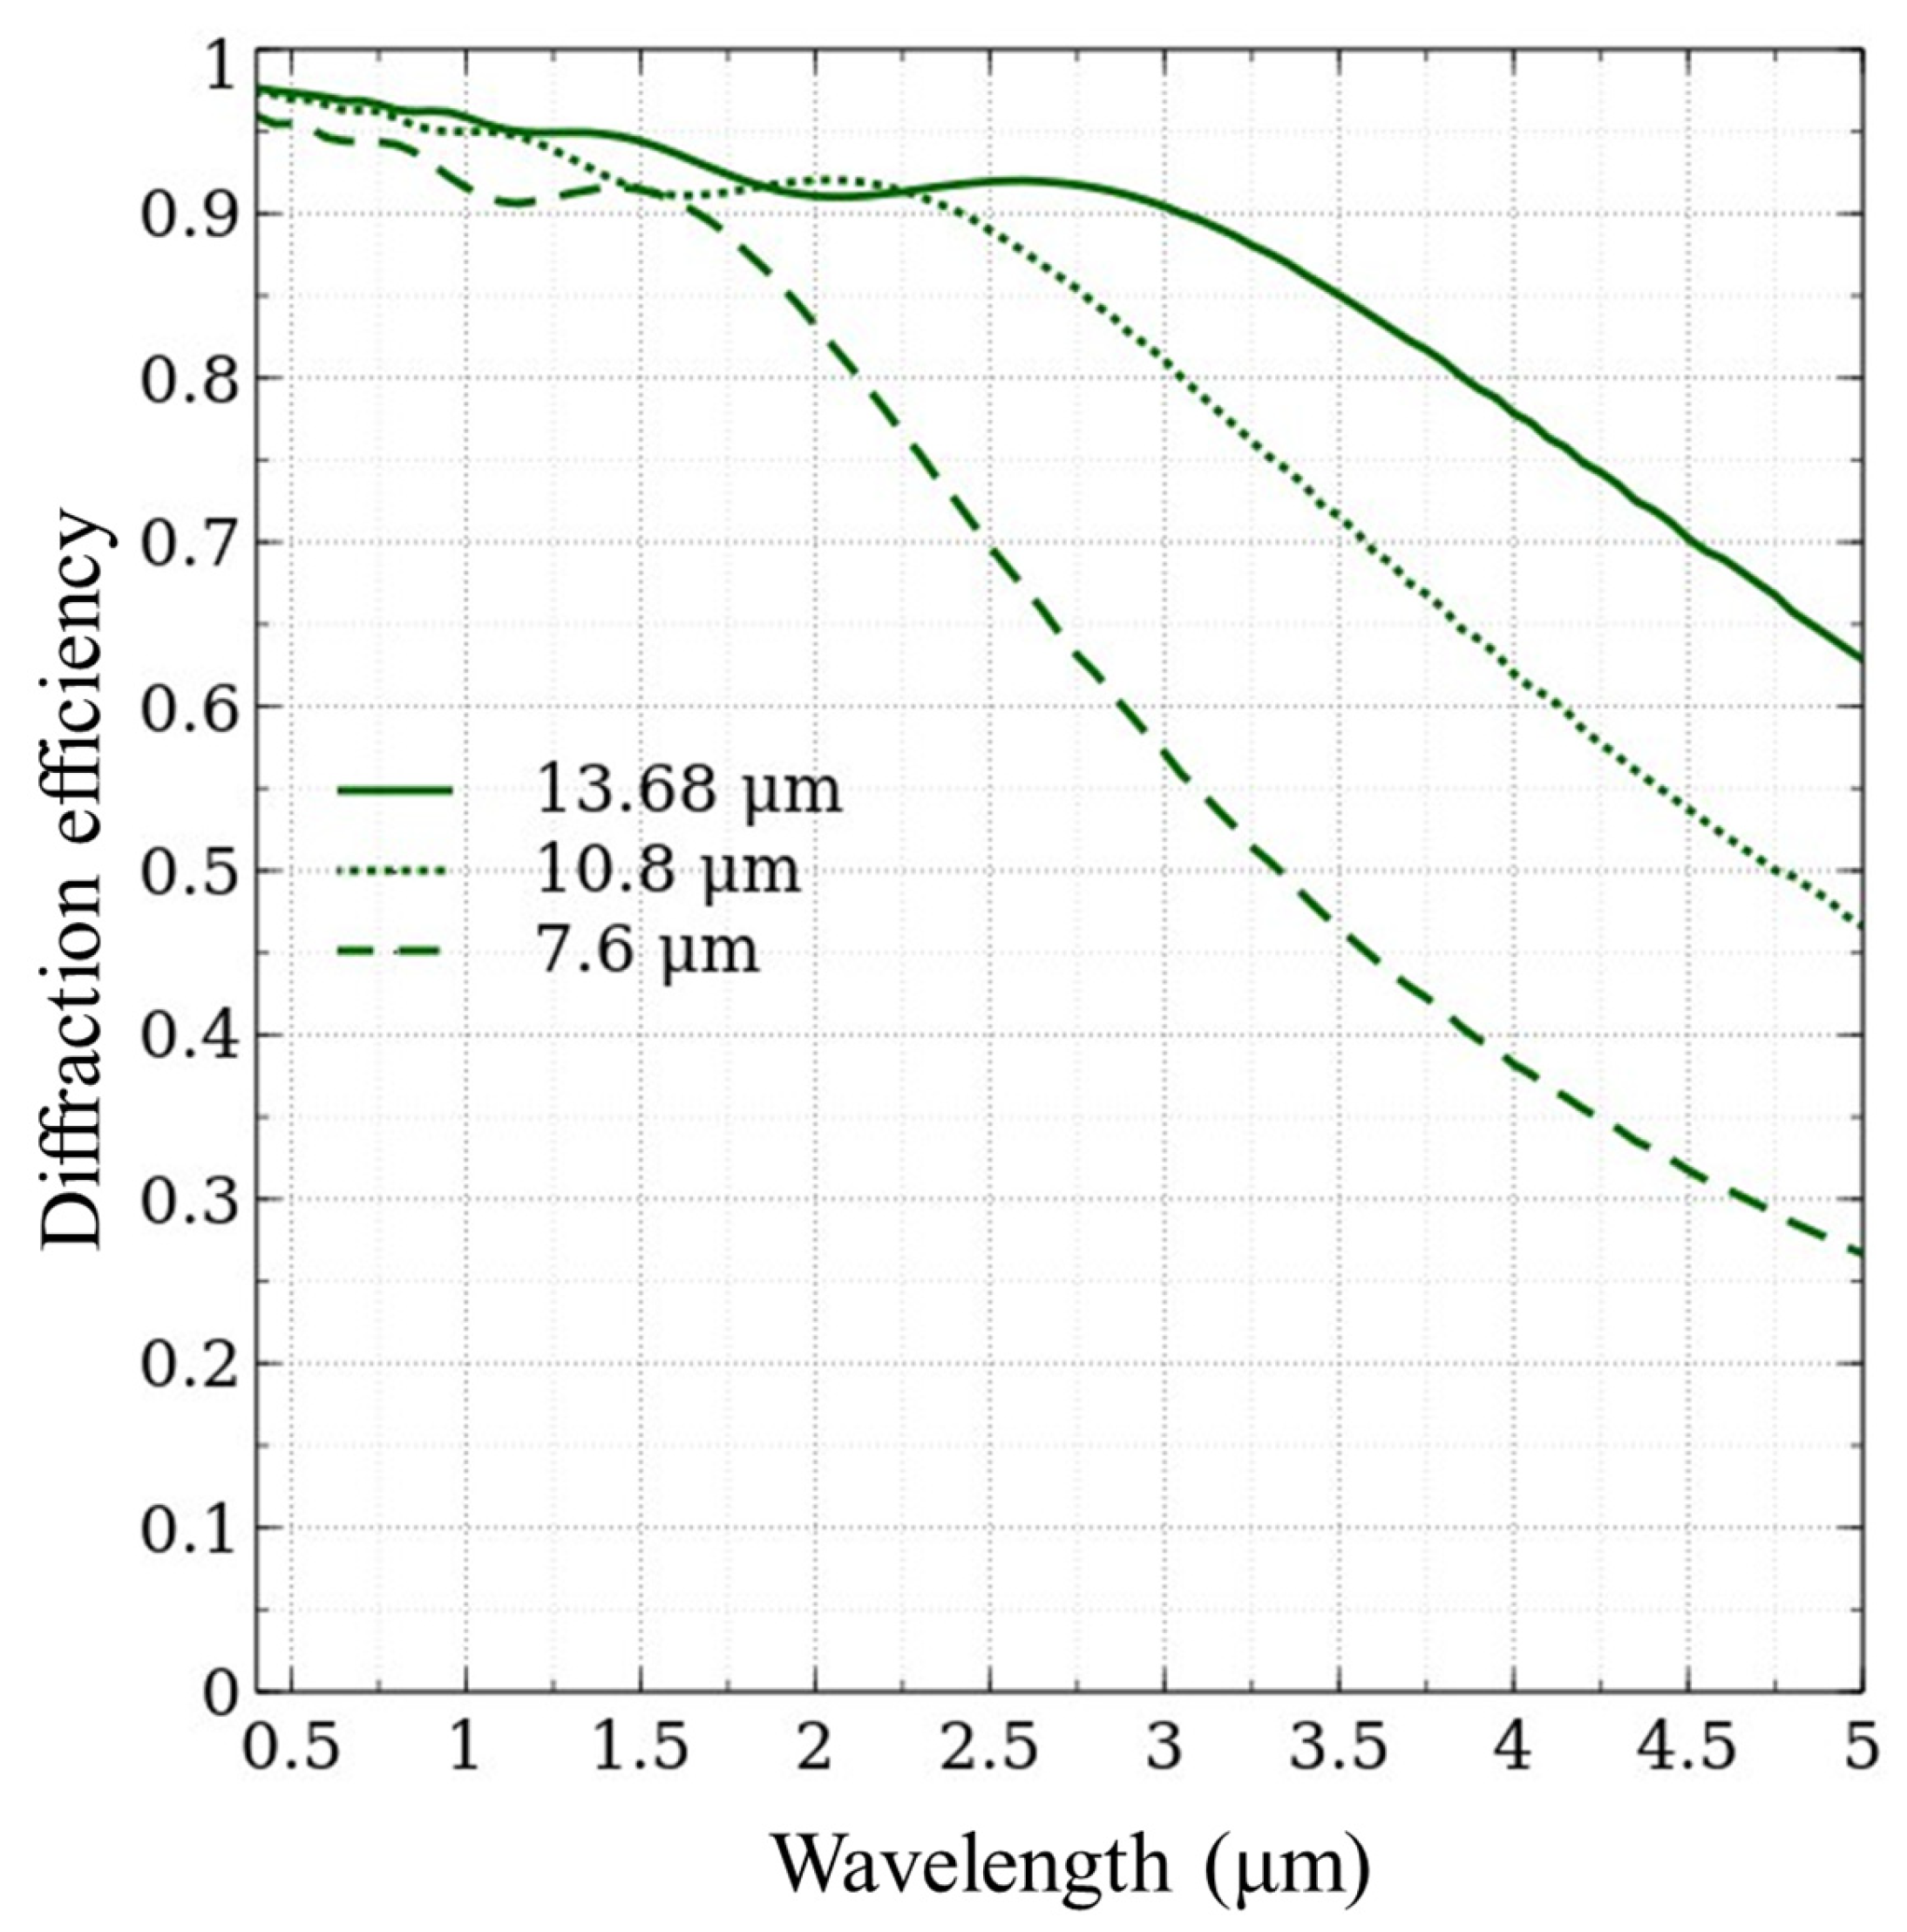
The diffraction efficiency as a function of wavelength has been evaluated for 3 different pitch values, considering each micropixel equal to a single micromirror. both for collecting and focusing optics was set to 2.35. Figure 3 shows the outcomes of the simulations.
Figure 3.
Diffraction efficiency as a function of wavelength for different values of the micromirror pitch. The pitch of DMD model DLP7000 ensures larger efficiency.
On the basis of the obtained results, the DMD model DLP7000 with a pitch of 13.68 µm acting as a micropixel allows us to obtain the best performances as far as the diffractive efficiency of the system is concerned.
2.2.2. Detector
Another relevant component of SISSI architecture is the MWIR detector. For SISSI instrument, the MARS MW detector, produced by Lynred/SOFRADIR EC (Fairfield, IA, USA), was selected because it was already space-qualified [34]. MARS is a two-dimensional array characterized by the spectral range of operation in the MWIR, a NEDT of the order of 13 mK and a number of detector pixels that can match with the desired super-resolution factor and SLM dimensions. Above all it offers the advantage of having a high TRL for aerospace applications. The main characteristics of MARS detector and DMD model are reported in the following Table 3.
Table 3.
Main technical characteristics of the selected DMD and detector.
2.2.3. Collection Optics
The collection optics has to be dimensioned on the basis of DMD characteristics, in particular, the focal length depends on the dimensions of the ground micropixel, dimensions of the DMD micromirrors, and altitude of the platform. Taking into account the nominal values of these parameters (Table 1), the focal length of the collection optics has been set to 638.4 mm. Given the focal length of the collection optics, the optimal value for the focal ratio is obtained by minimizing the Airy disk at the wavelengths of interest. The fact that the DMD has micromirrors with their own tilt angle means that, depending on the of the collection optics, the reflected ray beam can overlap with the incident beam that focuses the image on the DMD plane. Because a low at fixel focal length implies a larger beam diameter, imposing a lower limit on prevents the incident beam and the DMD-reflected beam from overlapping. Overlapping is also avoided by limiting the extension of the optical system’s back focal length. Based on the aforementioned considerations—including the required field of view (FOV) and the need for an entrance aperture large enough to ensure a sufficient signal-to-noise ratio—the collection optics was designed with an entrance pupil diameter of 200 mm. This configuration results in an F-number () of 3.192. The collecting optics designed for the SISSI instrument is a modified Schmidt–Cassegrain telescope consisting of a parabolic primary mirror, an elliptical (oblate) secondary mirror, a corrector optical system having one aspherical lens in ZnSe (for chromatic correction) and three aspherical lenses in CaF2. The Cassegrain configuration is used to have an image plane with low distortion on the DMD. Table 4 shows the parameter used for the design of the collecting optics.
Table 4.
Input Parameter used for the design of the collecting optics.
2.2.4. Focusing Optics
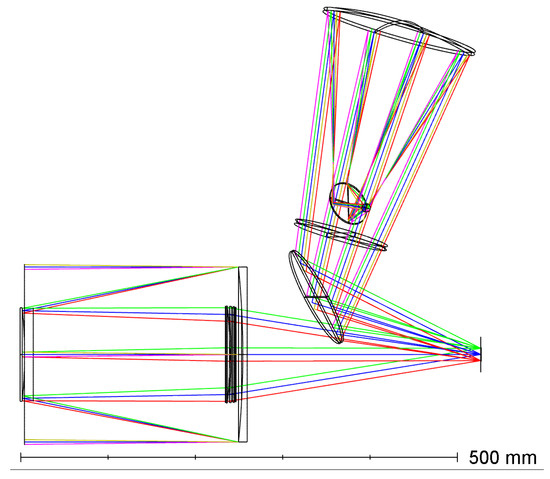
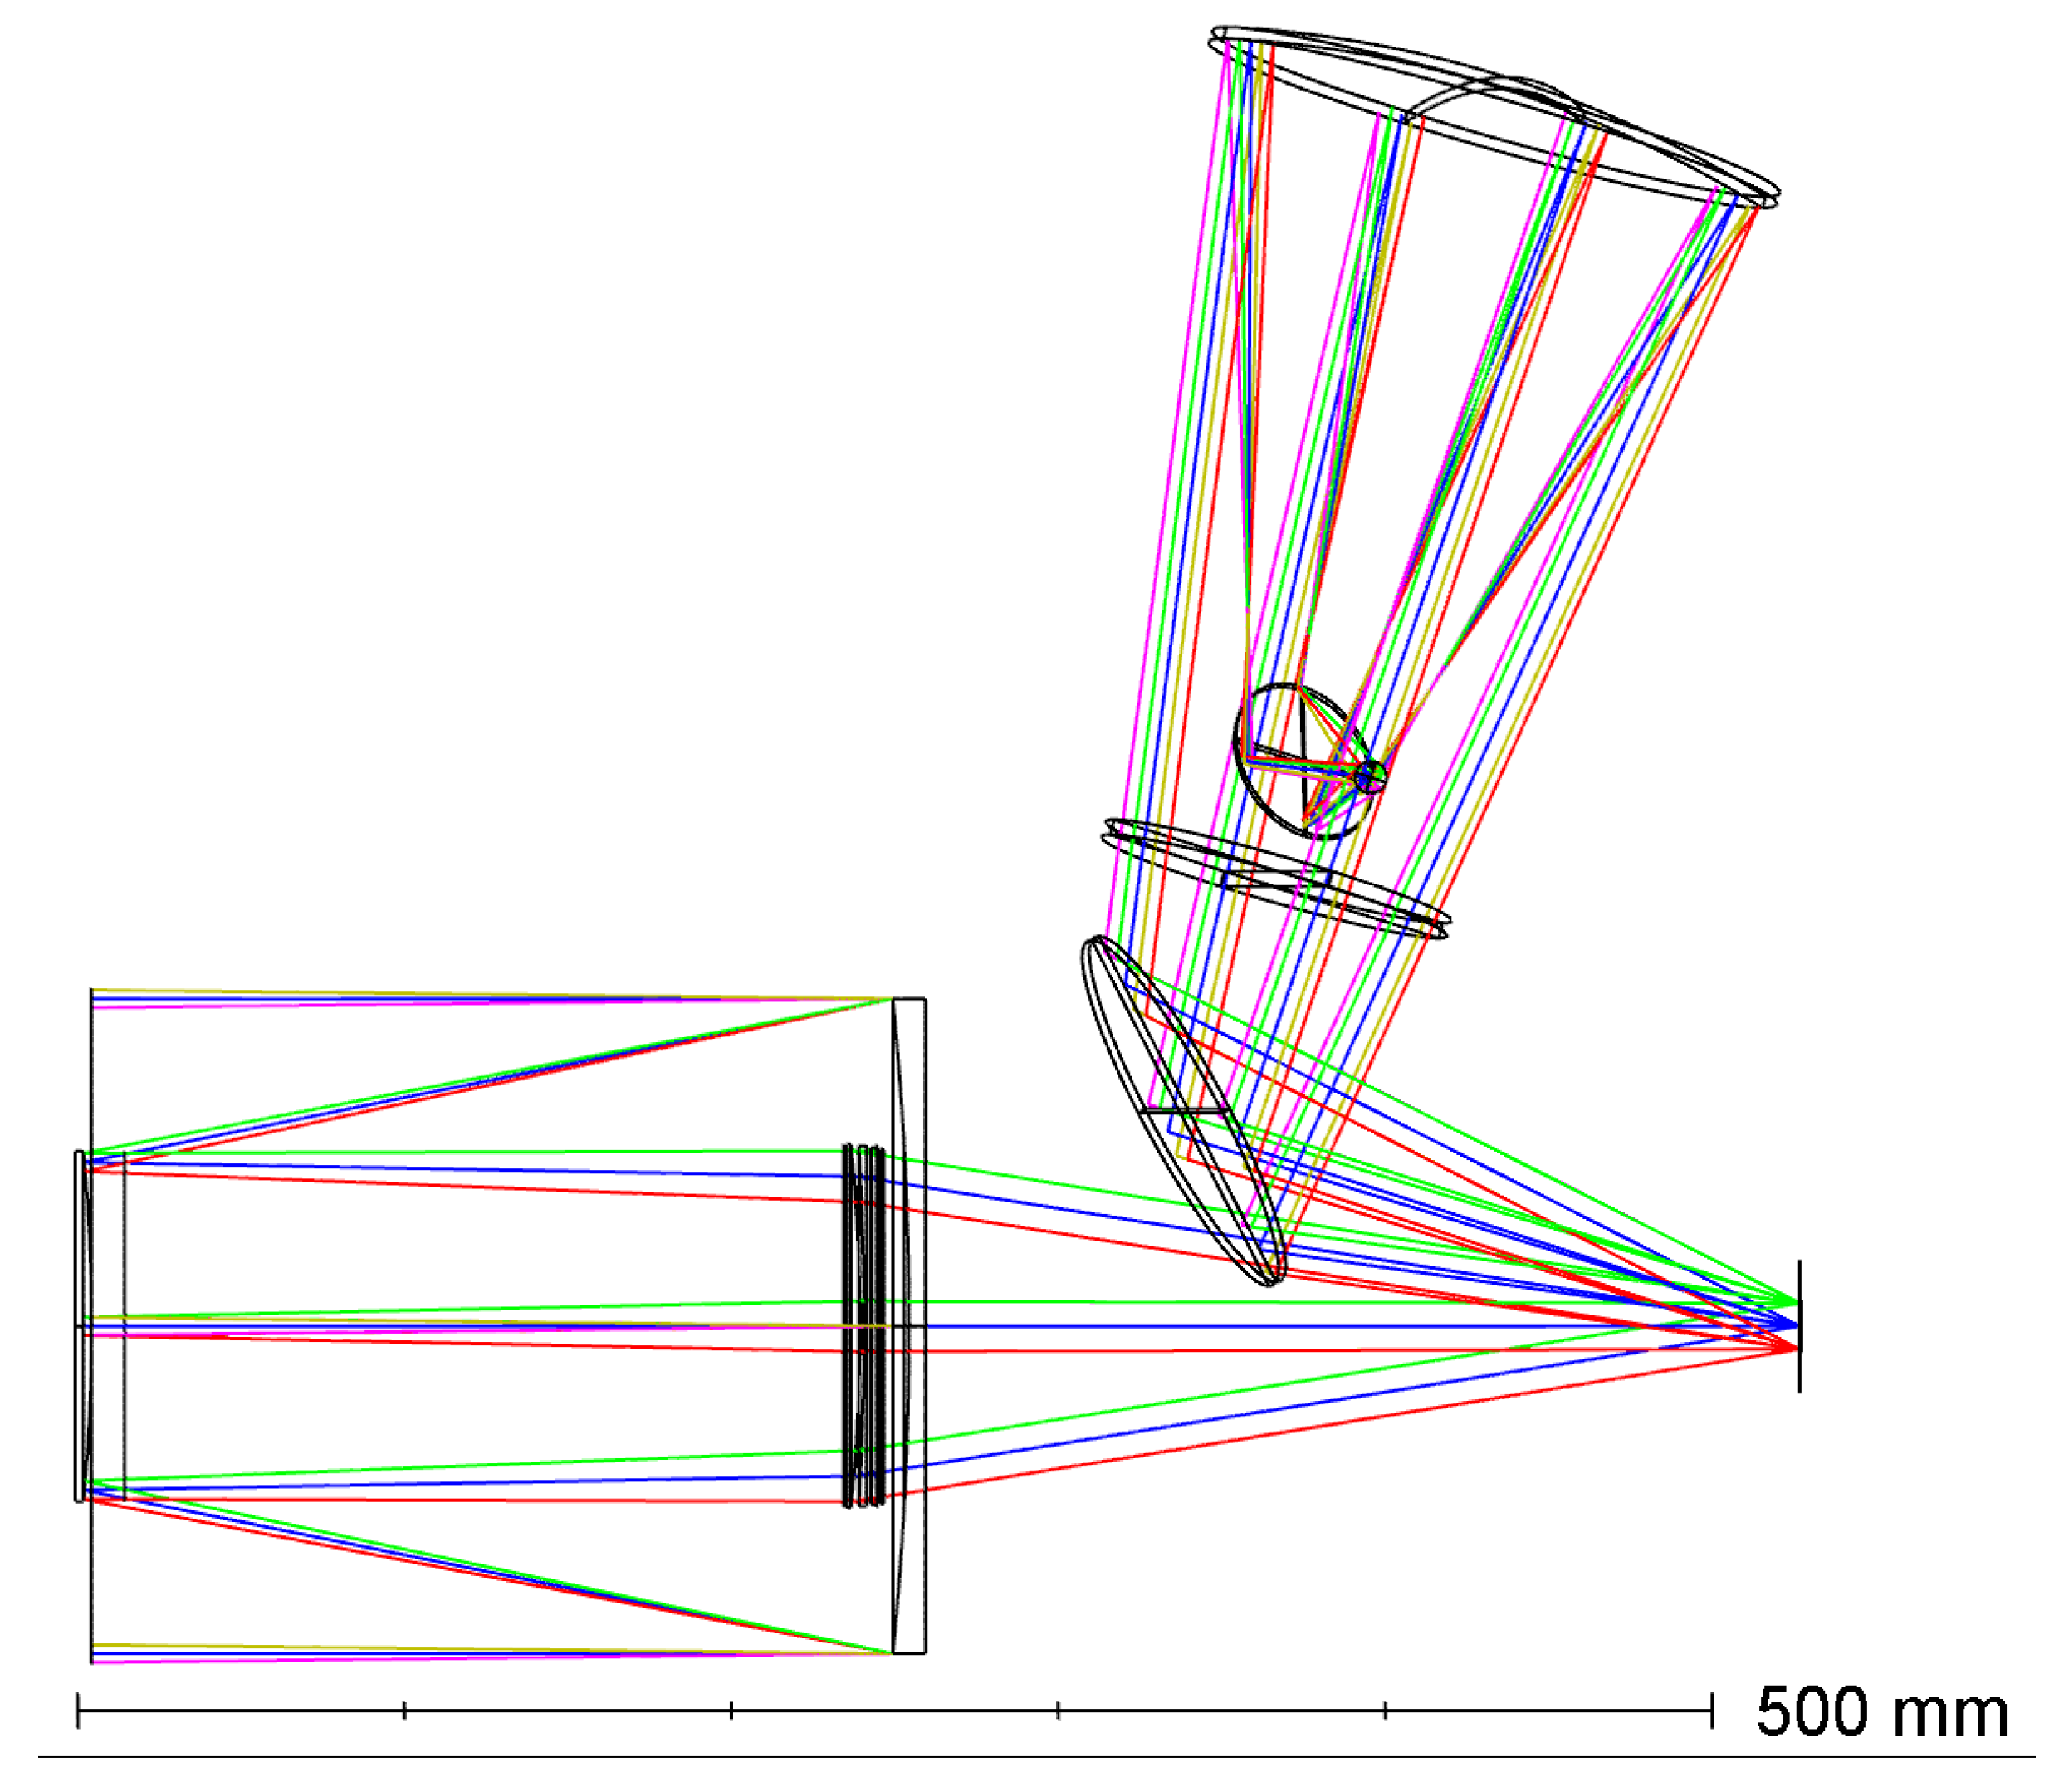
The focusing optics is designed to collect the signal reflected by each of the 4 × 4 micromirror groups on the DMD, directing it onto the corresponding detector elements. In this configuration, the DMD plane serves as the object plane for the focusing optics. The magnification ratio is defined by the ratio between the size of a 4-micromirror group and the size of an individual detector pixel. This parameter, along with the distance between the focusing optics and the DMD, determines the required focal length. Additionally, the magnification ratio and the of the collecting optics define the necessary aperture size of the focusing optics. To ensure that a 60 m side macropixel on the ground is imaged onto a single detector pixel, the focusing optics must be sized such that the optical system must achieve an effective F/# of 1.750. Furthermore, the design of the focusing optics must also comply with spatial constraints imposed by the DMD operating in reflection. To accommodate spatial constraints and prevent interference between optical components, a first folding mirror is introduced to avoid collisions between the focusing optics and the primary mirror of the acquisition optics. A second folding mirror is employed to extract the image plane from the reflection cone of the collimator’s focusing mirror. On the basis of the aforementioned considerations, the focusing optics is formed by the following elements: a folding mirror to redirect the beams reflected by the DMD and prevent obstruction by the primary mirror; a free-form correction plate made of CaF2, shaped using a cubic spline profile; an aspherical mirror; and an additional folding mirror.
It is important to note that the image plane is tilted with respect to the optical axis as a result of the Scheimpflug principle. Since the DMD operates in reflection, the object plane (i.e., the image reflected by the DMD) is inherently tilted relative to the optical axis, which in turn causes the image plane to be tilted accordingly (Scheimpflug principle). The optical CAD model of the focusing optics is shown in Figure 4.
Figure 4.
Optical CAD of the focusing optic.
2.2.5. Overall Optical System
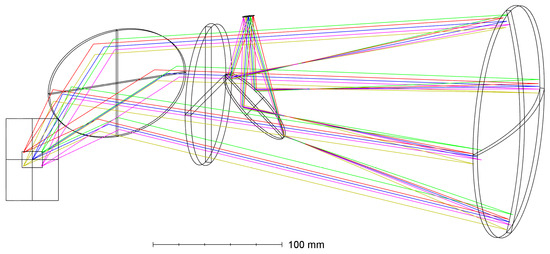
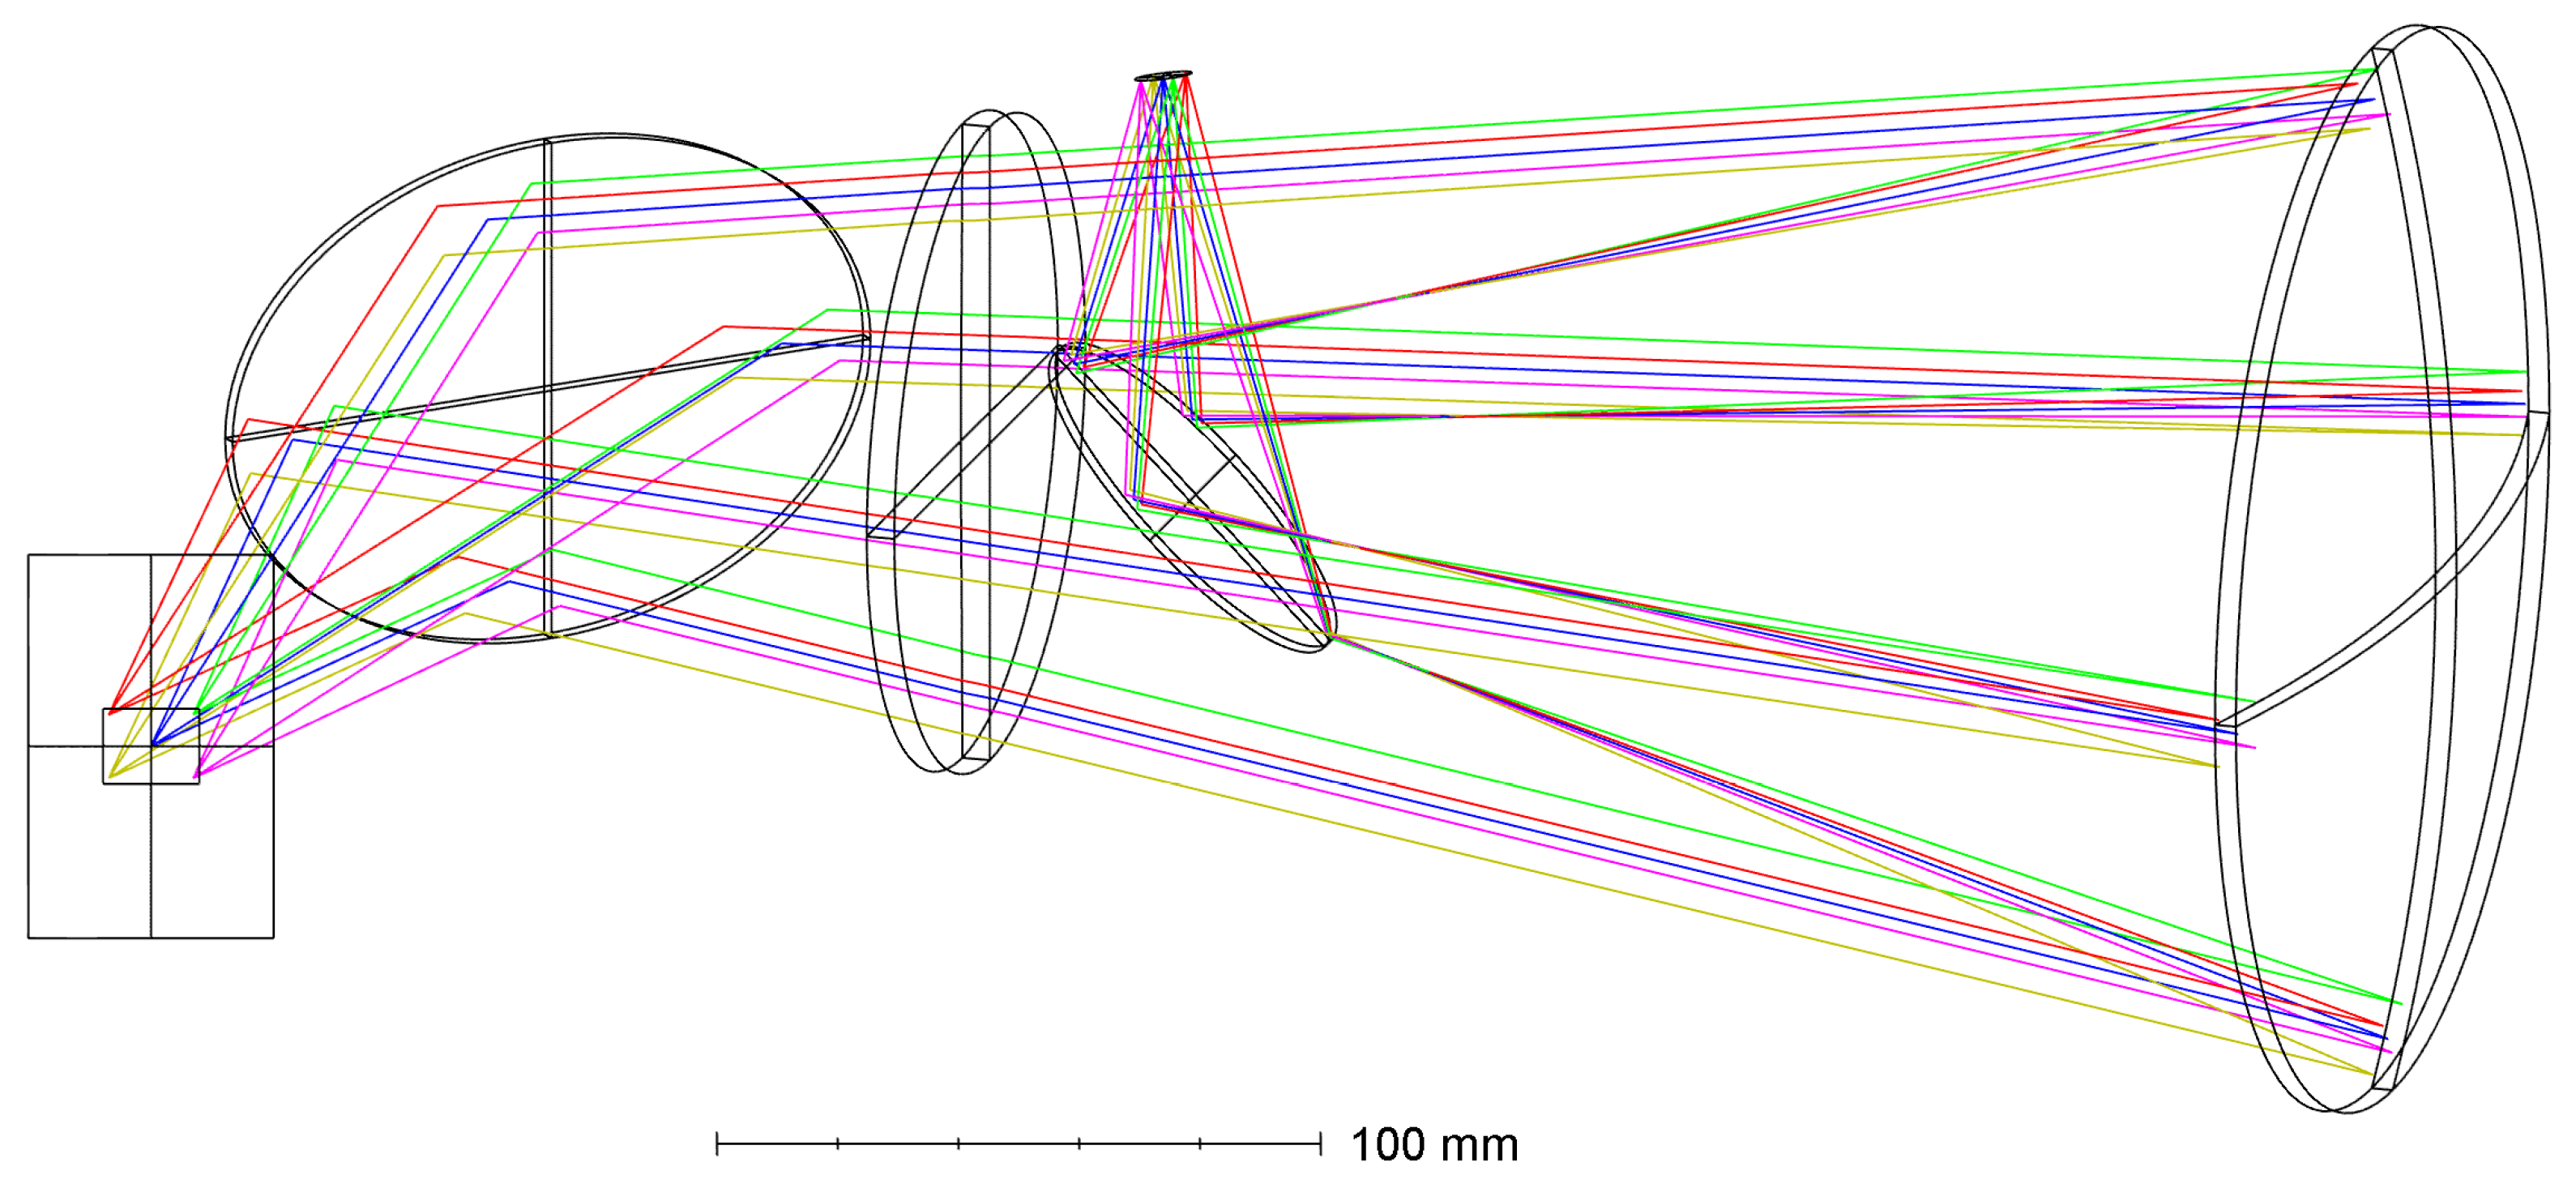
The overall 3D scheme for SISSI instrument is shown in Figure 5. It is important to highlight the non-planar nature of the optical design, which arises from the 45° azimuthal reflection angle introduced by the DMD. Specifically, the DMD reflects incoming light at an angle of 24°, with an additional 45° tilt along the diagonal, resulting in an azimuthal deflection that causes the reflected rays to diverge from the incident optical axis. To manage this geometry, two folding mirrors are employed: the first prevents the rays reflected by the DMD from colliding with the primary mirror of the acquisition optics, while the second redirects the focused rays to avoid interference with the CaF2 correction plate.
Figure 5.
3D schemes of the optical CAD for SISSI instrument.
In both the collection and focusing optics, the use of reflective optical elements is prioritized to minimize chromatic aberrations and simultaneously maximize the overall transmittance of the optical system.
2.3. Top of Atmosphere Signal Simulations
Simulating the data acquired by a new instrument such as SISSI plays a crucial role in refining its final design, evaluating sensor performance, and testing CS algorithms. To simulate the images captured by the SISSI instrument, high-quality ground-truth images are required, having spatial and spectral resolutions higher than the simulated images. Furthermore, these ground images must be representative of significant scenarios with regard to the possible future applications of the instrument.
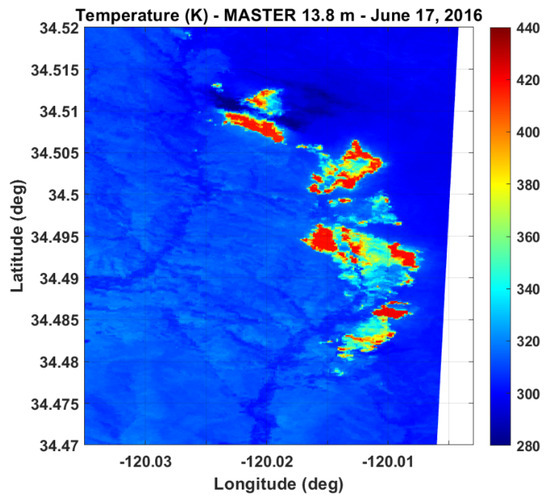
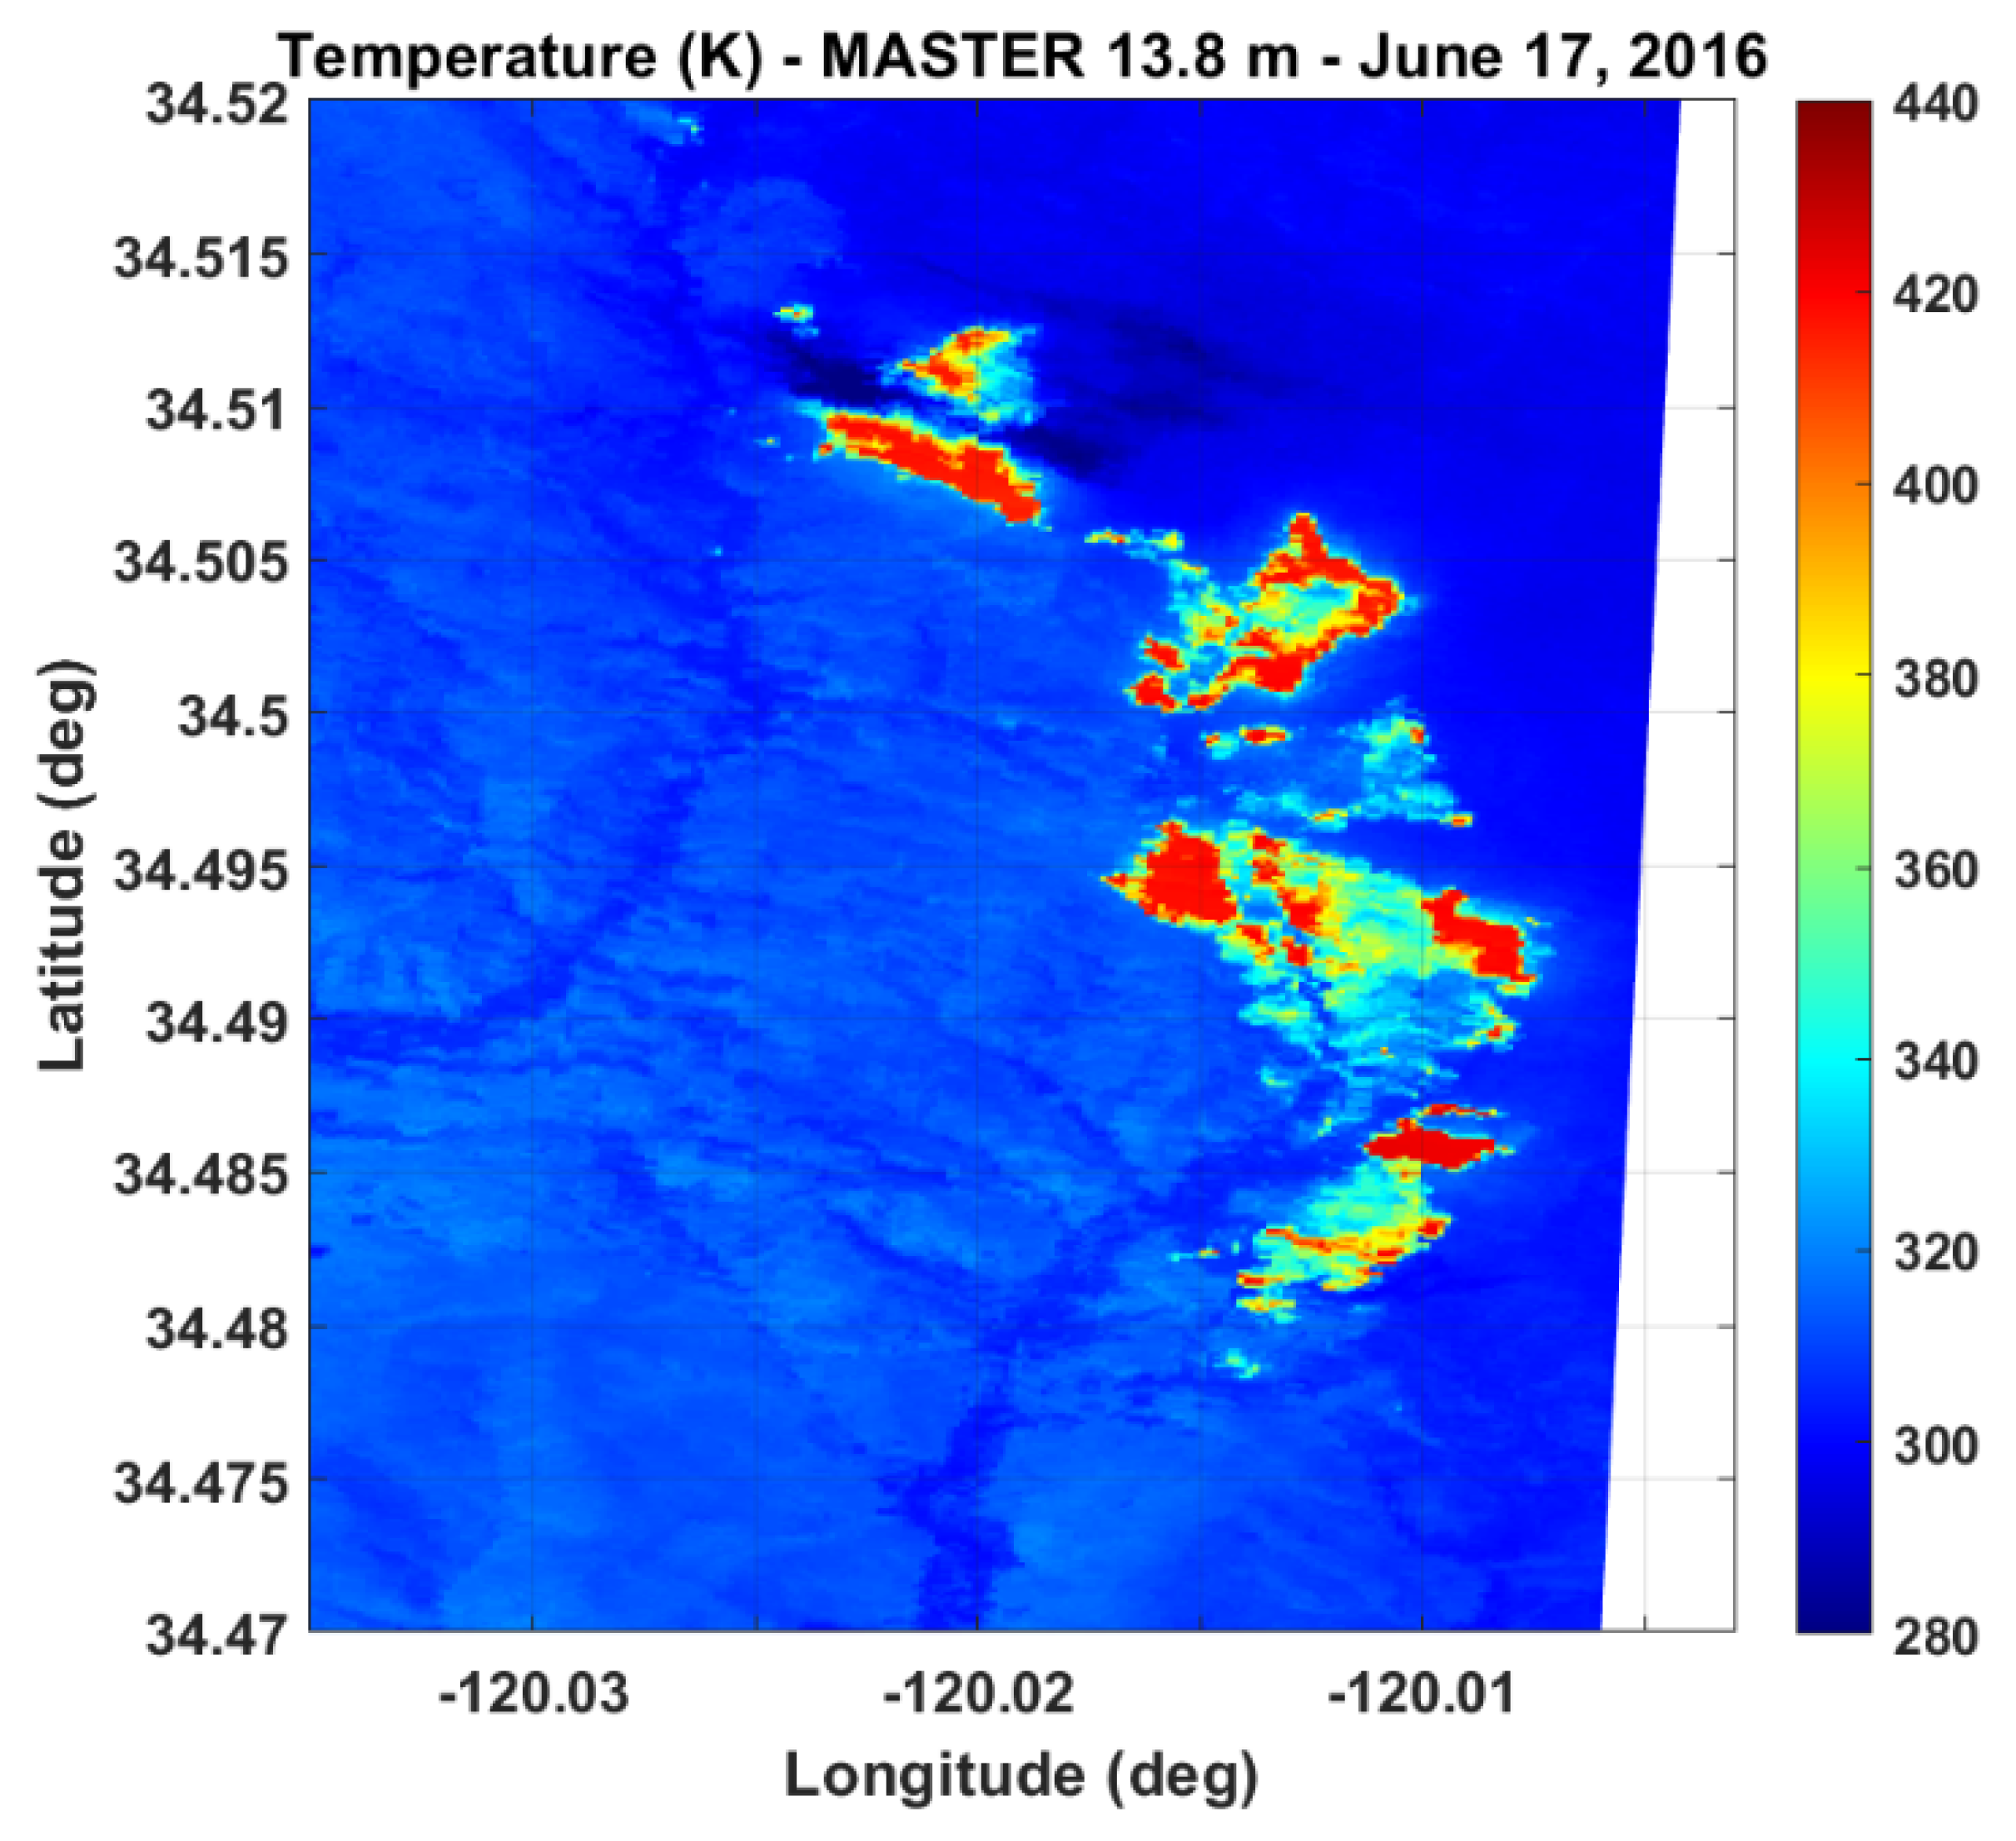
The SISSI instrument was designed targeting specific applications like HTEs. For this reason, some remote sensed data was used to characterize and define HTE case study scenarios to be used to simulate the TOA signal employed to characterize the ability of the SISSI instrument to detect HTEs. In particular, the acquisition performed by the airborne sensor MASTER [35] over a wildfire in California (USA) on the 17 June 2016 with a GSD of 14 m was selected for the evaluation of SISSI performances. For this acquisition the at-sensor radiance image (14 spectral bands in the MWIR) and the temperature map (Figure 6) were downloaded by MASTER server.
Figure 6.
Temperature map for the wildfire in California (USA): MASTER 17 June 2016.
2.4. Simulations of Instrumental Effects
In order to simulate at-sensor radiance image of SISSI instrument, the image simulator developed by CNR-IFAC [36] was used. The general procedure requires both the generation of a spectral reflectance image at ground level (scene simulator block) and the simulation of at-sensor radiance image using the MODTRAN radiative transfer model (propagation in the atmosphere) as initial steps. In particular, MODTRAN simulation takes into account the atmospheric contribution, the illumination geometry and the surface temperature. Finally, the simulation procedure applies various instrumental effects, including optics-induced MTF, photon-to-electron conversion, and different noise sources (Instrumental Effects Block).
For the simulation of the images acquired by SISSI instrument, the data acquired by the MASTER sensor were used as starting images of the simulation process. Consequently, neither the scene simulator block nor the propagation in the atmosphere via MODTRAN was used, since the MASTER data are released as L1 data, i.e., at-sensor radiance images. Only the step of the procedure involving the application of the instrument’s spatial and spectral transfer functions to the at-sensor radiance images was used. These functions take into account the characteristics of the optical system (e.g., the spatial and spectral MTF values, the FWHM values for each spectral channel) of the DMD with particular reference to its reflectivity, of the characteristics of the detector and of the noise contributions due to the electronics related to it. For the simulation of the optical system, the transfer functions extracted from the ZEMAX optical CAD were used for the spatial transfer functions. Simulated data took also into account the effects of SISSI acquisition mode, i.e., in particular, the effects of CS coding.
2.5. Dataset Simulation
Images acquired by the MASTER airborne sensor in the spectral range (3.27–5.26 µm) were used as input data for the simulation procedure. MASTER acquires multispectral images composed of 14 bands with FWHM ≈ 150 nm and spatial resolution of 13.6 m. Currently, the MASTER sensor provides the only available real multiband dataset with relatively high spatial resolution in the MWIR spectral range, but the FWHM and spatial resolution of the MASTER sensor do not allow us to directly apply the instrumental transfer functions of the SISSI payload: they would require input data with spatial and spectral resolutions at least three times higher.
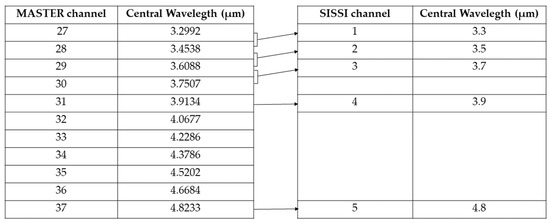
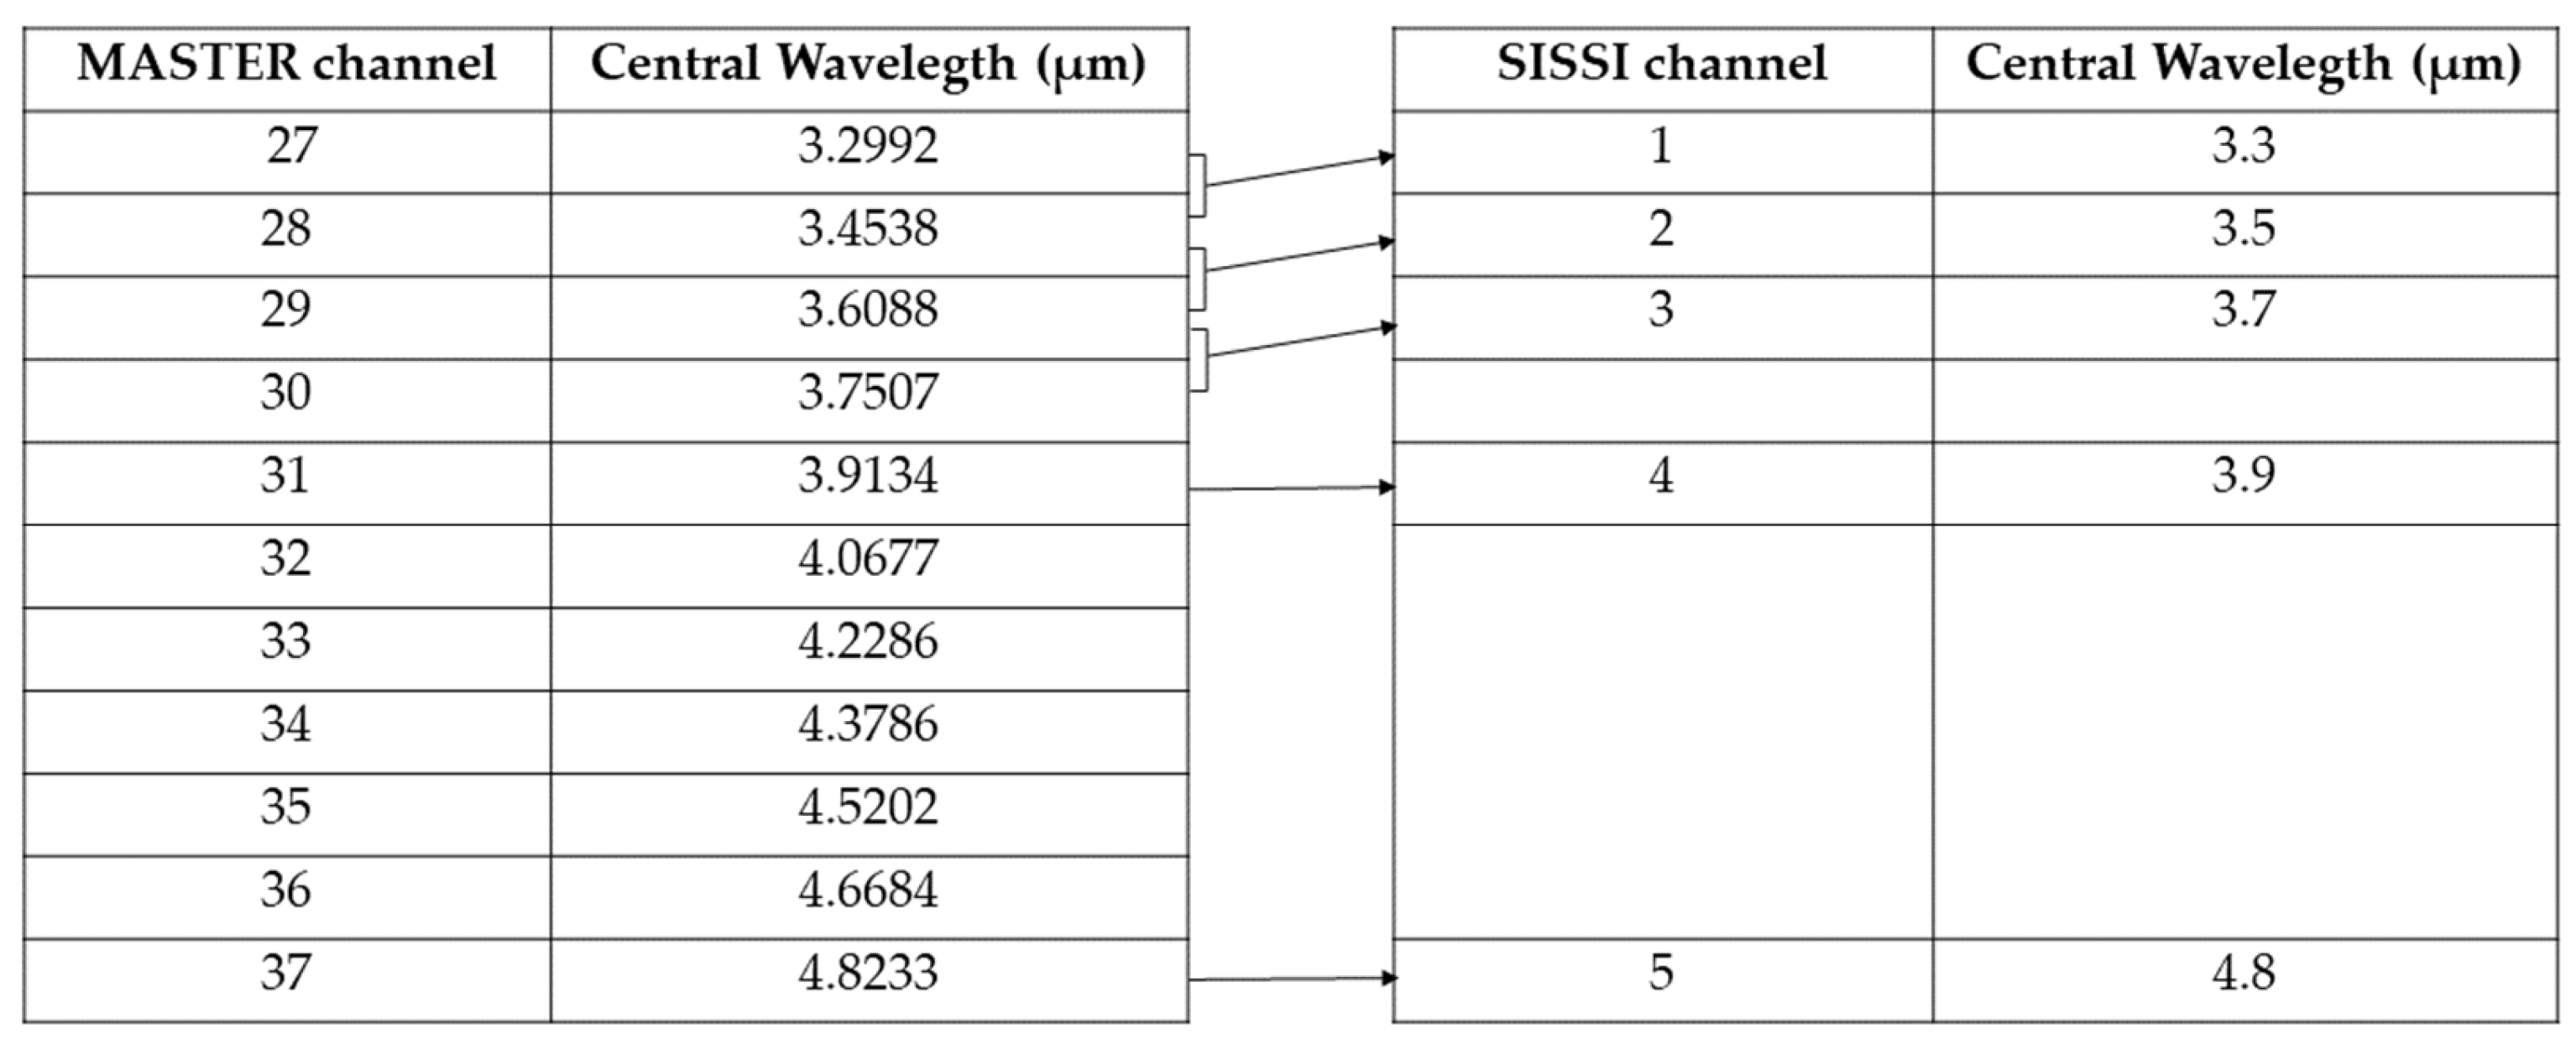
MASTER data were spatially interpolated using the nearest-neighbor method, and spectrally interpolated via bilinear interpolation on the basis of the expected band centers of the SISSI payload. Interpolation increases data correlation and, as a consequence, data reconstruction algorithm can give better results with respect to real data. For this reason, the reconstruction algorithm performance was evaluated mostly on the original MASTER data, and only on one simulated dataset. The simulated SISSI dataset is needed both for evaluating the optics MTF performance and the reconstruction performance on SISSI-like frames. Figure 7 lists the spectral band centers of the MASTER data and outlines the derivation of the corresponding spectral bands for the SISSI simulated dataset.
Figure 7.
Relationship between the central wavelengths of the MASTER sensor channel and of the SISSI sensor channel. MASTER data were spatially interpolated using the nearest-neighbor method, and spectrally interpolated via bilinear interpolation based on the SISSI band central wavelength.
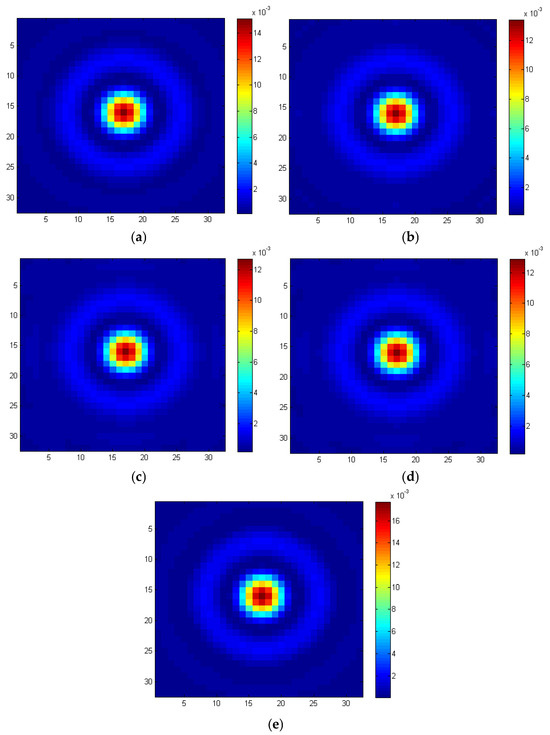
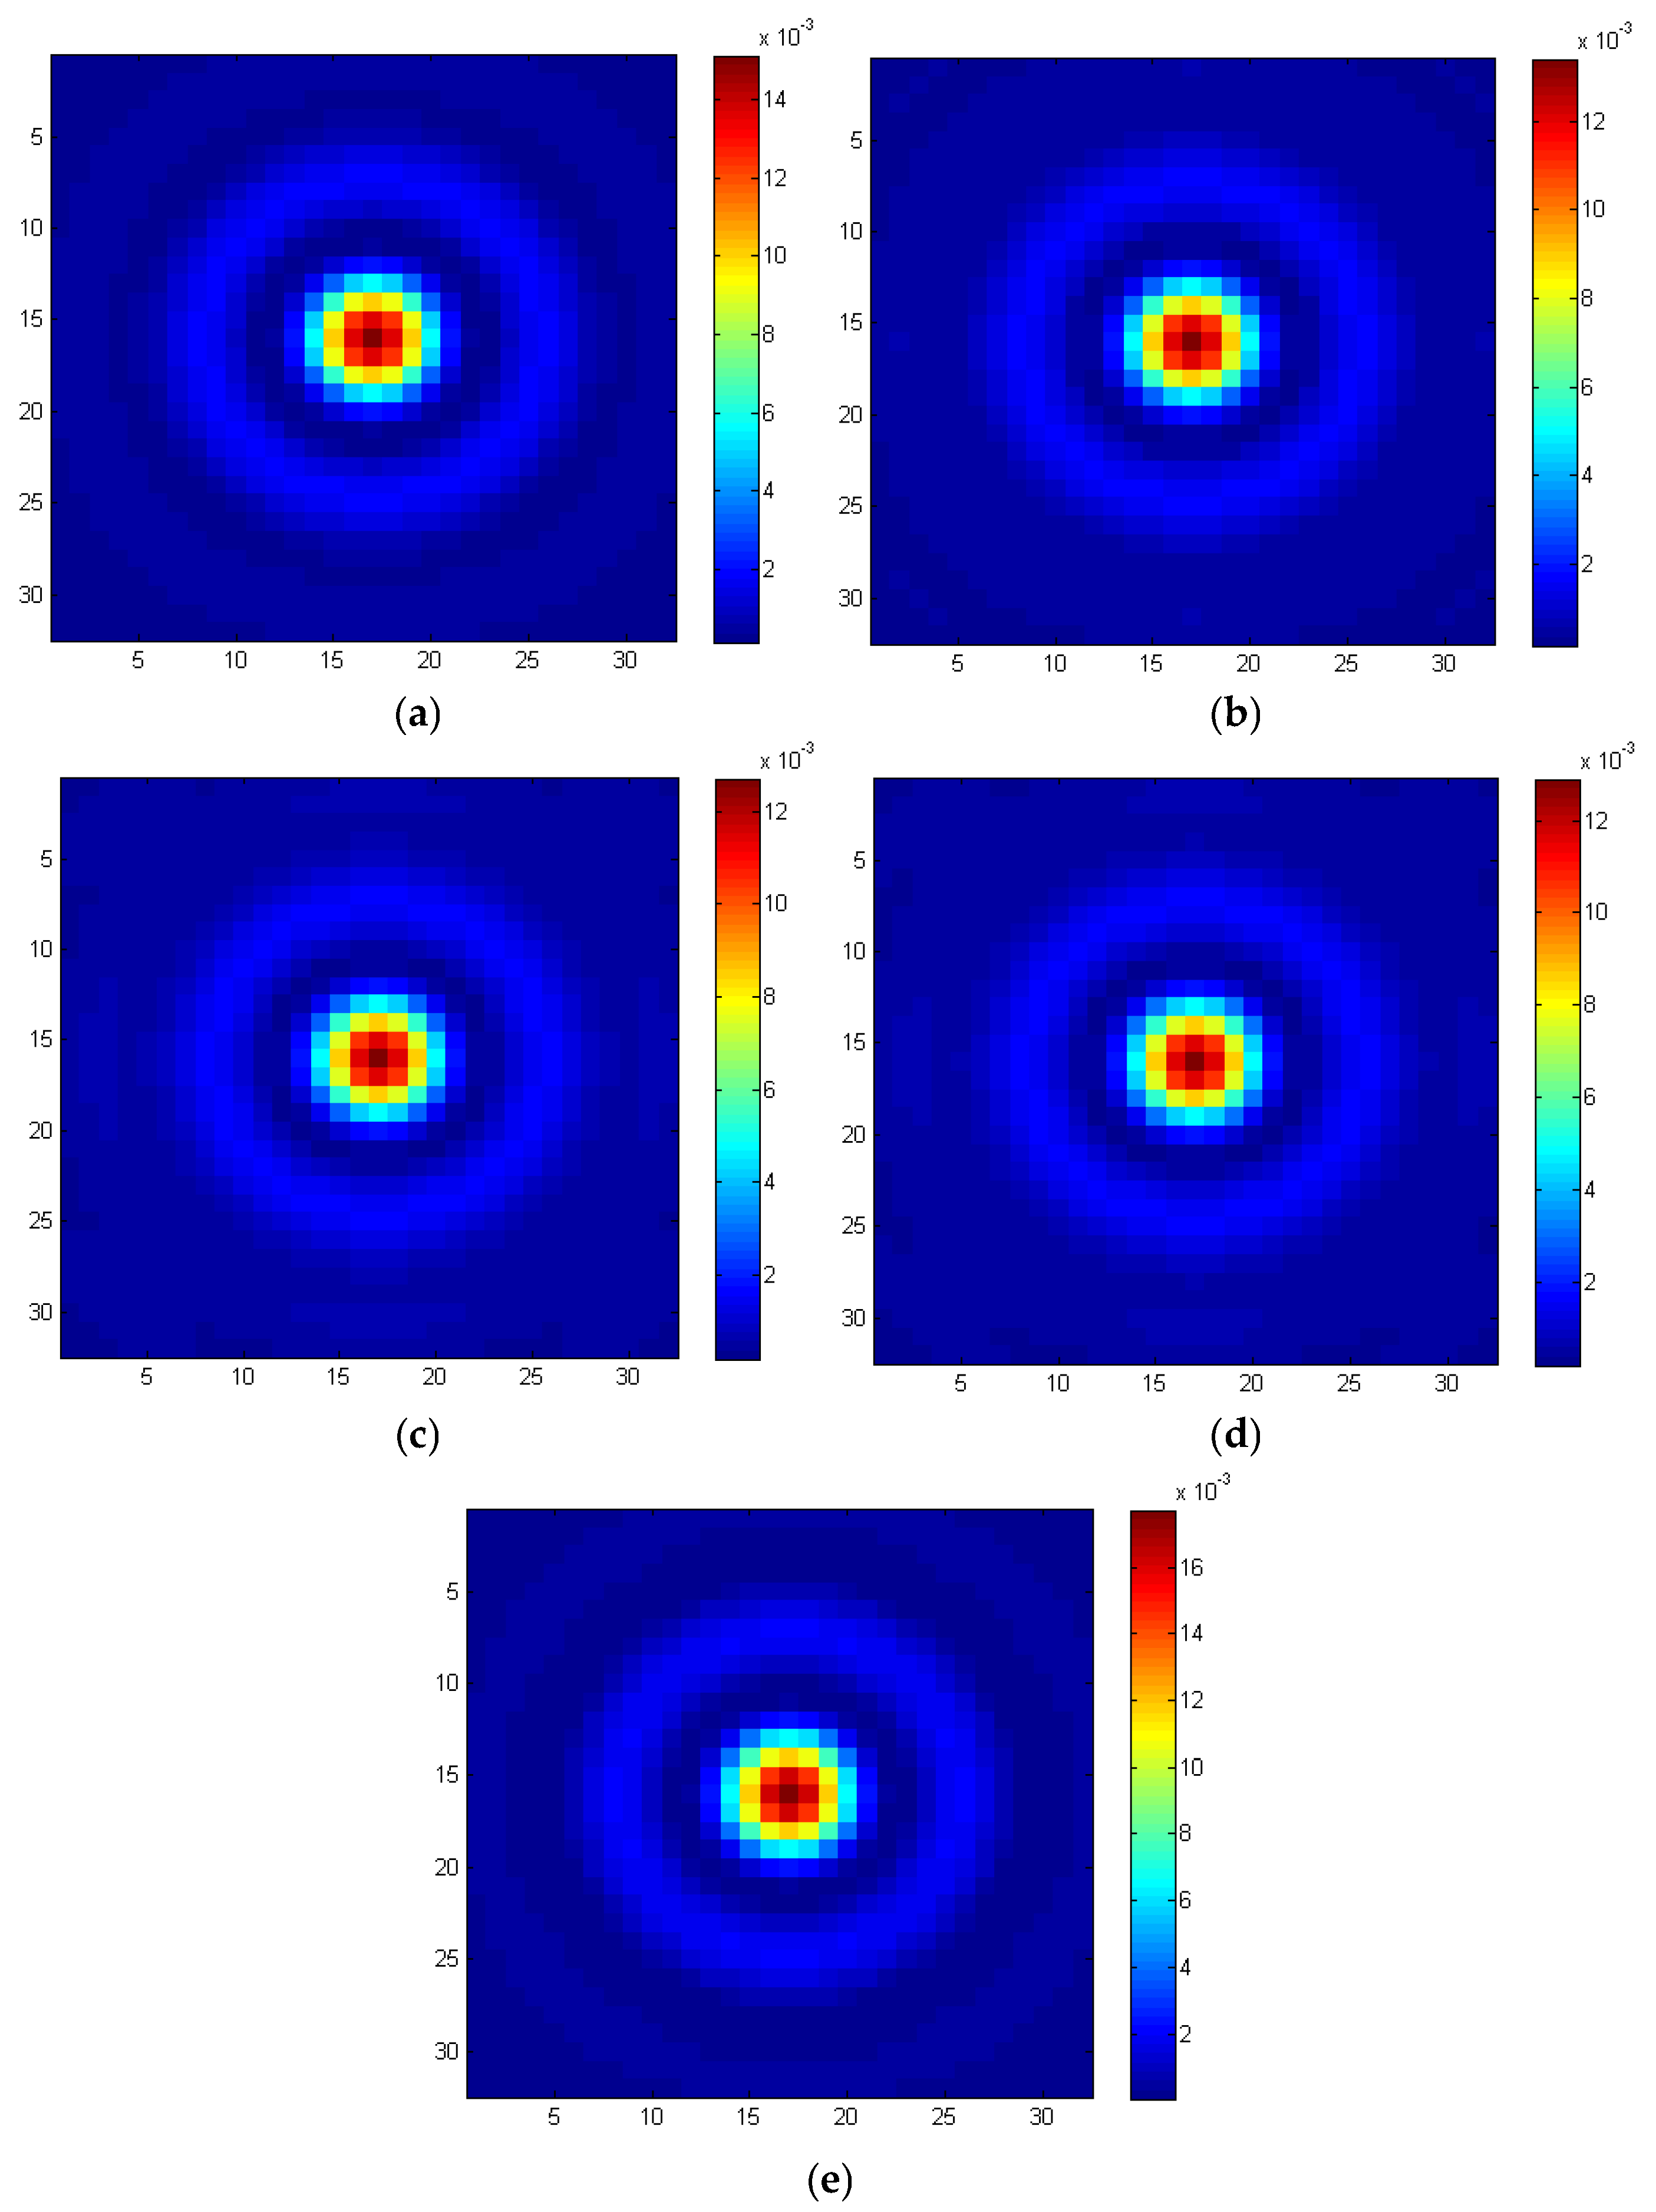
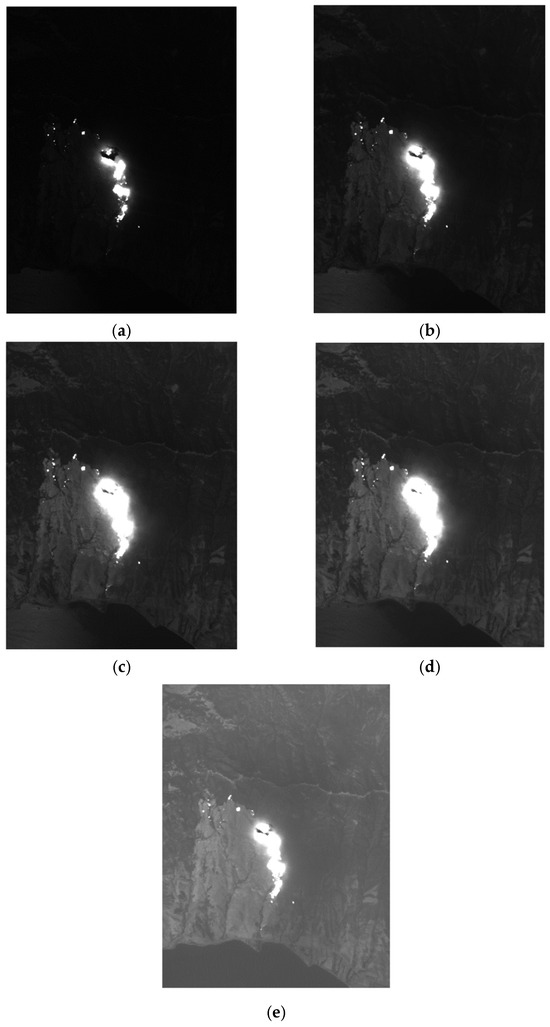
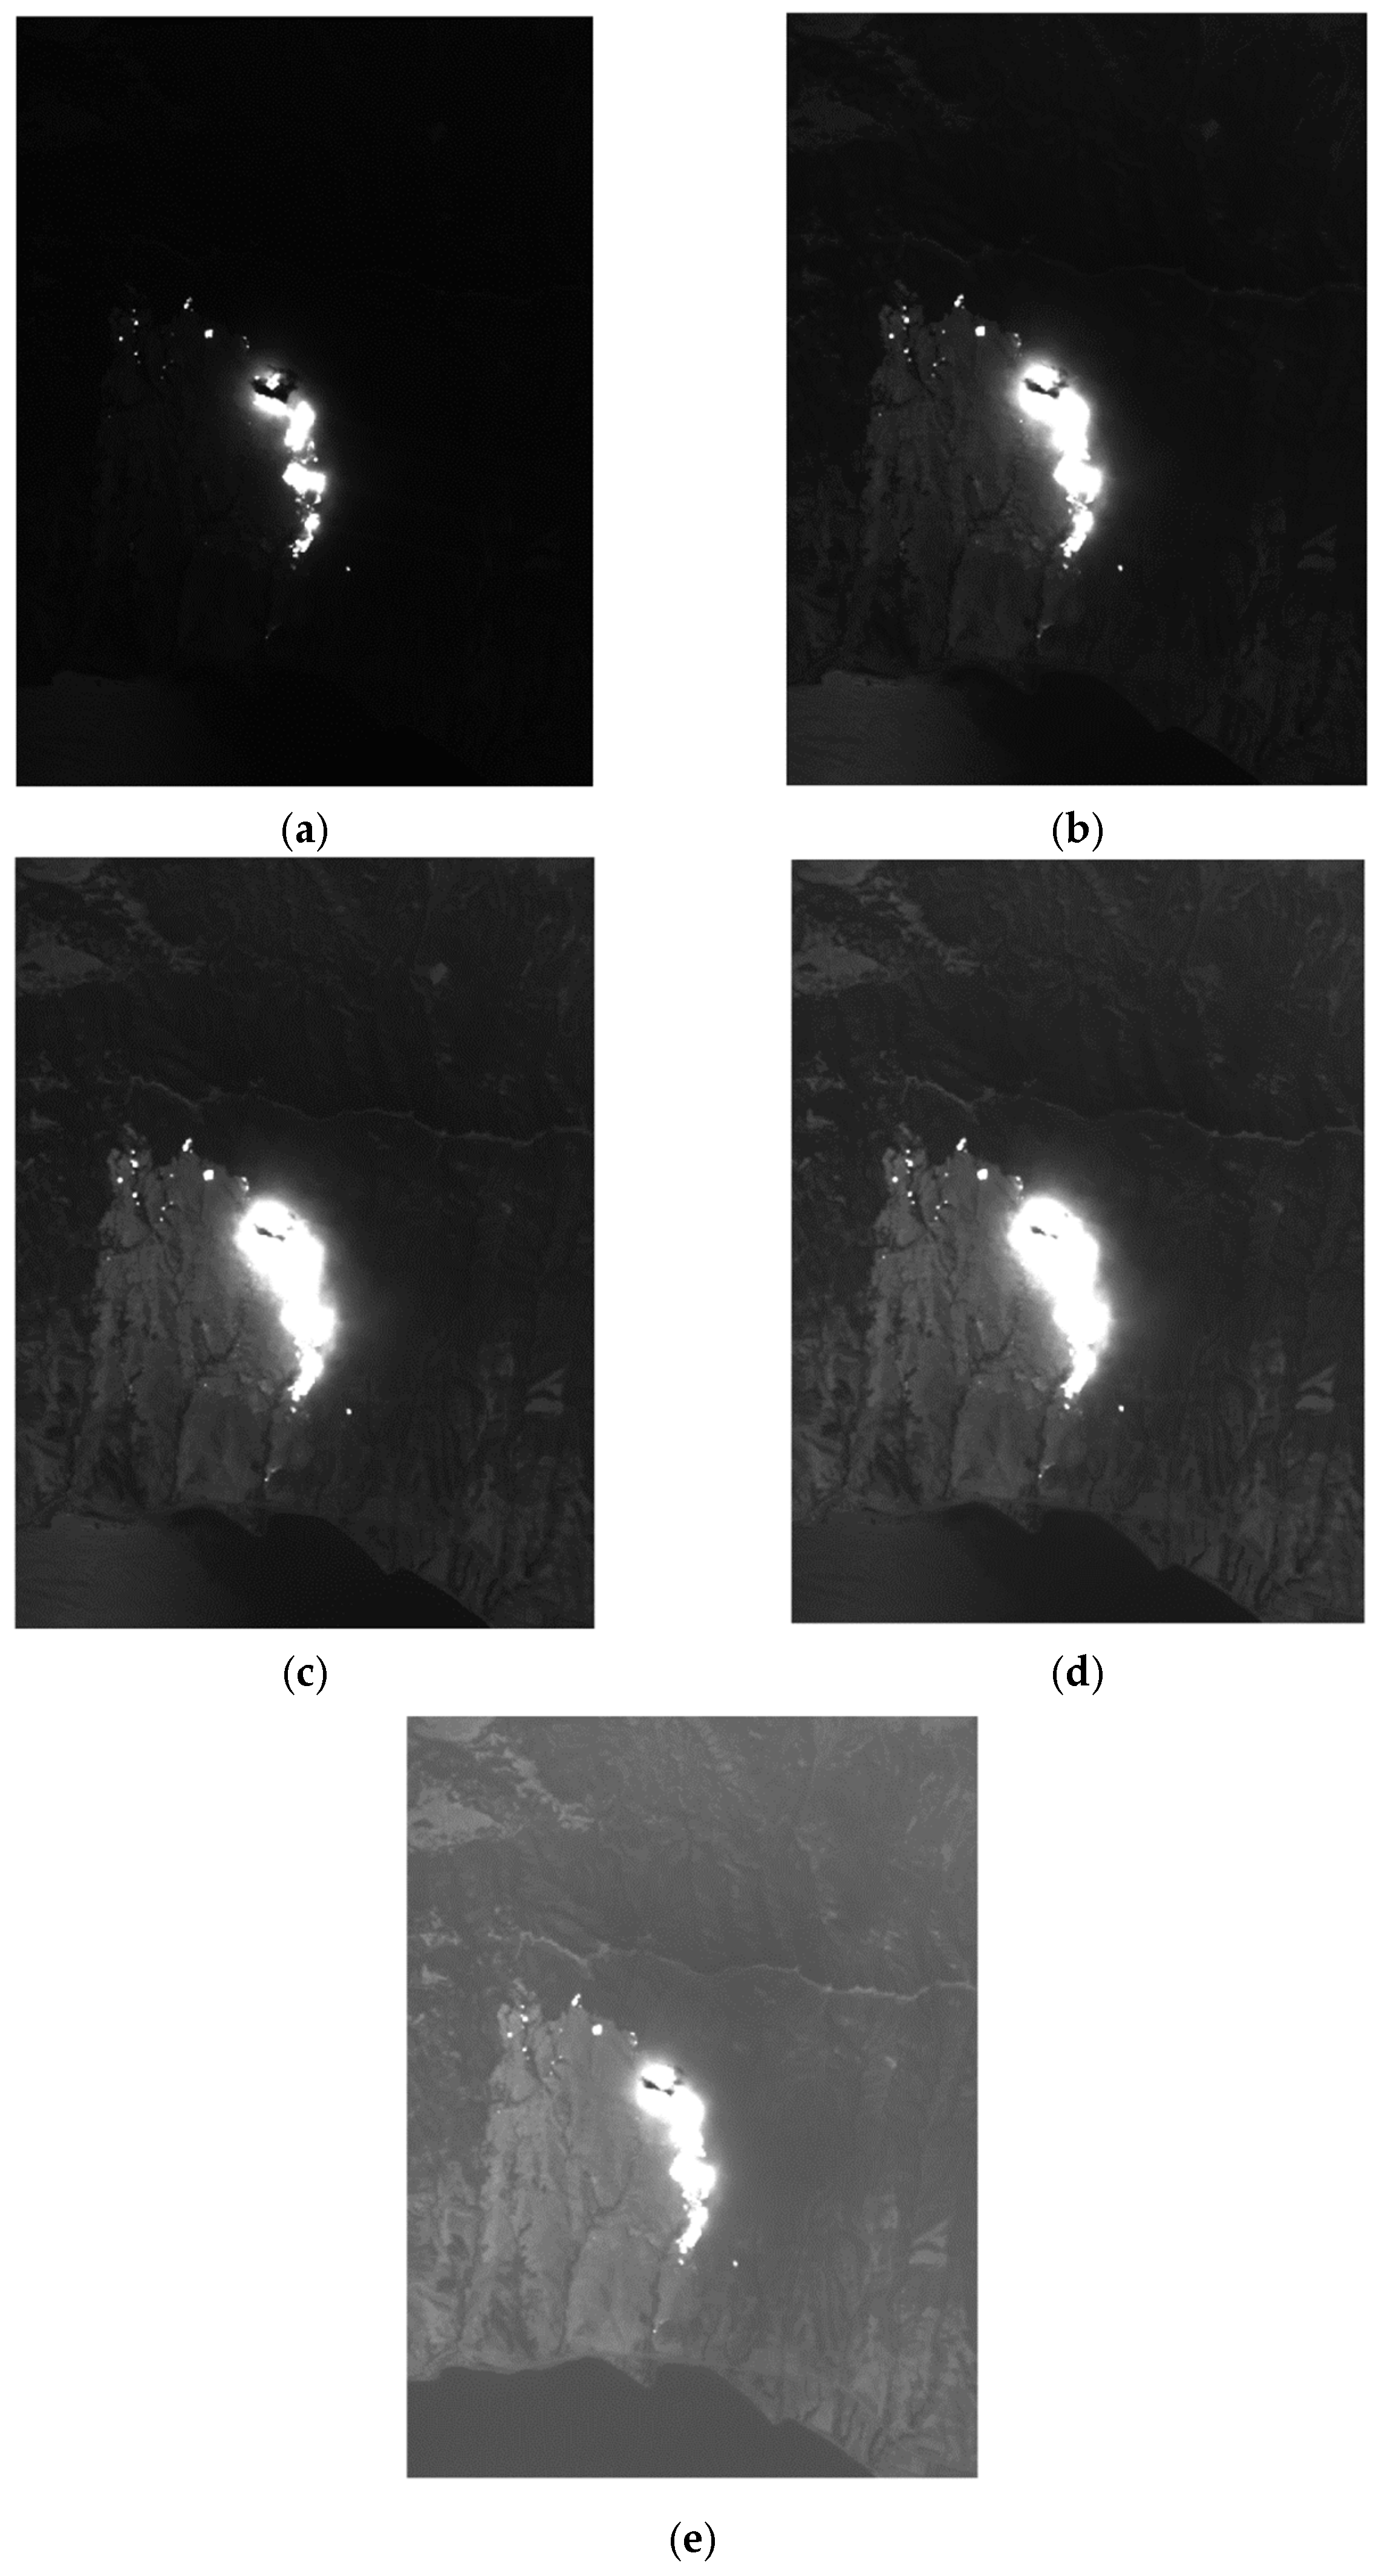
Figure 8 presents the normalized two-dimensional spatial transfer functions for the five spectral bands, as derived from the ZEMAX optical design CAD model of the SISSI instrument. The data were reorganized to reflect the expected configuration of the slitless push-broom acquisition mode, structured into frames consisting of 80 total rows, with each of the five SISSI spectral bands corresponding to 16 rows. Figure 9 shows the 5 de-interlaced SISSI bands obtained from the MASTER data and Figure 10 illustrates a simulated frame as it would be acquired by the SISSI instrument, according to the configuration of its slitless push-broom imaging mode.
Figure 8.
SISSI instrument two-dimensional normalized spatial PSF at 3.3 µm (a), 3.5 µm (b), 3.7 µm (c), 3.9 µm (d), 4.8 µm (e), as derived from the ZEMAX optical design CAD model of the SISSI instrument. Colorbars refers to the intensity of the PSF coefficients.
Figure 9.
SISSI instrument de-interlaced bands obtained from the MASTER data at, respectively: (a) 3.3 µm, (b) 3.5 µm, (c) 3.7 µm, (d) 3.9 µm, and (e) 4.8 µm.
Figure 10.
Simulated frame as it would be acquired by the SISSI instrument operating in slitless push-broom imaging mode.
2.6. Reconstruction Algorithms
The performance of a CS-based instrument is closely related to the reconstruction algorithm employed. Broadly, CS reconstruction techniques can be categorized into two classes: traditional optimization-based methods and deep learning-based approaches [37]. Both classes of methods attempt to solve the inverse problem of reconstructing the high-resolution images from their measurements; this is an ill-posed problem having infinitely many solutions, which requires some sort of regularization to find the most likely solution. For conventional methods, a loss function is minimized that explicitly combines a fidelity term (compatibility with the observed measurements) and a regularization term that promotes choosing as solutions images having a natural appearance. In the case of the SISSI instrument, two reconstruction algorithms were evaluated. The first is a traditional method that employs the Total Variation (TV) pseudo-norm as a regularizer [38,39], chosen for its speed and widespread adoption. The second is a deep learning-based method employing the convolutional neural network known as ISTA-Net architecture [40] (ISTA-Net+ in its enhanced version), which integrates the Iterative Shrinkage-Thresholding Algorithm at each stage and is particularly well-suited for natural image processing. ISTA-Net can be interpreted as the “unrolling” of a few iterations of a gradient descent operator corresponding to the shrinkage-thresholding minimizer, with the notable difference that the parameters defining the exact operator employed are learned via backpropagation from a training set of paired images and measurements, fully leveraging the power of deep learning to model the statistics of complex data and use them as learned regularizers to solve inverse problems.
These tests also facilitated the tuning of key parameters, such as the blocks dimension and the topology of the sensing matrix used in CS acquisition (e.g., Gaussian, pseudo-inverse, binary). Both algorithms were tested using a dataset of 11 natural images. ISTA-Net+ was trained on a dataset of 431 natural images, whereas the TV algorithm required no training phase. Although these training and test images are not representative of Earth Observation scenarios, the ISTA-Net+ model could easily be adapted for this context. In practice, it is possible to keep the basic ISTA-Net+ network as a pre-trained model and fine-tune its parameters on a new dataset. The tests were conducted on a workstation equipped with an AMD Ryzen 7 3700X CPU, 64 GB DDR4 3200MHz RAM, an Nvidia Titan V 12 GB GPU, and 1 1 Tb Intel 660p NVMe SSD. Performance comparisons between the two algorithms revealed that ISTA-Net+ generally outperforms the TV-based method in terms of Peak Signal-to-Noise Ratio (PSNR) and adaptability to various acquisition conditions.
It is important to highlight that the SISSI instrument operates in the MWIR spectral region, where images exhibit specific characteristics not present in the natural image datasets used for training and test, in particular, the presence of bright spots with radiance levels significantly higher than the surrounding background.
3. Results
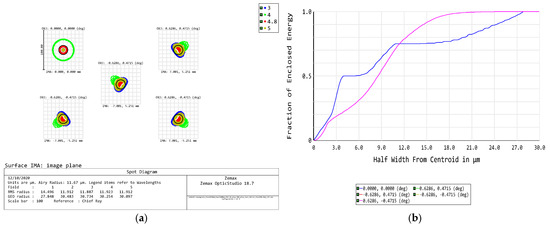
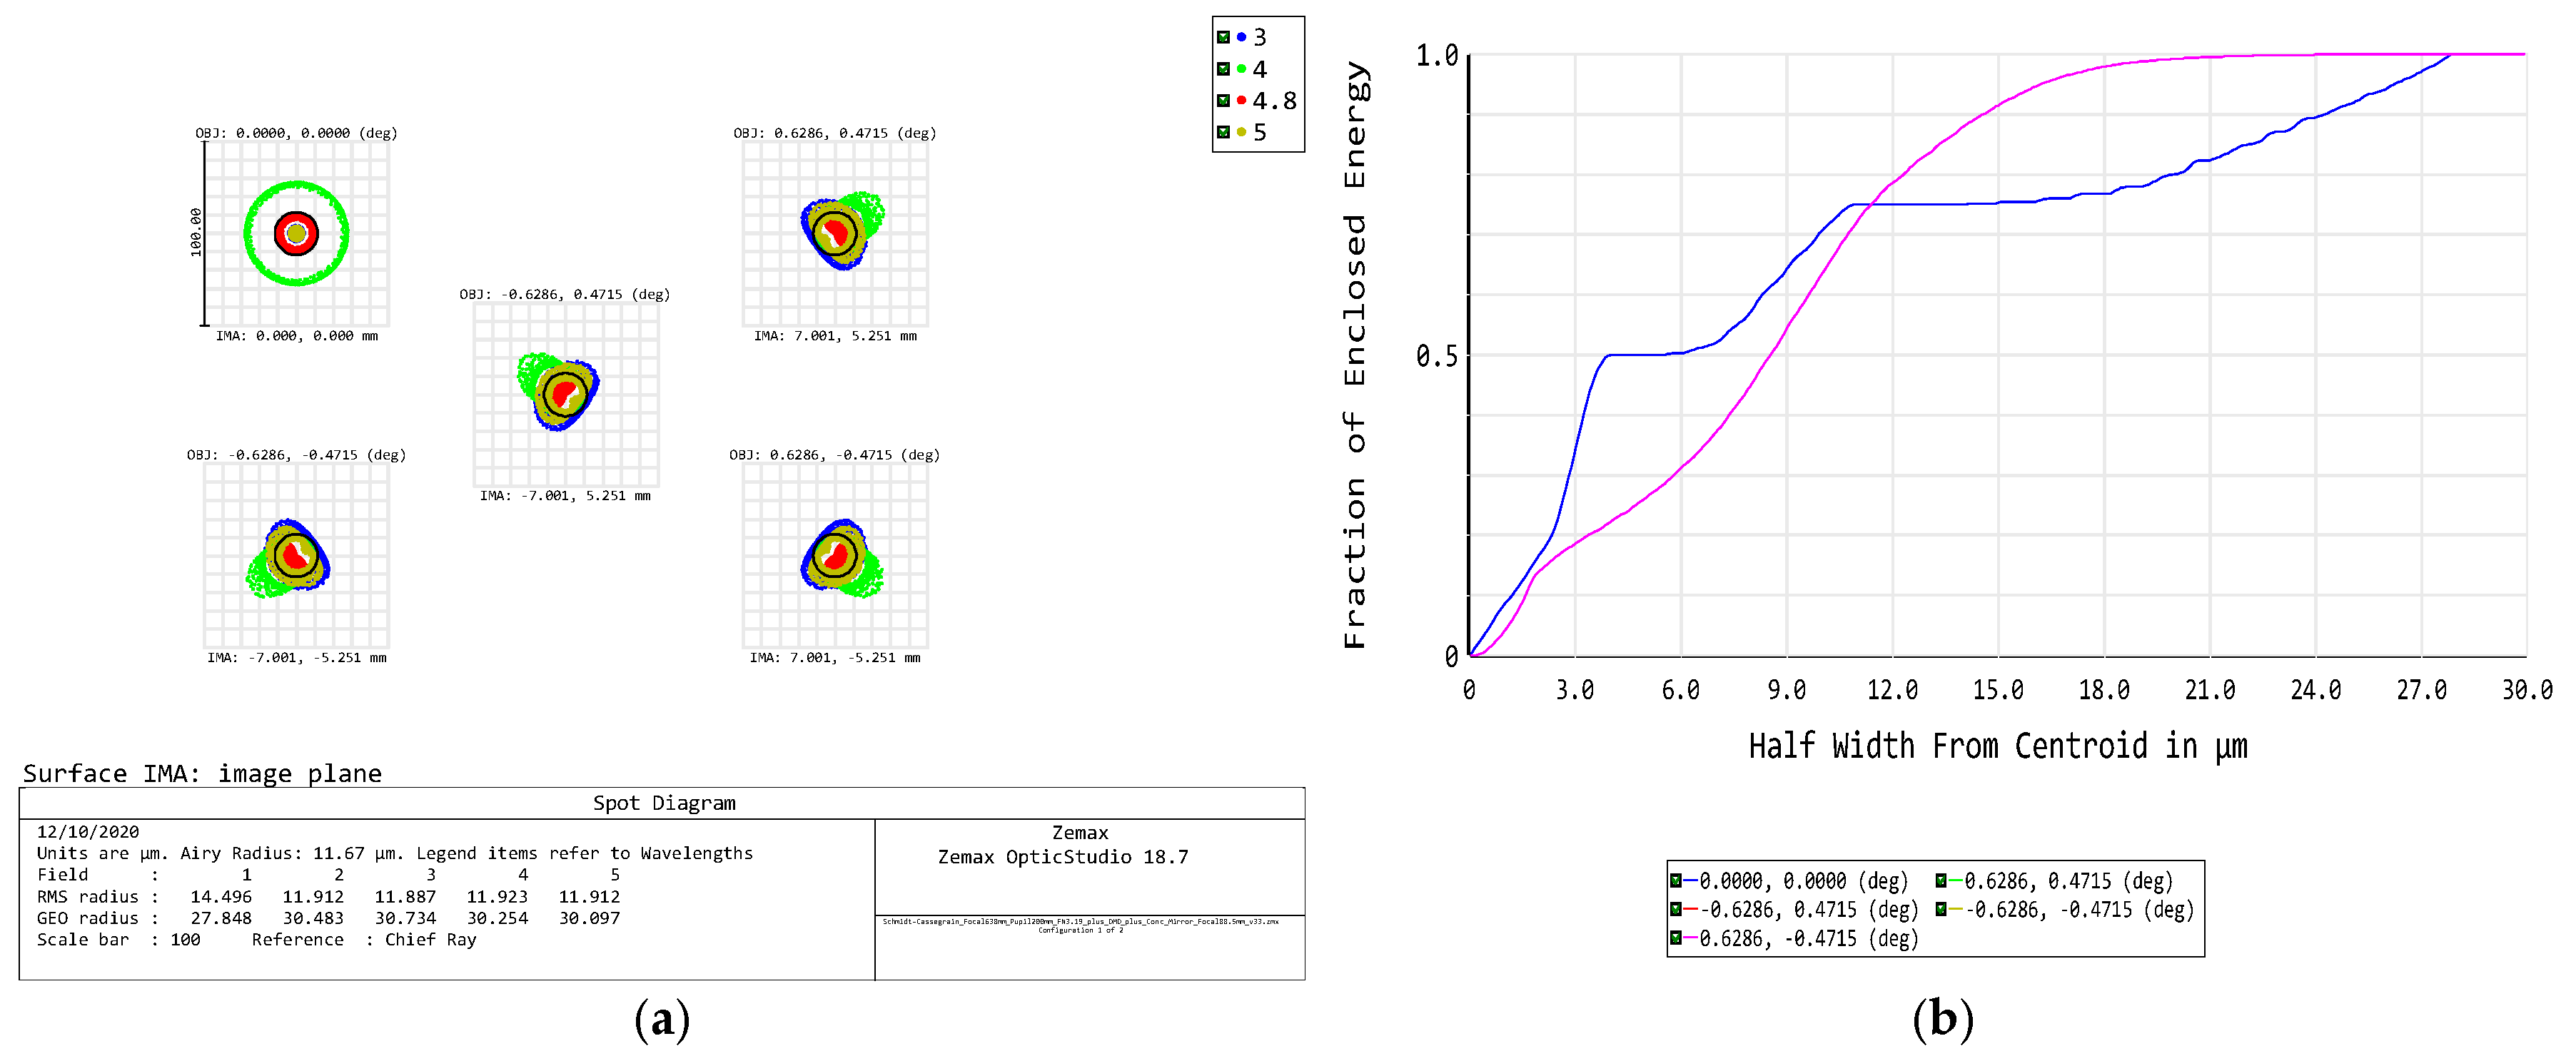
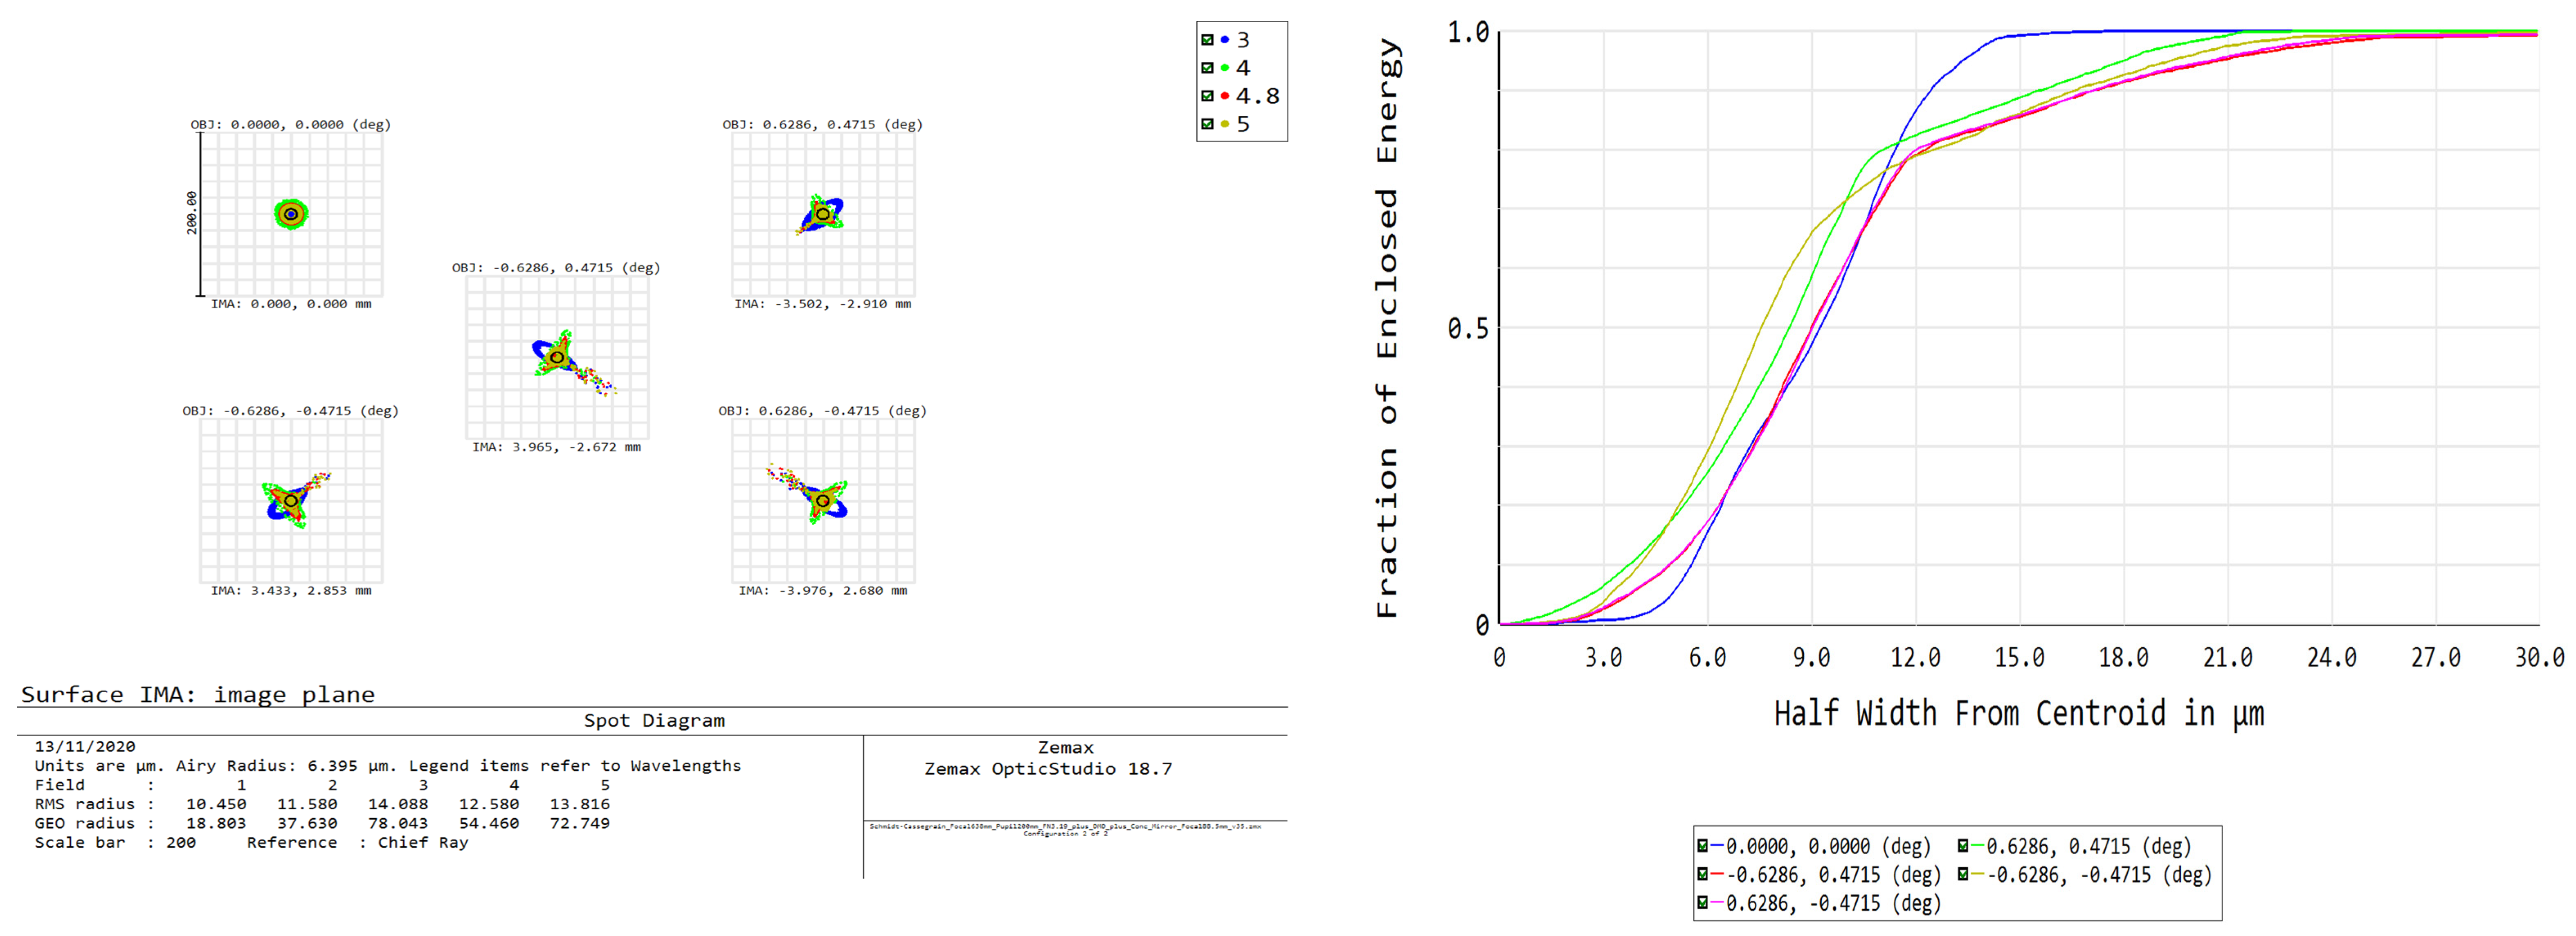
The performance assessment of the SISSI instrument begin with an evaluation of the optical design quality. Figure 11 reports the data, obtained with Zemax Opticstudio optical CAD package, relative to the spot diagram and enclosed energy of the collection optics. Specifically, the optical design ensures that more than 95% of the collected energy is concentrated within a 4 × 4 micropixel area, corresponding to a macropixel with a side length of 54.72 µm (based on 4 × 4 micropixels with pitch of 13.68 µm). Figure 12 presents the spot diagram and enclosed energy distribution of the focusing optics, indicating that approximately 85% of the total energy is concentrated within a single detector pixel.
Figure 11.
Collecting optics of SISSI instrument: (a) Spot diagram for different wavelengths: 3 μm (blue), 4 μm (green), 4.8 μm (red), 5 μm (yellow); the Airy disk was evaluated for a wavelength equal to 3.0 μm. (b) Enclosed energy for different viewing directions. The macropixel is equal to 54.72 µm (4 × 4 micropixels with a pitch of 13.68 µm).
Figure 12.
(a) Spot diagram on the detector of SISSI instrument: 3 μm (blue), 4 μm (green), 4.8 μm (red), 5 μm (yellow). (b) Enclosed energy of the focusing optics different viewing directions. The pixel dimension of the detector is 30 µm and approximately 85% of the total energy is concentrated into the generic detector pixel.
The total transmittance of the instrument is approximately 27%, excluding losses due to the DMD. Absorption by dielectric optical elements—excluding CaF2—further reduces transmittance. However, the primary limitation in overall performance arises from vignetting, predominantly caused by the telescope’s secondary mirror. This is largely due to the low F/# required by the system, which constrains the use of off-axis optics that would otherwise help mitigate vignetting. The optical design was guided by two main objectives: minimizing absorption (particularly challenging in the spectral range of interest due to the limited availability of highly transparent materials) and maximizing the collected luminous flux intercepted by the instrument. These constraints led to a design with a minimal number of optical surfaces, each as thin as possible (to minimize absorption and guarantee transparency), and a low F/#. As a result, the lenses in the collection optics are relatively wide compared to their thickness, increasing manufacturing complexity. The CaF2 correction element in the focusing optics also presents manufacturing challenges, requiring high mechanical precision for proper alignment. In contrast, the curved mirror in the focusing optics, although aspheric, does not pose significant fabrication difficulties. Additionally, the two elliptical folding mirrors must be precisely shaped and positioned to minimize vignetting.
Overall, prototype development based on this design necessitates meticulous mechanical engineering, with particular attention to alignment tolerances and the vibration sensitivity of individual optical components.
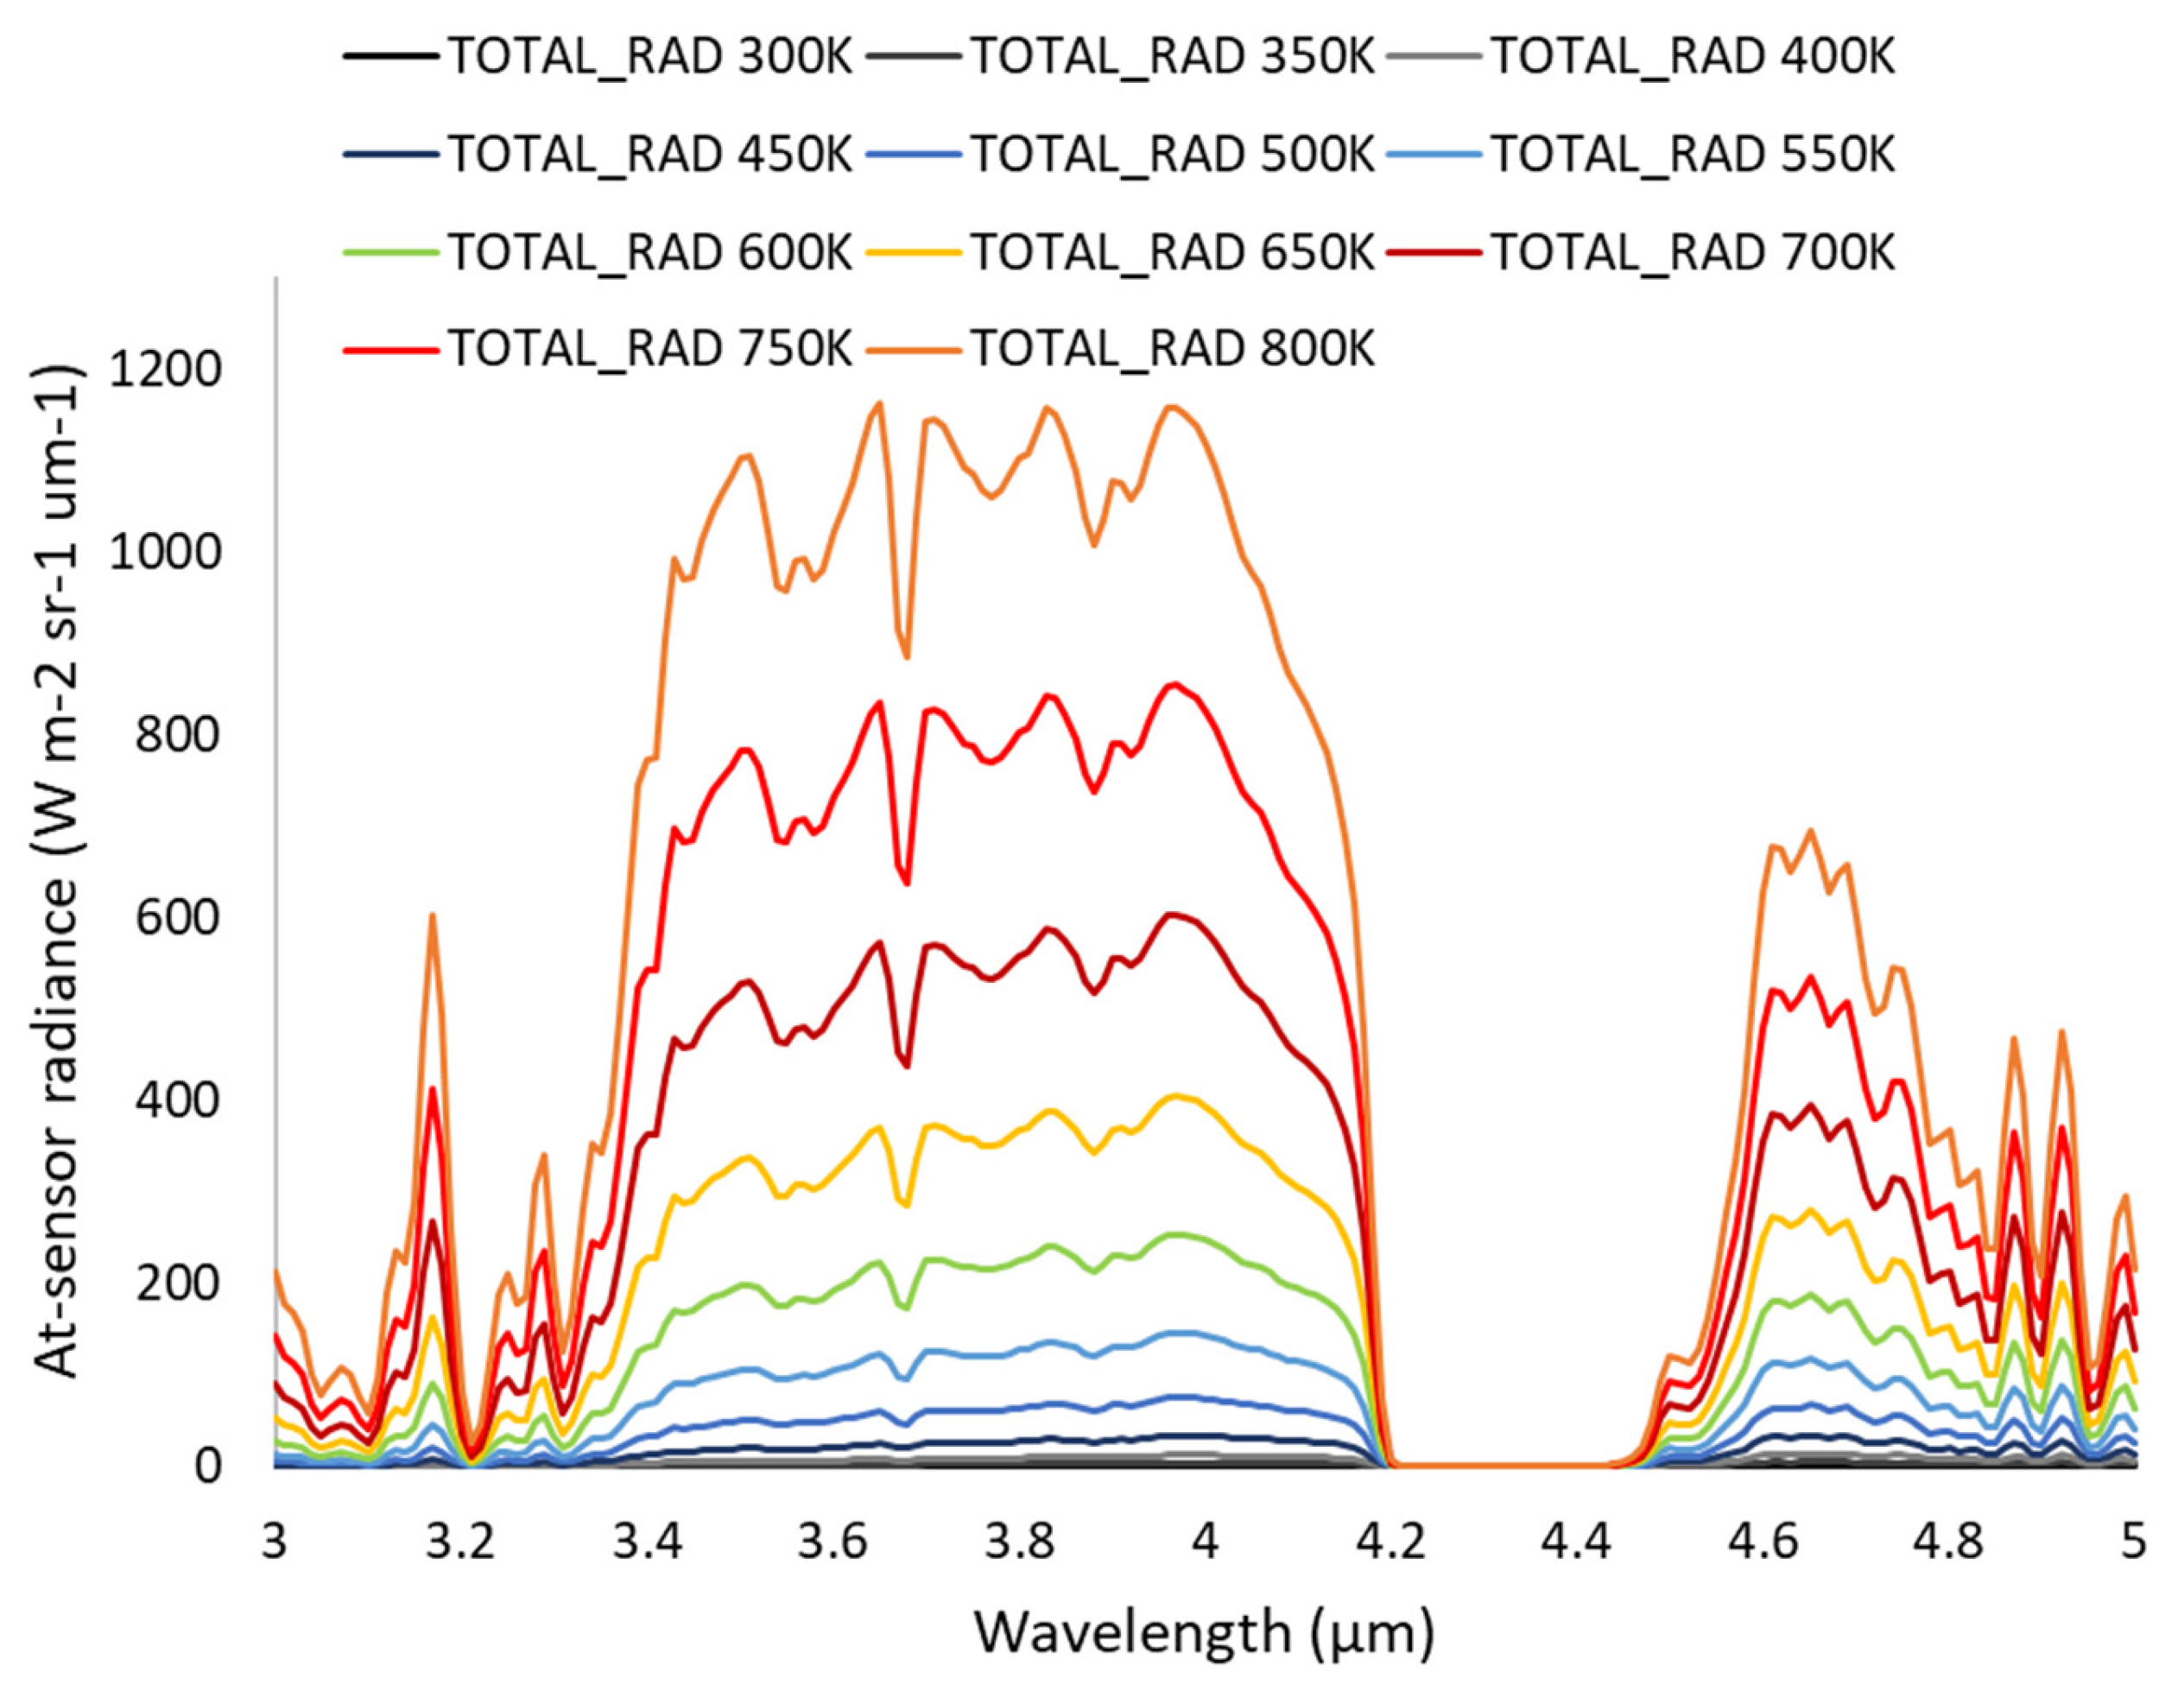
Regarding the radiometric performance of the SISSI instrument, it was assessed using simulated blackbody spectra at temperatures ranging from 300 K to 800 K. These spectra were propagated to the top of the atmosphere (TOA) using the MODTRAN 6 radiative transfer model. Specifically, the simulations were conducted for a sensor altitude of 700 km and a spectral resolution of 10 nm. Simulated spectra are reported in Figure 13.
Figure 13.
At-sensor radiance @700 Km evaluated for a blackbody with ground temperature ranging from 300 K to 800 K.
The effective radiance Rdetector, impinging on the detector, depends on the total transmittance of the optical system, τ(λ), the optical efficiency of DMD ε(λ), and by the modulation factor of DMD, F, i.e., the ratio between the number of micromirrors in ON position and the total number of micromirrors. Knowing this parameter, Rdetector can be expressed as
where R700km is the at-sensor radiance reaching the entrance pupil of SISSI instrument, F is the percentage of micromirrors turned on, τ(λ) and ε(λ) are calculated for the central wavelength of SISSI instrument and reported in Table 5. For F we considered a typical value of 0.5.
Rdetector = τ(λ) × ε(λ) × F × R700km
Table 5.
Values of τ(λ) and ε(λ) calculated for the central wavelengths of SISSI instrument.
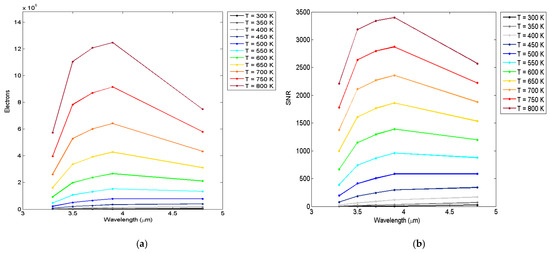
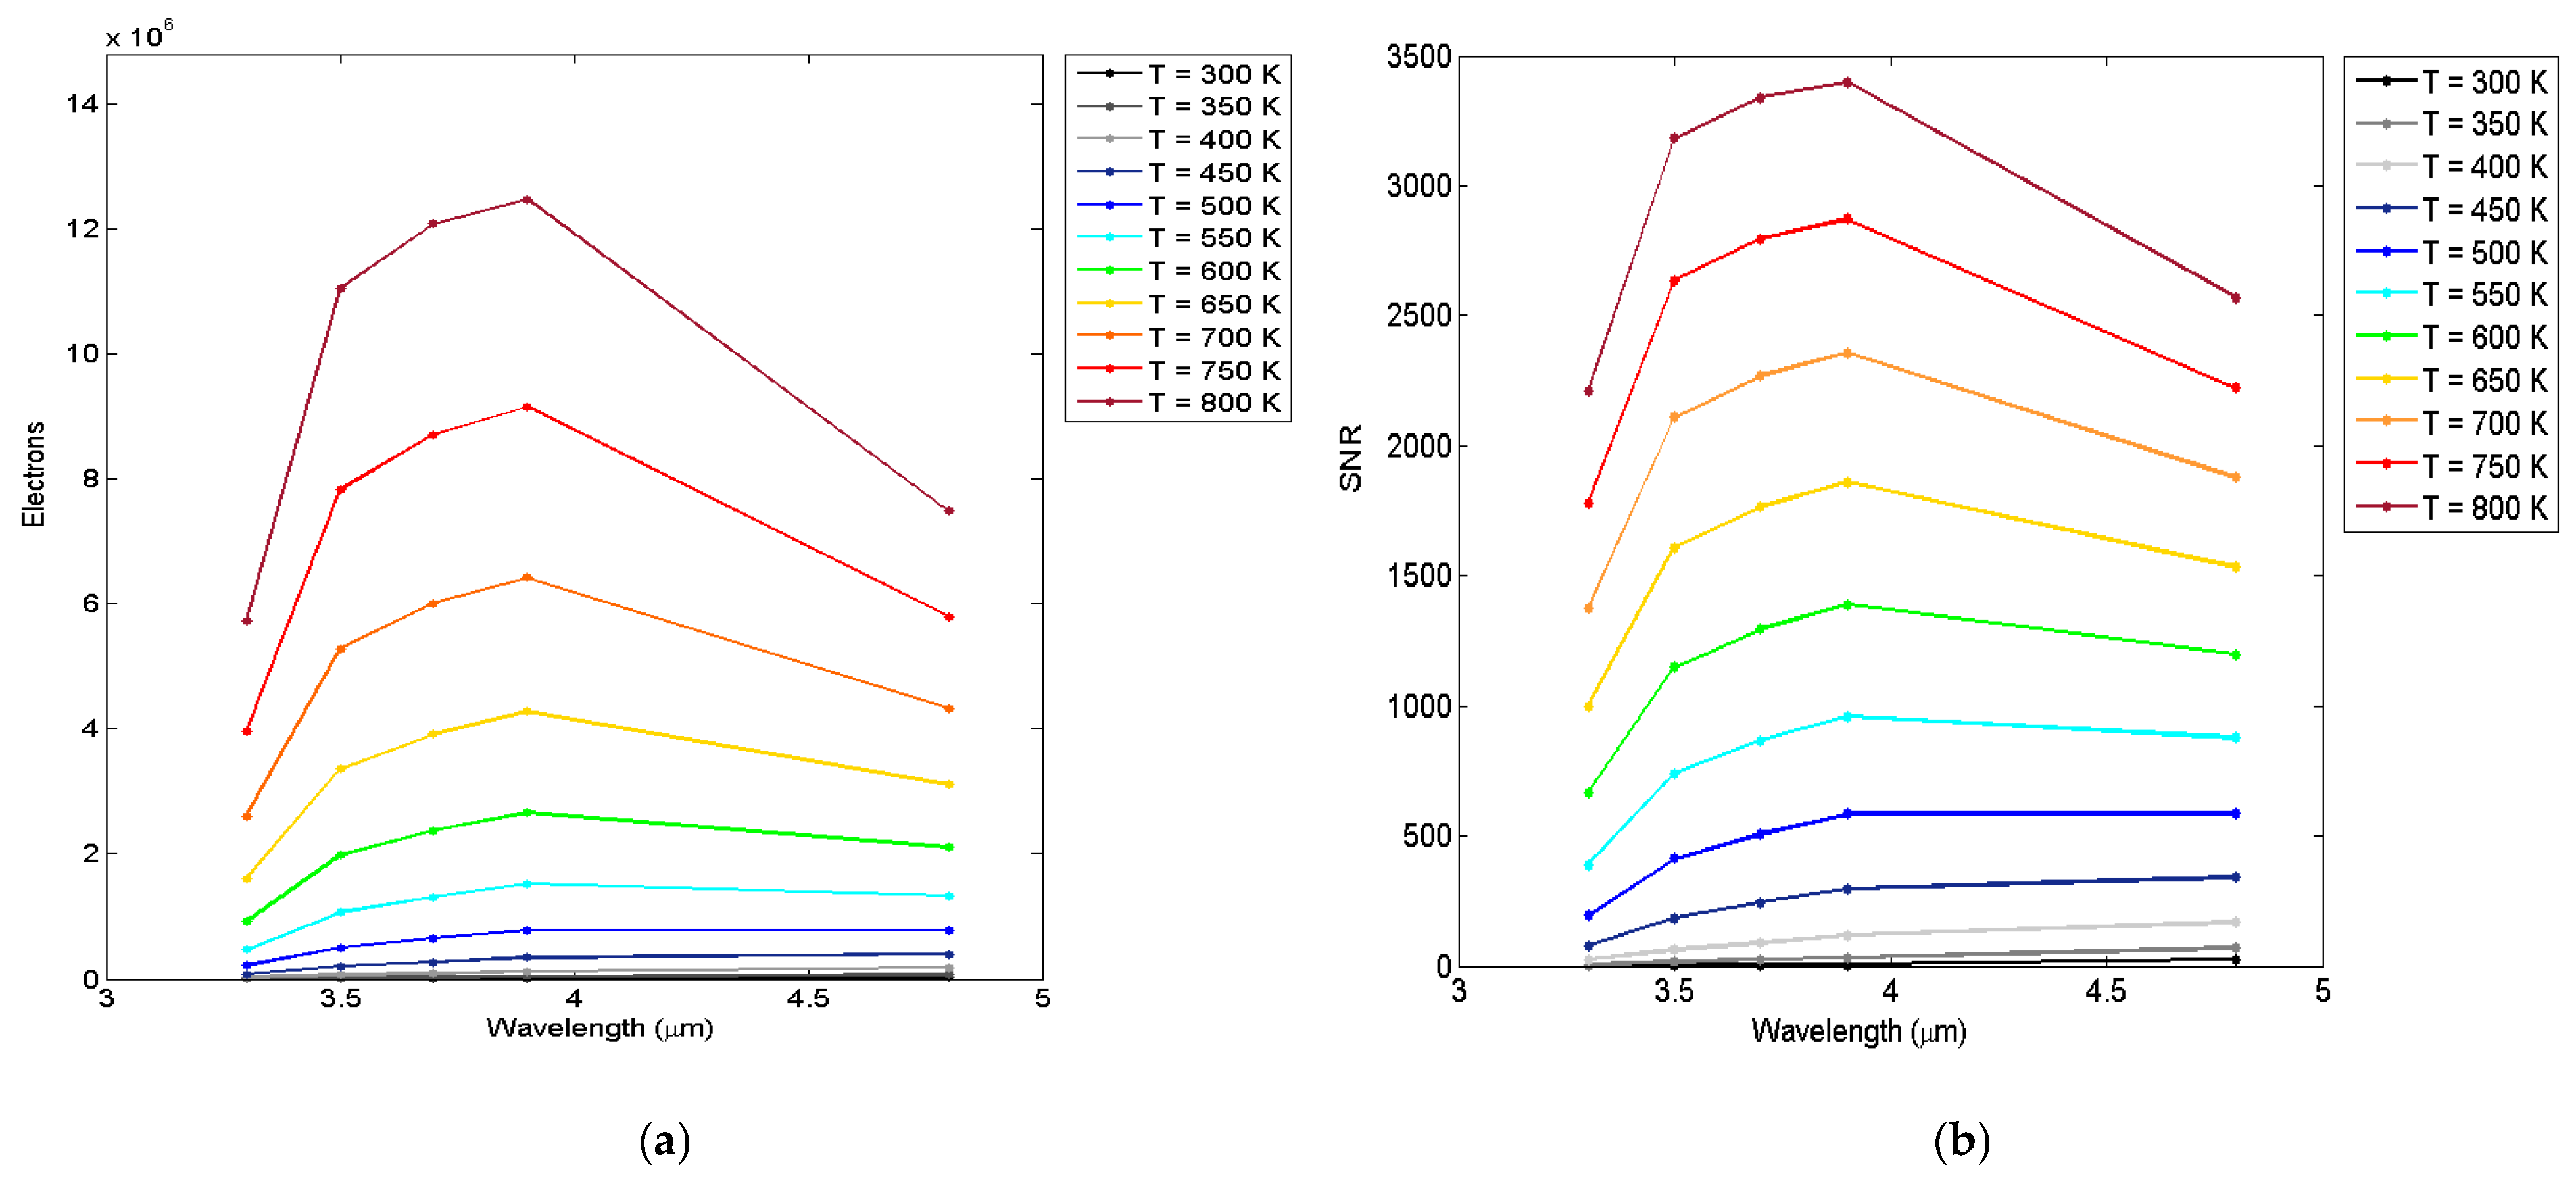
The number of photons reaching the detector was computed as the product of Rdetector and the detector’s Quantum Efficiency (QE), which was set to 90% based on the specifications provided in the MARS detector datasheet. The number of electrons generated per pixel, as well as the corresponding Signal-to-Noise Ratio (SNR), were calculated, assuming an integration time of 1.5 ms. Figure 14 presents the number of electrons per pixel for various ground temperatures. The signal saturation threshold (for Gain 0) is indicated by the upper limit of the graph. As shown, pixel saturation is expected at ground temperatures exceeding 800 K.
Figure 14.
(a) Number of electrons reaching a single detector pixel (corresponding to an entire macropixel and to a ground area 60 m × 60 m) for each spectral band at different ground temperatures, and (b) corresponding SNR evaluated for each spectral band at different ground temperatures. The signal saturation threshold is indicated by the upper limit of the graph.
It is important to note that these results refer to an entire macropixel (defined as the actual spatial area sensed by the detector (60 m × 60 m)). Hence, saturation occurs only if the average temperature over the entire macropixel reaches or exceeds the threshold. The application of CS and super-resolution techniques mitigates potential saturation effects. In particular, even if sub-areas within the macropixel (e.g., 15 m micropixels) exhibit localized temperatures significantly above 800 K, CS algorithms enable spatial reconstruction of these features without causing saturation. Conversely, for ground temperatures below 400 K, the number of electrons per pixel is insufficient in several spectral bands to meet the requirements of the intended applications.
Regarding SNR estimation, both photon noise and readout noise were considered. The dark current noise is not reported in the detector datasheet; however, a value of 6000 e−/s is estimated in [34]. Considering the 1.5 ms integration time of SISSI, the resulting dark current noise contribution to the overall noise estimate is negligible. The data quality remains satisfactory in the temperature range of 450–800 K and is still acceptable at 400 K—except in the 3.3 µm spectral band. For temperatures below 400 K, the signal quality is likely inadequate for most practical applications.
The performance of reconstruction algorithms on the data of the SISSI instrument was tested using both ISTANET and TV algorithms.
Performance comparisons between the two algorithms revealed that ISTA-Net+ generally outperforms the TV-based method in terms of quality measurements and adaptability to various acquisition conditions.
Since SISSI instrument operates in the MWIR spectral region, both algorithms were tailored to better reconstruct images acquired in the MWIR spectral range and subsequently tested on a dedicated dataset comprising the five images reported in Table 6. The first four test images were original dataset acquired by the MASTER airborne sensor, while the fifth image corresponds to the simulated scene presented in Figure 8.
Table 6.
Set of images used for testing CS algorithms: images 1–4 were acquired using the MASTER airborne sensor, image 5 is the simulated scene presented in Figure 8.
The performance of the reconstruction algorithms was evaluated for CS ratios of 25%, 50%, 75%, and 100%, where a CS ratio of 100% corresponds to absence of compression. The reconstruction quality was assessed using the Root Mean Squared Error (RMSE) and Peak Signal-to-Noise Ratio (PSNR), computed based on the original (non-normalized) pixel values of the images. As a result, the RMSE values are not directly comparable across different images. The detailed results are presented in Table 7, Table 8, Table 9, Table 10 and Table 11.
Table 7.
RMSE and PSNR for the reconstruction of “Test image 1”.
Table 8.
RMSE and PSNR for the reconstruction of “Test image 2”.
Table 9.
RMSE and PSNR for the reconstruction of “Test image 3”.
Table 10.
RMSE and PSNR for the reconstruction of “Test image 4”.
Table 11.
RMSE for the reconstruction of “Test image 5”.
The results presented in Table 7 through Table 10 indicate that the TV algorithm outperforms ISTA-Net+ in certain scenarios. This improvement is evident—both qualitatively and quantitatively—when the image contains large regions with high-intensity spots (Test image 1 and 4) and the CS ratio is high, as illustrated in Table 7, Table 8, Table 9 and Table 10 for a CS ratio of 75%. In contrast, when the CS ratio is low or the bright regions are spatially limited, TV tends to degrade reconstruction quality, like in Table 9, where Test image 3 does not contain HTE. While TV may yield slightly inferior results in reconstructing the background, it can be preferable due to its superior performance in accurately reconstructing bright areas, which are typically of primary interest in remote sensing applications in the MWIR. This trend is consistent across the other test cases, as most images include only a limited number of pixels with significantly elevated radiance values. Overall, these findings suggest that for MWIR image reconstruction, the TV algorithm can be considered a competitive alternative to ISTA-Net+.
Focusing on the performance observed with the SISSI simulated image (Test image 5 in Table 6), the image structure closely resembles that of the first test image, containing a single prominent bright spot against a relatively uniform background. However, a key distinction lies in the inclusion of the system’s Modulation Transfer Function (MTF) in the simulation process, which introduces filtering effects not present in the previous test images. Table 11 presents the RMSE and PSNR values obtained for this simulated image using the two reconstruction algorithms under consideration. In this case, ISTA-Net+ algorithm always outperforms TV, even if both demonstrated good performance. Temperature retrieval tests have been performed in [41] using classical algorithms adapted for MWIR data and applied to the reconstructed images, yielding satisfactory results.
4. Discussion
The optical design of the SISSI instrument yielded promising results, achieving an enclosed energy at the detector pixel of approximately 85% and a total system transmittance of around 30%, excluding losses introduced by the DMD. From a manufacturing standpoint, most optical components do not present significant challenges in terms of fabrication, alignment, or assembly. However, specific elements (namely the corrective plate of the focusing optics and the secondary mirror of the collecting optics) are aspherical and thus pose higher manufacturing complexity.
In general, all optical components require a robust mechanical design and a thorough vibration sensitivity analysis to ensure mechanical stability during operation. The mechanical design of a generic CS-based instrument should also address the problem of straylight mitigation. Straylight, in fact, represents a critical issue in CS-based architectures, impacting reconstruction fidelity. Mitigation strategies may include the use of baffles and light cages. Moreover, some part of the optical path could require cooling due to the considered spectral range, where unwanted light may originate from hot surfaces.
A critical optical issue, analyzed both qualitatively and quantitatively, was the perspective distortion induced by the use of the Scheimpflug principle, which results in the projected image of the DMD’s effective area on the detector being non-rectangular.
The SISSI payload data simulation incorporated all key characteristics of the system, including spatial and spectral resolution, and its unique acquisition configuration. Specifically, SISSI features a CS-based acquisition architecture that combines an SLM, a low-resolution detector, and a slitless push-broom scanning mode.
Simulation results demonstrate that the SISSI sensor is capable of capturing radiometrically robust data across a wide temperature range (400–800 K), while CS reconstruction techniques help mitigate potential saturation effects.
It is worth noting that these temperature values refer to the average temperature within a macropixel (60 m GSD), which represents the actual acquisition unit of the detector. Hence, saturation occurs only if the average temperature over the entire macropixel reaches or exceeds the saturation threshold. Assuming a standard 300 K ambient background temperature and a conventional MWIR sensor, if the HTE is an active wildfire (~1000 K), saturation will occur at approximately <0.1–pixel fill. If the HTE is a thermal landslide or industrial vent (~600 K), saturation requires approximately 1–5% pixel fill [42,43].
The application of CS to spatial super-resolution moves the acquisition mode from classical spatial multiplexing (i.e., acquisition of all pixels in one shot) to a temporal multiplexing approach, thus mitigating potential saturation effects. In particular, even if sub-areas within the macropixel (e.g., 15 m micropixels) exhibit localized temperatures significantly above 800 K, thus saturating it, CS algorithms enable spatial reconstruction of these features avoiding saturation effects. Indeed, whereas a pixel may saturate during a traditional acquisition, the CS acquisition distributes the energy of that bright pixel across multiple pixels on the sensor thanks to the modulation mask.
The estimated integration time of 1.5 ms enables 15 m GSD along-track as well and is fully compatible with the temporal requirements for frame acquisition and modulation mask switching on the SLM.
The CS reconstruction shows that, for Earth Observation images, the method based on deep learning performs better than traditional algorithm for CS reconstruction, since it achieves a better reconstruction accuracy. The disadvantage of these algorithms is that they require a training phase for which a suitable set of images is needed. Fortunately, the training set need not be domain-specific; a general collection of natural images is often sufficient, and a small set of domain-specific images may be employed for fine-tuning if available. Additionally, deep learning methods are typically less computationally intensive during inference compared to iterative conventional algorithms, especially when executed on GPU-equipped systems.
As far as MWIR imagery is concerned, scenes are often bimodal, consisting of a relatively uniform background interspersed with high-intensity bright spots. Deep learning-based reconstruction methods may struggle to accurately capture both modalities simultaneously, often performing well on the background but poorly on bright targets. In contrast, classical algorithms, if properly optimized to minimize artifacts due to numerical problems, offer reliable reconstruction quality under both conditions. Consequently, for MWIR image reconstruction involving both smooth backgrounds and bright targets, traditional CS methods currently remain the most robust and effective solution.
5. Conclusions
This study presented an innovative instrument architecture based on the Compressive Sensing (CS) paradigm, demonstrating promising performance for multispectral remote sensing in the MWIR spectral region. A key feature of the proposed system is its super-resolution capability, enabling a GSD of 15 m despite the use of a low-resolution detector. Currently, only two scientific spaceborne missions, MODIS and VIIRS, carry sensors capable of acquiring multiband data in the MWIR spectral range. However, both feature a coarse spatial resolution, with a GSD of 1000 m for MODIS and 750 m for VIIRS. Conversely, commercial missions such as HotSat offer a significantly finer GSD (3.5 m at nadir), but they acquire a single, broad, spectral band. In this scenario, an instrument like SISSI could fill the existing gap between very high spatial resolution sensors and multiband scientific ones.
Comprehensive evaluations of the instrument’s performance, in terms of both radiometric accuracy and image quality, showed that the system can deliver reliable radiometric data across a broad temperature range. Additionally, the CS-based acquisition strategy offers effective mitigation of pixel saturation effects. Beyond the technical results, this study introduces a novel paradigm for payload development in the MWIR domain, particularly in the context of EO missions focused on high-temperature phenomena, characterized by significant spatial variability. The findings of this paper suggest that CS-based architectures, coupled with advanced reconstruction techniques, offer a viable and efficient alternative to traditional imaging approaches in this spectral region.
Author Contributions
Conceptualization, C.L., D.G., M.F.B., E.M., V.N., L.P. and V.R. (Valentina Raimondi); methodology, C.L., D.G., E.M., V.N., L.P., D.V. and V.R. (Valentina Raimondi); software, C.L., V.N., L.P., V.R. (Vito Romaniello) and D.V.; validation, C.L., D.G., M.F.B., E.M., V.N., L.P., T.S. and V.R. (Valentina Raimondi); formal analysis, C.L., E.M., V.N., L.P., V.R. (Vito Romaniello) and D.V.; investigation, C.L., D.G., M.F.B., E.M., V.N., L.P., V.R. (Vito Romaniello), D.V. and V.R. (Valentina Raimondi); resources, M.F.B., E.M. and V.R. (Valentina Raimondi); data curation, C.L., D.G., V.N., L.P., V.R. (Vito Romaniello) and D.V.; writing—original draft preparation, C.L. and D.G.; writing—review and editing, C.L., D.G., E.M., V.N., L.P. and V.R. (Valentina Raimondi); visualization, C.L., V.N. and L.P.; supervision, E.M., M.F.B. and V.R. (Valentina Raimondi); project administration, V.R. (Valentina Raimondi); funding acquisition, V.R. (Valentina Raimondi). All authors have read and agreed to the published version of the manuscript.
Funding
This research was funded by ASI (Italian Space Agency), grant number ASI N. 2020-3-U.0 “Spettrometro a Immagine a Super-risoluzione Spaziale nel medio Infrarosso” (SISSI).
Data Availability Statement
MASTER data presented in this study are available at. https://asapdata.arc.nasa.gov/sensors/master/ (accessed on 5 December 2022). Simulated dataset and other data are available on request from the authors.
Conflicts of Interest
The authors declare no conflicts of interest.
References
- ASI Workshop for MWIR-LWIR Mission Study. 2019. Available online: https://www.asi.it/event/mwir-lwir-mission-study/ (accessed on 20 April 2026).
- European Space Agency. ESA’s Living Planet Programme: Scientific Achievements and Future Challenges—Scientific Context of the Earth Observation Science Strategy for ESA; ESA SP-1329/2; European Space Agency: Noordwijk, The Netherlands, 2015. [Google Scholar]
- Romaniello, V.; Spinetti, C.; Silvestri, M.; Buongiorno, M.F. A Sensitivity Study of the 4.8 µm Carbon Dioxide Absorption Band in the MWIR Spectral Range. Remote Sens. 2020, 12, 172. [Google Scholar] [CrossRef] [Scilit]
- Wooster, M.J.; Roberts, G.; Perry, G.L.W.; Kaufman, Y.J. Retrieval of biomass combustion rate and totals from fire radiative power observations: FRP derivation and calibration relationships between biomass consumption and fire radiative energy release. J. Geophys. Res. 2005, 110, D24311. [Google Scholar] [CrossRef] [Scilit]
- Lombardo, V.; Musacchio, M.; Buongiorno, M.F. Error Analysis of Subpixel Lava Temperature Measurements Using Infrared Remotely Sensed Data. Geophys. J. Int. 2012, 191, 112–125. [Google Scholar] [CrossRef] [Scilit]
- Gonnelli, A.; Baronti, S.; Carlà, R.; Raimondi, V. The Impact of Spatial Resolution on Active Fire Monitoring Using Multispectral Satellite Imagery. Eng. Proc. 2023, 51, 30. [Google Scholar] [CrossRef] [Scilit]
- Yang, S.; Huang, Q.; Yu, M. Advancements in remote sensing for active fire detection: A review of datasets and methods. Sci. Total Environ. 2024, 943, 173273. [Google Scholar] [CrossRef] [Scilit] [PubMed]
- Freeman, W.T.; Jones, T.R.; Pasztor, E.C. Example-based super-resolution. IEEE Comput. Graph. Appl. 2002, 22, 56–65. [Google Scholar] [CrossRef] [Scilit]
- Zhang, X.; Ge, Y.; Chen, J.; Ling, F.; Wang, Q.; Du, D.; Xiang, R. High-quality super-resolution mapping using spatial deep learning. iScience 2023, 26, 106875. [Google Scholar] [CrossRef] [Scilit] [PubMed]
- Wang, Z.; Chen, J.; Hoi, S.C.H. Deep Learning for Image Super-Resolution: A Survey. IEEE Trans. Pattern Anal. Mach. Intell. 2021, 43, 3365–3387. [Google Scholar] [CrossRef] [Scilit] [PubMed]
- Candes, E.J.; Wakin, M. An introduction to compressive sampling. IEEE Signal Process. Mag. 2008, 25, 21–30. [Google Scholar] [CrossRef] [Scilit]
- Donoho, D.L. Compressed sensing. IEEE Trans. Inf. Theory 2006, 52, 1289–1306. [Google Scholar] [CrossRef] [Scilit]
- Candes, E.; Romberg, J. Sparsity and incoherence in compressive sampling. Inverse Probl. 2007, 23, 969–985. [Google Scholar] [CrossRef] [Scilit]
- Duarte, M.F.; Davenport, M.A.; Takhar, D.; Laska, J.N.; Sun, T.; Kelly, K.F.; Baraniuk, R.G. Single-Pixel Imaging via Compressive Sampling. IEEE Signal Process. Mag. 2008, 25, 83–91. [Google Scholar] [CrossRef] [Scilit]
- Digital Signal Processing (DSP) at Rice University. Available online: https://dsp.rice.edu/cs/ (accessed on 20 April 2026).
- Romberg, J. Imaging via compressive sampling. IEEE Signal Process. Mag. 2008, 25, 14–20. [Google Scholar] [CrossRef] [Scilit]
- Maleki, A.; Donoho, D.L. Optimally tuned iterative reconstruction algorithms for compressed sensing. IEEE J. Sel. Top. Signal Process. 2010, 4, 330–341. [Google Scholar] [CrossRef] [Scilit]
- Gibson, G.M.; Johnson, S.D.; Padgett, M.J. Single-pixel imaging 12 years on: A review. Opt. Express 2020, 28, 28190–28208. [Google Scholar] [CrossRef] [Scilit] [PubMed]
- Chen, H.; Asif, M.S.; Sankaranarayanan, A.C.; Veeraraghavan, A. FPA-CS: Focal plane array-based compressive imaging in short-wave infrared. In 2015 IEEE Conference on Computer Vision and Pattern Recognition (CVPR); IEEE: Piscataway, NJ, USA, 2015; pp. 2358–2366. [Google Scholar]
- Mahalanobis, R.; Shilling, R.; Muise, R.; Neifeld, M.A. High-resolution imaging using a translating coded aperture. Opt. Eng. 2017, 56, 084106. [Google Scholar] [CrossRef] [Scilit]
- Dumas, J.P.; Lodhi, M.A.; Bajwa, W.U.; Pierce, M.C. From modeling to hardware: An experimental evaluation of image plane and Fourier plane coded compressive optical imaging. Opt. Express 2017, 25, 29472–29491. [Google Scholar] [CrossRef] [Scilit]
- Dudley, D.; Duncan, W.M.; Slaughter, J. Emerging digital micromirror device (DMD) applications. In MOEMS Display and Imaging Systems; SPIE: Bellingham, WA, USA, 2003; Volume 4985. [Google Scholar]
- Ren, Y.X.; Lu, R.D.; Gong, L. Tailoring light with a digital micromirror device. Ann. Phys. 2015, 527, 447–470. [Google Scholar] [CrossRef] [Scilit]
- Barducci, A.; Guzzi, D.; Lastri, C.; Nardino, V.; Pippi, I.; Raimondi, V. Compressive sensing for hyperspectral earth observation from space. In International Conference on Space Optics—ICSO 2014; SPIE: Bellingham, WA, USA, 2014; Volume 10563, p. 1056353. [Google Scholar]
- Guzzi, D.; Coluccia, G.; Labate, D.; Lastri, C.; Magli, E.; Nardino, V.; Palombi, L.; Pippi, I.; Coltuc, D.; Barducci, A.; et al. Optical compressive sensing technologies for space applications: Instrumental concepts and performance analysis. In International Conference on Space Optics—ICSO 2018; SPIE: Bellingham, WA, USA, 2018; Volume 11180, p. 111806B. [Google Scholar]
- Coluccia, G.; Lastri, C.; Guzzi, D.; Magli, E.; Nardino, V.; Palombi, L.; Pippi, I.; Raimondi, V.; Ravazzi, C.; Garoi, F.; et al. Optical Compressive Imaging Technologies for Space Big Data. IEEE Trans. Big Data 2020, 6, 430–442. [Google Scholar] [CrossRef] [Scilit]
- Mahalanobis, R.; Shilling, R.; Murphy, R.; Muise, R. Recent results of medium wave infrared compressive sensing. Appl. Opt. 2014, 53, 8060–8070. [Google Scholar] [CrossRef] [Scilit] [PubMed]
- Raimondi, V.; Baldi, M.; Berndt, D.; Bianchi, T.; Gallego, G.; Borrelli, D.; Carlà, R.; Corti, C.; Corti, F.; Corti, M.; et al. Super-resolved compressive demonstrator for Earth Observation applications in the Medium Infrared: Instrumental concept, optical design and expected performances. In International Conference on Space Optics—ICSO 2022; SPIE: Bellingham, WA, USA, 2023; p. 1277741. [Google Scholar] [CrossRef] [Scilit]
- Palombi, L.; Baldi, M.; Bianchi, T.; Bischof, L.; Franci, E.; Borque Gallego, G.; Corti, C.; Corti, F.; Corti, M.; Guzzi, D.; et al. SURPRISE laboratory demonstrator: Outcomes of the laboratory test campaign. In International Conference on Space Optics—ICSO 2024; SPIE: Bellingham, WA, USA, 2025; p. 136994C. [Google Scholar] [CrossRef] [Scilit]
- Zamkotsian, F.; Canonica, M.; Tangen, K.; Lanzoni, P.; Grassi, E.; Barette, R.; Fabron, C.; Waldis, S.; Noell, W.; de Rooij, N.; et al. Micromirror arrays designed and tested for space instrumentation. In 2010 International Conference on Optical MEMS and Nanophotonics; IEEE: Piscataway, NJ, USA, 2010. [Google Scholar]
- Travinsky, A.; Vorobiev, D.; Ninkov, Z.; Raisanen, A.; Quijada, M.; Smee, S.; Pellish, J.; Schwartz, T.; Robberto, M.; Heap, S.; et al. Evaluation of Digital Micromirror Devices for use in space-based Multi-Object Spectrometer application. J. Astron. Telesc. Instrum. Syst. 2017, 3, 035003. [Google Scholar] [CrossRef] [Scilit]
- Borque Gallego, G.; Giriens, L.; Ummel, A.; Roulet, J.-C.; Guzzi, D.; Raimondi, V.; Pache, C. Front-window replacement and performance characterization of a commercial digital micro-mirror device for use in the infrared spectrum. In International Conference on Space Optics—ICSO 2022; SPIE: Bellingham, WA, USA, 2023; p. 127777M. [Google Scholar] [CrossRef] [Scilit]
- Dauderstädt, U.; Dürr, P.; Kunze, D.; Francés González, S.; Borrelli, D.; Palombi, L.; Raimondi, V.; Wagner, M. Considerations for a Micromirror Array Optimized for Compressive Sensing (VIS to MIR) in Space Applications. J. Imaging 2024, 10, 282. [Google Scholar] [CrossRef] [Scilit] [PubMed]
- Neefs, E.; Vandaele, A.C.; Drummond, R.; Thomas, I.R.; Berkenbosch, S.; Clairquin, R.; Delanoye, S.; Ristic, B.; Maes, J.; Bonnewijn, S.; et al. NOMAD spectrometer on the ExoMars trace gas orbiter mission: Part 1—Design, manufacturing and testing of the infrared channels. Appl. Opt. 2015, 54, 8494–8520. [Google Scholar] [CrossRef] [Scilit] [PubMed]
- Hook, S.J.; Myers, J.J.; Thome, K.J.; Fitzgerald, M.; Kahle, A.B. The MODIS/ASTER airborne simulator (MASTER)—A new instrument for Earth science studies. Remote Sens. Environ. 2001, 76, 93–102. [Google Scholar] [CrossRef] [Scilit]
- Barducci, A.; Guzzi, D.; Lastri, C.; Marcoionni, P.; Nardino, V.; Pippi, I. Simulating the performance of the hyperspectral payload of the PRISMA mission. In Proceedings of the 2012 IEEE International Geoscience and Remote Sensing Symposium, Munich, Germany, 22–27 July 2012; pp. 5013–5016. [Google Scholar] [CrossRef] [Scilit]
- Needell, D.; Tropp, J. CoSaMP: Iterative signal recovery from incomplete and inaccurate samples. Appl. Comput. Harmon. Anal. 2009, 26, 301–321. [Google Scholar] [CrossRef] [Scilit]
- Sidky, E.Y.; Kao, C.M.; Pan, X. Accurate image reconstruction from few-views and limited-angle data in divergent-beam CT. J. X-Ray Sci. Technol. 2006, 14, 119–139. [Google Scholar] [CrossRef] [Scilit]
- Wang, Y.; Yang, J.; Yin, W.; Zhang, Y. A new alternating minimization algorithm for total variation image reconstruction. SIAM J. Imaging Sci. 2008, 1, 248–272. [Google Scholar] [CrossRef] [Scilit]
- Zhang, J.; Ghanem, B. ISTA-Net: Interpretable Optimization-Inspired Deep Network for Image Compressive Sensing. In 2018 IEEE/CVF Conference on Computer Vision and Pattern Recognition; IEEE: Piscataway, NJ, USA, 2018; pp. 1828–1837. [Google Scholar]
- Guzzi, D.; Baldi, M.; Bianchi, T.; Buongiorno, F.; Lastri, C.; Magli, E.; Nardino, V.; Palombi, L.; Romaniello, V.; Scopa, T.; et al. Data Simulations of a Compressive Sensing Multispectral Imager in the Mid-Infrared Region and Its Performances for the Monitoring of High-Temperature Events. Eng. Proc. 2023, 51, 31. [Google Scholar] [CrossRef] [Scilit]
- Dozier, J. A method for satellite identification of surface temperature fields of subpixel resolution. Remote Sens. Environ. 1981, 11, 221–229. [Google Scholar] [CrossRef] [Scilit]
- Giglio, L.; Kendall, J.D. Application of the Dozier retrieval to wildfire characterization: A sensitivity analysis. Remote Sens. Environ. 2001, 77, 34–49. [Google Scholar] [CrossRef] [Scilit]



Disclaimer/Publisher’s Note: The statements, opinions and data contained in all publications are solely those of the individual author(s) and contributor(s) and not of MDPI and/or the editor(s). MDPI and/or the editor(s) disclaim responsibility for any injury to people or property resulting from any ideas, methods, instructions or products referred to in the content. |
© 2026 by the authors. Licensee MDPI, Basel, Switzerland. This article is an open access article distributed under the terms and conditions of the Creative Commons Attribution (CC BY) license.