


Highlights
What are the main findings?
- Atmospheric SF6 column concentrations over Hefei during 2023–2025 were successfully retrieved using ground-based high-resolution FTIR observations with a total retrieval uncertainty of 5.70%.
- SF6 concentrations showed clear seasonal variations, with higher values in summer and lower values in winter, while the annual growth rate of XSF6 reached 0.88 ppt yr−1.
What are the implications of the main findings?
- High-SF6 events over Hefei were mainly influenced by regional transport from eastern and southern China, particularly during summer.
- The results provide observational evidence for understanding the long-term variation characteristics and regional transport influences of atmospheric SF6 over eastern China.
Abstract
Sulfur hexafluoride (SF6) is a typical long-lived greenhouse gas that has attracted considerable attention due to its extremely long atmospheric lifetime and high global warming potential. In this study, atmospheric SF6 column concentrations from 2023 to 2025 were retrieved using ground-based high-resolution Fourier transform infrared (FTIR) remote sensing observations at the Hefei site, China. The seasonal variation and annual trends of SF6 were analyzed, and the potential influencing regions and transport characteristics of high-value events were investigated by combining wind direction statistics with backward trajectory clustering analysis. The results show that high SF6 column concentrations over Hefei mainly occurred in summer, while relatively low concentrations appeared in winter during the observation period from 2023 to 2025. The average total column concentration of SF6 is 2.80 × 10¹⁴ molec·cm−2, the average dry-air column-averaged mole fraction is 13.06 ppt, and the annual growth rate is 0.88 ppt yr−1. The high-value events of SF6 at the Hefei site are mainly concentrated in summer, and the wind direction mainly corresponds to the northeast and the southeast wind. The air masses with high concentrations of SF6 mainly originated from the transportation path in the nearby southern regions of the station. During summer, the season with relatively higher SF6 concentrations, the air masses were mainly southerly and easterly winds. The results of this study provide observational evidence and scientific support for understanding the characteristics of variation in atmospheric SF6 column concentrations over Hefei and the influence of regional transport on high SF6 values.
1. Introduction
Sulfur hexafluoride (SF6) is a typical long-lived greenhouse gas with an extremely high global warming potential (GWP), and has been listed as one of the six major greenhouse gases in the Kyoto Protocol. According to the Sixth Assessment Report of the Intergovernmental Panel on Climate Change (IPCC), the 100-year global warming potential of SF6 is 24,300, meaning that the emission of 1 kg SF6 has a climate impact equivalent to approximately 24.3 t CO2 over a 100-year time horizon [1]. SF6 emissions are almost entirely anthropogenic, mainly originating from industrial activities such as electrical power equipment, semiconductor manufacturing, and metal smelting. During production and use, some gases are leaked and released into nature. Top–down estimates based on AGAGE observations showed that global SF6 emissions increased from 7.3 ± 0.6 Gg yr−1 in 2008 to 9.04 ± 0.35 Gg yr−1 in 2018 [2]. In recent years, with the development of industry and the increase in power demand, the global atmospheric concentration of SF6 has continued to rise. Due to its strong infrared absorption capacity, the continuous increase in SF6 concentrations can enhance the absorption of terrestrial longwave radiation, thereby increasing atmospheric radiative forcing and making a sustained contribution to global warming. IPCC AR6 reported that the effective radiative forcing (ERF) of SF6 was 5.6 mW·m−2 in 2019 [3]. Although the current contribution of SF6 to total radiative forcing is smaller than that of major greenhouse gases such as CO2, SF6 has an extremely long atmospheric lifetime, with the most widely estimated value reaching up to 3200 years; SF6 easily accumulates in the atmosphere over long periods [4,5]. Consequently, if emissions continue to increase, the long-term greenhouse effect of SF6 may be further amplified. In addition, because SF6 is chemically stable and shows almost no chemical transformation in the atmosphere, it is removed only slowly through photolysis in the stratosphere. Therefore, it has also been widely used as an important tracer in studies of atmospheric background variations and the influence of anthropogenic emissions.
Due to its extremely high global warming potential and exceptionally long atmospheric lifetime, its potential impact on global climate change has attracted widespread attention. Observations of atmospheric SF6 can be traced back to the 1970s. Lovelock et al. conducted early measurements in Ireland using gas chromatography and reported atmospheric mixing ratios of only 0.03–0.12 ppt, indicating that SF6 concentrations were extremely low at that time [6]. With the development of observational techniques, SF6 measurements gradually evolved into long-term continuous observations globally. Among them, the Global Greenhouse Gas Reference Network (GGGRN) established by the National Oceanic and Atmospheric Administration (NOAA) has carried out long-term monitoring of multiple greenhouse gases, including SF6, using methods such as flask air sampling since 1997 [7]. According to NOAA marine background station data, the global atmospheric SF6 concentration increased from 4.11 ppt in January 1998 to 12.03 ppt in January 2025, with the annual growth rate reaching 0.47 ppt yr−1 in 2025, indicating an accelerated increase over the past decade [7]. Based on model predictions, Tuğba Önder et al. found that without further worldwide emission reduction measures, the atmospheric SF6 concentration could reach approximately 21–23 ppt by 2050, representing an increase of 87–96% compared with 2023 [8]. In addition, other observational approaches have also been applied to monitoring the global variation of long-lived halogenated gases. De Longueville et al. used long-term observations from the Infrared Atmospheric Sounding Interferometer (IASI) satellite during 2008–2021 to retrieve concentration variations of several long-lived halogenated gases, including SF6. The results show a continuous global increase in SF6, with the global mean atmospheric mixing ratio reaching approximately 11 ppt in 2021 and an annual growth rate of about 0.34 ± 0.03 ppt yr−1, which is in good agreement with observations from the Advanced Global Atmospheric Gases Experiment (AGAGE) and NOAA ground-based monitoring networks [9].
China has conducted long-term SF6 observations at the Waliguan station in Qinghai since 1996 and has subsequently established additional regional background stations, such as Shangdianzi in Beijing [10,11]. Later, several regional atmospheric background stations were established at Longfengshan in Heilongjiang, Lin’an in Zhejiang, Shangri-La in Yunnan, Jinsha in Hubei, and Akedala in Xinjiang, gradually forming an atmospheric background observation network that covers different regional types across China [12,13]. According to the observational results reported in the China Greenhouse Gas Bulletin 2024 issued by the China Meteorological Administration, atmospheric SF6 concentrations in China have shown a persistent long-term increase. In 2024, the annual average concentration at the Waliguan and Shangdianzi stations reached the highest value since the start of observations, about 12.08 ppt [14]. An et al. reported, based on long-term atmospheric inversion studies, that China has become one of the major contributors to global SF6 emissions. From 2011 to 2021, China’s SF6 emissions increased from approximately 2.6 Gg yr−1 to 5.1 Gg yr−1, mainly associated with the use and leakage of gas-insulated equipment in power systems, with emission growth exceeding the increase in global total emissions during the same period [13].
In addition to anthropogenic emission strength, regional variations in SF6 concentration can also be modulated by atmospheric transport conditions. Patra et al. used an atmospheric general circulation model (AGCM)-based chemistry transport model and continuous observations from multiple sites to systematically investigate the transport mechanisms responsible for synoptic, seasonal, and interannual variations in SF6. Their results indicated that SF6 variability is closely related to atmospheric circulation, advection, convective transport, and vertical diffusion [15]. Zhao et al. investigated the changes in concentrations and potential source regions of greenhouse gases at the Akedala background station in Central Asia from 2009 to 2019 and found that SF6 concentrations showed a significant increasing trend. Their backward trajectory analysis showed that Akedala was strongly influenced by northwesterly airflows in all seasons, while the contribution of air masses from southern Russia increased in summer, which may affect greenhouse gas concentrations at the station [12].
At present, atmospheric SF6 observations in China are mainly based on in situ measurements at background stations, while studies on SF6 remote sensing observations and column concentration variation characteristics remain limited, especially in regions outside atmospheric background stations. The remote sensing measurements provide total column concentrations integrated from the surface to the top of the atmosphere, and are less influenced by local emissions and boundary layer height variations. Therefore, they can better reflect large-scale spatial distribution characteristics and are more suitable for studies of regional greenhouse gas variability and long-term trends. Among ground-based remote sensing techniques, high-resolution Fourier transform infrared (FTIR) spectroscopy retrieves atmospheric trace gas column concentrations by measuring solar mid-infrared spectra, enabling investigations of long-term SF6 column variations and providing a new observational approach for SF6 concentration monitoring. Krieg et al. conducted SF6 column retrievals using ground-based FTIR spectroscopy at several sites, including Ny-Ålesund (79°N), Jungfraujoch (47°N), and Kitt Peak (32°N). The results showed a continuous increase in tropospheric mean SF6 concentrations and have good agreement with simultaneous surface observations [16]. Zhou et al. measured the column concentration of SF6 on Reunion Island in the Indian Ocean based on ground-based FTIR spectroscopy. The growth rate of SF6 from 2004 to 2016 was about 0.265 ± 0.013 ppt yr−1, which was consistent with ground in situ and MIPAS, ACE-FTS satellite observations, indicating that FTIR observations can stably characterize the long-term trend in SF6 [17]. Atmospheric SF6 is mainly distributed near the surface and within the troposphere, but its concentration is very low, with maximum levels of only several to a dozen ppt. The spectral absorption characteristics are very weak, and the absorption bands are affected by multiple interfering gases, making accurate retrieval of SF6 column concentrations challenging.
Although previous studies have reported long-term increases in atmospheric SF6 concentrations and emissions in China, the seasonal variability and high-SF6 events over eastern China remain insufficiently characterized, particularly in terms of their association with regional anthropogenic emissions and atmospheric transport. Hefei is located in the Yangtze River Delta (YRD) region of eastern China, one of the most economically developed regions in China. Rapid expansion of industrial activities and electricity infrastructure has increased anthropogenic SF6 emissions, making this region highly susceptible to the combined influence of regional emissions and atmospheric transport. Therefore, analyzing the temporal variations of SF6 column concentrations over Hefei based on ground-based FTIR observations, together with wind statistics, backward trajectories, and emission inventories, is important for discussing the potential influence regions and transport characteristics of high-SF6 events and for improving our understanding of SF6 variations and their regional influencing factors over eastern China.
To investigate the recent temporal variations and transport characteristics of atmospheric SF6 over this region, this study focuses on FTIR observations during 2023–2025. The solar absorption spectra collected by ground-based high-resolution FTIR spectroscopy were used to retrieve atmospheric SF6 column concentrations over Hefei, and their temporal variation characteristics were analyzed. Furthermore, wind statistics, HYSPLIT backward trajectory analysis, the EDGAR emission inventory, and emission inversion studies based on atmospheric observations were combined to discuss the potential influence regions associated with elevated SF6 concentrations and to evaluate the possible impacts of regional anthropogenic emissions and atmospheric transport on high-SF6 events. Section 2 describes the Hefei ground-based FTIR observation system and the SF6 spectral retrieval method. Section 3 analyzes the temporal variation characteristics of SF6 column concentrations during 2023–2025. Section 4 focuses on the potential influence regions and transport characteristics associated with different seasons and high-value events. Finally, Section 5 presents the conclusions of this study.
2. Materials and Methods
2.1. Observation Site and Instrumentation
The observation is conducted at the Atmospheric Environment Observation Station of the Anhui Institute of Optics and Fine Mechanics, Hefei, China (117.17°E, 31.91°N, 34.5 m above sea level). The ground-based FTIR observation system includes a Bruker IFS 125HR spectrometer, an A547N solar tracker (Bruker Optics GmbH, Ettlingen, Germany), and a Zeno meteorological station (Coastal Environmental Systems, Seattle, WA, USA). Solar absorption spectra in the 700–1350 cm−1 range were recorded with 0.005 cm−1 spectral resolution and 180 cm optical path difference. During clear sky daytime conditions, the rooftop solar tracker precisely tracks the sun, receives solar radiation, and directs it into the indoor spectrometer. Simultaneously with spectral measurements, the rooftop meteorological station continuously records meteorological parameters. Site operation procedures, data acquisition, and data recording follow the data quality requirements of the Network for the Detection of Atmospheric Composition Change (NDACC) [18]. At present, the observation site has been officially incorporated into the standard observation network of the NDACC Infrared Working Group (NDACC-IRWG).
2.2. Retrieval Method and Strategy
SF6 column concentrations were obtained using SFIT4 (v0.9.4.4) with an optimal estimation approach that links observed spectra to atmospheric state parameters [19]. The forward model can be expressed as follows:
where represents the measured spectrum, is the forward model, is the state vector, denotes the model parameters, and represents the measurement error. During the retrieval process, the forward model is linearized, and the Jacobian matrix describing the sensitivity of the measured spectrum to the state vector can be written as follows:
where characterizes the sensitivity of the observed spectrum to changes in atmospheric state parameters at different altitudes. The OEM iteratively minimizes the residual between the measured and simulated spectra. The corresponding cost function is given by the following:
where and represent the measured and simulated spectra, and denotes the measurement error variance.
The a priori atmospheric state parameters required for the retrieval, including temperature, pressure, and H2O profiles, were obtained from the National Centers for Environmental Prediction (NCEP) reanalysis data [20]. The a priori profiles of SF6 and interfering gases were taken from the Whole Atmosphere Community Climate Model (WACCM) v7. Spectral line parameters for SF6 were obtained from the empirical pseudo-line lists (PLL) molecular database developed at NASA Jet Propulsion Laboratory (JPL) based on laboratory transmission spectra, while the spectral line parameters of all other gases were adopted from the HITRAN 2020 database [21]. Because trace gas absorption in the infrared spectral region can be significantly affected by strong absorption gas such as H2O and CO2, an appropriate retrieval window must be selected to ensure a distinct SF6 absorption signature. The spectral region around 947.9 cm−1 (946.5–949.0 cm−1) was chosen for the retrieval. To reduce errors caused by spectral line overlap, interfering gases including H2O, CO2, C2H4, and O3 were simultaneously fitted during the retrieval.
Due to the weak absorption signal and limited information content of SF6, direct retrieval of the vertical profile can easily lead to unrealistic oscillations. In order to improve the stability of the retrieval results, the Tikhonov L1 regularization method was applied to provide a smoothing constraint on the state vector [22,23]. The selection of the regularization parameter α has a significant influence on the retrieval. In this study, the optimal regularization strength was determined by minimizing the error test, and a regularization parameter of 0 was selected to ensure the stability of the retrieval results.
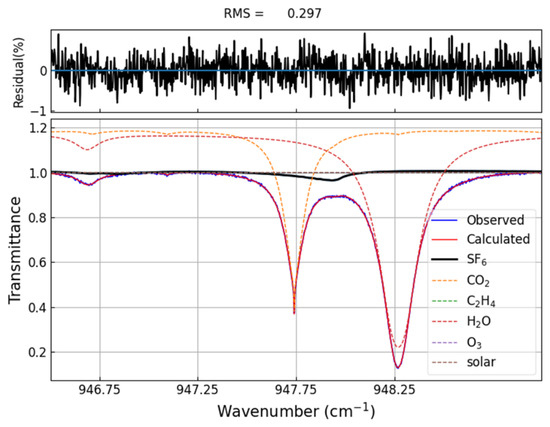
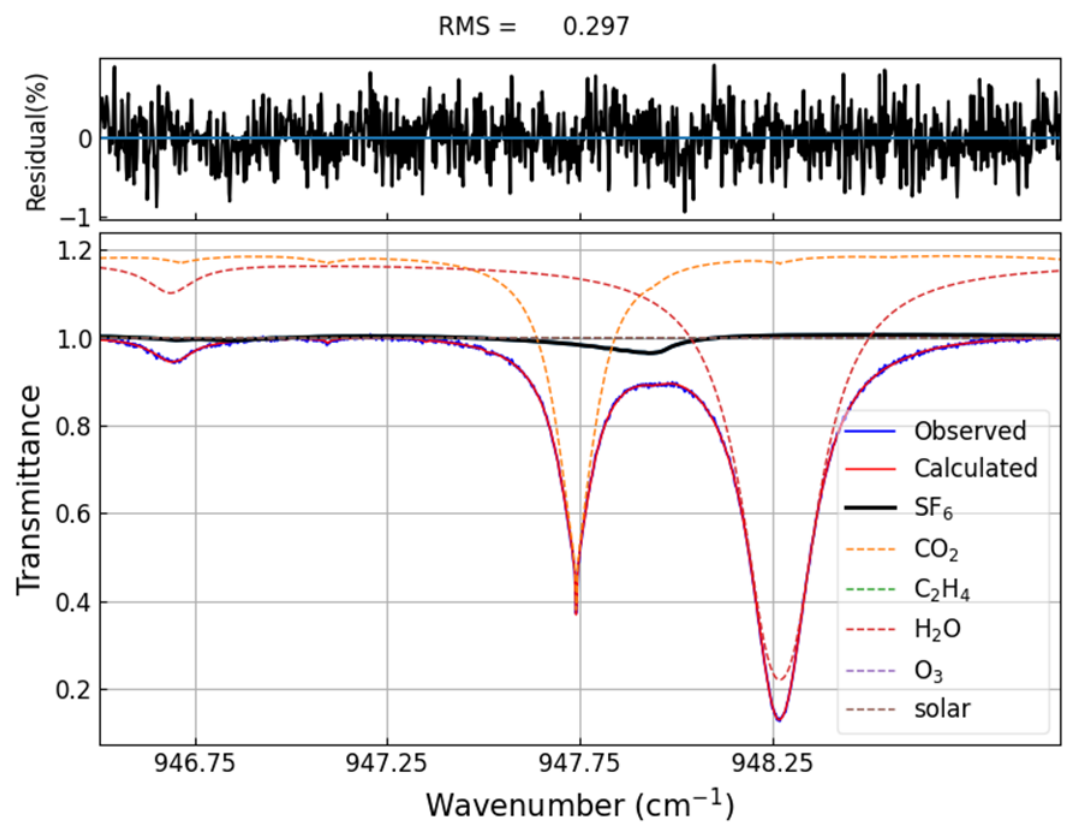
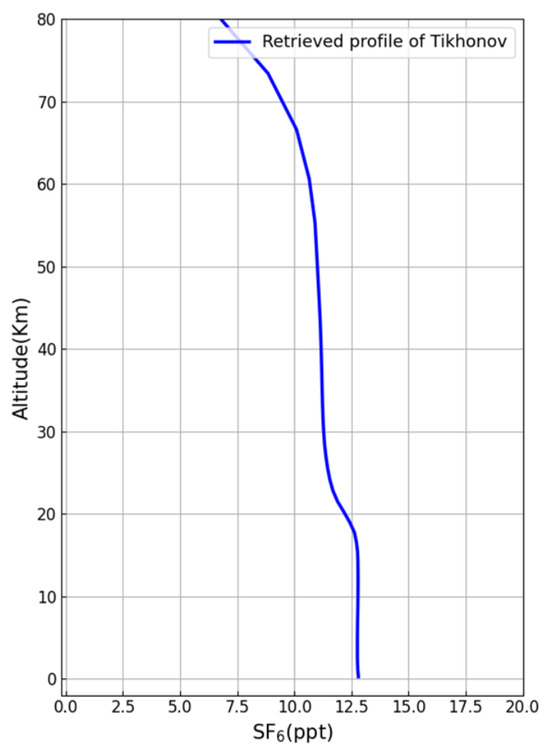
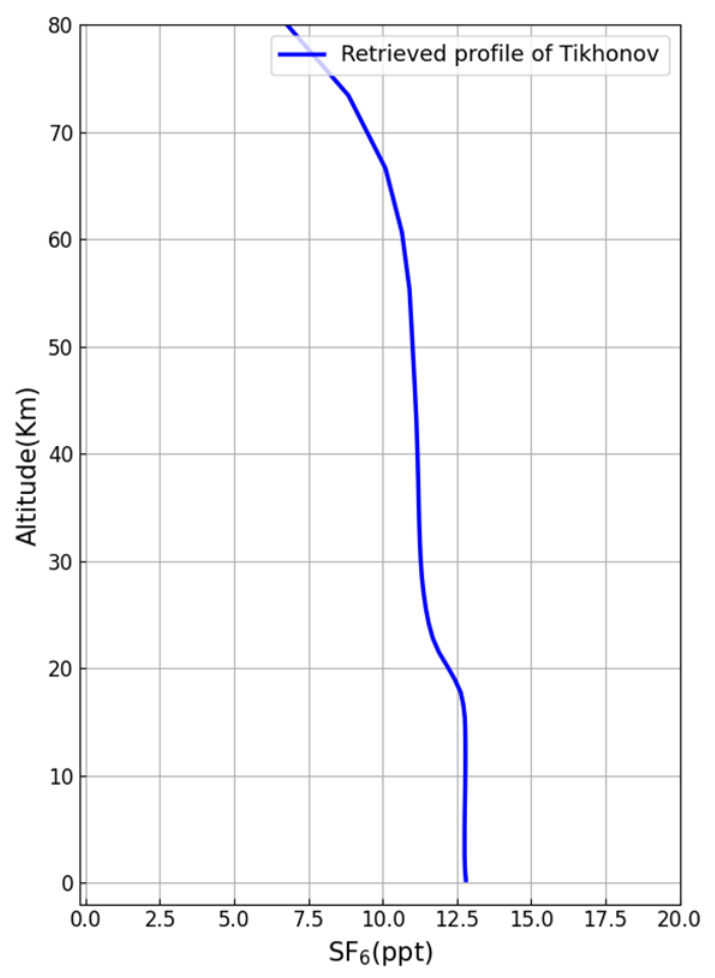
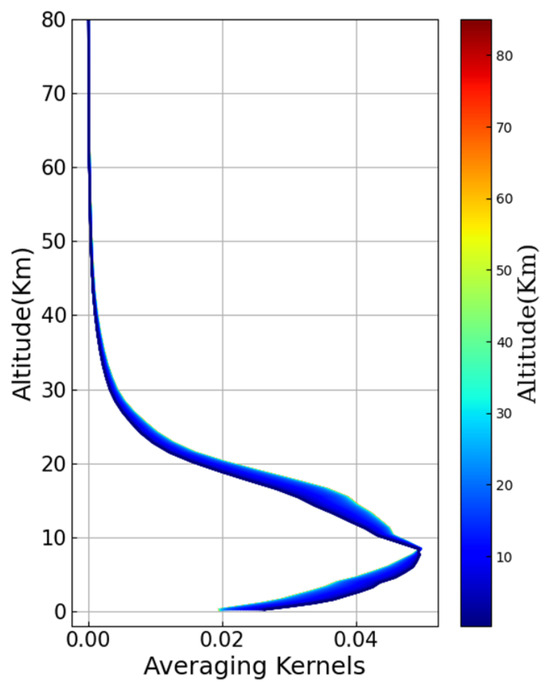
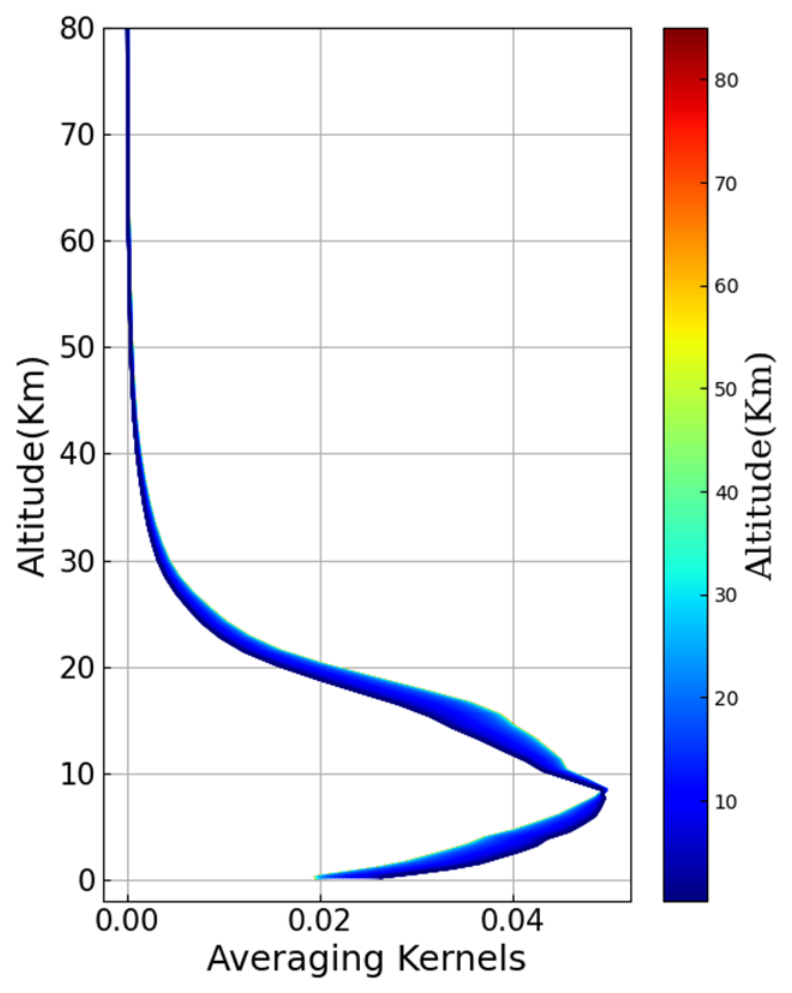
A typical spectrum was selected to evaluate the retrieval strategy. As shown in Figure 1, for the selected spectrum acquired on 18 February 2025 at 03:52:04 UTC, the root mean square (RMS) residual between the measured and fitted spectra was 0.297%, indicating a good spectral fitting result within the selected retrieval window. Figure 2 presents the retrieved SF6 profiles after introducing Tikhonov regularization. When using the OEM retrieval, the retrieved profile exhibited obvious oscillations and unrealistically enhanced concentrations within the troposphere and lower stratosphere. The SF6 absorption signal is weak and the vertical information is limited, so the retrieval results are easily affected by measurement noise. After applying Tikhonov regularization, the retrieved profile became more stable and unrealistic oscillations were significantly reduced, improving the stability of the retrieval results. Figure 3 shows the SF6 averaging kernel matrix after applying Tikhonov regularization. The retrieval exhibits relatively high sensitivity mainly in the troposphere and lower stratosphere, particularly within the altitude range of about 5–12 km. Above 30 km, the sensitivity decreases rapidly, indicating a greater dependence on the a priori profile at higher altitudes. After applying Tikhonov regularization, the degree of freedom for the signal (DOFS) increased from 0.82 to 1.05. This result suggests limited vertical information content in the SF6 retrieval, with the retrieved profiles primarily representing total column variations.
Figure 1.
Spectral fitting of the SF6 in the 946.5–949.0 cm−1 retrieval window, including the fitting residuals and interfering gases.
Figure 2.
Retrieved SF6 profile.
Figure 3.
Averaging kernels for the SF6 retrieval.
2.3. Uncertainty Analysis of Retrieval Results
Observation noise, spectroscopic parameter uncertainties, and the selection of the retrieval strategy all contribute to uncertainty in the SF6 retrieval results. Therefore, uncertainty analysis is important for understanding the influence of different error sources and for evaluating the reliability and accuracy of the results. Based on Rodgers’ posterior error estimation method [24], this study analyzes and evaluates the sources and impacts of retrieval uncertainties using results in 2025. During the retrieval process, a priori covariance matrices were constructed according to the uncertainties of the corresponding prior parameters. The temperature covariance matrix was obtained from the NCEP reanalysis data. The uncertainty of the SF6 spectroscopic parameters was set to 2% based on the empirical pseudo-line list database. The systematic and random uncertainties of the solar zenith angle (SZA) were both set to 3%, while those of the instrumental line shape (ILS) parameters were both assumed to be 5%. The final posterior error estimation results are summarized in Table 1. The systematic uncertainty of the retrieved column was 2.97%. The smoothing error was the largest contributor, with a value of 2.53%. This indicates that limited vertical sensitivity and a priori constraints have a significant influence on the retrieved SF6 columns. Other error sources, including uncertainties in the solar zenith angle, line intensity and instrumental line shape also contributed to the systematic uncertainty. The random uncertainty was 4.09%, mainly contributed by measurement noise and temperature uncertainty, with measurement error and random temperature error of 3.30% and 2.09%, respectively. The total retrieval uncertainty was estimated to be 5.70%. It can be seen that retrieved atmospheric SF6 concentrations in this study have relatively low uncertainties, demonstrating that the adopted spectroscopic parameters and retrieval strategy are reliable.
Table 1.
Error analysis results of SF6 retrieval.
2.4. Time Series Analysis Method
To characterize the seasonal variation and estimate the temporal trend of atmospheric SF6 column concentrations, the observational time series was fitted using a Fourier series. The fitting function is expressed as follows:
where is the intercept, represents the annual trend term, and is the fractional year. The coefficients to correspond to the cosine and sine harmonic terms of the Fourier series describing the seasonal cycle.
3. Results
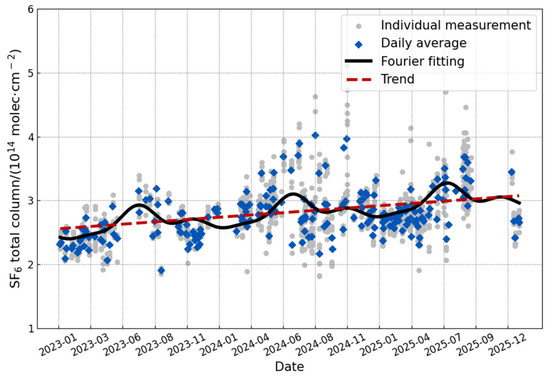
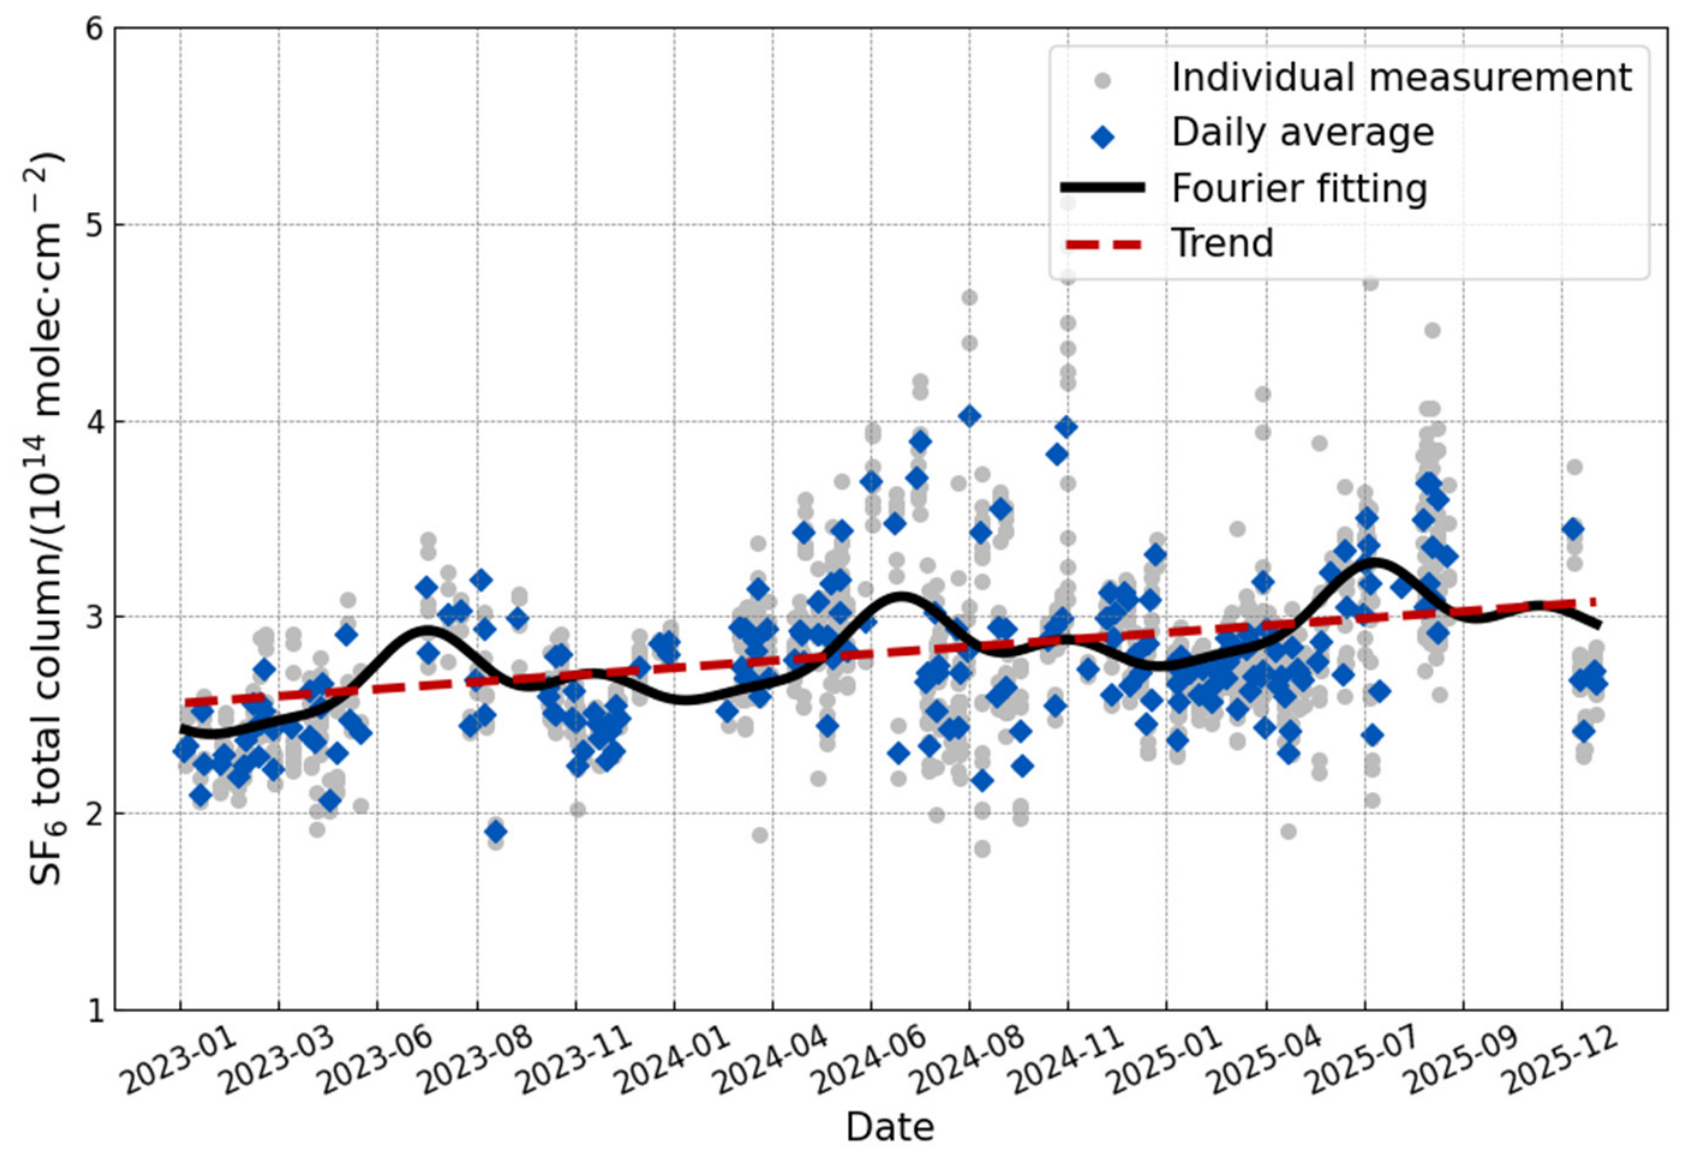
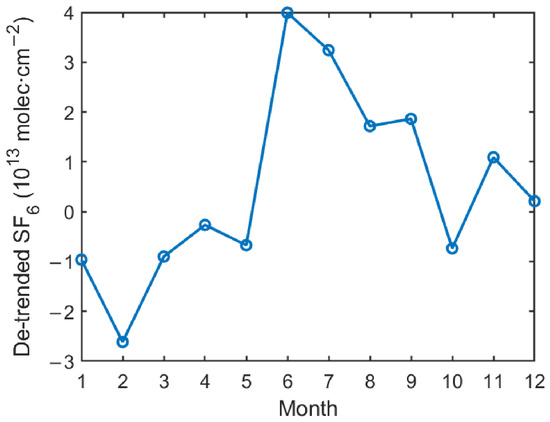
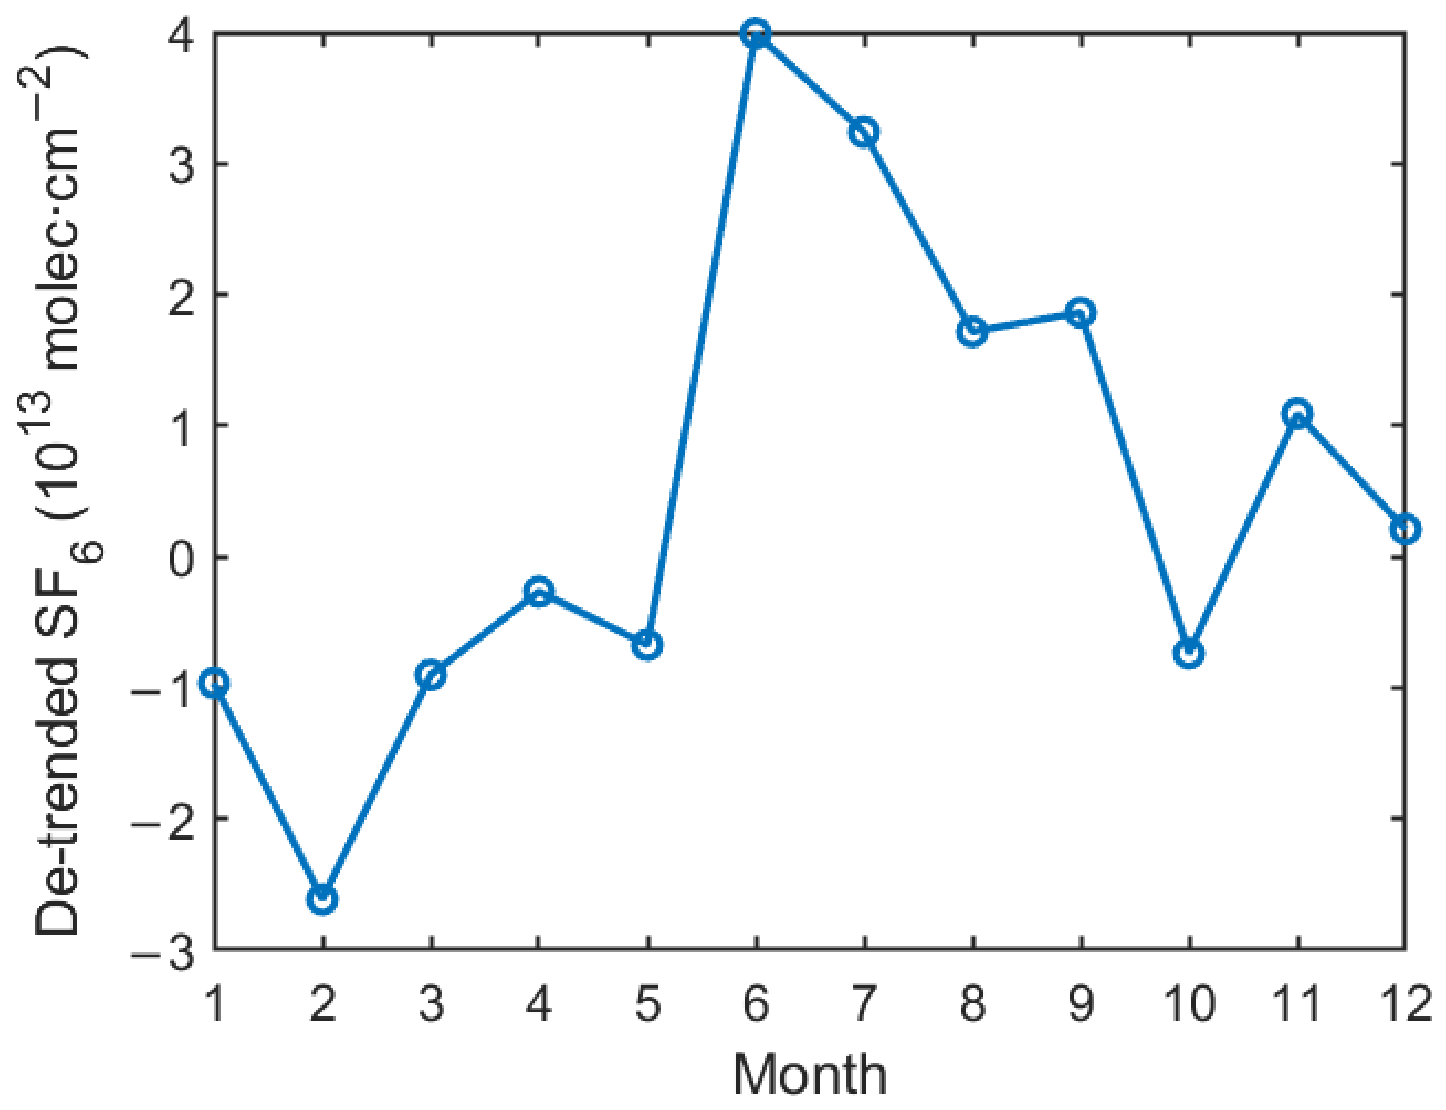
The temporal variations of SF6 column concentrations during 2023–2025 were analyzed using the fitting function described in Section 2.4. Figure 4 presents all individual SF6 column measurements and the calculated daily mean values during 2023–2025. The black solid line represents the Fourier-fitted curve, while the red dashed line denotes the linear fitting trend. The total SF6 column displays a clear seasonal pattern, with peak values in June and July and the lowest values in February. Furthermore, Figure 5 shows the monthly mean variations after removing the annual trend. The monthly values were obtained by subtracting the annual mean of each year from the corresponding monthly mean values, and the difference between the maximum and minimum monthly mean values reached 6.60 × 10¹³ molec·cm−2. This variation may be related to differences in regional atmospheric background, seasonal atmospheric transport processes, and air mass source areas. The evident seasonal cycle indicates that, besides the long-term increase in atmospheric SF6, seasonal atmospheric transport is also likely to influence the observed column concentrations over Hefei. P. K. Patra et al. compared global atmospheric transport model simulations with surface concentration observations and found that, because SF6 is a long-lived greenhouse gas that shows almost no chemical reactions in the atmosphere, its seasonal concentration variations are mainly controlled by atmospheric circulation and regional transport processes [15]. To further investigate this issue, Section 4 will further discuss the high-value SF6 event and seasonal transport characteristics in combination with wind direction statistics and HYSPLIT (Hybrid Single-Particle Lagrangian Integrated Trajectory) backward trajectory analysis.
Figure 4.
Time series of SF6 column concentrations over Hefei.
Figure 5.
Monthly mean detrended SF6 column concentrations over Hefei.
In addition, the average atmospheric SF6 total column observed at the Hefei site during 2023–2025 was 2.80 × 10¹⁴ molec·cm−2, showing an overall increase from 2023 to 2025 with an average annual growth rate of 6.33 ± 0.28% yr−1. In order to directly compare with results from different observation methods, the retrieved total columns were further converted into the dry-air column-averaged mole fraction XSF6. The calculated mean XSF6 at the Hefei site during 2023–2025 was 13.06 ppt, which is close to the annual mean surface concentration of 12.08 ppt measured at the Waliguan and Shangdianzi stations in 2024 [14]. This agreement reflects the relatively uniform distribution of SF6 among different regions as a long-lived greenhouse gas. Meanwhile, the average annual growth rate of at the Hefei site during 2023–2025 was 0.88 ppt yr−1, which is higher than the growth rate of 0.265 ppt yr−1 reported by Zhou et al. at Réunion Island during 2004–2016 [17], the annual growth rate of 0.47 ppt yr−1 observed at NOAA marine background stations in 2025 [7], and the annual growth rates of 0.53–0.45 ppt yr−1 reported at the Waliguan and Shangdianzi stations during 2023–2024 [14,25]. The relatively faster increase in SF6 over the Hefei region may be associated with enhanced emissions caused by recent industrial development in the area. The SF6 growth rate obtained in this study is higher than that reported at background stations and in previous studies, which may be related to the location of the observation site. Hefei is located in the Yangtze River Delta, where intensive industrial activities and extensive electricity infrastructure are associated with relatively high anthropogenic SF6 emissions. Emission inversion studies based on atmospheric observations by Chen et al. also suggested substantial anthropogenic SF6 emissions over southeastern China [26]. Therefore, regional anthropogenic emissions may have contributed to the increase in atmospheric SF6 concentrations over Hefei.
Meanwhile, the WACCM simulations were used for comparison and analysis in this study. As a global climate chemical model designed to investigate atmospheric dynamics, radiation, and chemical processes, the WACCM can provide continuous distributions of atmospheric constituents and their long-term variation trends [27]. In this study, WACCM data were also used to provide the a priori profile information for the retrieval. The WACCM simulation data for the Hefei site consist of monthly vertical SF6 concentration profiles from the surface up to 120 km altitude. The mean total SF6 column simulated by WACCM during 2023–2025 was calculated to be 2.48 × 10¹⁴ molec·cm−2, corresponding to the XSF6 of 11.65 ppt and an annual growth rate of 0.36 ppt yr−1. To further quantitatively evaluate the agreement between the WACCM simulations and FTIR observations, the FTIR retrievals were averaged to monthly means to match the temporal resolution of the WACCM data. The comparison resulted in a correlation coefficient (R) of 0.631, a mean bias (WACCM − FTIR) of −1.485 ppt, and an RMSE of 1.960 ppt. These results indicate that WACCM captures the temporal variability of atmospheric SF6 over Hefei reasonably well but systematically underestimates the observed XSF6. These values are all lower than those observed at the Hefei FTIR site and at the background observations at the Waliguan and Shangdianzi stations, indicating that the WACCM tends to underestimate both the background concentration and the growth rate of atmospheric SF6.
4. Discussion
4.1. Wind Field Characteristics
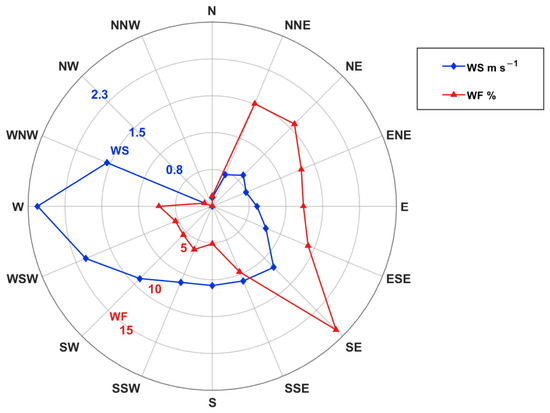
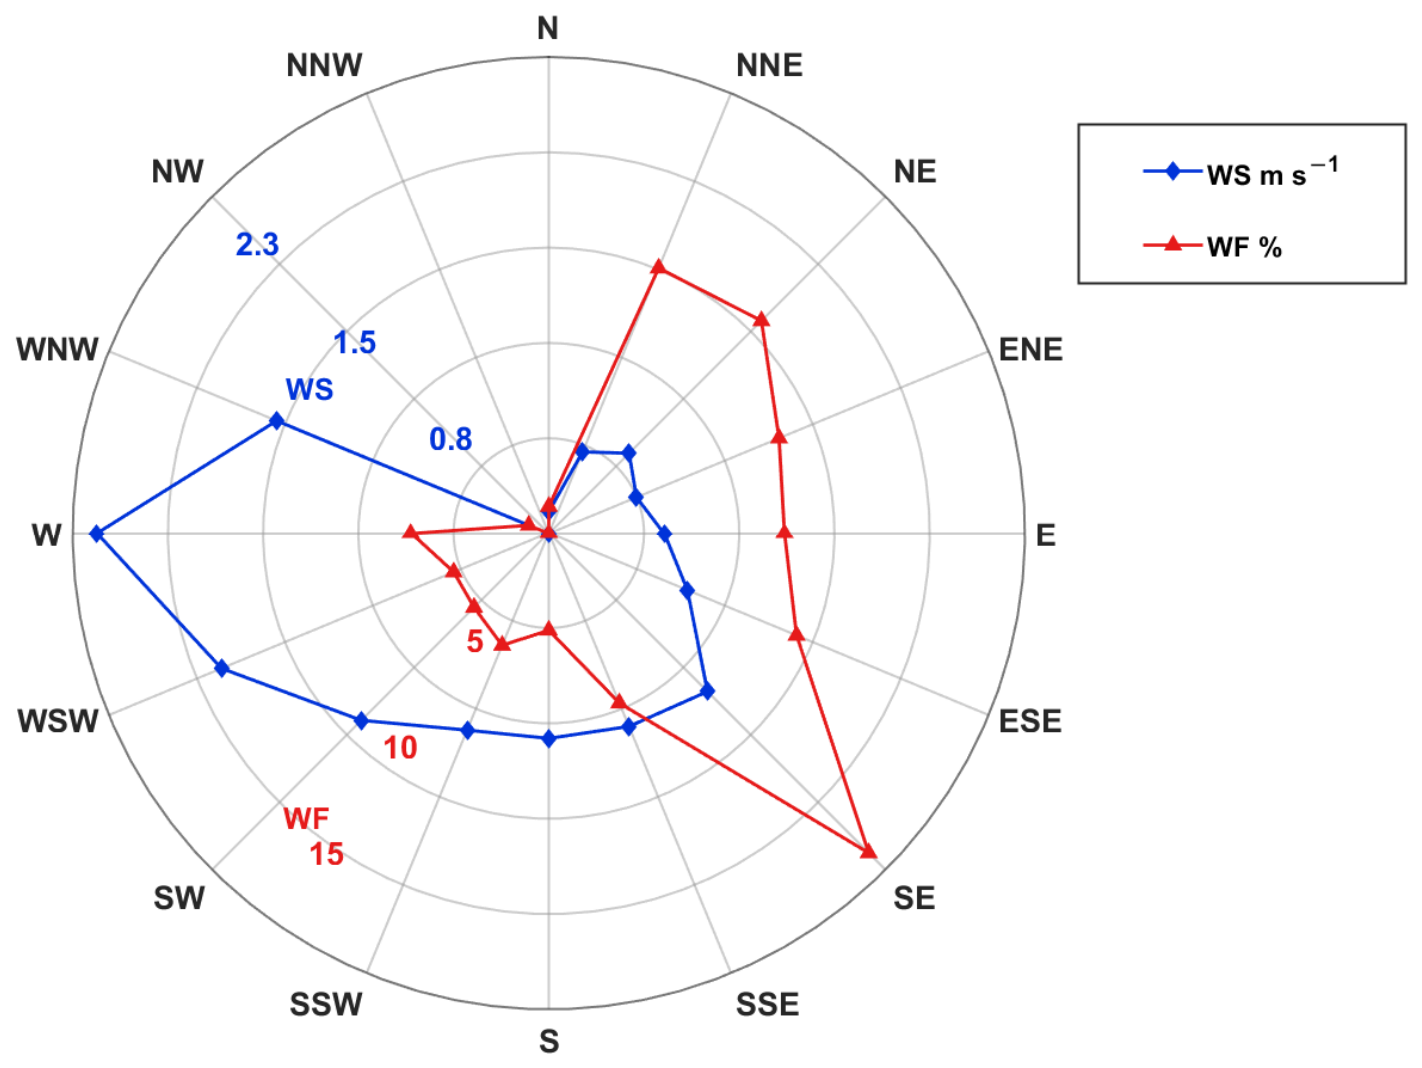
The Hefei ground-based remote sensing site is located in the northwestern suburb of Hefei, about 12 km from the city center. The site is surrounded by water on three sides, with nearby areas consist mainly of forest land, farmland, and grassland, with a relatively open and flat environment. Hefei is located in central Anhui Province and experiences a subtropical monsoon climate, with southeasterly winds prevailing in summer and northeasterly winds in winter. The region is highly industrialized and densely populated, with significant anthropogenic emissions and notable influence from regional atmospheric transport. To analyze the overall wind field characteristics during the SF6 observation period, wind direction and speed distributions were plotted based on synchronous meteorological measurements from 2023 to 2025. In Figure 6, WF represents wind frequency, indicating the frequency ratio of each wind direction and the dominant wind direction, while WS represents wind speed, reflecting the average wind speed under different wind directions. The overall wind direction distribution shows that the wind frequency at the Hefei site is mainly in the direction from southeast (SE) to northeast (NE), with the highest frequency observed for southeast winds (SE). During the study period, the site was mainly influenced by air masses from the east and southeast. In contrast, westerly winds were less frequent, particularly from the northwest (NW) and north (N). Wind speed (WS) exhibits different characteristics, with stronger winds primarily from the west (W), while the winds from the east (E) and northeast (NE) are relatively weaker. Therefore, the wind field at the observation site is characterized by a high frequency of easterly winds and stronger westerly winds.
Figure 6.
Wind characteristics during the SF6 observation period at the Hefei site.
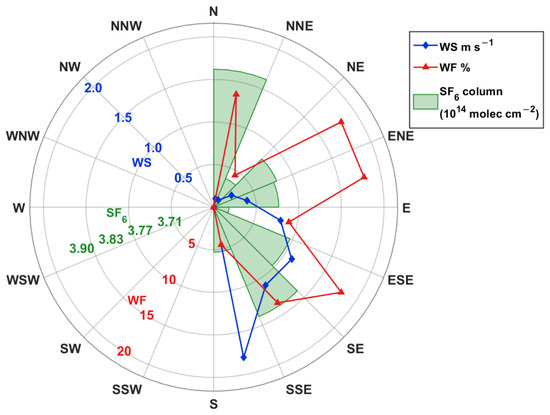
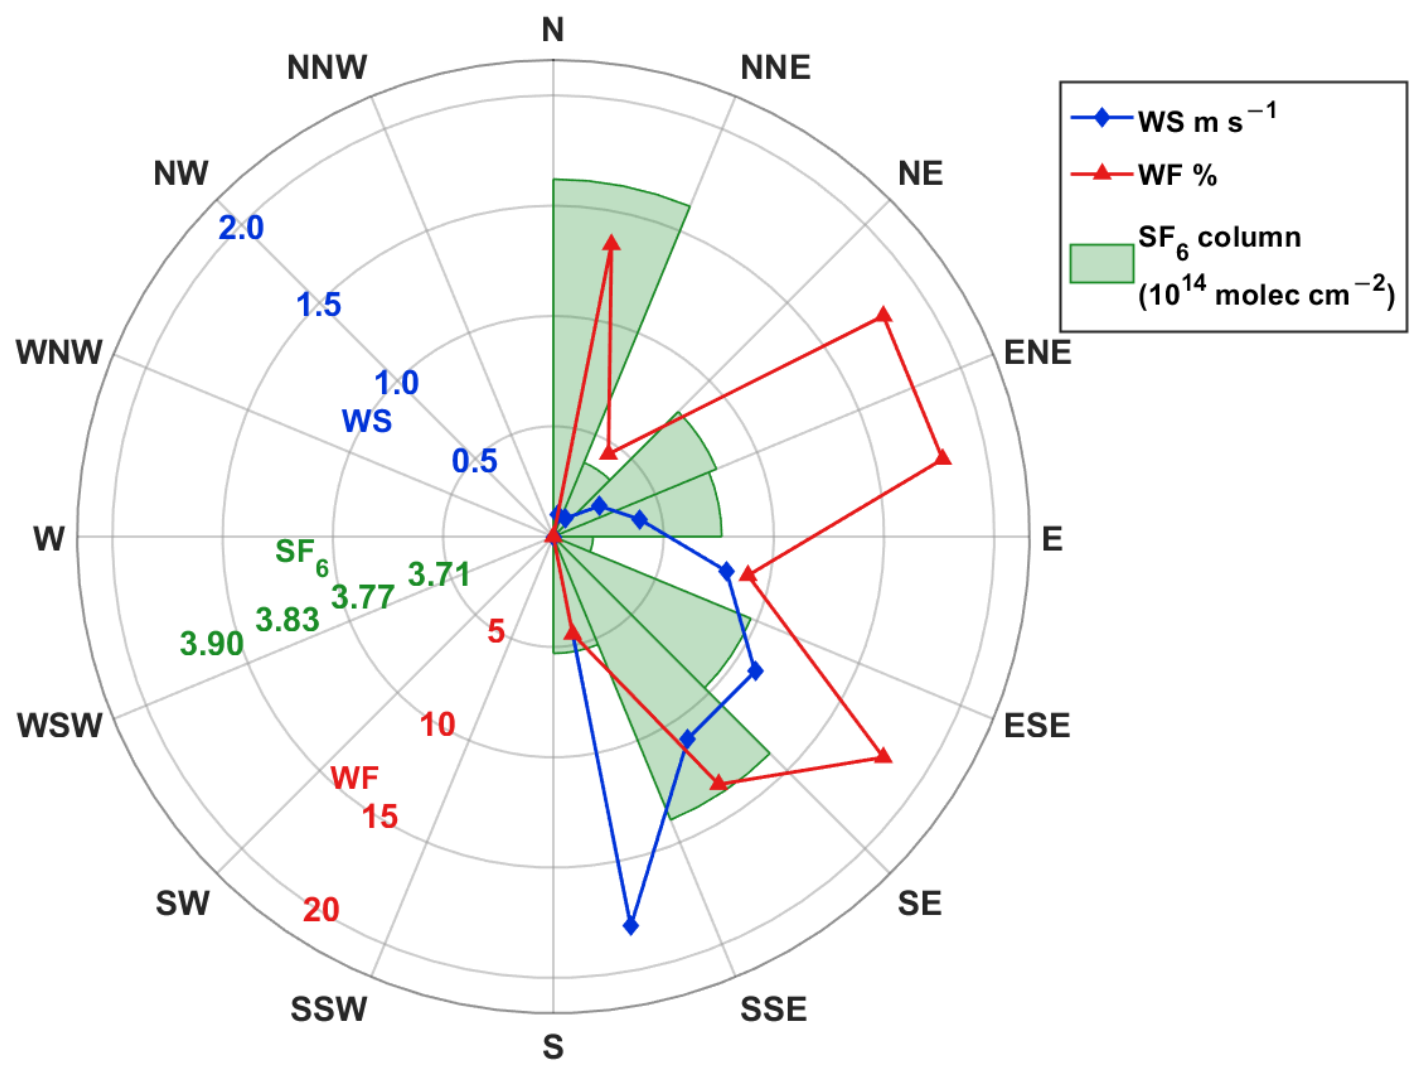
To investigate the wind field conditions associated with high-SF6 events, high-concentration observations were screened in this study. Data points with SF6 concentrations exceeding the mean value plus two standard deviations () in the time series were defined as the high-value data. The wind direction, wind speed data and mean SF6 column concentration were analyzed, as shown in Figure 7. The wind direction distribution during high SF6 periods exhibits clear directional characteristics, with wind frequency (WF) mainly concentrated in the easterly direction. Among these, east-northeast (ENE) and southeast (SE) winds show relatively high frequencies, while westerly winds did not appear, indicating that the high SF6 concentration events were more likely to occur under easterly flow conditions. In addition, the wind speed (WS) distribution shows that relatively strong winds mainly occur from the south (S) and south-southeast (SSE), representing the dominant transport pathways associated with enhanced atmospheric transport, while wind speeds from other directions are comparatively weaker. From the relationship between SF6 column concentration and wind speed, the mean SF6 column concentration was relatively high under northerly (N) winds, but the corresponding wind speed was very low. This suggests that the high-SF6 events under this direction may be related to SF6 accumulation around the observation site caused by limited atmospheric dispersion under weak wind conditions. Relatively high SF6 column concentrations were also observed under south–southeasterly (SSE) winds, where the mean wind speed was relatively high. This indicates that stronger transport conditions from the south-to-southeast sector may have facilitated the transport of regional air masses to the observation site, thereby contributing high-SF6 events. Considering the spatial location of the observation site, the Hefei site is situated to the northwest of the urban area, while the densely populated urban region lies to the east and southeast of the site. Under easterly to southeasterly flow conditions, the potential influence of anthropogenic emissions from the urban area and its surrounding regions on the SF6 column concentrations observed at the site may be enhanced. Overall, high-SF6 events may be associated with both near-regional accumulation and regional transport processes.
Figure 7.
Wind characteristics and SF6 column concentrations with high SF6 at the Hefei site.
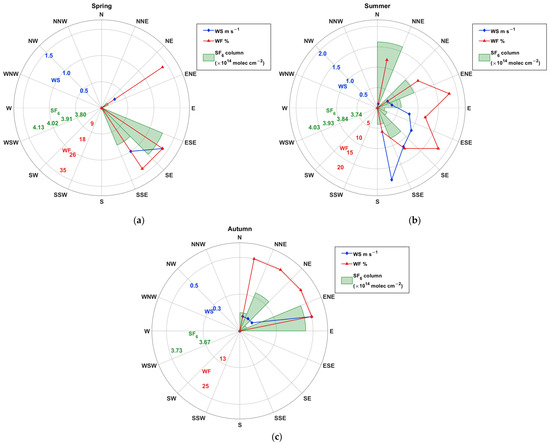
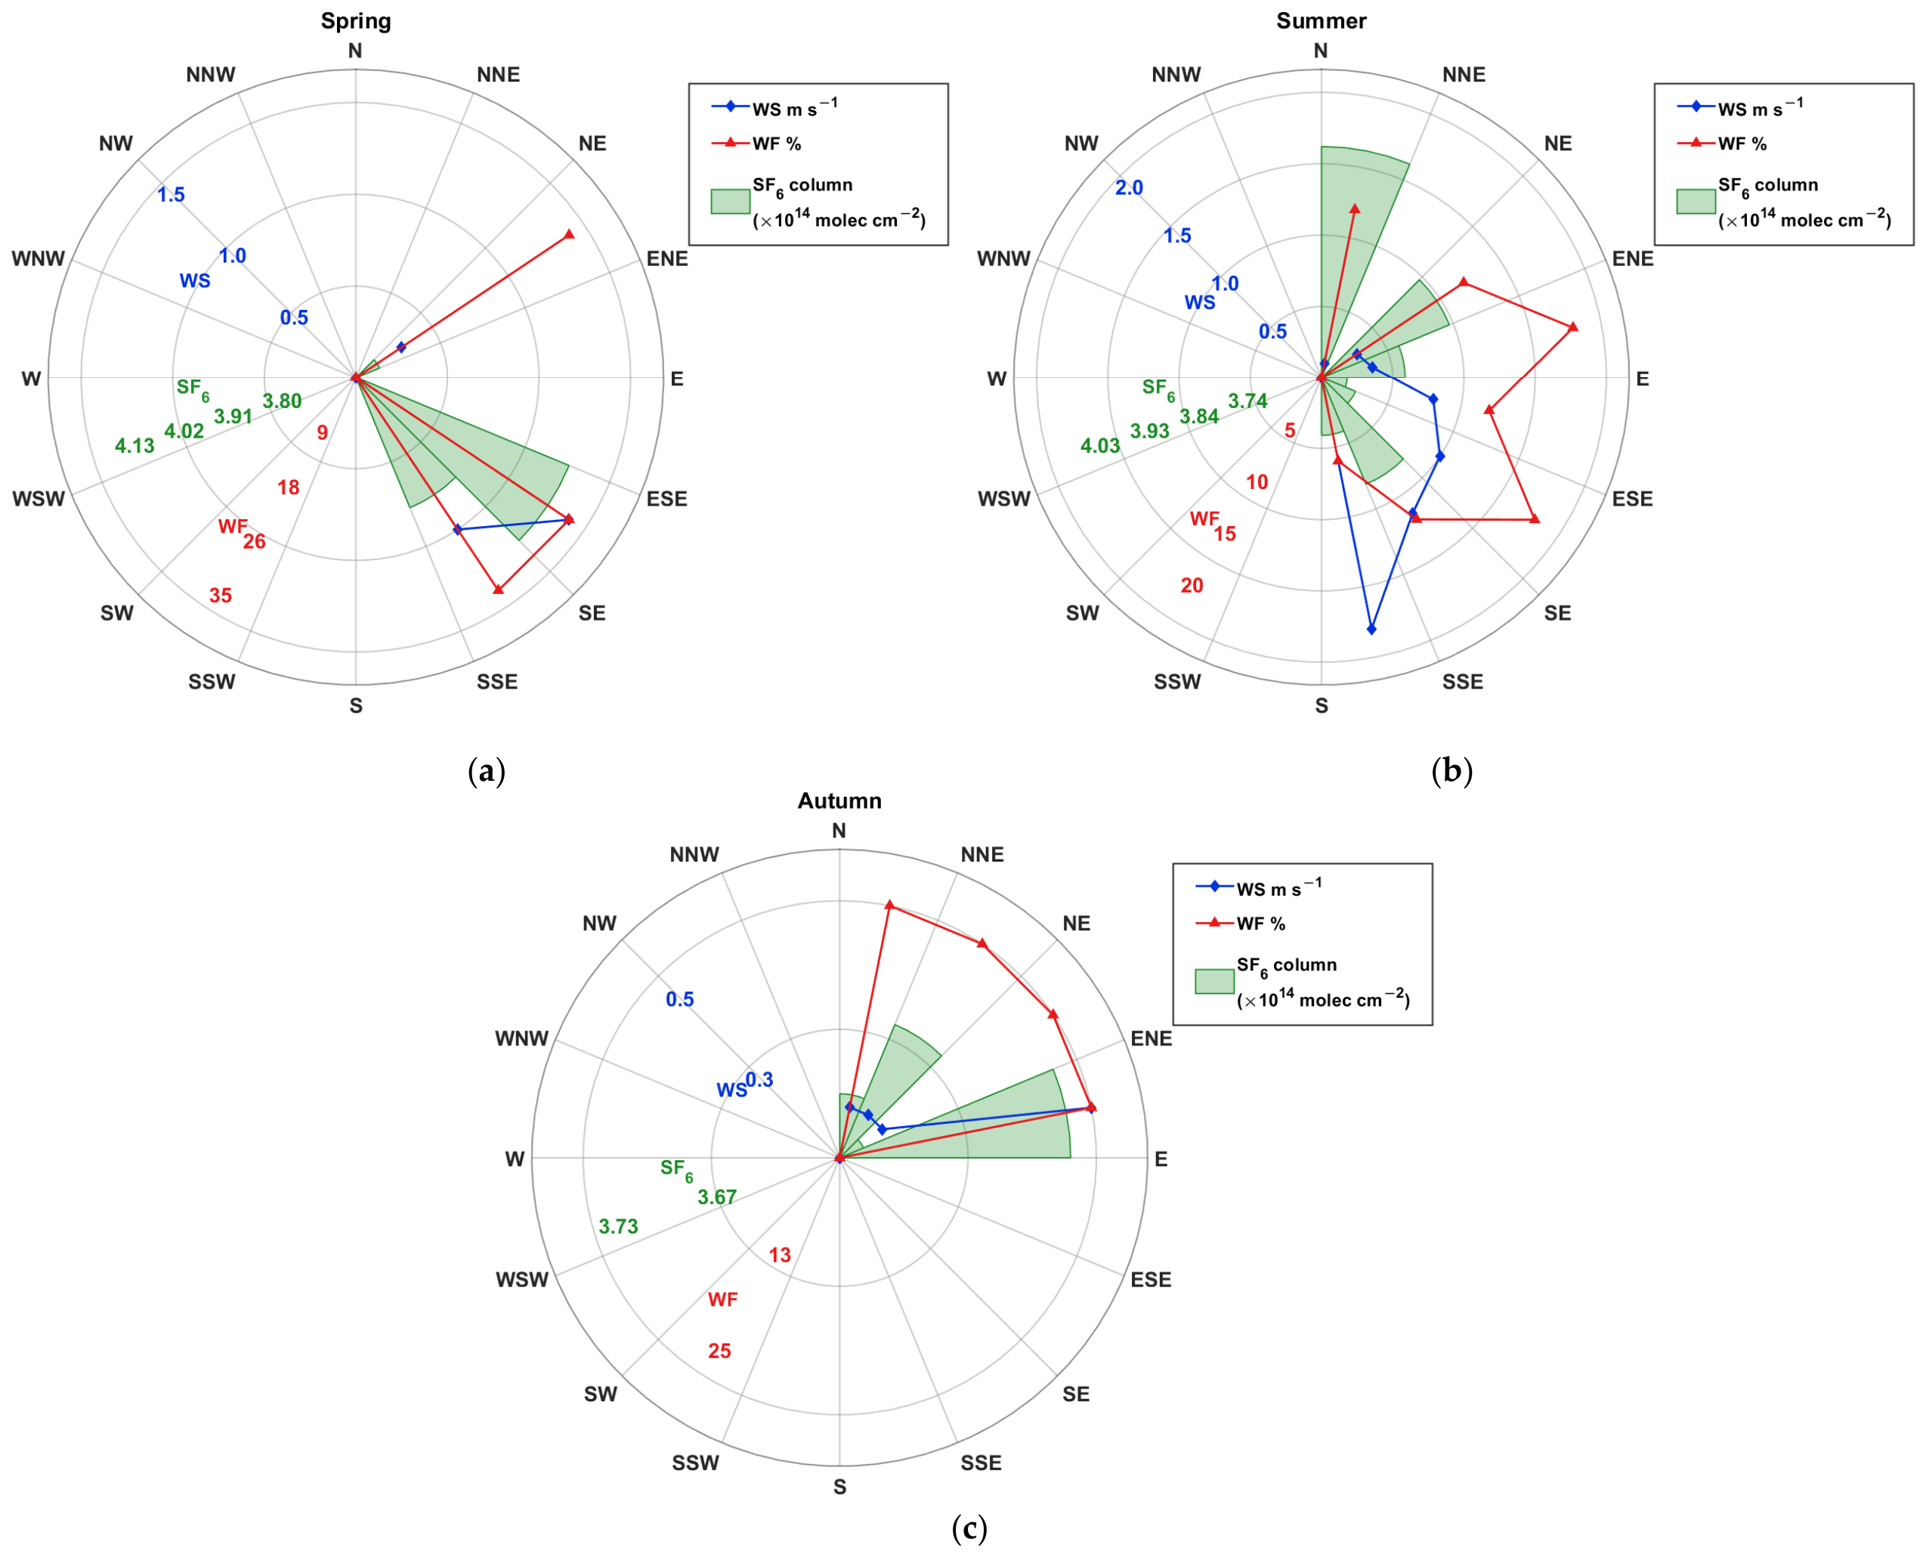
Furthermore, to identify the potential source areas of high SF6 concentrations in different seasons, the high-value observations were analyzed seasonal wind field characteristics and SF6 column concentrations were plotted, as shown in Figure 8. The number of high-value events varies among seasons, with the largest number occurring in summer, followed by autumn and spring, while no high-SF6 events were observed during winter. Therefore, Figure 8 only shows the characteristics of high-value wind fields in spring, summer and autumn.
Figure 8.
Seasonal wind field characteristics and SF6 column concentrations with high SF6 at the Hefei site: (a) spring; (b) summer; (c) autumn.
In spring, high-SF6 events mainly occurred under southeasterly flow conditions. The ESE-to-SSE sector was characterized by relatively high wind frequency and relatively large wind speed. This indicates that spring high-SF6 events were closely related to regional transport conditions from the southeasterly sector. In summer, the wind field and concentration characteristics associated with high-SF6 events were more complex. On the one hand, the N and NNE directions corresponded to relatively high mean SF6 column concentrations but low wind speeds, suggesting that these directions may be related to near-regional SF6 accumulation under weak wind conditions. On the other hand, relatively high SF6 column concentrations were also observed from the E-to-S sector, with relatively large mean wind speeds in the SSE and S directions. This suggests that stronger atmospheric transport conditions from the south-to-southeast sector may have facilitated the transport of regional air masses to the observation site. Therefore, summer high-SF6 events may be influenced by both weak wind accumulation and regional transport processes. In autumn, high-SF6 events were mainly concentrated under northeasterly flow conditions, with relatively high SF6 column concentrations observed in the NE, ENE, and E directions. However, wind speeds in autumn were generally lower than in spring and summer, suggesting that the autumn high SF6 may be related to relatively stable northeasterly flow conditions and weaker atmospheric dispersion.
4.2. Transport Pathways with High-SF6 Events and in Different Seasons
In order to further identify potential source areas and transport pathways for typical high-SF6 events, backward trajectory calculations were performed using the HYSPLIT model for all observation times associated with high SF6 concentrations. In addition, to analyze seasonal differences in background transport conditions, backward trajectory analyses were conducted for observation days in different seasons. HYSPLIT (Hybrid Single-Particle Lagrangian Integrated Trajectory) is a hybrid Lagrangian trajectory model developed by the Air Resources Laboratory (ARL) of the NOAA. It has been widely used in studies of atmospheric transport and dispersion processes. The model can use a variety of meteorological reanalysis data to calculate the complex transmission, diffusion and conversion of atmospheric particles along forward or backward paths in the air, and to identify pollutant transmission paths and source areas, as well as to perform large-scale regional transport analysis [28,29]. In this study, the transport path of contaminated air mass is traced through backward trajectory simulation, and similar trajectories are combined for cluster analysis to identify the main potential influence regions and transport characteristics. The simulation starts from the Hefei site, and the initial altitude is set at 1 km. Meteorological fields were obtained from the Global Data Assimilation System (GDAS) provided by NCEP, with a spatial resolution of 1° × 1°. The backward simulation duration was set to 48 h. The calculated backward trajectories were further classified using the angle–distance clustering method implemented in HYSPLIT. This clustering approach groups trajectories with similar transport pathways, thereby simplifying the large number of trajectories and facilitating the identification of the dominant transport pathways and potential source regions. It should be noted that the vertical degrees of freedom of the FTIR SF6 retrieval are limited, and the retrieval results mainly reflect variations in the total atmospheric column. However, since SF6 primarily originates from anthropogenic surface emissions, lower tropospheric transport plays an important role in transporting surface emissions to the air column above the observation site. In this study, 1 km was selected as the representative starting height for the HYSPLIT backward trajectories to analyze lower tropospheric air mass transport pathways over the Hefei FTIR site.
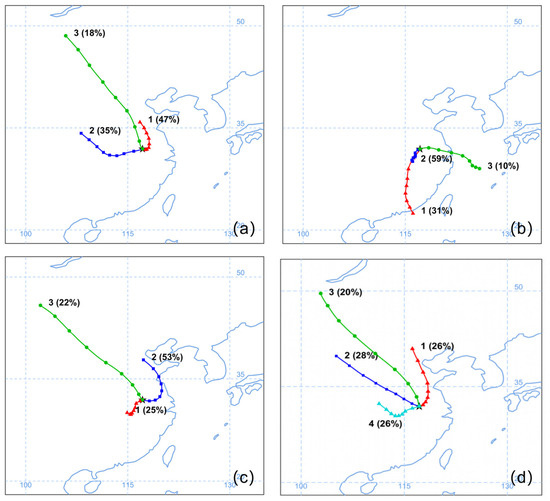
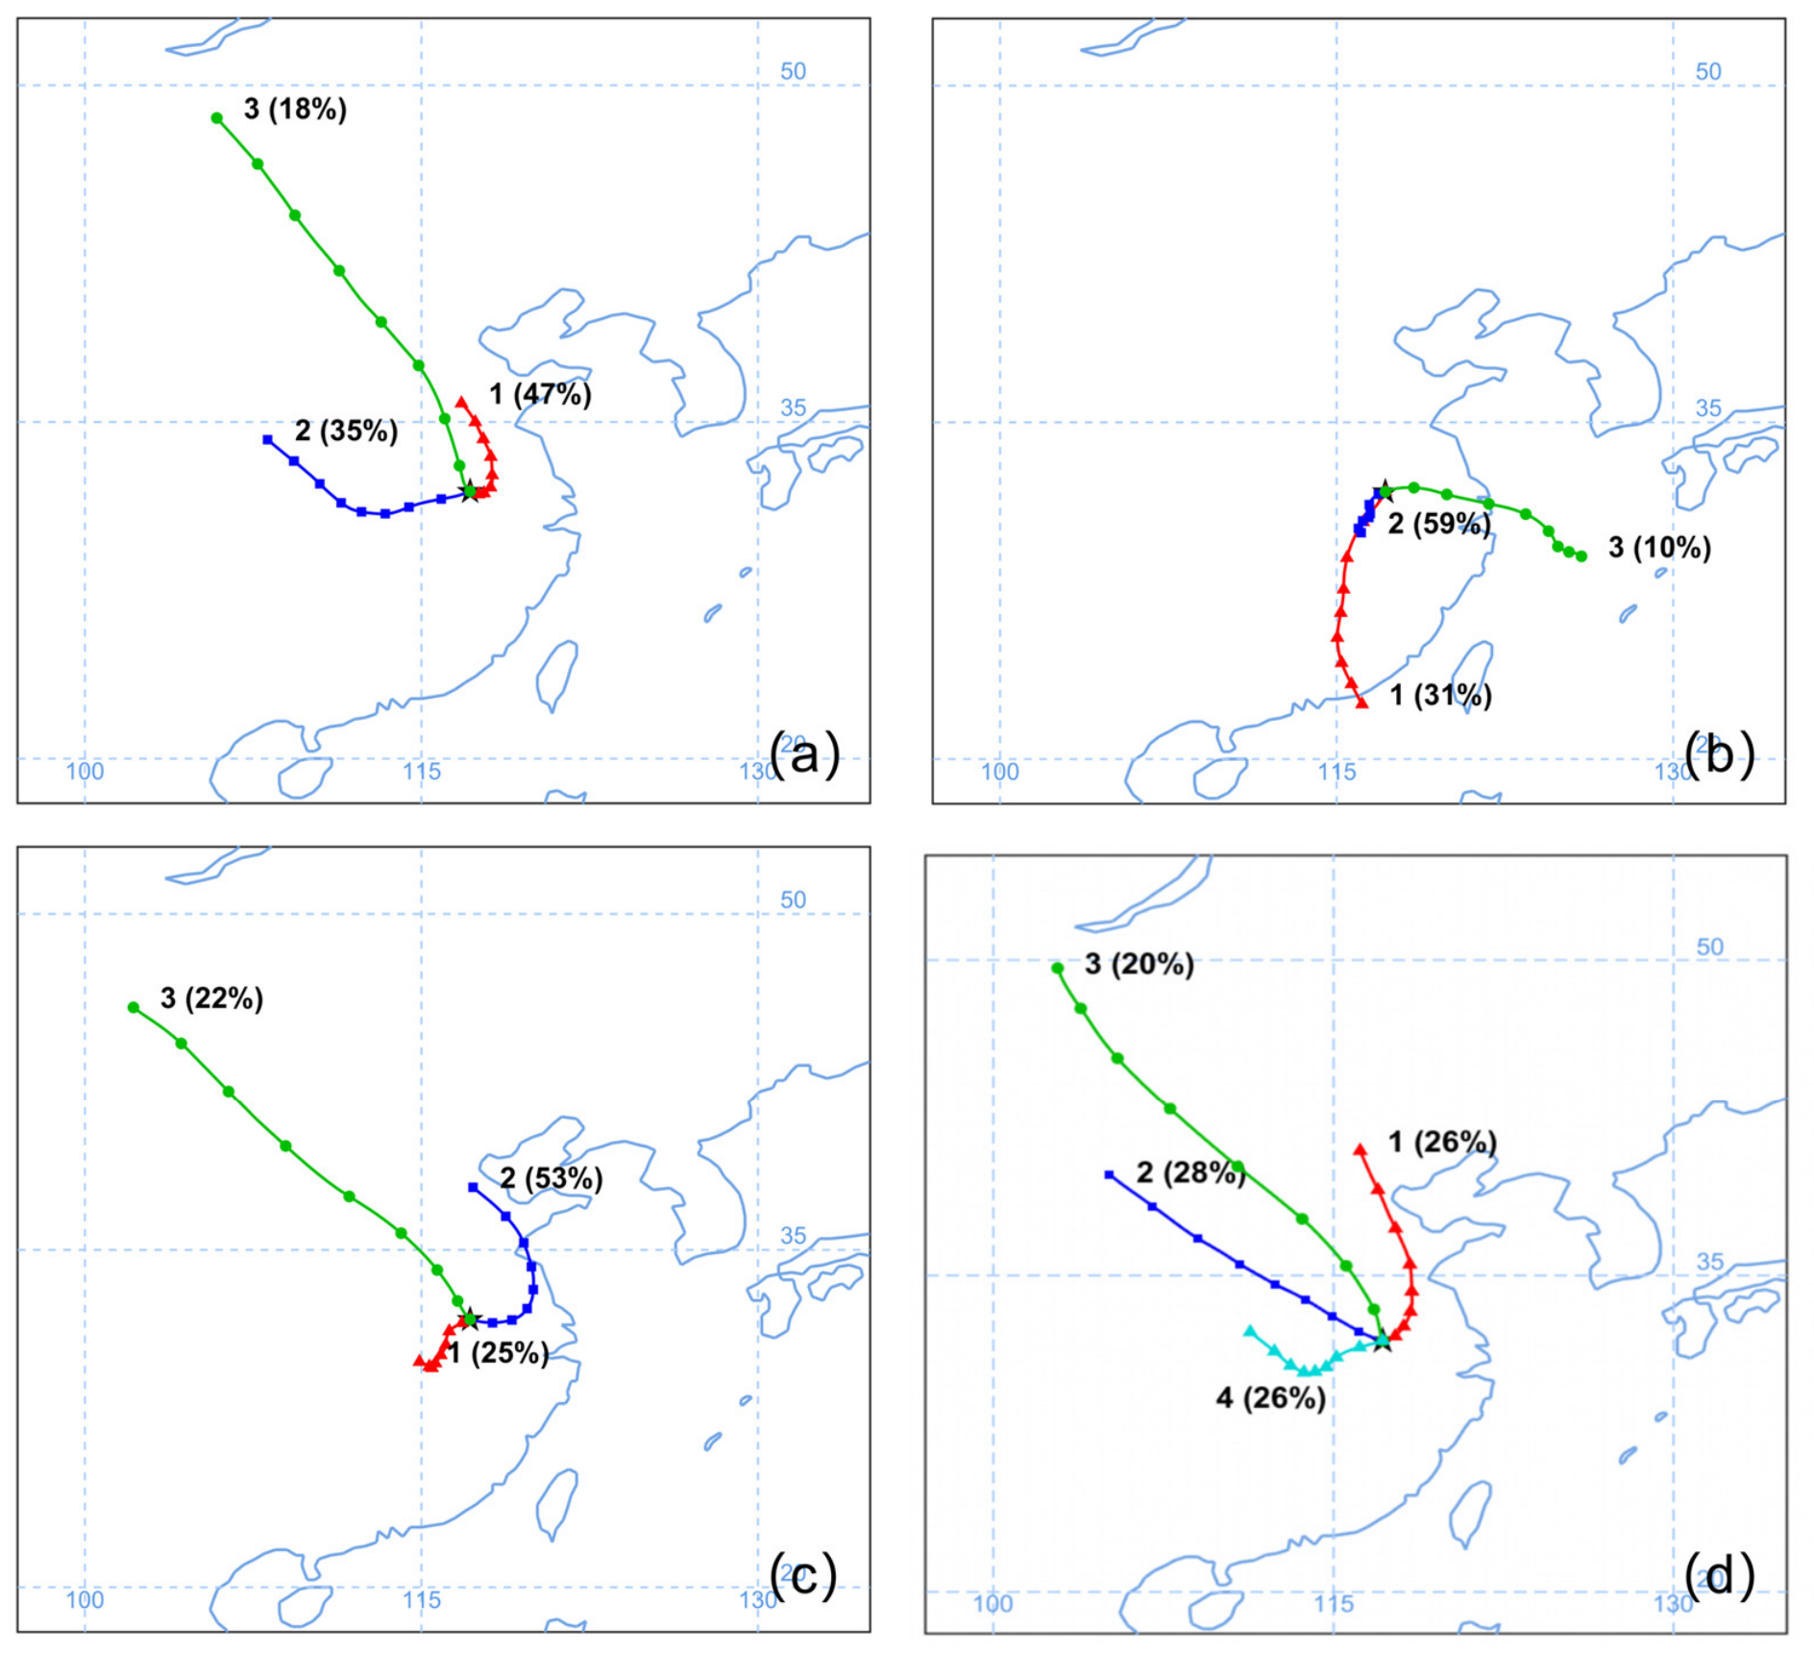
For the seasonal transport analysis, the backward trajectories were initialized at 12:00 local time (04:00 UTC) on each observation day, corresponding to the main FTIR observation period at the Hefei site. Figure 9 shows the clustering results for backward trajectories during SF6 observations in different seasons. In spring (Figure 9a), air masses were mainly transported from the northeast near the site (47%), with additional contributions from long-distance transport originating in the northwest. During summer (Figure 9b), when SF6 concentrations are relatively high, air masses mainly originated from nearby regions to the south of the site (59%), indicating that short-range transport and near-regional accumulation may have played an important role in the summer SF6 enhancement. The far transportation in southern China (31%), as well as the transportation in some eastern coastal areas (10%), shows summer high SF6 may have been jointly influenced by near-regional accumulation and southerly to easterly regional transport. In autumn (Figure 9c), the dominant transport pathways were from the eastern and northeastern coastal regions (53%), followed by nearby southern regional transport (25%) and long-range transport from the northwest (22%). During winter (Figure 9d), when SF6 concentrations were relatively low, multiple transport pathways were distributed from the west, northwest, and northeast of the site, with similar contributions from each direction.
Figure 9.
Backward trajectories of air masses during SF6 observations in different seasons: (a) spring; (b) summer; (c) autumn; (d) winter.
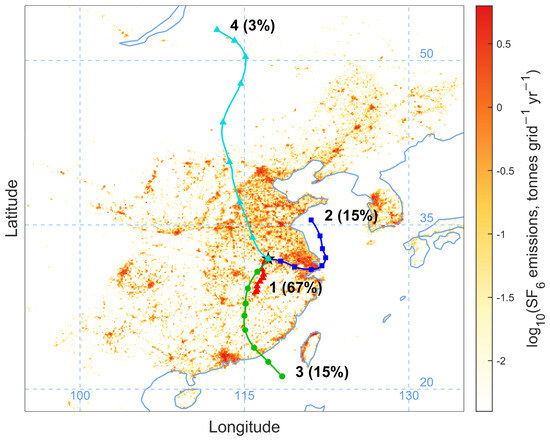
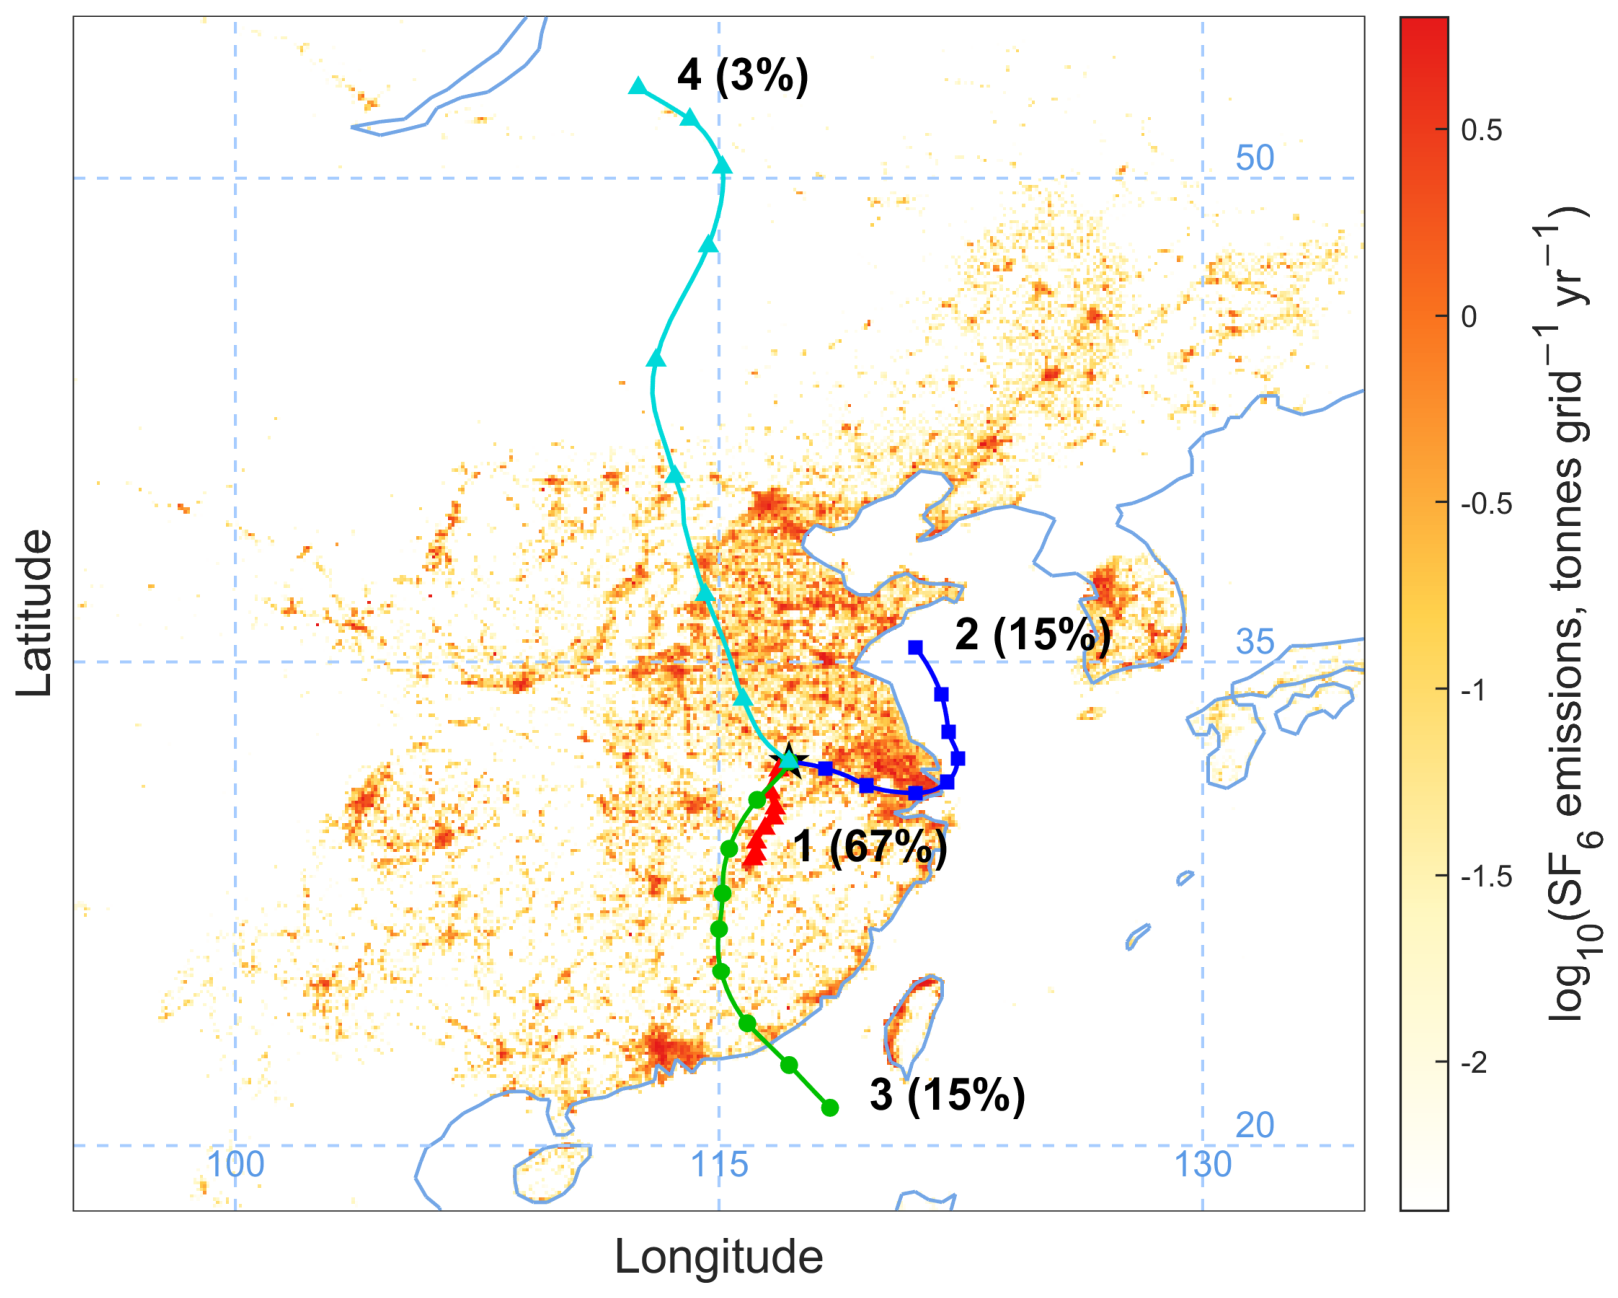
Figure 10 presents the backward trajectories of long-distance air masses during high-SF6 events. For the high-SF6 events analysis, the trajectory arrival time was set according to the corresponding high-SF6 events observation time at an hourly resolution. To examine the spatial relationship between atmospheric transport pathways and potential anthropogenic source regions, the EDGAR 2024 SF6 emission inventory was incorporated into the analysis. EDGAR (Emissions Database for Global Atmospheric Research) is a global anthropogenic emission inventory developed by the Joint Research Centre of the European Commission, providing greenhouse gas emissions as both national totals and gridded spatial distributions. In this study, gridded SF6 emission data with a spatial resolution of 0.1° × 0.1° were used as an independent dataset to provide additional spatial context for interpreting the backward trajectory results during high-SF6 events [30].
Figure 10.
Backward trajectories of air masses during high SF6 with the EDGAR SF6 emissions.
The results indicate that the majority of high-concentration SF6 air masses originate from nearby southern regions of the site (about 67%), passing through southern Anhui Province. About 15% of the air masses come from the east, including the eastern coastal regions of China, passing through southern Jiangsu and eastern Anhui. Another 15% originate from the South China Sea, traveling across southern China and southern Anhui. A small fraction about 3%, is attributed to long-distance transport from northern regions.
The SF6 emission inventory developed by Fang et al. showed that SF6 emissions in China mainly originate from the electrical equipment, magnesium production, semiconductor manufacturing, and SF6 production sectors. Among these sectors, the electrical equipment sector is the dominant source, accounting for approximately 70% of total SF6 emissions in China, whereas the magnesium production, semiconductor manufacturing, and SF6 production sectors each contribute approximately 10% [31]. The EDGAR emission inventory indicates that relatively high SF6 emissions are concentrated in eastern China, particularly in the Yangtze River Delta and its surrounding regions. In addition, Chen et al. estimated SF6 emissions over southeastern China (covering Anhui, Jiangsu, Zhejiang, Shanghai, Jiangxi, Fujian, Guangdong, and Hainan) for 2021–2023 using high-frequency in situ SF6 observations at the Xichong regional background station combined with the FLEXPART transport model and a Bayesian inversion framework. The estimated SF6 emissions in southeastern China were approximately 2.38 Gg yr−1 in 2023, indicating substantial anthropogenic emissions in this region [26]. The wind statistics indicate that high-SF6 events mainly occurred under easterly wind conditions, whereas the HYSPLIT backward trajectory analysis showed that the corresponding air masses mainly originated from nearby regions to the south of Hefei. In particular, the dominant trajectory cluster accounted for 67% of the high-SF6 events and showed relatively short transport pathways, suggesting that near-regional air mass transport and limited dispersion may also have contributed to the accumulation of SF6 around the observation site. These results suggest that regional anthropogenic emissions, near-regional accumulation and atmospheric transport may have jointly contributed to elevated SF6 column concentrations over Hefei.
Considering that the FTIR SF6 retrieval mainly provides column concentration information, backward trajectories initialized at different starting heights were further calculated using HYSPLIT. The trajectories initialized at 5 km and below generally showed similar transport characteristics, mainly indicating transport from the eastern to southern sectors of the site; however, the trajectories initialized at 10 km and above showed relatively large differences. Since SF6 mainly originates from anthropogenic surface emissions, lower and middle tropospheric trajectories are more directly related to the influence of regional surface emissions, whereas upper-level trajectories may more likely reflect the effects of upper-level atmospheric circulation, vertical mixing, and stratosphere–troposphere exchange on the column concentration. However, due to the lack of SF6 vertical profile observations and related meteorological diagnostic data, it is difficult to determine the specific contributions of transport processes at different altitude layers to the column concentration variations. Therefore, the HYSPLIT results in this study are mainly used to help identify the low-level transport directions and potential influence regions that may be affected by surface emissions during high-SF6 events.
5. Conclusions
In this study, atmospheric SF6 column concentrations during 2023–2025 were retrieved using mid-infrared solar absorption spectra measured by ground-based high-resolution FTIR spectroscopy at the Hefei site. The seasonal variation characteristics and recent trends of SF6 were analyzed, and the influence regions and transport characteristics of high-SF6 events were further investigated through wind statistics and HYSPLIT backward trajectory cluster analysis.
For SF6 spectral retrieval, the spectral window of 946.5–949.0 cm−1 was selected. To improve the stability of the retrieval results and suppress the influence of noise on the retrieved profiles, the Tikhonov L1 regularization method was introduced to reduce profile oscillations. The uncertainty analysis showed that the total retrieval uncertainty of the SF6 column concentrations was approximately 5.70%, with smoothing error, measurement error, and temperature error representing the major contributions. Based on the observational time series, the variations in SF6 column concentrations over Hefei during 2023–2025 were analyzed. The results showed that higher concentrations mainly occurred in summer, while lower concentrations appeared in winter. In addition, the SF6 column concentrations exhibited an overall increasing trend in three years, with an average total column concentration of 2.80 × 10¹⁴ molec·cm−2 and an average annual growth rate of 6.33 ± 0.28% yr−1. The dry-air column-averaged mole fraction XSF6 was further calculated from the retrieved total column concentrations, yielding an average annual growth rate of 0.88 ppt yr−1 during 2023–2025. Comparison with observations at other sites showed that the XSF6 values at the Hefei site were close to the annual mean surface concentrations measured at the Waliguan and Shangdianzi background stations in 2024, whereas the annual growth rate at Hefei was higher than observed at the two background stations. Comparisons with SF6 simulations from the WACCM further indicated that both the simulated dry-air mole fraction and annual growth rate were lower than the background observations at the Hefei, Waliguan, and Shangdianzi stations, suggesting that the WACCM generally underestimates the background concentration and growth trend of atmospheric SF6.
High-SF6 events at the Hefei site were identified using a threshold of the mean value plus two standard deviations. The results showed that high-value SF6 events mainly occurred in summer, followed by autumn and spring, while no high-value events were observed in winter. Wind statistics indicated that high SF6 concentrations were mainly associated with winds from the northeast to southeast directions, suggesting that easterly to southeasterly flow may have favored the occurrence of high-SF6 events. Further HYSPLIT backward trajectory cluster analysis revealed that the majority of high-concentration air masses originated from nearby southern transport pathways, accounting for approximately 67%, indicating that short-range transport and near-regional accumulation may have contributed to the observed enhancements. In addition, long-distance transport pathways from eastern China, the eastern coastal regions, and southern China were also identified. Seasonal transport analyses further demonstrated that air mass origins differed among seasons. In particular, summer, when relatively high SF6 concentrations were observed, exhibited more pronounced transport influences from nearby southern air masses and regional transport from southern to eastern sectors, whereas other seasons showed greater contributions from long-range transport originating from northern and northwestern regions. Wind statistics mainly reflect local wind field conditions near the observation site during high-value events, while backward trajectories describe the regional transport pathways of air masses before arriving at the site. Together, these analyses reveal the transport characteristics associated with high-SF6 events. Overall, regional anthropogenic emissions over eastern and southeastern China, together with short-range transport, near-regional accumulation, and atmospheric transport processes, may have jointly contributed to elevated SF6 column concentrations over Hefei. These findings provide observational evidence for understanding the variation characteristics of atmospheric SF6 column concentrations, the potential influencing regions of high-value events, and the influence of regional transport processes over Hefei.
This study still has some limitations. Since the vertical degrees of freedom of FTIR SF6 retrieval are limited, the retrieval results mainly reflect column concentration variations, while wind statistics and HYSPLIT backward trajectories are mainly used to characterize lower tropospheric transport processes. Therefore, the interpretation of vertical transport processes and their relationship with column concentration variations remains limited. Future studies combining in situ SF6 observations and higher resolution emission data would help improve the reliability of regional SF6 source identification and transport interpretation.
Author Contributions
Resources, W.W.; data curation, X.L., S.W. and B.L.; methodology, X.Z., W.W. and C.S.; writing—original draft preparation, X.Z.; visualization, X.L.; writing—review and editing, W.W. and C.S.; funding acquisition, W.W. All authors have read and agreed to the published version of the manuscript.
Funding
This research was funded by the Institute of Environment, Hefei Comprehensive National Science Center Research Project ‘Hyperspectral Global Total Carbon Column Observation Station’ (Grant No. HYSYPT2024001), and the Institute of Environment, Hefei Comprehensive National Science Center Research Project ‘Hyperspectral Intelligent Sensing Technology Innovation Team’ (Grant No. HYKYTD2024001).
Data Availability Statement
The raw data supporting the conclusions of this article will be made available by the authors on request.
Acknowledgments
We gratefully acknowledge Nicholas Jones, Wollongong University, for guidance on spectroscopy retrieval. We are grateful to the NDACC networks for providing information and advice on SFIT software (SFIT4 v0.9.4.4).
Conflicts of Interest
The authors declare no conflicts of interest.
References
- Smith, C.; Nicholls, Z.R.J.; Armour, K.; Collins, W.; Forster, P.; Meinshausen, M.; Palmer, M.D.; Watanabe, M. The Earth’s Energy Budget, Climate Feedbacks, and Climate Sensitivity Supplementary Material. In Climate Change 2021: The Physical Science Basis; Masson-Delmotte, V., Zhai, P., Pirani, A., Connors, S.L., Péan, C., Berger, S., Caud, N., Chen, Y., Goldfarb, L., Gomis, M.I., et al., Eds.; Cambridge University Press: Cambridge, UK, 2021; Available online: https://www.ipcc.ch/ (accessed on 10 May 2026).
- Simmonds, P.G.; Rigby, M.; Manning, A.J.; Park, S.; Stanley, K.M.; McCulloch, A.; Henne, S.; Graziosi, F.; Maione, M.; Arduini, J.; et al. The increasing atmospheric burden of the greenhouse gas sulfur hexafluoride (SF6). Atmos. Chem. Phys. 2020, 20, 7271–7290. [Google Scholar] [CrossRef] [Scilit]
- Dentener, F.J.; Hall, B.; Smith, C. Annex III: Tables of Historical and Projected Well-Mixed Greenhouse Gas Mixing Ratios and Effective Radiative Forcing of All Climate Forcers. In Climate Change 2021: The Physical Science Basis; Masson-Delmotte, V., Zhai, P., Pirani, A., Connors, S.L., Péan, C., Berger, S., Caud, N., Chen, Y., Goldfarb, L., Gomis, M.I., et al., Eds.; Cambridge University Press: Cambridge, UK; New York, NY, USA, 2021; pp. 2139–2152. [Google Scholar] [CrossRef] [Scilit]
- Ravishankara, A.R.; Solomon, S.; Turnipseed, A.A.; Warren, R.F. Atmospheric Lifetimes of Long-Lived Halogenated Species. Science 1993, 259, 194–199. [Google Scholar] [CrossRef] [Scilit] [PubMed]
- Ray, E.A.; Moore, F.L.; Elkins, J.W.; Rosenlof, K.H.; Laube, J.C.; Röckmann, T.; Marsh, D.R.; Andrews, A.E. Quantification of the SF6 lifetime based on mesospheric loss measured in the stratospheric polar vortex. J. Geophys. Res. Atmos. 2017, 122, 4626–4638. [Google Scholar] [CrossRef] [Scilit]
- Lovelock, J.E. Atmospheric Fluorine Compounds as Indicators of Air Movements. Nature 1971, 230, 379. [Google Scholar] [CrossRef] [Scilit]
- Lan, X.; Thoning, K.W.; Dlugokencky, E.J. Trends in Globally Averaged CH4, N2O, and SF6 Determined from NOAA Global Monitoring Laboratory Measurements, Version 2026-03. Available online: https://gml.noaa.gov/ccgg/trends_doi.html (accessed on 10 May 2026).
- Tuğba Önder, G. Comparative time series analysis of SARIMA, LSTM, and GRU models for global SF6 emission management system. J. Atmos. Sol.-Terr. Phys. 2024, 265, 106393. [Google Scholar] [CrossRef] [Scilit]
- De Longueville, H.; Clarisse, L.; Whitburn, S.; Clerbaux, C.; Lecomte, G.; Coheur, P. Atmospheric trends of long-lived halogenated gases derived from 15 years of IASI measurements. J. Quant. Spectrosc. Radiat. Transf. 2023, 311, 108755. [Google Scholar] [CrossRef] [Scilit]
- Zhang, L.; Jin, M.; Liu, Y.; Liang, X.; Yang, S.; Xian, Y. Concentration Variation Characteristics of Atmospheric Greenhouse Gases at Waliguan and Shangdianzi in China. Earth Sci. 2021, 46, 2984–2998. [Google Scholar]
- Yao, B.; Zhou, L.; Xia, L.; Zhang, G.; Guo, L.; Liu, Z.; Fang, S. Atmospheric sulfur hexafluoride in-situ measurements at the Shangdianzi regional background station in China. J. Environ. Sci. 2014, 26, 2451–2458. [Google Scholar] [CrossRef] [Scilit] [PubMed]
- Zhao, Z.; Lu, Z.; He, Q.; Zhao, Q.; Wang, J. Characteristics and source analysis of greenhouse gas concentration changes at Akedala Station in Central Asia. Theor. Appl. Climatol. 2022, 149, 1813–1825. [Google Scholar] [CrossRef] [Scilit]
- An, M.; Prinn, R.G.; Western, L.M.; Zhao, X.; Yao, B.; Hu, J.; Ganesan, A.L.; Mühle, J.; Weiss, R.F.; Krummel, P.B.; et al. Sustained growth of sulfur hexafluoride emissions in China inferred from atmospheric observations. Nat. Commun. 2024, 15, 1997. [Google Scholar] [CrossRef] [Scilit] [PubMed]
- China Meteorological Administration. China Greenhouse Gas Bulletin 2024. 2025. Available online: https://www.cma.gov.cn/zfxxgk/gknr/qxbg/202601/t20260116_7545762.html (accessed on 10 May 2026).
- Patra, P.K.; Takigawa, M.; Dutton, G.S.; Uhse, K.; Ishijima, K.; Lintner, B.R.; Miyazaki, K.; Elkins, J.W. Transport mechanisms for synoptic, seasonal and interannual SF6 variations and “age” of air in troposphere. Atmos. Chem. Phys. 2009, 9, 1209–1225. [Google Scholar] [CrossRef] [Scilit]
- Krieg, J.; Nothholt, J.; Mahieu, E.; Rinsland, C.P.; Zander, R. Sulphur hexafluoride (SF6): Comparison of FTIR-measurements at three sites and determination of its trend in the northern hemisphere. J. Quant. Spectrosc. Radiat. Transf. 2005, 92, 383–392. [Google Scholar] [CrossRef] [Scilit]
- Zhou, M.; Langerock, B.; Vigouroux, C.; Wang, P.; Hermans, C.; Stiller, G.; Walker, K.A.; Dutton, G.; Mahieu, E.; De Maziere, M. Ground-based FTIR retrievals of SF6 on Reunion Island. Atmos. Meas. Tech. 2018, 11, 651–662. [Google Scholar] [CrossRef] [Scilit]
- De Maziere, M.; Thompson, A.M.; Kurylo, M.J.; Wild, J.D.; Bernhard, G.; Blumenstock, T.; Braathen, G.O.; Hannigan, J.W.; Lambert, J.C.; Leblanc, T.; et al. The Network for the Detection of Atmospheric Composition Change (NDACC): History, status and perspectives. Atmos. Chem. Phys. 2018, 18, 4935–4964. [Google Scholar] [CrossRef] [Scilit]
- Rodgers, C.D. Retrieval of atmospheric temperature and composition from remote measurements of thermal radiation. Rev. Geophys. 1976, 14, 609–624. [Google Scholar] [CrossRef] [Scilit]
- Kalnay, E.; Kanamitsu, M.; Kistler, R.; Collins, W.; Deaven, D.; Gandin, L.; Iredell, M.; Saha, S.; White, G.; Woollen, J.; et al. The NCEP/NCAR 40-year reanalysis project. Bull. Am. Meteorol. Soc. 1996, 77, 437–471. [Google Scholar] [CrossRef] [Scilit]
- Gordon, I.E.; Rothman, L.S.; Hargreaves, R.J.; Hashemi, R.; Karlovets, E.V.; Skinner, F.M.; Conway, E.K.; Hill, C.; Kochanov, R.V.; Tan, Y.; et al. The HITRAN2020 molecular spectroscopic database. J. Quant. Spectrosc. Radiat. Transf. 2022, 277, 107949. [Google Scholar] [CrossRef] [Scilit]
- Tikhonov, A.N. On the solution of incorrectly stated problems and a method of regularization. Dokl. Acad. Nauk SSSR 1963, 151, 501–504. [Google Scholar]
- Sussmann, R.; Forster, F.; Rettinger, M.; Jones, N. Strategy for high-accuracy-and-precision retrieval of atmospheric methane from the mid-infrared FTIR network. Atmos. Meas. Tech. 2011, 4, 1943–1964. [Google Scholar] [CrossRef] [Scilit]
- Rodgers, C.D. Inverse Methods for Atmospheric Sounding: Theory and Practice; World Scientific: Singapore, 2000; pp. 48–51. [Google Scholar]
- China Meteorological Administration. China Greenhouse Gas Bulletin 2023. 2024. Available online: https://www.cma.gov.cn/zfxxgk/gknr/qxbg/202412/t20241209_6734975.html (accessed on 10 May 2026).
- Chen, Y.; Yao, B.; An, M.; Ding, A.; Liu, S.; Li, X.; Li, Y.; O’Doherty, S.; Krummel, P.B.; Yang, H.; et al. Emissions of Perfluorinated Greenhouse Gases in Southeastern China Derived From High-Frequency In Situ Observations. Geophys. Res. Lett. 2025, 52, e2024GL111393. [Google Scholar] [CrossRef] [Scilit]
- Gettelman, A.; Mills, M.J.; Kinnison, D.E.; Garcia, R.R.; Smith, A.K.; Marsh, D.R.; Tilmes, S.; Vitt, F.; Bardeen, C.G.; McInerny, J.; et al. The Whole Atmosphere Community Climate Model Version 6 (WACCM6). J. Geophys. Res. Atmos. 2019, 124, 12380–12403. [Google Scholar] [CrossRef] [Scilit]
- Draxler, R.R.; Hess, G.D. An overview of the HYSPLIT_4 modelling system for trajectories, dispersion and deposition. Aust. Meteorol. Mag. 1998, 47, 295–308. [Google Scholar] [CrossRef] [Scilit]
- Stein, A.F.; Draxler, R.R.; Rolph, G.D.; Stunder, B.J.B.; Cohen, M.D.; Ngan, F. NOAA’s HYSPLIT Atmospheric Transport and Dispersion Modeling System. Bull. Am. Meteorol. Soc. 2015, 96, 2059–2077. [Google Scholar] [CrossRef] [Scilit]
- Crippa, M.; Guizzardi, D.; Pagani, F.; Banja, M.; Muntean, M.; Schaaf, E.; Quadrelli, R.; Risquez Martin, A.; Taghavi-Moharamli, P.; Köykkä, J.; et al. GHG Emissions of All World Countries—2025 Report; Publications Office of the European Union: Luxembourg, 2025. [Google Scholar] [CrossRef]
- Fang, X.; Hu, X.; Janssens-Maenhout, G.; Wu, J.; Han, J.; Su, S.; Zhang, J.; Hu, J. Sulfur Hexafluoride (SF6) Emission Estimates for China: An Inventory for 1990–2010 and a Projection to 2020. Environ. Sci. Technol. 2013, 47, 3848–3855. [Google Scholar] [CrossRef] [Scilit] [PubMed]

Disclaimer/Publisher’s Note: The statements, opinions and data contained in all publications are solely those of the individual author(s) and contributor(s) and not of MDPI and/or the editor(s). MDPI and/or the editor(s) disclaim responsibility for any injury to people or property resulting from any ideas, methods, instructions or products referred to in the content. |
© 2026 by the authors. Licensee MDPI, Basel, Switzerland. This article is an open access article distributed under the terms and conditions of the Creative Commons Attribution (CC BY) license.