


Highlights
What are the main findings?
- A fully automated on-orbit absolute radiometric calibration method, which transfers MODIS radiometric reference to Jilin-1 satellites using pseudo-invariant calibration regions derived from historical MODIS products and a pre-built MODTRAN look-up table, was developed and validated without relying on ground synchronous experiments.
- The proposed method achieves reliable calibration accuracy (relative difference < 4% compared with RadCalNet ground calibration results) while eliminating the need for dedicated imaging tasks and ground measurements, outperforming traditional methods in terms of automation, cost-effectiveness, and resource efficiency for large commercial satellite constellations.
What are the implications of the main findings?
- This study provides a practical, replicable, and resource-efficient calibration solution for low-cost commercial satellite constellations lacking on-board calibration systems, addressing the critical bottleneck of scalable radiometric calibration for massive sensors.
- The validated methodological workflow and look-up table-based approach offer actionable guidance for the radiometric calibration of similar commercial optical satellites, supporting the high-precision quantitative applications of commercial remote sensing data in environmental monitoring, resource management, and other fields.
Abstract
On-orbit absolute radiometric calibration tracks sensor radiometric degradation and ensures accuracy for quantitative applications. Low-cost commercial satellites lack expensive on-board calibration systems, and traditional alternative methods cannot achieve automated, reliable calibration for large sensor fleets with low resource consumption. Pseudo-invariant calibration sites require no ground instruments, but commercial satellites’ heavy imaging schedules hinder frequent PICS observations. The Jilin-1 constellation is a large commercial constellation composed of satellites carrying multispectral imagers with resolution better than 1 m, and it has no on-board calibration system. Thus, an automated calibration method applicable to numerous imagers is needed, one that requires widely available clear-sky ground targets. Using MCD43A2 and MCD12Q1 products, we generate calibration region vectors to transfer the MODIS radiometric reference to Jilin-1. A look-up table (LUT) is constructed for the input parameters of the MODTRAN model. Calibration pixels and model input parameters are then extracted from Jilin-1 imagery using the region vectors, the LUT is interpolated to obtain the at-aperture radiance for each pixel and band, and on-orbit absolute radiometric calibration coefficients are calculated. The proposed method requires no ground-based synchronous experiments, achieves a high level of automation, and does not consume commercial imaging resources. The site calibration validation based on RadCalNet for the JL1GF02F PMS1 sensor shows that the maximum relative difference in the method across all bands is less than 4%.
1. Introduction
As remote sensing applications progressively expand across diverse fields, the quantification of remote sensing data has become imperative for advancing this technology (Gao, 2010) [1]. During the initial phase of remote sensing development, quantitative applications primarily relied on supervised and unsupervised classification estimates, which did not require absolute radiometric calibration of sensors (Zhang, 2012) [2]. Absolute radiometric calibration converts sensor response digital numbers (DNs) into TOA radiance or apparent reflectance, with its accuracy serving as a critical foundation for ensuring radiometric quality in satellite imagery and quantitative analyses (Dinguirard, 1999; Yang, 2023) [3,4]. Satellite sensors’ radiometric characteristics, however, degrade during orbital operations due to environmental factors and system aging (Wang, 2012; Chander, 2013; Ma, 2023) [5,6,7]. Consequently, periodic on-orbit absolute radiometric calibration is essential to maintain data validity for quantitative applications (Sanwlani, 2012; Helder, 2018) [8,9]. Post-launch calibration methodologies for remote sensing payloads predominantly include on-board calibration and vicarious calibration techniques (Wang, 2017) [10].
On-orbit on-board calibration offers high accuracy and efficiency (Wang, 2019) [11]. Satellites and sensors such as MODIS, Landsat series, and NPP/VIIRS have incorporated on-board calibration systems (Doelling et al., 2015; Barsi et al., 2016; Xiong et al., 2020) [12,13,14]. However, these systems entail significant costs, and their calibration capability degrades over time due to space environmental effects and material aging (Zhang, 2020) [15].
On-orbit vicarious calibration primarily encompasses site-based, cross-satellite, and stable target methods. The most prevalent site-based approach is the reflectance-based method, which requires concurrent measurements of surface reflectance and atmospheric parameters at calibration sites during satellite overpasses. Radiative transfer models then simulate top-of-atmosphere (TOA) radiance using these field measurements (Frouin, 1987) [16]. With SI-traceable calibration uncertainty of 5–7%, this method has been extensively applied to multi-sensor on-orbit calibration campaigns (Slater, 1987; Biggar, 1994; Thome, 2008) [17,18,19]. However, dependency on limited calibration sites combined with satellite revisit cycles and weather constraints restricts calibration frequency. Additionally, the high hardware costs of ground-based measurement systems present further economic challenges (Qi, 2015) [20].
Cross-calibration involves utilizing a radiometrically well-calibrated reference satellite to observe a uniform target area nearly simultaneously with the target satellite, enabling calibration through comparative analysis of the observations (Chander et al., 2013) [6]. The accuracy of this method is primarily governed by four factors: spectral response matching between sensors, temporal acquisition interval, observation geometry differences, and spatial co-registration precision (Gao, 2013) [21]. To enhance accuracy, researchers have developed Simultaneous Nadir Overpass (SNO) methods that constrain temporal intervals (<5 min) and viewing angle differences (<3°). For instance, Cao et al. achieved < 1% uncertainty for spectrally similar AVHRR-MODIS bands with sub-30 s synchronization [22].
Although SNO methods improve calibration accuracy over conventional approaches, their stringent spatiotemporal requirements limit the number of viable calibration samples (Gao et al., 2016; Zhao et al., 2018) [23,24]. Compared to site-based calibration, cross-calibration offers distinct advantages: reduced site dependency, lower operational costs, and applicability to historical datasets. Consequently, it frequently supplements site-calibration results for validation. However, calibration frequency remains constrained by coincident imaging opportunities between target and reference satellites (Zhao et al., 2018) [24]. Moreover, the complex radiative transfer modeling required to reconcile observations across platforms introduces reliability concerns under large temporal gaps or rapidly changing atmospheric conditions (Wang et al., 2020) [25].
Scene calibration employs spatially stable pseudo-invariant calibration sites (PICSs) as reference targets (Ma, 2025) [26]. By constructing scene-specific models and analyzing multitemporal satellite DNs, this approach evaluates radiometric performance (Cosnefroy et al., 1996; Rao et al., 1999) [27,28]. Initial applications assumed constant apparent reflectance under clear skies for trend analysis of on-orbit degradation. Subsequent studies established empirical apparent reflectance models for direct absolute calibration.
Helder et al. (2013) developed a Bidirectional Reflectance Distribution Function (BRDF) model for Libya 4 using Terra MODIS as the reference radiometer [29]. Incorporating Hyperion hyperspectral data and solar zenith angle as fitting variables, the model achieved < 2.5% deviation from MODIS and 3–6% from Landsat ETM+ observations. Mishra et al. (2014) enhanced this model by adding viewing zenith angle and seasonal atmospheric corrections [30]. Song et al. (2023) [31] advanced BRDF modeling for Golmud Desert PICSs through relative azimuth angle parameterization and sinusoidal atmospheric compensation, verifying < 2% deviation with Landsat-8 OLI and Sentinel-2 data.
Yang et al. realize the absolute radiometric calibration of the medium–high-resolution satellite Jilin-1/GP02. In order to reduce the difference between the reference data and the spatial resolution of GP02, the MCD43A1 surface BRDF product of MODIS, the aerosol water vapor data in the MCD19A2 product, and the ozone data in the MOD07 (MYD07) product are used in the radiative transfer simulation process, and the MCD43A1 and MCD19A1 products are used together to extend the short-wave range of the output irradiance spectrum to 400 nm to achieve the coverage of the GP02 satellite in the band below 450 nm. The MCD43A1 and MCD19A1 products were used in combination to extend the short-wave range of the output irradiance spectrum to 400 nm to provide coverage of the sub-450 nm band of the GP02 satellite. (Yang S, 2023) [4]. Although calibration schemes based on PICSs do not require ground instruments, commercial satellites have heavy imaging schedules, making it difficult to frequently observe these PICSs.
While each aforementioned calibration method offers distinct advantages, their independent application to individual cameras with in large constellations or multi-sensor satellites incurs prohibitive labor and time costs. Consider the Jilin-1 constellation, with over 100 on-orbit optical satellites and multi-camera configurations (e.g., 12 cameras on KF01C), each requiring independent absolute radiometric calibration due to unique radiometric datums from relative corrections. Crucially, site-based calibration can only image one camera per overpass, while temporal variations in calibration events hinder radiometric consistency across cameras.
This paper first constructs extensive desert area vectors with high clear-sky observation probability, and employs an interpolation-based look-up table (LUT) method for radiative transfer simulation, which drastically reduces the simulation time while maintaining accuracy. Ultimately, an automated on-orbit absolute radiometric calibration method tailored for the Jilin-1 satellite constellation is developed.
2. Materials and Methods
2.1. Data
2.1.1. Jilin-1
The Jilin-1 Constellation, developed by Changguang Satellite Technology Co., Ltd. (Changchun, China), has achieved significant milestones with 152 satellites operational by April 2026. As the world’s largest sub-meter commercial remote sensing constellation, it delivers 38–40 daily global revisits and sixfold annual coverage. Among this constellation, the high-spatial-resolution multispectral satellite series provides multispectral scanner (MSS) imagery including red, green, blue, and near-infrared bands, as well as panchromatic (PAN) imagery, with the spatial resolution of the panchromatic band better than 1 m. The JL1GF series constitutes the largest subset with 1–2 cameras per satellite at 0.75 m resolution, while JL1KF-series satellites exhibit the highest camera density, carrying 6–12 cameras per platform at 0.5–0.75 m resolution. The spectral response ranges of these cameras are similar, but their spectral response functions are slightly different from each other. Due to the pressure of data transmission, these satellites image on demand according to market tasks. Table 1, Table 2 and Table 3 present the detailed parameters of several major multispectral satellites in the Jilin-1 constellation. For satellites equipped with multiple cameras, calibrating all cameras using ground target points would require each camera to image the target site once, while the other cameras would waste considerable imaging resources at that time. This is unacceptable for commercial satellites with heavy imaging schedules.
Table 1.
Parameters of the KF01B/KF01C satellites.
Table 2.
Parameters of the KF02B01-KF02B07 satellites.
Table 3.
Parameters of the GF02A-GF02F satellites.
Given the dual challenges of extensive satellite deployment and multi-camera configurations inherent to such commercial constellations, developing cost-efficient on-orbit absolute radiometric calibration methods is essential to meet operational requirements. This research specifically addresses the calibration needs of Jilin-1’s high-resolution satellites, utilizing their payload imagery for developing automated calibration methdos and validating algorithm efficacy.
For the PMS1 payload onboard the JL1GF02F satellite of the Jilin-1 satellite constellation, this study conducted site calibration based on RadCalNet and cross-calibration based on Sentinel-2 L1C data. Among the two approaches, site calibration offers high accuracy, but its targets are all high-reflectance deserts, which cannot reflect the accuracy of the method over a wide range of reflectance; therefore, cross-calibration was used to verify the performance of the method in low-reflectance areas. First, JL1GF02F acquired images of the Baotou, Gobabeb, and Railroad Valley Playa calibration sites on 13 May, 9 July, and 28 September 2024, respectively, to validate the accuracy of the on-orbit radiometric calibration method through site calibration. Second, JL1GF02F acquired images of Baotou and Dunhuang on 17 May 2024, and 12 October 2024, respectively, while Sentinel-2A also imaged these two locations at close times. Therefore, these two JL1GF02F images were used for cross-calibration with the Sentinel-2A data to validate the accuracy of the on-orbit absolute radiometric calibration. The regions selected for cross-calibration are the high-reflectance sandy area in the Baotou calibration site, and in the Dunhuang calibration site, and the low-reflectance lake.
The five images used for validation, along with the calibration regions, are shown in Figure 1.
Figure 1.
Images acquired by the JL1GF02F PMS1 sensor for validating the method accuracy and the corresponding regions of interest (ROIs). (a) Baotou; (b) Gobabeb; (c) Railroad Valley Playa; (d) desert and lake in Dunhuang; and (e) desert in Baotou.
2.1.2. MODIS Data
This study initiates the calibration process by selecting target regions under specific criteria, followed by simulating sensor-apparent irradiance through radiative transfer modeling driven by site-specific surface reflectance and atmospheric parameters. Surface reflectance data are sourced from the MODIS MCD43A1 BRDF product, which delivers 500 m resolution model parameters for bands 1–7 to compute directional reflectance. Given the critical impact of MCD43A1 data quality on TOA radiance simulation accuracy, the spatially co-registered MCD43A2 quality control product (500 m resolution) is employed for calibration site validation, providing direct assessment of BRDF/albedo data integrity.
Atmospheric characterization integrates aerosol optical thickness (AOT) and water vapor content from the multi-angle inversion MCD19A2 aerosol product (500 m resolution), alongside ozone concentration data extracted from MOD08_D3/MYD08_D3 gridded daily composites. The latter provides 1° × 1° resolution Level-3 atmospheric synthesis encompassing aerosol, water vapor, and ozone parameters, forming a comprehensive input dataset for radiative transfer simulations.
2.1.3. RadCalNet Data
RadCalNet (Radiometric Calibration Network) is a global reference network for radiometric calibration led by the Committee on Earth Observation Satellites (CEOS). It aims to provide standardized, high-precision radiometric calibration services for Earth observation payloads operating in the visible to short-wave infrared spectral range. All RadCalNet sites strictly follow the traceability requirements of the International System of Units (SI), establishing a metrological reference chain with the support of institutions such as the National Physical Laboratory (NPL) in the United Kingdom, thereby ensuring the global consistency of data quality. RadCalNet offers high-quality, timely, SI-traceable, and readily accessible radiometric calibration services, making it a key infrastructure and authoritative reference for radiometric calibration in the global Earth observation community (Ma, 2020; Bouvet, 2019) [32,33]. Currently, RadCalNet comprises four sites: Railroad Valley Playa, La Crau, Gobabeb, and Baotou.
This study validates the accuracy of the proposed on-orbit absolute radiometric calibration method using RadCalNet calibration sites, specifically including data from Baotou on 13 May 2024, Gobabeb on 9 July 2024, and Railroad Valley Playa on 28 September 2024. From the RadCalNet site data, water vapor, ozone, aerosol optical depth at 550 nm, and surface reflectance near the imaging time can be obtained. Since these data are provided at half-hour intervals, the time difference between image acquisition and the site data acquisition does not exceed 15 min.
2.1.4. Sentinel 2 Satellite Data
Sentinel-2 is an optical Earth observation mission of the European Space Agency (ESA) under the Copernicus program, consisting of two satellites, Sentinel-2A and Sentinel-2B, each equipped with the Multipectral Instrument (MSI). The MSI acquires data in 13 spectral bands from visible to short-wave infrared, with spatial resolutions of 10 m, 20 m and 60 m. The constellation achieves a revisit time of five days at the equator. The radiometric calibration of Sentinel-2 is performed on a monthly basis, including dark-signal and absolute/relative gain updates. The mission requires an absolute radiometric accuracy of 5% (threshold) and 3% (target), with inter-band and inter-satellite accuracies of 3%. Long-term monitoring has demonstrated excellent stability, with gain coefficients varying within ±0.2% per year and inter-satellite differences below 1% (Rivoire, 2024) [34].
Owing to its high radiometric accuracy and stability, Sentinel-2 MSI is widely used as a reference sensor in cross-calibration studies for other satellite payloads. Therefore, this study uses Sentinel-2A data to perform cross-calibration with JL1GF02F imagery, thereby validating the accuracy of the proposed method.
2.2. Method
The algorithm in this paper first filters the daily real-time imaging data produced by Jilin-1 using calibration region vectors, selecting remote sensing images suitable for calibration. Subsequently, it intersects the selected remote sensing images with the calibration region vectors to obtain the sub-regions of the images that will be used for subsequent calibration. For the calibration regions within these images, the algorithm first downsamples the images to the resolution of MODIS products. It then extracts information from each calibration pixel, including its DN value, spatial coefficient of variation, imaging geometry angles, and geographic location. Based on the geographic locations and corresponding imaging times of all extracted calibration pixels, the algorithm determines the keywords needed to automatically download the relevant MODIS land surface and atmospheric data. The study employs the reflectance-based method to simulate the TOA radiance. Specifically, it uses MODIS MCD43A1 data as the land surface reflectance input, and AOT and water vapor from MCD19A2, along with ozone content from MOD08/MYD08 data, as atmospheric parameter inputs. To enhance computational speed, the algorithm utilizes a LUT combined with data interpolation instead of directly employing a radiative transfer model to obtain the apparent radiance at the sensor. The LUT itself is constructed using the MODerate resolution atmospheric TRANsmission (MODTRAN) radiative transfer model. All the above steps are automated via computer programs. Finally, the on-orbit absolute radiometric calibration coefficients for each spectral band are calculated using the gray values of all calibration pixels and their corresponding simulated radiance values. The specific workflow of the proposed method is shown in Figure 2.
Figure 2.
Specific workflow of the proposed method.
2.2.1. Generate Calibration Region Vectors
The number of daily imaging products from the Jilin-1 satellite constellation exceeds 35,000. These image products are acquired over target areas according to commercial business requirements and are tiled in accordance with the Jilin-1 standard product specifications. Performing calibration calculations on all pixels within these images would demand excessive computational resources and processing time. Furthermore, when using MCD43A1 reflectance data for simulating calibration radiance, invalid or low-reliability reflectance results directly reduce the accuracy of TOA radiance simulations under the reflectance-based method. Therefore, only regions within the MCD43A1 product exhibiting high validity and high reliability are suitable for the calibration process.
The MCD43A2 V6.1 Bidirectional Reflectance Distribution Function and Albedo (BRDF/Albedo) Quality dataset is a 500 m daily 16-day product. It contains all the quality information for the corresponding 16-day MCD43A1 products. The greater the number of valid observation days used to generate a particular MCD43A1 product, the more likely that MCD43A1 product is to have higher inversion accuracy. Consequently, by calculating the average valid clear-sky observation rate for each spatial location over a time series, regions with higher valid observation rates can be considered more likely to achieve reliable inversion accuracy in the MCD43A1 product. Data from the satellite to be calibrated imaging these regions has a higher probability of yielding reliable TOA radiance simulation accuracy in subsequent calibration steps.
Therefore, this paper calculates the average annual valid observation probability for each location to determine its suitability as a calibration site. Using a threshold of 50% of the total days in the year, regions with a valid observation rate exceeding this threshold are selected to generate a mask image that meets the valid observation rate requirement, thereby constructing the calibration region vectors.
The areas selected using the clear-sky observation rate only ensure the validity of the acquired calibration data; however, these areas still contain land cover types that are unfavorable for on-orbit absolute radiometric calibration, such as complex vegetation, urban areas, and mountainous regions. Deserts are often selected for on-orbit absolute radiometric calibration due to their high surface stability, high spatial uniformity, high surface reflectance, and low atmospheric interference. Therefore, this study further extracted desert areas from the mask image obtained above. MCD12Q1 is a MODIS Level-3 annual global land-cover-type product with a spatial resolution of 500 m and a sinusoidal grid, derived from the composite inversion of year-round observations from the Terra and Aqua satellites. Band 1 of this product, named LC_Type1, adopts the International Geosphere-Biosphere Program (IGBP) land cover classification scheme used by National Aeronautics and Space Administration (NASA)’s Earth Observing System (EOS), defining a total of 17 land cover types. Among them, pixels with a band value of 16 represent desert areas where at least 60% of the region is covered by non-vegetated barren land. This study used the 2024 MCD12Q1 data to extract desert areas, which were then intersected with the mask previously obtained from MCD43A2, yielding desert areas with a clear-sky observation rate greater than 50%.
Since the resulting mask still contains many small isolated areas that, although meeting the valid observation rate requirement, are susceptible to the instability of their surrounding environment, this study further applies an erosion operation from mathematical morphology using a 10 km × 10 km window to remove these small sub-regions. The final vector is shown in Figure 3.
Figure 3.
Desert areas with a clear-sky observation rate greater than 50%.
2.2.2. Extract Information of the Set of Calibration Pixels
For daily Jilin-1 imagery, spatial intersection with the pre-established calibration region vectors identifies usable datasets for on-orbit absolute radiometric calibration, requiring non-null overlap. Selected images are downsampled to 500 m resolution (matching MODIS specifications) to extract initial calibration pixels within target regions.
Given the significant resolution disparity between sub-meter Jilin-1 imagery and MODIS products, surface heterogeneity critically impacts radiation transfer errors from scale differences and geolocation variances. Consequently, spatial coefficients of variation are computed for each pixel and its neighborhood post-extraction. The product specifications of the Jilin-1 satellites guarantee that qualified data products achieve a geolocation accuracy better than 20 m without ground control points, and MODIS accuracy better than 150 m (<1 pixel, Robert, 2002), a 3 × 3 window suffices for spatial matching criteria at 500 m resolution [35]. These spatial coefficients of variation values serve as key filters for subsequent calibration pixel selection.
Each pixel’s geographic coordinates (latitude/longitude) are recorded for MODIS parameter extraction, while solar elevation, satellite elevation, height, and acquisition time enable TOA radiance retrieval via radiative transfer simulation LUTs.
This process finalizes calibration metadata extraction, capturing DNs, spatial coefficients of variation, geographic coordinates, solar/satellite geometry, surface height and acquisition timestamps.
Integrated into Jilin-1’s operational production system, this module executes automated daily processing.
2.2.3. Automatically Download MODIS Data Products
The TOA radiance computation requires MODIS products MCD43A1, MCD19A2, MOD08_D3, and MYD08_D3, necessitating an automated data retrieval protocol. For sinusoidal grid-based products (MCD43A1 and MCD19A2), geographic coordinates of calibration pixels uniquely determine tile indices within the sinusoidal projection framework. Daily tile indices are derived from these coordinates, enabling target filename resolution via product JSON metadata using Day of Year (DOY) and tile indices. The MCD43A1 and MCD19A2 products are combined Terra-Aqua MODIS products. Although MCD19A2 and MOD08/MYD08 differ in spatial resolution, considering that the calibration sites in this study are all located in desert regions with high spatial homogeneity under clear-sky conditions, the coarse resolution of the ozone data is unlikely to introduce significant uncertainty. Moreover, compared with aerosol optical depth and water vapor, ozone exerts a relatively weak influence on radiative transfer in the visible and near-infrared bands covered by JL1GF02F, and its spatiotemporal variability is considerably smaller. Therefore, the use of MOD08 ozone data is acceptable for the purposes of this study. For aerosol optical depth and water vapor, MCD19A2 provides sufficient spatial detail, and its retrieval accuracy over bright desert surfaces has been reported to be comparable to that of ground-based measurements.
Conversely, global daily composites MOD08/MYD08 utilize sinusoidal projection but require only DOY for filename determination. All identified products are programmatically acquired from NASA’s LAADS DAAC archive through automated queries based on resolved filenames.
2.2.4. Extract the Surface Directional Reflectance and Atmospheric Parameters
MODIS provides the 0.05-degree resolution MCD43A1 Bidirectional Reflectance Distribution Function (BRDF) product. According to the semi-empirical kernel-driven BRDF model theory, the spectral directional reflectance of the surface in the solar reflection band can be expressed as
where denotes the solar zenith angle; denotes the satellite viewing zenith angle; denotes the relative azimuth angle; denotes the wavelength; denotes the body scattering kernel calculated by the body scattering radiative transfer model; denotes the geometrical optics kernel calculated by the geometrical optics modeling theory; denotes the BRDF parameter which describes the anisotropic component in the directional reflectance; and and are the BRDF parameter which describes the weights of each component of the two kernels. The MCD43A1 product provides , and for MODIS band 1–band 7, and the center wavelengths of these bands are 645 nm, 859 nm, 469 nm, 555 nm, 1240 nm, 1640 nm, and 2130 nm, respectively.
The optical sensors aboard Jilin-1’s high-spatial-resolution satellite series exhibit distinct spectral characteristics: their shortest-wavelength band (blue) has a center wavelength of approximately 480 nm, exceeding MODIS band 3’s minimum center wavelength of 469 nm within bands 1–7. Conversely, their longest-wavelength band (near-infrared) features a center wavelength of about 830 nm, which remains below the 1240 nm wavelength of MODIS band 5. Consequently, the spectral coverage of directional reflectance derived from MODIS bands 1–5 BRDF parameters fully encompasses all five spectral bands of Jilin-1’s high-resolution satellites.
Regarding atmospheric parameters for radiative transfer simulations, this study sources 550 nm AOT and water vapor content directly from the MCD19A2 product, while obtaining ozone concentrations from the MOD08/MYD08 dataset.
2.2.5. Radiative Transfer Simulation Using LUTs and Interpolation
After obtaining the surface and atmospheric parameters, the reflectance-based method uses a radiative transfer model to simulate the corresponding TOA radiance. The MODTRAN 5.2 radiative transfer model, based on the atmospheric “narrow-band model” algorithm, provides solutions to the radiative transfer equations with a spectral resolution of 2 cm−1, and is extremely versatile for use in radiative transfer simulations.
In usual scientific research, few radiative transfer simulations using MODTRAN are sufficient, but if on-orbit absolute radiative calibrations are performed for all sensors and spectral bands of a large-scale commercial satellite constellation, point-by-point radiative transfer simulations of all calibrated pixel points using MODTRAN will consume a large amount of computational resource cost and time cost. Therefore, this study proposes to improve the speed of radiative transfer simulation by using LUT combined data interpolation to achieve fast radiative transfer simulation for all calibrated pixels.
LUTs are a common and effective method for solving the problem of large-scale real-time simulation with excessive time cost. However, classical LUT algorithms usually set smaller step sizes for each dimension in order to guarantee the accuracy of the results, while the MODTRAN model has a large number of input dimensions, which can exponentially increase the amount of data in the LUT to an unattainable level. This “dimension explosion” phenomenon puts pressure on the storage of LUTs, and also makes it more difficult to generate, maintain and migrate LUTs. Therefore, this study considers the use of a combination of LUTs and interpolation for fast radiative transfer simulation. Compared to the simple nearest neighbor LUT approach, this method, while increasing the amount of real-time computation introduced by the interpolation process, can significantly reduce the simulation computational effort of constructing a LUT as well as the stress of storing and porting the large amount of data for the LUT. Considering that each independent parameter affects the radiative transfer simulation results in a different way, in order to ensure the interpolation accuracy, this study used multidimensional gridded data interpolation by interpolating each factor individually in order and combining the a priori knowledge to determine the interpolation method for each dimension.
For such a method of LUT combined with interpolation, there are two key parameters to be determined: the interpolation method as well as the LUT node settings. Common interpolation methods include polynomial interpolation, piecewise interpolation, Hermite interpolation, and spline interpolation, among others. Among these, piecewise interpolation effectively avoids Runge’s phenomenon caused by high-degree polynomials. The method requires less computational effort and fewer interpolation nodes, thereby reducing computation time and LUT file access time. These advantages led to its ultimate selection for this study. For each factor, in order to ensure the interpolation accuracy, the interpolation function used for piecewise interpolation should be determined by the effect of that independent parameter on the results of the radiative transfer simulation, and such a priori knowledge can be obtained through a sensitivity analysis. Therefore, a sensitivity analysis of the physical quantities of each input is performed before constructing the LUT.
The input variables of the look-up table are the entries required as inputs in the radiative transfer process using MODTRAN, and the output is the simulated apparent radiance. The input variables specifically include surface reflectance values at MODIS band 1–band 5 wavelengths calculated from the MCD43A1 product, aerosol optical depth at 550 nm, water vapor content, ozone content, elevation, day of year, solar zenith angle, viewing zenith angle, and relative azimuth angle. Among them, the day of year can be used to derive the Earth–Sun distance, which is the variable that directly affects the radiative transfer simulation. However, the metadata of Jilin-1 satellite image products directly provide the day of year. To maintain direct compatibility with operational data, the input parameter of the look-up table is kept as the day of year rather than the pre-calculated Earth–Sun distance. The input and output of the LUT are as shown in Equation (2):
The sensitivity analysis methodology involves systematically perturbing individual target parameters at defined incremental steps while holding others constant, whereby radiation transfer simulation outputs are monitored to quantify their response patterns. This process necessitates establishing a baseline parameter configuration derived from standard operational conditions. For each sensitivity experiment, a single parameter is varied within predetermined ranges (as detailed in Table 4.) while maintaining all other parameters at their nominal values, thereby enabling isolation of specific parameter influences on the radiative transfer processes. It should be further noted that, since high water vapor values and AOT increase the uncertainty of radiative transfer simulations and are detrimental to on-orbit absolute radiometric calibration, the upper limit for water vapor is set to 1.2 cm−1, and that for AOT is set to 1.2. Consequently, images exceeding these values are excluded from on-orbit absolute radiometric calibration. Additionally, extreme observation geometries such as excessively low solar elevation angles and low satellite observation elevation angles may introduce errors due to topographic and BRDF effects. Therefore, the solar elevation angle is constrained to be no less than 30°, and the satellite observation elevation angle to no less than 70°. For desert areas, the surface reflectance in each spectral band is generally no greater than 0.7; therefore, the upper limit of the reflectance for the five MODIS bands is set to 0.7.
Table 4.
Parameter value settings for sensitivity analysis.
During radiative transfer simulations, the aerosol model was configured to the mid-latitude summer profile, while the atmospheric model was set as a rural characterization. The spectral sampling interval for output apparent radiance was set to 1 nm, with spectral interpolation across wavelengths implemented by the A radiative transfer model to convert discrete band reflectance values into continuous radiance spectra. The output wavelength range was further constrained to 380–1100 nm, a spectral domain that fully encompasses the spectral response range of the optical satellite sensors requiring calibration within the Jilin-1 satellite constellation. Subsequently, the output spectral radiance is convolved with the spectral response function of the Jilin-1 target payload to obtain the simulated at-sensor radiance.
The next critical step in completing radiative transfer simulations using the LUT combined with data interpolation is the construction of the LUT, where the primary task is to determine the sampling step size of the input parameters. If the sampling step size is too small, an excessive number of interpolation nodes will render the LUT cumbersome and difficult to maintain. Conversely, if the sampling step size is too large, the interpolation accuracy cannot be guaranteed. Therefore, this study further investigates the sampling interval of the LUT. The method involves the following procedure: for each input parameter, while fixing other parameters under typical input conditions as listed in Table 4, the target parameter range given in Table 4 is evenly divided into 200 sub-intervals. Following the specified interpolation method, interpolation was performed using different sampling step sizes, and the interpolated radiance values were compared with those simulated by MODTRAN to examine how the error varies with the sampling step and to determine the optimal interpolation step size for each input parameter.
3. Results
3.1. Sensitivity Analysis Results of Radiative Transfer Simulation
As illustrated in Figure 4 and Figure 5, the MODTRAN-based sensitivity analysis reveals critical dependencies. Notably, DOY, whose influence on radiative transfer is primarily mediated through its modulation of the Earth–Sun distance, was converted to actual Earth–Sun distance values for direct correlation analysis between simulated spectral radiance and solar irradiance variations.
Figure 4.
Sensitivity analysis results for parameters excluding MODIS reflectances. (a-) DOY and distance between the sun and the earth; (b-) height (km); (c-) AOT; (d-) water vapor (cm−1); (e-) ozone (ATM-cm); (f-) solar elevation (°) (g-) satellite elevation (°); and (h-) relative azimuth (°). (-1) Radiance (W/m2/sr/μm) variation as a function of wavelength (nm) under different input parameter values; (-2): radiance (W/m2/sr/μm) variation as a function of input parameter values across different wavelengths (nm).
Figure 5.
Sensitivity analysis results for MODIS reflectance. (a-) MODIS band 1 reflectance; (b-) MODIS band 2 reflectance; (c-) MODIS band 3 reflectance; (d-) MODIS band 4 reflectance; and (e-) MODIS band 5 reflectance. (-1) Radiance (W/m2/sr/μm) variation as a function of wavelength (nm) under different input parameter values; (-2): radiance (W/m2/sr/μm) variation as a function of input parameter values across different wavelengths (nm).
As shown in Figure 4, the TOA spectral radiance demonstrates pronounced linear correlations with height, AOT, ozone concentration, satellite elevation, and directional reflectance. These parameters are therefore recommended for linear interpolation schemes. The calculation results indicate that the product of the Sun–Earth distance and radiance at different wavelengths is essentially equal to the radiance at a Sun–Earth distance of 1 AU. Therefore, no interpolation for the Sun–Earth distance or DOY is required. When constructing the LUT, the radiance data at 1 AU are recorded, and the target radiance can be obtained by dividing these data by the corresponding Sun–Earth distance. For the remaining parameters, distinct functional relationships were identified: the radiance–water vapor correlation approximates an inverse proportional function, the solar elevation dependence follows a sinusoidal pattern, and the relative azimuth angle relationship exhibits cosine-like characteristics. Consequently, function-specific interpolation strategies were implemented—inverse proportional fitting for water vapor, sinusoidal regression for solar elevation, and cosine-based approximation for relative azimuth angle—to address these nonlinear dependencies.
It is noteworthy that Figure 5 reveals the five directional reflectance bands do not uniformly influence radiance values across the entire spectral range, but rather demonstrate distinct spectral domains of primary influence. Specifically, band 3 predominantly affects radiance below 556 nm; band 1 governs the 551–856 nm spectral region; band 5 dominates radiance above 857 nm; band 2 primarily influences the 465–648 nm interval; and band 4 exerts major control over the 644–1082 nm range. Based on this LUT construction framework, the radiative transfer simulation results can be approximately segmented into four spectral domains. Among them, 380–556 nm is the first part, and the TOA radiance in this wavelength interval is only affected by band 2 and band 3, so the directional reflectance in the five bands only needs to be interpolated in the dimensions of these two bands. The next three sections are as follows: 557–644 nm is the second group, and the TOA radiance in this section is affected by band 1 and band 2; 645–856 nm is the third group, and the TOA radiance in this section is affected by only band 1 and band 4; and 857–1100 nm is the fourth group, and the TOA radiance in this section is affected by only band 4 and band 5. The interpolation method is similar for the next three wavelength intervals, where only the two bands associated with them need to be considered. Consequently, spectral interpolation within each domain requires consideration of only two corresponding reflectance bands. This wavelength-partitioned approach achieves an 87.5% reduction in LUT data volume (equivalent to 1/8 original size) within the MODIS reflectance parameter space.
3.2. Optimal Interpolation Step Size and LUT Construction Results
Since different interpolation methods require different numbers of LUT nodes, this study uniformly adopts the number of interpolation groups as the independent variable for accuracy analysis. This variable represents the number of intervals into which the parameter variation range is divided. For example, if the entire parameter range is divided into three intervals, then for interpolation methods that require two data points to perform one interpolation operation, such as linear interpolation and sinusoidal function interpolation, the number of interpolation groups is two. For methods that require three data points, such as inverse interpolation, the number of interpolation groups is one. A larger number of interpolation groups indicates a smaller sampling step size and a larger LUT data volume. For each input parameter, the trend of relative error as a function of the number of interpolation groups is shown in Figure 6.
Figure 6.
Trends of relative error versus the number of interpolation groups across input parameters.
For each parameter, this study adopted an average relative error of 0.1% as the threshold. The smallest number of interpolation groups that yielded a relative error below this threshold was selected for constructing the LUT. The selected number of interpolation groups for each input parameter is shown in Table 5.
Table 5.
The number of interpolation groups for parameters.
Based on the prior knowledge established above, the proposed LUT framework systematically incorporates reasonable node configurations and corresponding interpolation methodologies as summarized in Table 6. The sampling step sizes for both the solar elevation and the satellite elevation were set to 5° to facilitate the configuration of the LUT.
Table 6.
Node configurations and corresponding interpolation methodologies.
The interpolation approach partially mitigates storage and maintenance challenges inherent to oversized LUTs, enabling radiative transfer simulations via tabular methods. However, escalating dimensionality of independent parameters introduces computational latency. As previously detailed, the nine-dimensional interpolation space requires triplicate LUT datasets for water vapor content dimensions and duplicate sets for other parameters. This configuration necessitates accessing 1536 nodal data points and performing 1023 interpolation computations per simulation cycle. Unoptimized data organization would severely degrade computational throughput due to excessive I/O operations. This necessitates the development of an optimized LUT storage architecture specifically designed to minimize data retrieval overhead during radiative transfer modeling.
The primary purpose of a CPU cache is to resolve the mismatch between CPU processing speed and memory read/write speed, and its existence offers the potential to reduce the time cost of accessing LUT node data. Cache design mainly exploits temporal locality and spatial locality; therefore, by adjusting the LUT structure and placing consecutively used node data in adjacent storage space, the cache hit rate can be improved. In the process of radiative transfer simulation via interpolation, the data used consecutively in time are precisely the LUT node data simultaneously accessed within a single interpolation calculation. In a single interpolation operation, a group of LUT data that differ only in one specific parameter while all other parameters remain identical is always used. Moreover, LUT data are either used together or not used together only when they satisfy the following principle: they differ solely in the values of a particular parameter, and for that parameter, the number of nodes required for interpolation equals the number of nodes set in the LUT. The parameters for which the number of interpolation-required nodes equals the number of nodes set in the LUT include the height, relative azimuth angle, ozone content, and aerosol optical depth. Therefore, LUT data that differ in only one of these parameters will inevitably be used together in the same interpolation calculation, and data that differ only in the values of these four parameters will inevitably be used together in the same radiative transfer simulation process. As a result, placing these data in contiguous storage space can increase the cache hit rate and ultimately enhance the overall interpolation computation speed.
Therefore, to enable the consecutive use of these data, the interpolation is performed in the following sequence: first along the four dimensions mentioned above, and then sequentially according to water vapor content, the five directional reflectance bands, satellite zenith angle, and solar zenith angle, after which the target spectral radiance is obtained. The apparent radiance of the target payload is then simulated by convolving this spectral radiance with the spectral response function of the corresponding band.
3.3. Accuracy Validation of the LUT-Based Interpolation Method Using Simulated Typical Data
To validate whether the proposed LUT-based interpolation approach for radiative transfer simulation can fulfill the requirements of high-frequency on-orbit absolute radiometric calibration in this study, comprehensive evaluations of both accuracy and computational speed were conducted. For accuracy verification, multiple parameter configurations were established to analyze discrepancies between MODTRAN-based radiative transfer simulations and the proposed methodology.
Each independent parameter was assigned three representative values: low, intermediate, and high. The intermediate value was positioned within the statistical range derived from extensive absolute radiometric calibration imagery, while low and high values were set at the lower and upper bounds of this range, respectively. During validation, a target parameter cycled through these three predefined values while other parameters maintained uniform value types (all intermediate, all low, or all high). This configuration effectively circumvents the exponential complexity of exhaustively traversing all parameter combinations while ensuring broad value range coverage. Notably, LUT node values were deliberately excluded from the validation parameters to isolate and quantify interpolation-induced errors. Detailed parameter specifications are provided in Table 7.
Table 7.
Parameter values for accuracy testing.
The accuracy validation results are shown in Figure 7, where the values of the target parameters and other parameters for experiments labeled one to nine are listed in Table 8.
Figure 7.
Accuracy validation of the LUT-Based Interpolation Method across diverse parameter combinations: (a) DOY; (b) height (km); (c) AOT; (d) water vapor (cm−1); (e) ozone (ATM-cm); (f) soar elevation (°); (g) satellite elevation (°); (h) relative azimuth (°); (i) MODIS band 1 reflectance; (j) MODIS band 2 reflectance; (k) MODIS band 3 reflectance; (l) MODIS band 4 reflectance; (m) and MODIS band 5 reflectance.
Table 8.
Settings of the parameter values represented by each serial number.
As detailed in Table 9, all test cases demonstrate mean relative errors below 1%. This confirms that the LUT-based interpolation approach achieves excellent agreement with MODTRAN radiative transfer simulations, maintaining relative errors within 1% across all validation scenarios.
Table 9.
Mean relative errors of parameters across experiments.
3.4. Accuracy Validation of the LUT-Based Interpolation Method Based on MODIS Data
The MODIS system provides the MOD02HKM/MYD02HKM product with 500 m spatial resolution containing TOA radiance data. This enables validation of the interpolation accuracy in our look-up table-based method by comparing simulated TOA radiance against actual MOD02HKM/MYD02HKM observations. To ensure the proper utilization of MOD02HKM/MYD02HKM data, supplementary MODIS products are required: the MOD03/MYD03 product supplies pixel geolocation and sun–sensor geometry for radiance simulation, while the MOD06/MYD06 cloud cover data facilitates mask generation to exclude cloud-contaminated pixels.
This study selected six days of data (1, 11, and 21 July; 1, 11, and 31 August 2024) to validate the accuracy of the LUT-Based Interpolation Method. The validation procedure was conducted as follows:
- Calibration region vectors were applied to perform pixel-by-pixel screening of MOD03/MYD03 data, selecting only those pixels located within the predefined calibration regions.
- A cloud mask generated from the MOD06/MYD06 cloud cover product was used to eliminate pixels identified in Step 1 that were affected by cloud coverage.
- Considering spectral response characteristics, only MODIS bands 1, 2, and 4 were validated, as bands 3 and 5 exceed the 380–1100 nm spectral range of Jilin-1 multispectral sensors. For the filtered pixels, TOA radiance values for bands 1, 2, and 4 were extracted from the MOD02HKM/MYD02HKM product, while corresponding solar and observation angles were obtained from MOD03/MYD03.
- For each target pixel, BRDF and atmospheric parameters were retrieved from MCD43A1, MCD19A2, MOD08, and MYD08 products based on geographic coordinates. These parameters, together with height and corresponding angular information, were input into the LUT-Based Interpolation Method for radiative transfer simulation. The MODIS spectral response function was incorporated to derive simulated TOA radiance for each pixel.
- Accuracy assessment was performed by comparing the simulated TOA radiance values with the actual TOA radiance measurements provided by MOD02HKM/MYD02HKM.
Figure 8 resents a comparative analysis between the simulated TOA radiance and MOD02HKM/MYD02HKM-provided radiance for bands 1, 2, and 4, including both the fitted linear functions and the reference line y = x. The results demonstrate close agreement between the simulated and observed radiance values, with all three bands exhibiting fitted slope values within the range of 0.93–1.00 and R2 values exceeding 0.93. These statistical metrics confirm that the TOA radiance simulated by the LUT-Based Interpolation Method proposed in this study maintains strong consistency with MODIS benchmark observations.
Figure 8.
Scatter plot comparing simulated TOA radiance with MODIS-observed TOA radiance. Blue dots represent the data scatter points, and the red line is y = x. (a) Band 1; (b) band 2; and (c) band 4.
3.5. Speed Validation of the LUT-Based Interpolation Method
The computational acceleration innovations in this study primarily involve two technical components: (1) employing LUT-augmented interpolation for radiative transfer simulations, and (2) optimizing LUT storage architecture to reduce data retrieval overhead. To systematically evaluate their respective performance enhancements, we implemented controlled experiments through comparative LUT configurations. A baseline LUT was constructed as the control group, which stores radiative transfer simulation results across distinct independent parameters as discrete interpolation nodes in separate files. This conventional implementation serves as the reference for quantifying the efficiency improvements achieved by our optimized methodology. For methodological clarity, the two LUT approaches are formally designated as the Enhanced LUT (featuring memory-optimized contiguous storage) and the Conventional LUT (file-discretized node storage), with experimental validation employing dual input modalities: (1) imagery-derived pixel-wise parameters aggregated from operational hyperspectral data, and (2) stochastically sampled parameter combinations spanning predefined ranges—a design intentionally mitigating potential cache coherence artifacts in image-based scenarios where the spatial correlation of input parameters among adjacent pixels could artificially inflate cache hit probabilities through redundant localized file accesses, thereby isolating true computational performance gains.
For the first validation approach, following the aforementioned calibration image selection protocol, a single image fully contained within the calibration region vector was selected for testing. The downsampled image yielded 2000 pixels per band for analysis, with 10,000 total pixel records across visible, near-infrared, and panchromatic spectral bands (five bands total). Radiative transfer simulations were executed using three distinct methodologies, with comparative processing durations quantified in Table 10.
Table 10.
Computational speed performance of methods (using calibration images).
The experimental results demonstrate significant computational efficiency improvements, with the MODTRAN radiative transfer model exhibiting a 5.51 s average single-point execution time, while the conventional and enhanced LUT methods achieve 2.47 s and 0.83 s per computation respectively—representing 15.13% and 33.7% runtime reductions compared to MODTRAN and conventional LUT baselines. Both LUT implementations outperform the MODTRAN baseline in processing speed, with the optimized LUT methodology demonstrating particularly remarkable acceleration—achieving 15.13% of MODTRAN’s runtime (0.83 s vs. 5.51 s) and 33.7% of the conventional LUT’s duration (0.83 s vs. 2.47 s).
For the stochastic input validation protocol, 10,000 parameter sets were stochastically sampled with each independent parameter value randomly selected within its defined operational range. Radiative transfer simulations were systematically executed utilizing three distinct methodologies, with computational durations quantitatively compared in Table 11.
Table 11.
Computational speed performance of methods (using random parameter sets).
The experimental findings reveal that the MODTRAN radiative transfer model maintains consistent computational performance with an average single-point execution time of 5.26 s across datasets, demonstrating its insensitivity to input data similarity. The conventional LUT method exhibits limited acceleration efficacy at 3.80 s per computation (72.20% of MODTRAN’s duration), while showing a 53.59% runtime increase compared to calibration imagery inputs—evidencing its dependence on input parameter coherence. This performance degradation stems from the conventional LUT’s inability to leverage cache optimization when processing dissimilar inputs, as dispersed parameter distributions reduce cache hit probability through non-sequential node access patterns.
3.6. Accuracy Validation of On-Orbit Absolute Radiometric Calibration Using RadCalNet Sites
Corresponding to the acquisition times of the three JL1GF02F images over RadCalNet sites that were used to validate the accuracy of the absolute radiometric coefficients, calibration data generated over the half-year period from 1 May to 31 October 2024, were selected to study the accuracy of the automatic on-orbit absolute radiometric calibration method. The selected calibration data can be used to fit the on-orbit absolute radiometric calibration coefficients. In the pre-launch laboratory absolute radiometric calibration experiment for JL1GF02F, Equation (2) was employed to describe the relationship between radiance and the DN value.
where gain denotes the absolute radiometric calibration coefficient, while bias represents the absolute radiometric offset coefficient. Figure 9 displays scatter plots of calibration data for the panchromatic band and four multispectral bands. Since the data points are still linearly distributed, the linear regression model can continue to be used for fitting and calibration. Through this methodology, we obtained the gain and bias coefficients, with the fitted linear functions superimposed on Figure 9.
Figure 9.
Heatmap and linear regression results by spectral band, where red indicates dense regions and blue indicates sparse regions. The black line represents the fitted regression function. (a) PAN; (b) MSS B1; (c) MSS B2; (d) MSS B3; and (e) MSS B4.
It is worth noting that the TOA radiance values involved in the calculation for each band span a wide range. For instance, the PAN band exhibits at-sensor radiance values ranging from 100 to 160 W/m2/sr. Investigation reveals that, under similar satellite observation angles and atmospheric conditions, images with lower radiance values are generally acquired at relatively higher latitudes, such as the Gobi Desert in Mongolia (around 47°N) and the northern Sahara Desert (around 30°N), whereas images with higher radiance values are generally acquired at relatively lower latitudes, such as the south-central Sahara Desert. This is mainly attributed to the variation in solar elevation angle with latitude. On one hand, due to orbital characteristics, the local overpass time deviates further from noon at higher latitudes, while it is closer to noon at lower latitudes. On the other hand, the subsolar point is always located within the tropics between the Tropic of Cancer and the Tropic of Capricorn. The greater the difference between the local latitude and the subsolar point latitude, the lower the solar elevation angle for the same local time. It should be noted that the off-nadir angle of the Jilin-1 satellite during imaging typically does not exceed ±30°, and therefore its influence on the local time is negligible. Of course, season is also among the main factors affecting radiance, and the lowest radiance values were those acquired from the Gobi Desert in October.
It can be observed that the coefficients of determination (R2) for all spectral bands are greater than 0.95, indicating that the DN–radiance data pairs generated by the automatic calibration system exhibit a pronounced linear relationship.
Using the reflectance spectra and atmospheric parameters provided by the calibration sites, radiative transfer simulations were performed with MODTRAN to obtain the TOA radiance for each band of JL1GF02F PMS1 over the calibration areas. The TOA radiance calculated by the proposed method can be obtained from the DN values of the JL1GF02F images and the absolute radiometric calibration coefficients derived using this method. The accuracy of the absolute radiometric calibration coefficients obtained by the proposed method can be evaluated by comparing the TOA radiance derived from the two approaches. The detailed results are presented in Table 12, where Radiancein-suit denotes the TOA radiance derived from site calibration and RadianceARC denotes the TOA radiance obtained using the proposed method. It can be observed that, compared with the site calibration results from the three sites, the absolute relative error of the TOA radiance obtained by the proposed calibration method is less than 4% for all spectral bands, indicating that the accuracy of the proposed on-orbit absolute radiometric calibration method is reliable.
Table 12.
Comparison of TOA radiance obtained by the proposed method (RadianceARC and site calibration (Radiancein-suit) for the Baotou, Gobabeb, and Railroad Valley Playa calibration sites, along with absolute relative errors per band.
3.7. Accuracy Validation of On-Orbit Absolute Radiometric Calibration Using Sentinel-2A Data
Although site calibration offers high accuracy, the calibration sites are always established on high-reflectance deserts, and relying solely on site calibration cannot verify the accuracy of the method over low-reflectance surfaces. Therefore, this study performed cross-calibration of the JL1GF02F PMS1 sensor using Sentinel-2A data. The data acquired by JL1GF02F PMS1 over Dunhuang and Baotou, as mentioned in Section 2.1.1, were used, with the Baotou desert, Dunhuang desert, and Dunhuang lake selected as the study areas for cross-calibration. To eliminate the differences caused by the spectral response curves of Sentinel-2A and JL1GF02F, spectral band adjustment factors (SBAF) were computed for compensation. The cross-calibration results are presented in Table 13. It can be seen that for the two high-reflectance desert areas, the relative errors remained at a low level. Except for the near-infrared band of the image acquired over Dunhuang, where the relative error reached 10.63%, the relative errors for the other bands were all within 6%. The cross-calibration results over the low-reflectance lake in Dunhuang differed. The errors for band 1 and band 2 also remained within 6%, but the relative errors for band 3 and band 4 were relatively high, which was caused by the extremely low apparent radiance. Even so, the maximum difference between the Sentinel-2 apparent radiance and the JL1GF02F apparent radiance did not exceed 3 W·m−2·sr−1·μm−1. Therefore, the cross-calibration results also indicate that the accuracy of the proposed method is relatively reliable.
Table 13.
Comparison of TOA radiance obtained by the proposed method (RadianceARC) and cross calibration (Radiancein-suit) for the Baotou, and Dunhuang, along with absolute relative errors per band.
4. Discussion
When constructing the calibration region vector, this study employed MCD43A2 to identify areas with a high clear-sky observation rate. However, the distribution of MODIS clear-sky observations (used to define the 50% clear-sky rate for screening calibration regions) is not uniform across seasons; for example, the probability of clear skies in desert areas is generally higher in summer than in winter. Consequently, the proposed method is implicitly biased towards seasons with more frequent clear-sky conditions. Therefore, future research should investigate the impact of seasonal sampling on calibration stability and accuracy.
The core step of this study is the construction of a LUT for radiative transfer simulation. Prior to LUT construction, sensitivity analysis was conducted to explore the influence trend of each parameter on the simulated at-sensor radiance, and different interpolation methods were selected for different input parameters. However, the current sensitivity analysis has limitations: it only examines the relationship between individual variables and simulated radiance while keeping other inputs fixed, without accounting for potential interactions among variables. Future research should therefore expand the scope of sensitivity analysis to incorporate more comprehensive prior knowledge and further improve computational accuracy.
Currently, this study only provides empirical constraints on the upper and lower bounds of each variable in the LUT, which remains inadequate. Future research should employ larger datasets to investigate the relationship between the accuracy of radiative transfer simulations and the values of various input variables, and further constrain the look-up table data to reduce the uncertainty of the method. Additionally, a vector-based filtering step for MODIS atmospheric data (e.g., using quality flags provided by MOD08/MYD08 and MCD19A2 products) will be incorporated in future work to exclude data with high uncertainty.
In the validation of the proposed method, although site calibration and cross-calibration have been conducted, all validations were performed using only one payload onboard one satellite of the large-scale Jilin-1 constellation. Therefore, future work should acquire more reliable on-orbit calibration results as reference truth values for validation, enabling a more comprehensive assessment of the accuracy of the on-orbit absolute radiometric calibration coefficients obtained by the proposed method for other satellites, other cameras, and other seasons.
The proposed method was validated over a 180-day window with dedicated calibration-site imaging. In routine commercial operations, imaging priority is assigned to customer orders, not calibration sites. Consequently, even a 180-day window may not guarantee sufficient valid pixels for robust calibration under operational conditions. The long-term multitemporal analysis of a single camera, including temporal variability, contributing factors (e.g., seasonal surface reflectance, imaging geometry, methodological noise), and sensor degradation, requires future campaigns with sustained calibration-site prioritization. The minimum temporal record length needed to reduce methodological noise for accurate calibration and degradation estimation remains undetermined. These limitations will be addressed in subsequent work.
5. Conclusions
Traditional reflectance-based vicarious calibration methods exhibit significant technical limitations: their reliance on manual synchronous field measurements results in high operational and resource costs (Juan, 2017) [35]. Meanwhile, cross-calibration faces dual bottlenecks—first, its stringent spectral band-matching requirements hinder effective application to advanced multispectral satellite payloads (Wu, 2021) [36]; second, the demanding conditions for calibration sites and imaging parameter alignment restrict its practical frequency (Hu, 2024) [37]. For rapidly expanding large commercial constellations such as Jilin-1, which features numerous satellites each equipped with multiple cameras, neither site-based nor cross-calibration can meet the need for low-cost, high-frequency on-orbit absolute radiometric calibration (Tian, 2018) [38].
To address these challenges, this study—inspired by PICS-based cross-calibration and reflectance-based methods—extends the approach proposed by Yang et al. (2023) [4] and develops an automated on-orbit absolute radiometric calibration method using MODIS data products, with emphasis on low cost, high operational speed, and reliable accuracy.
In this method, the step that most significantly affects the overall usability is the radiative transfer simulation, which is accomplished using an LUT combined with interpolation. To validate the accuracy of the radiative transfer simulation results, several sets of typical input parameters were first used to derive the corresponding TOA radiance with the proposed method and the MODTRAN radiative transfer model, respectively. The comparison reveals relative errors within 1%, indicating that the LUT interpolation approach achieves high accuracy for these input parameters. To further verify the accuracy of the LUT method, this study performed a validation using TOA radiance data provided by MODIS. The apparent radiance simulated by the proposed radiative transfer method was compared with that from MOD02HKM/MYD02HKM. For the three selected bands, the slopes of the fitted lines all fall between 0.93 and 1, and all R2 values exceed 0.92. Therefore, compared with the MODIS TOA radiance product, the TOA radiance simulated by the LUT-Based Interpolation Method proposed in this study exhibits good consistency.
To validate the speed of the radiative transfer simulation and obtain more comprehensive results, two test methods were employed: (1) testing with image data, and (2) testing with randomly simulated input parameters. In both tests, the proposed method consumed approximately 15% of the time required by MODTRAN, and the running speed was independent of the input data distribution. Therefore, the method makes extensive use of the computer cache, enabling the entire LUT algorithm to maintain high efficiency during large-scale data reading. This robust approach to constructing the LUT provides a foundation for the rapid processing of massive datasets, making it feasible to apply the method to the on-orbit absolute radiometric calibration of large commercial satellite constellations.
For the PMS1 sensor onboard the JL1GF02F satellite, the absolute radiometric calibration coefficients were calculated using the proposed method for the period from 1 May to 31 October 2024. Two schemes were employed to validate the method: (1) site-based calibration using atmospheric and surface reflectance data from the Baotou, Railroad Valley Playa, and Gobabeb sites provided by RadCalNet; (2) cross-calibration using apparent radiance data from Sentinel-2 L1C over the Baotou and Dunhuang sites. The former utilizes high-precision ground-based observations to assess whether the proposed method meets the accuracy requirements, while the latter uses data from a well-calibrated sensor to evaluate the accuracy of the method over a wide range of reflectance. The site calibration results indicate that the maximum relative error across all bands does not exceed 4%. The cross-calibration results are somewhat different: for high-reflectance surfaces such as the Baotou desert, the relative error likewise remains within 4%; however, in the validation over water bodies in Dunhuang, the extremely low reflectance leads to an increase in relative error, though the absolute error remains within 2 W·m−2·sr−1. Therefore, the absolute radiometric calibration coefficients derived using the proposed method exhibit high accuracy and meet the requirements for on-orbit absolute radiometric calibration of large commercial satellite constellations.
Author Contributions
Conceptualization, X.Y., Q.L. and S.Y.; methodology, X.Y. and S.Y.; software, X.Y.; validation, Q.L., S.Y. and Y.B.; formal analysis, S.H. and Y.B.; investigation, Y.S., S.H. and H.W.; resources, J.L. and H.W.; data curation, Y.S. and J.L.; writing—original draft preparation, X.Y.; writing—review and editing, X.Y., S.Y. and W.W.; visualization, X.Z. and W.W.; supervision, S.H. and X.Z.; project administration, X.Y. and X.Z.; funding acquisition, Y.B. All authors have read and agreed to the published version of the manuscript.
Funding
This research was funded by the Science and Technology Development Program of Jilin Province, China, grant number 20240212002GX.
Data Availability Statement
Restrictions apply to the availability of these data.
Acknowledgments
We would like to thank the reviewers for their helpful comments.
Conflicts of Interest
Authors Xiaojie Yang, Song Yang, Yang Bai, Shuai Huang, Yingshan Sun, Jiangpeng Li, Hongyu Wu, Xing Zhong and Weibin Wang were employed by the company Chang Guang Satellite Technology Co., Ltd. The authors declare that the research was conducted in the absence of any commercial or financial relationships that could be construed as a potential conflict of interest.
References
- Gao, H.L.; Gu, X.F.; Yu, T.; Li, X.Y.; Gong, H.; Li, J.G. The research overview on visible and near-infrared channels radiometric calibration of space-borne optical remote sensors. Remote Sens. Inf. 2010, 4, 12. [Google Scholar]
- Zhang, Y. Cross-Calibration of HJ1-CCD; Shandong University of Science and Technology: Qingdao, China, 2012. [Google Scholar]
- Dinguirard, M.; Slater, P.N. Calibration of Space-Multispectral Imaging Sensors—The Quantitative Approach. Remote Sens. Environ. 1999, 68, 194–205. [Google Scholar]
- Yang, S.; Huang, S.; Bai, Y.; Jia, Y.; Ba, Q.; Tian, S.; Zhong, X. On-orbit Absolute Radiometric Calibration for the Multi-Spectral Imager of Jilin-1/GP02 based on Multiple Stable Targets. Remote Sens. Technol. Appl. 2023, 38, 803–815. [Google Scholar]
- Wang, F.; Zhang, W.; Wang, H.; Hou, Q. Influence of Motion Status on Multispectral Optical Characteristics of Satellites. Acta Opt. Sin. 2012, 32, 21–28. [Google Scholar] [CrossRef] [Scilit]
- Chander, G.; Hewison, T.J.; Fox, N.; Wu, X.; Xiong, X.; Blackwell, W.J. Overview of intercalibration of satellite instruments. IEEE Trans. Geosci. Remote Sens. 2013, 51, 1056–1080. [Google Scholar] [CrossRef] [Scilit]
- Ma, L.L.; Wang, N.; Gao, C.X.; Zhao, Y.; Yang, B.; Wang, X.; Han, Q.; Xu, N.; Song, P.; Liu, Y. On-orbit absolute radiometric calibration for optical remote sensing satellites: Progress and trends. Natl. Remote Sens. Bull. 2023, 27, 1061–1087. [Google Scholar] [CrossRef] [Scilit]
- Sanwlani, N.; Singh, C.; Chauhan, P. Post-launch calibration of the INSAT-3A-CCD geostationary satellite sensor. Int. J. Remote Sens. 2012, 33, 4871–4885. [Google Scholar] [CrossRef] [Scilit]
- Helder, D.; Markham, B.; Morfitt, R.; Storey, J.; Barsi, J.; Gascon, F.; Clerc, S.; LaFrance, B.; Masek, J.; Roy, D.P.; et al. Observations and recommendations for the calibration of Landsat 8 OLI and Sentinel 2 MSI for improved data interoperability. Remote Sens. 2018, 10, 1340. [Google Scholar] [CrossRef] [Scilit]
- Wang, L.; Hu, X.Q.; Chen, L. Wide dynamic nonlinear radiometric calibration of optical satellite sensors using multiple stable earth targets. J. Remote Sens. 2017, 21, 892–906. [Google Scholar] [CrossRef] [Scilit]
- Wang, W.; Zhang, L.M.; Si, X.L.; Huang, W.; Wang, J. On-orbit degradation monitoring technology for solar diffuser reflectance. Acta Opt. Sin. 2019, 39, 728005. [Google Scholar] [CrossRef] [Scilit]
- Doelling, D.R.; Wu, A.; Xiong, X.; Scarino, B.R.; Bhatt, R.; Haney, C.O.; Morstad, D.; Gopalan, A. The radiometric stability and scaling of collection 6 Terra-and Aqua-MODIS VIS, NIR, and SWIR spectral bands. IEEE Trans. Geosci. Remote Sens. 2015, 53, 4520–4535. [Google Scholar]
- Barsi, J.A.; Markham, B.L.; Czapla-Myers, J.S.; Helder, D.L.; Hook, S.J.; Schott, J.R.; Haque, O. Landsat-7 ETM+ radiometric calibration status. In Proceedings of the Earth Observing Systems XXI: Conference on Earth Observing Systems XXI, San Diego, CA, USA, 30 August–1 September 2016. [Google Scholar]
- Xiong, X.; Butler, J.J. MODIS and VIIRS calibration history and future outlook. Remote Sens. 2020, 12, 2523. [Google Scholar] [CrossRef] [Scilit]
- Zhang, P.; Lu, N.; Li, C.; Ding, L.; Zheng, X.; Zhang, X.; Hu, X.; Ye, X.; Ma, L.; Xu, N.; et al. Development of the Chinese space-based radiometric benchmark mission LIBRA. Remote Sens. 2020, 12, 2179. [Google Scholar] [CrossRef] [Scilit]
- Frouin, R.; Gautier, C. Calibration of NOAA-7 AVHRR, GOES-5, and GOES-6 VISSR/VAS solar channels. Remote Sens. Environ. 1987, 22, 73–101. [Google Scholar] [CrossRef] [Scilit]
- Slater, P.N.; Biggar, S.F.; Holm, R.G.; Jackson, R.D.; Mao, Y.; Moran, M.S.; Palmer, J.M.; Yuan, B. Reflectance-and radiance-based methods for the in-flight absolute calibration of multispectral sensors. Remote Sens. Environ. 1987, 22, 11–37. [Google Scholar]
- Biggar, S.F.; Slater, P.N.; Gellman, D.I. Uncertainties in the in-flight calibration of sensors with reference to measured ground sites in the 0.4–1.1 μm range. Remote Sens. Environ. 1994, 48, 245–252. [Google Scholar]
- Thome, K.J.; Arai, K.; Tsuchida, S.; Biggar, S.F. Vicarious calibration of ASTER via the reflectance-based approach. IEEE Trans. Geosci. Remote Sens. 2008, 46, 3285–3295. [Google Scholar]
- Qi, J.H.; Xuewen, Z.; Zhiyuan, Q.; Lei, Y.; Zhiqiang, P.; Li, L. Wide dynamic radiometric calibration of GF-1 PMS sensors using multi-test sites. Infrared Laser Eng. 2015, 44, 127–133. [Google Scholar]
- Gao, C.X.; Jiang, X.G.; Ma, L.L.; Huo, H.Y. Review of radiometric cross-calibration. Arid Land Geogr. 2013, 36, 139–146. [Google Scholar]
- Cao, C.; Xiong, X.; Wu, A.; Wu, X. Assessing the consistency of AVHRR and MODIS L1B reflectance for generating fundamental climate data records. J. Geophys. Res. Atmos. 2008, 113. [Google Scholar] [CrossRef] [Scilit]
- Gao, H.; Gu, X.; Yu, T.; Sun, Y.; Liu, Q. Cross-calibration of GF-1 PMS sensor with Landsat 8 OLI and Terra MODIS. IEEE Trans. Geosci. Remote Sens. 2016, 54, 4847–4854. [Google Scholar]
- Zhao, Y.; Ma, L.; Li, C.; Gao, C.; Wang, N.; Tang, L. Radiometric cross-calibration of Landsat-8/OLI and GF-1/PMS sensors using an instrumented sand site. IEEE J. Sel. Top. Appl. Earth Obs. Remote Sens. 2018, 11, 3822–3829. [Google Scholar]
- Wang, S.S.; Xiang, J.M.; Zhu, S.Y.; Chen, B.Y. Cross radiation calibration for blue channel of FY4A AGRI sensor by using MODIS data. Remote Sens. Inf. 2020, 35, 115–121. [Google Scholar]
- Ma, L.; Zhao, Y.; Li, W.; Yang, R.; Wang, R.; Wang, N.; Han, Q.; Lu, X.; Huang, F.; Zhao, J. Top-of-atmosphere radiometric reference model for stable land sites with relaxed temporal stability requirements and its application to GF6/WFI radiometric calibration and validation. Remote Sens. Environ. 2025, 326, 114796. [Google Scholar]
- Cosnefroy, H.; Leroy, M.; Briottet, X. Selection and characterization of Saharan and Arabian desert sites for the calibration of optical satellite sensors. Remote Sens. Environ. 1996, 58, 101–114. [Google Scholar] [CrossRef] [Scilit]
- Rao, C.R.N.; Chen, J. Revised post-launch calibration of the visible and near-infrared channels of the Advanced Very High Resolution Radiometer (AVHRR) on the NOAA-14 spacecraft. Int. J. Remote Sens. 1999, 20, 3485–3491. [Google Scholar]
- Helder, D.; Thome, K.J.; Mishra, N.; Chander, G.; Xiong, X.; Angal, A.; Choi, T. Absolute radiometric calibration of Landsat using a pseudo invariant calibration site. IEEE Trans. Geosci. Remote Sens. 2013, 51, 1360–1369. [Google Scholar] [CrossRef] [Scilit]
- Mishra, N.; Helder, D.; Angal, A.; Choi, J.; Xiong, X. Absolute calibration of optical satellite sensors using Libya 4 pseudo invariant calibration site. Remote Sens. 2014, 6, 1327–1346. [Google Scholar] [CrossRef] [Scilit]
- Song, P.; Ma, L.; Zhao, Y.; Wang, N.; Li, W.; Han, Q.; Liu, Y.; Yao, W.; Zhang, B.; Ren, L.; et al. Construction and validation of the TOA reflectance reference model for stable land surface targets by using Golmud desert site as an example. Natl. Remote Sens. Bull. 2023, 27, 1099–1113. [Google Scholar] [CrossRef] [Scilit]
- Ma, L.; Zhao, Y.; Woolliams, E.R.; Dai, C.; Wang, N.; Liu, Y.; Li, L.; Wang, X.; Gao, C.; Li, C.; et al. Uncertainty analysis for RadCalNet instrumented test sites using the Baotou sites BTCN and BSCN as examples. Remote Sens. 2020, 12, 1696. [Google Scholar]
- Bouvet, M.; Thome, K.; Berthelot, B.; Bialek, A.; Czapla-Myers, J.; Fox, N.P.; Goryl, P.; Henry, P.; Ma, L.; Marcq, S.; et al. RadCalNet: A radiometric calibration network for Earth observing imagers operating in the visible to shortwave infrared spectral range. Remote Sens. 2019, 11, 2401. [Google Scholar]
- Rivoire, L.; Clerc, S.; Alhammoud, B.; Romand, F.; Lamquin, N. Inter-Sensor Level 1 Radiometric Comparisons Using Deep Convective Clouds. Remote Sens. 2024, 16, 4445. [Google Scholar] [CrossRef] [Scilit]
- Juan, L.I.; Lian, F.; Xiaoping, P. Comparison of the cross-calibration methods between image-based and RTM-BRDF for GF-1 images. Acta Geod. Et. Cartogr. Sin. 2017, 46, 882. [Google Scholar]
- Wu, J.; Chen, C.; Liu, Y. The preliminary study of the radiometric cross-calibration of Zhuhai-1/OHS. Remote Sens. Technol. Appl. 2021, 36, 791–802. [Google Scholar]
- Hu, K.; Du, W.L.; Xie, Y.H. On-orbit radiometric calibration of JL-1 satellite based on the moon. Chin. Space Sci. Technol. 2024, 44, 154–163. [Google Scholar]
- Tian, Y.; Zhang, Q.; Wang, T.; Xu, Q. Lookup Table Allocation for Approximate Computing with Memory Under Quality Constraints//2018 Design, Automation & Test in Europe Conference & Exhibition (DATE); IEEE: Piscataway, NJ, USA, 2018; pp. 153–158. [Google Scholar]
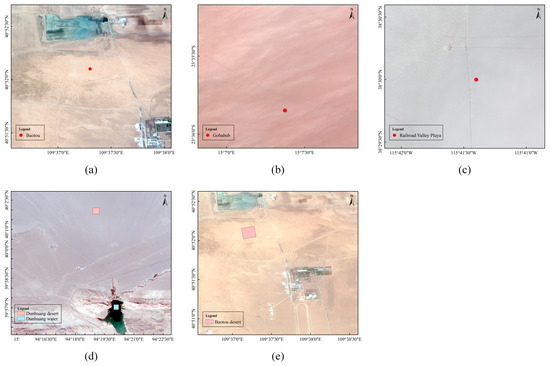
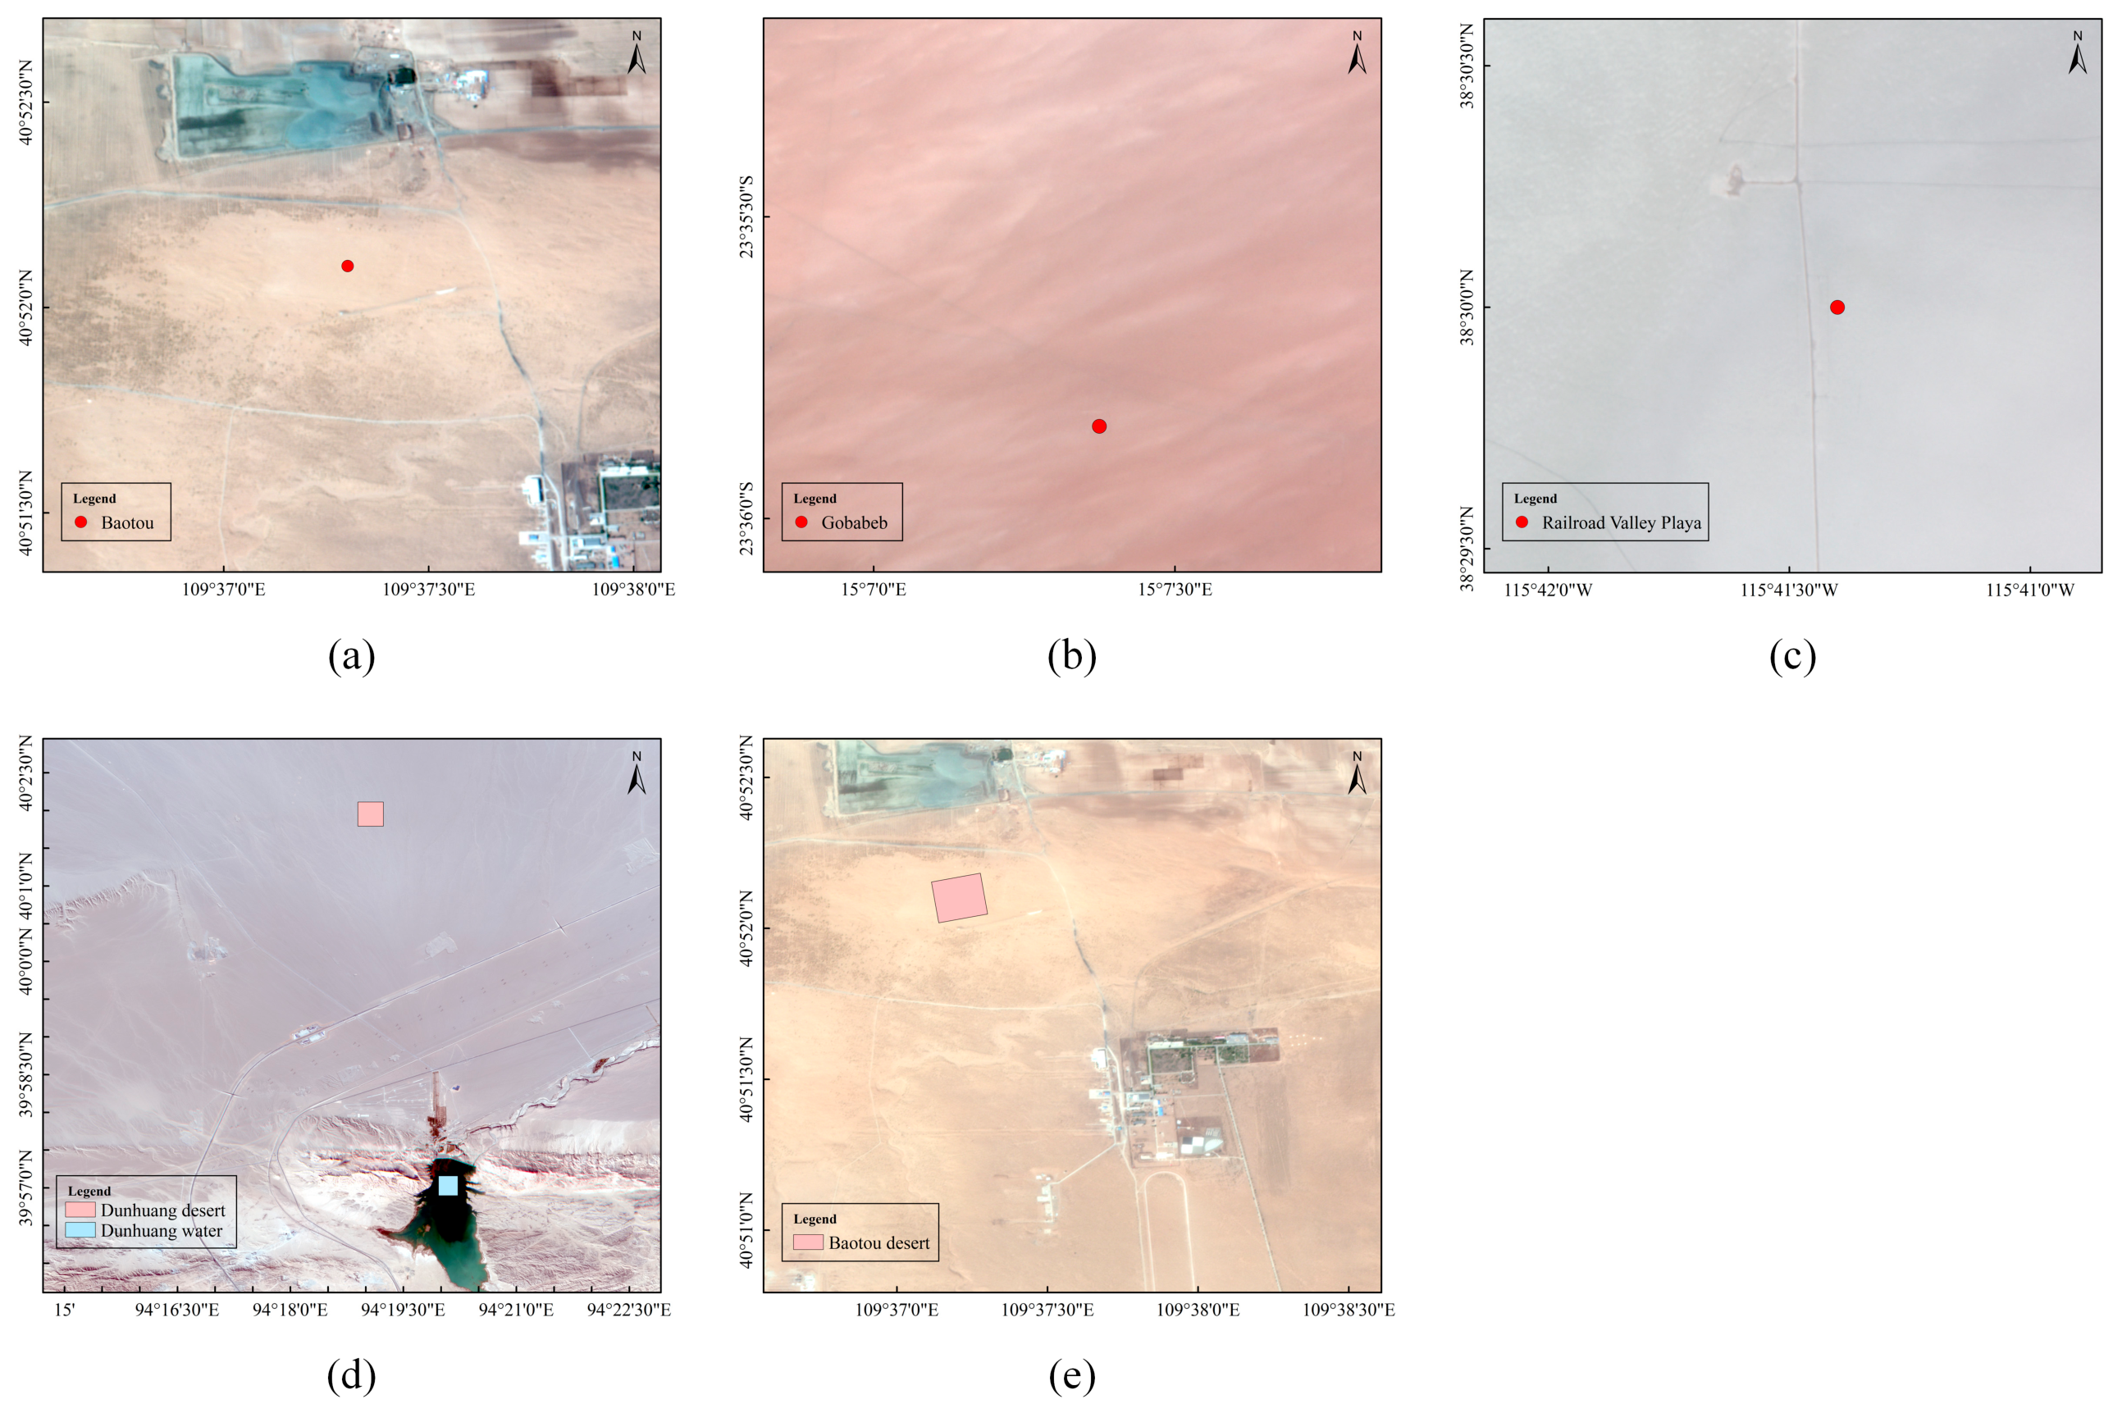
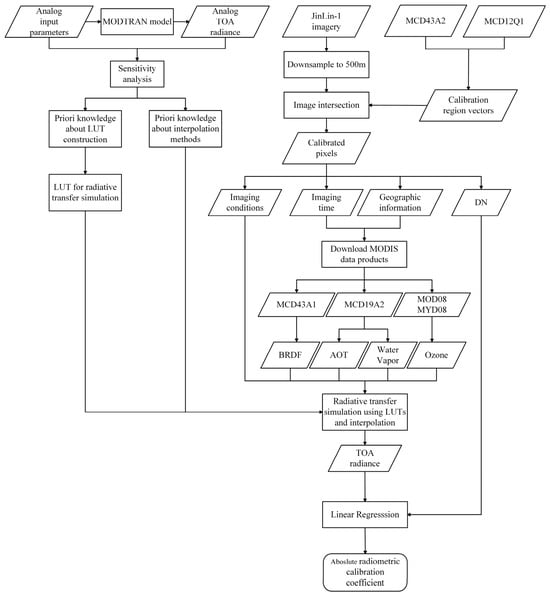
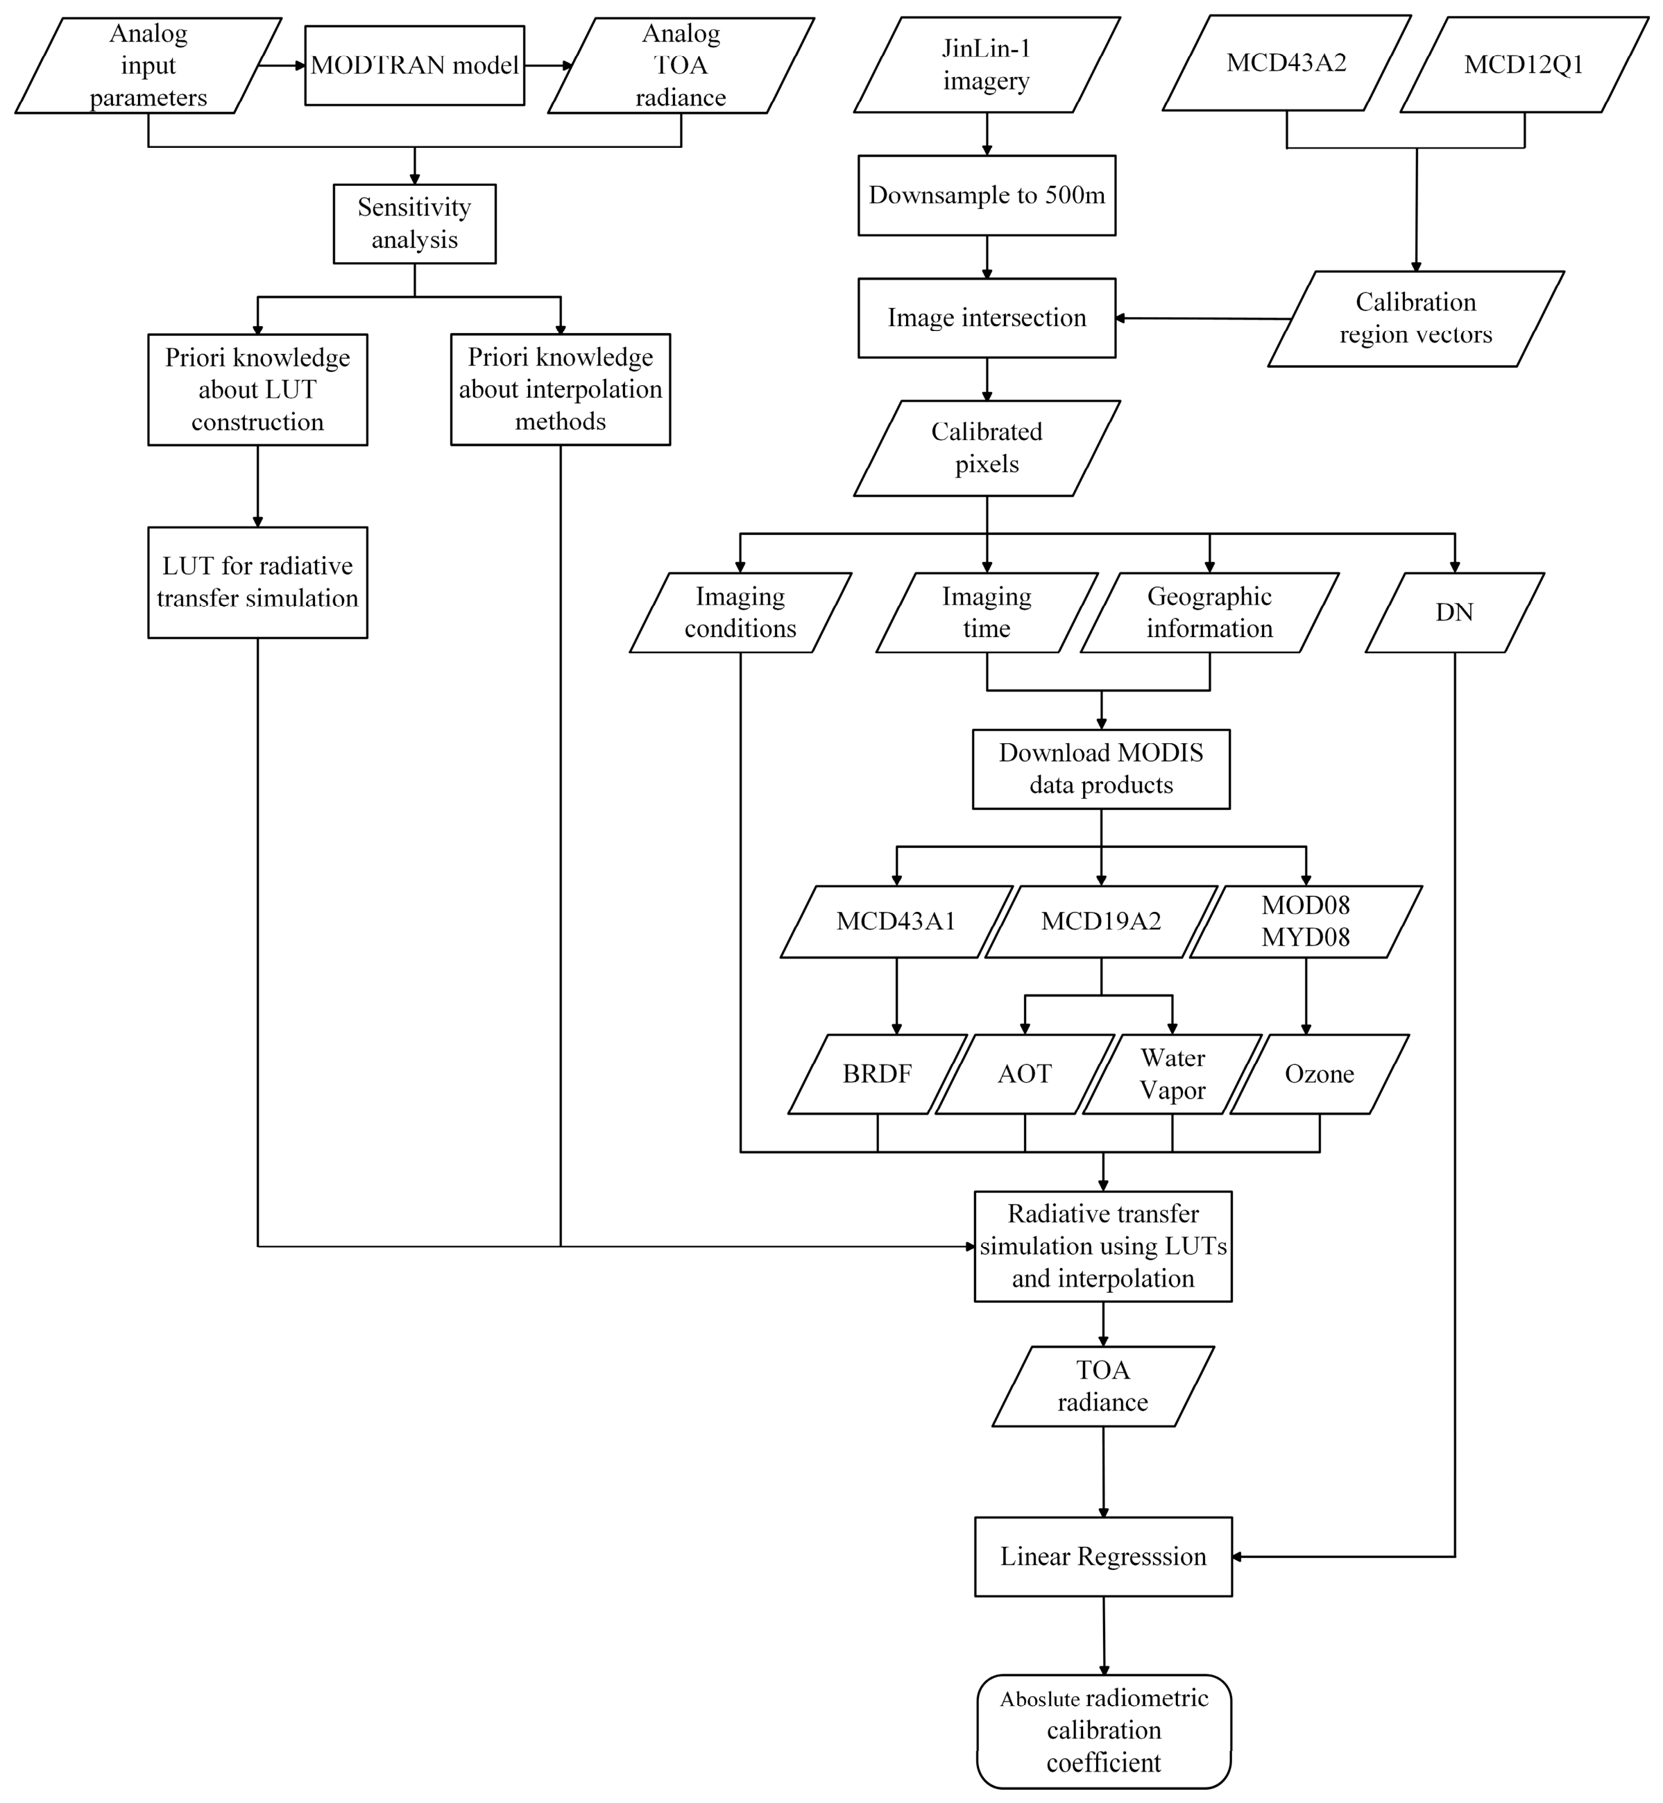
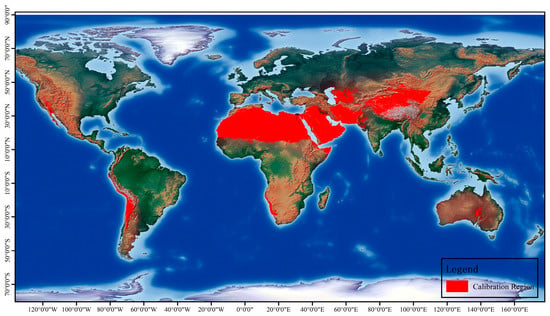
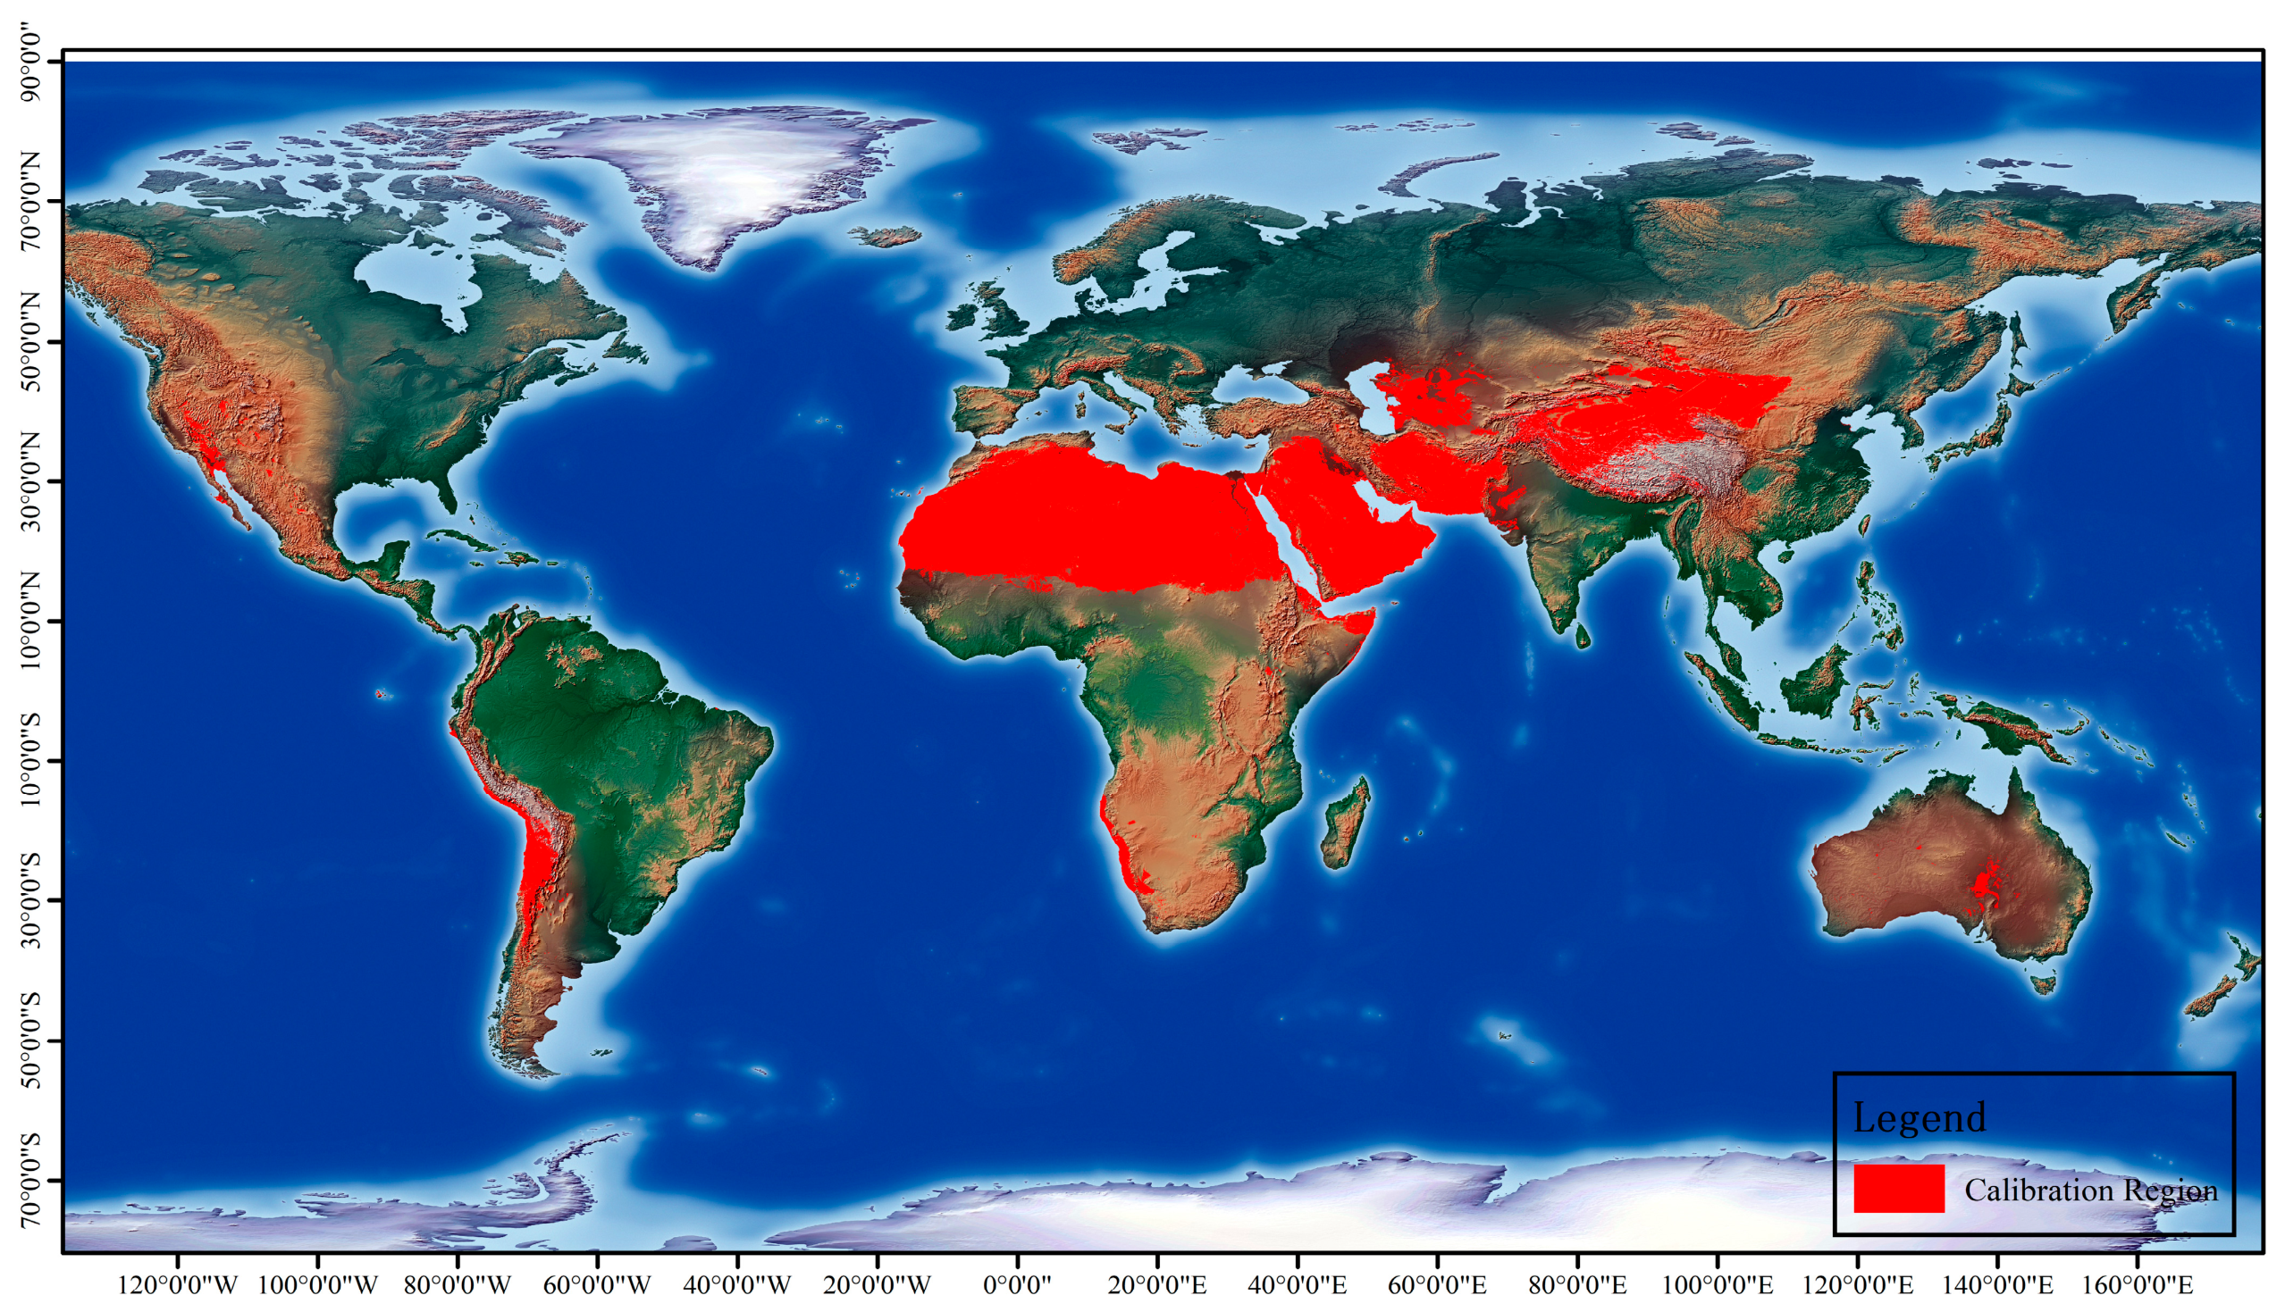
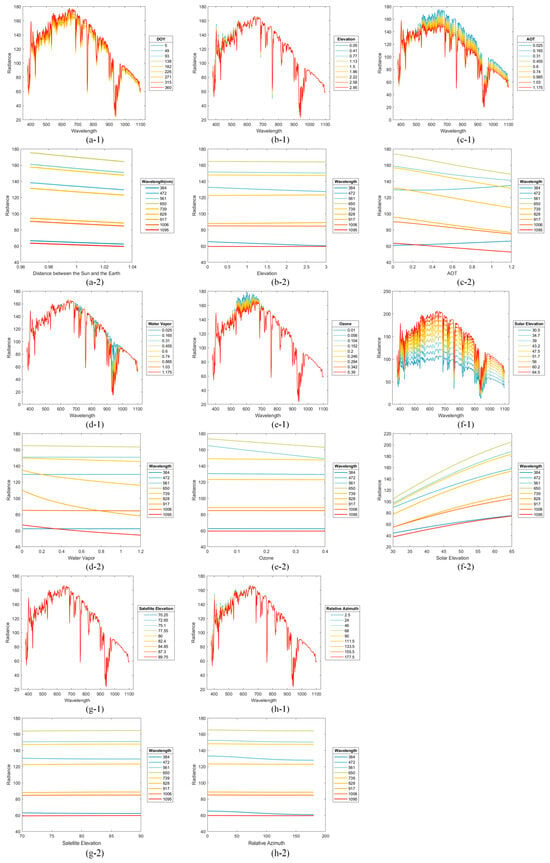
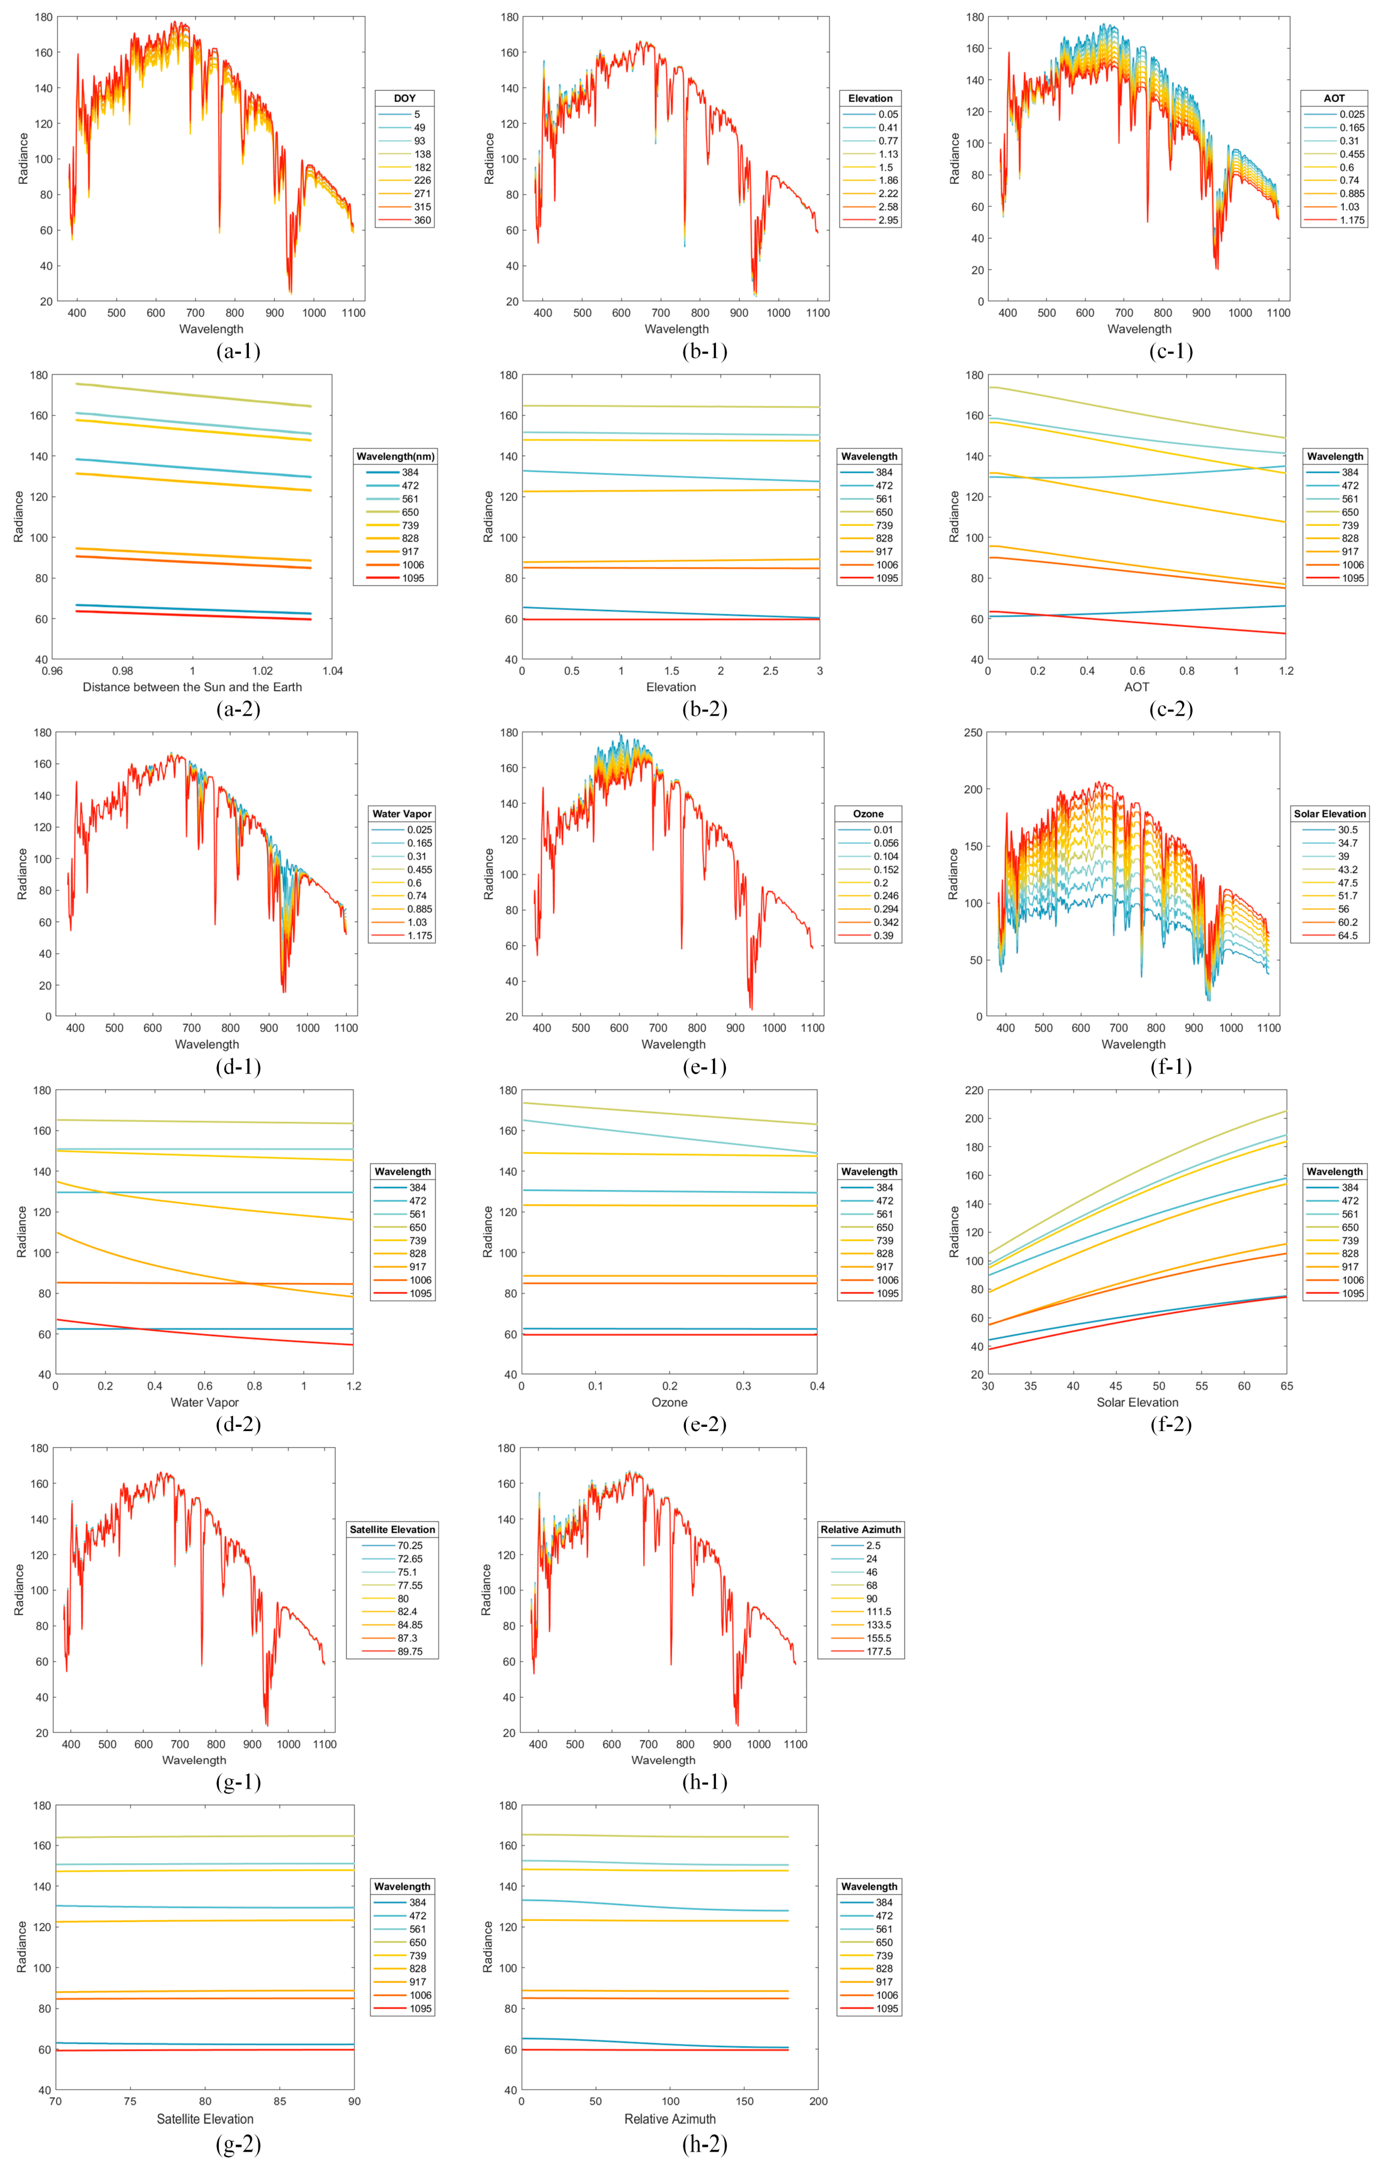
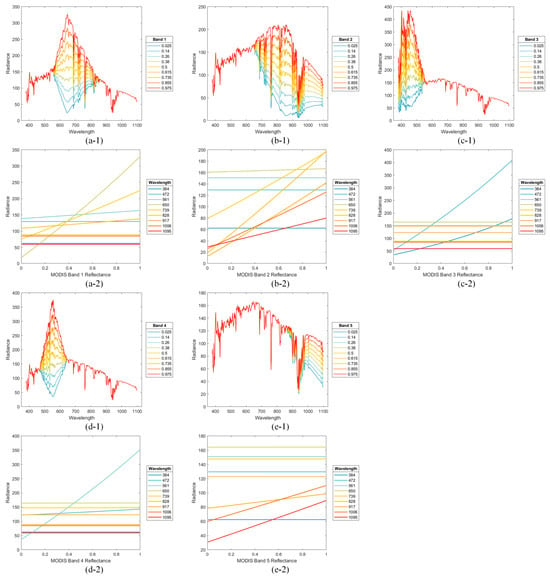
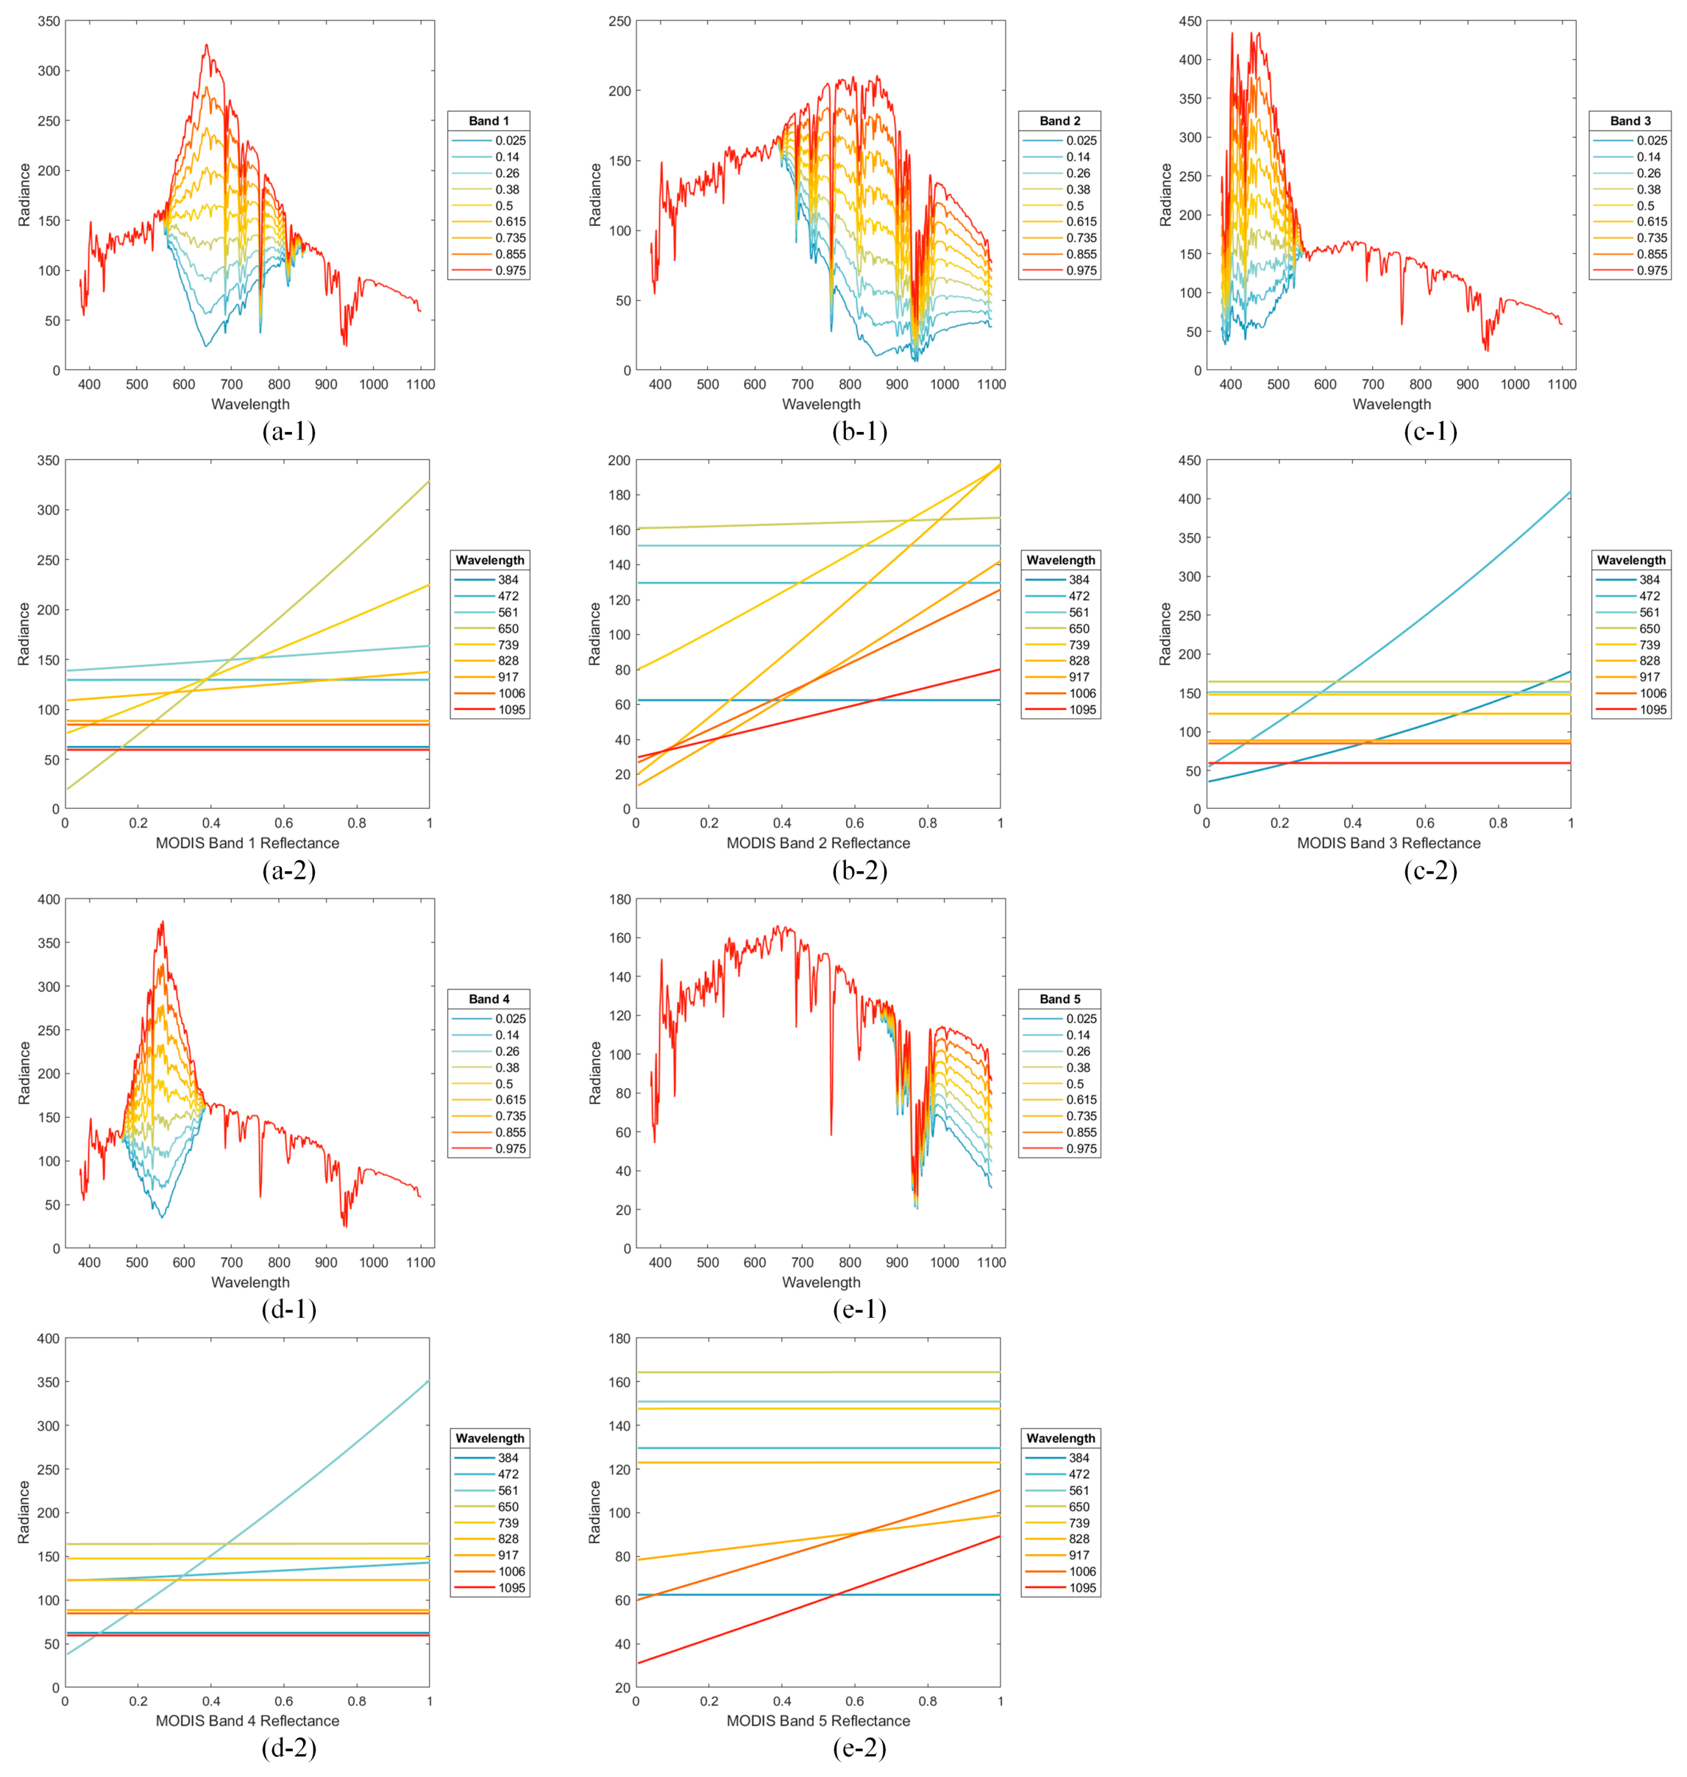
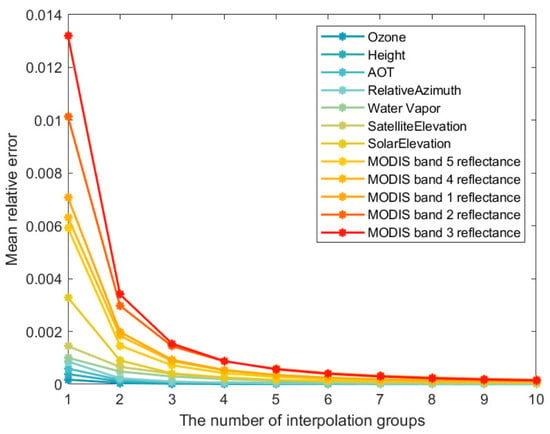
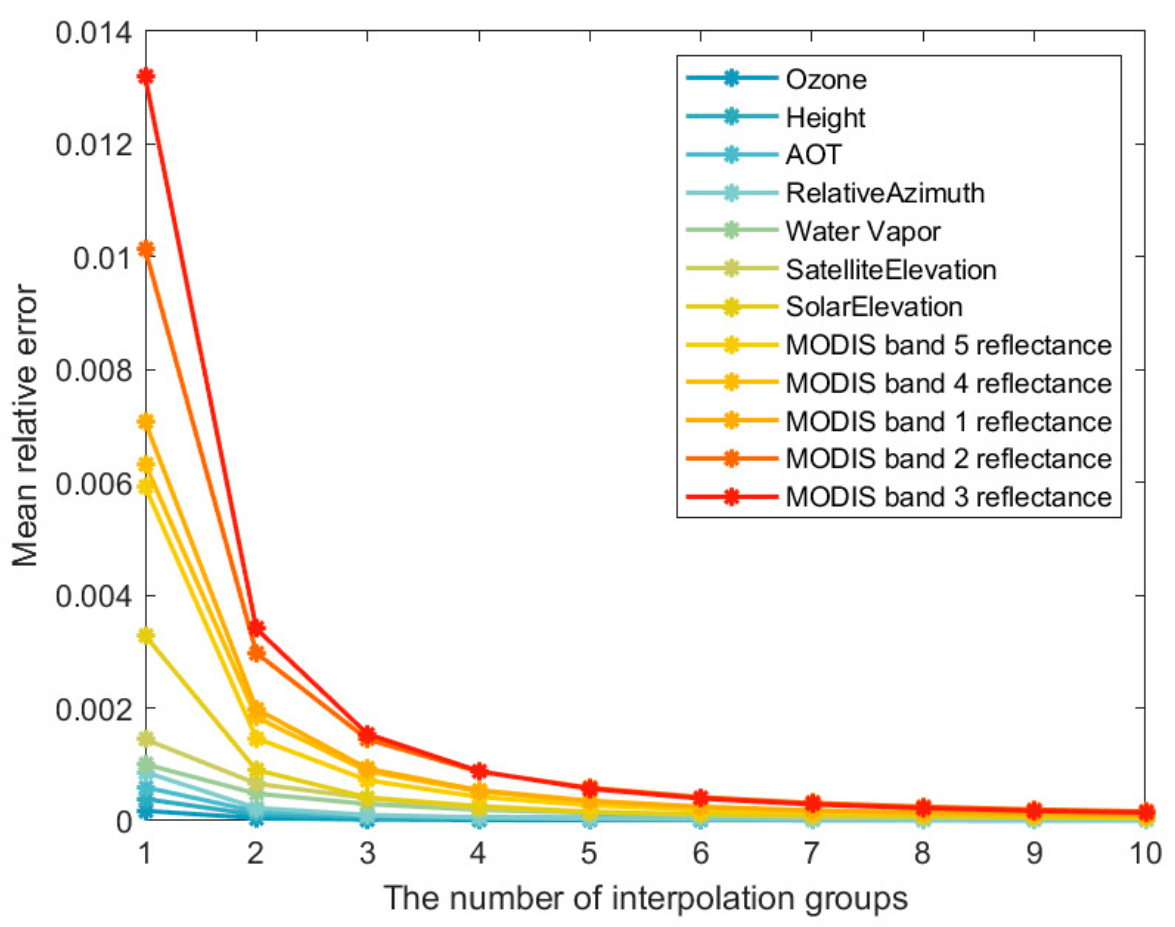
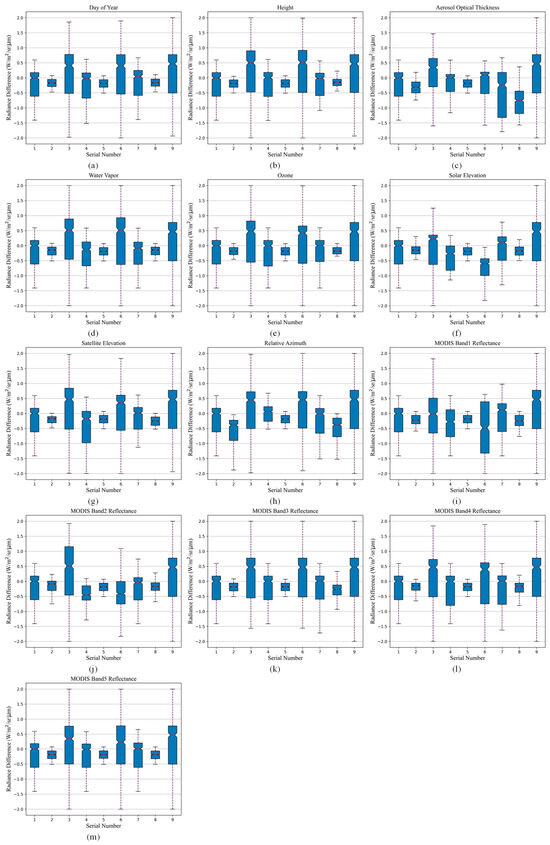
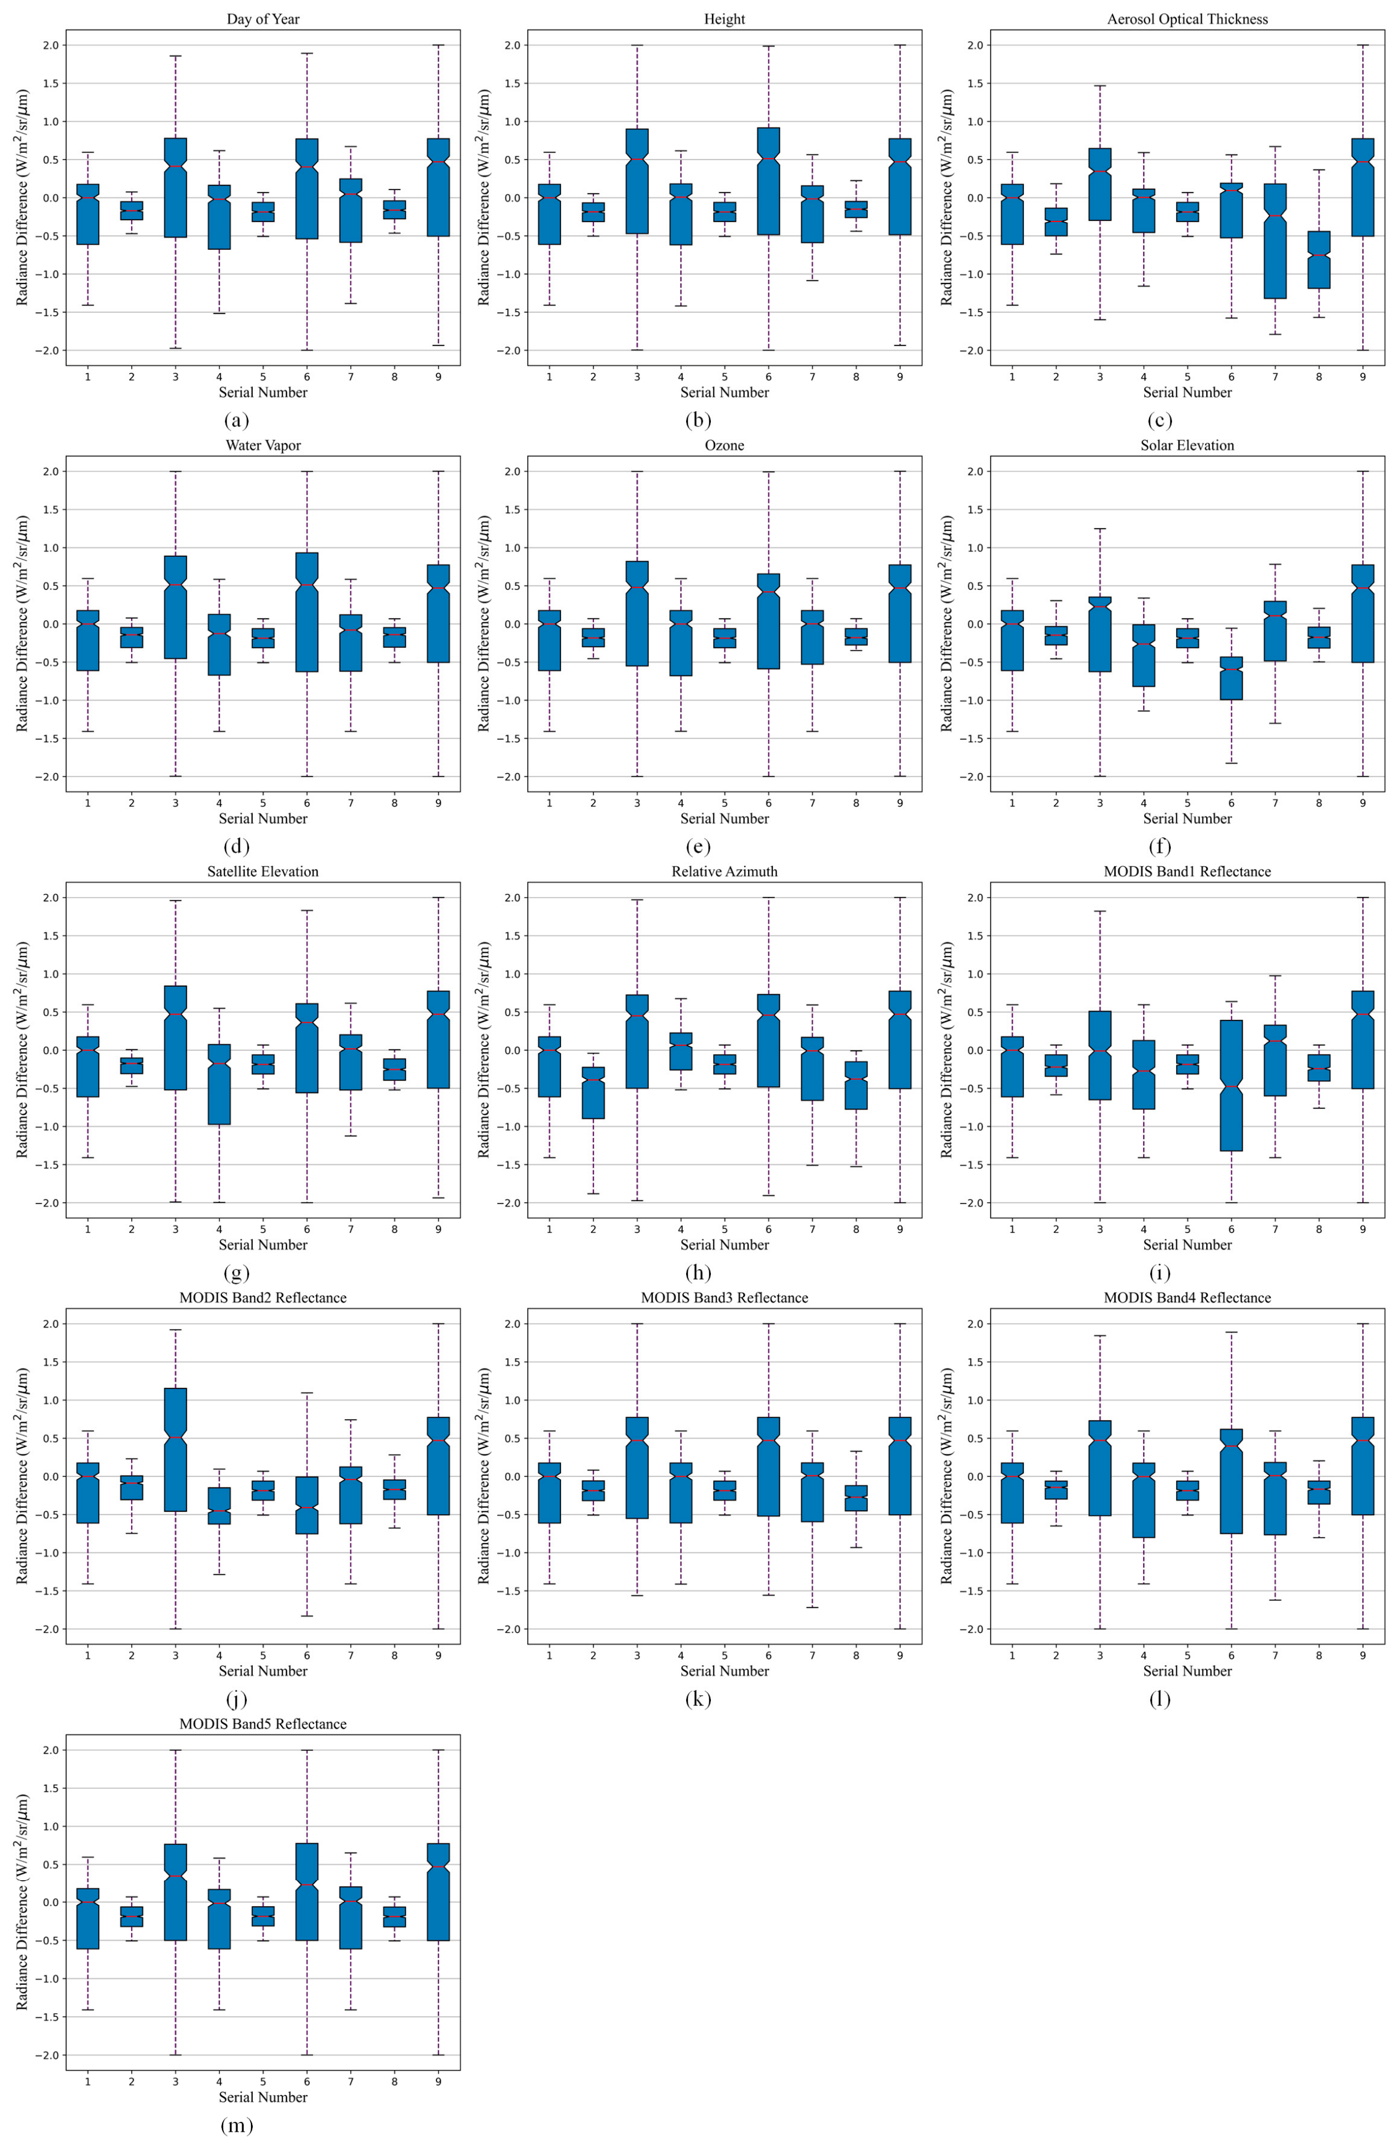
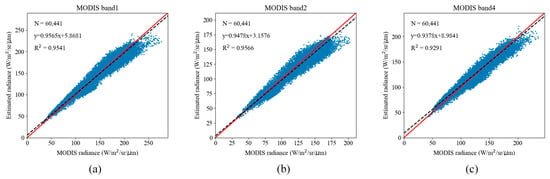
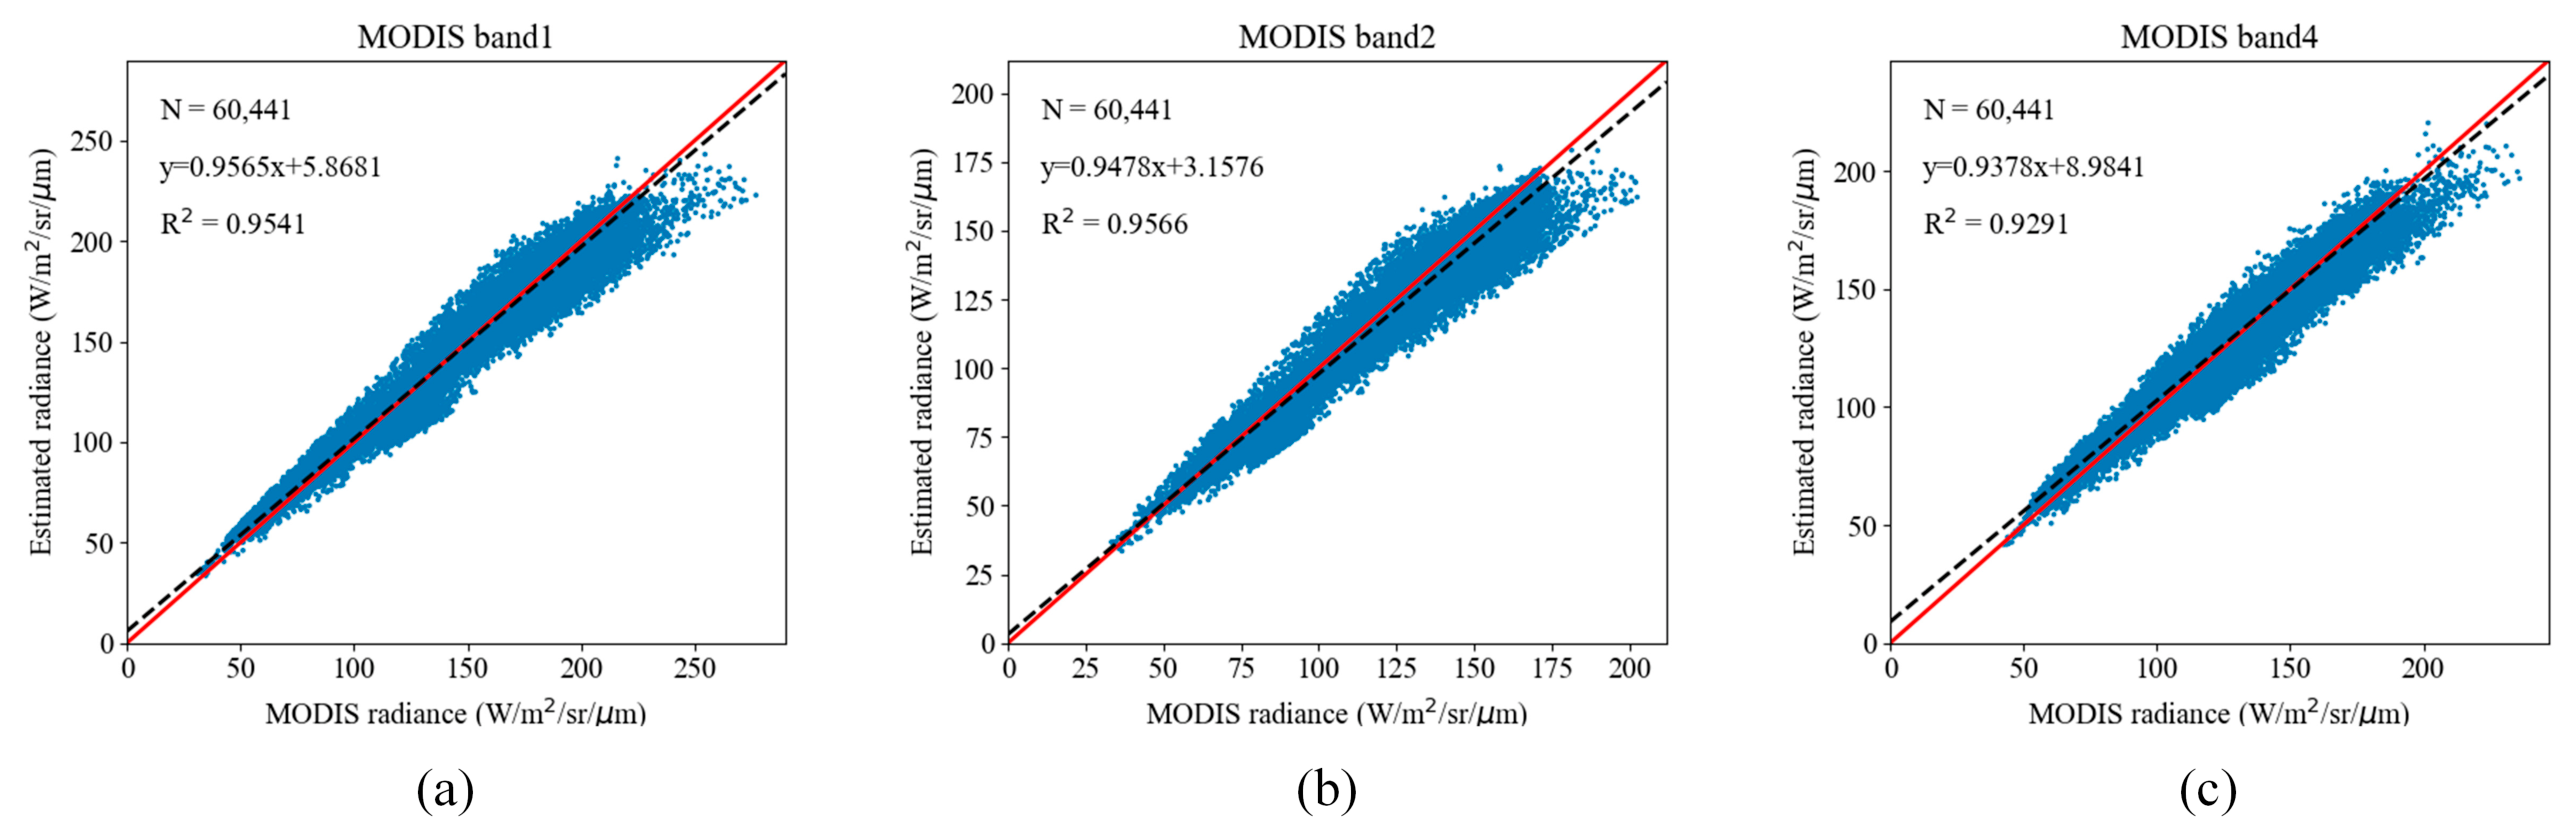
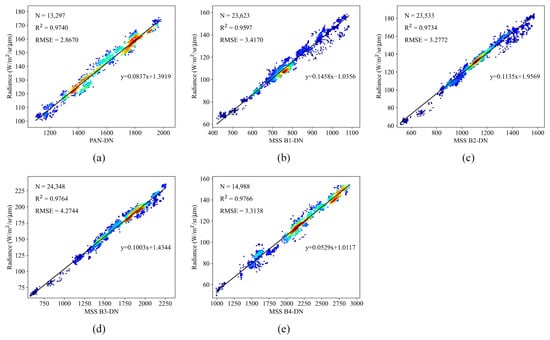
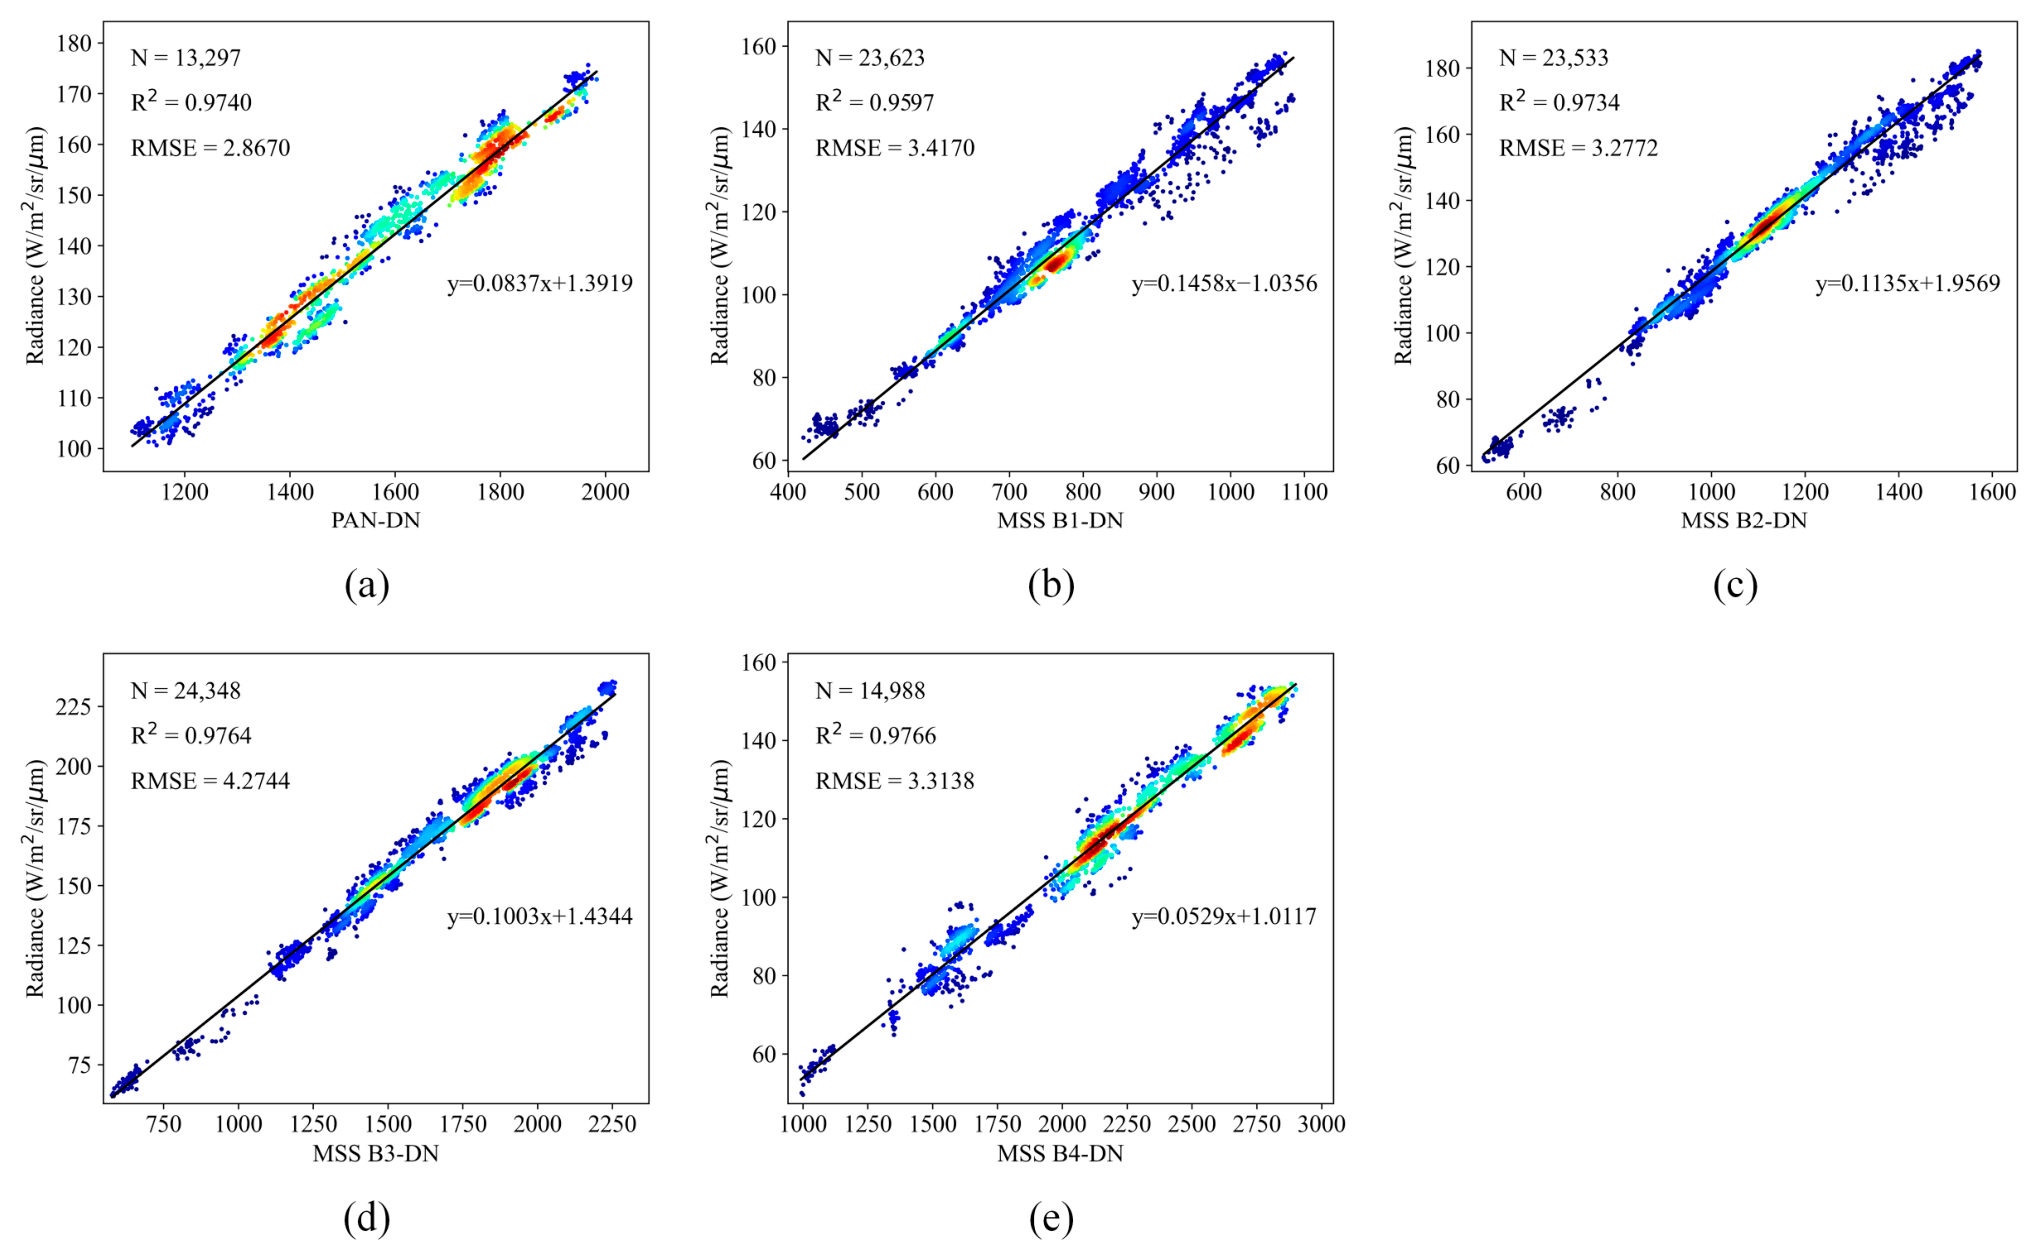

Disclaimer/Publisher’s Note: The statements, opinions and data contained in all publications are solely those of the individual author(s) and contributor(s) and not of MDPI and/or the editor(s). MDPI and/or the editor(s) disclaim responsibility for any injury to people or property resulting from any ideas, methods, instructions or products referred to in the content. |
© 2026 by the authors. Licensee MDPI, Basel, Switzerland. This article is an open access article distributed under the terms and conditions of the Creative Commons Attribution (CC BY) license.