


Highlights
What are the main findings?
- UAV-based multispectral and hyperspectral imaging combined with machine learning accurately estimated nitrogen uptake in wheat and canola across three years and contrasting irrigated and rain-fed environments.
- Artificial Neural Networks (ANN) provided the best performance with multispectral data, while ANN and Support Vector Regression achieved the highest accuracies with hyperspectral data.
What are the implications of the main findings?
- Multi-year, multi-site datasets improved model transferability and reduced overfitting, supporting robust nitrogen estimation across diverse environmental conditions.
- Hyperspectral imaging enhanced prediction accuracy, while multispectral imaging offered a practical and cost-effective alternative for operational precision nitrogen management.
Abstract
Unmanned Aerial Vehicle (UAV)-based remote sensing using high-throughput spectral imaging has emerged as an effective non-destructive alternative for large-scale agricultural monitoring. This study evaluates the performance of UAV-based multispectral (MSI) and hyperspectral (HSI) imaging combined with machine learning for estimating in-season nitrogen uptake in spring wheat and canola. Field trials were conducted at irrigated and non-irrigated sites in southern and central Alberta, Canada, respectively, over three growing seasons (2023–2025). Coincident with ground-truth tissue sampling, aerial imagery was collected and processed to train and validate six machine learning models, using ~520 matchups per crop. All models successfully estimated nitrogen uptake across years and locations, although performance varied by sensor and data types. For canola, ANN produced the highest MSI-based accuracy (R2 = 0.83, RMSE = 0.5%), whereas HSI data improved prediction performance, with SVR achieving the best results (R2 = 0.90, RMSE = 0.40%). In wheat, ANN yielded the highest accuracy for both MSI and HSI data (R2 = 0.77, RMSE = 0.54% for MSI; R2 = 0.8, RMSE = 0.48% for HSI). These findings demonstrate that UAV-based spectral imaging combined with machine learning provides a reliable and scalable approach for non-destructive nitrogen uptake estimation. Although MSI sensors produced strong predictive performance, the enhanced spectral resolution of HSI data consistently improved estimation accuracy for both crops across varied growing conditions.
1. Introduction
In precision agriculture, nitrogen (N) fertilizer is a critical input that underpins crop productivity and nutritional quality, particularly for staple crops such as wheat and canola [1]. However, excessive and inefficient application of nitrogen poses significant economic and environmental challenges. Over-application is a primary contributor to greenhouse gas (GHG) emissions, particularly nitrous oxide (N2O), and poses severe environmental risks through nitrate leaching into water systems and ammonia volatilization [2]. Consequently, accurately monitoring crop nitrogen status throughout the growing season is essential for optimizing the soil–plant nitrogen balance, reducing environmental footprints, and improving overall Nitrogen Use Efficiency (NUE).
Traditional methods for estimating plant nitrogen content rely heavily on destructive tissue sampling followed by laboratory analysis [3]. These conventional techniques are subjective, labor-intensive, time-consuming, and costly, making them highly impractical for large-scale, real-time agricultural monitoring. In response, high-throughput remote sensing has emerged as a promising, non-destructive alternative for measuring plant traits and nitrogen uptake [4,5,6,7]. While satellite-based observations have historically dominated crop trait estimation, their spatial and temporal resolutions often limit precise field-scale applications [8]. Recent advances in lightweight sensors mounted on Unmanned Aerial Vehicles (UAVs) now enable high-resolution and timely crop monitoring for precision management [9].
Among UAV sensing technologies, multispectral imaging (MSI) and hyperspectral imaging (HSI) are widely used to capture spectral signatures associated with plant health and nutrient status [10,11]. The growing prominence of HSI in precision agriculture stems from its fundamental advantages over traditional broadband remote sensing technologies [12,13]. While conventional RGB and MSI sensors aggregate reflected light into a few wide, discontinuous spectral bands, HSI captures a near-continuous spectrum across hundreds of narrow channels [12,14]. This ultra-high spectral resolution enables the detection of subtle physiological, chemical, and pigment variation, such as minor shifts in the red-edge region, even before structural changes become visible to broader bands [13,15]. Several studies have demonstrated their potential for nitrogen estimation [16,17,18]. For example, ref. [19] successfully employed multisource data fusion, combining multispectral, RGB, and thermal infrared imagery to estimate nitrogen levels in winter wheat. Similarly, ref. [20] utilized UAV-based hyperspectral imagery to assess nitrogen levels in paddy rice, demonstrating that vegetation indices can accurately estimate leaf and whole-plant nitrogen concentrations across various growth stages. Furthermore, ref. [21] showed that UAV-based hyperspectral imaging combined with advanced algorithms yielded superior prediction accuracy for winter wheat nitrogen concentration compared to traditional multispectral approaches.
Despite these advancements, translating complex spectral data into accurate, generalizable nitrogen estimations remains a challenge. The relationship between spectral reflectance and crop biochemical traits is highly non-linear and is significantly influenced by crop-specific structural traits. For instance, ref. [22] noted that variations in canopy structural effects significantly influence the remote estimation of leaf nitrogen concentration. To handle the high-dimensional nature of these data, researchers have increasingly turned to Machine Learning (ML) algorithms [23]. Techniques such as Partial Least Squares Regression (PLSR; [24]) effectively handle multicollinearity in spectral data, whereas Support Vector Regression (SVR; [25]) captures non-linear relationships in high-dimensional feature spaces. Ensemble methods such as Extreme Gradient Boosting (XGBoost; [26]), Gradient Boosting Regression (GBR; [27]), and Random Forest (RF; [28]) offer high computational efficiency and robust performance for structured datasets. Additionally, Artificial Neural Networks (ANN; [29]) leverage interconnected nodes to capture intricate patterns within high-dimensional spectral features.
Although ML models have shown strong potential, their transferability across environments is often limited by overfitting [11], primarily because most studies rely on constrained datasets restricted to a single location or growing season. Such limitations prevent these models from generalizing to broader agricultural landscapes, including diverse irrigated and non-irrigated environments. Furthermore, a significant knowledge gap remains regarding the comparative efficacy of MSI versus HSI data when applied identically across different crop architectures and complex ML pipelines. Relying solely on spectral reflectance in these models also limits their contextual understanding of nitrogen dynamics; however, introducing agronomic metadata can mitigate these performance limitations. For instance, preliminary findings by [11] demonstrated that integrating non-spectral data, specifically fertilizer treatment (TRT) and days after in-crop treatment (DAT), significantly improved nitrogen uptake predictions by providing contextual information related to crop development and management timing. Addressing these remaining gaps requires a unified approach that leverages extensive multi-year data, robustly compares sensor types across varied crops, and integrates non-spectral metadata to ensure highly generalizable nitrogen estimations.
To address these gaps, this study presents a comprehensive multi-year evaluation of UAV-based nitrogen uptake estimation in spring wheat and canola. The objectives were to: (1) compare the predictive performance of MSI and HSI data for nitrogen estimation; and (2) evaluate six machine learning algorithms (PLSR, SVR, XGBoost, ANN, RF, and GBR) across both spectral datasets. The study also investigates crop-specific spectral responses associated with differing canopy structures. Model robustness and transferability were assessed using an extensive three-year dataset (2023–2025) collected from irrigated and non-irrigated field trials in Alberta, Canada.
2. Materials and Methods
2.1. Study Sites and Experimental Design
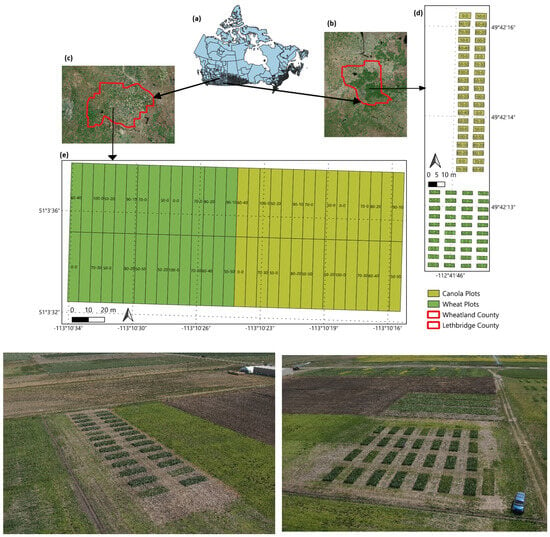
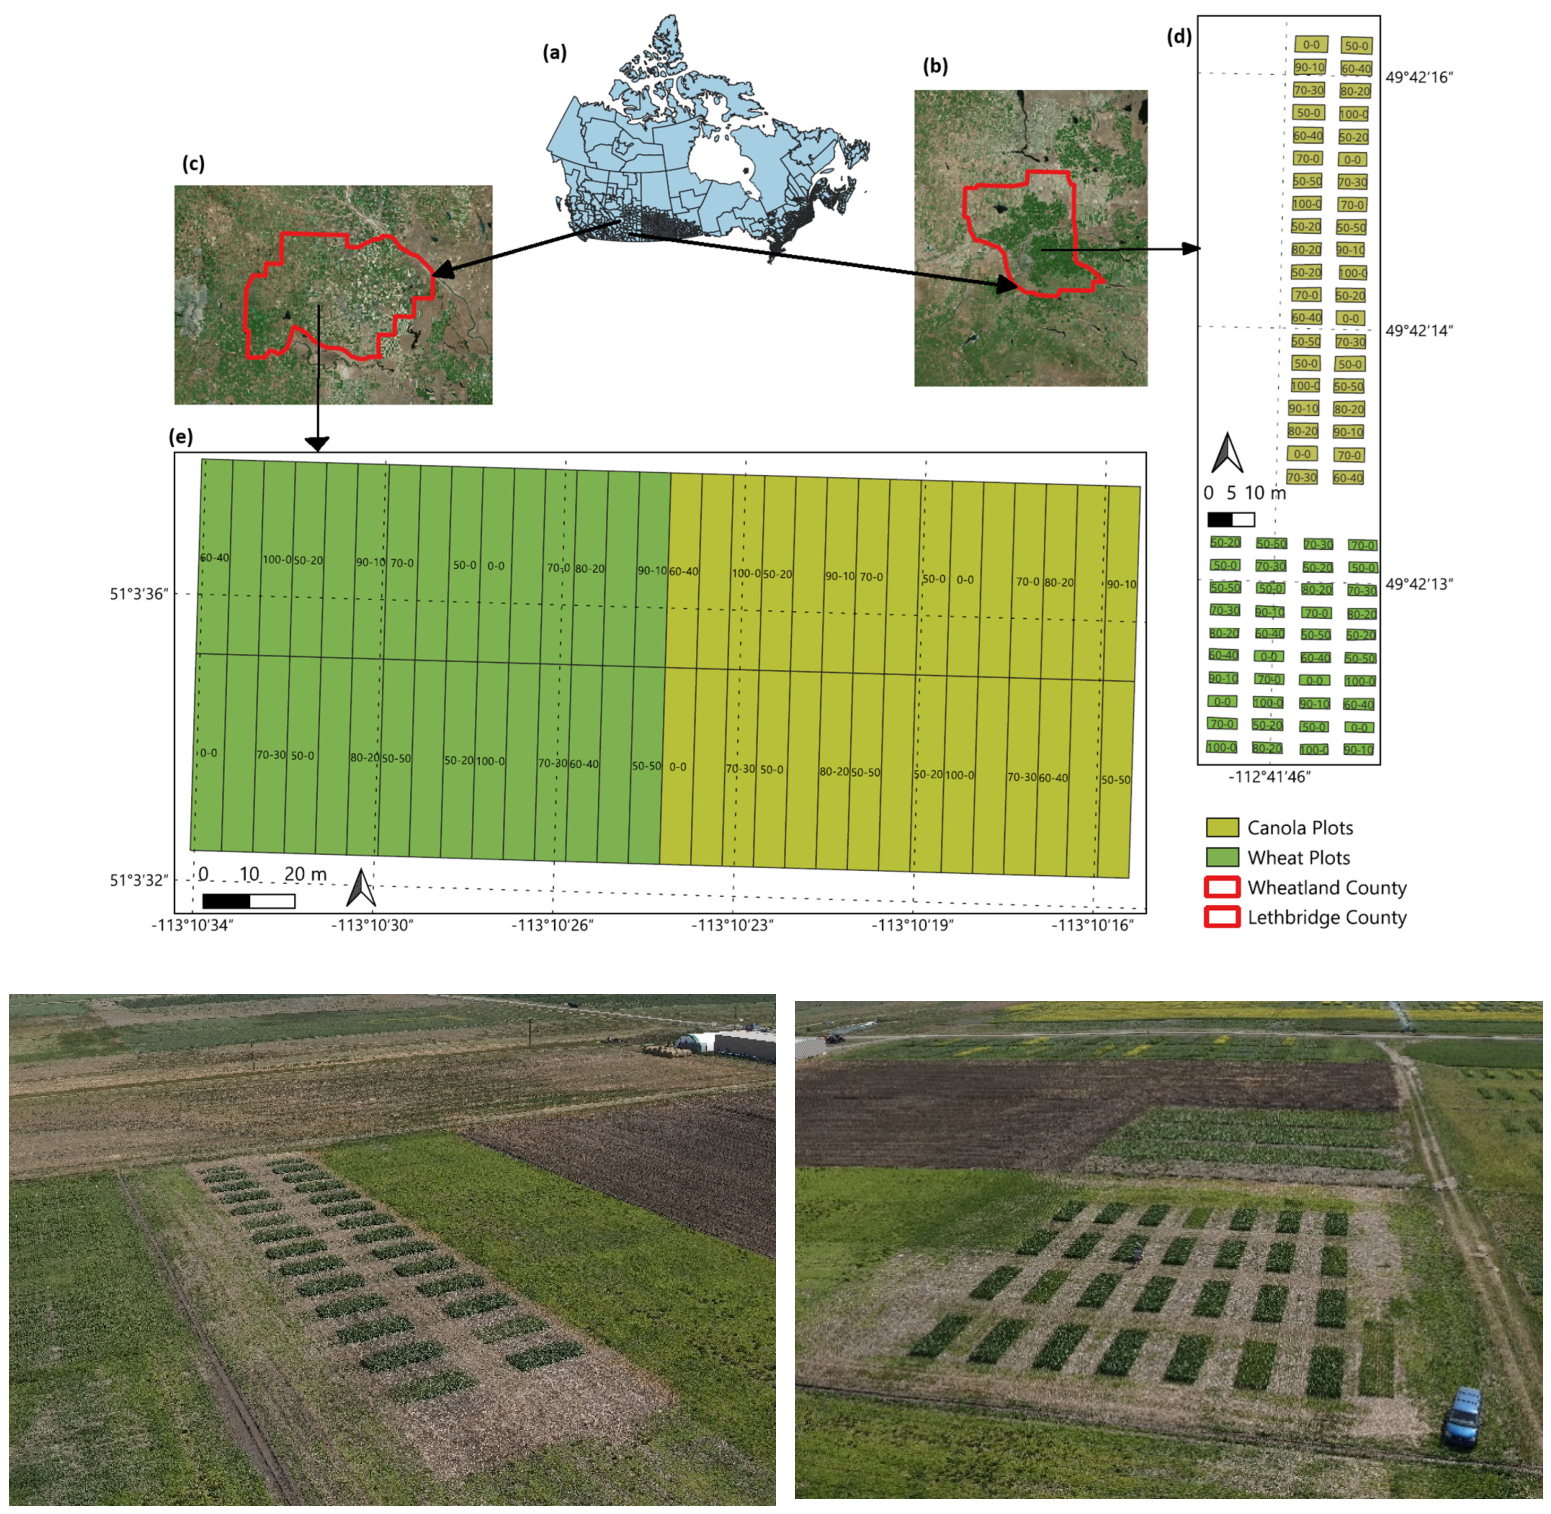
The study was conducted over three consecutive growing seasons (2023–2025) at two distinct agro-climatic locations in central and southern Alberta, Canada (Figure 1). The first site was an irrigated field trial at the Agriculture and Agri-Food Canada (AAFC) Fairfield Research Farm in Lethbridge County (49°42′12.7″N, 112°41′51.4″W). The site is characterized by gently rolling terrain with an approximate 2% slope and medium-textured Orthic Dark Brown Chernozem soils. Average growing season temperature and cumulative precipitation were approximately 14 °C and 200 mm, respectively. The second site, managed by John Deere (JD; Deere & Company, Moline, IL, USA), was a rain-fed (non-irrigated) field trial located near Strathmore in Wheatland County (51°3′30.17″N, 113°10′26.34″W). This site features hummocky, medium-relief terrain with slopes reaching approximately 9% and consists of Orthic and Calcareous Dark-Brown Chernozem soils. The average growing season temperature was approximately 13 °C, with cumulative precipitation near 250 mm.
Figure 1.
The geographical location of field trials in (a) Canada, (b) Lethbridge County agricultural division and (c) Wheatland County. (d,e) are respectively showing canola and wheat plots at Fairfield and Strathmore trials, with their associated nitrogen application at and after seeding. Overhead imagery of the canola and wheat trials at AAFC are also displayed in (left) and (right bottom), respectively.
The experiments at both sites were established using a randomized complete block design (RCBD). Two crop varieties were evaluated: spring wheat (AAC Viewfield) and canola (InVigor L345PC). Seeding rates were standardized at 300 seeds m−2 for wheat and 120 seeds m−2 for canola. Plot dimensions differed between locations to accommodate site-specific equipment, with AAFC plots measuring 2.5 m × 6 m and JD plots measuring 90 m × 35 m. Relevant weed control programs were followed for their respective crop to keep the trial in a weed-free state.
To evaluate nitrogen management strategies, multiple nitrogen (N) treatment regimes were applied using granular urea fertilizer and liquid Urea-Ammonium Nitrate (UAN). During the pilot year (2023), experiments were conducted only at the AAFC Fairfield site using seven treatments. In 2024 and 2025, the study expanded to include the JD Strathmore site, and the experimental design increased to ten treatments per crop. Treatments consisted of an untreated control, a 100% N application at seeding, and split N applications between seeding and in-crop stages (90–10%, 80–20%, 70–30%, 60–40%, 50–50%, 70–0%, 50–20%, and 50–0%). The final three treatments were not included in the 2023 pilot year. The N at seeding consisted of urea placed in a mid-row band, while the in-crop treatment was liquid UAN applied using a tractor-mounted CO2 sprayer outfitted with streamer nozzles (PSSTCQ10015: Straight-stream ceramic, Deere & Company, Moline, IL, USA). In-crop N was applied at the late tillering stage for wheat and 4–6 leaf stage for canola. The 100% N rate was determined based on the Prairie Nutrient Calculator (https://prairienutrientcalculator.info/) after accounting for plot-level NO3-N in the top 60 cm of the soil profile. The total N requirements for wheat and canola were determined using target yields of 4842 and 3228 kg ha−1, respectively. The AAFC trials included four replicates, resulting in 28 plots per crop in 2023 and 40 plots per crop in 2024–2025, while the JD trials used two replicates for a total of 20 large size plots per crop. In total, 296 canola and wheat plots were evaluated over the three-year study period and used as regions of interest (ROIs) for subsequent analyses.
2.2. UAV-Based Image Acquisition
To compare the efficacy of different spectral resolutions, both multispectral (MSI) and hyperspectral (HSI) imagery were acquired. Flights were conducted on sunny days near solar noon across key phenological stages: a baseline pre-application (in-crop) flight (late June), mid-season intervals (late July), i.e., approximately 25–30 days after treatment (DAT), 50–60 DAT (mid-late August), and prior to harvest (Early September). This campaign resulted in 18 flights per sensor per crop, totaling 72 images.
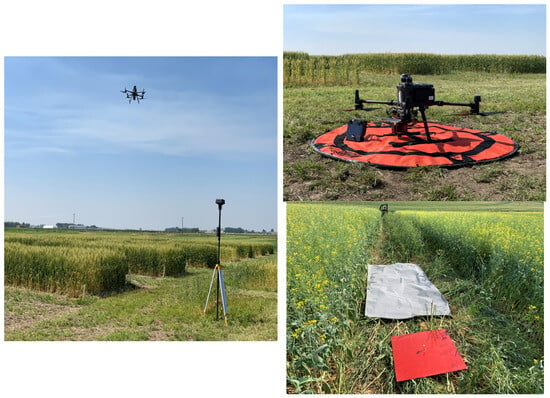
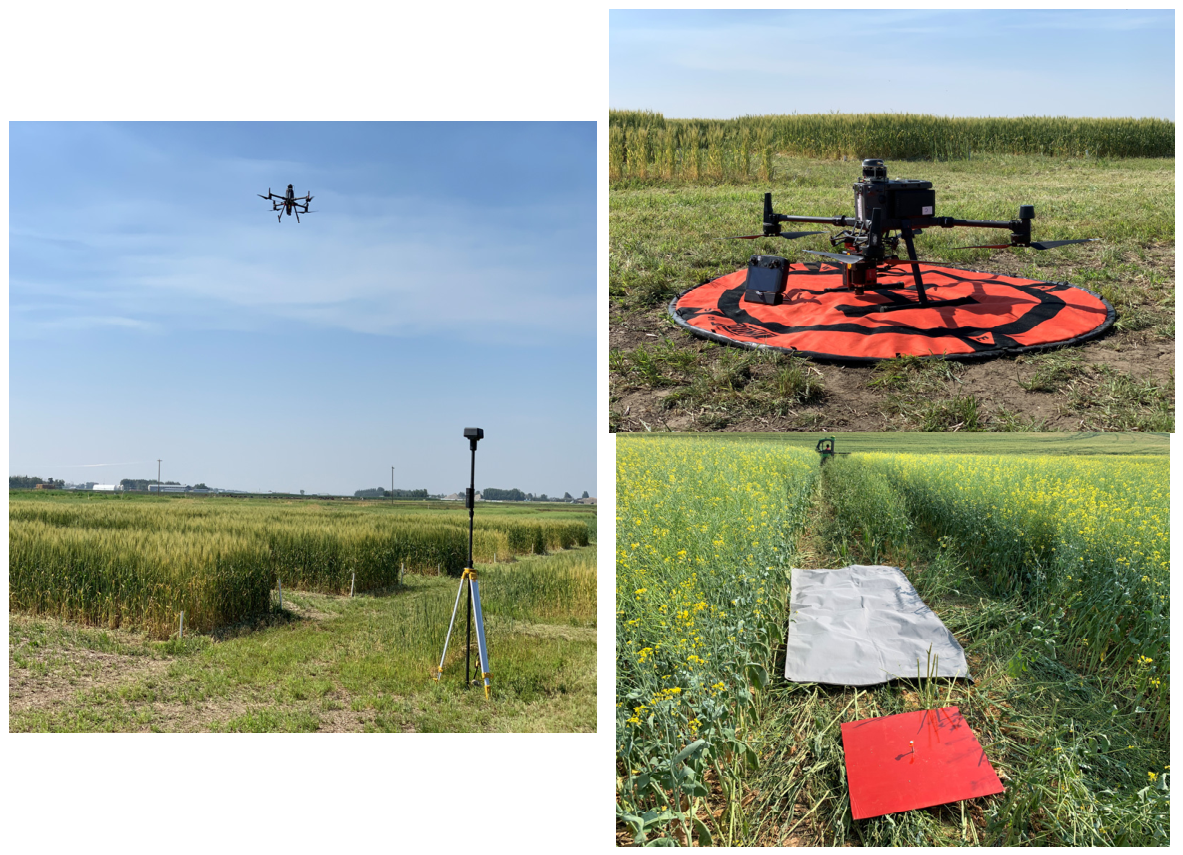
- Multispectral Imaging (MSI): A MicaSense RedEdge-P multispectral camera (MicaSense, Inc., Seattle, WA, USA) capturing five discrete spectral bands (blue, green, red, red-edge, and near-infrared) was mounted on a DJI-M300 RTK drone (SZ DJI Technology Co., Ltd., Shenzhen, China). Flights were conducted at 25 m above ground level (AGL) with a flight speed of 2.5 m/s, maintaining an 80–85% forward and lateral overlap (Figure 2). This configuration yielded a ground sampling distance (GSD) of 1.63 cm/pixel. Radiometric calibration was performed using a white reflectance panel and a downwelling irradiance sensor (DLS-2) to compensate for ambient light fluctuations.
- Hyperspectral Imaging (HSI): HSI data were collected using a Pika-L hyperspectral camera (Resonon Inc., Bozeman, MT, USA) mounted on a DJI-M350 RTK drone. This sensor captures 300 spectral channels ranging from 400 nm to 1000 nm, with a fine spectral resolution of 2.7 nm. The UAV was flown at 30 m AGL at a speed of 2 m/s. A 24% reflectance calibration tarp placed within the field was utilized for image radiometric calibration (Figure 2). For all flights, a D-RTK2 GNSS base station was deployed to ensure high positional accuracy during image acquisition (Figure 2).
Figure 2.
Representative photographs illustrating key steps of data collection conducted during the study: (top right) UAV equipped with MSI/HSI sensors prior to flight operations; (bottom right) calibration tarp used for radiometric calibration of HSI imagery; and (left) UAV flying over crop plots equipped with the DJI D-RTK 2 system.
2.3. Ground Truth Data Collection
Coinciding with the UAV flights, intensive field sampling was conducted to gather ground-truth biochemical parameters. To determine the appropriate baseline nitrogen application rates for each plot, comprehensive soil sampling was performed pre-seeding, alongside post-harvest soil tests to measure residual NO3-N levels. During the active growing season, plant leaf tissue samples were collected directly from the plots at identical intervals (baseline, two mid-season, and pre-harvest). These tissue samples were analyzed by Down to Earth Labs (Lethbridge, AB, Canada) to quantify total nitrogen in the plant tissue. At harvest time, nitrogen values were measured using a separate, whole-plant nitrogen method, which included both grain and straw, since the plants had senesced and dried. These whole-plant measurements were incorporated into the modeling dataset because preliminary evaluations showed that their inclusion increased the volume of training data without reducing model performance, thereby improving the robustness of the machine learning models.
2.4. Image Processing and Data Integration
The raw spectral imagery underwent radiometric and geometric correction before being stitched into geo-referenced orthomosaics using Pix4D v4.9.0 (Pix4D Mapper, Prilly, Switzerland) for MSI data and SpectrononPro v3.4.10 (Resonon Inc., Bozeman, MT, USA) for HSI data. To ensure spectral signatures accurately represented the crop canopy rather than background interference, open-source Python (v3.12)-based tools were applied to remove bare soil, shadow, and canola flowering pixels.
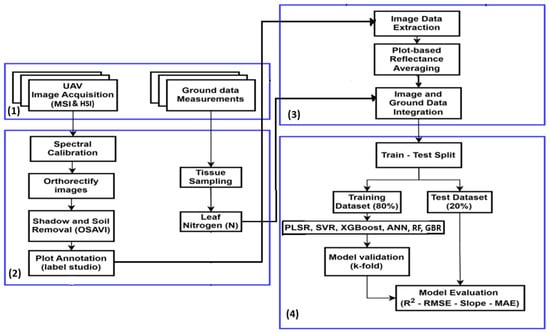
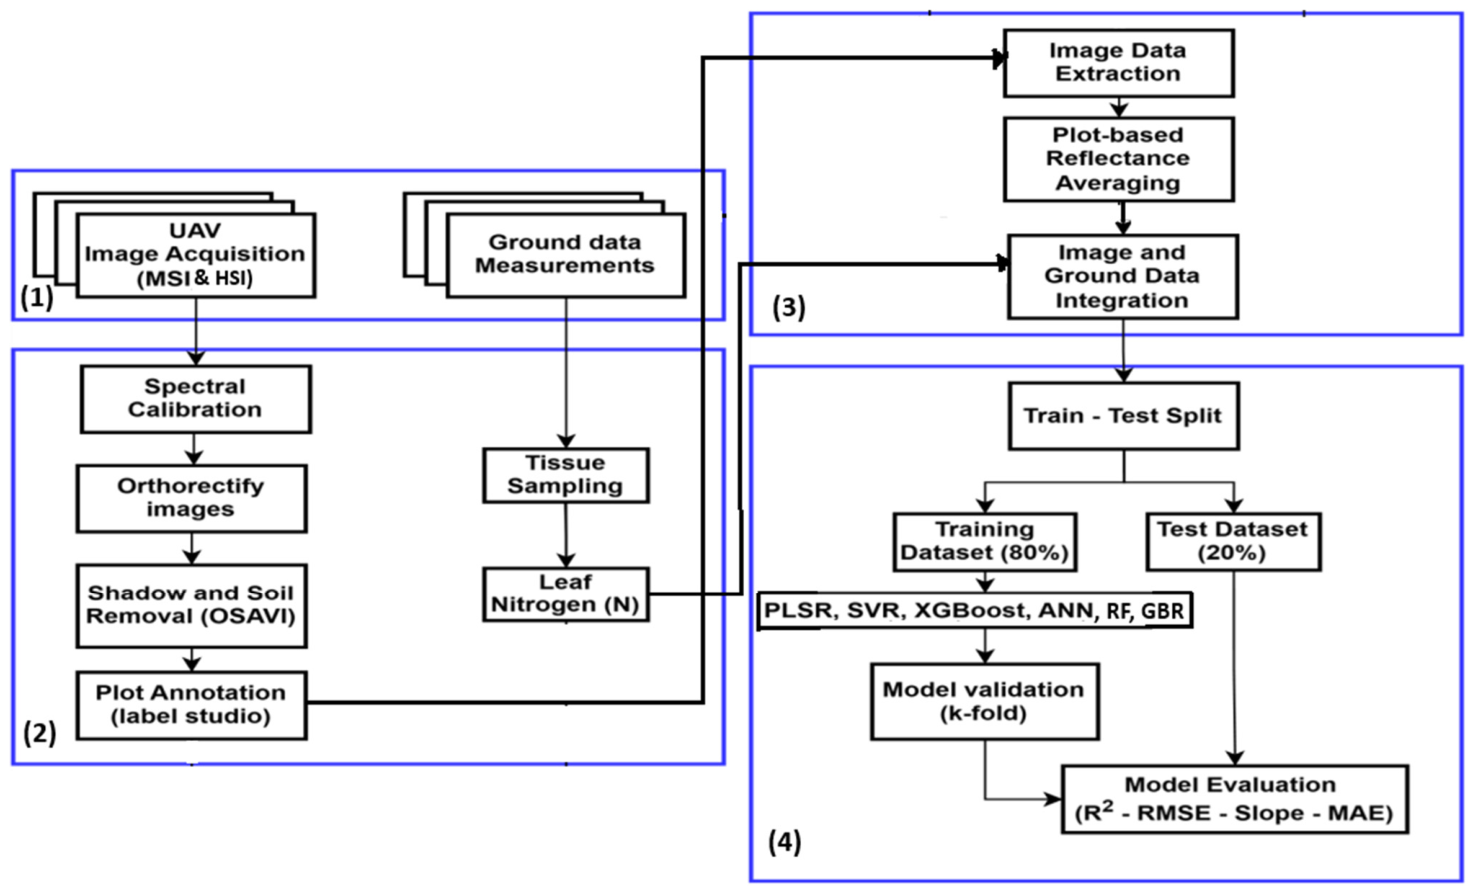
Following background removal, plot boundaries were delineated, and average reflectance values were extracted for each plot. These reflectance values were spatially aggregated and matched with the corresponding in situ nitrogen tissue samples. Combining three years of multi-site data (2023–2025) produced robust datasets exceeding 520 matchups per crop (e.g., N = 523 for canola MSI, N = 521 for canola HSI, N = 523 for wheat MSI, and N = 520 for wheat HSI), enabling comprehensive and transferable machine learning analyses. Figure 3 illustrates the overall workflow of the study.
Figure 3.
The UAV-based crop nitrogen uptake estimation workflow comprised four phases: (1) Data Acquisition, involving multi-year (2023–2025) collection of tissue nitrogen samples and coincident MSI and HSI imagery; (2) Data Processing, including spectral calibration, orthorectification, soil-background removal, and plot annotation; (3) Data Integration, where plot-level mean spectral signatures were linked to corresponding ground-truth nitrogen measurements; and (4) Predictive Modeling, involving the optimization, training, and evaluation of six machine learning regression algorithms for nitrogen uptake estimation.
2.5. Machine Learning Modeling and Evaluation
To estimate crop nitrogen uptake, six machine learning regression algorithms were trained and evaluated: Partial Least Squares Regression (PLSR), Support Vector Regression (SVR), Extreme Gradient Boosting (XGBoost), Artificial Neural Networks (ANN), Random Forest (RF), and Gradient Boosting Regression (GBR). PLSR serves as a linear baseline that reduces dimensionality by projecting predictors into latent variables that maximize explained variance [24]. SVR maps features into a high-dimensional space using a Radial Basis Function (RBF) kernel to establish a non-linear decision boundary defined by support vectors within a robust error margin [25]. The remaining models capture complex, non-linear relationships through diverse structural architectures. ANN utilizes interconnected node layers optimizing weight adjustments via backpropagation [29], while the ensemble tree methods (RF, GBR, and XGBoost) combine multiple decision trees to stabilize variance and minimize bias [27,28], with XGBoost specifically leveraging advanced regularization and gradient frameworks to maximize computational efficiency and predictive accuracy [26].
Following the framework proposed by [11], non-spectral variables were incorporated to provide the ML models with additional agronomic context. Specifically, fertilizer treatment regime (TRT) and days after in-crop application (DAT) were engineered and appended to the spectral reflectance feature set. This integrated feature space enabled the models to account for crop phenological stages and the temporal dynamics of nitrogen uptake associated with split-application strategies [11].
To robustly evaluate model performance and reduce overfitting, a nested cross-validation framework was implemented, ensuring that hyperparameter tuning was conducted independently from observations reserved for out-of-fold validation. Because the objective was to utilize the complete dataset to identify the most suitable machine learning algorithm and system configuration for nitrogen uptake estimation, this validation strategy maximized data efficiency while maintaining unbiased performance evaluation. The outer evaluation loop used five-fold cross-validation, repeatedly withholding 20% of samples for validation. Within each outer training subset, an inner four-fold cross-validation combined with grid-search optimization was applied to determine optimal hyperparameters by maximizing the coefficient of determination (R2). Both the inner and outer splitters used randomly shuffled folds to ensure representative sampling across iterations. This framework provided a robust and generalizable assessment of model performance under varying environmental and observational conditions.
During each fold, a data-processing pipeline was fitted exclusively on the corresponding training subset. The pipeline applied an iterative imputer followed by a standard scaler to normalize numerical reflectance features and temporal variables (e.g., days after treatment) before model fitting. Subsequently, out-of-fold predictions from all outer folds were stacked to generate a single predicted nitrogen value per sample, which was then compared against measured ground-truth nitrogen values to compute overall validation statistics. All machine learning models were implemented in Python using the Scikit-learn library [30]. Table A1 also lists the hyperparameters selected through grid-search optimization process for each model.
Model performance was evaluated based on estimation accuracy using R2, slope, Root Mean Square Error (RMSE), and Mean Absolute Error (MAE). The mathematical formulations of these evaluation metrics are presented in Equations (1)–(4), where represents the observed value, the predicted value, the mean of observed value, n the number of observations, and the mean of predicted values.
3. Results
3.1. Nitrogen Uptake Estimation Using Multispectral Imaging (MSI)
The results of nitrogen uptake estimation using MSI imagery, categorized by site and year for canola and wheat, are presented in Table 1 and Table 2, respectively. For canola, MSI data showed strong potential for estimating nitrogen content. Among the six machine learning algorithms evaluated on the combined dataset, ANN achieved the highest predictive accuracy, with an R2 of 0.83 and a Root Mean Square Error (RMSE) of 0.50%. Other models, including Support Vector Regression (SVR) and Random Forest (RF), demonstrated moderate performance, with R2 values of 0.74 and 0.75, respectively.
Table 1.
Assessment results of nitrogen content estimation in canola at the AAFC and JD sites, utilizing various ML models with MSI datasets for the years 2023–2025. N shows the number of samples. Best performances are highlighted in bold text.
Table 2.
Assessment results of nitrogen content estimation in wheat at the AAFC and JD sites, utilizing various ML models with MSI dataset for the years 2023–2025. N shows the number of samples. Best performances are highlighted in bold text.
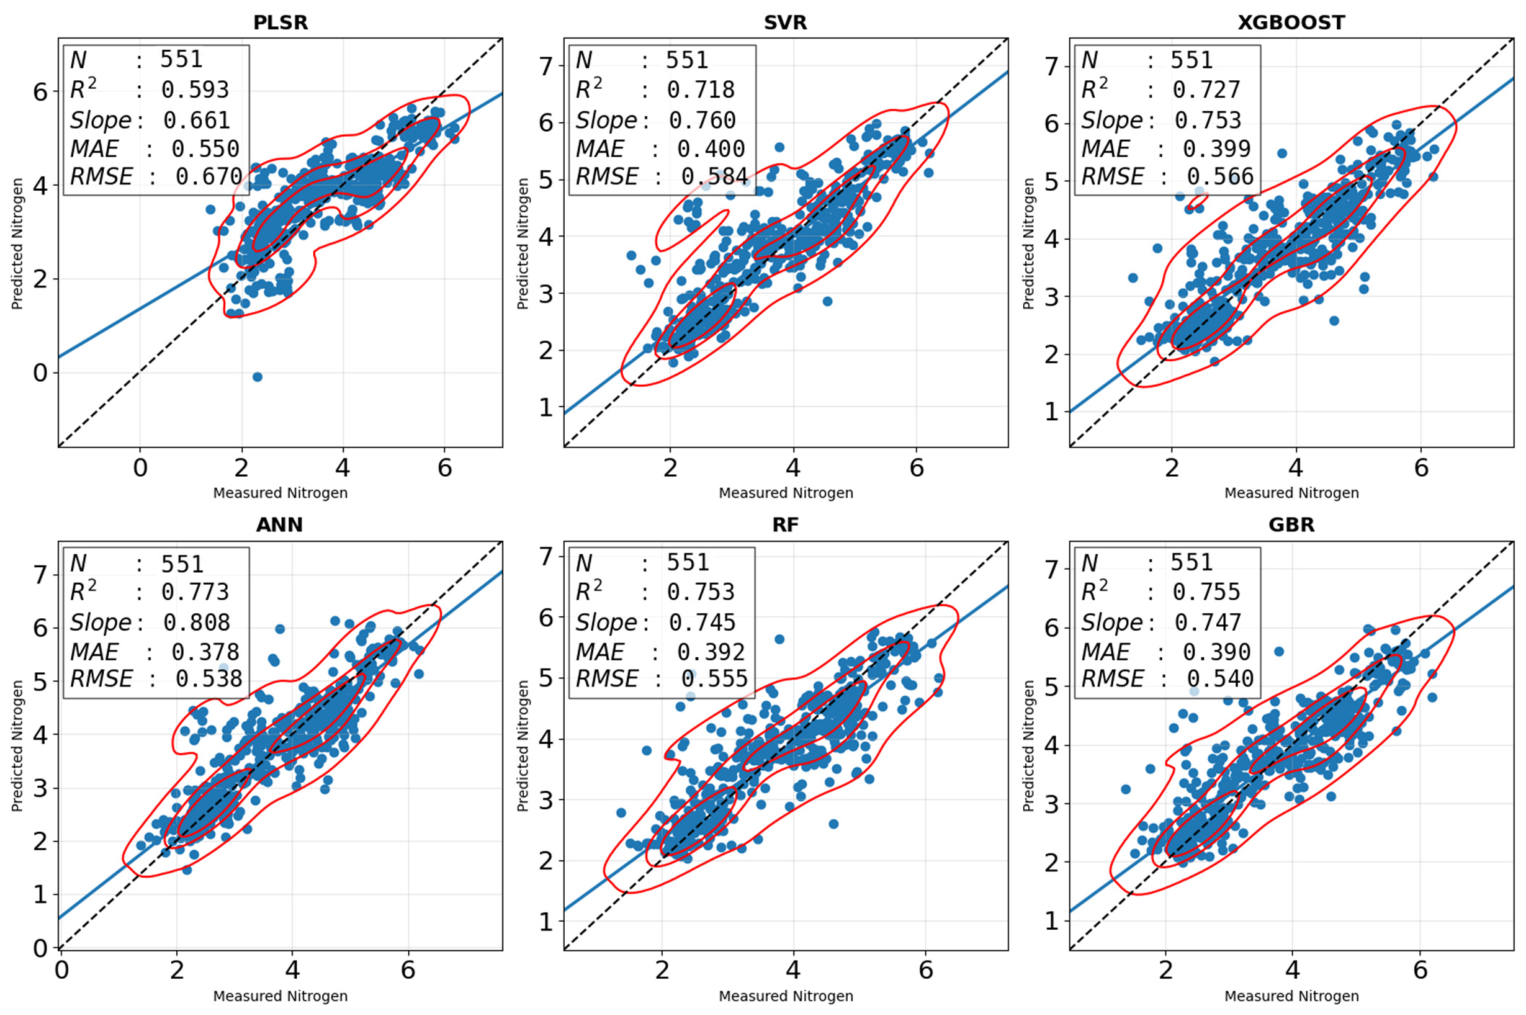
For spring wheat, the overall accuracy of MSI-based estimations showed a slight reduction (R2 decrease of ~5%) compared with canola. The ANN model again emerged as the best-performing algorithm on the combined dataset, achieving an R2 of 0.77 and a RMSE of 0.54%. The remaining models demonstrated lower predictive performance, with R2 values ranging from 0.59 to 0.75, respectively.
A closer examination of the site-specific and interannual variations in MSI results presented in Table 1 and Table 2 revealed fluctuations across the evaluated environments. While most algorithms demonstrated relatively stable and high performance across the AAFC trials for both crops, greater variability was observed in the rain-fed JD trials, likely due to the smaller number of training samples per site. Most notably, the ANN model exhibited a sharp and anomalous decline in predictive accuracy for canola at the JD site in 2024, with the R2 dropping to 0.13. Despite this localized reduction in performance, ANN remained the most robust model across the combined multi-year datasets for both crops. In contrast, linear approaches such as PLSR consistently produced the lowest overall accuracies on the consolidated datasets for both canola (R2 = 0.56) and wheat (R2 = 0.59).
3.2. Nitrogen Uptake Estimation Using Hyperspectral Imaging (HSI)
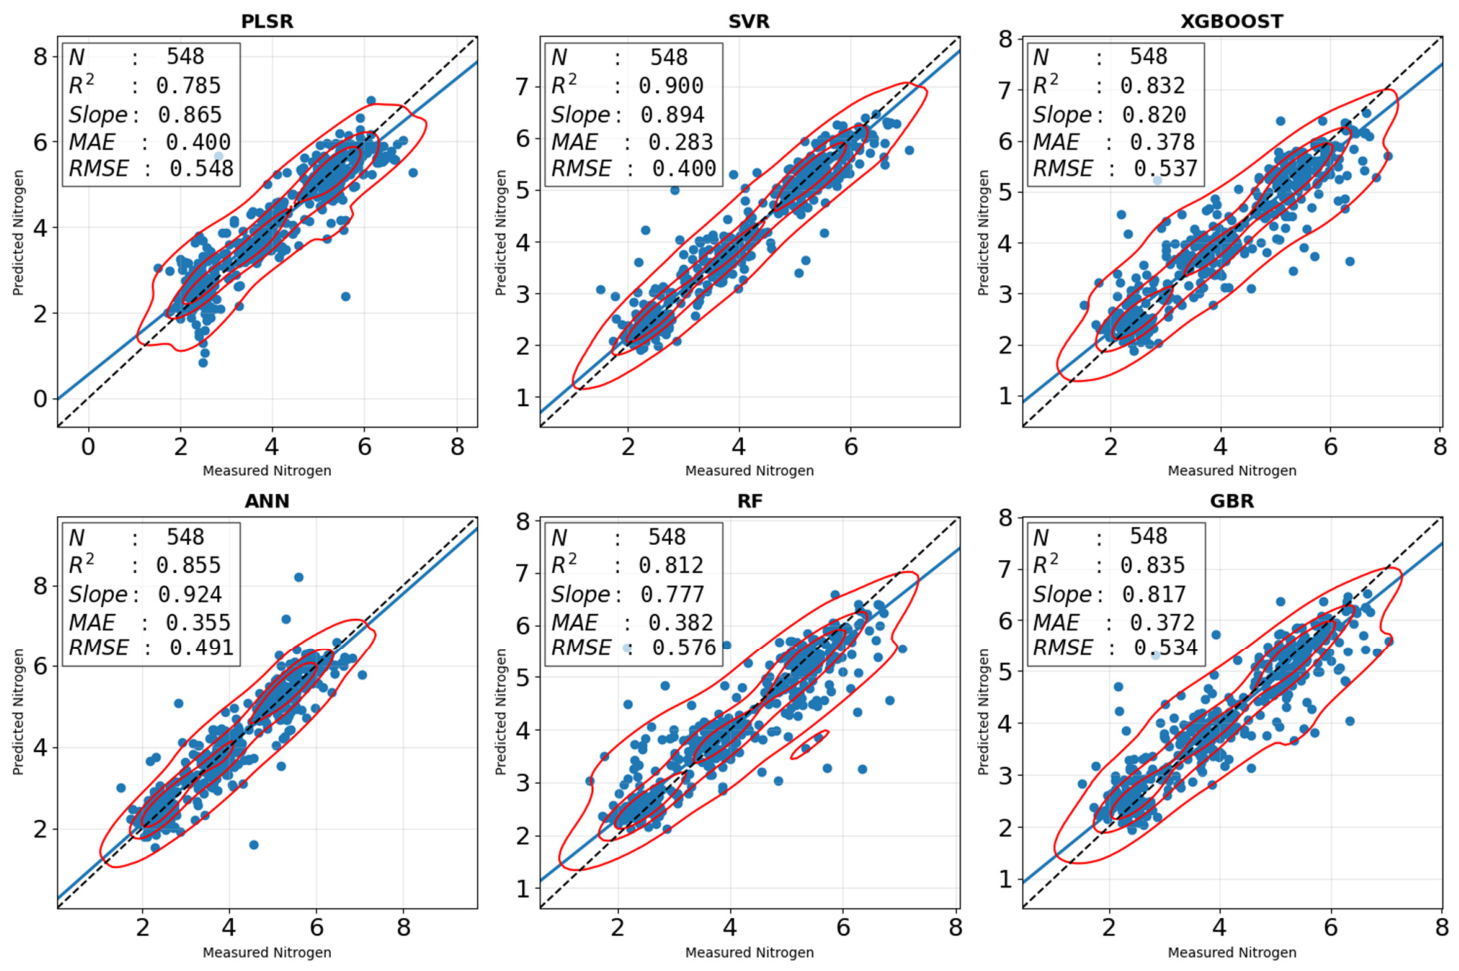
Transitioning from multispectral to high-resolution hyperspectral data resulted in measurable improvements in nitrogen estimation accuracy for both crops. For canola, HSI data produced notable and consistent accuracy gains across most models. Comparing the average performance metrics of all six ML models on the combined datasets, the transition from MSI to HSI increased the mean R2 by 0.12 (from 0.69 to 0.81) while reducing the mean RMSE by 0.19% (from 0.72% to 0.53%). Individually, SVR emerged as the top-performing model for the combined high-dimensional dataset, achieving an R2 of 0.90 and a RMSE of 0.40%. The ANN and GBR models followed closely, with R2 values of 0.85 and 0.83, respectively (Table 3).
Table 3.
Assessment results of nitrogen content estimation in canola at the AAFC and JD sites, utilizing various ML models with HSI datasets for the years 2023–2025. N shows the number of samples. Best performances are highlighted in bold text.
The transition to hyperspectral data also produced consistent and substantial accuracy improvements for the wheat trials, ensuring that predictive performance reached highly reliable levels. Although the overall magnitude of improvement was slightly greater in canola, integrating HSI data for wheat successfully increased the performance of the best-performing models beyond the 0.80 R2 threshold. Averaging the performance metrics of all six ML models on the combined datasets showed that HSI integration improved the overall mean R2 by 0.05 (from 0.70 to 0.75) while reducing the mean RMSE by 0.06% (from 0.60% to 0.54%). On the combined HSI wheat dataset, ANN achieved highest performance, reaching an R2 of 0.8 with RMSE value of 0.48%. PLSR also performed well with HSI data, achieving an R2 of 0.74 (Table 4).
Table 4.
Assessment results of nitrogen content estimation in wheat at the AAFC and JD sites, utilizing various ML models with HSI dataset for the years 2023–2025. N shows the number of samples. Best performances are highlighted in bold text.
A detailed examination of the site- and year-specific metrics for HSI results in Table 3 and Table 4 revealed notable performance fluctuations across individual trials. For canola, linear models such as PLSR demonstrated exceptionally high accuracies within isolated site-years (reaching an R2 of 0.95 at JD in 2025), but experienced a substantial decline in performance when applied to the consolidated dataset (decreasing to an R2 of 0.71). Conversely, in the wheat trials, the ANN model exhibited a severe localized anomaly at the JD site in 2025, where predictive accuracy declined sharply to an R2 of only 0.31. However, unlike the reduction observed for PLSR on the combined canola dataset, ANN fully recovered on the combined wheat dataset and tied for the highest overall accuracy (R2 = 0.80). Despite these pronounced fluctuations, SVR consistently maintained high performance across both isolated site-years and aggregated multi-year datasets for both crops.
4. Discussion
4.1. Suitability of Machine Learning Models
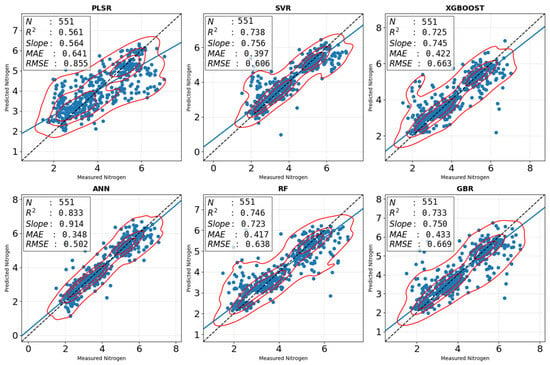
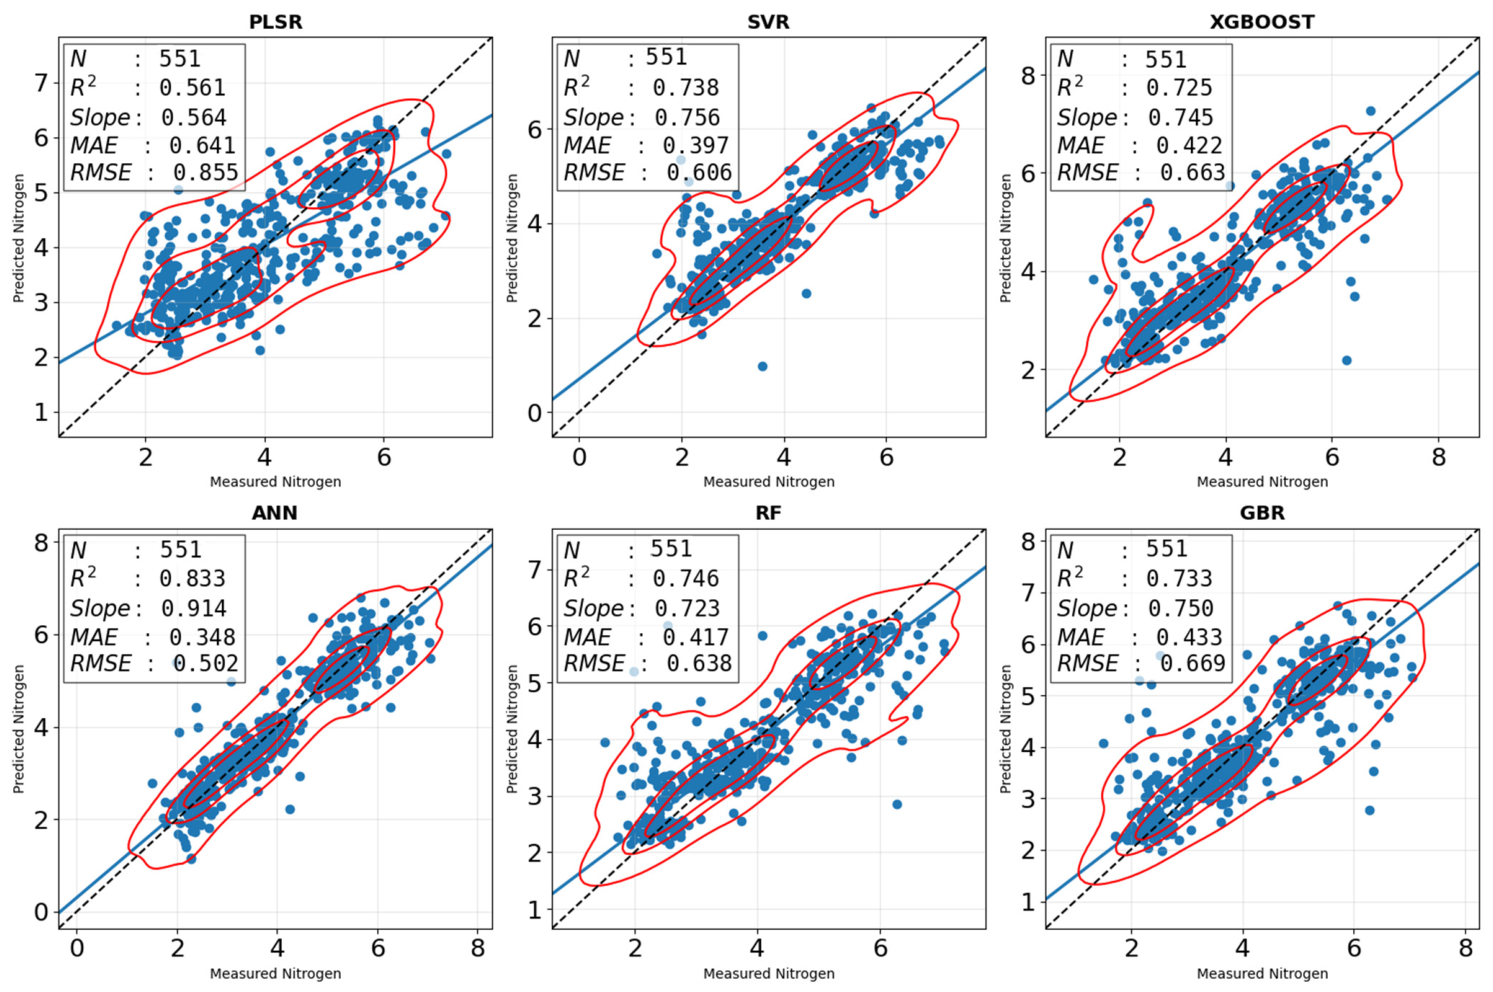
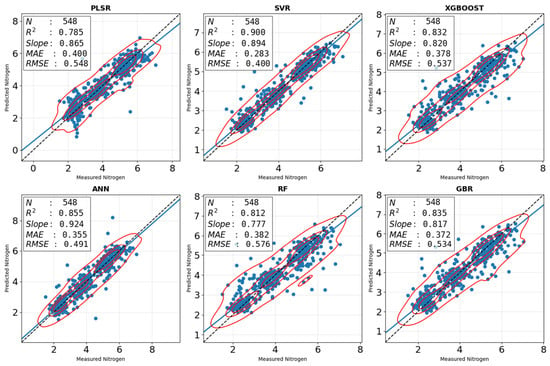
The evaluation of six distinct ML algorithms revealed that model performance strongly depended on input data dimensionality and training data availability. For canola, the ANN model consistently outperformed the others when using lower-dimensional MSI data (Figure 4), achieving the highest predictive accuracy (R2 = 0.83, RMSE = 0.50%). However, with high-dimensional HSI data (Figure 5), SVR demonstrated superior performance (R2 = 0.90, RMSE = 0.40%), highlighting its strong capability to model complex, non-linear relationships within higher-dimensional feature spaces while effectively handling uncertainties [27,31]. This finding aligns with the broader push toward advanced ML techniques in agriculture; for example, ref. [23] recently highlighted the robust performance of optimized deep learning models for complex crop trait predictions. Furthermore, ref. [21] demonstrated that pairing UAV-based hyperspectral imaging with advanced algorithms yields superior prediction accuracy compared to traditional approaches.
Figure 4.
Scatter distributions compare the measured ground-truth nitrogen content (x-axis, %) against predicted values (y-axis, %) across six machine learning algorithms (PLSR, SVR, XGBoost, ANN, RF, and GBR) utilizing the combined multi-year, multi-site Canola MSI dataset (N = 551). The dashed line represents the perfect 1:1 reflection line, while the solid blue line indicates the line of best fit for each model. Red contours depict the kernel density estimation of the scatter distribution, highlighting areas of highest data concentration. Embedded text boxes list validation performance metrics: sample size (N), coefficient of determination (R2), slope, mean absolute error (MAE), and root mean square error (RMSE).
Figure 5.
Scatter distributions compare the measured ground-truth nitrogen content (x-axis, %) against predicted values (y-axis, %) across six machine learning algorithms (PLSR, SVR, XGBoost, ANN, RF, and GBR) utilizing the combined multi-year, multi-site Canola HSI dataset (N = 548). The dashed line represents the perfect 1:1 reflection line, while the solid blue line indicates the line of best fit for each model. Red contours depict the kernel density estimation of the scatter distribution, highlighting areas of highest data concentration. Embedded text boxes list validation performance metrics: sample size (N), coefficient of determination (R2), slope, mean absolute error (MAE), and root mean square error (RMSE).
Model overfitting remains a persistent challenge in agricultural remote sensing because it restricts transferability across seasons and geographic regions. By combining datasets collected from 2023 to 2025 at both an irrigated site (AAFC) and a topographically diverse rain-fed site (JD), this study rigorously evaluated model generalizability. The consistently high accuracies (R2 > 0.80) achieved by models such as SVR and ANN on the consolidated datasets indicate that these algorithms successfully captured underlying biochemical relationships instead of memorizing site-specific patterns. In contrast, while PLSR is known for effectively handling multicollinearity in dense spectral datasets, it struggled to generalize across the combined multi-environment datasets, supporting the necessity of complex non-linear models for geographically diverse agricultural trials.
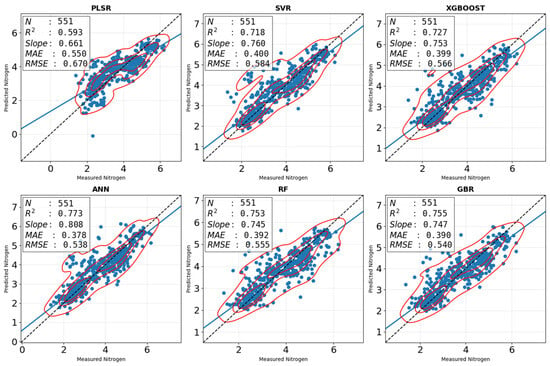
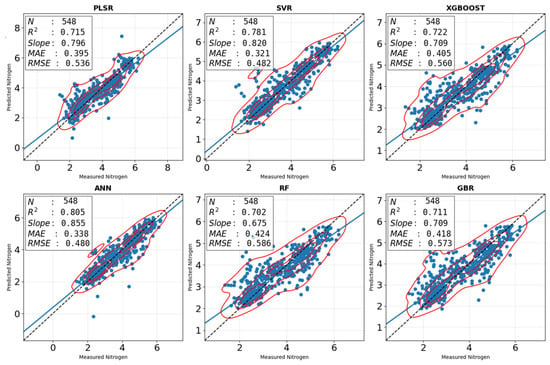
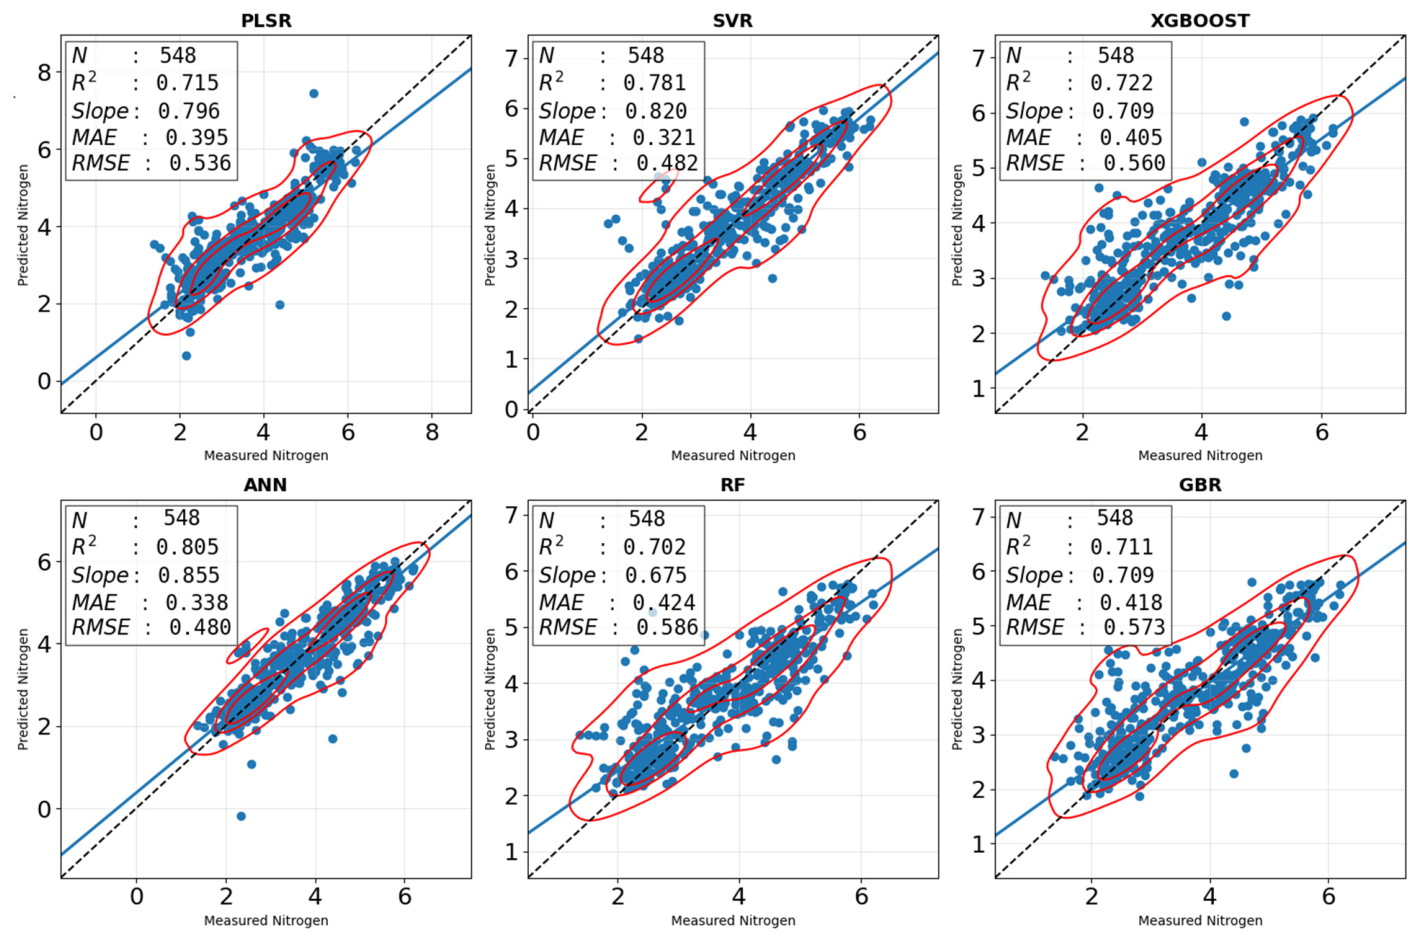
For spring wheat, ANN also emerged as the most accurate algorithm using lower-dimensional MSI data (Figure 6), achieving an R2 of 0.78 and an RMSE of 0.53%. Transitioning to high-dimensional HSI data (Figure 7) enabled both SVR and ANN to achieve top-tier performance (R2 = 0.78 and 0.82, respectively). Additionally, PLSR performed well on the wheat HSI dataset (R2 = 0.74), consistent with previous studies demonstrating its effectiveness in handling multicollinearity within dense spectral datasets [24,32]. Similarly to the canola models, the robust three-year dataset enhanced model transferability across diverse environments while minimizing overfitting.
Figure 6.
Scatter distributions compare the measured ground-truth nitrogen content (x-axis, %) against predicted values (y-axis, %) across six machine learning algorithms (PLSR, SVR, XGBoost, ANN, RF, and GBR) utilizing the combined multi-year, multi-site Wheat MSI dataset (N = 551). The dashed line represents the perfect 1:1 reflection line, while the solid blue line indicates the line of best fit for each model. Red contours depict the kernel density estimation of the scatter distribution, highlighting areas of highest data concentration. Embedded text boxes list validation performance metrics: sample size (N), coefficient of determination (R2), slope, mean absolute error (MAE), and root mean square error (RMSE).
Figure 7.
Scatter distributions compare the measured ground-truth nitrogen content (x-axis, %) against predicted values (y-axis, %) across six machine learning algorithms (PLSR, SVR, XGBoost, ANN, RF, and GBR) utilizing the combined multi-year, multi-site Wheat HSI dataset (N = 548). The dashed line represents the perfect 1:1 reflection line, while the solid blue line indicates the line of best fit for each model. Red contours depict the kernel density estimation of the scatter distribution, highlighting areas of highest data concentration. Embedded text boxes list validation performance metrics: sample size (N), coefficient of determination (R2), slope, mean absolute error (MAE), and root mean square error (RMSE).
The site-specific performance fluctuations observed in the MSI results, particularly the contrast between localized anomalies and success on the combined datasets, emphasize the inherent challenges of model generalization across heterogeneous environments. The recovery of the ANN model on the consolidated dataset, despite severe underperformance within a single site-year combination, highlights the neural network’s strong capacity to generalize and capture complex non-linear biochemical relationships when trained using sufficiently large and diverse datasets spanning multiple environments [29,33]. The contrast between this non-linear performance and the weaker results from linear approaches such as PLSR demonstrates an important limitation [34]. Although simpler regression models may perform adequately in isolated single-site evaluations, advanced non-linear machine learning architectures are essential for overcoming the structural and environmental complexities associated with multi-year, geographically diverse agricultural trials.
Furthermore, the contrasting behavior of these models when transitioning from single-site HSI evaluations to consolidated multi-environment datasets provides important insights into algorithmic robustness and overfitting. The marked performance decline of PLSR on the combined canola dataset, despite near-perfect accuracies on isolated trials, suggests a strong tendency to overfit localized spectral and environmental conditions, limiting its ability to generalize across broader spatial and temporal variability. In contrast, the ANN model recovered from a localized failure in JD trials in 2025 and achieved higher accuracy on the combined wheat dataset, underscoring the strength of complex non-linear architectures when trained using large and diverse datasets that reduce local noise and better capture universal biochemical traits. Ultimately, the consistent stability of SVR across both individual and combined datasets establishes it as the most reliable algorithm for high-dimensional hyperspectral data, effectively balancing algorithmic complexity with strong generalizability.
To contextualize these findings within the existing literature, the integration of spectral imaging and machine learning (ML) models in this study achieved strong predictive performance (R2 up to 0.90 for HSI and 0.83 for MSI), surpassing the accuracy typically reported for traditional parametric regression approaches that rely on individual narrowband or broadband vegetation indices (VIs). Previous studies using conventional indices, such as NDVI and NDRE, have reported limitations associated with signal saturation under dense canopy conditions and reduced model robustness across growing seasons [35,36]. Although several single-season, site-specific ML studies have achieved high prediction accuracies, their broader applicability is often constrained by geographic and temporal overfitting, limiting model transferability [22]. By training six machine learning algorithms using a consolidated and heterogeneous three-year dataset (2023–2025) encompassing both irrigated and rain-fed environments, the present study addresses these limitations and improves model generalizability. The strong performance of non-linear algorithms, particularly ANN and SVR, highlights the benefits of integrating high-dimensional spectral information with robust machine learning frameworks. This approach provides a scalable pathway for multi-environment crop nitrogen diagnostics while reducing dependence on site-specific calibrations.
4.2. Comparison of MSI and HSI Efficacy
The results indicate that although multispectral imaging (MSI) is an effective tool for nitrogen estimation, transitioning to hyperspectral imaging (HSI) provides a clear and superior improvement in accuracy across all evaluated environments. Standard broad-band MSI configurations may obscure subtle spectral shifts and biochemical variations [36]. By capturing subtle information across hundreds of narrow wavebands, HSI successfully detects these finer physiological differences, resulting in an average accuracy increase of 12% for canola and 5% for wheat across the evaluated machine learning algorithms [37,38]. This superior efficacy of HSI for nitrogen assessment was shown in other studies, such as [16,17], which similarly demonstrated high resolution and predictive power of HSI data in maize and corn. Reference [20] also utilized UAV-based HSI to accurately assess paddy rice nitrogen levels across various growth stages.
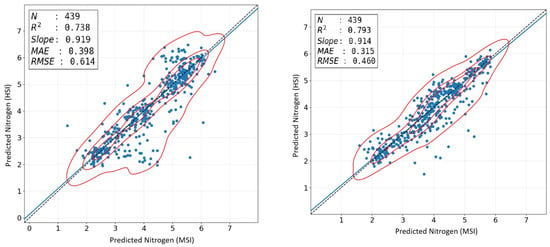
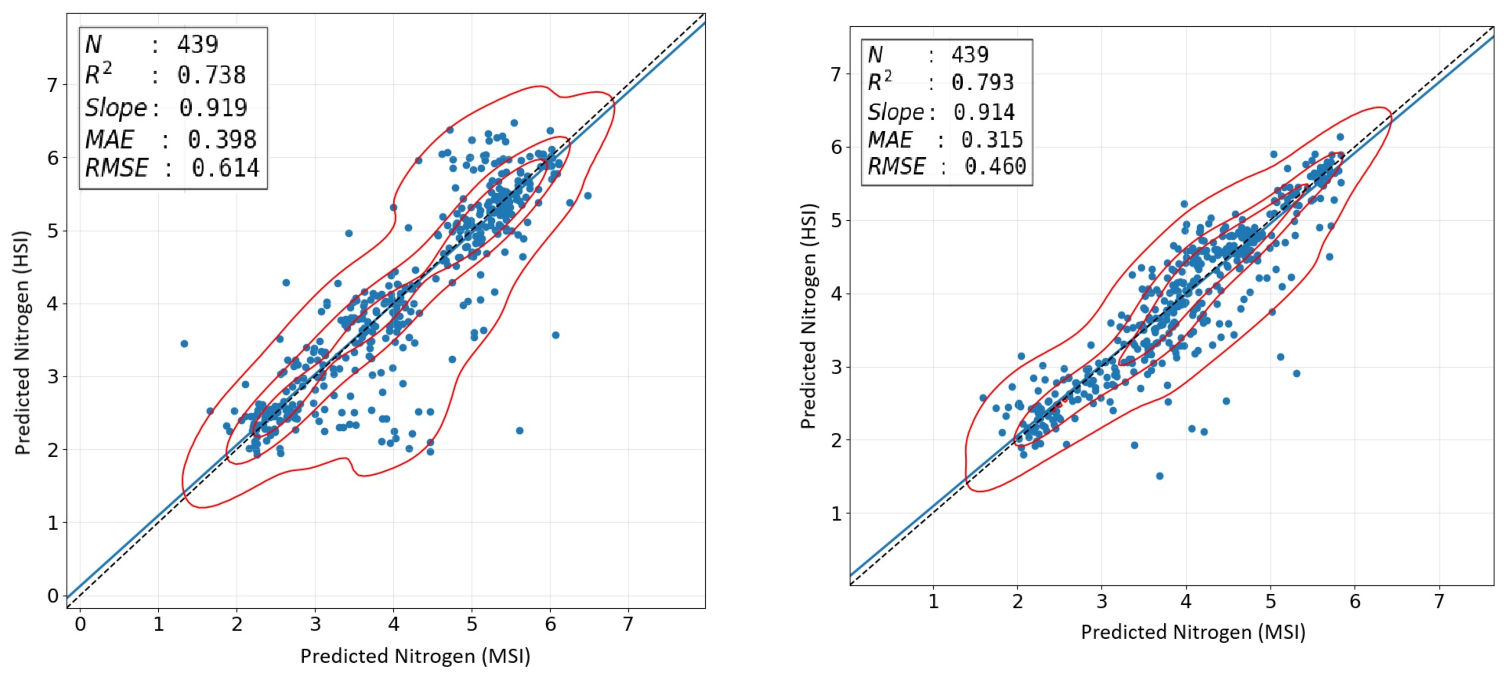
Despite the superior precision of HSI, comparisons between paired sensor predictions demonstrate that MSI still captures a substantial portion of the spectral variability required for nitrogen estimation. This relationship is illustrated through direct comparisons of paired predictions generated by one of the top-performing models (SVR) using both sensor types (Figure 8). Strong linear agreement was observed between MSI-derived and HSI-derived estimations for both canola (R2 = 0.74) and wheat (R2 = 0.79). These findings align with successful MSI applications in the literature, such as [19], confirming that the simpler MSI sensor captures much of the same critical predictive information as the high-dimensional HSI sensor.
Figure 8.
Comparison of predicted values from MSI vs. HSI sensors over canola (left) and wheat (right) using SVR. The unit for nitrogen measurements is percentage. Red contours represent the density of the scatter distribution. The dashed line represents the perfect 1:1 reflection line, while the solid blue line indicates the line of best fit for each model.
Ultimately, selecting between these sensor systems requires balancing predictive accuracy with operational feasibility. Although HSI provides superior predictive capability, often enabling models to exceed the critical R2 threshold of 0.80, it remains inherently data-intensive, computationally demanding, and economically costly. The large volume of high-dimensional data generated by hyperspectral sensors requires advanced computational resources for storage, processing, and dimensionality reduction. Consequently, despite producing slightly lower predictive accuracies, the operational simplicity, faster processing times, and cost-effectiveness of MSI strongly support its continued application in large-scale, commercial, and resource-constrained precision agriculture systems.
Consequently, the choice between these sensor systems should not be framed solely in terms of whether HSI is universally superior, but rather in relation to the intended operational application and deployment scale. Although HSI consistently provides enhanced sensitivity for detecting subtle physiological changes and narrow spectral absorption features, its relative advantage may be reduced under less heterogeneous conditions where MSI can adequately capture most nitrogen-related variability. In applications that prioritize rapid deployment over large agricultural areas, lower-dimensional MSI platforms offer substantial operational advantages. Compared with HSI, MSI data require considerably lower computational resources for image processing, including geometric correction and orthomosaic generation, while also reducing data storage requirements and eliminating the need for more complex radiometric calibration procedures associated with hyperspectral workflows.
From an agricultural management perspective, MSI systems offer an effective balance between cost efficiency and predictive performance. When integrated with robust non-linear algorithms, such as Artificial Neural Networks (ANN), MSI achieved high predictive accuracies (R2 = 0.77 for wheat and R2 = 0.83 for canola), which are sufficient to support variable-rate nitrogen management and precision fertilizer recommendations [39]. Therefore, although HSI remains highly valuable for advanced applications such as crop breeding, biochemical characterization, and spectral waveband optimization, MSI represents a more practical, scalable, and economically feasible solution for operational precision agriculture at commercial scales.
4.3. Challenges and Limitations
Model overfitting remains a persistent challenge in agricultural remote sensing because it severely restricts the transferability of predictive models across seasons and geographic regions. This study actively addressed this limitation by integrating a comprehensive three-year dataset (2023–2025) spanning two contrasting environments: an irrigated site (AAFC) and a topographically diverse rain-fed site (JD). By consolidating these datasets, the models were rigorously evaluated for generalizability. The sustained high accuracies (R2 > 0.80) achieved by algorithms such as SVR and ANN confirm that the models successfully captured underlying biochemical relationships rather than memorizing site-specific anomalies unique to individual fields. To achieve this level of predictive accuracy, non-spectral and temporal variables, including fertilizer treatment types and growth-stage metrics (e.g., days after treatment), were incorporated into the predictive framework (see [11]). Providing machine learning models with this agronomic metadata enabled them to account for phenological variation and the temporal dynamics associated with split-application strategies [35,40].
Despite these mitigation strategies, several uncertainties remain inherent to the remote estimation of crop biochemical traits. The highly non-linear relationship between spectral reflectance and crop nitrogen status is continually influenced by complex canopy structural effects and environmental variability. This complication is well-documented; for instance, ref. [22] noted that variations in canopy structural effects significantly influence the remote estimation of leaf nitrogen concentration, introducing noise that aerial sensors cannot always fully capture. Furthermore, reliance on standard broad-band MSI sensors presented an additional limitation for narrow-leaf crops such as wheat. Within these relatively uniform canopies, subtle but important spectral shifts can be obscured by wider spectral bandwidths, necessitating higher-resolution alternatives such as HSI.
Another limitation of this study arises from the spatial imbalance between the two experimental sites. The AAFC trials included four replicates, producing 40 plots per crop annually, whereas the JD trials contained only two replicates, totaling 20 large size plots per crop. This discrepancy introduces the possibility of machine learning algorithms becoming biased toward the spectral and environmental characteristics of the AAFC site because of its greater representation within the dataset. To reduce this imbalance, analytical procedures were adjusted to improve representation balance, and the nested cross-validation framework employed grouped shuffling to prevent site-specific data from disproportionately influencing training and testing subsets. Although this strategy effectively managed uneven distributions during model development, future multi-environment studies should target symmetrical replicate numbers across geographic locations to further strengthen cross-site transferability.
An additional source of biological variability was introduced into the target variable during the final stages of data collection. During active crop growth, nitrogen uptake was quantified using green leaf tissue samples. However, at crop maturity and harvest, plants had senesced and dried, requiring whole-plant nitrogen analysis (combining grain and straw) to determine final nitrogen values. Integrating these fundamentally different biological measurements—leaf nitrogen concentration and accumulated whole-plant nitrogen within the same regression framework presents a potential theoretical limitation. Nevertheless, these late-season whole-plant measurements were retained because empirical testing demonstrated that their inclusion did not reduce predictive performance while substantially increasing the amount of training data available for the algorithms. Because temporal metadata (i.e., DAT and TRT) were explicitly incorporated into the models, the non-linear algorithms successfully contextualized this biological transition, effectively learning phase-specific relationships between late-season canopy reflectance and final accumulated plant nitrogen.
Finally, although combining irrigated and rain-fed datasets substantially improved model robustness, operational transferability still requires continued validation. Additional testing across a broader range of geographically and climatically diverse environments is necessary to ensure that these models remain broadly applicable and free from localized biases.
5. Conclusions
This study developed and evaluated a comprehensive framework for estimating crop nitrogen uptake by integrating UAV-based spectral imaging with machine learning (ML) across multiple growing seasons and contrasting environmental conditions. The use of a heterogeneous three-year dataset (2023–2025), encompassing both irrigated and rain-fed environments, substantially improved model generalizability and reduced the temporal and spatial overfitting that has historically limited the operational deployment of remote sensing technologies in agriculture. These findings demonstrate the importance of incorporating multi-year and multi-environment datasets to enhance the transferability and reliability of predictive models for precision nutrient management.
The comparative assessment of six machine learning algorithms revealed that model performance is strongly influenced by the dimensionality of the spectral data. For lower-dimensional multispectral imaging (MSI), Artificial Neural Networks (ANN) consistently provided the highest predictive accuracy for both spring wheat and canola. In contrast, when utilizing the high-dimensional spectral information provided by hyperspectral imaging (HSI), both ANN and Support Vector Regression (SVR) achieved superior performance by effectively capturing subtle biochemical and physiological variations associated with crop nitrogen dynamics. Although HSI offered enhanced diagnostic capability through its continuous and narrow spectral bands, MSI combined with advanced non-linear machine learning algorithms produced sufficiently high accuracies to support operational applications while maintaining lower computational requirements and reduced implementation costs.
Beyond the scope of spring wheat and canola, the multi-environment framework presented in this study provides a scalable approach that can be extended to other major field crops, including corn, barley, and soybean, as well as broader precision agriculture applications. Furthermore, incorporating agronomic metadata, such as fertilizer treatment regimes and days after treatment, improved the models’ ability to account for crop phenology and temporal nitrogen dynamics. This framework has the potential to support variable-rate nitrogen management, real-time crop monitoring, and high-throughput phenotyping in crop breeding programs. Future research should focus on advanced spectral band selection and dimensionality-reduction techniques to identify the most informative wavebands for developing optimized, crop-specific multispectral sensors that combine the sensitivity of hyperspectral systems with the operational efficiency and scalability required for commercial precision agriculture applications.
Author Contributions
Conceptualization, A.M.C. and K.D.S.; methodology, A.M.C., K.D.S., L.J.M. and M.N.; software, A.M.C. and M.N.; resources, K.D.S., C.M.G. and C.H.; writing—original draft preparation, A.M.C. and K.D.S.; writing—review and editing, A.M.C., K.D.S., C.M.G., C.H., L.J.M. and M.N.; supervision, K.D.S.; funding acquisition, K.D.S., C.M.G. and C.H. All authors have read and agreed to the published version of the manuscript.
Funding
This research was funded by Results Driven Agriculture Research (RDAR), grant number 2024F2650R and through AAFC’s collaborative agreement with John Deere & Company, AB, funding number AGR-21189.
Data Availability Statement
The data presented in this study are available on request from the corresponding author due to Crown copyright restrictions.
Acknowledgments
We greatly appreciate the field and technical support provided by AAFC staff at Lethbridge, especially Prabahar Ravichandran from the Remote Sensing and Phenomics group. Crown copyright © His Majesty the King in Right of Canada, 2026.
Conflicts of Interest
Author C.H. was employed by the John Deere & Company. The remaining authors declare that the research was conducted in the absence of any commercial or financial relationships that could be construed as a potential conflict of interest. The authors declare that this study received some funding from John Deere & Company, AB. The funder had the following involvement with the study: study design, experimental trial setup and ground data collection for model validation.
Appendix A
Table A1.
Optimal hyperparameter configurations for each model across crop and sensor combinations. The values listed represent the optimized values selected across all validation folds during cross-validation, where activation, hidden_layer_sizes, and learning_rate_init dictate the ANN’s non-linear transformation function, layer architecture, and initial optimization step size, respectively. For tree-based ensembles (GBR, RF, and XGBOOST), max_depth limits individual tree complexity to mitigate overfitting, n_estimators specifies the total number of trees constructed, and learning_rate scales each tree’s contribution to optimize final generalization. Lastly, n_components defines the latent variables retained to capture maximum variance in PLSR, while for SVR, C controls the regularization trade-off between training error and margin smoothness, and gamma defines the radius of influence for individual training samples.
References
- Raghuram, N.; Aziz, T.; Kant, S.; Zhou, J.; Schmidt, S. Nitrogen use efficiency and sustainable nitrogen management in crop plants. Front. Plant Sci. 2022, 13, 862091. [Google Scholar] [CrossRef] [Scilit] [PubMed]
- Tufail, M.A.; Ayyub, M.; Tariq, L.; Iltaf, J.; Asbat, A.; Bashir, I.; Umar, W. Nitrogen fertilizers and the future of sustainable agriculture: A deep dive into production, pollution, and mitigation measures. Soil Sci. Plant Nutr. 2024, 70, 457–477. [Google Scholar] [CrossRef] [Scilit]
- Pabuayon, I.C.M.; Pabuayon, I.L.B.; Singh, R.K.; Ritchie, G.L.; de los Reyes, B.G. Applicability of hyperspectral imaging during salinity stress in rice for tracking Na+ and K+ levels in planta. PLoS ONE 2022, 17, e0270931. [Google Scholar] [CrossRef] [Scilit] [PubMed]
- Perich, G.; Meyer, P.; Wieser, A.; Liebisch, F. Proximal and drone-based hyperspectral sensing for crop nitrogen status detection in historic field trials. In Proceedings of the 2021 11th Workshop on Hyperspectral Imaging and Signal Processing: Evolution in Remote Sensing (WHISPERS), Amsterdam, The Netherlands, 24–26 March 2021; Volume 11, pp. 1–5. [Google Scholar] [CrossRef] [Scilit]
- Chegoonian, A.M.; Singh, K.D.; Geddes, C.M.; Hansen, C.; Wang, H. Aerial Insights: Advancing Nitrogen Estimation in Field Crops using Multispectral Imaging. Int. Arch. Photogramm. Remote Sens. Spat. Inf. Sci. 2025, 48, 7–12. [Google Scholar] [CrossRef] [Scilit]
- Ravichandran, P.; Singh, K.D.; Randhawa, H.S.; Dhariwal, R.; Sangha, J.S.; Ellert, B.; Chegoonian, A.M.; Natarajan, M. High-Throughput Screening of Wheat Genotypes for Drought Tolerance Using Aerial Thermal Imagery. In Proceedings of the 2025 13th International Conference on Agro-Geoinformatics (Agro-Geoinformatics), Boulder, CO, USA, 7–10 July 2025; pp. 1–6. [Google Scholar]
- Hoyos-Villegas, V.; Jackson, M.; Vargas-Cedeño, M.; Farmer, E.E.; Hanneman, M.; Mazis, A.; Singh, K.D.; Sangjan, W.; McNair, M.; Sankaran, S.; et al. Affordable phenomics: Expanding access to enhancing genetic gain in plant breeding. Plant Phenome J. 2025, 8, e70034. [Google Scholar] [CrossRef] [Scilit]
- Thieme, A.; Prabhakara, K.; Jennewein, J.; Lamb, B.T.; McCarty, G.W.; Hively, W.D. Intercomparison of Same-Day Remote Sensing Data for Measuring Winter Cover Crop Biophysical Traits. Sensors 2024, 24, 2339. [Google Scholar] [CrossRef] [Scilit] [PubMed]
- Phang, S.K.; Chiang, T.H.A.; Happonen, A.; Chang, M.M.L. From satellite to UAV-based remote sensing: A review on precision agriculture. IEEE Access 2023, 11, 127057–127076. [Google Scholar] [CrossRef] [Scilit]
- Chegoonian, A.M.; Singh, K.D.; Geddes, C.M.; Hansen, C.; Wang, H. Estimation of Nitrogen Content in Canola and Wheat Using Hyperspectral Drone Imaging. In Proceedings of the IGARSS 2025 IEEE International Geoscience and Remote Sensing Symposium, Brisbane, Australia, 3–8 August 2025; pp. 4387–4391. [Google Scholar] [CrossRef] [Scilit]
- Chegoonian, A.M.; Singh, K.D.; Geddes, C.M.; Hansen, C.; Wang, H. Multispectral drone imaging for non-destructive estimation of nitrogen content in canola and wheat. In Proceedings of the 2024 14th Workshop on Hyperspectral Imaging and Signal Processing: Evolution in Remote Sensing (WHISPERS), Helsinki, Finland, 9–11 December 2024; Volume 14, pp. 1–5. [Google Scholar] [CrossRef] [Scilit]
- Hong, D.; Li, C.; Yokoya, N.; Zhang, B.; Jia, X.; Plaza, A.; Gamba, P.; Benediktsson, J.A.; Chanussot, J. Hyperspectral imaging. Nat. Rev. Methods Primers 2026, 6, 19. [Google Scholar] [CrossRef] [Scilit]
- Panda, D. From spectrum to yield: Advances in crop photosynthesis with hyperspectral imaging. Photosynthetica 2025, 63, 196–233. [Google Scholar] [CrossRef] [Scilit] [PubMed]
- Shoaib, M. Plant stress detection using multimodal imaging and machine learning: From leaf spectra to smartphone applications. Front. Plant Sci. 2025, 16, 1670593. [Google Scholar] [CrossRef] [Scilit] [PubMed]
- Lee, K.S.; Cohen, W.B.; Kennedy, R.E.; Maiersperger, T.K.; Gower, S.T. Hyperspectral versus multispectral data for estimating leaf area index in four different biomes. Remote Sens. Environ. 2004, 91, 508–520. [Google Scholar] [CrossRef] [Scilit]
- Nigon, T.J.; Yang, C.; Dias Paiao, G.; Mulla, D.J.; Knight, J.F.; Fernández, F.G. Prediction of Early Season Nitrogen Uptake in Maize Using High-Resolution Aerial Hyperspectral Imagery. Remote Sens. 2020, 12, 1234. [Google Scholar] [CrossRef] [Scilit]
- Fan, L.; Zhao, J.; Xu, X.; Liang, D.; Yang, G.; Feng, H.; Yang, H.; Wang, Y.; Chen, G.; Wei, P. Hyperspectral-Based Estimation of Leaf Nitrogen Content in Corn Using Optimal Selection of Multiple Spectral Variables. Sensors 2019, 19, 2898. [Google Scholar] [CrossRef] [Scilit] [PubMed]
- Azizabadi, E.H.; Gomroki, M.; El-Shetehy, M.; Singh, K.D.; Mossa, A.W.; Badreldin, N. VNIR-SWIR hyperspectral spectroscopy for nitrogen assessment in potato crops: Deep learning and regression models across field and laboratory conditions. Smart Agric. Technol. 2026, 13, 101801. [Google Scholar] [CrossRef] [Scilit]
- Ding, F.; Li, C.; Zhai, W.; Fei, S.; Cheng, Q.; Chen, Z. Estimation of nitrogen content in winter wheat based on multi-source data fusion and machine learning. Agriculture 2022, 12, 1752. [Google Scholar] [CrossRef] [Scilit]
- Wang, L.; Chen, S.; Li, D.; Wang, C.; Jiang, H.; Zheng, Q.; Peng, Z. Estimation of paddy rice nitrogen content and accumulation both at leaf and plant levels from UAV hyperspectral imagery. Remote Sens. 2021, 13, 2956. [Google Scholar] [CrossRef] [Scilit]
- Chen, X.; Li, F.; Shi, B.; Chang, Q. Estimation of winter wheat plant nitrogen concentration from UAV hyperspectral remote sensing combined with machine learning methods. Remote Sens. 2023, 15, 2831. [Google Scholar] [CrossRef] [Scilit]
- Liu, S.; Li, L.; Wang, S.; Jiao, X.; Liu, J.; Zhang, J.; Cao, W.; Ni, J. Remote estimation of leaf nitrogen concentration in winter oilseed rape across growth stages and seasons by correcting for the canopy structural effect. Remote Sens. Environ. 2023, 284, 113348. [Google Scholar] [CrossRef] [Scilit]
- Valarezo-Plaza, S.; Torres-Tello, J.; Singh, K.D.; Shirtliffe, S.J.; Deivalakshmi, S.; Ko, S.B. A novel optimized deep learning model for canola crop yield prediction on edge devices. IEEE Trans. AgriFood Electron. 2024, 2, 436–444. [Google Scholar] [CrossRef] [Scilit]
- Geladi, P.; Kowalski, B.R. Partial least-squares regression: A tutorial. Anal. Chim. Acta 1986, 185, 1–17. [Google Scholar] [CrossRef] [Scilit]
- Drucker, H.; Kaufman, L.; Smola, A.; Vapnik, V. Support vector regression machines. Adv. Neural Inf. Process. Syst. 1997, 9, 155–161. [Google Scholar]
- Chen, T.; Guestrin, C. XGBoost: A scalable tree boosting system. In Proceedings of the 22nd acm Sigkdd International Conference on Knowledge Discovery and Data Mining, San Francisco, CA, USA, 13–17 August 2016; pp. 785–794. [Google Scholar] [CrossRef] [Scilit]
- Friedman, J.H. Greedy function approximation: A gradient boosting machine. Ann. Stat. 2001, 29, 1189–1232. [Google Scholar] [CrossRef] [Scilit]
- Breiman, L. Random forests. Mach. Learn. 2001, 45, 5–32. [Google Scholar] [CrossRef] [Scilit]
- LeCun, Y.; Bengio, Y.; Hinton, G. Deep learning. Nature 2015, 521, 436–444. [Google Scholar] [CrossRef] [Scilit] [PubMed]
- Pedregosa, F.; Varoquaux, G.; Gramfort, A.; Michel, V.; Thirion, B.; Grisel, O.; Blondel, M.; Prettenhofer, P.; Weiss, R.; Dubourg, V.; et al. Scikit-learn: Machine learning in Python. J. Mach. Learn. Res. 2011, 12, 2825–2830. [Google Scholar]
- Mountrakis, G.; Im, J.; Ogole, C. Support vector machines in remote sensing: A review. ISPRS J. Photogramm. Remote Sens. 2011, 66, 247–259. [Google Scholar] [CrossRef] [Scilit]
- Wold, S.; Sjöström, M.; Eriksson, L. PLS-regression: A basic tool of chemometrics. Chemom. Intell. Lab. Syst. 2001, 58, 109–130. [Google Scholar] [CrossRef] [Scilit]
- Reichstein, M.; Camps-Valls, G.; Stevens, B.; Jung, M.; Denzler, J.; Carvalhais, N.; Prabhat, F. Deep learning and process understanding for data-driven Earth system science. Nature 2019, 566, 195–204. [Google Scholar] [CrossRef] [Scilit] [PubMed]
- Hastie, T.; Tibshirani, R.; Friedman, J. The Elements of Statistical Learning: Data Mining, Inference, and Prediction; Springer Science & Business Media: New York, NY, USA, 2009; pp. 1–745. [Google Scholar] [CrossRef]
- Berger, K.; Verrelst, J.; Féret, J.B.; Wang, Z.; Wocher, M.; Strathmann, M.; Danner, M.; Mauser, W.; Hank, T. Crop nitrogen monitoring: Recent progress and principal developments in the context of imaging spectroscopy missions. Remote Sens. Environ. 2020, 242, 111758. [Google Scholar] [CrossRef] [Scilit] [PubMed]
- Thenkabail, P.S.; Smith, R.B.; De Pauw, E. Hyperspectral vegetation indices and their relationships with agricultural crop characteristics. Remote Sens. Environ. 2000, 71, 158–182. [Google Scholar] [CrossRef] [Scilit]
- Blackburn, G.A. Hyperspectral remote sensing of plant pigments. J. Exp. Bot. 2007, 58, 855–867. [Google Scholar] [CrossRef] [Scilit] [PubMed]
- Gitelson, A.A. Remote sensing estimation of crop biophysical characteristics at various scales. Hyperspectr. Remote Sens. 2016, 20, 329. [Google Scholar]
- Yousfi, S.; Peira, J.F.M.; De La Horra, G.R.; Ablanque, P.V.M. Remote sensing: Useful approach for crop nitrogen management and sustainable agriculture. In Sustainable Crop Production; IntechOpen: Rijeka, Croatia, 2019; pp. 45–62. [Google Scholar] [CrossRef] [Scilit]
- Boegh, E.; Soegaard, H.; Broge, N.; Hasager, C.B.; Jensen, N.O.; Schelde, K.; Thomsen, A. Airborne multispectral data for quantifying leaf area index, nitrogen concentration, and photosynthetic efficiency in agriculture. Remote Sens. Environ. 2002, 81, 179–193. [Google Scholar] [CrossRef] [Scilit]

Disclaimer/Publisher’s Note: The statements, opinions and data contained in all publications are solely those of the individual author(s) and contributor(s) and not of MDPI and/or the editor(s). MDPI and/or the editor(s) disclaim responsibility for any injury to people or property resulting from any ideas, methods, instructions or products referred to in the content. |
© 2026 by the authors. Licensee MDPI, Basel, Switzerland. This article is an open access article distributed under the terms and conditions of the Creative Commons Attribution (CC BY) license.