


Highlights
What are the main findings?
- UAV-based VNIR-only imaging spectroscopy achieved comparable accuracy to airborne full-spectrum VSWIR for predicting ten foliar functional traits in grasslands (R2 = 0.66–0.82 for NSC, carotenoids, and cellulose).
- The VNIR spectral region alone performed as well as the full VSWIR spectrum; SWIR wavelengths provided only marginal improvements for structural traits, and vector normalization consistently outperformed NIRv correction for reducing confounding effects.
What are the implications of the main findings?
- UAV-based VNIR sensors offer a cost-effective and operationally flexible alternative to airborne systems for large-scale grassland trait monitoring.
- Vector normalization is recommended as an effective preprocessing approach to minimize canopy structure and illumination effects in grassland hyperspectral studies.
Abstract
Grassland foliar functional traits are closely linked to ecosystem functioning, biodiversity, and plant responses to environmental change. Hyperspectral remote sensing provides an efficient and non-destructive approach for mapping foliar traits, yet direct comparisons between UAV-based and airborne imaging spectroscopy remain limited. In this study, we evaluated the performance of UAV-based Nano and airborne Hyspex hyperspectral imagery for predicting ten foliar functional traits across experimental grassland plots at the Cedar Creek Ecosystem Science Reserve, USA. We further assessed the contributions of visible-to-near-infrared (VNIR) and shortwave infrared (SWIR) spectral regions, as well as the effects of spectral preprocessing approaches for minimizing confounding effects from canopy structure, illumination/viewing geometry, and soil background. Random Forest regression models were developed using plot-level average spectra derived from Nano and Hyspex imagery. Both UAV- and airborne-based imaging spectroscopy achieved moderate to high prediction accuracies for most foliar traits. High accuracies were obtained for non-structural carbohydrates (NSC), carotenoids, β-carotene, hemicellulose, and cellulose (R2 = 0.66–0.82; NRMSE = 6–10%), while moderate accuracies were achieved for nitrogen, chlorophyll, and xanthophylls (R2 = 0.51–0.74; NRMSE = 8–12%). In contrast, carbon and lignin consistently exhibited lower predictive performance (R2 = 0.32–0.59; NRMSE = 9–15%). Despite covering only the VNIR spectral range, the UAV-based Nano imagery achieved accuracies comparable to those obtained using the airborne full-spectrum Hyspex imagery, indicating that high spatial resolution can partially compensate for limited spectral coverage by reducing soil background effects. The VNIR spectral region alone provided trait estimation accuracies comparable to those obtained using the full visible-to-shortwave infrared (VSWIR) spectrum, whereas SWIR wavelengths contributed only marginal improvements for a subset of structural traits. Among preprocessing approaches, vector normalization generally improved prediction performance by reducing the confounding effects of canopy structure and illumination/viewing geometry, whereas NIRv-adjusted spectra provided limited benefits. Our findings demonstrate that UAV-based VNIR imaging spectroscopy can provide accurate and cost-effective estimation of grassland foliar functional traits. The results also highlight important trade-offs between spectral and spatial resolution in hyperspectral remote sensing and provide practical guidance for selecting imaging spectroscopy platforms and preprocessing approaches for grassland ecosystem monitoring.
1. Introduction
Grasslands cover approximately 40% of the Earth’s terrestrial surface and can provide ecosystem services such as carbon sequestration, water regulation and nutrient cycling [1,2,3]. However, grasslands are threatened by global climate and land-use changes, making them more vulnerable to disturbance such as disease, drought and fire [4,5]. Foliar functional traits are morphological, physiological and biochemical properties of leaves, which are closely related to ecosystem function and processes [6]. For example, leaf chlorophylls determine photosynthetic capacity and primary productivity, while carotenoids and xanthophylls protect the photosynthetic apparatus from excess light damage [7]. Nitrogen is a core component of photosynthetic enzymes, particularly Rubisco, and strongly correlates with maximum photosynthetic rate and growth potential [6,8]. Structural components, such as hemicellulose, cellulose and lignin, determine leaf mechanical strength, longevity, herbivore palatability, and decomposability [9,10,11]. Non-structural carbohydrates (NSC), primarily composed of soluble sugars and starch, serve as a primary buffer against environmental stress [12,13]. All these traits can reflect plant responses and adaptations to the environment and are essential indicators of biodiversity [9,14]. Therefore, timely monitoring of foliar functional traits in grasslands is crucial for conservation and management [15,16].
Traditional measurement of foliar functional traits relies on field surveys and laboratory chemical analyses, which are labor-intensive and typically limited to small spatial extents. Hyperspectral remote sensing, especially imaging spectroscopy, provides narrow and continuous spectral information that captures the scattering and absorption characteristics associated with foliar traits [17,18,19], offering an efficient and non-destructive approach for monitoring foliar functional traits [20,21,22,23]. Despite recent advances in mapping foliar traits in grasslands using hyperspectral remote sensing, studies concurrently estimating multiple dimensions of foliar traits remain limited [20,24,25].
Hyperspectral data can be acquired at multiple scales, spanning proximal, unmanned airborne vehicle (UAV), airborne, and satellite platforms. Satellite missions such as the Environmental Mapping and Analysis Program (EnMAP) and the Italian Precursore Iperspettrale della Missione Applicativa (PRISMA) provide the opportunity to monitor grasslands across the globe, but the spatial and temporal resolutions are low [26,27]. Airborne imaging spectroscopy covering the full visible to shortwave infrared spectrum (VSWIR, 400–2500 nm) has been widely used for characterizing plant properties due to its high spectral and spatial resolution [21,22,23], though its primary limitation is the high operational cost. For example, Wang et al. [20] mapped fifteen foliar traits in experimental grasslands and evaluated prediction uncertainty associated with partial least squares regression (PLSR) and Gaussian process regression (GPR) models using airborne full-spectrum imaging spectroscopy. However, airborne campaigns remain expensive and operationally demanding, limiting repeated observations across space and time.
Recently, UAV-based imaging spectroscopy has emerged as an effective approach for mapping foliar traits due to its flexibility and lower cost, but it is typically restricted to visible-to-near-infrared (VNIR) sensors covering 400–1000 nm [25,28,29]. Previous studies demonstrated that UAV-based VNIR imaging spectroscopy can successfully estimate multiple foliar traits under both controlled and heterogeneous grassland conditions. For example, Zhao et al. [25] mapped ten leaf functional traits in a semi-arid grassland monoculture experiment, and Zhang et al. [29] extended this approach to estimate ten plant community traits across species-rich alpine meadows. These studies demonstrate the feasibility of UAV-based VNIR sensing for trait estimation.
Foliar trait estimation using imaging spectroscopy involves an inherent trade-off between spectral and spatial information. Airborne VSWIR imaging spectroscopy provides broad spectral coverage and captures additional absorption features associated with dry matter traits, including nitrogen, cellulose, lignin, and NSC, whereas UAV-based VNIR imaging spectroscopy offers finer spatial resolution but more limited spectral information. In principle, broader spectral coverage may improve trait estimation by capturing additional biochemical absorption features. However, accurate prediction of foliar functional traits in grasslands remains challenging because herbaceous vegetation is often small and spatially heterogeneous, increasing spectral mixing between vegetation and soil within individual pixels [20,25,30]. Compared with airborne VSWIR systems, UAV-based VNIR sensors provide centimeter-level spatial resolution, which may better resolve individual plants and reduce mixed-pixel effects despite their reduced spectral coverage.
In addition to spectral and spatial characteristics of imaging systems, the estimation accuracy of foliar traits in grasslands can also be affected by several confounding factors, including canopy structure, illumination and viewing geometry, and soil background. Previous studies have proposed multiple approaches to reduce these effects and improve the robustness of trait estimation. To reduce the effects of illumination/viewing geometry and canopy structure, brightness normalization has been widely applied in imaging spectroscopy studies [23,31,32]. Near-infrared reflectance of vegetation (NIRv) has also been shown to minimize the confounding effects of canopy structure and soil background, thereby improving the prediction of variables such as leaf area index and leaf nitrogen content [33,34]. In addition, soil background effects can be mitigated through approaches such as filtering soil pixels using NDVI thresholds, vegetation-cover-based adjustment, and spectral unmixing [30,35,36]. For example, Gholizadeh et al. [36] proposed a vegetation cover-based soil correction method to improve the relationship between spectral diversity and species richness. Xu et al. [30] applied linear spectral unmixing to minimize soil influence in spectral observations and improve species diversity estimation.
Despite these advances, several important questions remain unresolved. First, although previous studies demonstrated the potential of both airborne VSWIR and UAV-based VNIR imaging spectroscopy for foliar trait estimation, direct comparisons between these platforms under consistent experimental conditions remain scarce. Second, the relative importance of broad spectral coverage versus fine spatial resolution for predicting multiple foliar functional traits in grasslands remains unclear. Third, while several preprocessing and soil correction approaches have been proposed to reduce confounding effects, their effectiveness for improving foliar trait prediction across different hyperspectral platforms has not been systematically evaluated. Addressing these gaps is important for understanding the trade-offs among spectral information, spatial resolution, and preprocessing strategies and for developing robust and cost-effective approaches for operational grassland trait monitoring.
In this study, we collected both airborne and UAV-based hyperspectral imagery to predict a comprehensive set of foliar traits in grasslands. The specific objectives were to: (1) compare the performance of airborne and UAV-based hyperspectral remote sensing for quantifying foliar functional traits; (2) assess the contributions of different spectral regions, including the visible-to-near-infrared (VNIR) and shortwave infrared (SWIR) ranges, to foliar trait estimation accuracy; and (3) evaluate approaches for minimizing the confounding effects of canopy structure, illumination/viewing geometry, and soil background in order to improve the accuracy of foliar trait prediction.
2. Materials and Methods
2.1. Data Collection
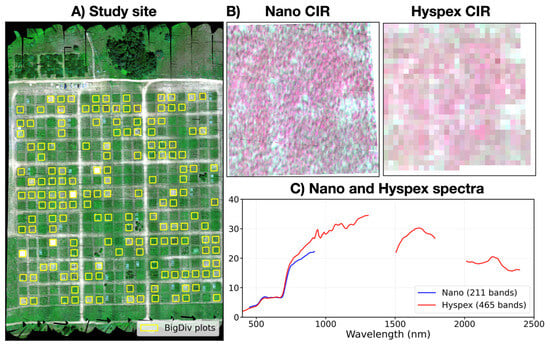
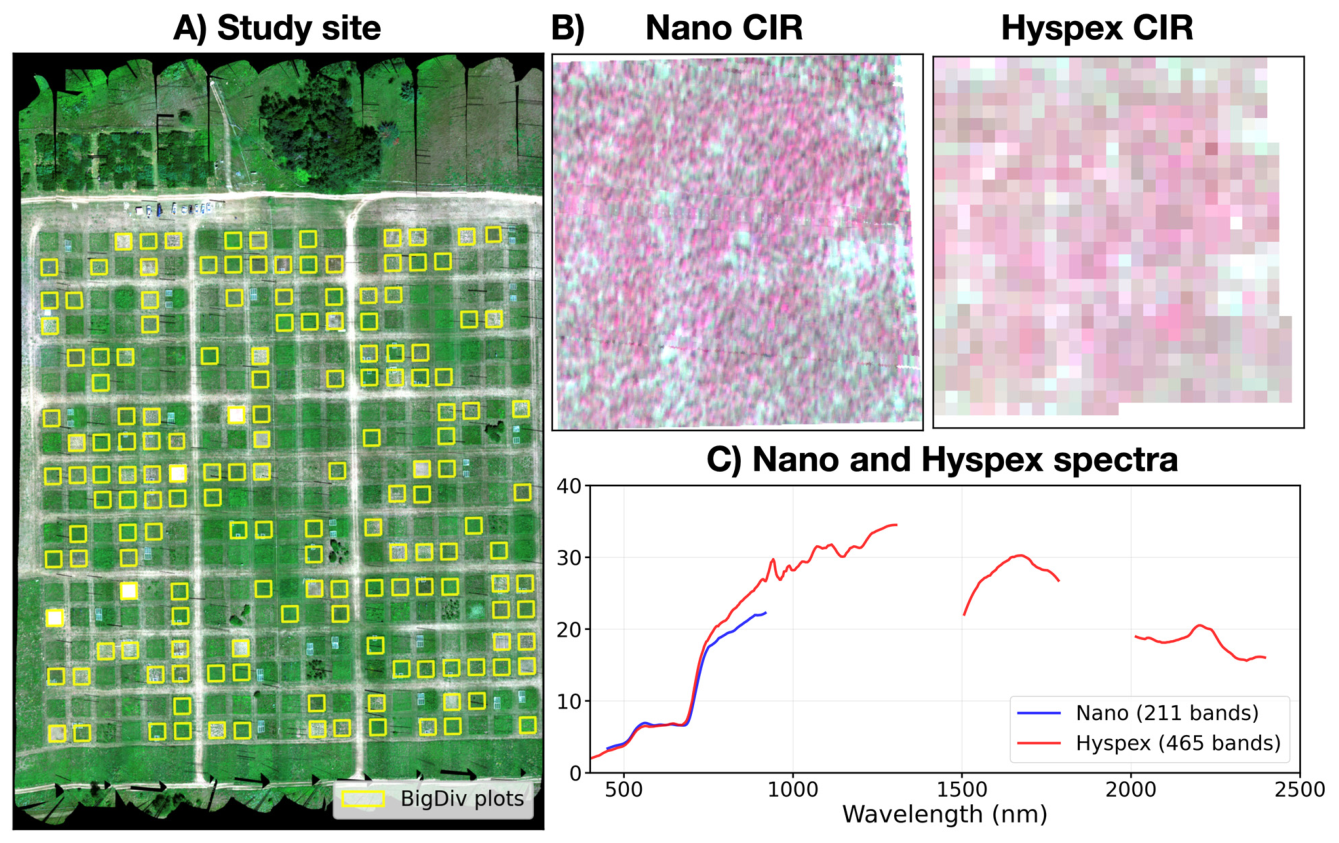
Our study site is situated at the Cedar Creek Ecosystem Science Reserve (CCESR; 45.402°N, 93.202°W) in Minnesota, USA (Figure 1A). Since 1994, CCESR has been maintaining 432 experimental plots (size: 9 × 9 m), among which 154 plots (yellow boxes in Figure 1A) are established to investigate the effects of species diversity and functional traits on ecosystem dynamics and functioning [36,37,38]. These plots are planted with 1, 2, 4, 8 or 16 species selected from 35 prairie-savannah perennial species of five functional types: C3 and C4 grasses, legumes and non-legume forbs, and woody species [24]. During the summers of 2015–2018, fieldwork was conducted to collect leaf spectra, aboveground biomass and airborne hyperspectral imagery.
Figure 1.
The Cedar Creek Ecosystem Science Reserve (CCESR) biodiversity (BioDIV) experiment site. (A) The locations of 154 BioDiv experimental plots. (B) A close-up color-infrared (CIR) view of the Nano images capturing two BioDIV plots. (C) The average spectral reflectance of one BioDIV plot derived from Nano and Hyspex images.
2.1.1. Field Leaf Spectra
Leaf spectra were collected from 38 BioDIV plots between 12 and 19 July 2015. Each plot was evenly divided into nine 3 × 3 m subplots. A 1 × 1 m grid was randomly placed within 4–8 subplots, depending on the species diversity level of the plot. Four plants were chosen within each subplot to represent the dominant species. For each plant, we collected either three mature leaves (two from the top and one from the bottom canopy layer for plants shorter than 30 cm) or five mature leaves (two from the top, two from the middle and one from the bottom layer for plants taller than 30 cm).
Reflectance was measured for each sampled leaf using an SVC spectrometer (HR-1024i; Spectra Vista Corporation, Poughkeepsie, NY, USA) with a wavelength range of 400–2500 nm and a spectral interval of 1 nm. Measurements were conducted using a leaf clip equipped with an internal light source (LC-RP PRO; Spectra Vista Corporation, Poughkeepsie, NY, USA) and a 99% reflectance Spectralon reference panel (Labsphere, North Sutton, NH, USA). Noisy bands below 400 nm or above 2400 nm were excluded. These spectra were used to estimate ten foliar traits of 24 species in Section 3.1. In total, 1076 leaf spectra were collected.
2.1.2. UAV-Borne Nano and Airborne Hyspex Hyperspectral Imaging
Hyperspectral images were acquired on 21 July 2018, using two different imaging spectrometers: the Nano and Hyspex systems (Figure 1B,C). The Nano spectrometer (Headwall Photonics, Bolton, MA, USA) was mounted on a six-rotor unmanned aerial vehicle to capture images at a spatial resolution of 0.02 m (“Nano” in Figure 1B). This system offers 272 spectral bands with a 2.22 nm spectral interval across the 400–1000 nm range (“Nano” in Figure 1C). The Hyspex system (NEO, Oslo, Norway) was mounted on a fixed-wing aircraft, achieving a spatial resolution of 0.25 m (“Hyspex” in Figure 1B). It consists of two imaging spectrometers: the VNIR-1800, which provides 186 spectral bands at a 3.26 nm interval within the 400–1000 nm range, and the SWIR-384, which delivers 288 spectral bands at a 5.24 nm interval across the 930–2500 nm range (“Hyspex” in Figure 1C).
Hyperspectral images were radiometrically calibrated, geometrically orthorectified, and atmospherically corrected. Raw digital numbers were first radiometrically calibrated to at-sensor radiance using the calibration coefficients provided by sensor manufacturers. Then, at-sensor radiance images were geometrically rectified in PARGE (version 4.0, ReSe, Munich, Germany) using GPS positions (longitude, latitude and altitude) and flight attitudes (roll, pitch, and yaw) recorded by inertial measurement unit sensors, along with a 1 m-resolution digital elevation model. Then, geo-rectified at-sensor radiance images were converted to ground-surface reflectance using three calibration tarps in ENVI (version 5.6, L3Harris Geospatial Solutions, Boulder, CO, USA). For Nano images, noisy bands outside the 450–920 nm range were excluded, retaining 211 bands. For Hyspex images, spectral bands greatly affected by atmospheric scattering and absorption (400–450 nm, 1310–1502 nm, 1790–2010 nm and 2400–2500 nm) were removed, retaining 465 bands. Finally, the spectra were smoothed using a Savitzky–Golay filter (window size: 11 bands; polynomial order: 2).
2.1.3. Plant Species and Aboveground Biomass
Aboveground dry weight biomass for each species was collected in clip strips along the edges of 154 BioDIV plots. These data were utilized to upscale foliar traits from the leaf to plot levels in Section 3.1 and to calculate plant diversities in Section 3.4.
2.2. Methodology
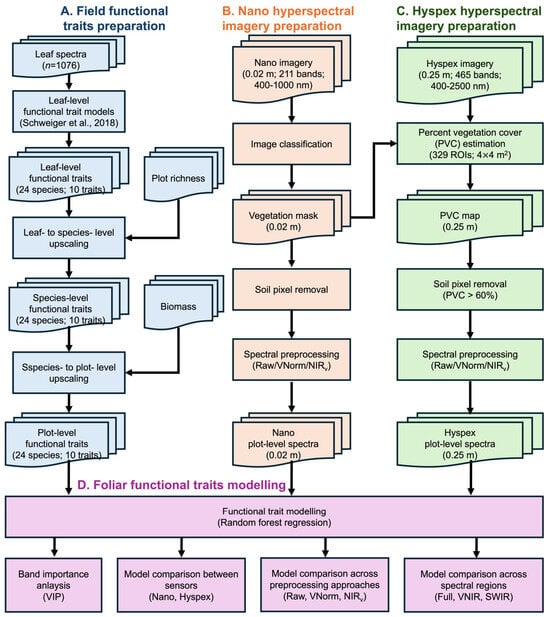
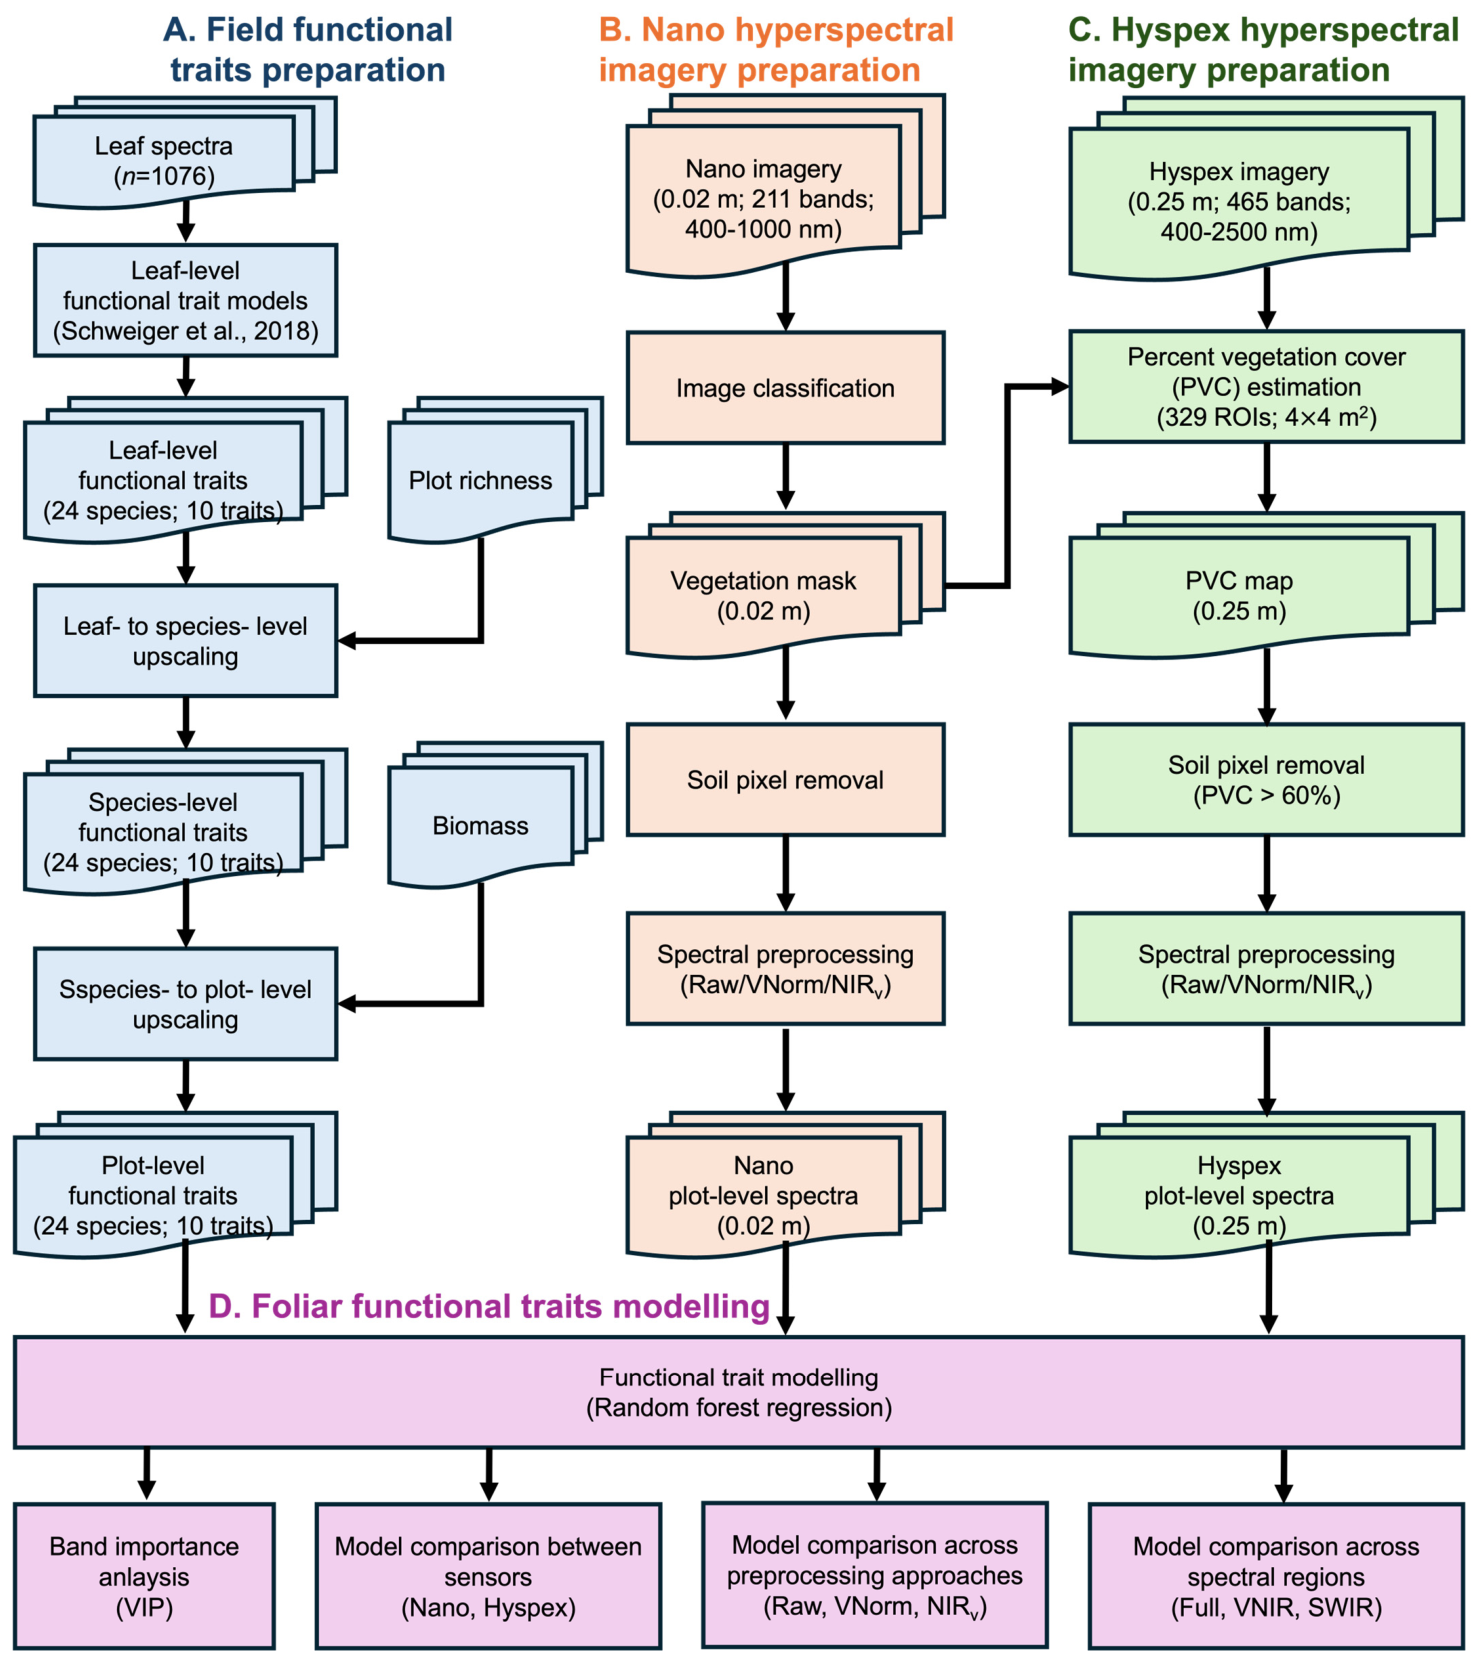
Figure 2 summarizes the methodological framework adopted in this study. First, foliar functional traits were estimated from leaf spectra using previously developed PLSR models [24] and subsequently upscaled from leaf to species and plot levels based on species composition and biomass data. Second, Nano and Hyspex hyperspectral imagery were independently processed to minimize soil background effects through vegetation classification and PVC-based masking, respectively, followed by three spectral preprocessing techniques. Finally, random forest regression models were developed to predict plot-level foliar traits from hyperspectral data, enabling comparisons among sensors, spectral preprocessing approaches, and spectral regions, as well as assessment of band importance for trait estimation. All image processing, statistical analyses, model development, and figure production were conducted in Python (v3.9.0) using the packages NumPy (v2.4.6), Pandas (v3.0.3), Rasterio (v1.5.0), GeoPandas (v1.1.3), Scikit-learn (v1.9.0), and Matplotlib (v3.11.0).
Figure 2.
Workflow for foliar functional trait mapping using field spectroscopy, UAV hyperspectral imagery (Nano), and airborne hyperspectral imagery (Hyspex). (A) Leaf-level foliar traits were first derived from leaf spectra and subsequently upscaled to species- and plot-level traits using species composition and biomass information. (B) Nano imagery (0.02 m, 211 bands, 400–1000 nm) was processed through vegetation classification and spectral preprocessing to derive plot-level spectra. (C) Hyspex imagery (0.25 m, 465 bands, 400–2500 nm) was processed through percent vegetation cover (PVC) estimation, PVC-based soil removal, and spectral preprocessing to derive plot-level spectra. (D) Random forest regression models were developed to predict plot-level foliar traits from hyperspectral data, followed by analyses of variable importance, sensor comparison (Nano vs. Hyspex), preprocessing methods (Raw, VNorm, and NIRv), and spectral regions (Full spectrum, VNIR, and SWIR).
2.2.1. Upscaling Foliar Functional Traits from Leaf to Plot Levels
Obtaining plot-level foliar traits by collecting all traits for every plant species within each plot would be ideal but is impractical due to the extensive field sampling and chemical assays required. For a comprehensive data collection in this study, an estimated total of 9240 measurements would have been needed, calculated as 6 species on average per plot × 154 plots × 10 traits per species. To address this challenge, we adopted an approach for estimating plot-level foliar traits reported by [24] (Figure 2A). This method involves predicting leaf-level traits from leaf spectra and subsequently upscaling them to species and plot levels.
First, partial least squared regression (PLSR) models trained on field data collected at CCESR were applied to leaf reflectance to predict ten foliar traits. These traits included the concentrations of carbon, nitrogen, hemicellulose, non-structural carbohydrate (NSC), hemicellulose, cellulose, lignin on a dry-mass basis (%), as well as chlorophyll a + b, xanthophylls, β-carotene and carotenoids contents on a leaf-area basis (μmol·m−2). The predictive accuracy of these models is high, with validation R2 values ranging from 0.56 to 0.87 [24].
Then, species-level foliar functional traits were obtained from leaf-level predictions using a three-stage aggregation procedure. In the first stage, leaf-level trait values were averaged for each species in each subplot to generate subplot-level species means. In the second stage, subplot-level means were averaged across subplots within each plot to produce plot-level species means. In the third stage, two types of species-level averages were derived: (1) means averaged across plots sharing the same treated species richness (i.e., 1, 2, 4, 8 and 16 species) to account for potential effects of neighboring species richness on species traits, and (2) overall species means averaged across all plots. This averaging procedure allows robust upscaling of leaf-level predictions while capturing the influence of local community composition on species-level trait expression.
Finally, species-level traits were upscaled to the plot level by weighting each species’ traits according to its relative biomass within the plot, thereby reflecting each species’ contribution to overall plot-level trait composition. When calculating plot-level traits for plots with a specific treated species richness (i.e., 1, 2, 4, 8, or 16 species), species-level traits averaged across plots with the same richness were used. If a particular species-level trait was unavailable for a given richness treatment, the overall species mean across all plots was substituted. This approach accounts for potential effects of neighboring species richness on species traits. The resulting plot-level traits were used for mapping foliar traits from hyperspectral images in Section 3.3. In total, 154 plot-level foliar trait samples were used for model development and trait mapping.
2.2.2. Correcting for Soil Effects in Mapping Functional Traits from Hyperspectral Imagery
In this study, we applied two approaches, including image classification (Figure 2A) and percent vegetation cover (PVC) threshold (Figure 2B), to correct soil effects in mapping functional traits from Nano and Hyspex imagery, respectively.
- (a)
- Soil Correction for 0.02 m-resolution Nano Images
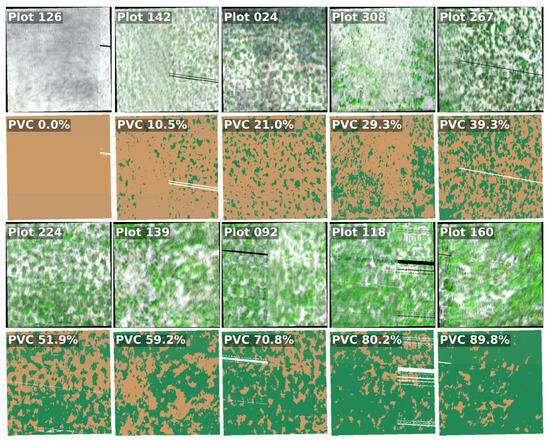
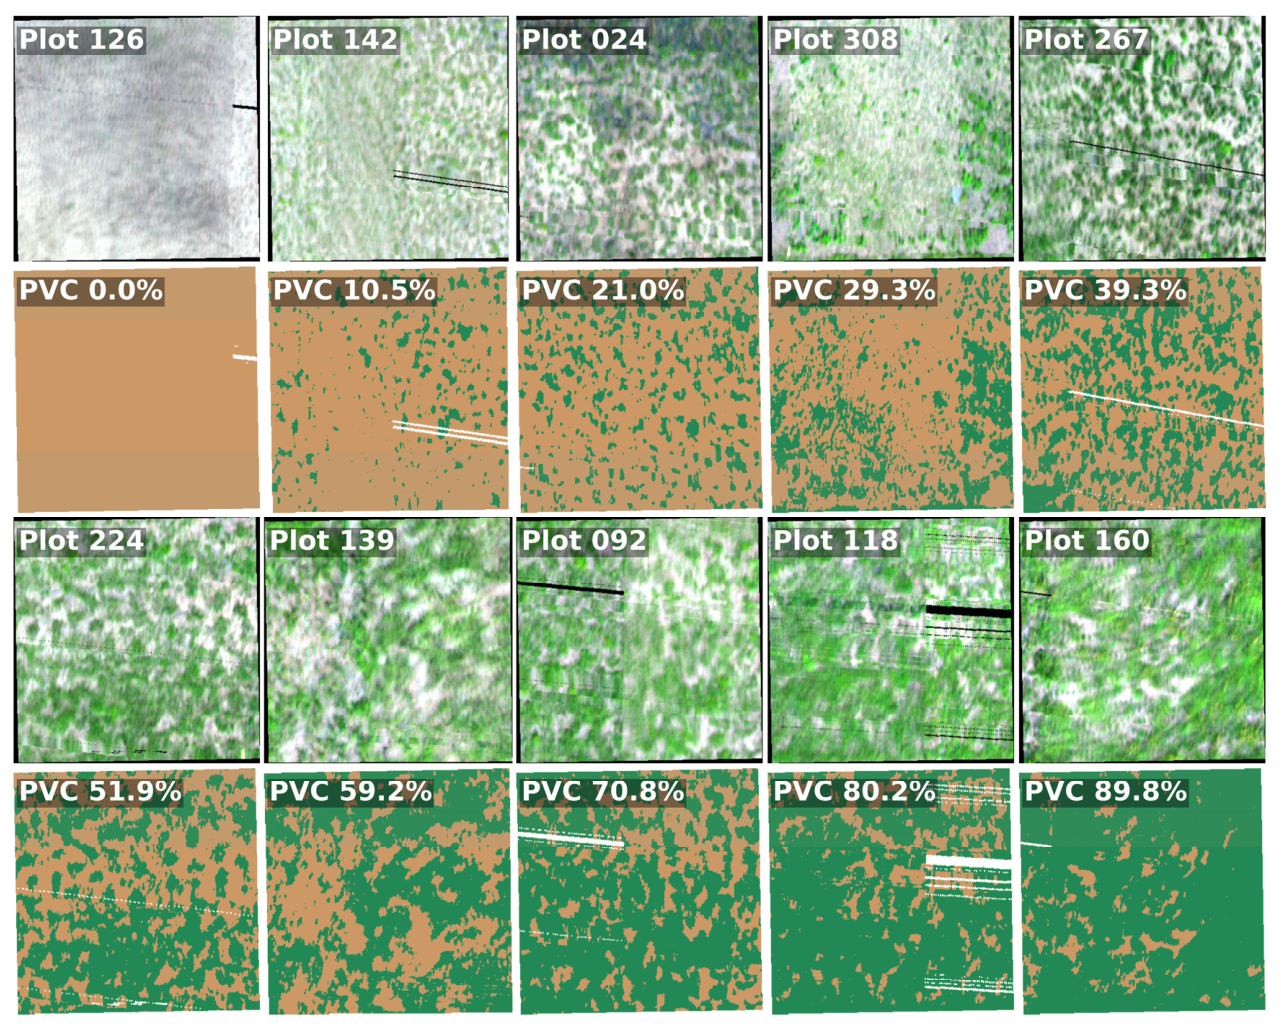
The 0.02 m spatial resolution of the Nano images allowed for accurate differentiation between vegetated and soil pixels (“RGB” in Figure 3). A total of 24,656 vegetation pixels and 42,811 soil pixels were visually identified from Nano images. Three-fourths of these samples were used to train a random forest classifier using vector-normalized Nano spectra as inputs. This classifier achieved an F1 score of 99.79% upon the remaining one-fourth of the samples. Then, we applied this classifier to Nano images to exclude soil pixels from trait mapping in Section 3.3. Figure 3 shows examples of Nano true-color images and their corresponding classification maps for 10 representative plots spanning vegetation cover from 0% to 90%.
Figure 3.
Examples of the RGB true color (rows 1 and 3) and binary classification (rows 2 and 4; brown = soil, dark green = vegetation, white = no Nano observation) of Nano images at ten plots. Plot-level percent vegetation cover (PVC) was calculated as the proportion of vegetated pixels relative to the total number of pixels within each plot.
- (b)
- Soil Correction for 0.25 m-resolution Hyspex Images
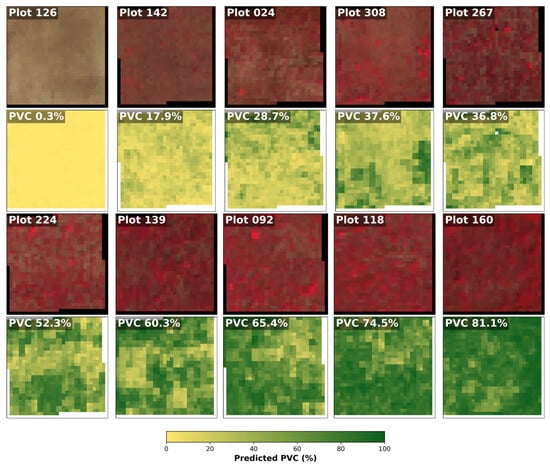
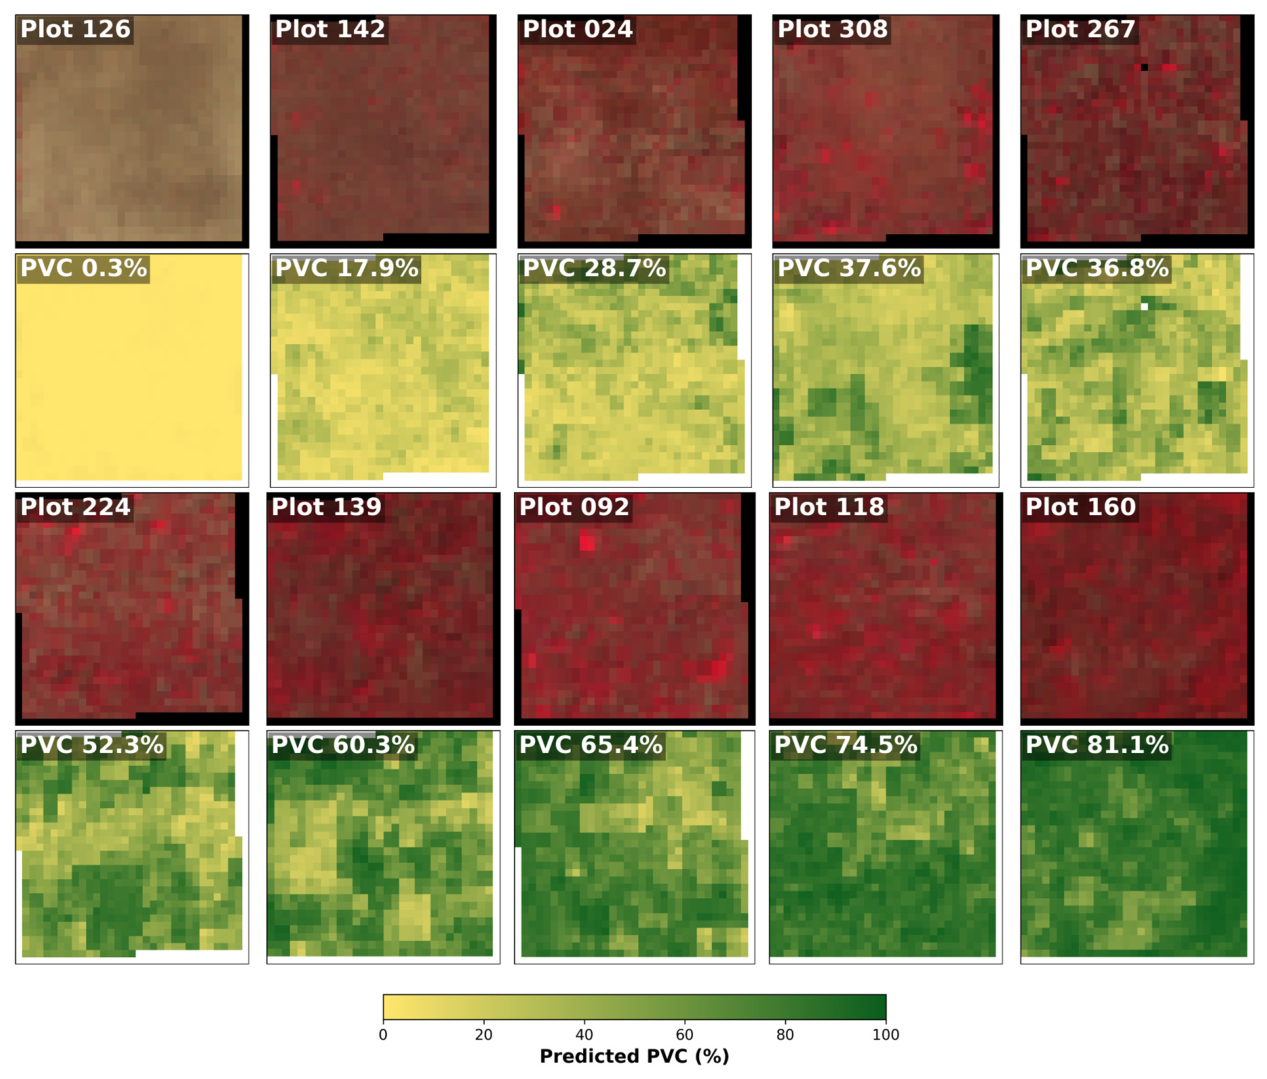
Removing the soil effect was challenging for the 0.25 m resolution Hyspex imagery due to the presence of mixed pixels (“CIR” in Figure 4). To address this, we applied a threshold to the estimated percent vegetation cover (PVC) to exclude soil-affected pixels. However, it should be noted that directly deriving Hyspex pixel-level PVC from the 0.02 m Nano-classification imagery was infeasible due to insufficient pixel-to-pixel registration accuracy between the two datasets. The spatial misalignment between the two sensor systems made it unreliable to determine which specific Nano pixels corresponded to each Hyspex pixel.
Figure 4.
Examples of Hyspex false-color images (rows 1 and 3) and corresponding PVC maps (rows 2 and 4) at ten plots. Plot-level percent vegetation cover (PVC) was calculated as the proportion of vegetated pixels relative to the total number of pixels within each plot.
To overcome this limitation, we randomly generated 329 regions of interest (ROIs), each measuring about 4 × 4 m2 (=256 Hyspex pixels). At the ROI scale, the misregistration between Nano and Hyspex images was considered negligible. For each ROI, we calculated PVC from the Nano-classification maps as the proportion of vegetated pixels and extracted the corresponding the mean of vector-normalized Hyspex spectra. Two-thirds of the ROIs were used to train a random forest regression model to predict PVC from Hyspex spectra, while the remaining one-third was reserved for validation. This model achieved an R2 of 0.95 and RMSE of 7% and was applied to estimate pixel-level PVC across the entire Hyspex image (“PVC” in Figure 4). A PVC threshold of 60% was applied to exclude Hyspex pixels with low vegetation cover.
2.2.3. Modeling Foliar Functional Traits with Hyperspectral Imagery
Plot-level average spectra were extracted for each BioDIV plot by averaging vegetation pixels. For Nano imagery, all pixels classified as vegetation were included, whereas for Hyspex imagery, only pixels with percent vegetation cover (PVC) > 60% were considered. To evaluate the effects of spectral preprocessing on trait estimation, three types of vegetation spectra were considered: (1) raw reflectance, (2) vector-normalized reflectance, and (3) near-infrared reflectance of vegetation (NIRv)-corrected spectra (Figure 2B,C). Vector normalization transforms each pixel spectrum into a unit vector to reduce brightness variability caused by illumination differences and canopy structural heterogeneity. The NIRv correction, implemented by dividing reflectance at each band by NIRv (defined as NDVI × NIR), was used to mitigate background soil effects and better isolate the vegetation canopy signal, particularly accounting for sub-canopy soil contributions. In addition, to evaluate the influence of spectral range on trait estimation, Hyspex bands were separated into three spectral subsets: full spectrum (400–2500 nm), VNIR (400–1400 nm), and SWIR (1500–2500 nm). Each spectral range was used independently to model foliar traits.
Random forest regression models were developed to link plot-level traits to the plot-level average spectra (Figure 2D). The dataset was divided into calibration and validation subsets in a 3:1 ratio. Model accuracy was assessed using the coefficient of determination (R2), root mean squared error (RMSE) and normalized RMSE (%RMSE = RMSE/(Max − Min) × 100%, where Max and Min are the observed trait value ranges).
3. Results
3.1. Correlation and Principal Component Analysis of Foliar Functional Traits
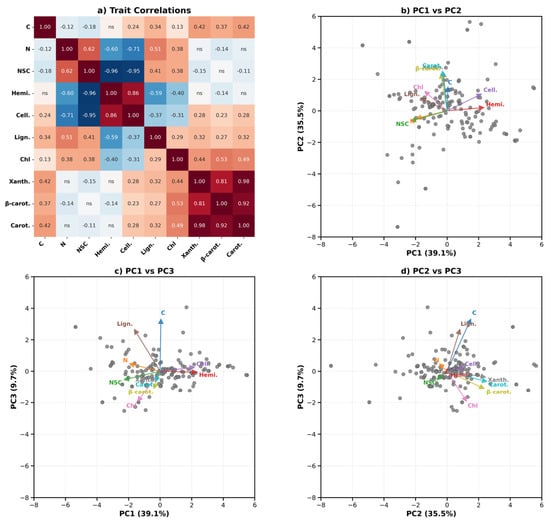
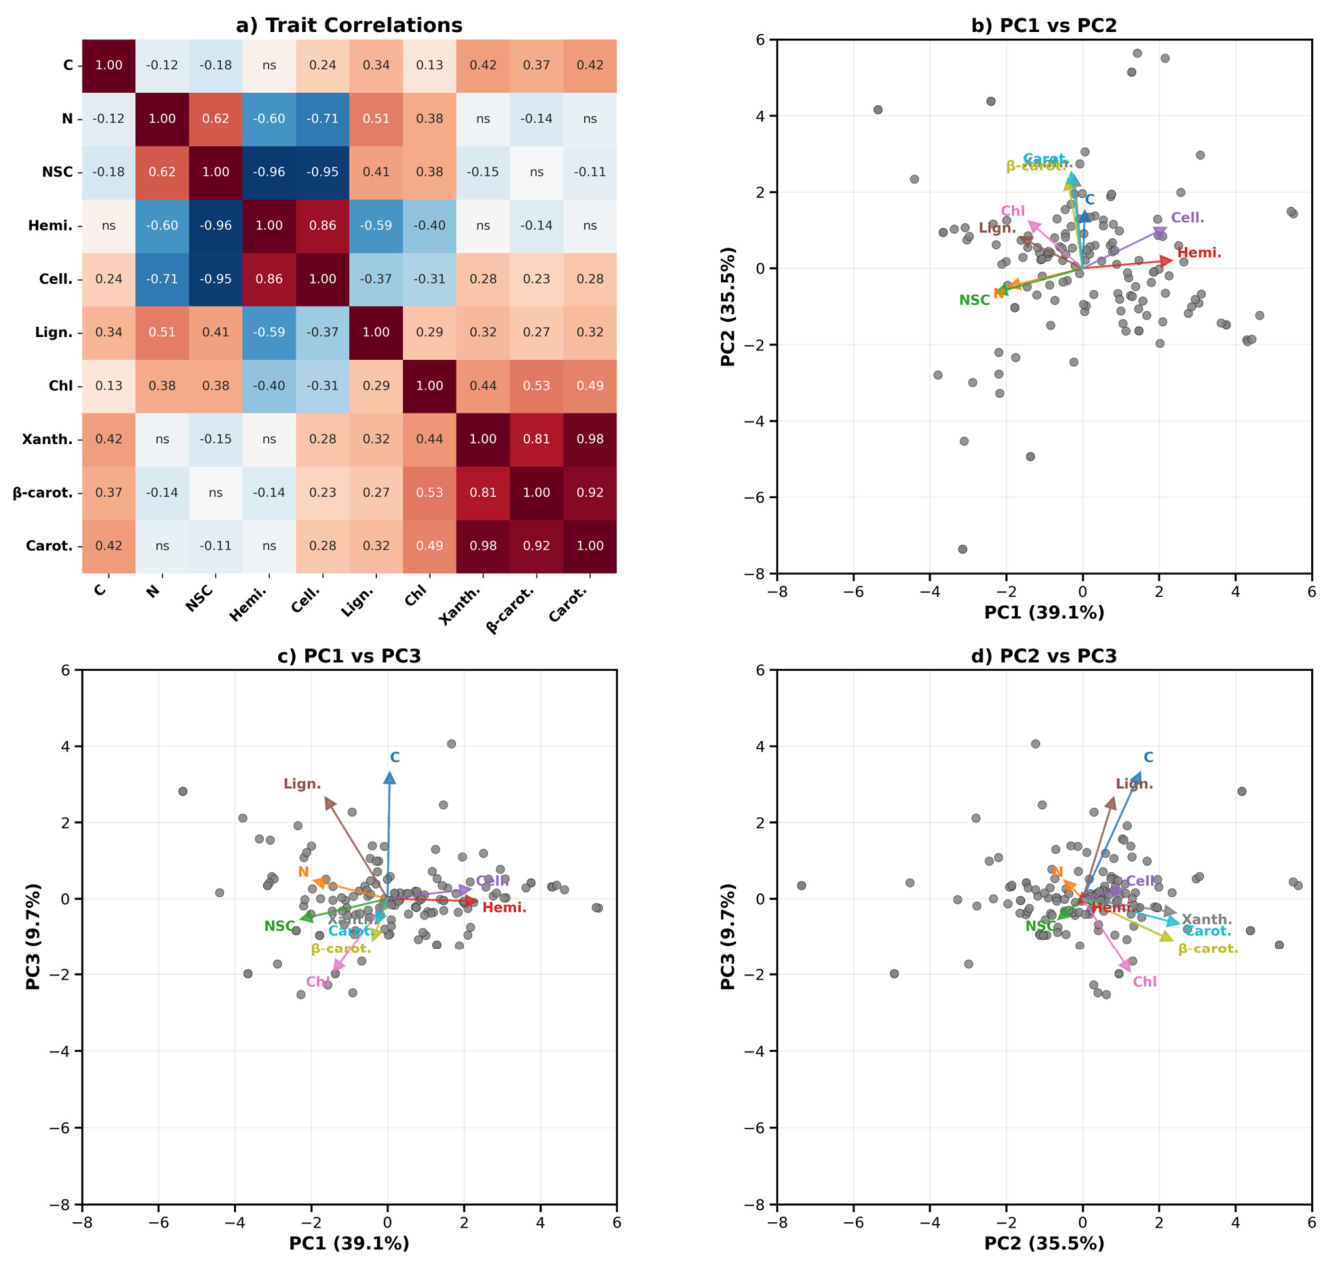
Strong correlations were observed among several traits (Figure 5a). In particular, carotenoids, β-carotene, and xanthophylls were highly positively correlated with each other (Pearson’s correlation r = 0.81–0.98), reflecting their closely related physiological functions in photoprotection and light harvesting. Structural compounds also exhibited strong interrelationships, with hemicellulose positively correlated with cellulose (r = 0.86) but strongly negatively correlated with NSC (r = −0.96). Similarly, cellulose showed a strong negative correlation with nitrogen (r = −0.71) and NSC (r = −0.95), indicating a trade-off between structural investment and metabolically active compounds. Nitrogen was positively associated with NSC (r = 0.62) and lignin (r = 0.51), whereas chlorophyll showed moderate positive correlations with carotenoid-related pigments (r = 0.44–0.53). Carbon content exhibited relatively weak correlations with most traits (|r| ≤ 0.42), although moderate positive relationships were observed with lignin and carotenoid pigments.
Figure 5.
Relationships among plot-level foliar functional traits. (a) Pearson correlation matrix showing pairwise correlations among ten foliar traits, including carbon (C), nitrogen (N), non-structural carbohydrates (NSC), hemicellulose (Hemi.), cellulose (Cell.), lignin (Lign.), chlorophyll a + b (Chl), xanthophylls (Xanth.), β-carotene (β-carot.), and carotenoids (Carot.). “ns” indicates non-significant correlations (p > 0.05). Panels (b–d) show biplots of the first three principal components (PCs) derived from plot-level foliar traits. Colored arrows indicate trait loadings and directions of contribution to each PC.
The PCA revealed major axes of coordinated variation among foliar traits (Figure 5b–d). The first three principal components explained 84.3% of the total variance. PC1 primarily represented a gradient contrasting structural compounds and pigments. Hemicellulose and cellulose loaded positively along PC1, whereas NSC and several pigment-related traits loaded negatively. PC2 was largely associated with pigment variation, particularly carotenoids, β-carotene, xanthophylls, and chlorophyll, which showed strong positive loadings. PC3 captured additional variation associated mainly with carbon and lignin, both of which exhibited strong positive loadings, while chlorophyll and carotenoid-related pigments contributed negatively.
3.2. Performance for Foliar Functional Trait Prediction Using Nano Imagery
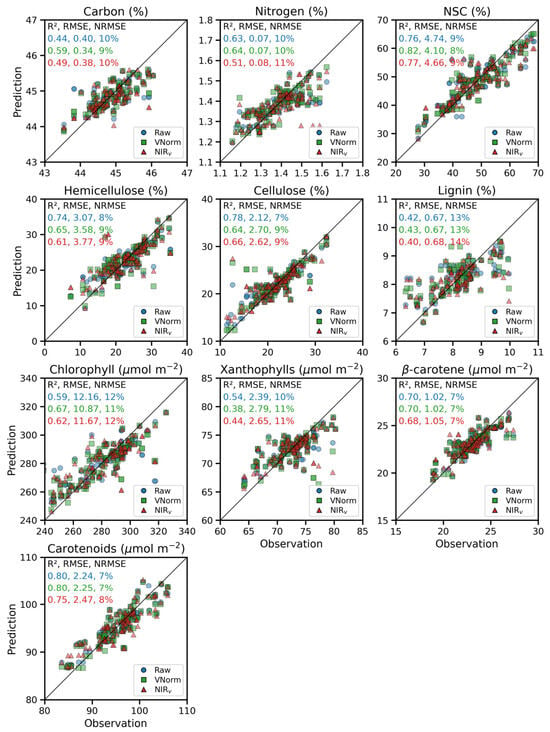
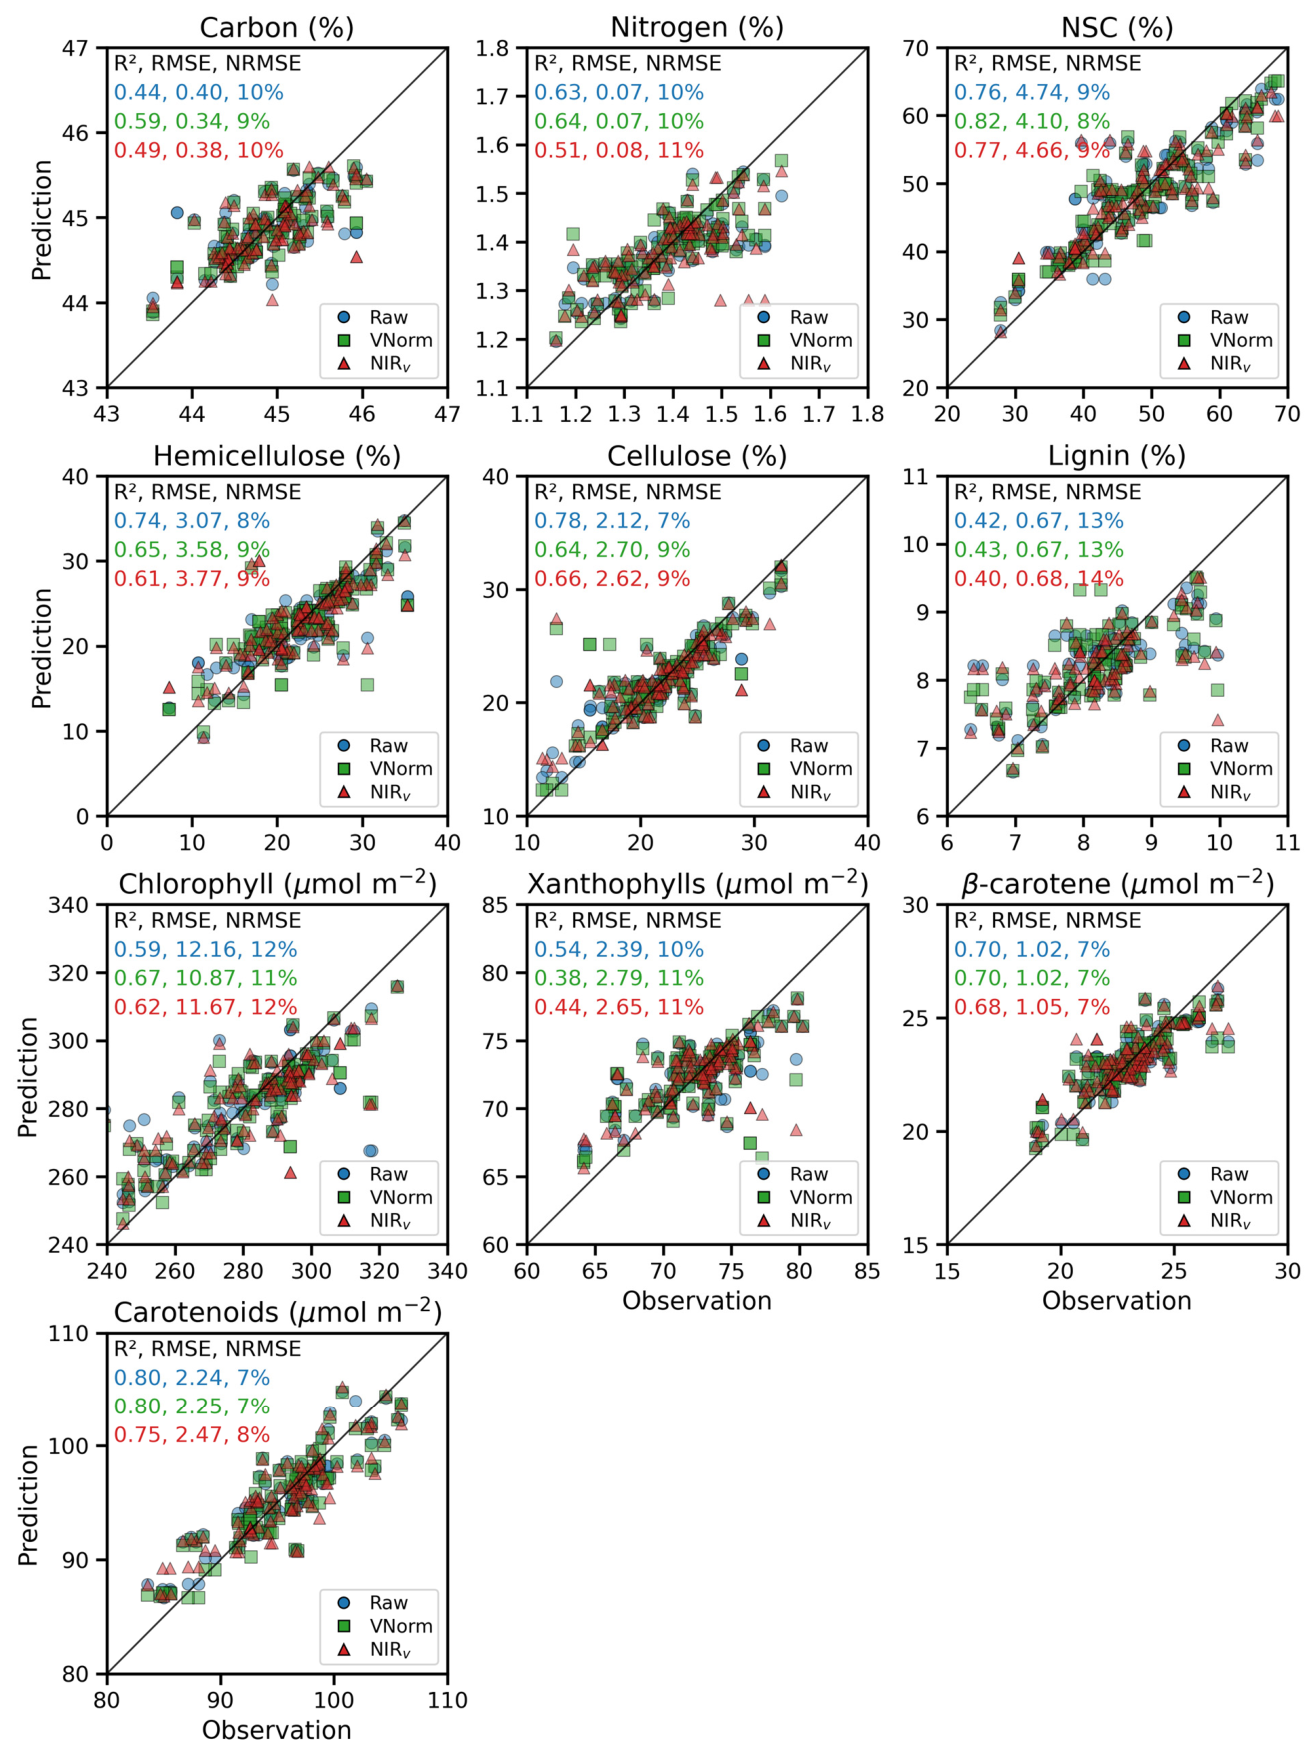
Using PLSR models developed from plot-level foliar trait measurements and Nano hyperspectral imagery under three spectral preprocessing strategies (raw reflectance, vector normalization, and NIRv correction), we evaluated prediction performance across ten foliar functional traits (Figure 6). The performance of foliar trait estimation using Nano hyperspectral imagery varied across traits and preprocessing strategies (Figure 6). Overall, model performance ranged from moderate to high, with validation R2 values between 0.38 and 0.82 and NRMSE below 14%. Traits associated with pigments and non-structural compounds were generally predicted with the highest accuracy. In particular, NSC, carotenoids, β-carotene, and cellulose were achieved with relatively high accuracy (R2 = 0.66–0.82; NRMSE = 6–9%). Moderate accuracies were obtained for nitrogen, hemicellulose, and chlorophyll (R2 = 0.51–0.74; NRMSE = 8–12%), whereas xanthophylls, lignin and carbon showed comparatively lower predictive performance (R2 = 0.38–0.54; NRMSE = 10–11%).
Figure 6.
Performance of foliar functional trait estimation using Nano hyperspectral imagery. Raw: models developed using raw reflectance spectra; VNorm: models developed using vector-normalized reflectance spectra; NIRv: models developed using NIRv-corrected spectra.
The influence of spectral preprocessing was trait-dependent. Compared to raw reflectance, vector normalization generally improved model performance for several traits. The largest improvement was observed for carbon, where R2 increased from 0.44 to 0.59, accompanied by reductions in RMSE (0.40 to 0.34) and NRMSE (10% to 9%). NSC and chlorophyll also benefited from vector normalization, with improvements of 0.06 and 0.08 in R2, respectively. In contrast, nitrogen showed only marginal changes (ΔR2 = 0.01) relative to raw reflectance. Reduced model performance was observed for structural traits, including hemicellulose (ΔR2 = −0.09, ΔRMSE = 0.51, ΔNRMSE = 1%) and cellulose (ΔR2 = −0.14, ΔRMSE = 0.58, ΔNRMSE = 2%).
3.3. Performance for Foliar Functional Trait Prediction Using Hyspex Imagery
The performance of foliar trait estimation using Hyspex full-spectrum imagery varied among traits and preprocessing strategies (“Full spectrum” in Table 1), with R2 values ranging from 0.32 to 0.80 and NRMSE values ranging from 7% to 15%. Similar to the Nano imagery results, traits associated with pigments, non-structural compounds, and leaf structural composition were generally predicted with relatively high accuracy. Carotenoids achieved the highest accuracy (R2 = 0.78–0.80; NRMSE = 7–8%), followed by NSC (R2 = 0.72–0.77; NRMSE = 9–11%), hemicellulose (R2 = 0.60–0.74; NRMSE = 8–10%), and β-carotene (R2 = 0.63–0.75; NRMSE = 6–8%). Moderate performance was obtained for nitrogen (R2 = 0.51–0.65; NRMSE = 10–12%), cellulose (R2 = 0.61–0.71; NRMSE = 8–9%), chlorophyll (R2 = 0.49–0.61; NRMSE = 12–14%), and xanthophylls (R2 = 0.44–0.58; NRMSE = 9–11%). Lignin consistently showed the lowest predictive performance (R2 = 0.32–0.45; NRMSE = 13–15%), followed by carbon (R2 = 0.35–0.54; NRMSE = 9–11%).
Table 1.
Performance of foliar functional trait estimation using Hyspex full (wavelength range: 400–2500 nm), VNIR (visible-to-near-infrared, 400–1300 nm) and SWIR (shortwave infrared, 1400–2500 nm)-spectrum hyperspectral imagery. Raw: models developed using raw reflectance spectra; VNorm: models developed using vector-normalized reflectance spectra; NIRv: models developed using NIRv-corrected spectra. The best-performing model for each foliar trait is highlighted in red.
The influence of spectral preprocessing was again trait-dependent. Compared with raw reflectance spectra, vector normalization improved model performance for several traits, particularly lignin, hemicellulose, cellulose, β-carotene, and carotenoids. The largest improvement was observed for lignin, where R2 increased from 0.32 to 0.42 and NRMSE decreased from 15% to 13%. Moderate improvements were also observed for hemicellulose (R2: from 0.71 to 0.73; RMSE: from 3.19 to 3.09), cellulose (R2: from 0.67 to 0.69; RMSE: from 2.48 to 2.40), β-carotene (R2: from 0.66 to 0.69; RMSE: from 1.08 to 1.04), and carotenoids (R2: from 0.78 to 0.80; RMSE: from 2.35 to 2.22). In contrast, reduced performance was observed for nitrogen (R2: from 0.64 to 0.59; NRMSE: from 10% to 11%) and carbon (R2: from 0.54 to 0.52). NIRv-corrected spectra generally produced lower predictive performance than both raw and vector-normalized spectra across most traits, with average reductions in R2 of approximately 0.06–0.10 for several traits, although β-carotene and lignin showed slight improvements.
Comparison of model performance among spectral ranges revealed contrasting contributions of VNIR and SWIR information to foliar trait estimation (“VNIR” and “SWIR” in Table 1). Overall, model performance obtained using VNIR spectra was comparable to that derived from the Hyspex full spectrum, with no significant differences observed for either R2 or NRMSE (p > 0.05), indicating that the majority of predictive information for many foliar traits was retained within the 400–1400 nm spectral region despite the exclusion of SWIR wavelengths.
Across all traits and preprocessing strategies, SWIR-only models exhibited a small overall decline in predictive performance relative to full-spectrum models (mean ΔR2 = −0.02), but this effect was strongly trait-dependent. The most pronounced decreases occurred for pigment- and physiology-related traits, including carbon, nitrogen, chlorophyll, and xanthophylls, with declines in R2 reaching up to approximately −0.13. These reductions indicate that VNIR wavelengths contain critical information related to photosynthetic pigments and canopy physiological status, likely due to strong visible absorption features and indirect relationships with canopy productivity and structure.
In contrast, SWIR-only spectra provided limited but consistent improvements for certain structural and dry-matter-related traits. Cellulose and hemicellulose showed moderate gains under SWIR-only configurations in some preprocessing schemes (e.g., ΔR2 up to 0.05 for cellulose and 0.02–0.04 for hemicellulose), suggesting that SWIR wavelengths contribute complementary absorption information associated with leaf structural composition. Nitrogen also exhibited occasional improvements under SWIR-based models (ΔR2 up to 0.06–0.07 depending on preprocessing), although these responses were not consistent across all cases.
3.4. Contributions of VNIR and SWIR Wavelengths to Foliar Trait Estimation
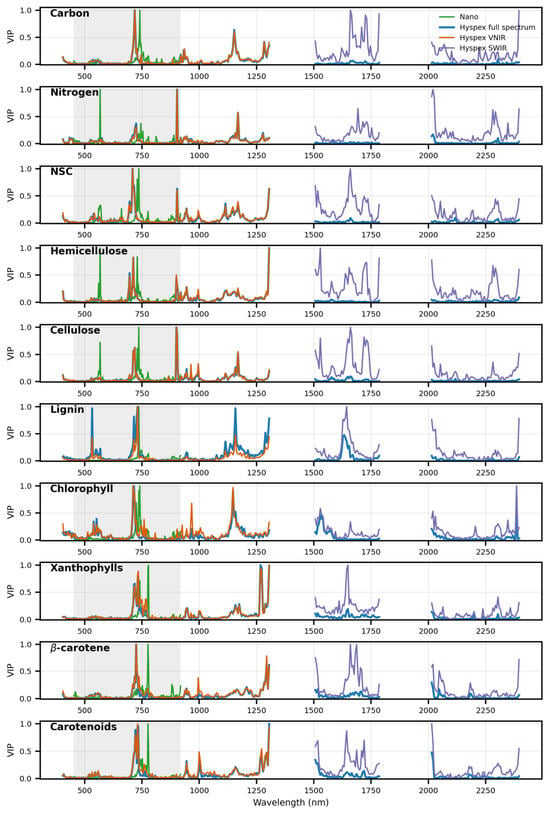
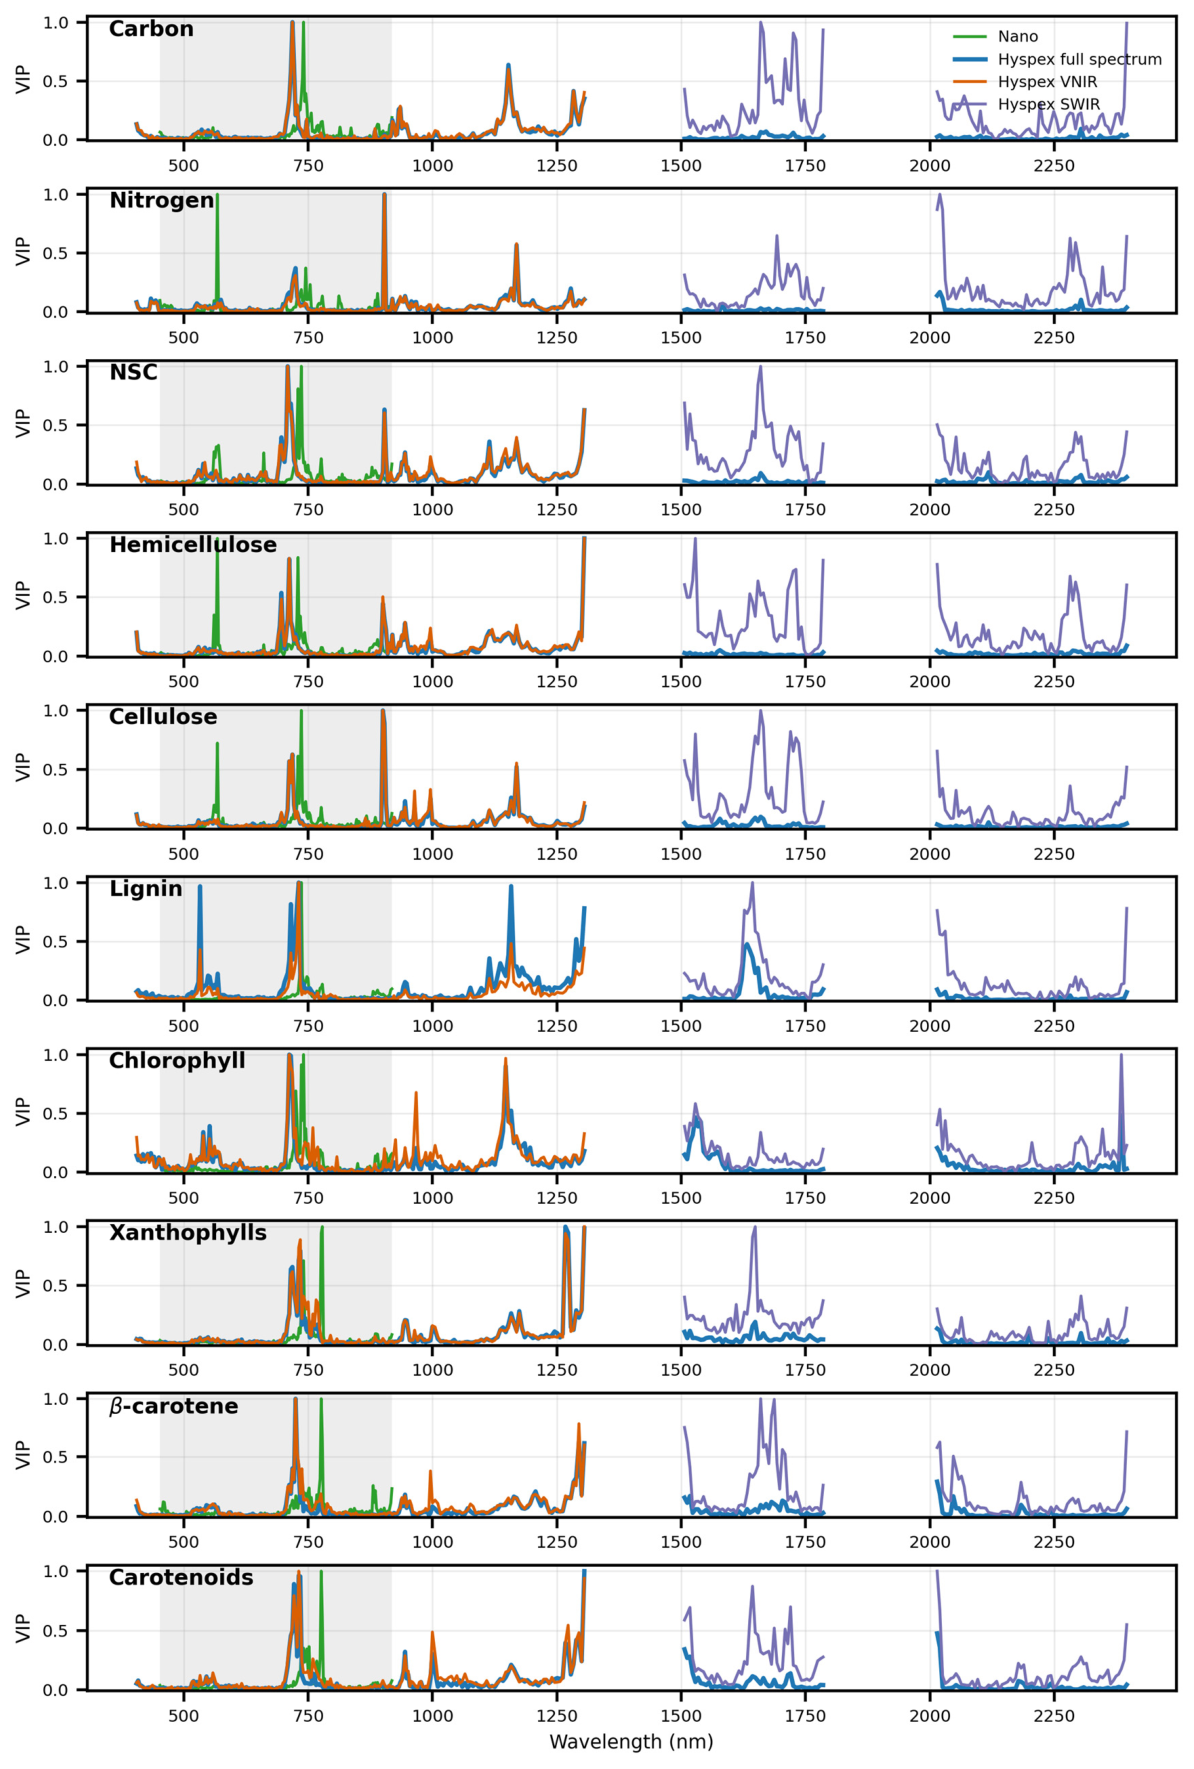
Variable importance patterns differed among foliar traits and spectral configurations (Figure 7). Across most traits, the highest variable importance (VIP) values in Nano, Hyspex full-spectrum, and Hyspex VNIR models were concentrated within the visible and red-edge regions, particularly around 680–760 nm. Additional important regions were consistently observed near 930–980 nm and approximately 1150–1300 nm. In contrast, SWIR-only models exhibited broader and more distributed importance patterns, with major peaks occurring around 1500–1750 nm, 2000 nm, and 2200–2350 nm.
Figure 7.
Variable importance patterns for random forest models predicting ten foliar traits using vector-normalized Nano spectra, Hyspex full-spectrum spectra, Hyspex VNIR spectra, and Hyspex SWIR spectra. Curves represent normalized variable importance (VIP) values across wavelengths. Nano spectra covered the 450–920 nm range, Hyspex VNIR spectra covered 400–1400 nm, and Hyspex SWIR spectra covered 1500–2500 nm. The shadow area represents the wavelength range of the Nano sensor.
Pigment-related traits, including chlorophyll, xanthophylls, β-carotene, and carotenoids, showed highly consistent importance peaks in the visible and red-edge regions across Nano, Hyspex full-spectrum, and Hyspex VNIR models. Strong VIP peaks were particularly concentrated near 700–750 nm, corresponding to the red-edge transition region that is highly sensitive to chlorophyll absorption and canopy photosynthetic activity. Additional importance peaks near 1200–1300 nm were also observed for several pigment traits, suggesting indirect coupling between pigment concentrations and canopy structural characteristics.
Structural and dry-matter-related traits exhibited more substantial contributions from SWIR wavelengths. Hemicellulose and cellulose showed pronounced VIP peaks in the 1500–1750 nm region, as well as around 2200–2350 nm, corresponding to known absorption features associated with cellulose, lignin, and other carbon-based compounds [17]. These SWIR importance patterns were considerably stronger than those observed for pigment-related traits, supporting the finding that SWIR wavelengths provided complementary information for structural trait estimation. Lignin also exhibited relatively strong SWIR importance, particularly near 1650 nm and beyond 2200 nm, although visible and red-edge wavelengths remained important in full-spectrum models.
Nitrogen and NSC displayed mixed spectral importance patterns spanning both VNIR and SWIR regions. For nitrogen, important wavelengths occurred near the red-edge region (~700–750 nm), around 900–1000 nm, and within several SWIR regions associated with protein- and water-related absorption features. NSC exhibited broad importance across visible, near-infrared, and SWIR domains, suggesting that its estimation relied on combined information related to canopy productivity, water status, and dry-matter composition.
3.5. Comparison of Nano- and Hyspex-Derived Foliar Trait Maps
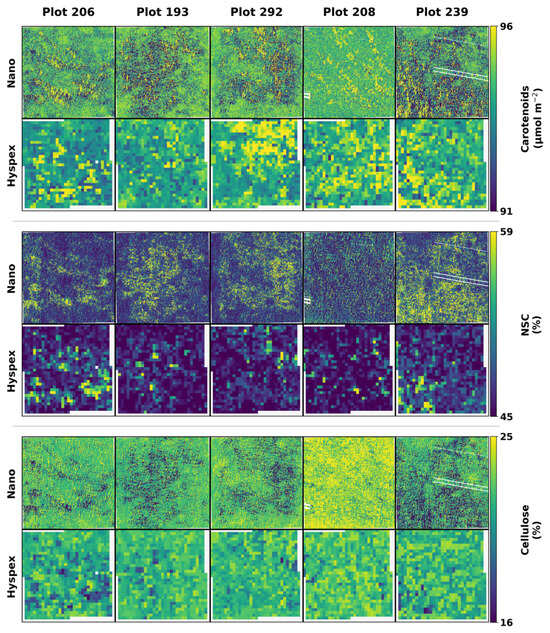
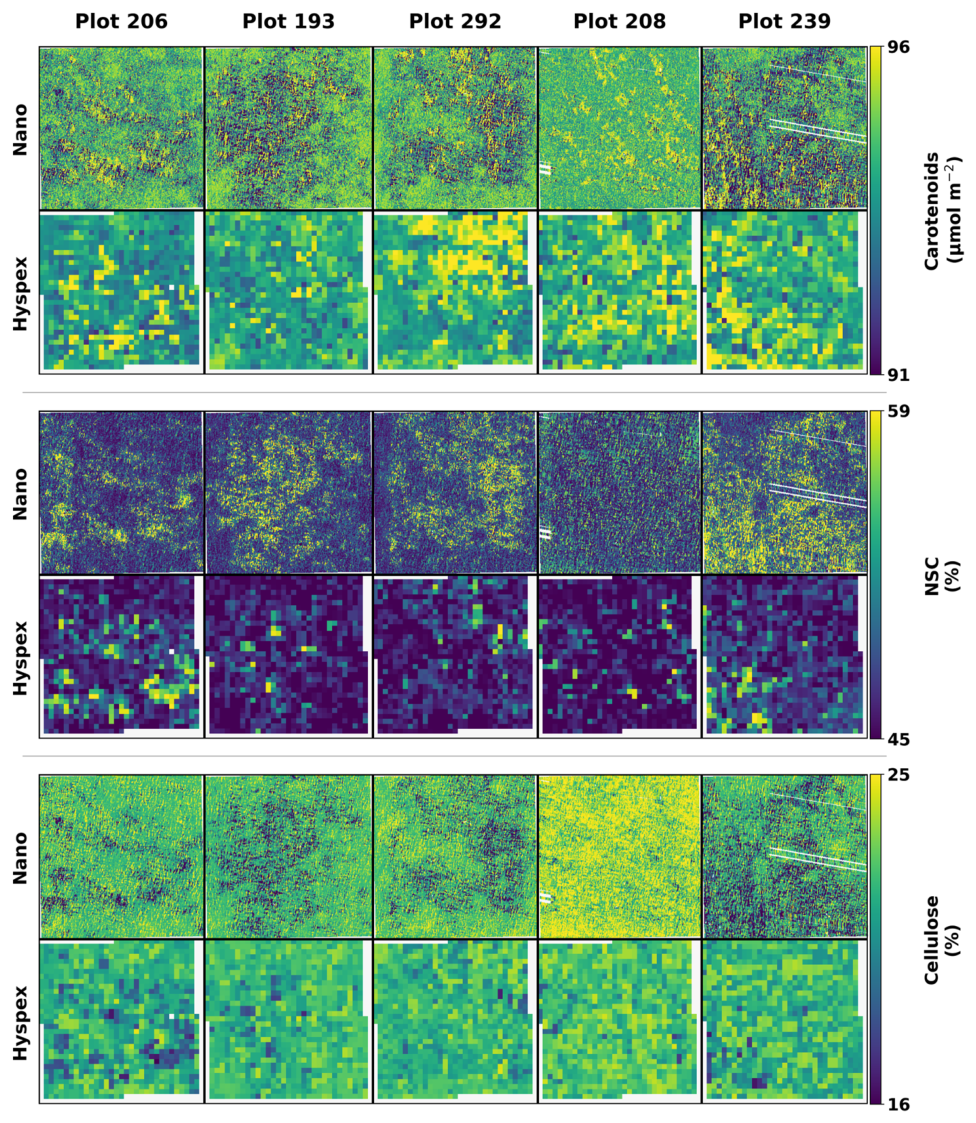
Figure 8 illustrates representative spatial distributions of carotenoids, NSC, and cellulose predicted from Nano and Hyspex hyperspectral imagery across five BioDIV plots. Overall, spatial patterns derived from the two imaging systems were broadly consistent despite a substantial difference in their spatial resolutions (i.e., 0.02 m for Nano and 0.25 m for Hyspex). Nano imagery revealed pronounced fine-scale heterogeneity within plots, with trait distributions varying at centimeter scales, whereas Hyspex imagery captured similar large-scale spatial gradients but with substantially smoother patterns due to mixed-pixel effects associated with the coarse 0.25 m spatial resolution.
Figure 8.
Representative spatial distributions of carotenoids, non-structural carbohydrates (NSC), and cellulose predicted from Nano and Hyspex hyperspectral imagery across five BioDIV plots. Nano imagery (0.02 m spatial resolution) captured fine-scale within-plot heterogeneity, whereas Hyspex imagery (0.25 m spatial resolution) produced smoother spatial patterns while preserving broader plot-level gradients.
The degree of spatial heterogeneity differed among traits. Carotenoids exhibited relatively continuous spatial distributions, while NSC showed highly patchy patterns with strong local variability. In contrast, cellulose displayed comparatively homogeneous distributions within several plots, particularly in Plot 208, where consistently high cellulose values were observed across both Nano and Hyspex maps. Differences among plots were also evident, suggesting substantial variation in canopy composition and functional properties across the BioDIV experiment.
4. Discussion
This study evaluated the feasibility of both airborne and UAV-based imaging spectroscopy for predicting ten foliar functional traits in grasslands. The two platforms achieved comparable accuracies across most traits, demonstrating the potential of both UAV- and airborne-based hyperspectral remote sensing for grassland trait mapping. Most traits were predicted with moderate to high accuracy, whereas carbon and lignin consistently showed lower performance. The VNIR spectral range alone produced accuracies comparable to those obtained using the full VSWIR spectrum, while SWIR wavelengths provided only limited improvements for a few structural traits. In addition, vector normalization generally improved prediction accuracy by reducing the confounding effects of canopy structure and illumination/viewing geometry, whereas NIRv-transformed spectra often resulted in lower predictive performance.
4.1. Comparable Performance of UAV- and Airborne-Based Imaging Spectroscopy in Foliar Trait Prediction
Although the UAV-based sensor only covered the VNIR spectral region, it achieved prediction accuracies comparable to those of the airborne sensor for most foliar traits. NSC, hemi-cellulose, cellulose, β-carotene, carotenoids were most accurately predicted with an R2 higher than 0.70 and an NRMSE lower than 10%. This may be attributed to its much finer spatial resolution (0.02 m), which enabled accurate separation of vegetation and soil pixels and thereby reduced soil background effects in the spectra. In addition, many foliar traits, particularly pigments such as chlorophylls and carotenoids, exhibit major absorption features within the VNIR region [18,32,39], making VNIR wavelengths sufficient for accurate estimation. These results suggest that UAV-based hyperspectral systems can provide reliable foliar trait predictions despite their limited spectral range.
The predictive accuracies obtained using the UAV-based NIR imagery were generally comparable to or even higher than those reported in previous studies with an R2 of 0.43–0.82 and an NRMSE of 8–13% [25,29]. However, very high accuracies were not achieved for several factors. First, grassland canopies are characterized by small and spatially heterogeneous herbaceous vegetation, increasing mixed vegetation–soil signals even after soil correction procedures. Second, foliar traits were predicted at the plot level after upscaling leaf measurements, introducing uncertainty associated with within-plot variability and aggregation from species-level traits to canopy-level observations. Third, some traits, particularly carbon and lignin, exhibit relatively weak or overlapping spectral absorption features and are therefore more difficult to estimate directly from canopy reflectance. Residual uncertainty associated with temporal mismatch between field measurements and hyperspectral imagery may have further contributed to moderate prediction performance.
The limitation in spectral coverage can be partially compensated by higher spatial resolution. Considering the higher cost, weight, and operational constraints of VSWIR sensors on UAV platforms, our findings support the use of VNIR sensors for efficient and accurate estimation of grassland foliar traits [28].
The performance of the airborne Hyspex imagery was comparable to that reported in previous studies with an R2 of 0.42–0.80 and an NRMSE of 7–13% [20,21,32]. Carbon showed relatively low prediction accuracy, likely because of its narrow range of variation. Lignin was also predicted with lower accuracy due to its relatively weak and overlapping spectral absorption features [17], which is consistent with previous studies [20,23]. Despite the inclusion of SWIR wavelengths, the airborne full-spectrum imagery did not substantially improve overall prediction performance. Unlike the Nano imagery, the coarser spatial resolution of the Hyspex imagery (0.25 m) made it more difficult to differentiate vegetation from soil background. Although vegetation cover estimated from Nano imagery was used to minimize soil effects in Hyspex imagery, mixed vegetation–soil pixels likely remained in areas with sparse vegetation cover. These results highlight the trade-off between spatial and spectral resolution when selecting hyperspectral sensors for foliar trait prediction.
4.2. Limited Additional Contribution of SWIR Information to Foliar Trait Estimation
Pigment-related traits, including chlorophylls and carotenoids, were accurately estimated using the VNIR region of the Hyspex imagery, whereas xanthophylls showed comparatively lower prediction accuracy. The green and red-edge spectral regions contributed most strongly to the prediction models, consistent with previous studies highlighting the sensitivity of these wavelengths to leaf pigments and photosynthetic activity [21,32]. For traits such as nitrogen, cellulose, lignin, and NSC, the inclusion of SWIR wavelengths did not substantially improve prediction accuracy relative to VNIR-only models. In the full-spectrum models, SWIR bands generally showed lower variable importance than VNIR wavelengths, while SWIR-only models often produced lower accuracies than VNIR-only models.
Previous studies have emphasized the importance of VSWIR spectra for estimating biochemical and structural foliar traits across proximal, UAV, airborne, and satellite platforms [40,41,42,43]. For example, full-spectrum VSWIR data have been reported to improve the estimation of foliar nitrogen and crude protein in temperate grasslands compared with VNIR- or SWIR-only spectra [42,44]. Similarly, UAV-based studies integrating VNIR and SWIR imagery found improved performance for nitrogen estimation [41]. A recent study comparing three satellite hyperspectral sensors for estimating grassland biomass and species composition highlighted the advantage of SWIR-enabled sensors, including PRISMA and EnMAP, over the VNIR-only DESIS sensor for biomass estimation, while SWIR wavelengths contributed only marginally to species composition mapping [40]. However, our results suggest that, at the plot level, much of the predictive information for the investigated traits was already captured within the VNIR region. This may partly reflect strong covariance among foliar traits, as well as indirect relationships between biochemical properties and canopy structure or productivity, which are strongly expressed in VNIR wavelengths. In addition, residual mixed-pixel effects and the coarser spatial resolution of the airborne imagery may have reduced the potential advantages of SWIR information in this study.
4.3. Effects of Soil Background and Spectral Preprocessing on Foliar Trait Estimation
Grassland foliar trait estimation can be strongly affected by soil background because of the large spectral differences between vegetation and soil pixels. Previous studies have shown that applying NDVI thresholds can help exclude soil-contaminated pixels and thereby improve the retrieval of foliar traits and species diversity [25,30]. In this study, vegetation and soil pixels were accurately classified from the UAV imagery with a spatial resolution of 0.02 m, and the resulting classification maps were subsequently used to estimate vegetation cover in the coarser-resolution Hyspex imagery. This approach effectively reduced soil background effects and contributed to the accurate estimation of foliar traits from both imaging systems.
Brightness normalization has been widely used to minimize the effects of illumination/viewing geometry and canopy structure, enhance biochemical absorption features, and improve plant trait retrieval in forest ecosystems [21,31,32]. Our results further demonstrate its effectiveness for foliar trait estimation in grasslands. In contrast, NIRv-adjusted spectra generally provided limited improvements in prediction accuracy. Previous studies reported that NIRv correction can reduce the influence of canopy structure and soil background, thereby improving leaf nitrogen estimation in oilseed rape using UAV-based multispectral imagery [34], as well as chlorophyll and leaf area index estimation from broadband satellite data such as Sentinel-2 and Landsat [33,45]. In this study, we extended the application of NIRv-adjusted spectra to both UAV- and airborne-based hyperspectral imagery and a broad range of foliar traits in grasslands. However, the improvements were generally limited, possibly because canopy structural effects are less pronounced in grasslands than in more vertically complex ecosystems such as forests. Overall, our results suggest that brightness normalization is a more effective preprocessing approach for grassland foliar trait estimation.
4.4. Limitations and Prospects
Our comparison of UAV- and airborne-based imaging spectroscopy for estimating multiple foliar traits has several limitations.
Firstly, this study was conducted in an experimental grassland, and therefore the conclusions may not be directly transferable to other grassland ecosystems. Future studies should evaluate the generalizability of this approach across a broader range of ecosystems, particularly natural grasslands characterized by greater species diversity and more heterogeneous environmental conditions.
Secondly, the temporal mismatch between leaf-level spectral/trait measurements and airborne hyperspectral imagery represents another source of uncertainty. Although leaf traits were upscaled to the plot level using species mean trait values that were assumed to be relatively stable across years, interannual variation may still influence the comparison and trait prediction accuracy. Future studies should prioritize acquiring field trait measurements and hyperspectral imagery within the same growing season to minimize temporal inconsistencies.
Thirdly, the comparison between UAV- and airborne-based imaging spectroscopy was not fully independent because soil correction for the airborne Hyspex imagery partly relied on vegetation information derived from the higher-resolution Nano imagery. Specifically, vegetation cover estimated from Nano imagery was used to reduce soil background effects in the coarser-resolution airborne observations. Although this strategy helped minimize confounding effects caused by mixed vegetation–soil pixels and enabled a more controlled evaluation of spectral and spatial trade-offs, it may also have introduced partial dependence between the two platforms. Consequently, some improvements in airborne-based trait estimation may reflect the benefit of UAV-assisted soil correction in addition to airborne spectral information alone. Future studies should evaluate platform-independent soil correction approaches, such as independent vegetation classification or spectral unmixing methods, to better isolate the respective contributions of spectral and spatial information to foliar trait prediction. [30,36].
Despite these limitations, our results demonstrate the potential of integrating UAV- and airborne-based imaging spectroscopy for estimating multiple foliar traits and provide insights into the trade-offs among spectral coverage, spatial resolution, and preprocessing strategies. These findings may support the development of more robust and cost-effective approaches for operational grassland trait monitoring and ecosystem assessment [1,16].
5. Conclusions
This study conducted a direct comparison of the predictive performance of airborne and UAV-based imaging spectroscopy for estimating a comprehensive set of foliar functional traits in grasslands. Both airborne and UAV-based hyperspectral imagery achieved moderate to high prediction accuracies for most foliar traits, although carbon and lignin consistently showed lower predictive performance. Despite covering the VNIR spectral region only, the UAV-based sensor performed comparably to the airborne full-spectrum VSWIR sensor, indicating that high spatial resolution can partially compensate for limited spectral coverage by reducing soil background effects. The VNIR spectral range alone provided satisfactory trait estimation accuracies, whereas the inclusion of SWIR wavelengths resulted in only marginal improvements for a subset of structural traits. In addition, brightness normalization effectively improved prediction performance by minimizing the confounding effects of canopy structure and illumination/viewing geometry, while NIRv-adjusted spectra generally provided limited benefits.
The accurate estimation of foliar functional traits from hyperspectral imagery provides important opportunities for improving our understanding of the relationships between plant functional traits, biodiversity, and ecosystem functioning in grasslands. Spatially explicit trait mapping can help reveal plant responses and adaptations to environmental change, including drought, nutrient limitation, and land-use disturbance, and can support more effective grassland conservation and management. Furthermore, our results provide practical guidance for selecting hyperspectral sensors and platforms for grassland monitoring. Considering the trade-offs among spectral resolution, spatial resolution, operational flexibility, and cost, UAV-based VNIR imaging spectroscopy represents an efficient and cost-effective approach for large-scale foliar trait estimation in grassland ecosystems.
Author Contributions
Conceptualization, N.L. and A.K.S.; methodology, N.L., A.K.S. and Z.W.; software, N.L. and X.G.; validation, N.L. and X.G.; formal analysis, N.L. and X.G.; investigation, N.L. and X.G.; resources, A.K.S., Z.W., T.Z., J.C.-B. and P.A.T.; data curation, A.K.S., Z.W., T.Z., J.C.-B. and P.A.T.; writing—original draft preparation, N.L., Z.W. and X.G.; writing—review and editing, N.L., Z.W. and X.G.; visualization, N.L.; supervision, J.C.-B. and P.A.T.; project administration, J.C.-B. and P.A.T.; funding acquisition, N.L. and Z.W. All authors have read and agreed to the published version of the manuscript.
Funding
This research was funded by Guangzhou Key Research and Development Program (2024B03J1266), the Guangdong R&D Infrastructure and Facility Development Program (2024B1212040005), the National Natural Science Foundation of China (42471408), Young Talent Project of GDAS (2025GDASQNRC-0202), and GDAS’ Project of Science and Technology Development (2024GDASZH-2024010102).
Data Availability Statement
Data are available from the corresponding author upon reasonable request.
Acknowledgments
The authors express their gratitude to the three anonymous reviewers for their constructive comments and valuable suggestions, which helped improve the quality and clarity of this manuscript.
Conflicts of Interest
The authors declare no conflict of interest.
References
- Bengtsson, J.; Bullock, J.M.; Egoh, B.; Everson, C.; Everson, T.; O’Connor, T.; O’Farrell, P.J.; Smith, H.G.; Lindborg, R. Grasslands—More Important for Ecosystem Services than You Might Think. Ecosphere 2019, 10, e02582. [Google Scholar] [CrossRef] [Scilit]
- Blair, J.; Nippert, J.; Briggs, J. Grassland Ecology. In Ecology and the Environment; Monson, R.K., Ed.; Springer: New York, NY, USA, 2014; pp. 389–423. [Google Scholar]
- Zhao, Y.; Liu, Z.; Wu, J. Grassland Ecosystem Services: A Systematic Review of Research Advances and Future Directions. Landsc. Ecol. 2020, 35, 793–814. [Google Scholar] [CrossRef] [Scilit]
- Isbell, F.; Craven, D.; Connolly, J.; Loreau, M.; Schmid, B.; Beierkuhnlein, C.; Bezemer, T.M.; Bonin, C.; Bruelheide, H.; De Luca, E.; et al. Biodiversity Increases the Resistance of Ecosystem Productivity to Climate Extremes. Nature 2015, 526, 574–577. [Google Scholar] [CrossRef] [Scilit] [PubMed]
- Arroyo, A.I.; Pueyo, Y.; Gaspar, M.; Cruz-Amo, L.; Anadón, J.D. Climate Change Limits Aboveground Primary Production and Exacerbates Post-Abandonment Woody Encroachment in Mountain Grasslands. Landsc. Ecol. 2025, 40, 153. [Google Scholar] [CrossRef] [Scilit]
- Kattge, J.; Bönisch, G.; Díaz, S.; Lavorel, S.; Prentice, I.C.; Leadley, P.; Tautenhahn, S.; Werner, G.D.A.; Aakala, T.; Abedi, M.; et al. TRY Plant Trait Database–Enhanced Coverage and Open Access. Glob. Change Biol. 2020, 26, 119–188. [Google Scholar] [CrossRef] [Scilit]
- Croft, H.; Chen, J.M. Leaf Pigment Content. In Comprehensive Remote Sensing; Elsevier: Amsterdam, The Netherlands, 2018; pp. 117–142. [Google Scholar]
- Evans, J.R. Nitrogen and Photosynthesis in the Flag Leaf of Wheat (Triticum aestivum L.). Plant Physiol. 1983, 72, 297–302. [Google Scholar] [CrossRef] [Scilit] [PubMed]
- Bruelheide, H.; Dengler, J.; Purschke, O.; Lenoir, J.; Jiménez-Alfaro, B.; Hennekens, S.M.; Botta-Dukát, Z.; Chytrý, M.; Field, R.; Jansen, F.; et al. Global Trait–Environment Relationships of Plant Communities. Nat. Ecol. Evol. 2018, 2, 1906–1917. [Google Scholar] [CrossRef] [Scilit] [PubMed]
- Melillo, J.M.; Aber, J.D.; Muratore, J.F. Nitrogen and Lignin Control of Hardwood Leaf Litter Decomposition Dynamics. Ecology 1982, 63, 621–626. [Google Scholar] [CrossRef] [Scilit]
- Azevedo-Schmidt, L.; Currano, E.D. Leaf Traits Linked to Structure and Palatability Drive Plant–Insect Interactions within Three Forested Ecosystems. Am. J. Bot. 2024, 111, e16263. [Google Scholar] [CrossRef] [Scilit] [PubMed]
- Blumstein, M.; Oseguera, M.; Caso-McHugh, T.; Des Marais, D.L. Nonstructural Carbohydrate Dynamics’ Relationship to Leaf Development under Varying Environments. New Phytol. 2024, 241, 102–113. [Google Scholar] [CrossRef] [Scilit] [PubMed]
- Signori-Müller, C.; Oliveira, R.S.; Barros, F.D.V.; Tavares, J.V.; Gilpin, M.; Diniz, F.C.; Zevallos, M.J.M.; Yupayccana, C.A.S.; Acosta, M.; Bacca, J.; et al. Non-Structural Carbohydrates Mediate Seasonal Water Stress across Amazon Forests. Nat. Commun. 2021, 12, 2310. [Google Scholar] [CrossRef] [Scilit] [PubMed]
- Skidmore, A.K.; Coops, N.C.; Neinavaz, E.; Ali, A.; Schaepman, M.E.; Paganini, M.; Kissling, W.D.; Vihervaara, P.; Darvishzadeh, R.; Feilhauer, H.; et al. Priority List of Biodiversity Metrics to Observe from Space. Nat. Ecol. Evol. 2021, 5, 896–906. [Google Scholar] [CrossRef] [Scilit] [PubMed]
- Jetz, W.; Cavender-Bares, J.; Pavlick, R.; Schimel, D.; Davis, F.W.; Asner, G.P.; Guralnick, R.; Kattge, J.; Latimer, A.M.; Moorcroft, P.; et al. Monitoring Plant Functional Diversity from Space. Nat. Plants 2016, 2, 16024. [Google Scholar] [CrossRef] [Scilit] [PubMed]
- Cavender-Bares, J.; Schneider, F.D.; Santos, M.J.; Armstrong, A.; Carnaval, A.; Dahlin, K.M.; Fatoyinbo, L.; Hurtt, G.C.; Schimel, D.; Townsend, P.A.; et al. Integrating Remote Sensing with Ecology and Evolution to Advance Biodiversity Conservation. Nat. Ecol. Evol. 2022, 6, 506–519. [Google Scholar] [CrossRef] [Scilit] [PubMed]
- Curran, P.J. Remote Sensing of Foliar Chemistry. Remote Sens. Environ. 1989, 30, 271–278. [Google Scholar] [CrossRef] [Scilit]
- Ustin, S.L.; Gamon, J.A. Remote Sensing of Plant Functional Types. New Phytol. 2010, 186, 795–816. [Google Scholar] [CrossRef] [Scilit] [PubMed]
- Ollinger, S.V. Sources of Variability in Canopy Reflectance and the Convergent Properties of Plants. New Phytol. 2011, 189, 375–394. [Google Scholar] [CrossRef] [Scilit] [PubMed]
- Wang, Z.; Townsend, P.A.; Schweiger, A.K.; Couture, J.J.; Singh, A.; Hobbie, S.E.; Cavender-Bares, J. Mapping Foliar Functional Traits and Their Uncertainties across Three Years in a Grassland Experiment. Remote Sens. Environ. 2019, 221, 405–416. [Google Scholar] [CrossRef] [Scilit]
- Wang, Z.; Chlus, A.; Geygan, R.; Ye, Z.; Zheng, T.; Singh, A.; Couture, J.J.; Cavender-Bares, J.; Kruger, E.L.; Townsend, P.A. Foliar Functional Traits from Imaging Spectroscopy across Biomes in Eastern North America. New Phytol. 2020, 228, 494–511. [Google Scholar] [CrossRef] [Scilit] [PubMed]
- Asner, G.P.; Martin, R.E.; Knapp, D.E.; Tupayachi, R.; Anderson, C.B.; Sinca, F.; Vaughn, N.R.; Llactayo, W. Airborne Laser-Guided Imaging Spectroscopy to Map Forest Trait Diversity and Guide Conservation. Science 2017, 355, 385–389. [Google Scholar] [CrossRef] [Scilit] [PubMed]
- Singh, A.; Serbin, S.P.; McNeil, B.E.; Kingdon, C.C.; Townsend, P.A. Imaging Spectroscopy Algorithms for Mapping Canopy Foliar Chemical and Morphological Traits and Their Uncertainties. Ecol. Appl. 2015, 25, 2180–2197. [Google Scholar] [CrossRef] [Scilit] [PubMed]
- Schweiger, A.K.; Cavender-Bares, J.; Townsend, P.A.; Hobbie, S.E.; Madritch, M.D.; Wang, R.; Tilman, D.; Gamon, J.A. Plant Spectral Diversity Integrates Functional and Phylogenetic Components of Biodiversity and Predicts Ecosystem Function. Nat. Ecol. Evol. 2018, 2, 976–982. [Google Scholar] [CrossRef] [Scilit] [PubMed]
- Zhao, Y.; Sun, Y.; Lu, X.; Zhao, X.; Yang, L.; Sun, Z.; Bai, Y. Hyperspectral Retrieval of Leaf Physiological Traits and Their Links to Ecosystem Productivity in Grassland Monocultures. Ecol. Indic. 2021, 122, 107267. [Google Scholar] [CrossRef] [Scilit]
- Guanter, L.; Kaufmann, H.; Segl, K.; Foerster, S.; Rogass, C.; Chabrillat, S.; Kuester, T.; Hollstein, A.; Rossner, G.; Chlebek, C.; et al. The EnMAP Spaceborne Imaging Spectroscopy Mission for Earth Observation. Remote Sens. 2015, 7, 8830–8857. [Google Scholar] [CrossRef] [Scilit]
- Pignatti, S.; Palombo, A.; Pascucci, S.; Romano, F.; Santini, F.; Simoniello, T.; Umberto, A.; Vincenzo, C.; Acito, N.; Diani, M.; et al. The PRISMA Hyperspectral Mission: Science Activities and Opportunities for Agriculture and Land Monitoring. In Proceedings of the 2013 IEEE International Geoscience and Remote Sensing Symposium-IGARSS; IEEE: Melbourne, VIC, Australia, 2013; pp. 4558–4561. [Google Scholar]
- Wang, Z.; Sun, Z.; Liu, N.; Geng, S.; Wen, M.; Zhang, H.; Yang, L. Characterizing Key Foliar Functional Traits of Subtropical Evergreen Forests in South China Using Leaf and UAV-Based Spectroscopy. Comput. Electron. Agric. 2025, 233, 110178. [Google Scholar] [CrossRef] [Scilit]
- Zhang, Y.-W.; Wang, T.; Guo, Y.; Skidmore, A.; Zhang, Z.; Tang, R.; Song, S.; Tang, Z. Estimating Community-Level Plant Functional Traits in a Species-Rich Alpine Meadow Using UAV Image Spectroscopy. Remote Sens. 2022, 14, 3399. [Google Scholar] [CrossRef] [Scilit]
- Xu, C.; Zeng, Y.; Zheng, Z.; Zhao, D.; Liu, W.; Ma, Z.; Wu, B. Assessing the Impact of Soil on Species Diversity Estimation Based on UAV Imaging Spectroscopy in a Natural Alpine Steppe. Remote Sens. 2022, 14, 671. [Google Scholar] [CrossRef] [Scilit]
- Feilhauer, H.; Asner, G.P.; Martin, R.E.; Schmidtlein, S. Brightness-Normalized Partial Least Squares Regression for Hyperspectral Data. J. Quant. Spectrosc. Radiat. Transf. 2010, 111, 1947–1957. [Google Scholar] [CrossRef] [Scilit]
- Asner, G.P.; Martin, R.E.; Anderson, C.B.; Knapp, D.E. Quantifying Forest Canopy Traits: Imaging Spectroscopy versus Field Survey. Remote Sens. Environ. 2015, 158, 15–27. [Google Scholar] [CrossRef] [Scilit]
- Wan, L.; Ryu, Y.; Dechant, B.; Hwang, Y.; Feng, H.; Kang, Y.; Jeong, S.; Lee, J.; Choi, C.; Bae, J. Correcting Confounding Canopy Structure, Biochemistry and Soil Background Effects Improves Leaf Area Index Estimates across Diverse Ecosystems from Sentinel-2 Imagery. Remote Sens. Environ. 2024, 309, 114224. [Google Scholar] [CrossRef] [Scilit]
- Liu, S.; Bai, X.; Zhu, G.; Zhang, Y.; Li, L.; Ren, T.; Lu, J. Remote Estimation of Leaf Nitrogen Concentration in Winter Oilseed Rape across Growth Stages and Seasons by Correcting for the Canopy Structural Effect. Remote Sens. Environ. 2023, 284, 113348. [Google Scholar] [CrossRef] [Scilit]
- Wang, Z.; Chen, J.; Zhang, J.; Tan, X.; Ali Raza, M.; Ma, J.; Zhu, Y.; Yang, F.; Yang, W. Assessing Canopy Nitrogen and Carbon Content in Maize by Canopy Spectral Reflectance and Uninformative Variable Elimination. Crop J. 2022, 10, 1224–1238. [Google Scholar] [CrossRef] [Scilit]
- Gholizadeh, H.; Gamon, J.A.; Zygielbaum, A.I.; Wang, R.; Schweiger, A.K.; Cavender-Bares, J. Remote Sensing of Biodiversity: Soil Correction and Data Dimension Reduction Methods Improve Assessment of α-Diversity (Species Richness) in Prairie Ecosystems. Remote Sens. Environ. 2018, 206, 240–253. [Google Scholar] [CrossRef] [Scilit]
- Reich, P.B.; Tilman, D.; Isbell, F.; Mueller, K.; Hobbie, S.E.; Flynn, D.F.B.; Eisenhauer, N. Impacts of Biodiversity Loss Escalate Through Time as Redundancy Fades. Science 2012, 336, 589–592. [Google Scholar] [CrossRef] [Scilit] [PubMed]
- Tilman, D.; Knops, J.; Wedin, D.; Reich, P.; Ritchie, M.; Siemann, E. The Influence of Functional Diversity and Composition on Ecosystem Processes. Science 1997, 277, 1300–1302. [Google Scholar] [CrossRef] [Scilit]
- Ustin, S.L.; Gitelson, A.A.; Jacquemoud, S.; Schaepman, M.; Asner, G.P.; Gamon, J.A.; Zarco-Tejada, P. Retrieval of Foliar Information about Plant Pigment Systems from High Resolution Spectroscopy. Remote Sens. Environ. 2009, 113, S67–S77. [Google Scholar] [CrossRef] [Scilit]
- Wallis, C.I.B.; Holtgrave, A.-K.; Prati, D.; Förster, M.; Kleinschmit, B. Modeling Grassland Parameters with Hyperspectral Satellite Data: Comparison of Sensors, Acquisition Times and Spectral Transformations. Int. J. Appl. Earth Obs. Geoinf. 2025, 144, 104857. [Google Scholar] [CrossRef] [Scilit]
- Oliveira, R.A.; Näsi, R.; Korhonen, P.; Mustonen, A.; Niemeläinen, O.; Koivumäki, N.; Hakala, T.; Suomalainen, J.; Kaivosoja, J.; Honkavaara, E. High-Precision Estimation of Grass Quality and Quantity Using UAS-Based VNIR and SWIR Hyperspectral Cameras and Machine Learning. Precis. Agric. 2024, 25, 186–220. [Google Scholar] [CrossRef] [Scilit]
- Pullanagari, R.R.; Dehghan-Shoar, M.; Yule, I.J.; Bhatia, N. Field Spectroscopy of Canopy Nitrogen Concentration in Temperate Grasslands Using a Convolutional Neural Network. Remote Sens. Environ. 2021, 257, 112353. [Google Scholar] [CrossRef] [Scilit]
- Camino, C.; González-Dugo, V.; Hernández, P.; Sillero, J.C.; Zarco-Tejada, P.J. Improved Nitrogen Retrievals with Airborne-Derived Fluorescence and Plant Traits Quantified from VNIR-SWIR Hyperspectral Imagery in the Context of Precision Agriculture. Int. J. Appl. Earth Obs. Geoinf. 2018, 70, 105–117. [Google Scholar] [CrossRef] [Scilit]
- Togeiro De Alckmin, G.; Lucieer, A.; Roerink, G.; Rawnsley, R.; Hoving, I.; Kooistra, L. Retrieval of Crude Protein in Perennial Ryegrass Using Spectral Data at the Canopy Level. Remote Sens. 2020, 12, 2958. [Google Scholar] [CrossRef] [Scilit]
- Wan, L.; Ryu, Y.; Dechant, B.; Lee, J.; Zhong, Z.; Feng, H. Improving Retrieval of Leaf Chlorophyll Content from Sentinel-2 and Landsat-7/8 Imagery by Correcting for Canopy Structural Effects. Remote Sens. Environ. 2024, 304, 114048. [Google Scholar] [CrossRef] [Scilit]

Disclaimer/Publisher’s Note: The statements, opinions and data contained in all publications are solely those of the individual author(s) and contributor(s) and not of MDPI and/or the editor(s). MDPI and/or the editor(s) disclaim responsibility for any injury to people or property resulting from any ideas, methods, instructions or products referred to in the content. |
© 2026 by the authors. Licensee MDPI, Basel, Switzerland. This article is an open access article distributed under the terms and conditions of the Creative Commons Attribution (CC BY) license.