


Highlights
What are the main findings?
- The GWR model effectively captured spatial non-stationarity in carbon density, enabling long-term (1990–2024) estimation of aboveground and belowground forest carbon storage in Jiangxi Province, with total carbon storage exhibiting an extremely significant increasing trend and cumulative sequestration of approximately 122 Tg C.
- Climate change was the dominant driver of the temporal changes in carbon storage (contributing ~60% to total carbon storage change, based on pixel-wise residual analysis), while precipitation and solar radiation dominated the spatial differentiation of carbon storage; the influence of anthropogenic factors progressively increased over time, with a stronger regulatory effect on belowground carbon pools than on aboveground carbon pools.
What are the implications of the main findings?
- The distinct spatial patterns of carbon storage, with high values in mountainous areas and low values in basins and plains, provide a scientific basis for delineating forest carbon sink conservation zones and formulating differentiated management strategies in Jiangxi Province.
- The quantitative separation of climate and human activity contributions highlights the need to strengthen forest protection and ecological restoration in plain regions, while implementing adaptive forest management in areas subject to the dual pressures of climate change and urbanisation.
Abstract
Forests, as the largest terrestrial carbon sink, play a critical role in mitigating climate change. Accurately estimating forest vegetation carbon storage and identifying its drivers are essential for evaluating regional carbon sink functions and supporting carbon neutrality policies. However, long-term carbon storage estimation that simultaneously captures spatial non-stationarity and separately quantifies aboveground and belowground carbon pools at the provincial scale remains limited, and the spatial differentiation drivers and the temporal change drivers of carbon storage have rarely been disentangled through pixel-wise attribution. This study aimed to estimate forest vegetation carbon storage in Jiangxi Province, China, from 1990 to 2024, and to separately quantify the drivers of its spatial differentiation and the contributions of climate change and human activities to its temporal changes. A geographically weighted regression (GWR) model was constructed using field measurements and multi-source remote sensing data; the geographical detector and partial correlation analysis were applied for spatial differentiation attribution, and pixel-wise residual analysis was used for temporal change attribution. The results showed that: (1) total carbon storage fluctuated between 553.95 and 839.78 Tg C over the 35-year period and exhibited a significant increasing trend, with a cumulative carbon sequestration of approximately 122 Tg C; (2) the belowground carbon pool increased disproportionately (net gain 79.32 Tg C) compared with the aboveground pool (42.20 Tg C); (3) precipitation and solar radiation were the dominant drivers of the spatial differentiation of carbon storage; and (4) climate change contributed approximately 60% and human activities approximately 43% to the temporal changes in total carbon storage. These findings provide a scientific basis for delineating forest carbon sink conservation zones and formulating differentiated forest management strategies in subtropical China.
1. Introduction
Among global terrestrial ecosystems, forests, as the largest terrestrial carbon sink, play an irreplaceable role in absorbing atmospheric carbon dioxide and mitigating the greenhouse effect. The Food and Agriculture Organization (FAO) [1] reported in 2020 that forests cover approximately 31% of the global land area and constitute the ecosystem in which 80–90% of aboveground plant biomass resides [2]. Forest vegetation (including aboveground and belowground biomass) represents the most dynamic component of the forest carbon pool, and changes in its carbon storage can directly reflect the strength of forest carbon sink functions and the capacity of ecosystems to respond to external environmental changes. Forest vegetation carbon pools are highly responsive to climate change, human activities, and forest management practices, and therefore exhibit pronounced spatiotemporal dynamics [3]. Therefore, accurate estimation of forest vegetation carbon storage and elucidation of its spatiotemporal variation patterns constitute an essential scientific foundation for assessing forest carbon sink functions and supporting the “dual carbon” strategic goals.
In terms of estimation methods, early studies primarily relied on forest resource inventories, biomass conversion factor approaches, and statistical models, as exemplified by the estimation of China’s national forest biomass carbon storage from 1949 to 1998, which integrated multi-period inventory data, biomass expansion factor (BEF) calculations, and biomass volume regression models within a single representative study [4]. Although these methods can provide relatively reliable statistical results, they are constrained by long inventory cycles and insufficient spatial continuity, making it difficult to meet the demands of large-scale, high spatiotemporal resolution dynamic monitoring of carbon storage. With the rapid development of remote sensing technology, the use of optical and radar satellite imagery (such as Landsat and Sentinel data) for forest carbon storage inversion has become the predominant approach. Global syntheses indicate that large-scale forest carbon storage estimation based on multi-source remote sensing combined with machine learning has now improved fitting performance to R2 > 0.6, although saturation effects remain a challenge in tropical and high-density forests [5]. With respect to remote sensing inversion modelling, existing studies have mainly adopted three categories of methods: parametric models, such as multiple linear regression and biomass–environment statistical models, which offer high computational efficiency but have difficulty in characterising complex relationships among variables; non-parametric models, such as random forest, XGBoost, and other machine learning algorithms [6], which can effectively handle nonlinear relationships and high-dimensional variable interactions but suffer from insufficient interpretability and the risk of overfitting; and spatial models, such as geographically weighted regression (GWR) [7], which incorporate a spatial weight matrix to capture the spatial non-stationarity in the relationship between carbon density and environmental variables, thereby overcoming the limitation of global models that neglect spatial heterogeneity. However, studies applying the GWR model to long-term inversion of forest vegetation carbon storage at the provincial scale remain relatively limited, particularly lacking separate modelling and systematic evaluation of aboveground and belowground carbon pool components.
Regarding driving factors, spatiotemporal variations in carbon storage are jointly regulated by natural and anthropogenic factors. Among natural factors, hydrothermal conditions are widely recognised as the most important climatic factors influencing vegetation carbon sink functions. Hogan et al. [8] demonstrated that forests in the eastern United States exhibited increased productivity under moderate warming combined with increased precipitation, whereas forests in the western United States showed productivity decline under severe warming and reduced precipitation, highlighting the vulnerability of forest carbon sinks to climatic conditions. Wen et al. [9] confirmed the positive effects of temperature and precipitation on vegetation carbon storage in eastern Chinese forests. Sun et al. [10] further noted that topographic and stand factors such as elevation and forest age are also important factors driving the spatial patterns of forest carbon density. Mekonnen et al. [11], based on CMIP6 model projections, further predicted that climate change will reshape the relative proportions of vegetation carbon and soil carbon at the global scale by the end of the 21st century. The influence of human activities is equally noteworthy. Erb et al. [12] indicated that land use change and forest harvesting are the primary causes of global carbon storage loss, and Li et al. [13] also found that socioeconomic factors such as population density and night-time light intensity, together with natural variables, jointly drive the spatial differentiation of carbon storage. However, existing studies have predominantly focused on analyses from a single perspective of either climatic or anthropogenic factors, and the quantitative separation of their relative contributions remains insufficient. In particular, studies that systematically distinguish the contributions of climate change and human activities at the pixel scale based on partial correlation analysis and residual analysis are still lacking.
The forest coverage rate in Jiangxi Province reaches 63.35%, ranking second nationally [14], making it an ideal region for conducting forest carbon storage research. In recent years, several scholars have carried out a series of studies on forest carbon storage in Jiangxi Province. Li et al. [15] revealed the fluctuating upward trend of forest carbon storage in Jiangxi Province during 2005–2020. Wang et al. [16] estimated the spatial distribution characteristics of provincial forest carbon density using an ensemble learning algorithm. Wu et al. [17] reported, based on forest resource inventory records, a cumulative net increase of approximately 119.63 Tg C in provincial vegetation carbon storage during 1988–2011, with an average annual growth rate of 2.72%. Wang et al. [18] further analysed the Poyang Lake basin and found that, although total carbon storage in the basin experienced a net decrease driven mainly by conversion of cropland and forest to built-up land, ecological restoration through reverse conversion contributed substantially to carbon gain. However, the temporal spans of these studies were relatively limited and thus unable to reflect the latest dynamics of carbon storage in recent years. Moreover, the modelling methods predominantly employed global regression or ensemble learning algorithms without adequately accounting for the spatial non-stationarity of carbon density, and systematic quantitative analysis of driving factors was lacking.
To address the aforementioned limitations, this study focused on forest vegetation in Jiangxi Province, China, and employed field measurement data and multi-source remote sensing data to construct aboveground and belowground forest vegetation carbon storage inversion models using the GWR model. The carbon storage of forest vegetation in Jiangxi Province was estimated for the period 1990–2024, and its spatiotemporal distribution patterns and variation characteristics were systematically analysed. The contributions of climate change and human activities to carbon storage changes were also quantitatively elucidated. The findings of this study can provide a scientific basis for forest carbon sink function assessment, carbon sink conservation zone delineation, and the formulation of differentiated management strategies in Jiangxi Province, and can also serve as a methodological reference for long-term monitoring of forest carbon storage and quantitative analysis of driving factors at the regional scale.
2. Materials and Methods
2.1. Study Area
Jiangxi Province is located in southeastern China, spanning 24°29′–30°04′N and 113°34′–118°28′E, with a total area of approximately 16.69 × 10⁴ km2 (Figure 1). The terrain is dominated by mountains and hills, with an overall topographic gradient sloping from south to north. The average elevation is approximately 245.6 m, and the Poyang Lake Plain is situated in the northern part of the province [14]. The province is bordered by mountains on its eastern, western, and southern sides, with the major mountain ranges including the Wuyi Mountains to the east, the Luoxiao Mountains to the west, and the Dayu Mountains and the Jiulian Mountains to the south, while hills and river valley plains are interspersed across the central area [19]. Jiangxi Province has a subtropical humid monsoon climate, with a mean annual temperature of 16.3–19.5 °C and a mean annual precipitation of 1341–1943 mm, making it one of the most precipitation-abundant provinces in China [14]. The zonal vegetation type is subtropical evergreen broadleaved forest. Forest resources are exceptionally rich, with the forest coverage rate reaching 63.35%, ranking second nationally [14,19].
Figure 1.
Maps of the study area (Jiangxi Province).
2.2. Data Source and Processing
2.2.1. Carbon Density Data
The data used in this study were derived from the 2013 Jiangxi Province forest biomass field measurement dataset, which includes aboveground biomass carbon density (AGBC) and belowground biomass carbon density (BGBC). To improve the spatial coverage of samples and the regional representativeness of the model, sample data corresponding to 2013 from the 2010s China Terrestrial Ecosystem Carbon Density Dataset [20] were supplemented. After integrating the two datasets, a total of 271 samples were obtained for the aboveground component and 249 samples for the belowground component (Figure 2).
Figure 2.
Distribution of field sampling sites for aboveground and belowground forest vegetation biomass.
It should be clarified that the field measurement data used in this study correspond only to the year 2013. No field surveys were conducted in this study for other years between 1990 and 2024. The 2013 field measurement data were used solely as ground-truth samples to construct and validate the GWR-based carbon storage inversion model (Section 2.3.2). The model was subsequently applied to annual Landsat imagery and corresponding remote sensing variables to retrieve aboveground and belowground carbon storage for each year during the full study period (1990–2024). All carbon storage estimates for years other than 2013 are therefore model-derived rather than directly measured.
2.2.2. Remote Sensing Variable Data
Remote-sensing-based forest biomass estimation requires predictor variables that can characterise canopy spectral responses, vegetation structure, and terrain conditions. Spectral bands, vegetation indices, transformed images, texture measures, and topographic variables have been widely used in forest aboveground biomass estimation [21,22]. In subtropical forest regions, the selection of suitable spectral, texture, and ancillary topographic variables is critical for improving AGB modelling performance [22]. Texture measures can further characterise spatial variation in forest structure and improve biomass prediction compared with models based only on physical and spectral variables [23]. Accordingly, 85 variables were selected in this study, including topographic factors, single-band spectral factors, tasselled cap transformation factors, vegetation indices, and texture features (Table A1). The tasselled cap transformation factors were calculated using sensor-specific coefficients for Landsat 8 OLI [24] and Landsat 5 TM [25]. Remote sensing variables were derived from Landsat 5–8 imagery (spatial resolution of 30 m) on the Google Earth Engine (GEE) platform (Google LLC, Mountain View, CA, USA) [26]. Cloud-contaminated pixels were removed, and cloud-free composite images were generated for the extraction of remote sensing variables. Specifically, remote sensing variables corresponding to the year of field measurement data (2013) were extracted for the construction of the carbon storage inversion model. After model construction, the same preprocessing, cloud-masking, cloud-free compositing, and variable extraction workflow was consistently applied to the annual Landsat image collections from 1990 to 2024 for the long-term inversion estimation of forest vegetation carbon storage in Jiangxi Province.
2.2.3. Driving Factor Data
Regional carbon storage is influenced by multiple natural and anthropogenic factors. Climatic conditions can affect vegetation carbon uptake by regulating photosynthetic activity and gross primary productivity [27]. Topographic gradients, particularly elevation, further influence forest carbon storage and carbon density by modifying vegetation and soil conditions [28]. In addition, land use/cover change and socioeconomic activities can reshape regional carbon storage patterns by altering vegetation structure and soil carbon pools [13]. Spatially explicit forest carbon density modelling also highlights the importance of considering spatial heterogeneity when analysing regional carbon storage patterns [7]. Therefore, the driving factors selected in this study included climatic factors, topographic factors, vegetation-related factors, and anthropogenic factors.
The driving factors considered in this study were classified into four major categories: natural factors, climatic factors, topographic features, and anthropogenic factors. The data sources are presented in Table 1.
Table 1.
Summary table of driving factors.
2.3. Methods
2.3.1. Remote Sensing Variable Selection
In this study, stepwise regression analysis (SRA), performed in R (version 4.4.2; R Foundation for Statistical Computing, Vienna, Austria), was employed to screen the 85 candidate remote sensing variables following the standard stepwise variable selection procedure. On this basis, Pearson correlation analysis was used to eliminate variables with an absolute correlation coefficient with the dependent variable below 0.1, and collinearity diagnostics were performed using the variance inflation factor (VIF), with variables exhibiting multicollinearity removed based on a threshold of VIF < 10. Ultimately, only variables with significant explanatory power for carbon storage and mutual independence were retained for model construction. This VIF threshold is consistent with those adopted in comparable remote sensing inversion studies [38] and can effectively control redundant information among variables.
2.3.2. Construction and Evaluation of Carbon Storage Inversion Models
Forest carbon density in Jiangxi Province exhibits significant spatial differentiation characteristics under the influence of topographic, climatic, and other factors, which traditional global regression models have difficulty in effectively characterising due to spatial non-stationarity. Therefore, this study employed the GWR model, implemented in ArcGIS Pro (version 3.1.6; Esri, Redlands, CA, USA), to separately construct inversion models for aboveground and belowground forest vegetation carbon density. As a local parameter estimation method, the GWR model introduces a spatial weight matrix to describe the spatial non-stationarity of variable relationships and can estimate location-specific regression parameters [39]. This model can adequately capture the local spatial variation patterns of carbon density and is thus suitable for the long-term inversion of the spatiotemporal distribution of forest vegetation carbon storage in Jiangxi Province from 1990 to 2024.
In terms of model parameter optimisation, this study adopted a grid search strategy to systematically optimise three neighbourhood parameters: the minimum number of neighbours, the neighbour increment, and the number of increments. The optimal parameter combination was determined based on the criteria of maximum R2, minimum RMSE, and minimum MAE (Table A2). Compared with a single AIC or CV criterion, this strategy enables searching across a larger parameter space, facilitating the identification of local regression parameters better suited to the data characteristics of this study. Under the optimal parameter settings, each local regression window contained at least 30 valid samples, satisfying the statistical requirements for local parameter estimation.
Model accuracy was evaluated using three metrics: R2, RMSE, and MAE. Specifically, R2 reflects the model’s ability to explain the spatial variability of carbon density, with values closer to 1 indicating better fitting performance. RMSE is more sensitive to large errors and can reflect the overall deviation between predicted and measured values. MAE characterises the mean absolute magnitude of prediction errors and is less sensitive to outliers. The combined use of these three metrics enables a comprehensive assessment of model estimation accuracy and stability from different perspectives. Following the common practice in comparable studies [38], the accuracy evaluation in this study was based on the comparison between fitted values and measured values using the full sample set. This is because the fitting process of the GWR model itself possesses certain local cross-validation properties through the spatial weight matrix, and the limited sample size may result in insufficient valid samples within local windows after partitioning into training and test sets, thereby compromising the stability of spatial estimation.
2.3.3. Spatiotemporal Variation Analysis of Carbon Storage
In this study, Theil–Sen median trend analysis combined with the Mann–Kendall test was employed to analyse the temporal variation trends of forest carbon storage in Jiangxi Province from 1990 to 2024. This method does not require specific distributional assumptions for the data series, permits the presence of missing values, and exhibits strong robustness against extreme outliers [40]. Specifically, the Theil–Sen median was used to estimate the rate of change in the time series, while the Mann–Kendall non-parametric test was used to determine the statistical significance of trend variations [41]. The combination of these two methods enables robust and effective identification of variation patterns in long-term time series data.
Regarding spatial pattern analysis, Moran’s I and the Local Indicator of Spatial Association (LISA) were employed to characterise the global and local spatial autocorrelation of forest carbon storage, respectively. A Moran’s I value greater than 0 indicates positive spatial autocorrelation with a clustered distribution, a value less than 0 indicates negative spatial autocorrelation with a dispersed distribution, and a value equal to 0 indicates a random distribution. For areas passing the significance test, LISA clustering was classified into four spatial association patterns, namely high–high, low–low, high–low, and low–high, corresponding to local clustering or spatial outlier characteristics [42,43].
2.3.4. Analysis of Driving Mechanisms for Carbon Storage Changes
This study integrated geographical detector, partial correlation analysis, and multiple linear regression residual analysis to quantitatively disentangle the driving mechanisms of forest carbon storage changes from multiple perspectives.
The geographical detector is a set of statistical methods designed to detect spatial differentiation and reveal its underlying driving forces [44]. In this study, the factor detector and interaction detector were employed using Geodetector (Excel-based tool; Institute of Geographic Sciences and Natural Resources Research, Chinese Academy of Sciences, Beijing, China) to examine the extent to which individual driving factors explain the spatial differentiation of carbon density, as well as the effects of pairwise interactions on the dependent variable. The geographical detector analysis was conducted for three representative years, 2000, 2010, and 2020, to examine the temporal changes in the explanatory power of each driving factor. Since the geographical detector requires categorical independent variables, all continuous driving factors were discretised using the K-means clustering algorithm [45] in IBM SPSS Statistics (version 26.0; IBM Corp., Armonk, NY, USA), with the optimal number of clusters determined by maximising the q-value. The final number of categories for each factor is provided in Table A6.
Partial correlation analysis can eliminate the interference of other confounding factors and independently quantify the correlation between two variables [46,47], and has become a commonly used method for investigating the association between carbon storage and climatic factors [48,49]. In this study, pixel-level partial correlation coefficients were calculated between forest carbon storage of each component and annual mean temperature, precipitation, and potential evapotranspiration. For each pairwise partial correlation, the remaining two climatic factors were treated as control variables (e.g., when computing the partial correlation between carbon density and PRE, TEM and PET were controlled for).
Multiple regression residual analysis was used to quantitatively separate the contributions of climate change (CC) and human activities (HA) to temporal changes in forest carbon storage [50,51]. The analysis was performed on a pixel-by-pixel basis using annual time series data (1990–2024, n = 35 per pixel): an independent multiple linear regression was fitted for each pixel using its own 35-year time series. For each carbon pool, the two climatic factors with the largest absolute mean partial correlation coefficients identified from the preceding partial correlation analysis were selected as predictors. These were PRE and TEM for aboveground carbon, TEM and PRE for belowground carbon, and PRE and PET for total carbon. The pixel-wise regression model is:
where is the climate-driven predicted carbon density at pixel i in year t; X1 and X2 are the two selected climatic factors; and ,, are the pixel-specific regression coefficients estimated independently for each pixel by ordinary least squares. The regression is linear and does not include interaction terms, consistent with the standard residual attribution framework, in which a parsimonious specification ensures that the residuals can be unambiguously interpreted as the climate-independent component. The residual, attributed to human activities, was computed as:
Because only climatic factors enter the regression, captures the variation explainable by climate, whereas the residual represents the variation that cannot be explained by climate and is conventionally attributed to the integrated effect of human activities (e.g., afforestation, deforestation, ecological restoration, land use change) [52,53]. Theil–Sen slopes were then computed for ,, and at each pixel and used to classify each pixel into one of six driving factor categories and to calculate the corresponding relative contribution rates of CC and HA (Table 2).
Table 2.
The criteria for identifying the driving factors of forest carbon storage change and calculating the relative contribution rates.
3. Results
3.1. Variable Selection and Model Construction
Following screening by stepwise regression, the optimal variable combinations were determined based on the criteria of VIF < 10 and maximum R2. The aboveground carbon density model ultimately retained six variables (Altitude, SR_B2_Max, SR_B3_Mean, GARI_Mean, SR_B6_var, and SR_B6_diss), and the belowground carbon density model retained seven variables (Aspect, SR_B3_Mean, SR_B4_Max, GARI_Mean, SR_B7_diss, SR_B6_contrast, and SR_B4_var), with none of the variables exhibiting multicollinearity (Table A3 and Table A4).
Based on the screened variables, the optimal GWR model parameters were determined through gradient optimisation (Table A2). As shown in Figure 3, the R2 values of the aboveground and belowground carbon density models were 0.67 and 0.72, respectively, indicating good overall fitting performance. Further analysis of the estimation results from the optimal models (Table 3) revealed that the coefficients of variation for both components fell within the moderate variability range, and the vast majority of standardised residuals lay between −2 and 2, with a low proportion of outliers, demonstrating that the models possess good reliability and accuracy.
Figure 3.
The fitting results of the optimal GWR-based inversion models for forest vegetation carbon density. (a) Aboveground biomass carbon density model (R2 = 0.67); (b) belowground biomass carbon density model (R2 = 0.72). Each scatter point represents a field-measured sample (n = 271 for aboveground, n = 249 for belowground). The solid line represents the 1:1 reference line indicating perfect agreement between the observed and predicted values. The lighter and wider shaded band denotes the 95% prediction interval, while the darker and narrower shaded band denotes the 95% confidence interval.
Table 3.
Descriptive statistics of aboveground and belowground forest vegetation carbon density estimated by the optimal models.
3.2. Spatiotemporal Distribution Characteristics of Forest Carbon Storage
The GWR model was used to estimate aboveground and belowground carbon storage in Jiangxi Province from 1990 to 2024 (Table A5). The results indicated that each carbon pool exhibited distinct characteristics in terms of temporal variation, spatial distribution, and spatiotemporal variation trends.
In terms of temporal variation, aboveground carbon storage ranged from 392.21 to 593.29 Tg C, with carbon density ranging from 34.60 to 56.09 t C/ha, accounting for approximately 61–76% of total carbon storage. The overall trend showed a non-significant increase (p > 0.05) and can be divided into three phases (Figure 4 and Figure 5): the period from 1990 to 2003 was a phase of fluctuating growth (slope = +11.39 Tg C/yr, R2 = 0.57, p < 0.01), with the peak reaching 593.29 Tg C in 2003; the period from 2003 to 2020 was a phase of fluctuating decline (slope = −5.02 Tg C/yr, R2 = 0.33, p < 0.01), with the trough falling to 423.35 Tg C in 2017; and after 2020, a recovery was observed, though the trend was not yet significant (p > 0.05). Belowground carbon storage ranged from 161.74 to 324.16 Tg C, with carbon density ranging from 14.27 to 28.6 t C/ha, accounting for approximately 24–39% of total carbon storage. The overall trend exhibited a highly significant increase (p < 0.01) and can similarly be divided into three phases: the period from 1990 to 2002 was a phase of low-level fluctuation; the period from 2002 to 2016 was a phase of stepwise increase (slope = +4.66 Tg C/yr, R2 = 0.43, p < 0.01), rising from 162.93 to 288.91 Tg C; and the period from 2016 to 2024 was a phase of rapid ascent, reaching a historical maximum of 324.16 Tg C in 2023 (Figure 4 and Figure 5). Total carbon storage ranged from 553.95 to 839.78 Tg C, with carbon density ranging from 48.87 to 77.35 t C/ha, and exhibited a highly significant increasing trend overall (p < 0.01), undergoing three phases: fluctuating growth (1990–2004, peak of 816.69 Tg C), fluctuating decline (2004–2011, trough of 638.27 Tg C), and gradual increase (2011–2024, slope = +7.93 Tg C/yr, R2 = 0.31, p < 0.05), reaching a historical maximum of 839.78 Tg C in 2023, with a cumulative carbon sequestration of 121.52 Tg C over the 35-year period (Figure 4 and Figure 5). Furthermore, the proportions of aboveground and belowground carbon storage relative to total carbon storage remained relatively stable throughout the study period (Figure 6), indicating that the contribution ratios of each carbon pool to total carbon storage were essentially unchanged.
Figure 4.
Trends in forest vegetation carbon storage in Jiangxi Province from 1990 to 2024. (a) Aboveground biomass carbon storage; (b) belowground biomass carbon storage; (c) total carbon storage. Each data point represents the annual provincial-scale carbon storage aggregated from pixel-wise estimates. The solid line denotes the fitted trend, and the shaded band represents the 95% confidence interval of the fit. The significance level (p-value) of the overall linear trend is indicated within each panel.
Figure 5.
Piecewise linear regression analysis of forest vegetation carbon storage in Jiangxi Province from 1990 to 2024. (a–c) Three temporal phases of aboveground biomass carbon storage; (d–f) three temporal phases of belowground biomass carbon storage; (g–i) three temporal phases of total carbon storage. In each panel, the solid line denotes the fitted linear regression and the shaded band represents the 95% confidence interval of the regression. For each phase, the slope, coefficient of determination (R2), and significance level (p-value) are shown.
Figure 6.
The annual proportions of aboveground and belowground biomass carbon storage relative to total forest vegetation carbon storage in Jiangxi Province from 1990 to 2024. The proportions were calculated from the provincial-scale annual carbon storage values (aggregated from pixel-wise estimates), and therefore represent province-level summary ratios without spatial variability information.
Regarding spatial distribution, aboveground carbon storage exhibited a spatial pattern characterised by high values in the northeast and southwest and low values in the eastern and northwestern areas, with a maximum of 132.36 t C/ha. Belowground carbon storage displayed a spatial pattern of high values in the northern and central areas and low values in the western and eastern areas, with a maximum of 37.87 t C/ha. Total forest carbon storage presented a ring-shaped distribution with high values on the eastern, southern, and northern sides and low values in the central area, with a maximum of 162.61 t C/ha (Figure 7, Figure 8 and Figure 9). The results of Moran’s I and LISA cluster analysis showed that over the 35-year period, forest AGBC, BGBC, and total carbon storage (TC) all exhibited significant spatial autocorrelation (AGBC: Moran’s I = 0.61, p = 0; BGBC: Moran’s I = 0.45, p = 0; TC: Moran’s I = 0.59, p = 0), predominantly displaying spatial clustering patterns of high–high (HH) and low–low (LL) aggregation. The HH clusters of AGBC and TC showed an overall similar distribution, mainly concentrated in the Luoxiao Mountains, Jiuhua Mountains, and Baiji Mountains. The HH clusters of BGBC were concentrated in the Dayu Mountains, Tianhu Mountains, Jiuhua Mountains, Baiji Mountains, and areas north of Lushan. The LL clusters of both AGBC and TC were concentrated north of Wugong Mountains and east of the Yushan Mountains. The LL clusters of BGBC were distributed across the Ji-Tai Basin, areas east of the Jiulian Mountains, north of the Wugong Mountains, and east of the Tianhu Mountains.
Figure 7.
The spatial distribution of aboveground biomass carbon storage of forest vegetation in Jiangxi Province from 1990 to 2024. (a–d) The spatial distribution of aboveground biomass carbon storage in 1990, 2000, 2010, and 2024, respectively; (e) the spatial distribution of the multi-year average aboveground biomass carbon storage during 1990–2024; (f) a LISA cluster map of aboveground biomass carbon storage. Blank areas within the provincial boundary represent non-forest land cover (e.g., cropland, water bodies, built-up areas) and are excluded from the analysis.
Figure 8.
The spatial distribution of belowground biomass carbon storage of forest vegetation in Jiangxi Province from 1990 to 2024. (a–d) The spatial distribution of belowground biomass carbon storage in 1990, 2000, 2010, and 2024, respectively; (e) the spatial distribution of the multi-year average belowground biomass carbon storage during 1990–2024; (f) a LISA cluster map of belowground biomass carbon storage. Blank areas within the provincial boundary represent non-forest land cover (e.g., cropland, water bodies, built-up areas) and are excluded from the analysis.
Figure 9.
The spatial distribution of total carbon storage of forest vegetation in Jiangxi Province from 1990 to 2024. (a–d) The spatial distribution of total carbon storage in 1990, 2000, 2010, and 2024, respectively; (e) the spatial distribution of the multi-year average total carbon storage during 1990–2024; (f) a LISA cluster map of total carbon storage. Blank areas within the provincial boundary represent non-forest land cover (e.g., cropland, water bodies, built-up areas) and are excluded from the analysis.
Regarding spatiotemporal variation trends, areas with increasing aboveground carbon storage accounted for 68.55% (dominated by extremely significant increases at 20.49% and non-significant increases at 35.07%), while areas with decreasing values accounted for 31.45% (dominated by non-significant decreases at 26.72%). Belowground carbon storage showed a higher proportion of increasing areas, reaching 85.81% (with extremely significant increases at 38.26% and non-significant increases at 28.00%), while decreasing areas accounted for only 14.19%. Areas with increasing total carbon storage accounted for 80.90% (dominated by extremely significant increases at 32.85% and non-significant increases at 32.36%), while decreasing areas accounted for only 19.10% (Figure 10 and Figure 11). Areas of increase were concentrated in high-elevation mountainous regions including the Wuyi Mountains, Yushan Mountains, Dayu Mountains, Tianhu Mountains, and Huaiyu Mountains, whereas areas of decrease were mainly concentrated in the Ji-Tai Basin and the northwestern areas of Lushan.
Figure 10.
Variation trends in aboveground and belowground biomass carbon storage of forest vegetation in Jiangxi Province from 1990 to 2024. (a) The variation trend in aboveground biomass carbon storage; (b) the variation trend in belowground biomass carbon storage. The trend categories are based on the combined Theil–Sen slope and Mann–Kendall test results, classified into nine levels (from “Extremely significant decrease” to “Extremely significant increase”); the colours in the map correspond to those in the legend. The pie chart in the upper-left corner of each panel summarises the area proportion of each trend category. In panel (b), one category occupies an extremely small proportion of the total area and is therefore not visible in the pie chart. Blank areas within the provincial boundary represent non-forest land cover (e.g., cropland, water bodies, built-up areas) and are excluded from the analysis.
Figure 11.
The variation trend in total carbon storage of forest vegetation in Jiangxi Province from 1990 to 2024. The trend categories are based on the combined Theil–Sen slope and Mann–Kendall test results, classified into nine levels (from “Extremely significant decrease” to “Extremely significant increase”); the colours in the map correspond to those in the legend. The pie chart in the upper-left corner of each panel summarises the area proportion of each trend category. Blank areas within the provincial boundary represent non-forest land cover (e.g., cropland, water bodies, built-up areas) and are excluded from the analysis.
3.3. Analysis of Driving Factors for Forest Carbon Storage Changes
3.3.1. Drivers of Spatial Differentiation in Carbon Storage
The following analyses, based on the geographical detector and pixel-wise partial correlation, address the spatial differentiation of carbon storage. These methods explain why carbon density varies across different regions of Jiangxi, rather than how it changes over time.
Regarding single-factor and interaction detection using the geographical detector, PRE and SRAD exhibited the highest explanatory power for both aboveground and belowground carbon storage. For aboveground carbon storage, the q values of PRE, SIF, and SRAD were 0.150, 0.134, and 0.108, respectively; for belowground carbon storage, the q values of PRE, SRAD, and FVC were 0.163, 0.156, and 0.102, respectively (Figure 12). Notably, the influences of TEM, NTL, FVC, POP, and GDP on aboveground carbon storage showed a progressively increasing trend over time, and the influence of POP on belowground carbon storage similarly increased year by year, reflecting the increasingly significant role of anthropogenic factors. The dual-factor interaction detection revealed that the q values of any pairwise factor interaction were greater than those of the corresponding single factors. For aboveground carbon storage, the interaction effect of SRAD ∩ PRE (the symbol “∩” denotes pairwise interaction between two driving factors as defined in the geographical detector framework) was the largest (mean q = 0.54), followed by SRAD ∩ SIF (mean q = 0.47). For belowground carbon storage, the interaction effect of SRAD ∩ GDP was the largest (mean q = 0.47), followed by SRAD ∩ PRE (mean q = 0.46), indicating that the spatial differentiation of forest carbon storage is the result of synergistic effects among multiple factors (Figure 13).
Figure 12.
Single-factor detection results of spatial differentiation of forest biomass carbon storage. (a) Driving factors of aboveground biomass carbon storage; (b) driving factors of belowground biomass carbon storage. Driving factor abbreviations: POP = population density; NTL = night-time light; GDP = gross domestic product; DEM = digital elevation model; SLOPE = slope; TEM = temperature; PRE = precipitation; PET = potential evapotranspiration; SRAD = solar radiation; SIF = solar-induced chlorophyll fluorescence; FVC = fractional vegetation cover.
Figure 13.
The dual-factor interaction detection results for aboveground and belowground forest biomass carbon storage. (a) Aboveground biomass carbon storage; (b) belowground biomass carbon storage. For the abbreviations of driving factors, please refer to Figure 12.
Regarding the partial correlation analysis of climatic factors, PRE exhibited the most significant influence on aboveground carbon storage, with positively correlated areas accounting for 33% and a mean correlation coefficient of 0.52, mainly distributed in southern and northeastern Jiangxi. TEM and PET also showed positive correlations, with mean correlation coefficients of 0.42 and 0.41, respectively, and positively correlated areas accounting for 74% and 73%, respectively (Figure 14). Belowground carbon storage was most significantly influenced by TEM and PRE, both with a mean correlation coefficient of 0.39. Positively correlated areas for TEM accounted for 64%, concentrated in the central and northeastern regions, while positively correlated areas for PRE accounted for 47%, displaying a spatial differentiation pattern of higher values in the north and lower values in the south. PET also showed a positive correlation with belowground carbon storage, with positively correlated areas accounting for 65% and a mean correlation coefficient of 0.38 (Figure 15). Total carbon storage was most prominently influenced by PRE, with a mean correlation coefficient of 0.60 and positively correlated areas accounting for 34%. TEM had the most extensive positively correlated areas, accounting for 75%, with a mean correlation coefficient of 0.42. PET, in contrast, exhibited a negative correlation with total carbon storage, with negatively correlated areas accounting for 26% and a mean correlation coefficient of −0.56, concentrated in the western and northeastern regions (Figure 16).
Figure 14.
Spatial distribution of partial correlation coefficients between climatic factors and aboveground forest biomass carbon storage.
Figure 15.
Spatial distribution of partial correlation coefficients between climatic factors and belowground forest biomass carbon storage.
Figure 16.
Spatial distribution of partial correlation coefficients between climatic factors and total forest carbon storage.
3.3.2. Attribution of Temporal Changes in Carbon Storage
The following analyses, based on the pixel-wise multiple regression residual method (Section 2.3.4), quantify the relative contributions of climate change and human activities to the temporal changes in carbon storage during 1990–2024.
Regarding the relative contributions of climate change and human activities, all three carbon pools were dominated by increasing trends. For aboveground carbon storage, growth-type drivers collectively accounted for 68.95%, among which the joint driving of climate change and human activities accounted for 49.98%, widely distributed across eastern Jiangxi and the hilly areas of central Jiangxi. Among areas of decrease, reduction caused solely by climate change had the highest proportion (16.13%), concentrated in the northwestern river valley zones and the low mountain–hill areas in the south, while reduction caused solely by human activities accounted for 9.82%, mainly distributed in the Ji-Tai Basin and northern Jiangxi. The mean contribution rate of climate change was 67.34%, and that of human activities was 35.77%, with areas where the contribution rate exceeded 50% accounting for 80.56% and 19.80%, respectively. Spatially, the contribution rate of climate change exhibited a pattern of higher values in the south and lower values in the north, with high-value areas (>80%) concentrated in ecologically sensitive areas such as the Wuyi Mountains in southern Jiangxi, whereas human activities displayed a pattern of higher values in the north and lower values in the south, with high-value areas mainly distributed in population-dense areas of northern and central Jiangxi (Figure 17).
Figure 17.
Spatial distribution of driving factors for aboveground biomass carbon storage from 1990 to 2024 (a); spatial distribution of contribution rates of climate change (b) and human activities (c) to aboveground biomass carbon storage changes.
Belowground carbon storage exhibited a more prominent increasing trend, with growth-type drivers collectively accounting for 91.16%. The joint driving of climate change and human activities accounted for 72.86%, considerably higher than the corresponding proportion for aboveground carbon storage. Areas of decrease accounted for only 8.84% in total, with small proportions across all categories. The mean contribution rate of climate change was 57.62%, and that of human activities was 45.98%, markedly higher than for aboveground carbon storage, with areas where the contribution rate exceeded 50% accounting for 67.12% and 38.97%, respectively. High-contribution areas of climate change were concentrated in ecologically sensitive areas such as the Tianhu Mountains, Baiji Mountains, and Huaiyu Mountains, while high-contribution areas of human activities were mainly distributed in population-dense areas of southwestern and northwestern Jiangxi (Figure 18).
Figure 18.
Spatial distribution of driving factors for belowground biomass carbon storage from 1990 to 2024 (a); spatial distribution of contribution rates of climate change (b) and human activities (c) to belowground biomass carbon storage changes.
For total carbon storage, growth-type drivers collectively accounted for 82.07%, dominated by the joint driving of climate change and human activities (67.71%). Among areas of decrease, climate change alone accounted for 7.24%, human activities alone accounted for 5.79%, and the joint effect of both accounted for 4.89%, sporadically distributed in central Jiangxi and the northeastern corner. The mean contribution rate of climate change was 60.01%, and that of human activities was 42.72%, with areas where the contribution rate exceeded 50% accounting for 75.14% and 28.13%, respectively. Spatially, the contribution rate of climate change exhibited a pattern of high values in the peripheral areas and low values in the central area, with high-value areas concentrated in the Wuyi Mountains, Dayu Mountains, and other regions, whereas human activities displayed a pattern of high values in the central area and low values in the periphery, with high-value areas mainly concentrated in the Nanchang metropolitan area in northern Jiangxi and population-dense areas of central Jiangxi (Figure 19).
Figure 19.
Spatial distribution of driving factors for total carbon storage from 1990 to 2024 (a); spatial distribution of contribution rates of climate change (b) and human activities (c) to total carbon storage changes.
Across all three carbon pools, climate change consistently served as the dominant driving factor. However, its contribution rate exhibited a declining trend from aboveground (67.34%) to belowground (57.62%), while the contribution rate of human activities progressively increased from aboveground (35.77%) to belowground (45.98%), indicating that human activities exert a more prominent regulatory effect on belowground carbon pools than on aboveground carbon pools.
4. Discussion
4.1. Comparison of Forest Carbon Storage Estimates Across Different Studies
The mean aboveground carbon density of forest vegetation in Jiangxi Province estimated in this study was 45.57 t C/ha, the mean belowground carbon density was 20.83 t C/ha, and the mean total carbon density was 66.37 t C/ha. Compared with existing studies, those employing remote sensing data combined with field survey methods yielded results most similar to those of this study. For example, Sun et al. [54] estimated the aboveground forest carbon density in Jiangxi Province to be 30–90 t C/ha, which largely overlaps with the fluctuation range of 34.60–56.09 t C/ha obtained in this study. The aboveground carbon densities reported by Zhang et al. [55] and Wu et al. [56] were 42.11 t C/ha and 38.30–60.63 t C/ha, respectively, deviating from the mean value of this study by approximately 7.6% and within 16.0%, respectively. Huang et al. [57] estimated a total carbon density of 58.1 t C/ha (aboveground 46.9 t C/ha, belowground 11.2 t C/ha) based on the InVEST model, which was approximately 12.5% lower than the mean total carbon density of this study, possibly attributable to their relatively conservative belowground carbon density parameters. The aforementioned studies are broadly consistent with this study in terms of data sources, carbon pool definitions, and spatial scales, and their results demonstrate good comparability.
Some studies reported higher values than those of this study. For instance, Li et al. [58] estimated the aboveground carbon density of the tree layer at 49.59–80.73 t C/ha in afforested degraded red soil areas of Taihe County, Jiangxi Province, which was approximately 9–77% higher than the mean value of this study. This discrepancy arises from their focus on specific high-quality afforestation sites. Hu et al. [59], using fixed carbon density parameters, estimated aboveground and belowground carbon densities of 109.10 and 34.81 t C/ha, respectively, approximately 139% and 67% higher than the mean values of this study. Zhang et al. [60] estimated carbon density at 63.07–76.31 t C/ha for evergreen broadleaved forest alone, approximately 0–15% higher. These overestimations were primarily caused by the restriction of their study scope to specific forest types or the use of fixed parameters without regional calibration.
Conversely, some studies reported notably lower estimates. Zhang et al. [61] estimated forest carbon density in Jiangxi at 21.2–31.9 t C/ha during 1984–2013 using the biomass expansion factor method based on multi-period inventory data, which is approximately 52–68% lower than the mean value of this study. This discrepancy is mainly attributable to the limited timeliness of early inventory data, conservative expansion factors, and the insufficient inclusion of belowground carbon pools. Ning et al. [62] measured forest carbon density at 58.4 t C/ha in the red soil hilly region, approximately 12% lower, with a relatively small deviation and partial spatial overlap with this study, providing a certain reference value.
Overall, discrepancies in estimation results among different studies are common in forest carbon research, fundamentally arising from differences in sample data sources, biomass conversion models, carbon pool component definitions, and spatial extrapolation methods. The GWR model employed in this study (model fitting results shown in Figure 3) can effectively capture the spatial non-stationarity of carbon density, and the integration of multi-dimensional remote sensing variables including topographic, spectral, vegetation index, and texture features enhanced the spatial estimation accuracy. However, signal saturation issues persist in areas with high canopy closure or complex terrain, potentially leading to underestimation in high carbon density regions.
4.2. Spatiotemporal Variation Characteristics of Carbon Storage
From 1990 to 2024, the total carbon storage of forest vegetation in Jiangxi Province exhibited an overall fluctuating upward trend, with both aboveground and belowground carbon storage showing varying degrees of increase (Figure 4 and Figure 5), reflecting the dynamic response under the combined effects of ecological restoration policies and natural disturbances.
Regarding temporal variation (Figure 4 and Figure 5), the fluctuating growth of aboveground carbon storage during 1990–2003 was closely associated with the implementation of ecological projects such as the Grain-for-Green Programme and the Natural Forest Protection Programme. Liu et al. [63] demonstrated that these policies significantly increased vegetation coverage and carbon sequestration capacity, which is highly consistent with the increasing trend observed in the first phase of this study. The sustained decline in aboveground carbon storage during 2003–2020, with persistent low-level oscillation and a trough reaching 423.35 Tg C in 2017 (a 28.6% decrease from the 2003 peak), was the result of multiple superimposed natural disturbance events, including the extreme ice and snow disaster of 2008, severe droughts in 2007 and 2011, and the continuous expansion of pest and disease outbreaks against a background of climatic warming and drying [64,65]. After 2020, carbon storage recovered with post-disaster forest regeneration, but the time span was relatively short and the trend was not yet significant. For belowground carbon storage, the low-level fluctuation during 1990–2002 may be attributable to insufficient root biomass accumulation in the early stages of large-scale afforestation [66], although direct root biomass measurements for this period are not available in our study to verify this hypothesis. The period from 2002 to 2016 represented the most prominent phase of stepwise increase. Yang et al. [67] indicated that the rapid expansion of root biomass within several years following afforestation can significantly enhance belowground carbon storage, which is consistent with the pattern observed during this phase in the present study. Belowground carbon storage reached a historical maximum of 324.16 Tg C in 2023, corroborating the cumulative effects of long-term ecological restoration. Notably, the net increase in belowground carbon storage (79.32 Tg C) was significantly higher than that of aboveground carbon storage (42.20 Tg C). Two complementary mechanisms can explain this disproportionate increase. First, under the functional equilibrium hypothesis [68], trees preferentially allocate net primary productivity to roots when soil resources are more limited than light, which is particularly relevant during early- to mid-stage afforestation on the degraded soils typical of the Grain-for-Green Programme sites in Jiangxi. Second, root-to-shoot biomass ratios systematically decline as forests accumulate aboveground stem biomass through wood deposition [69]; since most plantations in Jiangxi remain in young to mid-developmental stages, the system has not yet entered the phase dominated by aboveground stem accumulation. Together, these allocation mechanisms help explain why ecological restoration in Jiangxi has exerted a more prominent promoting effect on belowground than on aboveground carbon pools. Total carbon storage declined substantially during 2004–2011 due to the superposition of multiple natural disturbances (a decline of 21.8%), and subsequently recovered gradually, reaching a historical maximum of 839.78 Tg C in 2023, with a cumulative carbon sequestration of 121.52 Tg C over 35 years. This demonstrates that the carbon sequestration capacity of forests in Jiangxi Province has been continuously strengthened and that ecological restoration policies have achieved remarkable results. Throughout the 35-year period, the proportional contributions of aboveground and belowground carbon storage to total carbon storage remained relatively stable (Figure 6), indicating that the temporal increase in total carbon storage was driven by simultaneous accumulation in both pools rather than by a structural shift between them.
From the perspective of spatial distribution patterns (Figure 7, Figure 8 and Figure 9), high carbon storage areas were concentrated in high-elevation mountainous regions such as the Luoxiao Mountains, Jiuhua Mountains, Huaiyu Mountains, and Tianhu Mountains. These areas are dominated by natural broadleaved forests and mixed coniferous–broadleaved forests, with high vegetation coverage and strong biomass accumulation capacity. In subtropical regions, mid-to-high elevation areas typically possess higher carbon density due to lower temperatures, reduced evapotranspiration, and increased effective moisture supply [70], which is highly consistent with the spatial pattern of high-value areas concentrated in mountainous core regions observed in this study. Moran’s I analysis further confirmed that all three categories of carbon storage exhibited significant spatial autocorrelation (AGBC: Moran’s I = 0.61; BGBC: Moran’s I = 0.45; TC: Moran’s I = 0.59), with the HH clusters identified in Figure 7, Figure 8 and Figure 9 concentrated in mountainous core areas such as the Wuyi Mountains, Luoxiao Mountains, and Jiuhua Mountains, further corroborating the high carbon sink characteristics of mountain vegetation. Low carbon storage areas were mainly concentrated in low-elevation regions such as the Ji-Tai Basin and the northern Jiangxi plains (Figure 7, Figure 8 and Figure 9), attributable to both natural conditions and anthropogenic activities. These areas are characterised by flat terrain, with land use predominantly consisting of cropland or planted forests, and relatively low vegetation coverage. Meanwhile, these areas have been significantly affected by urbanisation processes, with approximately 2588 km2 of cropland and forest land in Jiangxi converted to construction land between 2000 and 2020 [71]. The LL clusters largely overlapped with urban expansion areas [72], indicating that anthropogenic land use change contributed to the formation of low carbon storage patterns. In the central and eastern regions, carbon storage distribution was relatively stable, with moderate elevation and favourable climatic conditions. Coupled with the sustained implementation of ecological projects such as the Grain-for-Green Programme and the Natural Forest Protection Programme [73], carbon storage exhibited a trend of steady increase. The widespread distribution of mixed coniferous–broadleaved forests also contributed to further enhancement of regional carbon storage [74].
From the perspective of variation trends (Figure 10 and Figure 11), areas with increasing aboveground carbon storage accounted for 68.55% across Jiangxi Province during 1990–2024, while areas of decrease reached 31.45%. Belowground carbon storage showed a higher proportion of increasing areas at 85.81%, with decreasing areas accounting for only 14.19%. Areas with increasing total carbon storage accounted for 80.90%, while decreasing areas accounted for only 19.10%. Areas of increase were concentrated in high-elevation mountainous regions including the Wuyi Mountains, Yushan Mountains, Dayu Mountains, Tianhu Mountains, and Huaiyu Mountains. These areas benefit from favourable natural conditions, abundant precipitation, minimal anthropogenic disturbance, and the effective implementation of the Natural Forest Protection Programme, enabling forest vegetation to maintain a high carbon sink capacity [75]. Areas of decrease were mainly concentrated in the Ji-Tai Basin and the northwestern areas of Lushan, attributable to multiple causes. First, the Ji-Tai Basin has experienced deforestation, replanting, agricultural expansion, and urbanisation since the 1950s, with surface vegetation frequently subjected to anthropogenic disturbance [76]. Second, heatwaves are frequent in low-elevation areas, where high temperatures and drought suppress vegetation growth and exacerbate carbon release [77]. Third, the low-lying areas of northern Jiangxi have been severely affected by flood disasters in the Poyang Lake watershed. During the summer flood of 2020, the water level at the Hukou Station reached 22.43 m, with a maximum inundated cropland area of 1375.67 km2 [78]. Flooding may cause soil erosion, root damage, and biomass loss, thereby contributing to local decreases in forest carbon storage. Anthropogenic factors also exacerbated the decline in carbon storage. Between 2000 and 2020, construction land in Jiangxi increased by a net area of 2588.25 km2, while forest area decreased by approximately 1301.74 km2 [79]. These land use changes likely reduced vegetation cover and disturbed stand structure, thereby contributing to the relatively low forest vegetation carbon storage in this region.
The preceding temporal variation analysis indicated that carbon storage underwent a significant phased decline during 2003–2020. To quantitatively verify the temporal correspondence between these interannual fluctuations and extreme climatic events, this study analysed the frequency and intensity of drought, winter temperature, and precipitation variation characteristics in Jiangxi Province from 1990 to 2024, based on the SPEIbase v2.11 global drought dataset [80] and ERA5-Land reanalysis data [81] (Figure 20). The SPEI-12 analysis revealed that extreme drought events occurred with high frequency during 2004–2011. Specifically, 2004 was characterised by severe drought conditions throughout the entire year (SPEI-12 < −1.5), and the number of drought months exceeded six in 2007, 2009, and 2011. Concurrently, ERA5-Land annual precipitation data showed that precipitation in these years was significantly below the 35-year mean, reaching a minimum of 1308 mm in 2011, which coincided with the timing of carbon storage falling to its trough (Figure 20b,c,e). Regarding extreme low temperatures, the mean winter temperature in 2008 dropped to 5.96 °C (the lowest in the 35-year period), directly corroborating the severity of the extreme ice and snow disaster that year (Figure 20d). This disaster damaged approximately 3.56 million hectares of forests across the province [82]. However, carbon storage did not decline significantly in that year, owing to the dilution of winter damage signals in annual remote sensing composite imagery and the gradual release process of biomass loss following canopy breakage. Hua et al. [65] also confirmed this lag effect based on long-term Landsat monitoring. Notably, although carbon storage exhibited apparent low values in 2013 and 2017, no moderate or above drought events occurred during the same period, suggesting that these low values were more likely a continuation of the cumulative impacts of multiple extreme events in preceding years. Furthermore, precipitation recovered to above the multi-year mean during 2015–2016, and drought frequency dropped to zero. The improvement in hydrothermal conditions provided a favourable climatic background for carbon storage recovery, which corroborates the conclusion from the partial correlation analysis in this study regarding the positive driving effect of precipitation on carbon storage.
Figure 20.
The temporal correspondence between forest carbon storage and extreme climatic events in Jiangxi Province from 1990 to 2024. (a) The interannual variation in total forest vegetation carbon storage; (b) the annual frequency of moderate and above drought events based on SPEI-12 (number of months with SPEI-12 < −1.0); (c) the annual maximum drought intensity (annual minimum SPEI-12 value), with dashed lines indicating thresholds for moderate drought (−1.0), severe drought (−1.5), and extreme drought (−2.0); (d) the mean winter temperature (January–February), with red dots indicating years of extreme low temperatures; (e) the annual total precipitation, with the dashed line indicating the 35-year mean (1805 mm); (f) the annual frequency of extreme precipitation events (number of months in which monthly precipitation exceeded 1.5 standard deviations above the multi-year monthly mean). The yellow shaded areas indicate drought event years (2004, 2007, 2009, and 2011), and the blue shaded area indicates the 2008 ice and snow disaster year.
In summary, the spatiotemporal variation of carbon storage is the result of interactive effects between natural and anthropogenic factors. Topographic and climatic conditions jointly determine the fundamental spatial pattern, while extreme climatic events trigger pronounced interannual fluctuations through drought stress and ice and snow disasters, exhibiting significant lag and cumulative effects. Ecological projects such as the Grain-for-Green Programme have driven the overall increase in carbon storage, whereas urban expansion has caused localised decreases. In the future, efforts should be made to maintain the carbon sink functions of mountainous areas while strengthening forest protection and restoration in basin and plain regions [83], with attention also given to early warning systems for extreme climatic events and the establishment of post-disaster forest recovery mechanisms.
4.3. Driving Mechanisms of Forest Carbon Storage Changes
Regarding the dominant driving factors of spatial differentiation in carbon storage (Figure 12), the results of this study are highly consistent with existing research. Fang et al. [4] and Pan et al. [84] both indicated that climatic factors are the dominant driving force behind the spatial distribution of carbon storage, and Mo et al. [2] further demonstrated that solar radiation and precipitation play a decisive role in global forest carbon sinks. Precipitation directly regulates tree physiological metabolism and biomass accumulation by affecting soil moisture content and vegetation transpiration processes. As the energy source for photosynthesis, solar radiation, combined with the spatial variation in solar exposure caused by the mountainous and hilly terrain of Jiangxi, results in significant spatial heterogeneity in forest carbon storage across different slope aspects, slope positions, and elevations [85,86]. Zhang et al. [55], in their study on forest carbon density in Jiangxi Province, also noted that the provincial mean annual precipitation of 1341–1940 mm and annual sunshine duration of 1482–2085 h represent abundant yet spatially uneven hydrothermal conditions that constitute an important environmental basis for spatial differences in carbon density. Furthermore, this study found that SIF exhibited the second highest explanatory power for aboveground carbon storage after PRE (q = 0.134) as shown in Figure 12, indicating that the spatial distribution of carbon storage is closely related to vegetation photosynthetic productivity. This finding is consistent with recent research trends of using SIF to assess vegetation carbon sink functions [87]. Dual-factor interaction analysis (Figure 13) revealed that the interactive q values of all factor pairs exceeded those of single factors. The SRAD ∩ PRE interaction effect was the largest for aboveground carbon storage (mean q = 0.54), as solar radiation only enhances productivity when water supply is sufficient—a precipitation–radiation coupling also reported in subtropical forests of eastern China [88]. For belowground carbon storage, the interaction effect of SRAD and GDP was the largest (mean q = 0.47), and the influence of POP increased progressively over time, indicating that socioeconomic factors exert a stronger regulatory effect on belowground carbon pools than on aboveground carbon pools. Ye et al. [89], based on a global synthesis of 873 forest sites, demonstrated that anthropogenic factors such as forest management and regeneration methods can significantly alter the stand-level root-to-shoot ratio. Economic growth indirectly regulates the spatial pattern of belowground carbon storage by promoting the Grain-for-Green Programme and low-efficiency forest improvement, thereby altering stand composition and age class structure. Additionally, Wang et al. [90] showed that GDP, POP, and night-time light have become critical factors influencing carbon storage over recent decades, suggesting that future forest carbon sink management should give adequate attention to anthropogenic disturbances.
Regarding the differentiated influences of climatic factors (Figure 14, Figure 15 and Figure 16), PRE exhibited the most significant impact on aboveground carbon storage (Figure 14 mean correlation coefficient of 0.52). Tang et al. [91] and Zhang et al. [55] both confirmed that carbon density increases significantly with increasing precipitation, and that moisture conditions are the key limiting factor for photosynthetic carbon fixation in subtropical forests. TEM had the most prominent influence on belowground carbon storage (Figure 15 mean correlation coefficient of 0.39). Temperature affects belowground carbon pools by promoting root growth and regulating soil microbial activity. Lv et al. [92] indicated that root carbon allocation is more readily regulated by temperature when precipitation is sufficient, and warming at mid-to-high elevations can extend the growing season and promote belowground carbon accumulation [93]. The relationship between PET and carbon storage was relatively complex, showing positive correlations with both aboveground and belowground carbon storage but negative correlations with total carbon storage in some regions (mean correlation coefficient of −0.56 in Figure 16). Excessively high PET leads to soil moisture deficit and vegetation water stress. Wang et al. [86] found that excessively high vapour pressure deficit similarly suppresses carbon sink potential, consistent with the patterns observed in this study. Overall, precipitation primarily affects aboveground vegetation photosynthetic carbon fixation directly by regulating moisture supply, while temperature more predominantly regulates belowground carbon pool dynamics indirectly through root physiological metabolism and organic matter decomposition. The differentiated influence mechanisms of these two factors provide important insights for understanding carbon cycle processes and formulating targeted carbon sink management strategies.
Climate change was the dominant driving factor of the temporal changes in forest carbon storage in Jiangxi Province during 1990–2024, as quantified by the pixel-wise residual analysis (Section 3.3.2, Figure 17), with mean contribution rates to aboveground, belowground, and total carbon storage of 67.34%, 57.62%, and 60.01%, respectively, while the contribution rates of human activities were 35.77%, 45.98%, and 42.72%, respectively. These results are consistent with the findings of Shi et al. [52] and Feng et al. [53]. It should be noted that the sum of the two contribution rates exceeds 100%, because climate change and human activities exhibit synergistic effects in some regions. For example, the Grain-for-Green Programme improved local hydrothermal conditions, while concurrent climatic warming also favoured the growth of newly planted forests. Such interactive effects result in partial overlap between the contributions of the two factors. Additionally, the residuals may contain model errors and the influences of factors not incorporated in the analysis, such as pest and disease outbreaks and forest age succession. Therefore, the aforementioned contribution rates should be interpreted as indicative assessments of relative magnitudes. From the perspective of the spatial proportions of trend types, growth jointly driven by climate change and human activities was the most predominant trend type (aboveground 49.98%, belowground 72.86%, total carbon 67.71%). From a climatic perspective, temperatures in Jiangxi have risen over the past three decades with abundant precipitation. Moderate warming has extended the forest growing season and promoted biomass accumulation [94], while the province’s abundant precipitation has provided favourable hydrothermal conditions for sustained carbon sink growth [95]. From the perspective of human activities, ecological projects such as the Grain-for-Green Programme and the Natural Forest Protection Programme have played a pivotal role. Liu et al. [63] confirmed that these policies significantly enhanced vegetation coverage and carbon sequestration capacity, and Yue et al. [96] further indicated that afforestation and reforestation activities contributed approximately 49% of the carbon sink increment. Jiangxi Province has successively implemented the Grain-for-Green Programme, the second phase of the Natural Forest Protection Programme, and comprehensive logging bans with management and protection measures since 2001 [97], and reforestation activities have significantly strengthened carbon sequestration functions [19]. In areas of carbon storage decline, the northwestern Jiangxi river valley zones have been affected by intensified evapotranspiration due to warming, with seasonal drought leading to biomass decline. Yan et al. [98] further reported that drought in subtropical China has shown an increasing trend since the 1950s, with the 2011 extreme drought event substantially reducing subtropical forest carbon storage, consistent with the trough observed in our study (Section 4.2). Urbanisation expansion has been most concentrated in the Ji-Tai Basin and northern Jiangxi, where construction land increased from 341,700 to 542,300 hectares between 2010 and 2020, with a substantial increase in carbon emissions [99]. Urban agglomeration expansion has exerted significant negative impacts on vegetation coverage and carbon storage [100]. Although the proportion of decline jointly caused by climate change and human activities was the smallest (aboveground 5.10%, belowground 4.56%, total carbon 4.89%), it reflects the superimposed effects of dual pressures. These areas should be prioritised in future carbon sink management, requiring the optimisation of land use structure and the control of disorderly urban sprawl, while simultaneously strengthening adaptive forest management in climate-change-sensitive areas.
4.4. Limitations and Future Perspectives
Several limitations remain in this study. At the data level, the study period spans three generations of Landsat sensors (Landsat 5, 7, and 8), which differ in radiometric characteristics and band configurations. Although radiometric calibration was applied, systematic errors may still have been introduced. Spectral signal saturation in areas with complex terrain or high canopy closure may lead to underestimation of carbon density in high-value regions. Climatic factors were based on monthly scale data, and although this study conducted a preliminary quantitative analysis of the short-term disturbances caused by extreme climatic events using SPEI-12 and ERA5-Land data, the lag effects of drought stress and the mechanisms of its interaction with pest and disease outbreaks have not been thoroughly explored.
At the methodological level for time-related attribution, the partial correlation analysis between climatic factors and carbon storage was performed using time-synchronous data, in which the carbon storage of each year was correlated with the climatic factors of the same year. It is widely recognised that climatic factors exert lag effects on forest biomass accumulation [101], as tree growth, leaf area development, and biomass partitioning involve physiological and structural responses that may extend over multiple years following a climatic perturbation. The synchronous correlation approach adopted here therefore captures the contemporaneous co-variation between climate and carbon storage but does not fully resolve the cumulative or delayed effects of climatic anomalies on forest carbon dynamics. Nevertheless, this approach remains a methodologically defensible starting point for regional-scale forest carbon studies, and the direction and magnitude of our results are consistent with previous synchronous correlation findings in eastern Chinese forests [9] and southern subtropical forests [102].
At the model and methodology level, the linear framework of the GWR model may insufficiently capture nonlinear relationships between carbon storage and environmental variables, and the multiple regression residual analysis method may also omit nonlinear responses and threshold effects. Furthermore, this study only accounted for aboveground and belowground biomass carbon pools, without incorporating soil organic carbon and litter carbon, resulting in an incomplete assessment of the overall carbon sink capacity of the forest ecosystem. This exclusion may also bias the attribution of climate change and human activity contributions reported in Section 3.3.2. Soil organic carbon responds more slowly to interannual climate variability than vegetation carbon, so our climate contribution rate (~60%) may overestimate the role of climate in total ecosystem carbon dynamics. Conversely, soil and litter carbon pools are more sensitive to human-driven disturbances such as tillage, fire, and residue removal, suggesting that the contribution of human activities to the full ecosystem carbon pool is likely higher than our 43% estimate. Therefore, the contribution rates reported in this study should be interpreted strictly as attribution for vegetation carbon pools only.
Future research could advance in the following directions: integrating multi-source remote sensing data such as LiDAR and synthetic aperture radar to overcome signal saturation issues; introducing nonlinear algorithms to construct hybrid models that account for spatial heterogeneity; expanding the scope of carbon pool accounting to establish a more comprehensive carbon budget framework; incorporating multi-year lag windows (e.g., 1-year, 2-year, and 3-year lags) and cumulative climate indices into the pixel-wise partial correlation framework to more comprehensively quantify the synergistic effects of climate variability on forest carbon storage; and incorporating extreme climatic event indicators and fine-resolution land use change data to more accurately disentangle the driving mechanisms of carbon storage changes, thereby providing a scientific basis for regional carbon neutrality goals.
5. Conclusions
Based on a GWR model integrating field measurements and multi-source remote sensing data, this study estimated forest vegetation carbon storage in Jiangxi Province from 1990 to 2024 and quantitatively attributed its spatial differentiation and temporal changes. Total carbon storage fluctuated between 553.95 and 839.78 Tg C over the 35-year period and exhibited an extremely significant increasing trend (p < 0.01), with a cumulative carbon sequestration of approximately 122 Tg C, and the net increase in belowground carbon storage (79.32 Tg C) was markedly higher than that of aboveground carbon storage (42.20 Tg C). Spatially, carbon storage was concentrated in mountainous areas, with HH clusters in the Wuyi and Luoxiao Mountains and LL clusters in the Ji-Tai Basin and the central-northern hilly plains. Precipitation and solar radiation were the dominant drivers of the spatial differentiation of carbon storage, while climate change contributed approximately 60% and human activities approximately 43% to the temporal changes in total carbon storage.
These findings provide a scientific basis for delineating forest carbon sink conservation zones and formulating differentiated forest management strategies in subtropical China. Strengthening ecological restoration in basin and plain regions, maintaining the carbon sink functions of mountainous core areas, and prioritising adaptive forest management in areas subject to combined climate and urbanisation pressures are recommended directions for enhancing the regional carbon sink. Future work should further incorporate climate lag effects, soil carbon pools, and finer-scale forest age structures to refine the attribution of forest carbon dynamics and to support the design of long-term forest carbon sink management strategies under the dual carbon goals.
Author Contributions
Conceptualization, J.D. and Y.G.; methodology, J.D. and Y.G.; software, Y.G.; validation, Y.G. and X.Z.; formal analysis, Y.G. and L.L.; investigation, Y.G. and Y.L.; resources, J.D.; data curation, Y.G., X.L. and J.H.; writing—original draft preparation, Y.G.; writing—review and editing, Y.G. and J.D.; visualisation, Y.G. and Y.L.; supervision, J.D.; project administration, J.D.; funding acquisition, J.D. All authors have read and agreed to the published version of the manuscript.
Funding
This study was supported by the Fundamental Research Funds for the Central Public-interest Scientific Institution (Grant No. 2024YSKY-37); the National Natural Science Foundation of China (Grant No. 41001055); and the National Ecological Environment Survey and Assessment (Grant No. 2024-Vertical-0107).
Data Availability Statement
The data presented in this study are available from the corresponding author upon reasonable request. The data are not publicly available due to the fact that we need to conduct more research based on these data.
Acknowledgments
The authors would like to thank the following data providers: the National Tibetan Plateau/Third Pole Environment Data Center (http://data.tpdc.ac.cn) for the climate and vegetation datasets; the Google Earth Engine platform for providing access to Landsat imagery; the Geospatial Data Cloud for the ASTER GDEM elevation data; the Science Data Bank for the solar-induced chlorophyll fluorescence dataset; the Resource and Environmental Science Data Platform for the GDP grid dataset; the European Centre for Medium-Range Weather Forecasts (ECMWF) for the ERA5-Land reanalysis data; and the Oak Ridge National Laboratory for the LandScan population density dataset.
Conflicts of Interest
The authors declare no conflicts of interest.
Appendix A
Table A1.
Summary of characteristic variables.
Table A2.
Aboveground and belowground carbon density models and accuracy validation results.
Table A3.
Forest aboveground carbon storage component stepwise regression analysis variable selection results.
Table A4.
Forest belowground carbon storage component stepwise regression analysis variable selection results.
Table A5.
Statistical table of carbon storage and carbon density of forest vegetation in Jiangxi province from 1990 to 2024.
Table A6.
Number of categories used for the discretisation of each driving factor in the geographical detector analysis (K-means clustering).
References
- FAO. Global Forest Resources Assessment 2020; FAO: Rome, Italy, 2020. [Google Scholar]
- Mo, L.; Zohner, C.M.; Reich, P.B.; Liang, J.; De Miguel, S.; Nabuurs, G.-J.; Renner, S.S.; Van Den Hoogen, J.; Araza, A.; Herold, M.; et al. Integrated Global Assessment of the Natural Forest Carbon Potential. Nature 2023, 624, 92–101. [Google Scholar] [CrossRef] [Scilit]
- Yang, Y.; Shi, Y.; Sun, W.; Chang, J.; Zhu, J.; Chen, L.; Wang, X.; Guo, Y.; Zhang, H.; Yu, L.; et al. Terrestrial Carbon Sinks in China and around the World and Their Contribution to Carbon Neutrality. Sci. China Life Sci. 2022, 65, 861–895. [Google Scholar] [CrossRef] [Scilit]
- Fang, J.; Chen, A.; Peng, C.; Zhao, S.; Ci, L. Changes in Forest Biomass Carbon Storage in China between 1949 and 1998. Science 2001, 292, 2320–2322. [Google Scholar] [CrossRef] [Scilit]
- Feng, Y.; Liu, J.; Hu, H.; Cui, P.; Zhou, H.; Ma, B.; Liu, Z.; Chen, D. Global Patterns in Forest Carbon Storage Estimation: Bibliometric Analysis of Technological Evolution, Accuracy Gains and Scaling Challenges. Front. For. Glob. Change 2025, 8, 1649356. [Google Scholar] [CrossRef] [Scilit]
- Li, Y.; Li, M.; Li, C.; Liu, Z. Forest Aboveground Biomass Estimation Using Landsat 8 and Sentinel-1A Data with Machine Learning Algorithms. Sci. Rep. 2020, 10, 9952. [Google Scholar] [CrossRef] [Scilit]
- Zhou, Y.; Wei, G.; Wang, Y.; Wang, B.; Quan, Y.; Wu, Z.; Liu, J.; Bian, S.; Li, M.; Fan, W.; et al. Estimating Regional Forest Carbon Density Using Remote Sensing and Geographically Weighted Random Forest Models: A Case Study of Mid- to High-Latitude Forests in China. Forests 2025, 16, 96. [Google Scholar] [CrossRef] [Scilit]
- Hogan, J.A.; Domke, G.M.; Zhu, K.; Johnson, D.J.; Lichstein, J.W. Climate Change Determines the Sign of Productivity Trends in US Forests. Proc. Natl. Acad. Sci. USA 2024, 121, e2311132121. [Google Scholar] [CrossRef] [Scilit]
- Wen, D.; He, N. Forest Carbon Storage along the North-South Transect of Eastern China: Spatial Patterns, Allocation, and Influencing Factors. Ecol. Indic. 2016, 61, 960–967. [Google Scholar] [CrossRef] [Scilit]
- Sun, L.; Wang, M.; Fan, X. Spatial Pattern and Driving Factors of Biomass Carbon Density for Natural and Planted Coniferous Forests in Mountainous Terrain, Eastern Loess Plateau of China. For. Ecosyst. 2020, 7, 9. [Google Scholar] [CrossRef] [Scilit]
- Mekonnen, Z.A.; Riley, W.J. Climate Change Will Increase Biomass Proportion of Global Forest Carbon Stocks under an SSP5–8.5 Climate Trajectory. Geophys. Res. Lett. 2023, 50, e2023GL104612. [Google Scholar] [CrossRef] [Scilit]
- Erb, K.-H.; Kastner, T.; Plutzar, C.; Bais, A.L.S.; Carvalhais, N.; Fetzel, T.; Gingrich, S.; Haberl, H.; Lauk, C.; Niedertscheider, M.; et al. Unexpectedly Large Impact of Forest Management and Grazing on Global Vegetation Biomass. Nature 2018, 553, 73–76. [Google Scholar] [CrossRef] [Scilit]
- Li, C.; Huang, J.; Luo, Y.; Wang, J. Spatial Synergy between Carbon Storage and Emissions in Coastal China: Insights from PLUS-InVEST and OPGD Models. Remote Sens. 2025, 17, 2859. [Google Scholar] [CrossRef] [Scilit]
- Luo, Y.; Qi, S.; Liao, K.; Zhang, S.; Hu, B.; Tian, Y. Mapping the Forest Height by Fusion of ICESat-2 and Multi-Source Remote Sensing Imagery and Topographic Information: A Case Study in Jiangxi Province, China. Forests 2023, 14, 454. [Google Scholar] [CrossRef] [Scilit]
- Li, J.; Wang, B.; Wang, C.; Gao, H.; Wu, H.L.; Zheng, X.; Peng, H.F. Spatiotemporal trends and influencing factors of forest carbon stock in Jiangxi Province from 2005 to 2020. For. Grassl. Resour. Res. 2024, 1, 17–24. (In Chinese) [Google Scholar] [CrossRef]
- Wang, K.Y.; Wang, Y.F.; Chen, X.; Zheng, J.P.; Li, J.; Sun, Y.J. Remote sensing estimation of forest carbon storage in Jiangxi Province based on ensemble learning algorithm and Optuna tuning. Acta Ecol. Sin. 2025, 45, 685–700. (In Chinese) [Google Scholar] [CrossRef]
- Wu, G.; Tang, X.; Ruan, H.; Luo, X. Carbon Storage and Carbon Sequestration Potential Based on Forest Inventory Data in Jiangxi Province, China. J. Nanjing For. Univ. (Nat. Sci. Ed.) 2019, 43, 105–110. (In Chinese) [Google Scholar]
- Wang, Y.; Zhang, Z.; Chen, X. Land Use Transitions and the Associated Impacts on Carbon Storage in the Poyang Lake Basin, China. Remote Sens. 2023, 15, 2703. [Google Scholar] [CrossRef] [Scilit]
- Wang, R.; Wang, M.; Sun, X.; Wang, J.; Li, G. Winter Remote Sensing Images Are More Suitable for Forest Mapping in Jiangxi Province. Eur. J. Remote Sens. 2023, 56, 2237655. [Google Scholar] [CrossRef] [Scilit]
- Xu, L.; He, N.P.; Yu, G.R. A dataset of carbon density in Chinese terrestrial ecosystems (2010s). China Sci. Data 2019, 4, 90–96. (In Chinese) [Google Scholar] [CrossRef] [Scilit]
- Lu, D.; Chen, Q.; Wang, G.; Liu, L.; Li, G.; Moran, E. A Survey of Remote Sensing-Based Aboveground Biomass Estimation Methods in Forest Ecosystems. Int. J. Digit. Earth 2016, 9, 63–105. [Google Scholar] [CrossRef] [Scilit]
- Gao, Y.; Lu, D.; Li, G.; Wang, G.; Chen, Q.; Liu, L.; Li, D. Comparative Analysis of Modeling Algorithms for Forest Aboveground Biomass Estimation in a Subtropical Region. Remote Sens. 2018, 10, 627. [Google Scholar] [CrossRef] [Scilit]
- Kelsey, K.; Neff, J. Estimates of Aboveground Biomass from Texture Analysis of Landsat Imagery. Remote Sens. 2014, 6, 6407–6422. [Google Scholar] [CrossRef] [Scilit]
- Baig, M.H.A.; Zhang, L.; Shuai, T.; Tong, Q. Derivation of a Tasselled Cap Transformation Based on Landsat 8 At-Satellite Reflectance. Remote Sens. Lett. 2014, 5, 423–431. [Google Scholar] [CrossRef] [Scilit]
- Crist, E.P. A TM Tasseled Cap Equivalent Transformation for Reflectance Factor Data. Remote Sens. Environ. 1985, 17, 301–306. [Google Scholar] [CrossRef] [Scilit]
- Gorelick, N.; Hancher, M.; Dixon, M.; Ilyushchenko, S.; Thau, D.; Moore, R. Google Earth Engine: Planetary-Scale Geospatial Analysis for Everyone. Remote Sens. Environ. 2017, 202, 18–27. [Google Scholar] [CrossRef] [Scilit]
- Gao, H.; Liu, S.; Lu, W.; Smith, A.R.; Valbuena, R.; Yan, W.; Wang, Z.; Xiao, L.; Peng, X.; Li, Q.; et al. Global Analysis of the Relationship between Reconstructed Solar-Induced Chlorophyll Fluorescence (SIF) and Gross Primary Production (GPP). Remote Sens. 2021, 13, 2824. [Google Scholar] [CrossRef] [Scilit]
- Xiao, Y.; An, K.; Yang, Y.; Xie, G.; Lu, C. Forest Carbon Storage Trends along Altitudinal Gradients in Beijing, China. J. Resour. Ecol. 2014, 5, 148–156. [Google Scholar] [CrossRef] [Scilit]
- Gao, J.; Shi, Y.; Zhang, H.; Chen, X.; Zhang, W.; Shen, W.; Xiao, T.; Zhang, Y. China Regional 250m Fractional Vegetation Cover Data Set (2000–2024); National Tibetan Plateau Data Center (TPDC): Beijing, China, 2025. [Google Scholar]
- Tao, S.; Chen, J.M.; Zhang, Z.; Zhang, Y.; Ju, W.; Zhu, T.; Wu, L.; Wu, Y.; Kang, X. A High-Resolution Satellite-Based Solar-Induced Chlorophyll Fluorescence Dataset for China from 2000 to 2022. Sci. Data 2024, 11, 1286. [Google Scholar] [CrossRef] [Scilit] [PubMed]
- He, J.; Yang, K.; Li, X.; Tang, W.; Shao, C.; Jiang, Y.; Ding, B. China Meteorological Forcing Dataset v2.0 (1951–2024); National Tibetan Plateau Data Center (TPDC): Beijing, China, 2025. [Google Scholar]
- Peng, S. 1-Km Monthly Potential Evapotranspiration Dataset for China (1901–2024); National Tibetan Plateau Data Center (TPDC): Beijing, China, 2025. [Google Scholar]
- Peng, S.; Ding, Y.; Liu, W.; Li, Z. 1km Monthly Temperature and Precipitation Dataset for China from 1901 to 2017. Earth Syst. Sci. Data 2019, 11, 1931–1946. [Google Scholar] [CrossRef] [Scilit]
- Geospatial Data Cloud. ASTER GDEM 30 m Resolution Digital Elevation Data. Available online: https://www.gscloud.cn (accessed on 9 November 2025).
- Xu, X.L. China GDP Spatial Distribution Kilometre Grid Dataset. Resource and Environmental Science Data Platform. 2017. Available online: http://www.resdc.cn/DOI (accessed on 9 November 2025). (In Chinese)
- Wu, Y.; Shi, K.; Chen, Z.; Liu, S.; Chang, Z. An Improved Time-Series DMSP-OLS-like Data (1992–2024) in China by Integrating DMSP-OLS and SNPP-VIIRS, Version V7. Harvard Dataverse, 2021. [CrossRef]
- LandScan. Global Population Dataset. Available online: https://landscan.ornl.gov/ (accessed on 9 November 2025).
- Wu, L.; Du, J.; Liu, X.; Li, L.; Zhu, X.; Chen, X.; Gong, Y.; Li, Y. Comparative Analysis of Carbon Density Simulation Methods in Grassland Ecosystems: A Case Study from Gansu Province, China. Remote Sens. 2025, 17, 172. [Google Scholar] [CrossRef] [Scilit]
- Brunsdon, C.; Fotheringham, A.S.; Charlton, M.E. Geographically Weighted Regression: A Method for Exploring Spatial Nonstationarity. Geogr. Anal. 1996, 28, 281–298. [Google Scholar] [CrossRef] [Scilit]
- Cai, B.F.; Yu, R. Advance and evaluation in the long time series vegetation trends research based on remote sensing. J. Remote Sens. 2009, 13, 1170–1186. (In Chinese) [Google Scholar]
- Wang, F.; Shao, W.; Yu, H.; Kan, G.; He, X.; Zhang, D.; Ren, M.; Wang, G. Re-Evaluation of the Power of the Mann-Kendall Test for Detecting Monotonic Trends in Hydrometeorological Time Series. Front. Earth Sci. 2020, 8, 14. [Google Scholar] [CrossRef] [Scilit]
- Zhang, W.; Wang, Z.; Meng, M.; Li, T.; Guo, J.; Sun, D.; Qin, L.; Xu, X.; Shen, X. Long-Term NDVI Trends and Vegetation Resilience in a Seismically Active Debris Flow Watershed: A Case Study from the Wenchuan Earthquake Zone. Sustainability 2025, 17, 5081. [Google Scholar] [CrossRef] [Scilit]
- Liu, C.; Li, W.; Wang, W.; Zhou, H.; Liang, T.; Hou, F.; Xu, J.; Xue, P. Quantitative Spatial Analysis of Vegetation Dynamics and Potential Driving Factors in a Typical Alpine Region on the Northeastern Tibetan Plateau Using the Google Earth Engine. CATENA 2021, 206, 105500. [Google Scholar] [CrossRef] [Scilit]
- Wang, J.F.; Xu, C.D. Geodetector: Principle and prospective. Acta Geogr. Sin. 2017, 72, 116–134. (In Chinese) [Google Scholar]
- Song, Y.; Wang, J.; Ge, Y.; Xu, C. An Optimal Parameters-Based Geographical Detector Model Enhances Geographic Characteristics of Explanatory Variables for Spatial Heterogeneity Analysis: Cases with Different Types of Spatial Data. GIScience Remote Sens. 2020, 57, 593–610. [Google Scholar] [CrossRef] [Scilit]
- Guo, P.; Zhao, X.; Shi, J.; Huang, J.; Tang, J.; Zhang, R.; Chen, J.; Wang, Q.; Zeng, J. The Influence of Temperature and Precipitation on the Vegetation Dynamics of the Tropical Island of Hainan. Theor. Appl. Climatol. 2021, 143, 429–445. [Google Scholar] [CrossRef] [Scilit]
- Gao, W.; Zheng, C.; Liu, X.; Lu, Y.; Chen, Y.; Wei, Y.; Ma, Y. NDVI-Based Vegetation Dynamics and Their Responses to Climate Change and Human Activities from 1982 to 2020: A Case Study in the Mu Us Sandy Land, China. Ecol. Indic. 2022, 137, 108745. [Google Scholar] [CrossRef] [Scilit]
- Chen, Z.; Zan, M.; Kong, J. Assessing the Potential for Carbon Storage Enhancement in Forests of Xinjiang Uygur Autonomous Region, China. Sci. Rep. 2025, 15, 29774. [Google Scholar] [CrossRef] [Scilit] [PubMed]
- Zhou, J.; Zan, M.; Zhai, L.; Ke, J.; Zhao, Z. Study on the Spatio-Temporal Dynamics of Forest Carbon Sources and Sinks in Xinjiang Based on Process Models and Their Climate Response Mechanisms. Front. For. Glob. Change 2025, 8, 1713711. [Google Scholar] [CrossRef] [Scilit]
- Cheng, D.; Qi, G.; Song, J.; Zhang, Y.; Bai, H.; Gao, X. Quantitative Assessment of the Contributions of Climate Change and Human Activities to Vegetation Variation in the Qinling Mountains. Front. Earth Sci. 2021, 9, 782287. [Google Scholar] [CrossRef] [Scilit]
- Dong, S.; Ren, W.; Dong, X.; Lei, F.; Wang, X.-C.; Xie, L.; Zhou, X. Decoupling the Impacts of Climate Change and Human Activities on Terrestrial Vegetation Carbon Sink. Remote Sens. 2024, 16, 4417. [Google Scholar] [CrossRef] [Scilit]
- Shi, S.; Zhu, L.; Luo, Z.; Qiu, H. Quantitative Analysis of the Contributions of Climatic and Anthropogenic Factors to the Variation in Net Primary Productivity, China. Remote Sens. 2023, 15, 789. [Google Scholar] [CrossRef] [Scilit]
- Feng, H.; Kang, P.; Deng, Z.; Zhao, W.; Hua, M.; Zhu, X.; Wang, Z. The Impact of Climate Change and Human Activities to Vegetation Carbon Sequestration Variation in Sichuan and Chongqing. Environ. Res. 2023, 238, 117138. [Google Scholar] [CrossRef] [Scilit] [PubMed]
- Sun, X.; Li, G.; Wang, M.; Fan, Z. Analyzing the Uncertainty of Estimating Forest Aboveground Biomass Using Optical Imagery and Spaceborne LiDAR. Remote Sens. 2019, 11, 722. [Google Scholar] [CrossRef] [Scilit]
- Zhang, C.; Deng, Q.; Liu, A.; Liu, C.; Xie, G. Effects of Stand Structure and Topography on Forest Vegetation Carbon Density in Jiangxi Province. Forests 2021, 12, 1483. [Google Scholar] [CrossRef] [Scilit]
- Wu, C.; Yue, T.; Wang, Y.; Zhao, N.; Yang, Y.; Du, Z.; Shao, W.; Zhang, X.; Li, Z.; Pan, J.; et al. Analysing Causes of Carbon Density Dynamics in Subtropical Forests. Forests 2025, 16, 1496. [Google Scholar] [CrossRef] [Scilit]
- Huang, Y.; Xie, F.; Song, Z.; Zhu, S. Evolution and Multi-Scenario Prediction of Land Use and Carbon Storage in Jiangxi Province. Forests 2023, 14, 1933. [Google Scholar] [CrossRef] [Scilit]
- Li, P.; Liu, X.; Wang, C.; Lu, Y.; Luo, L.; Tao, L.; Xiao, T.; Liu, Y. The Carbon Storage of Reforestation Plantings on Degraded Lands of the Red Soil Region, Jiangxi Province, China. Forests 2024, 15, 320. [Google Scholar] [CrossRef] [Scilit]
- Hu, J.X.; Le, X.W.; Wang, W.L.; Xiong, Y.; Tan, X.L. Temporal and spatial evolution and prediction of ecosystem carbon storage in Jiangxi Province based on PLUS-InVEST model. Environ. Sci. 2024, 45, 3284–3296. (In Chinese) [Google Scholar] [CrossRef] [Scilit]
- Qiugen, Z.; Ruan, D.; Jian, L. Temporal Variation and Trend Prediction of Carbon Storage in Subtropical Evergreen Broad-Leaved Forest in Jiangxi Province Based on Remote Sensing Images. IOP Conf. Ser. Earth Environ. Sci. 2020, 546, 032048. [Google Scholar] [CrossRef] [Scilit]
- Zhang, Q.; Ye, H.; Ding, Y.; Cao, Q.; Zhang, Y.; Huang, K. Carbon Storage Dynamics of Subtropical Forests Estimated with Multi-Period Forest Inventories at a Regional Scale: The Case of Jiangxi Forests. J. For. Res. 2020, 31, 1247–1254. [Google Scholar] [CrossRef] [Scilit]
- Ning, K.; Chen, J.; Li, Z.; Liu, C.; Nie, X.; Liu, Y.; Wang, L.; Hu, X. Land Use Change Induced by the Implementation of Ecological Restoration Programs Increases Future Terrestrial Ecosystem Carbon Sequestration in Red Soil Hilly Region of China. Ecol. Indic. 2021, 133, 108409. [Google Scholar] [CrossRef] [Scilit]
- Liu, J.; Li, S.; Ouyang, Z.; Tam, C.; Chen, X. Ecological and Socioeconomic Effects of China’s Policies for Ecosystem Services. Proc. Natl. Acad. Sci. USA 2008, 105, 9477–9482. [Google Scholar] [CrossRef] [Scilit]
- Zhang, P.; Ye, Q.; Ouyang, F.; Peng, L.; Liu, X.; Guo, Y.; Zeng, J. Global Warming and Droughts Aggravates Forest Damage Resulting from Pests and Diseases in Jiangxi Province. Acta Ecol. Sin. 2017, 37, 639–649. [Google Scholar] [CrossRef] [Scilit]
- Hua, J.; Chen, G.; Yu, L.; Ye, Q.; Jiao, H.; Luo, X. Improved Mapping of Long-Term Forest Disturbance and Recovery Dynamics in the Subtropical China Using All Available Landsat Time-Series Imagery on Google Earth Engine Platform. IEEE J. Sel. Top. Appl. Earth Obs. Remote Sens. 2021, 14, 2754–2768. [Google Scholar] [CrossRef] [Scilit]
- Hong, S.; Ding, J.; Kan, F.; Xu, H.; Chen, S.; Yao, Y.; Piao, S. Asymmetry of Carbon Sequestrations by Plant and Soil after Forestation Regulated by Soil Nitrogen. Nat. Commun. 2023, 14, 3196. [Google Scholar] [CrossRef] [Scilit]
- Yang, X.; Wang, B.; Fakher, A.; An, S.; Kuzyakov, Y. Contribution of Roots to Soil Organic Carbon: From Growth to Decomposition Experiment. CATENA 2023, 231, 107317. [Google Scholar] [CrossRef] [Scilit]
- Poorter, H.; Niklas, K.J.; Reich, P.B.; Oleksyn, J.; Poot, P.; Mommer, L. Biomass Allocation to Leaves, Stems and Roots: Meta-analyses of Interspecific Variation and Environmental Control. New Phytol. 2012, 193, 30–50. [Google Scholar] [CrossRef] [Scilit] [PubMed]
- Mokany, K.; Raison, R.J.; Prokushkin, A.S. Critical Analysis of Root: Shoot Ratios in Terrestrial Biomes. Glob. Change Biol. 2006, 12, 84–96. [Google Scholar] [CrossRef] [Scilit]
- Wang, W.; Tang, L.; Zhang, Y.; Cai, J.; Chen, X.; Mao, X. Mapping Ecosystem Carbon Storage in the Nanling Mountains of Guangdong Province Using Machine Learning Based on Multi-Source Remote Sensing. Atmosphere 2025, 16, 954. [Google Scholar] [CrossRef] [Scilit]
- Fu, C.; Xiang, L.; Liu, Y.; Zhou, T. Response of Nitrogen Emissions to Land Use Changes and Driving Forces Analysis in Jiangxi Province under Multiple Scenarios. Sci. Rep. 2025, 15, 29599. [Google Scholar] [CrossRef] [Scilit] [PubMed]
- Li, Y.; Ye, C.; Sun, K. Research on the Impact of County Urbanization in Jiangxi Province on Carbon Budget Balance. Environ. Monit. Assess. 2025, 197, 182. [Google Scholar] [CrossRef] [Scilit]
- Wei, X.; Li, Q.; Liu, Y.; Liu, S.; Guo, X.; Zhang, L.; Niu, D.; Zhang, W. Restoring Ecosystem Carbon Sequestration through Afforestation: A Sub-Tropic Restoration Case Study. For. Ecol. Manag. 2013, 300, 60–67. [Google Scholar] [CrossRef] [Scilit]
- Xu, W.; Zhang, B.; Xu, Q.; Gao, D.; Zuo, H.; Ren, R.; Diao, K.; Chen, Z. Enhanced Carbon Storage in Mixed Coniferous and Broadleaf Forest Compared to Pure Forest in the North Subtropical–Warm Temperate Transition Zone of China. Forests 2024, 15, 1520. [Google Scholar] [CrossRef] [Scilit]
- Chen, Z.; Wei, K.; Hu, L.; Yi, C.; Liu, S. Spatiotemporal Variation and Driving Forces of Carbon Storage in the Fuhe River Basin, China. Sci. Rep. 2025, 15, 30224. [Google Scholar] [CrossRef] [Scilit]
- Zhao, S.; Lu, J.; Zhang, H.; Zeng, Y.; Qi, W.; Liang, Z.; Zhang, T.; Liu, G.; Qin, M.; Jiang, L. Population, Consumption, and Land Use in the Jitai Basin Region, Jiangxi Province. In Growing Populations, Changing Landscapes: Studies from India, China, and the United States; The National Academies Press: Washington, DC, USA, 2001; pp. 179–206. [Google Scholar]
- Liu, W.; Sun, S.; He, Y.; Zhang, Y.; Huang, C. Climatic Characteristics of Heat Wave Events (1959–2023) in Jiangxi Province, China. Geomat. Nat. Hazards Risk 2024, 15, 2379595. [Google Scholar] [CrossRef] [Scilit]
- Yang, H.; Wang, H.; Lu, J.; Zhou, Z.; Feng, Q.; Wu, Y. Full Lifecycle Monitoring on Drought-Converted Catastrophic Flood Using Sentinel-1 SAR: A Case Study of Poyang Lake Region during Summer 2020. Remote Sens. 2021, 13, 3485. [Google Scholar] [CrossRef] [Scilit]
- Zhao, T.; Zhou, X.; Jian, Z.; Zhu, J.; Liu, M.; Yin, S. Spatial–Temporal Evolution and Influencing Factors of Land-Use Carbon Emissions: A Case Study of Jiangxi Province. Appl. Sci. 2025, 15, 10986. [Google Scholar] [CrossRef] [Scilit]
- Vicente-Serrano, S.M.; Beguería, S.; López-Moreno, J.I. A Multiscalar Drought Index Sensitive to Global Warming: The Standardized Precipitation Evapotranspiration Index. J. Clim. 2010, 23, 1696–1718. [Google Scholar] [CrossRef] [Scilit]
- Muñoz-Sabater, J.; Dutra, E.; Agustí-Panareda, A.; Albergel, C.; Arduini, G.; Balsamo, G.; Boussetta, S.; Choulga, M.; Harrigan, S.; Hersbach, H.; et al. ERA5-Land: A State-of-the-Art Global Reanalysis Dataset for Land Applications. Earth Syst. Sci. Data 2021, 13, 4349–4383. [Google Scholar] [CrossRef] [Scilit]
- Shao, Q.; Huang, L.; Liu, J.; Kuang, W.; Li, J. Analysis of Forest Damage Caused by the Snow and Ice Chaos along a Transect across Southern China in Spring 2008. J. Geogr. Sci. 2011, 21, 219–234. [Google Scholar] [CrossRef] [Scilit]
- Zhang, T.; Hu, Y.; Guan, S.; Zhu, M.; Lei, T.; Hu, H. Spatiotemporal Changes and Influencing Factors of Ecosystem Services in the Nanchang Metropolitan Area, China. Front. Ecol. Evol. 2024, 12, 1470912. [Google Scholar] [CrossRef] [Scilit]
- Pan, Y.; Birdsey, R.A.; Fang, J.; Houghton, R.; Kauppi, P.E.; Kurz, W.A.; Phillips, O.L.; Shvidenko, A.; Lewis, S.L.; Canadell, J.G.; et al. A Large and Persistent Carbon Sink in the World’s Forests. Science 2011, 333, 988–993. [Google Scholar] [CrossRef] [Scilit] [PubMed]
- Chen, J.; Wang, S.; Shi, H.; Chen, B.; Wang, J.; Zheng, C.; Zhu, K. Radiation and Temperature Dominate the Spatiotemporal Variability in Resilience of Subtropical Evergreen Forests in China. Front. For. Glob. Change 2023, 6, 1166481. [Google Scholar] [CrossRef] [Scilit]
- Wang, L.; Yu, M.; Ye, S.; Yan, J. Seasonal Patterns of Carbon and Water Flux Responses to Precipitation and Solar Radiation Variability in a Subtropical Evergreen Forest, South China. Agric. For. Meteorol. 2023, 342, 109760. [Google Scholar] [CrossRef] [Scilit]
- Cheng, R. Solar-Induced Chlorophyll Fluorescence (SIF): Towards a Better Understanding of Vegetation Dynamics and Carbon Uptake in Arctic-Boreal Ecosystems. Curr. Clim. Change Rep. 2024, 10, 13–32. [Google Scholar] [CrossRef] [Scilit]
- Zhang, Y.; Li, K.; Zhang, X.; Huang, M.; Wang, Q.; Zhang, S.; Zhang, F.; Li, H. Response Mechanism of Subtropical Forest Carbon Balance to Climate Change Based on InTEC Model. Front. For. Glob. Change 2025, 8, 1526743. [Google Scholar] [CrossRef] [Scilit]
- Ye, J.; Yue, C.; Hu, Y.; Ma, H. Spatial Patterns of Global-Scale Forest Root-Shoot Ratio and Their Controlling Factors. Sci. Total Environ. 2021, 800, 149251. [Google Scholar] [CrossRef] [Scilit]
- Wang, X.; Zhang, W.; Zhao, X.; Wang, D.; Li, Y. Sustaining Carbon Storage: An Analysis of Land Use and Conservation Strategies in China’s Huang-Huai-Hai Plain. Sustainability 2024, 17, 139. [Google Scholar] [CrossRef] [Scilit]
- Tang, X.; Zhao, X.; Bai, Y.; Tang, Z.; Wang, W.; Zhao, Y.; Wan, H.; Xie, Z.; Shi, X.; Wu, B.; et al. Carbon Pools in China’s Terrestrial Ecosystems: New Estimates Based on an Intensive Field Survey. Proc. Natl. Acad. Sci. USA 2018, 115, 4021–4026. [Google Scholar] [CrossRef] [Scilit] [PubMed]
- Lv, Z.; Duan, A.; Zhang, J. Influence of Forest Age, Tree Size, and Climate Factors on Biomass and Carbon Storage Allocation in Chinese Fir Forests. Ecol. Indic. 2024, 163, 112096. [Google Scholar] [CrossRef] [Scilit]
- Huang, X.; Zhen, Z.; Zhao, W.; Wang, X. Forest Carbon Sink in North China Increased in Recent Two Decades, but Decreased in Extreme Drought Years. GIScience Remote Sens. 2024, 61, 2383040. [Google Scholar] [CrossRef] [Scilit]
- Zhao, Q.; Xu, C.; An, W.; Liu, Y.; Xiao, G.; Huang, C. Increasing Tree Growth in Subalpine Forests of Central China Due to Earlier Onset of the Thermal Growing Season. Agric. For. Meteorol. 2023, 333, 109391. [Google Scholar] [CrossRef] [Scilit]
- Zhen, Y.; Zhang, X.; Zhang, C.; Gao, Q.; Dong, J.; Zhang, L.; Lu, X.; Wang, Y. Effects of Climate Change and Land Use/Cover Changes on Carbon Sequestration in Forest Ecosystems in the Coastal Area of China. Front. For. Glob. Change 2023, 6, 1271239. [Google Scholar] [CrossRef] [Scilit]
- Yue, C.; Xu, M.; Ciais, P.; Tao, S.; Shen, H.; Chang, J.; Li, W.; Deng, L.; He, J.; Leng, Y.; et al. Contributions of Ecological Restoration Policies to China’s Land Carbon Balance. Nat. Commun. 2024, 15, 9708. [Google Scholar] [CrossRef] [Scilit]
- Wang, H.; He, M.; Ran, N.; Xie, D.; Wang, Q.; Teng, M.; Wang, P. China’s Key Forestry Ecological Development Programs: Implementation, Environmental Impact and Challenges. Forests 2021, 12, 101. [Google Scholar] [CrossRef] [Scilit]
- Yan, M.; Mao, F.; Du, H.; Li, X.; Chen, Q.; Ni, C.; Huang, Z.; Xu, Y.; Gong, Y.; Guo, K.; et al. Spatiotemporal Dynamic of Subtropical Forest Carbon Storage and Its Resistance and Resilience to Drought in China. Front. Plant Sci. 2023, 14, 1067552. [Google Scholar] [CrossRef] [Scilit]
- Wenmei, L.; Liwen, J.; Jiamin, Z.; Zhipeng, W.; Hailan, Q.; Shuie, S. Spatial Differentiation and Functional Zoning of Carbon Budget: Evidence from Jiangxi Province. Front. Environ. Sci. 2024, 12, 1404760. [Google Scholar] [CrossRef] [Scilit]
- Liu, X.; Wang, S.; Wu, P.; Feng, K.; Hubacek, K.; Li, X.; Sun, L. Impacts of Urban Expansion on Terrestrial Carbon Storage in China. Environ. Sci. Technol. 2019, 53, 6834–6844. [Google Scholar] [CrossRef] [Scilit] [PubMed]
- Wu, D.; Zhao, X.; Liang, S.; Zhou, T.; Huang, K.; Tang, B.; Zhao, W. Time-lag Effects of Global Vegetation Responses to Climate Change. Glob. Change Biol. 2015, 21, 3520–3531. [Google Scholar] [CrossRef] [Scilit] [PubMed]
- Zeng, W.-H.; Zhu, S.-D.; Luo, Y.-H.; Shi, W.; Wang, Y.-Q.; Cao, K.-F. Aboveground Biomass Stocks of Species-Rich Natural Forests in Southern China Are Influenced by Stand Structural Attributes, Species Richness and Precipitation. Plant Divers. 2024, 46, 530–536. [Google Scholar] [CrossRef] [Scilit] [PubMed]
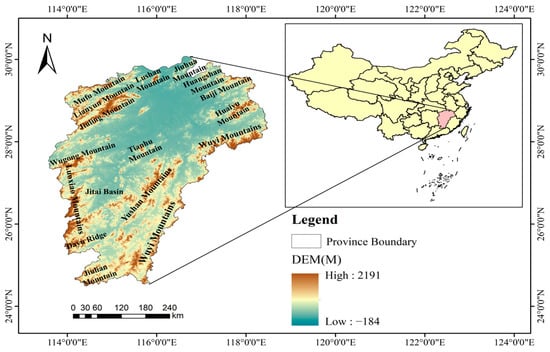
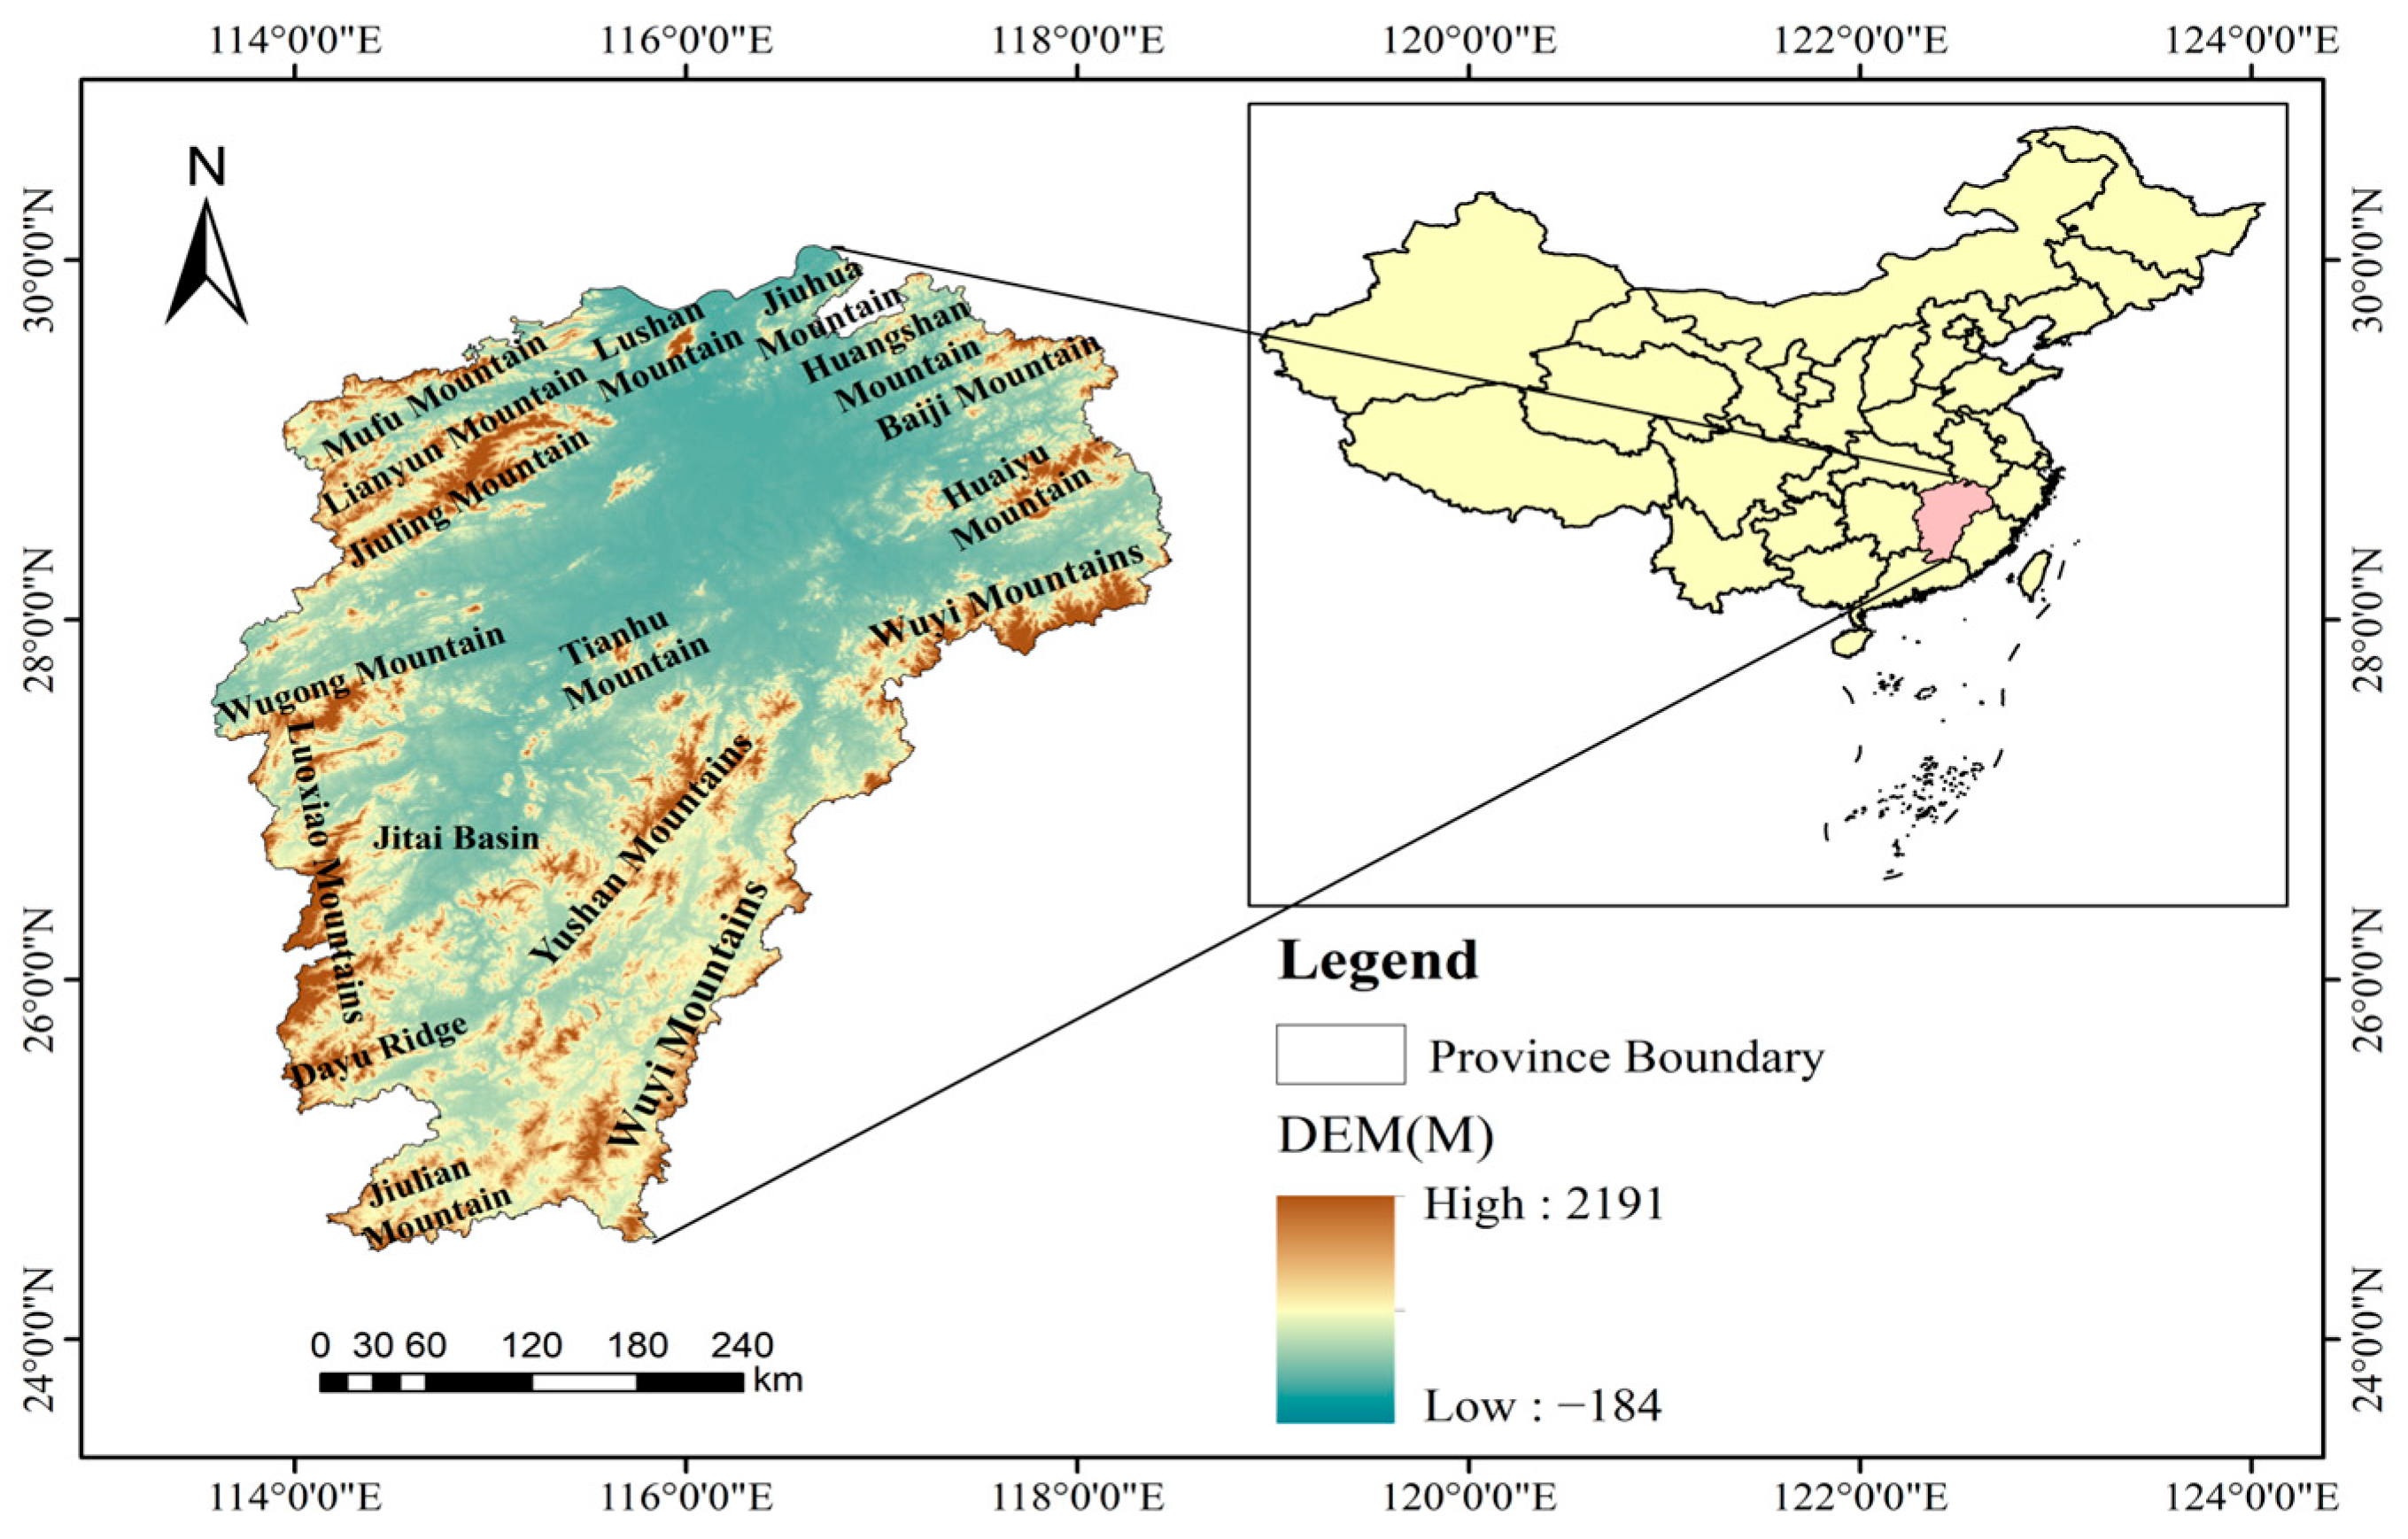
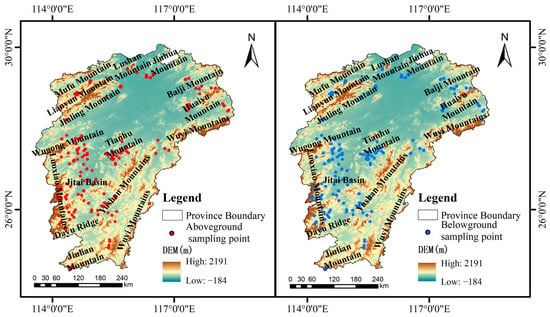
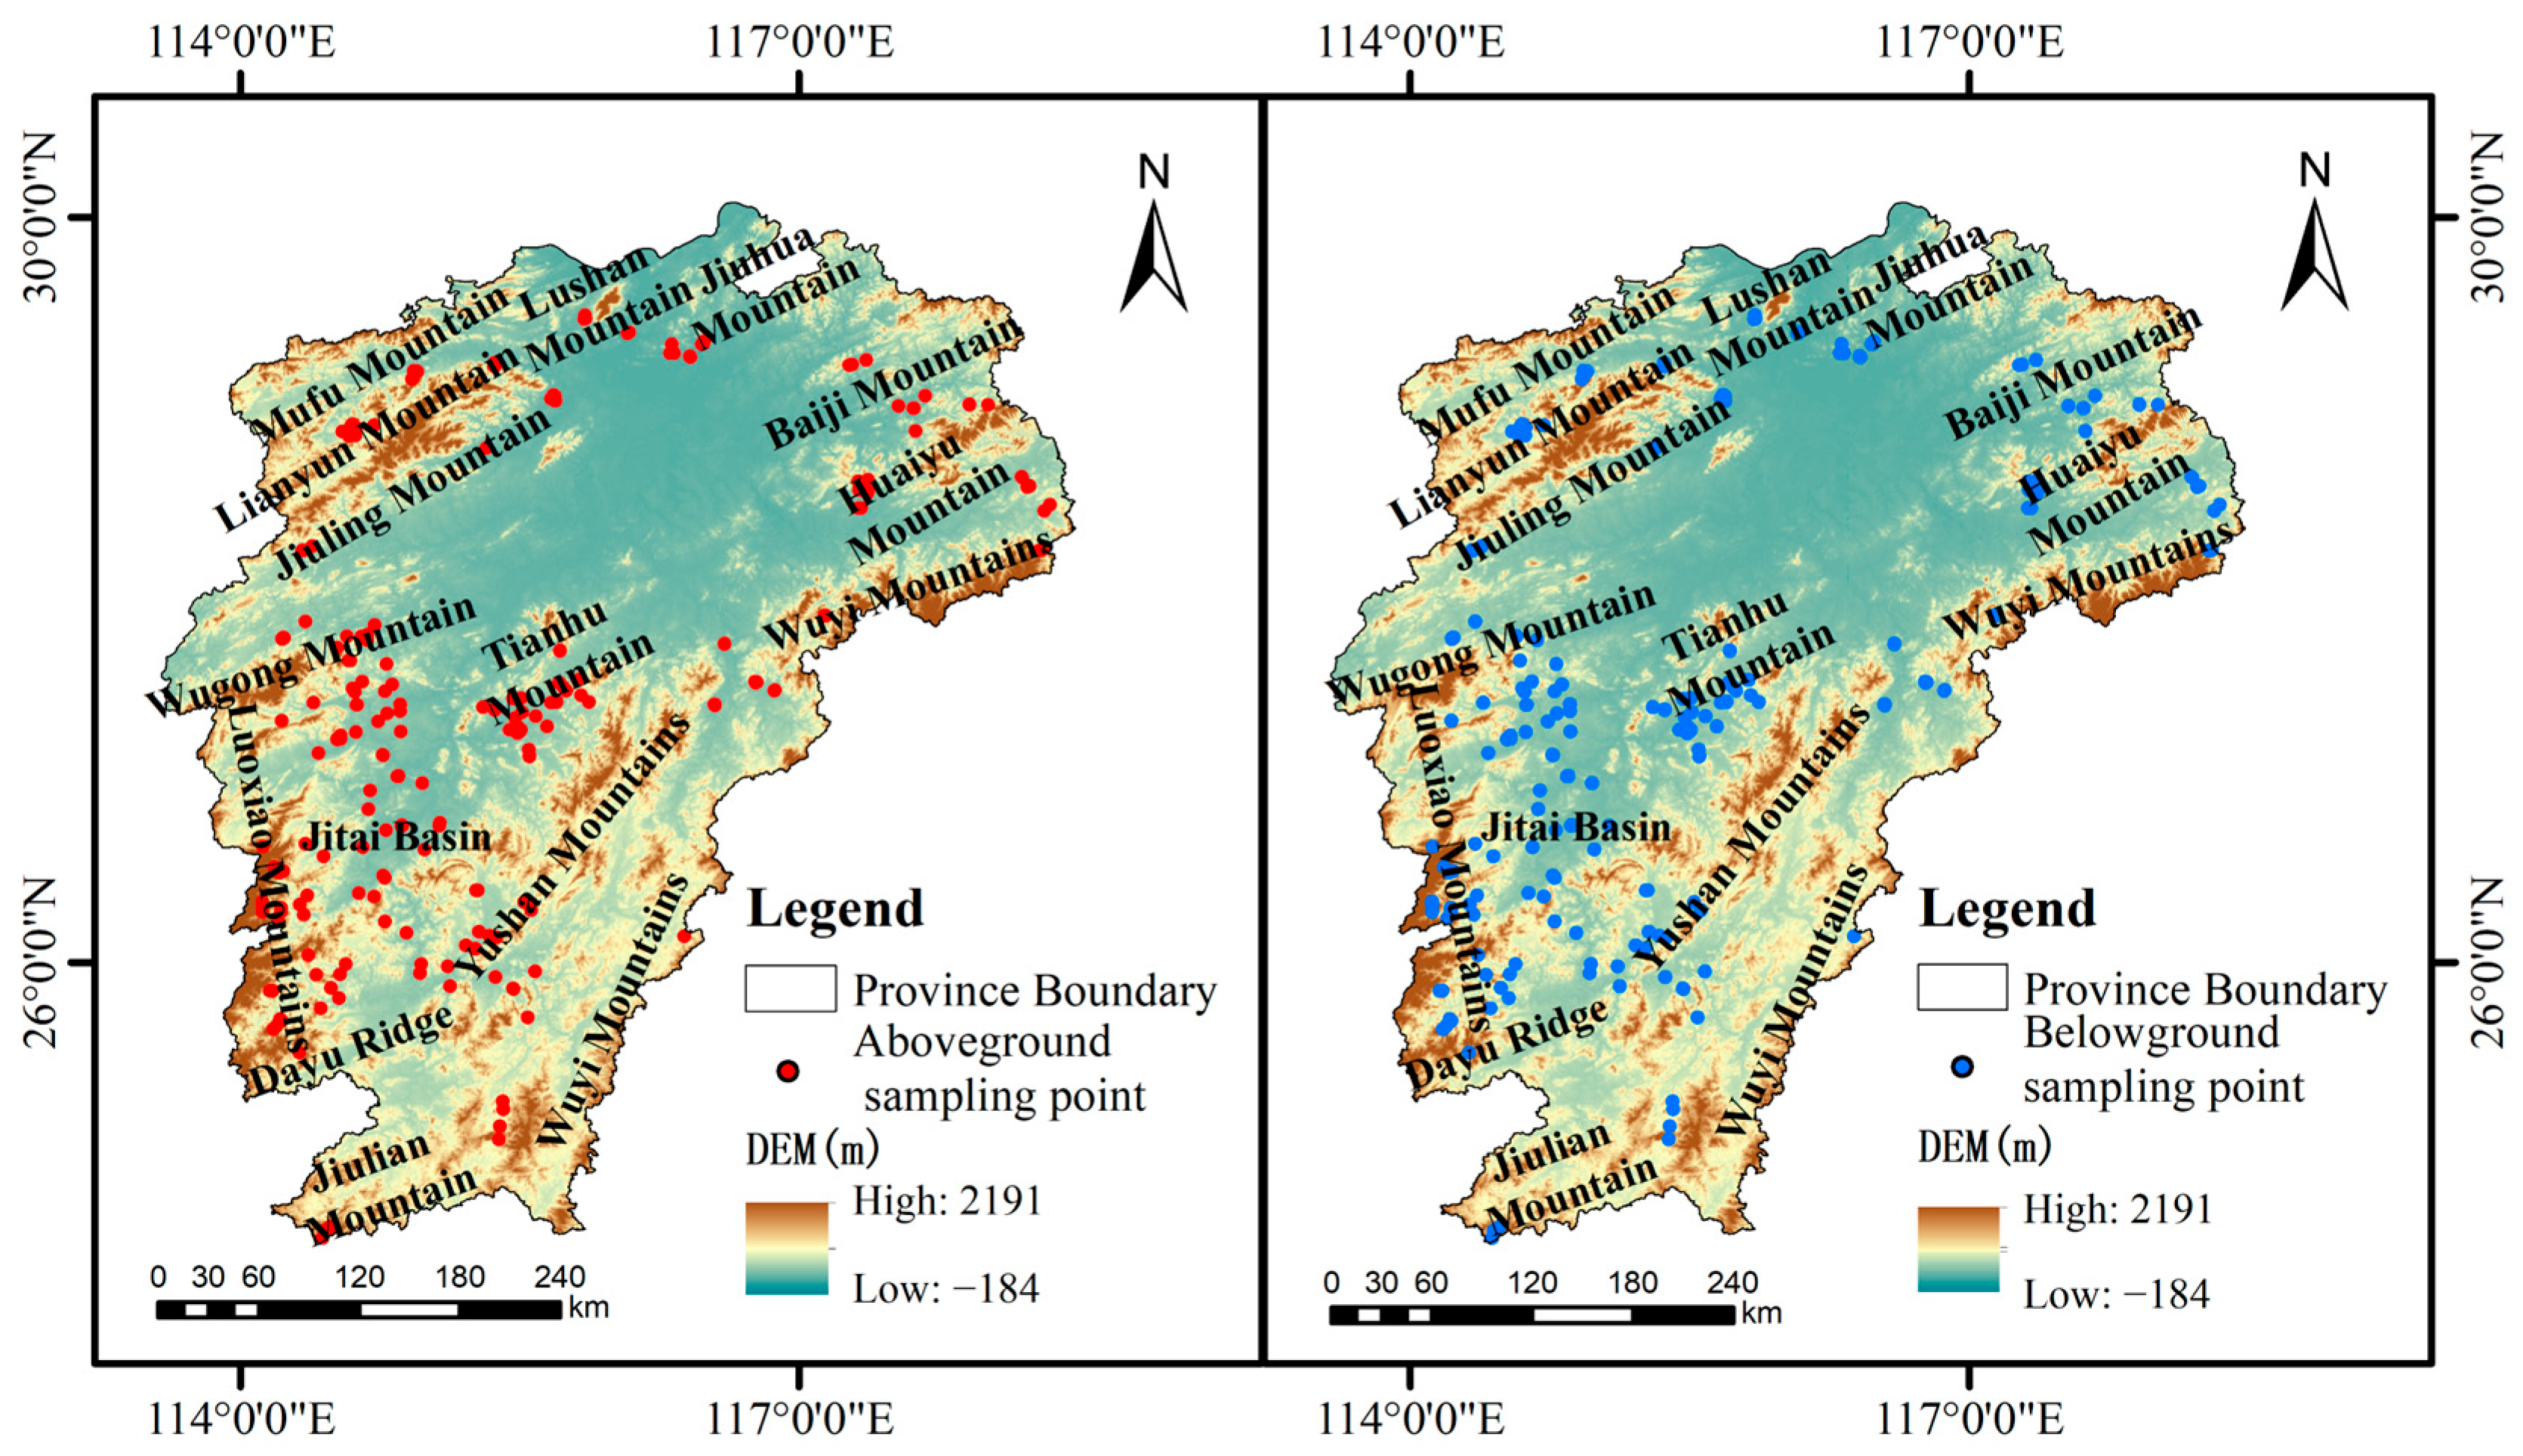
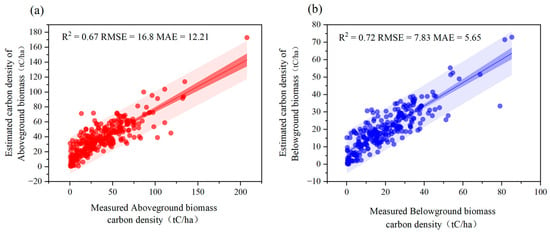
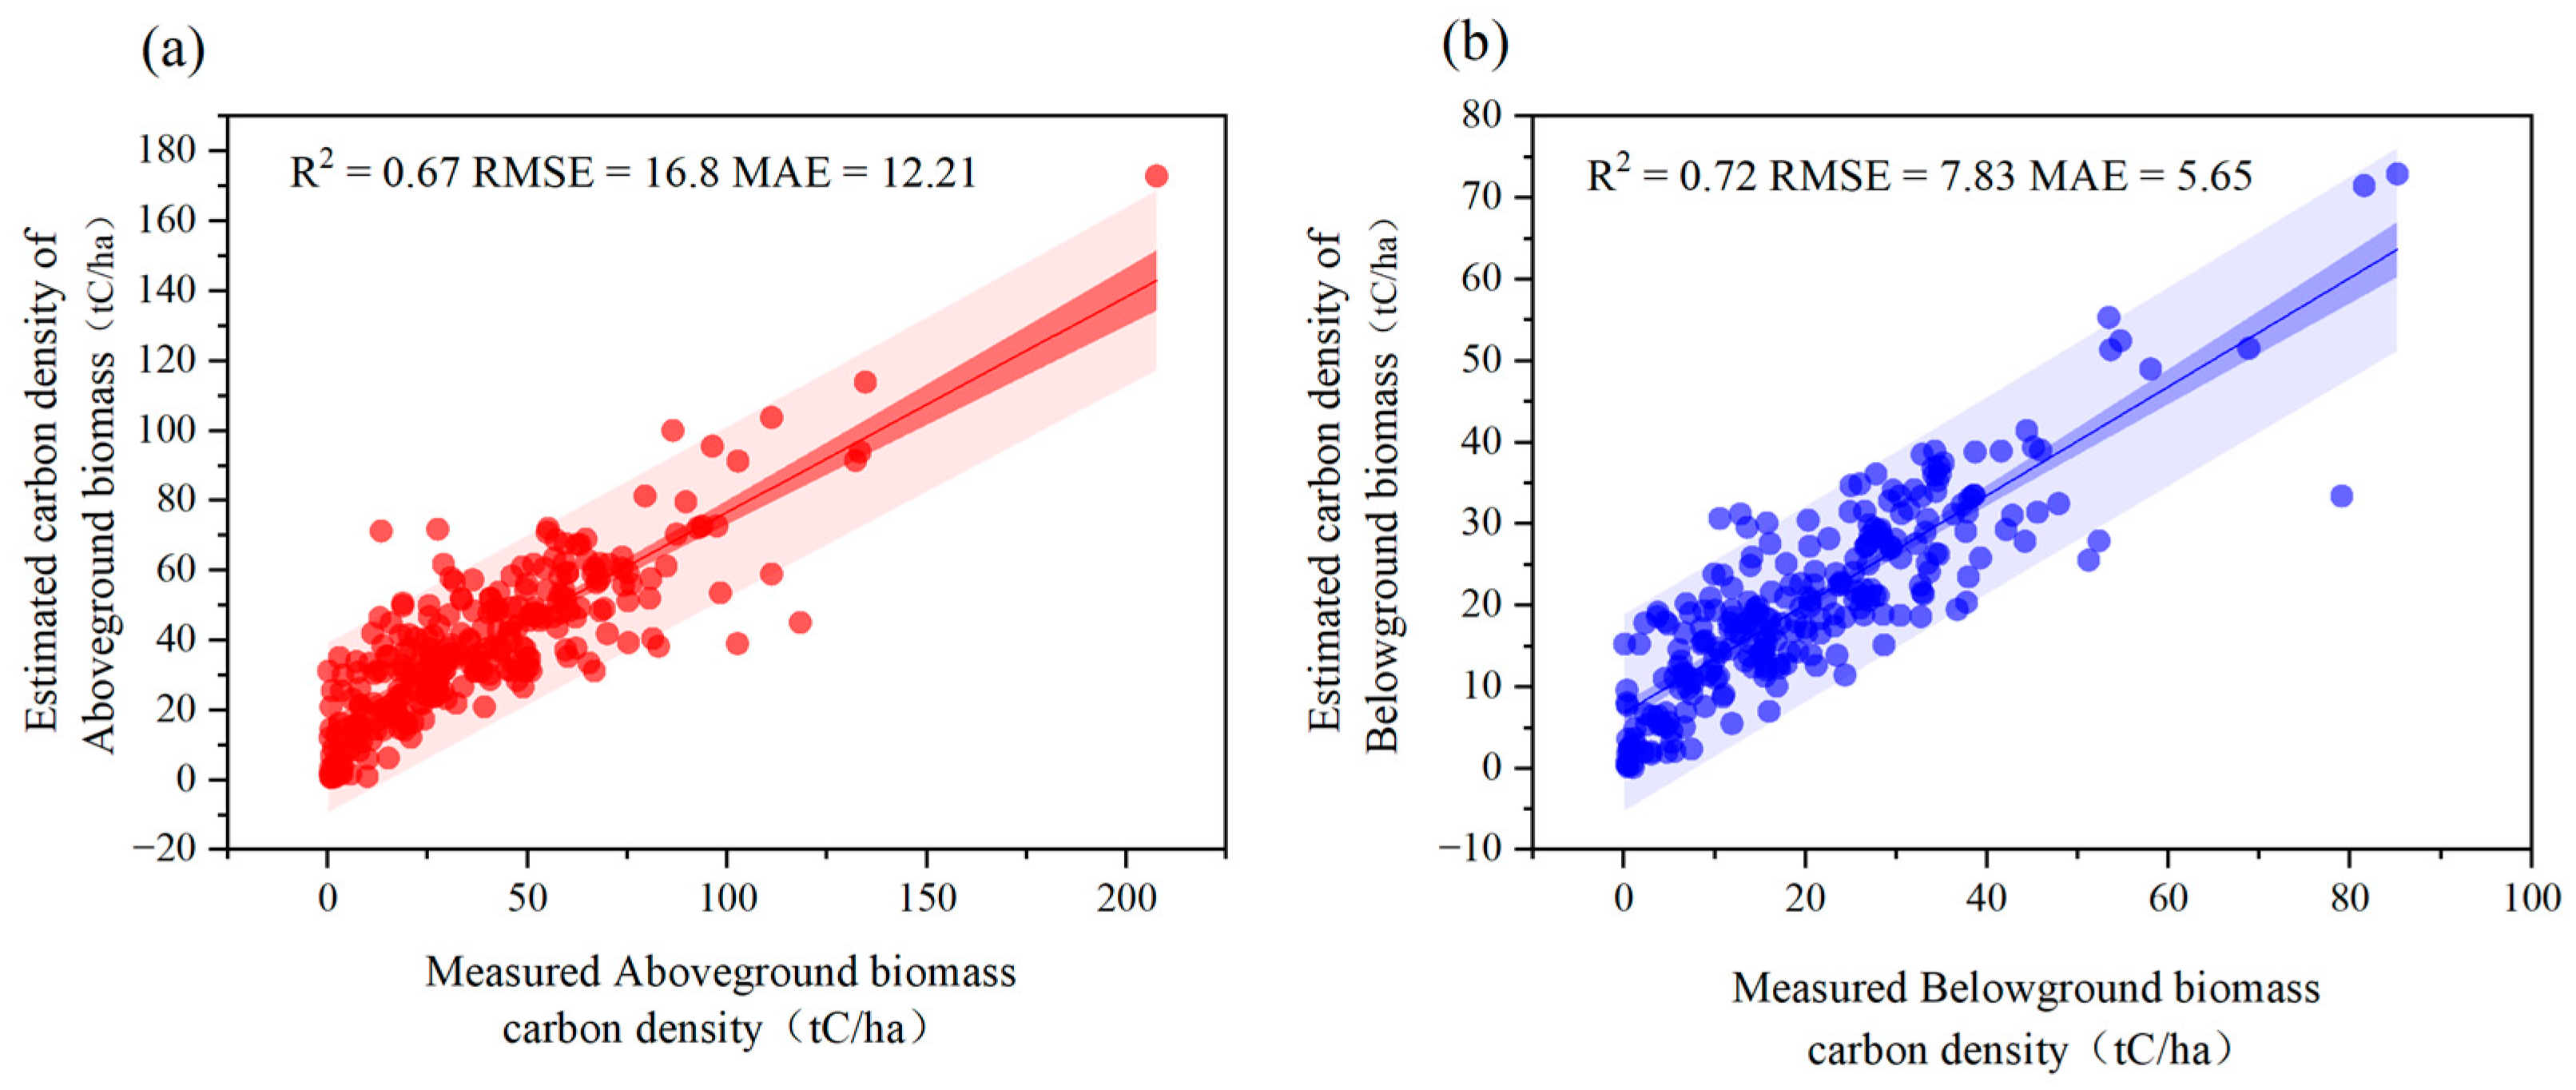
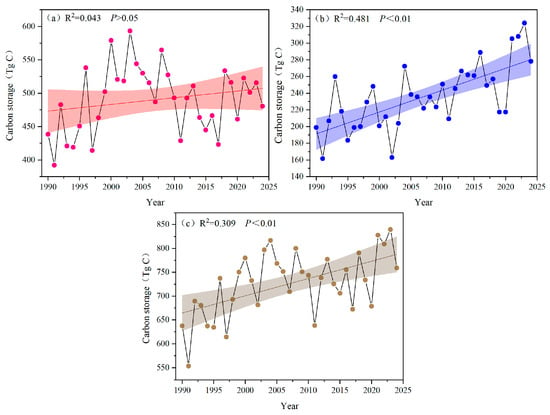
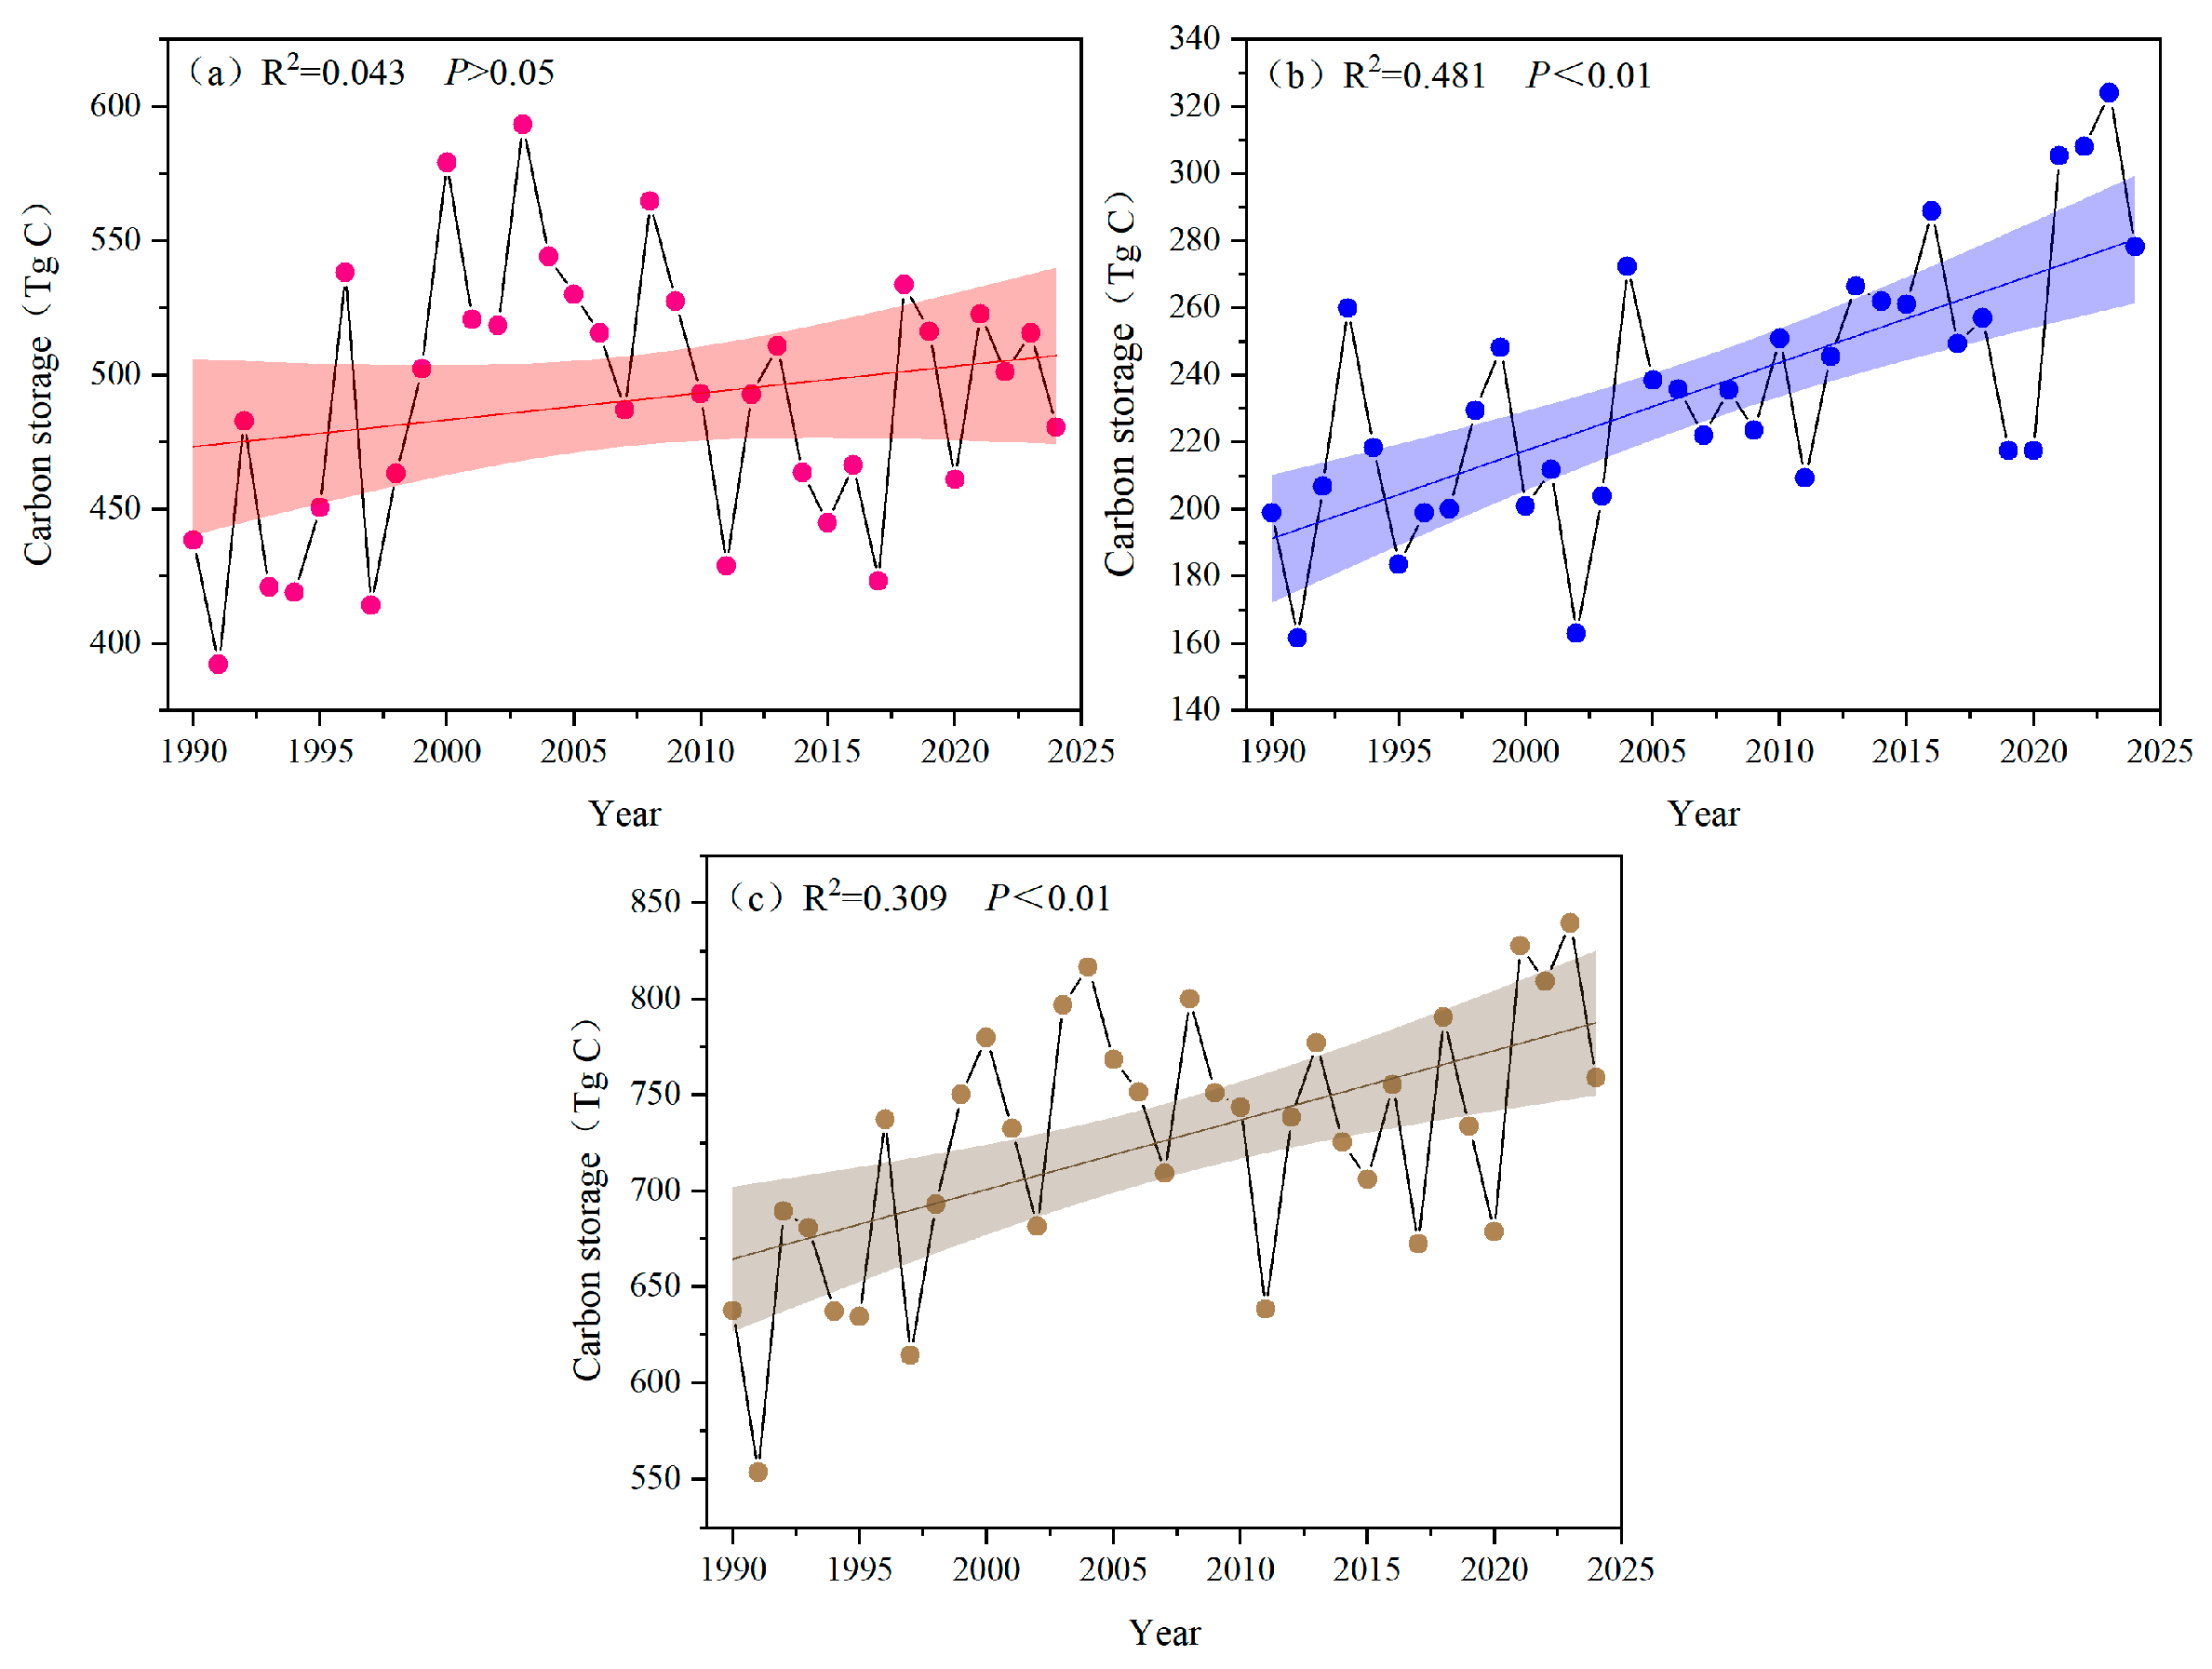
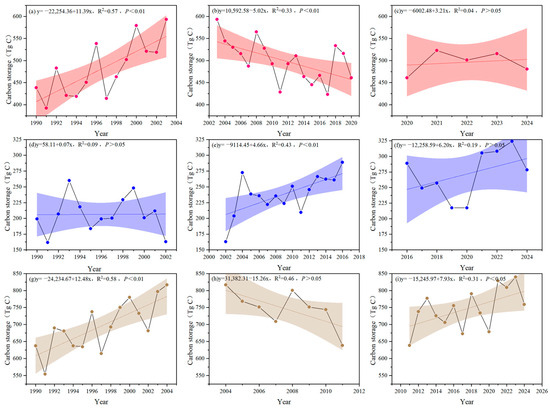
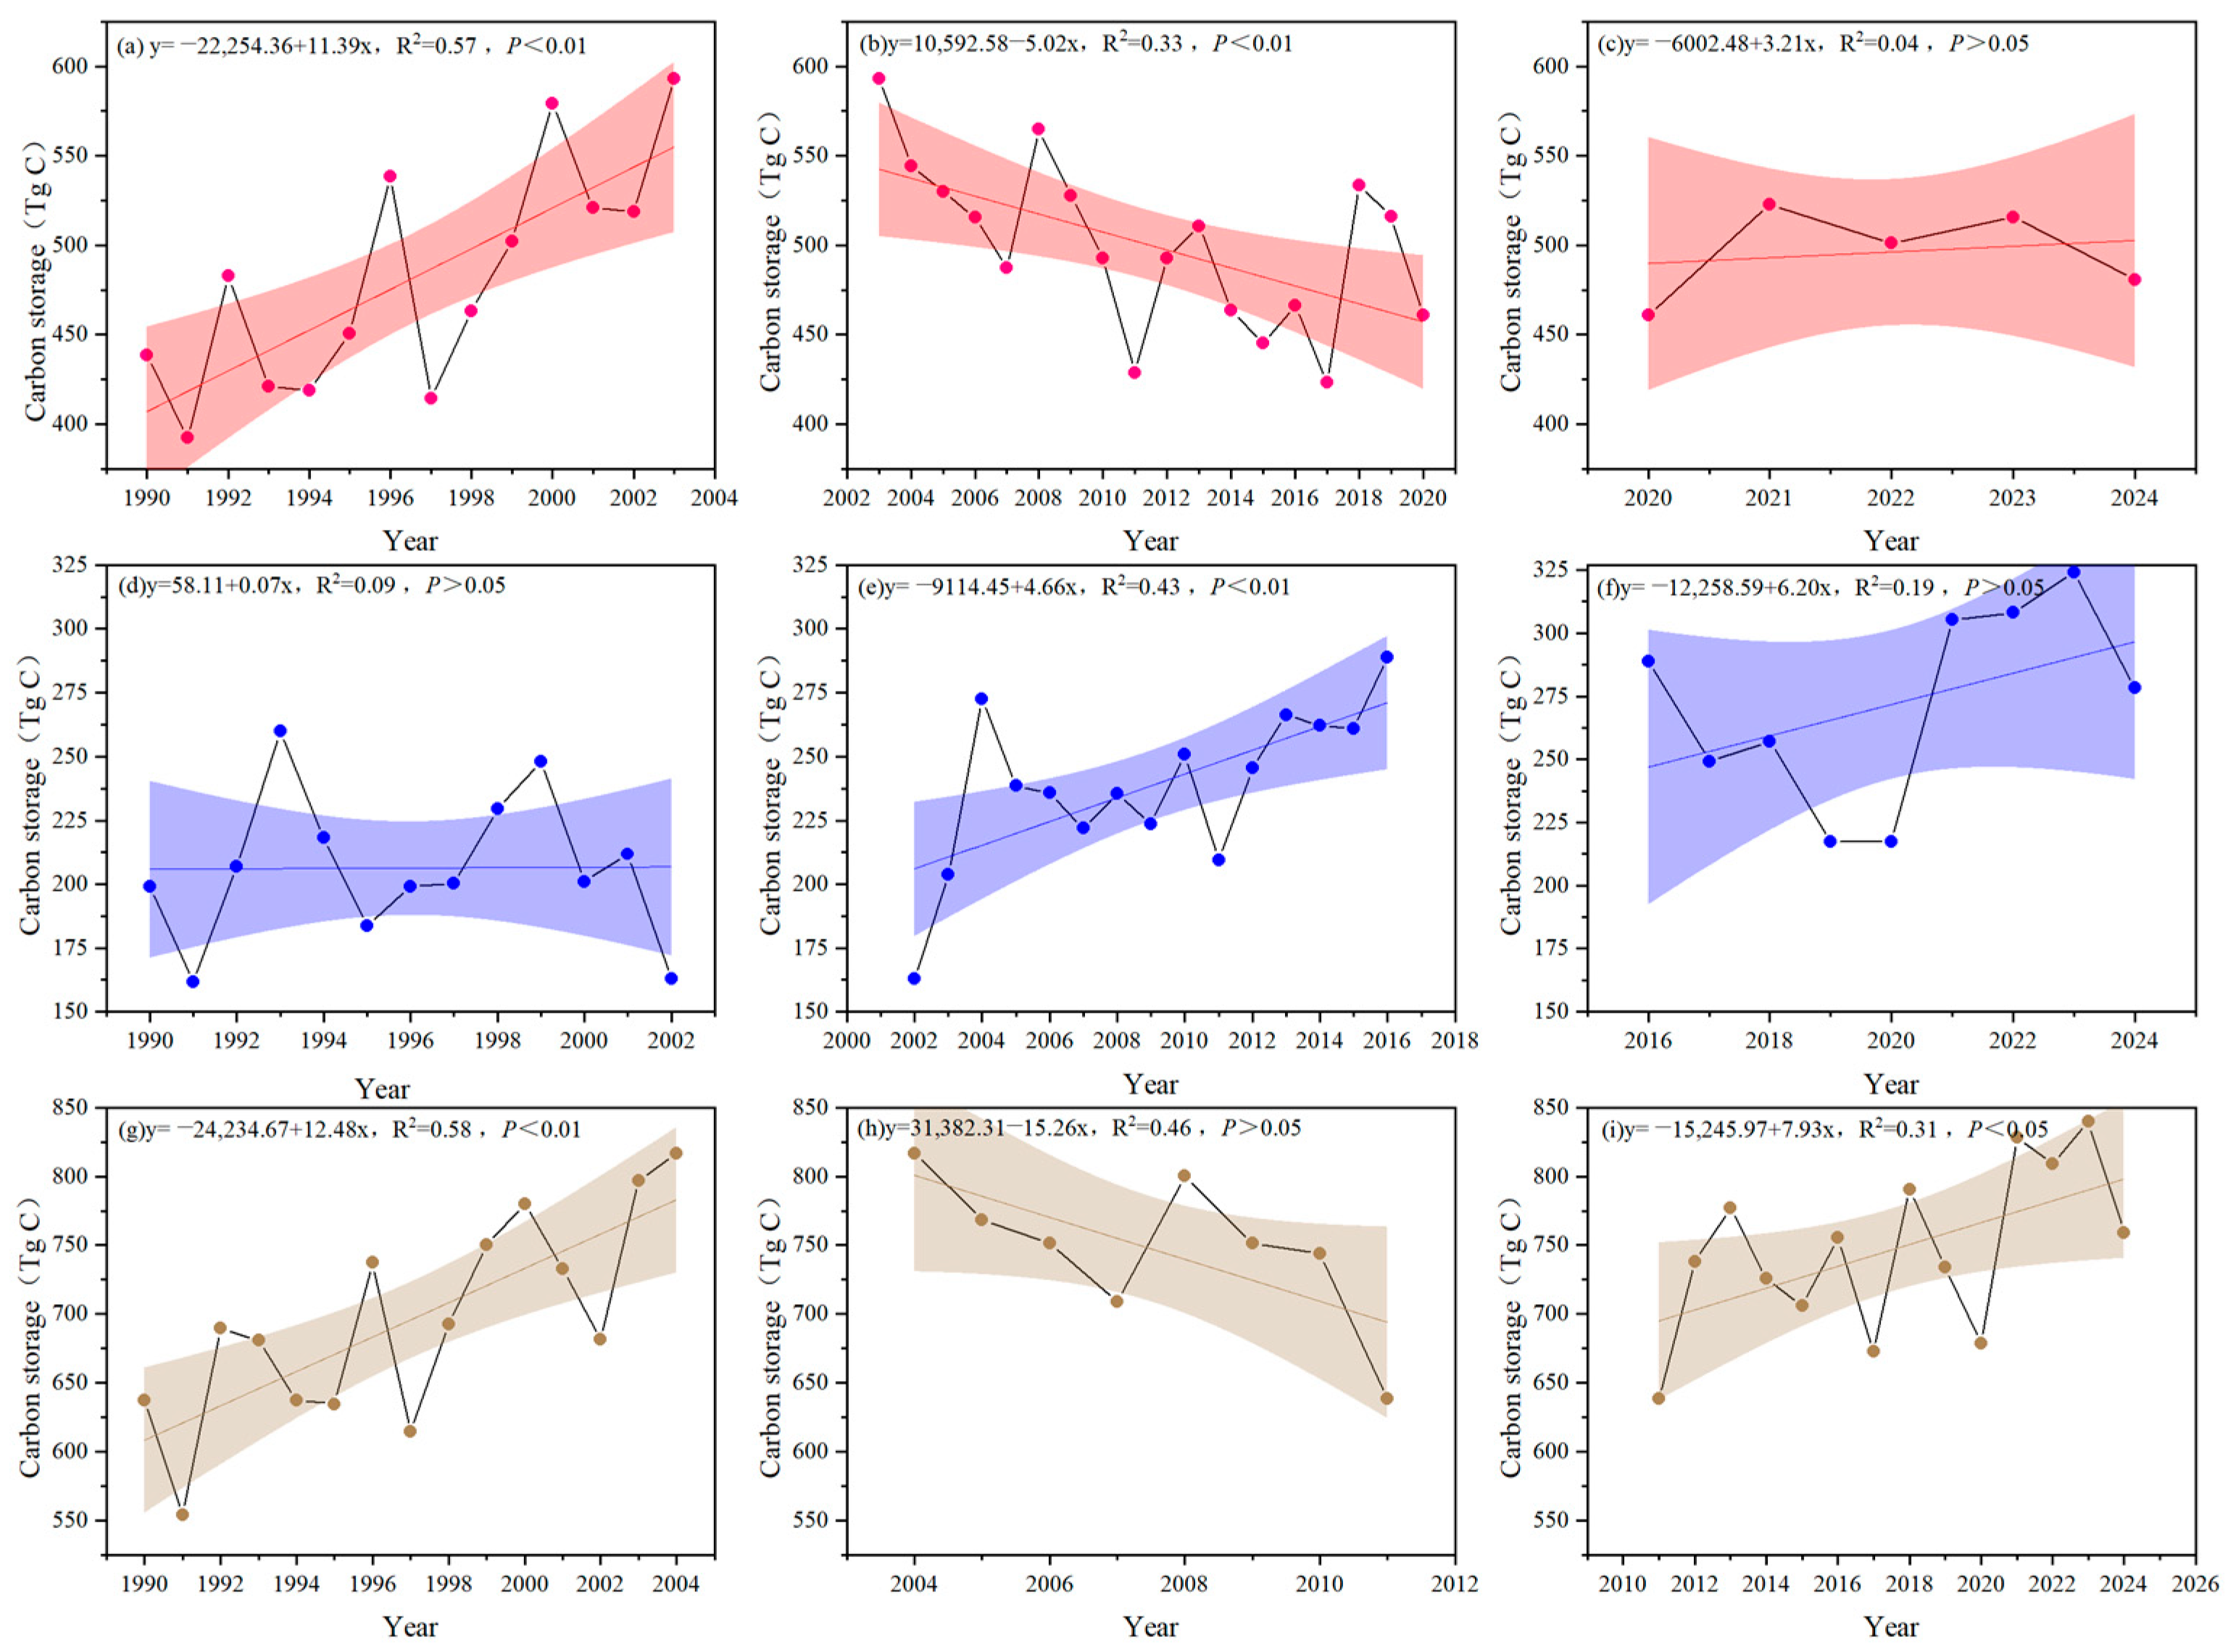
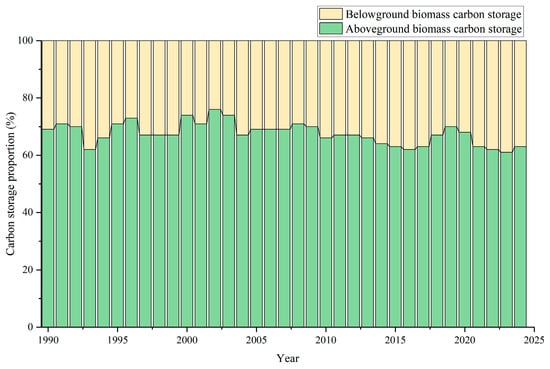
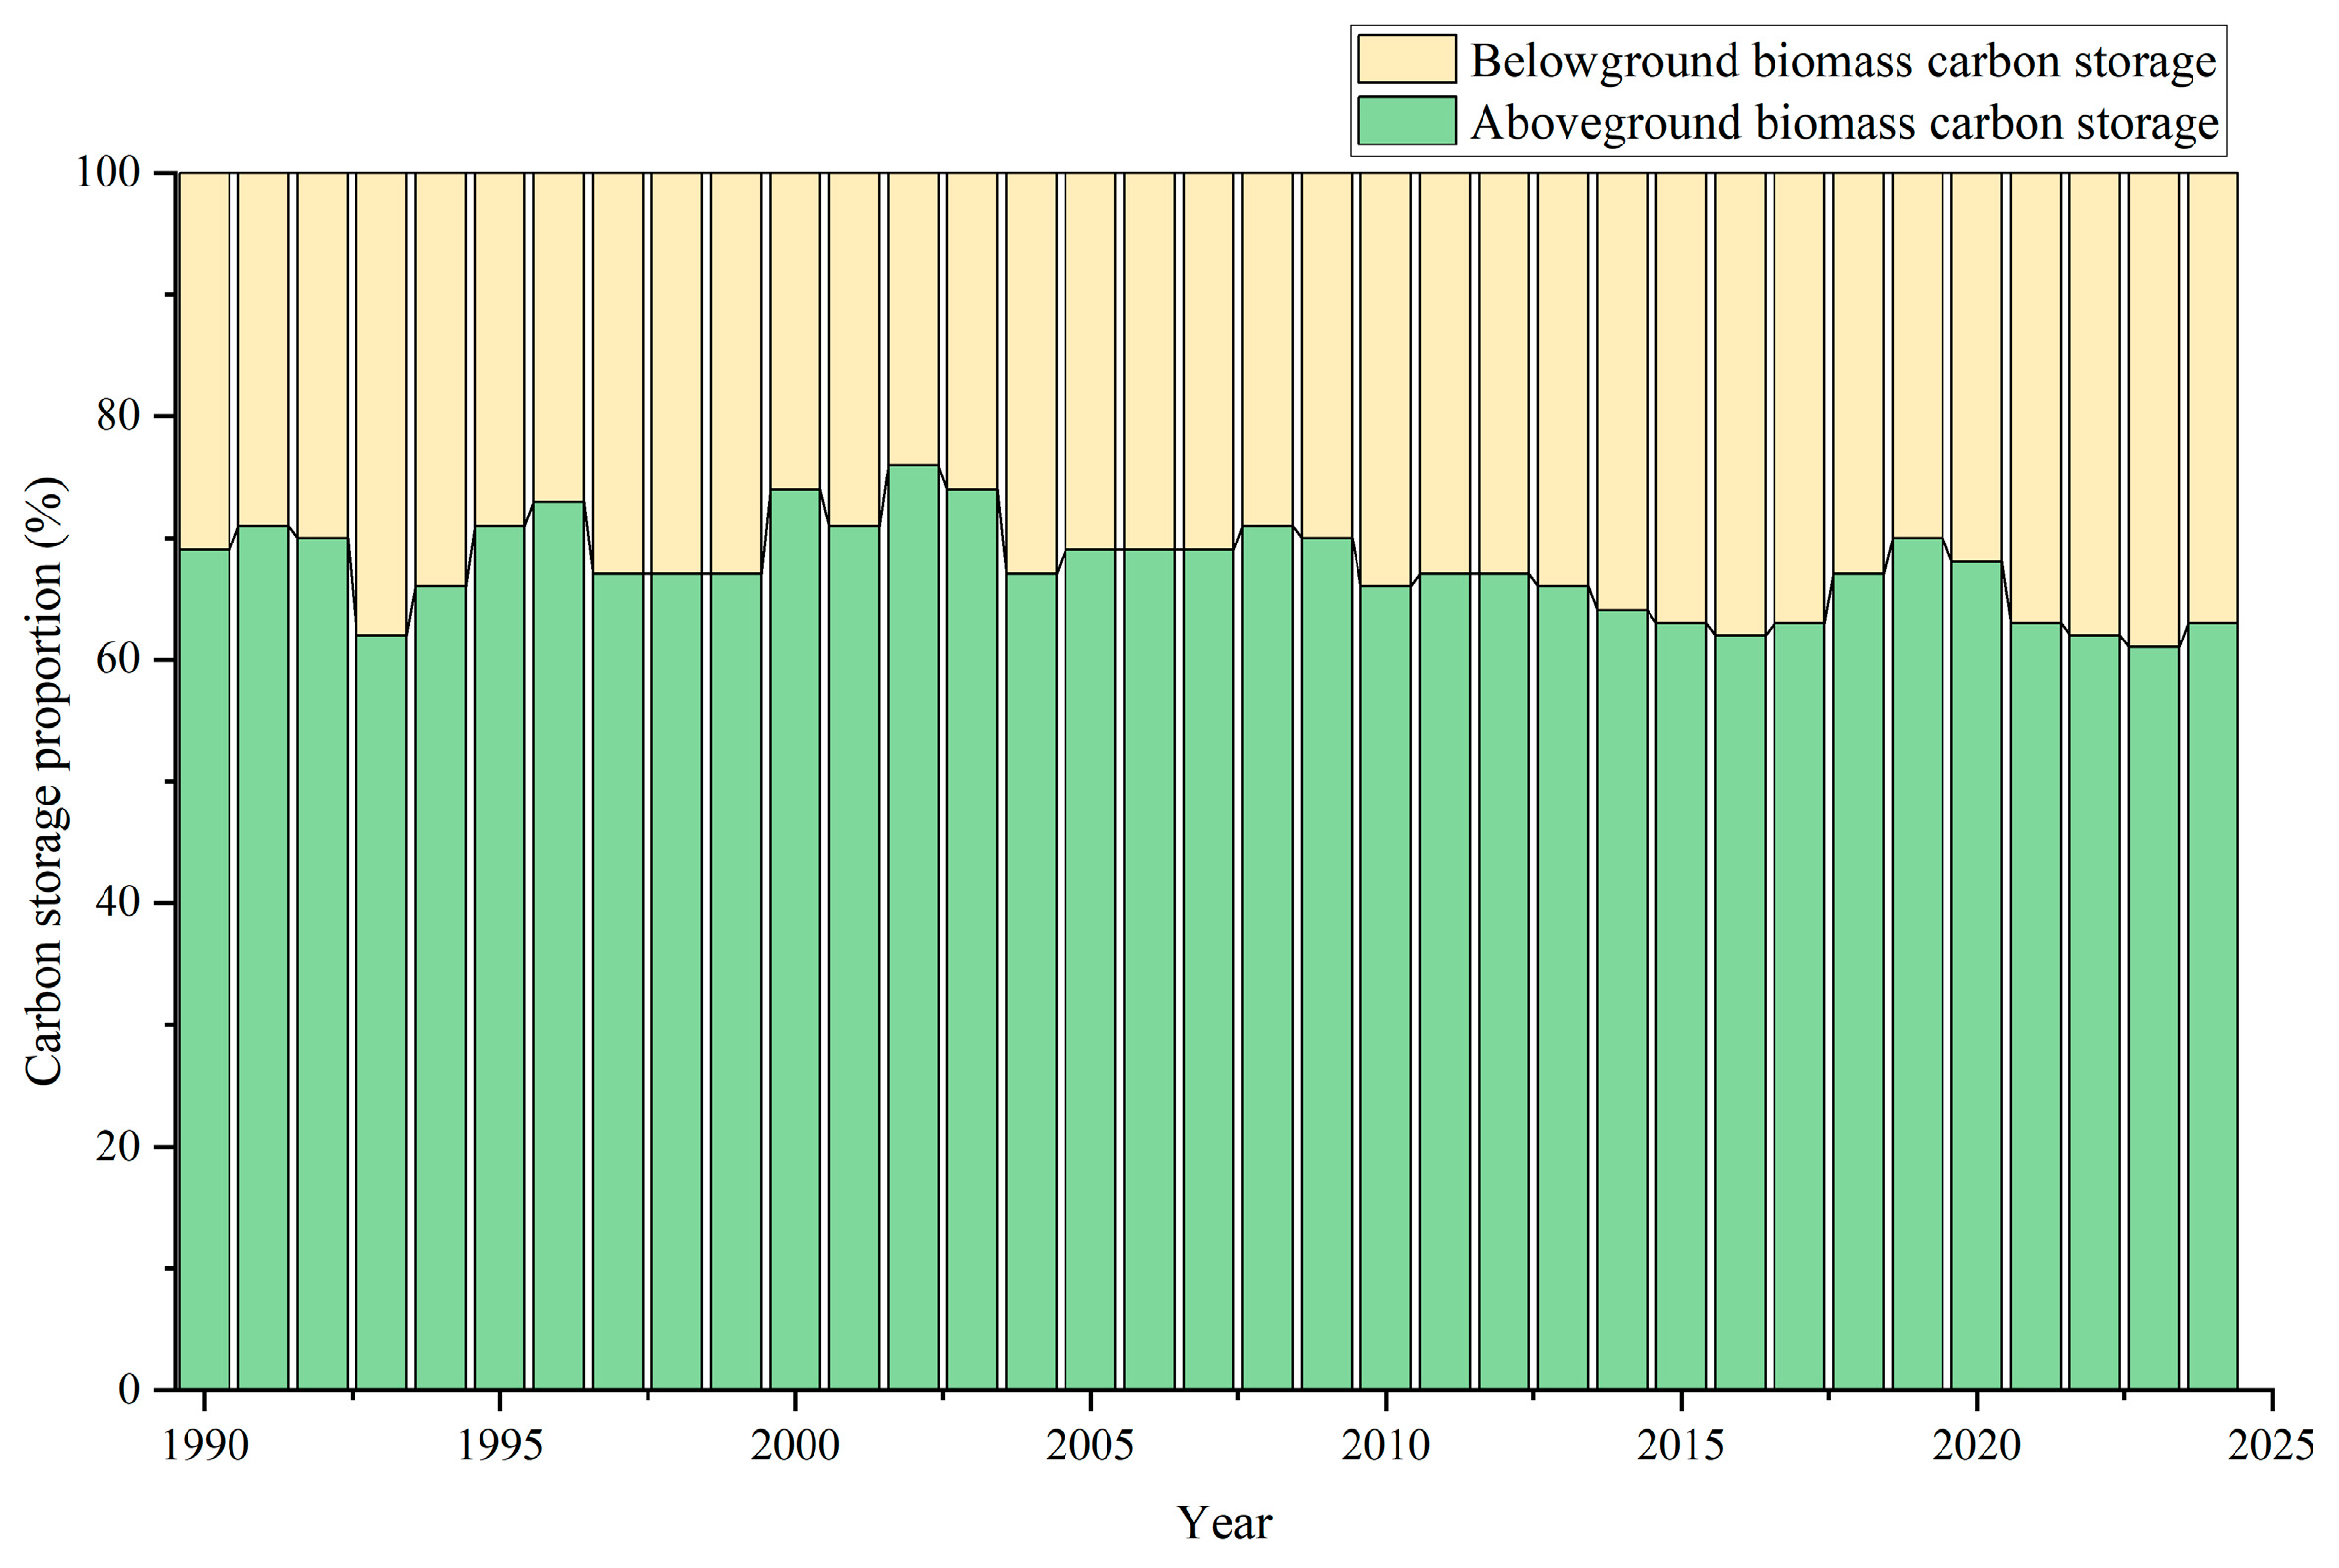
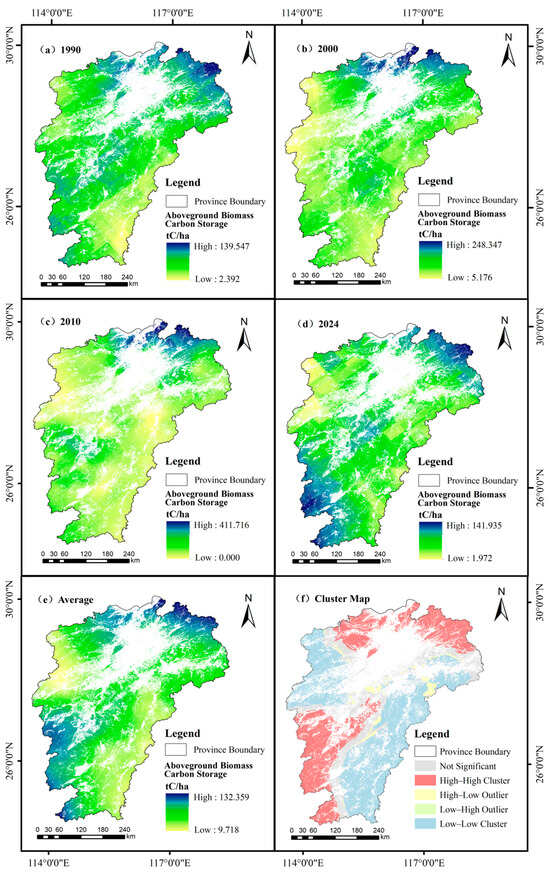
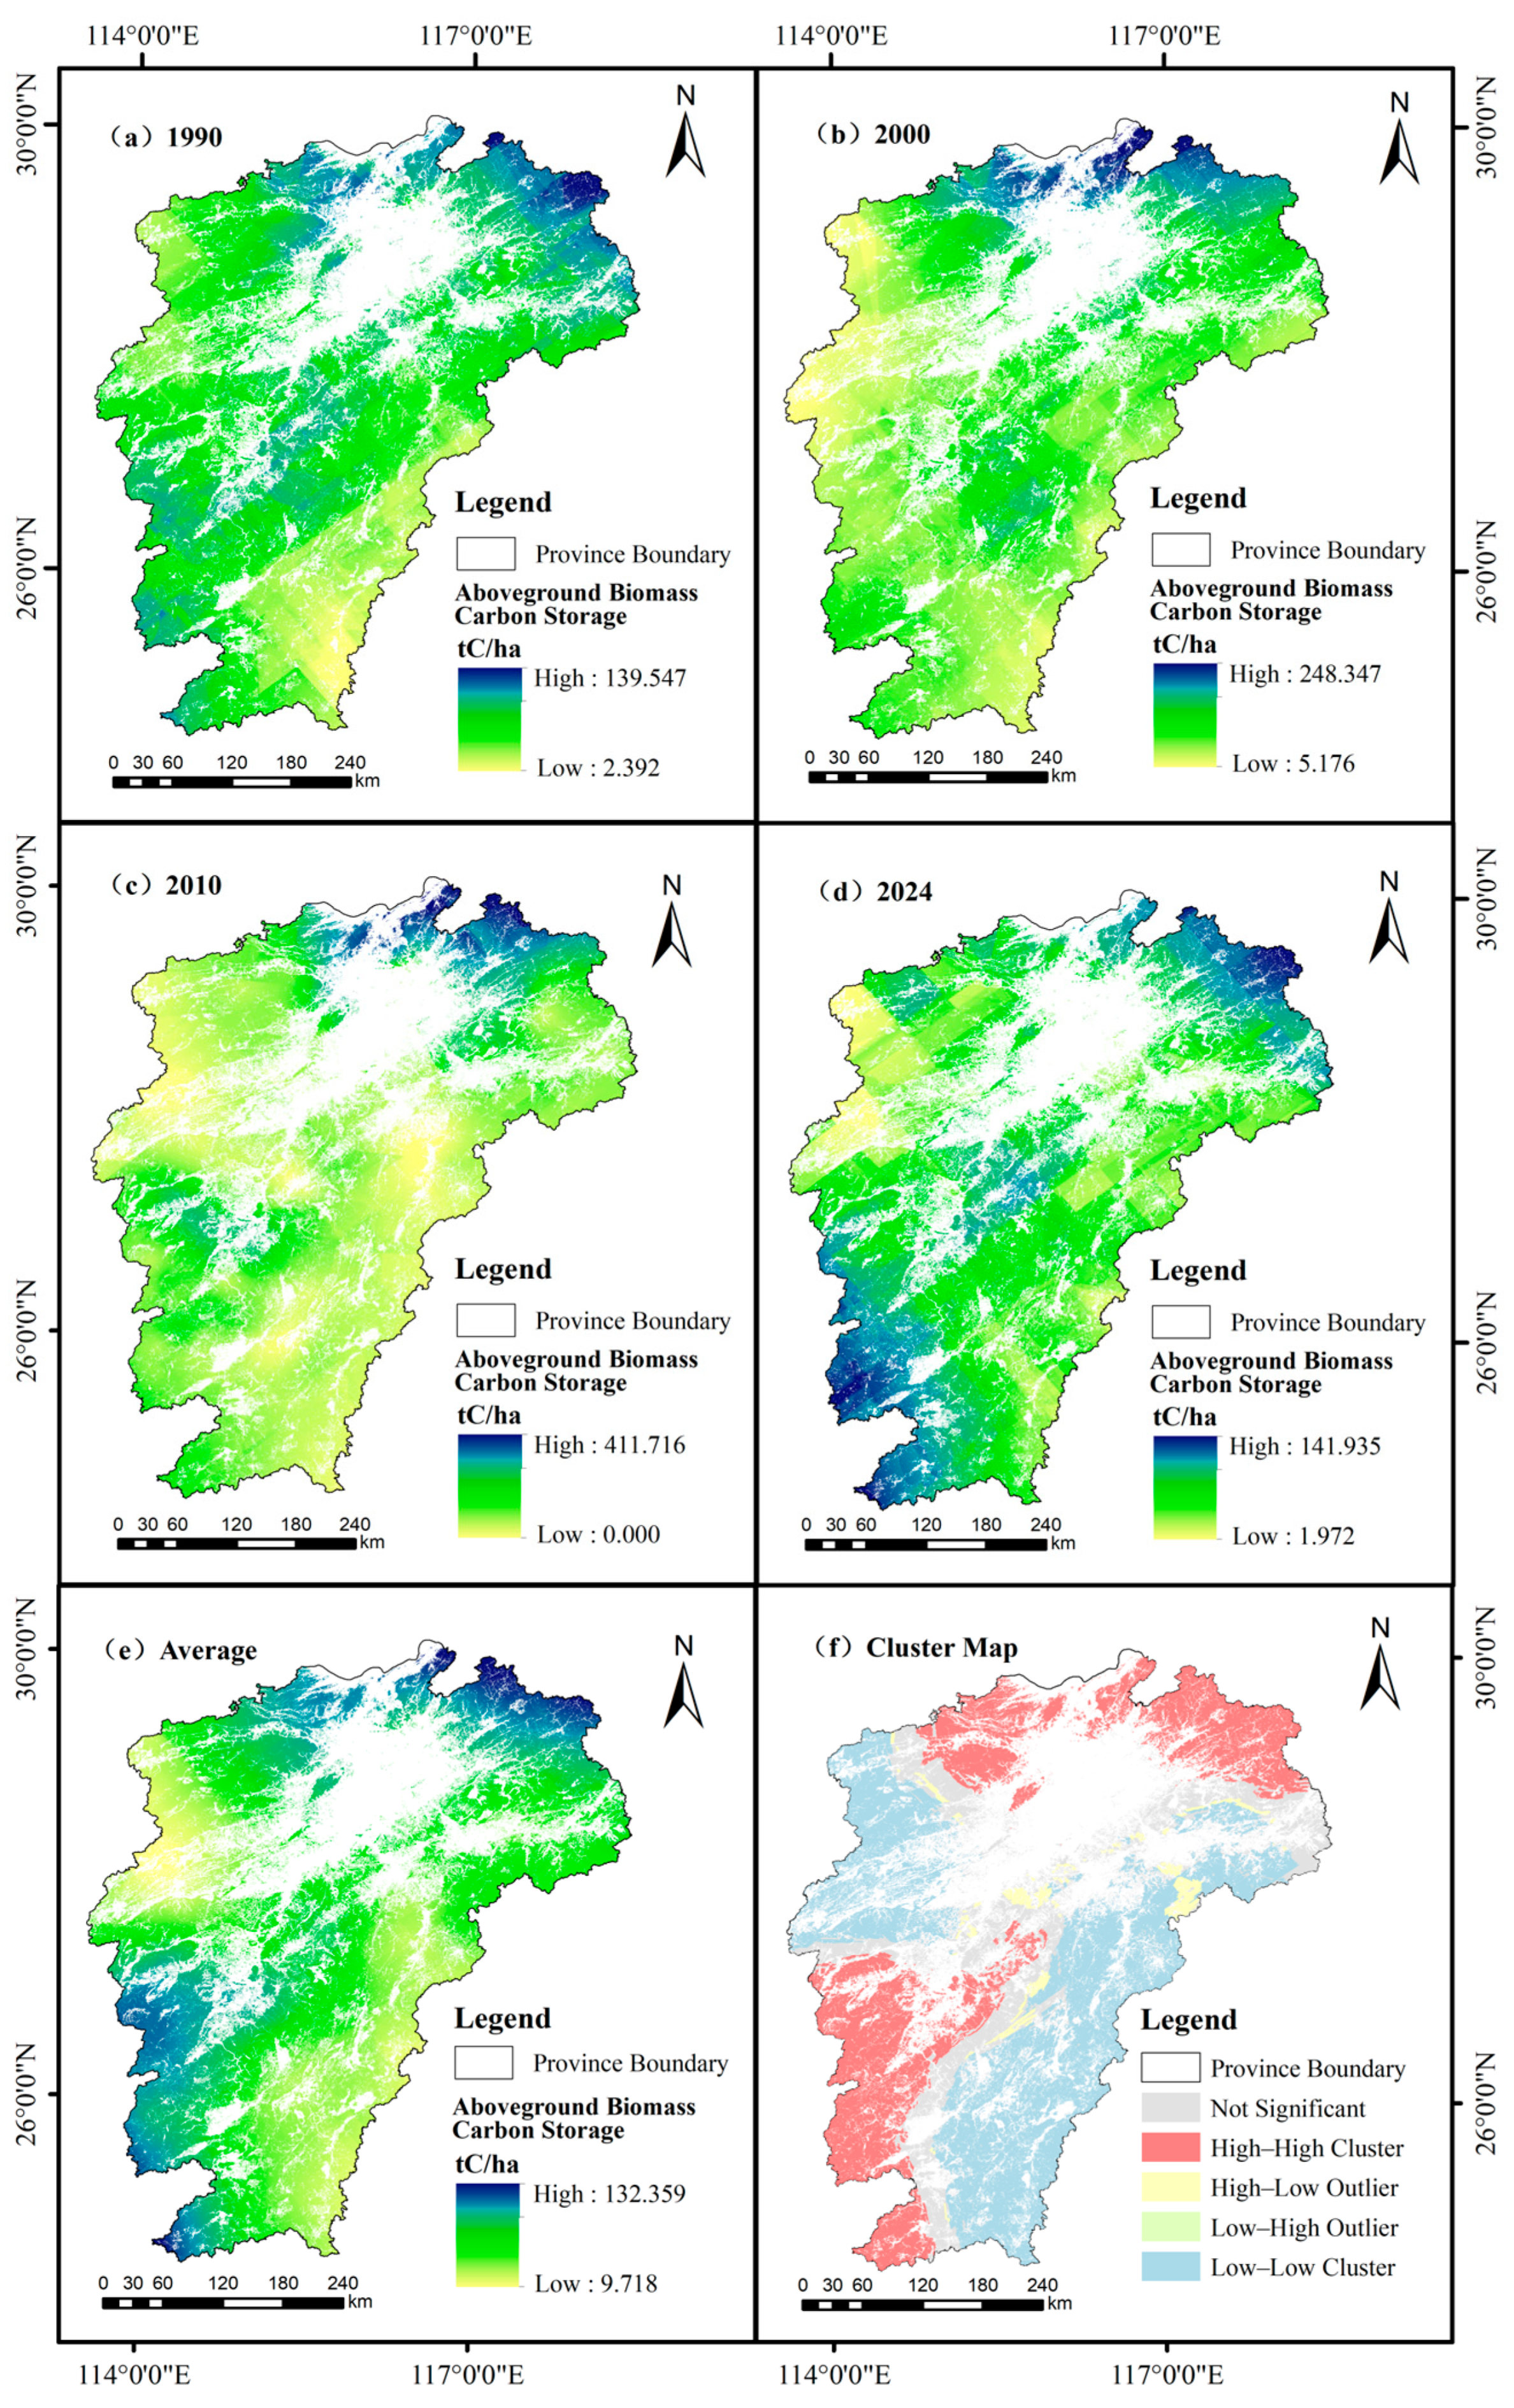
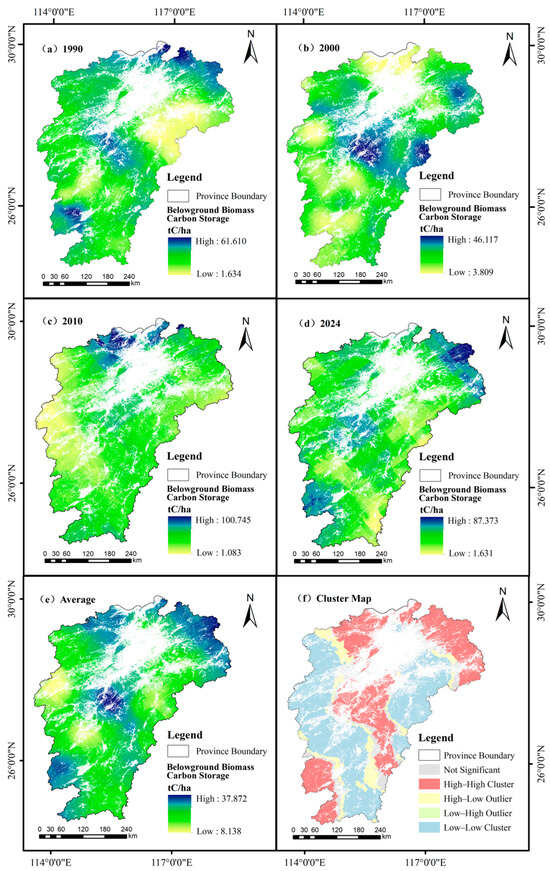
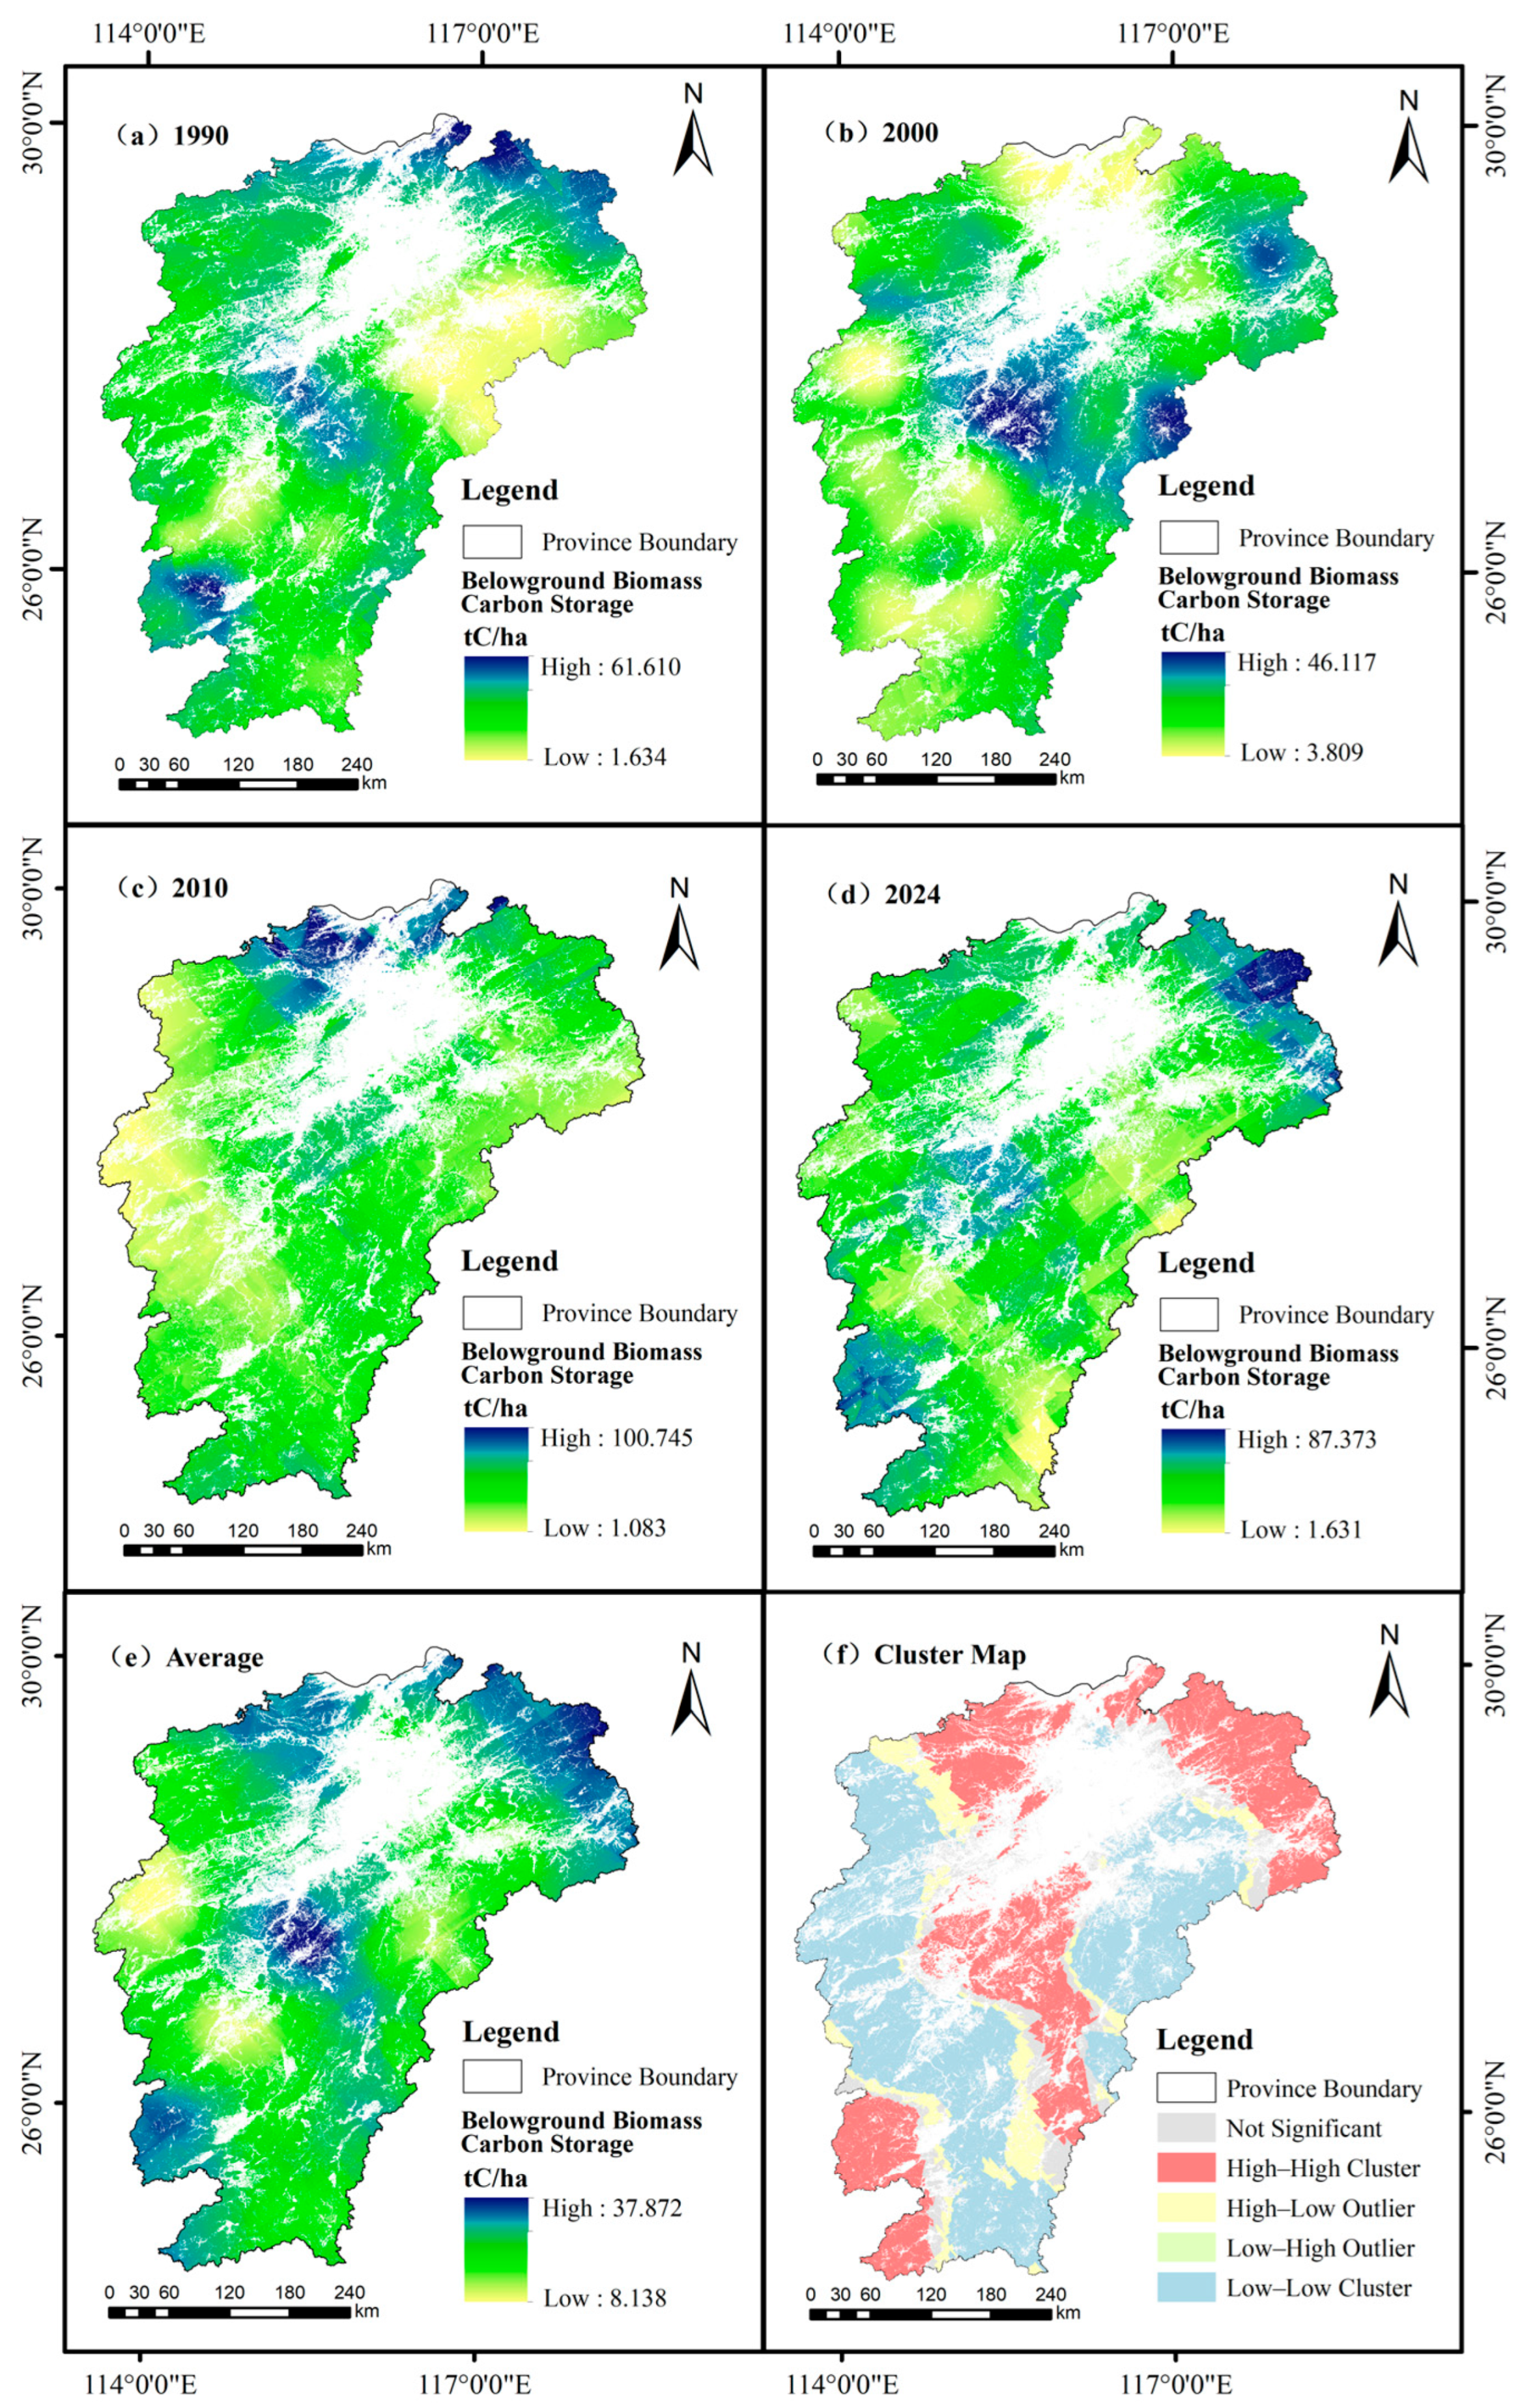
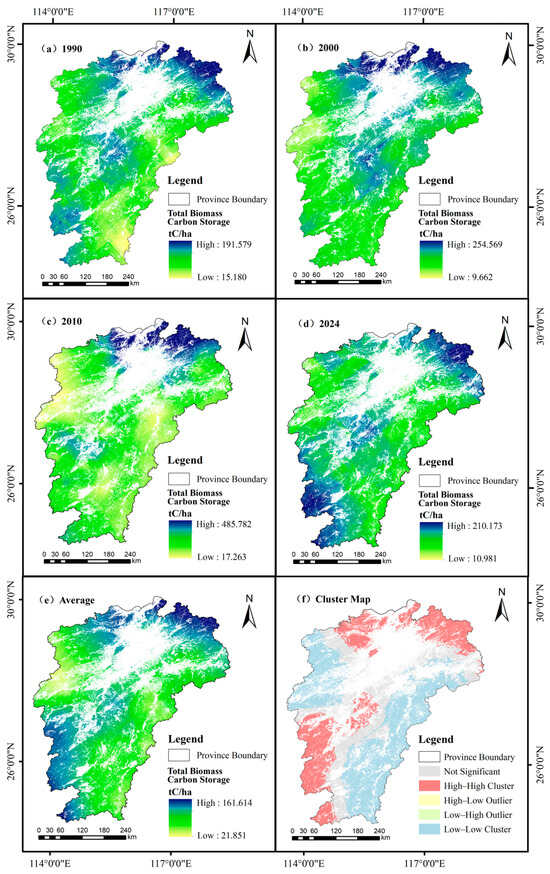
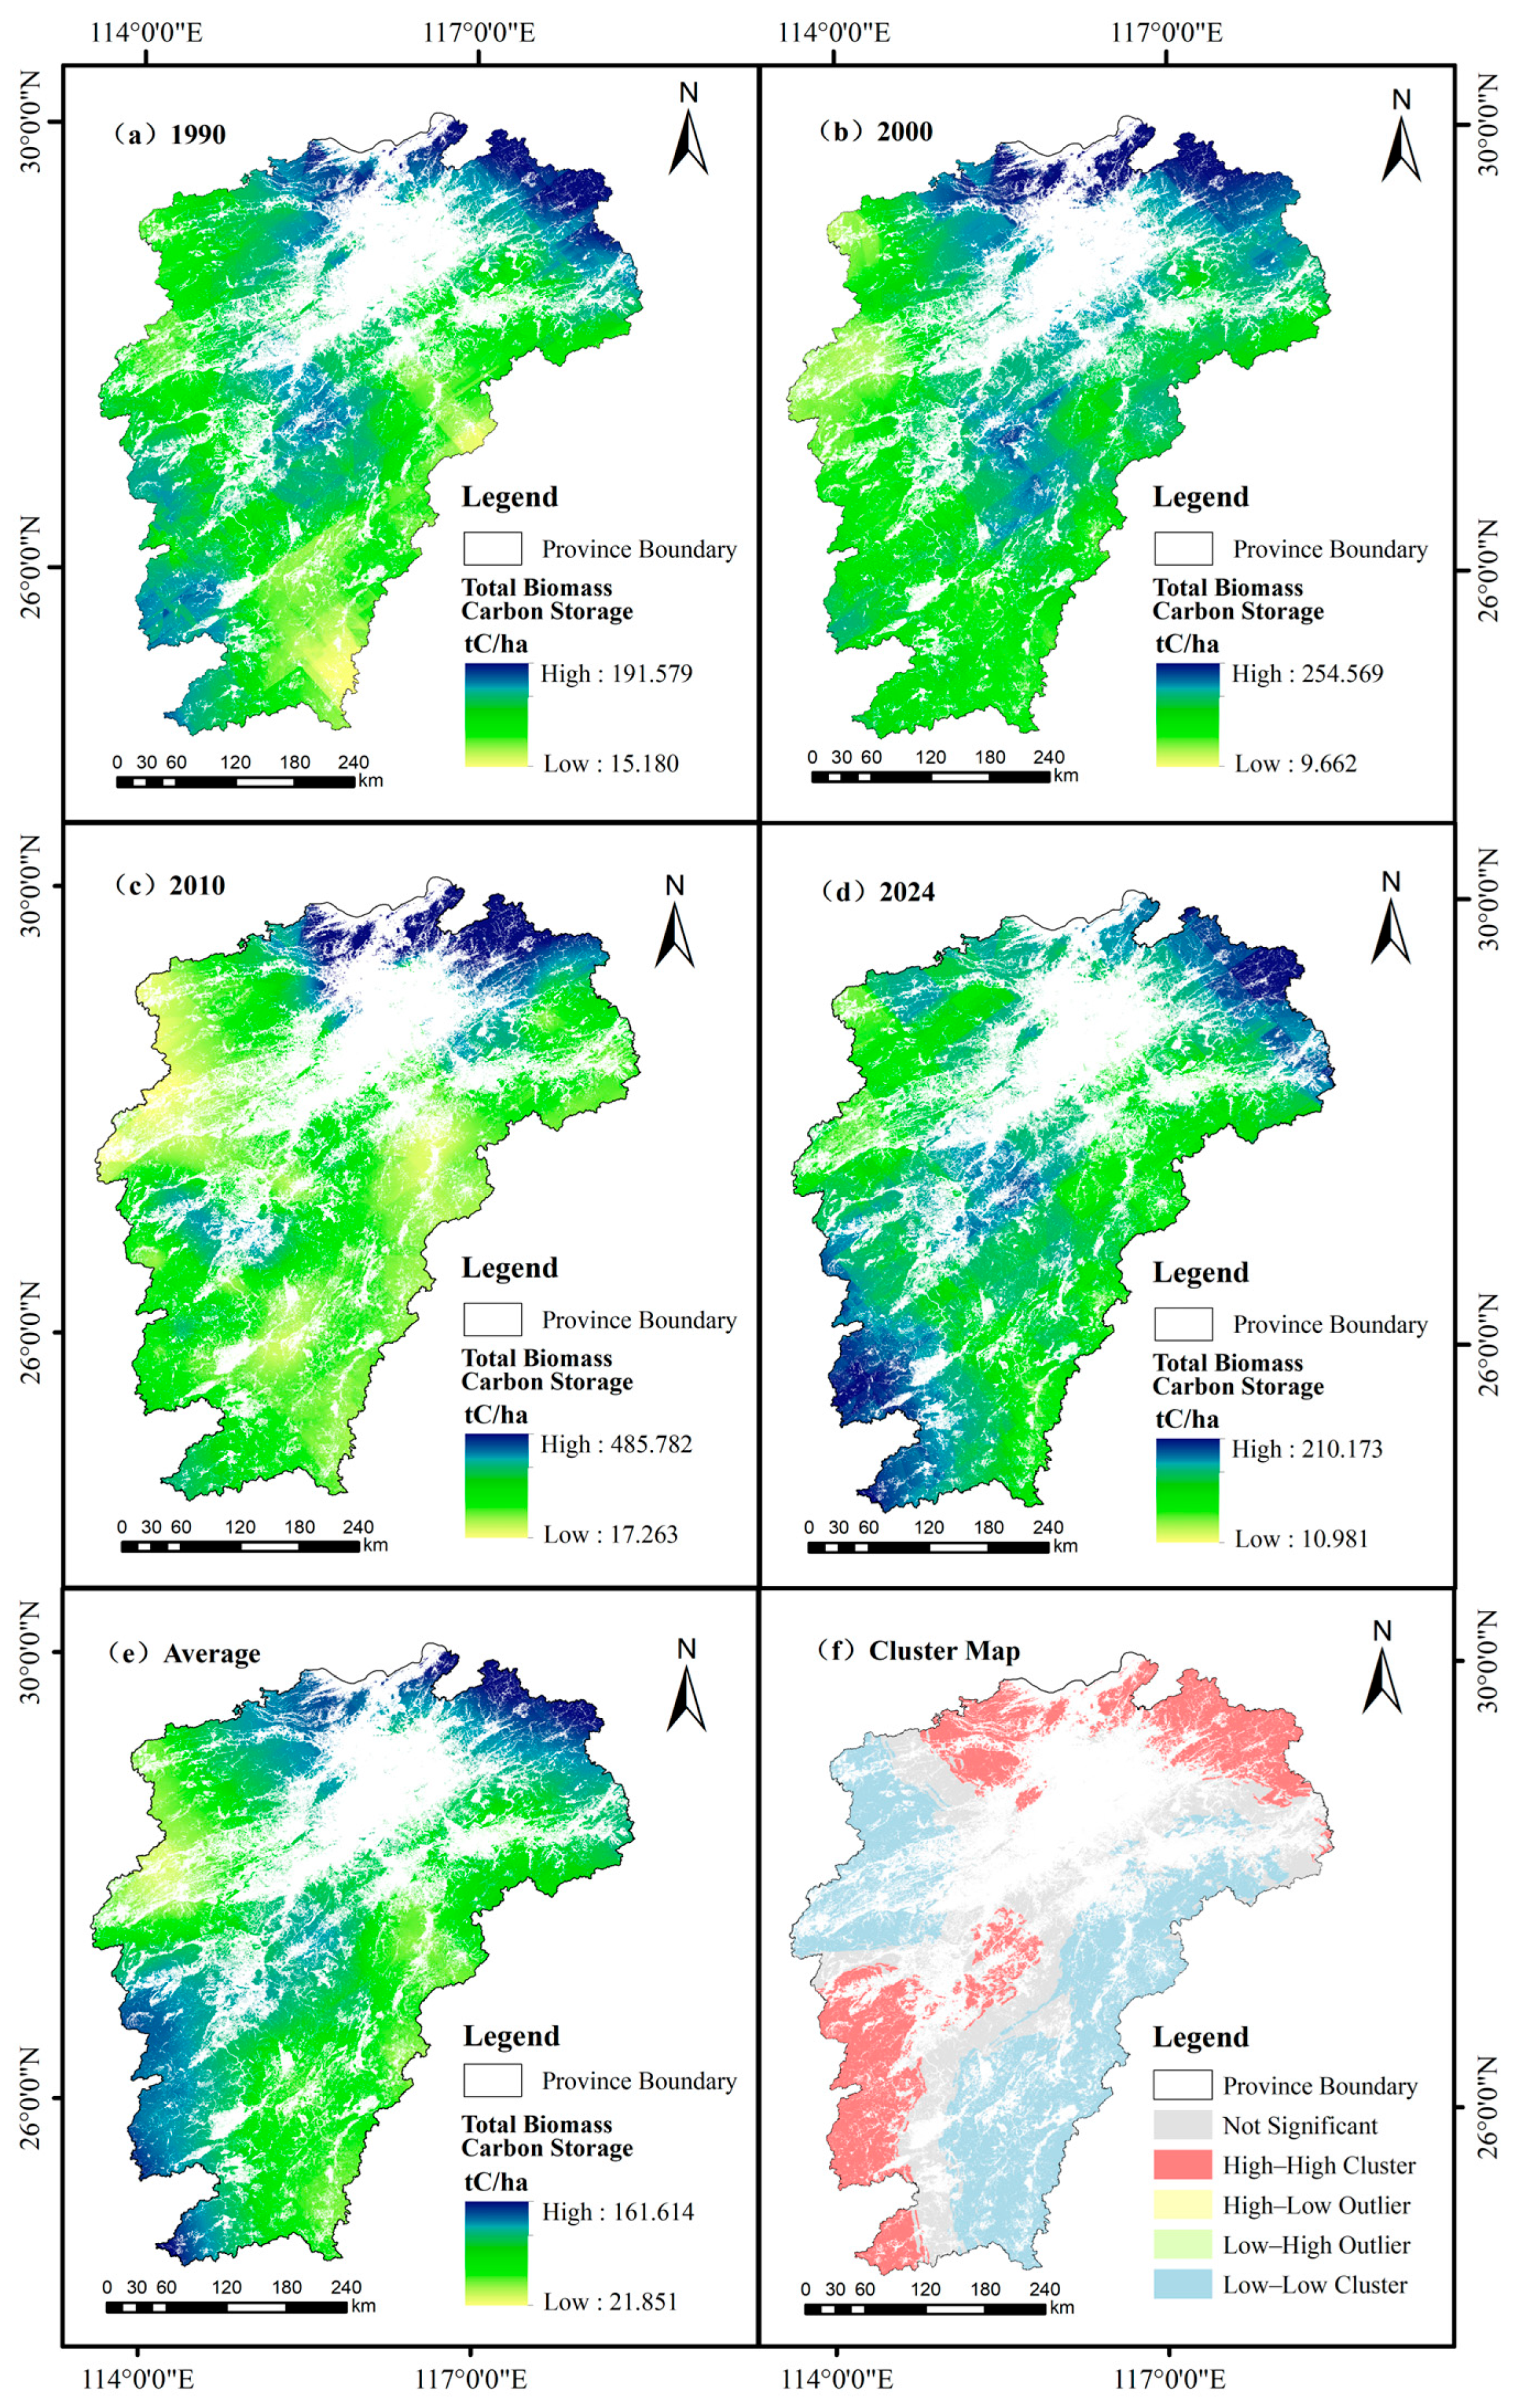
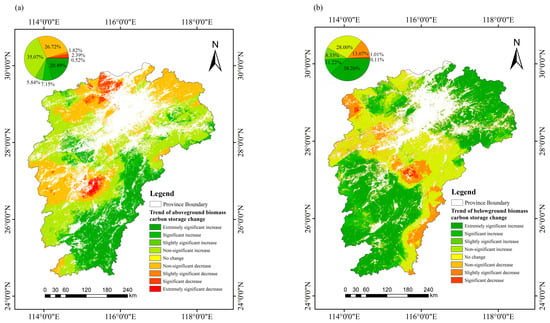
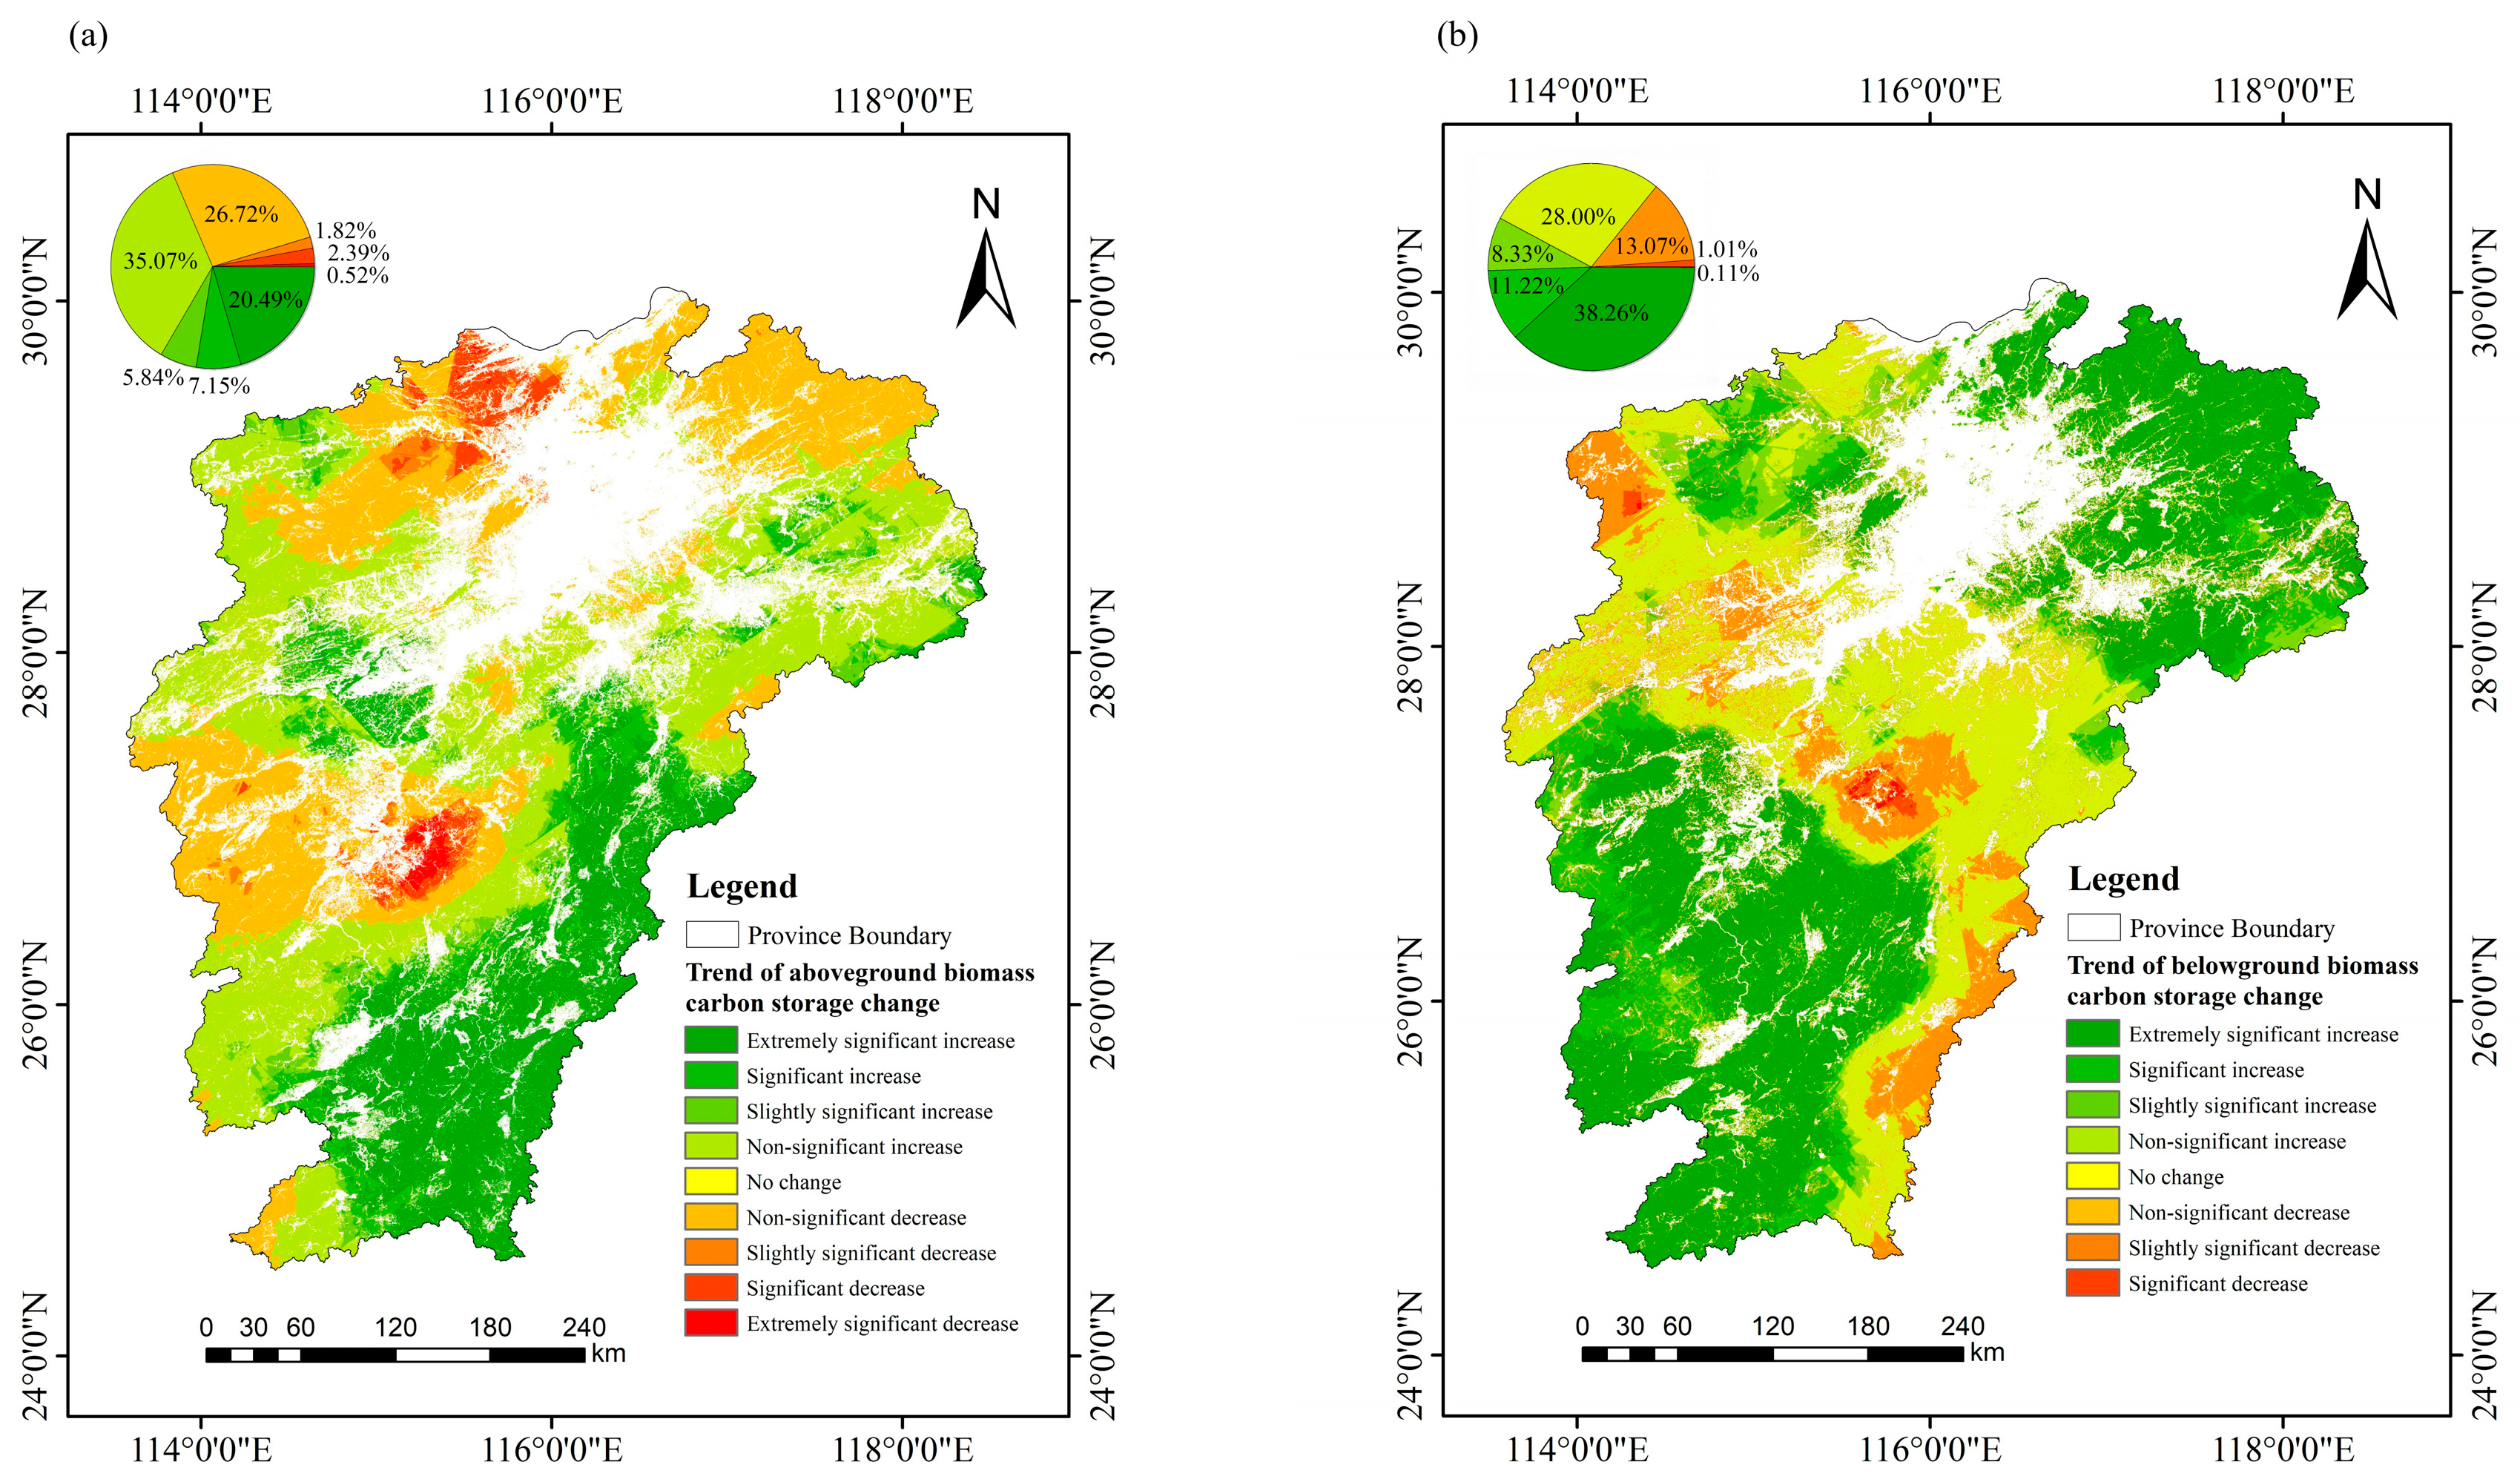
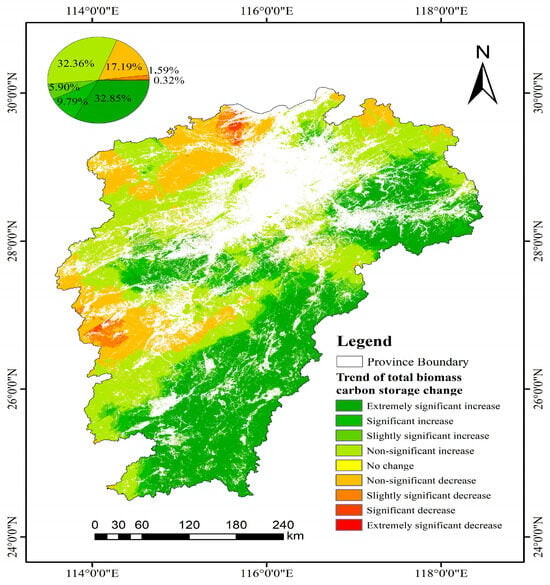
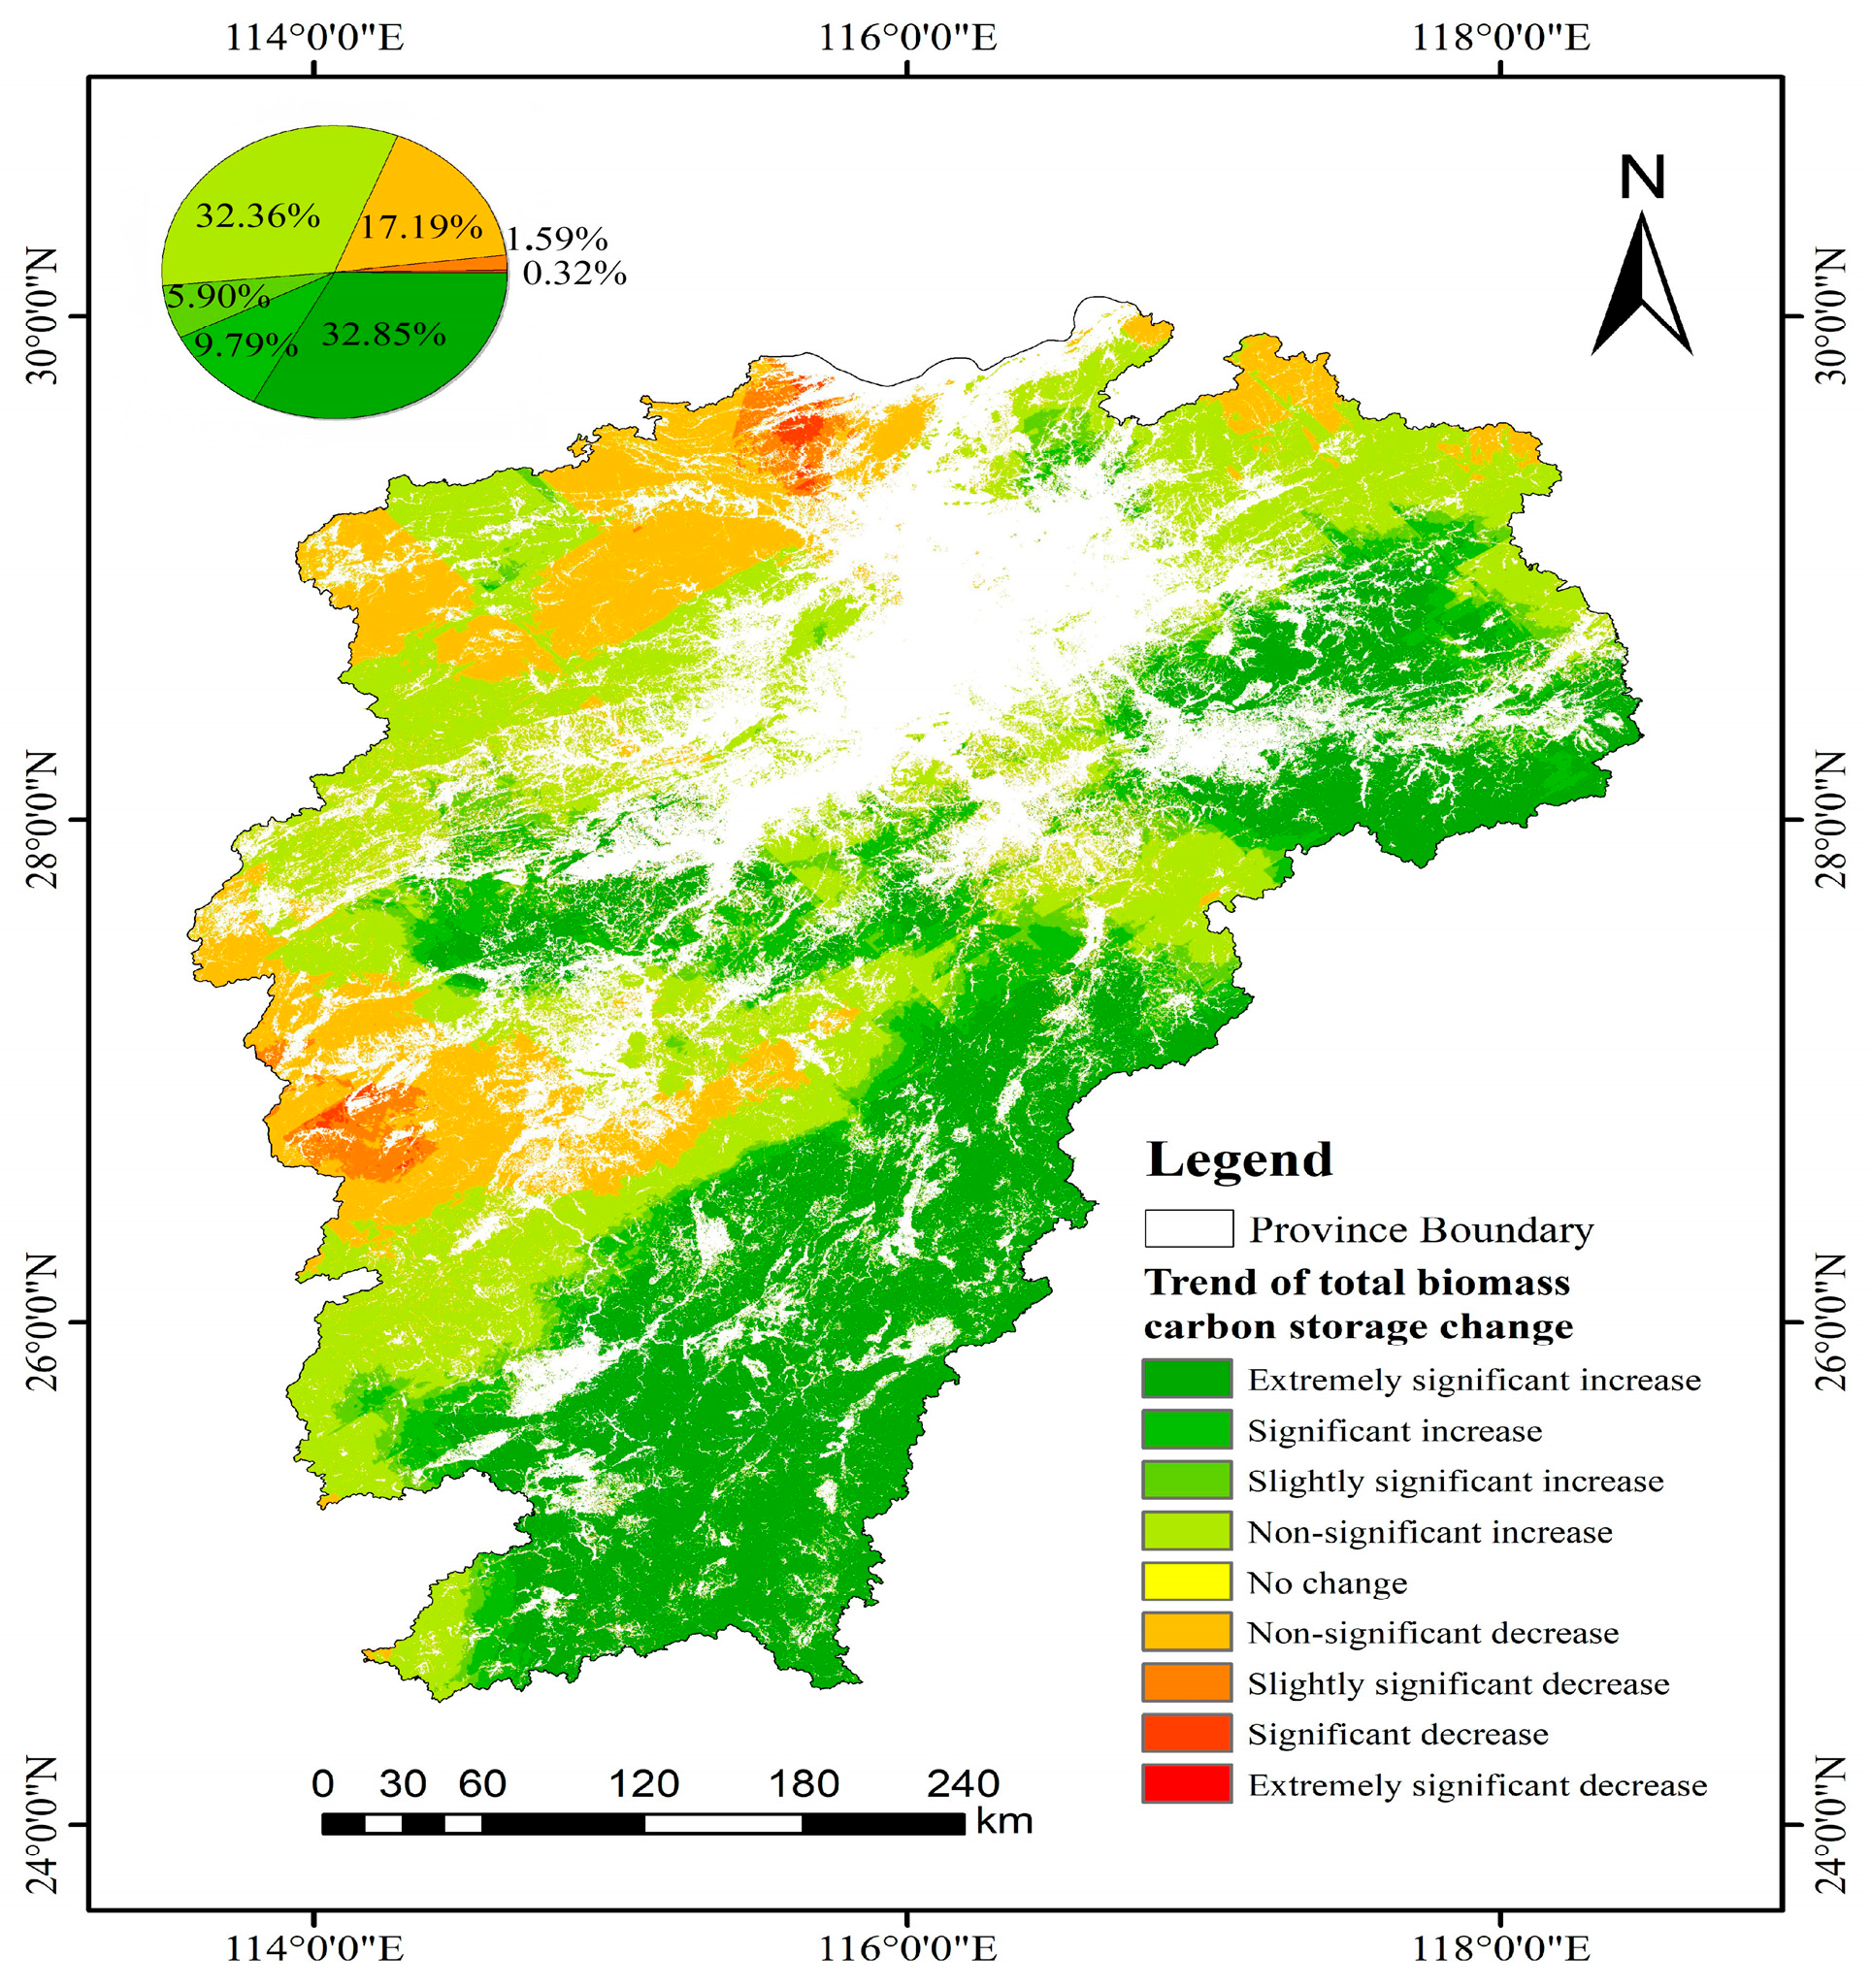
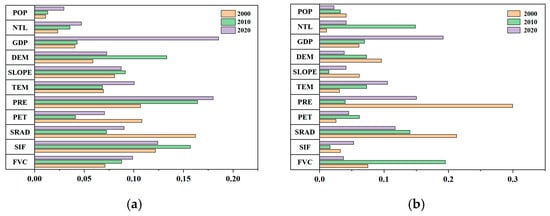
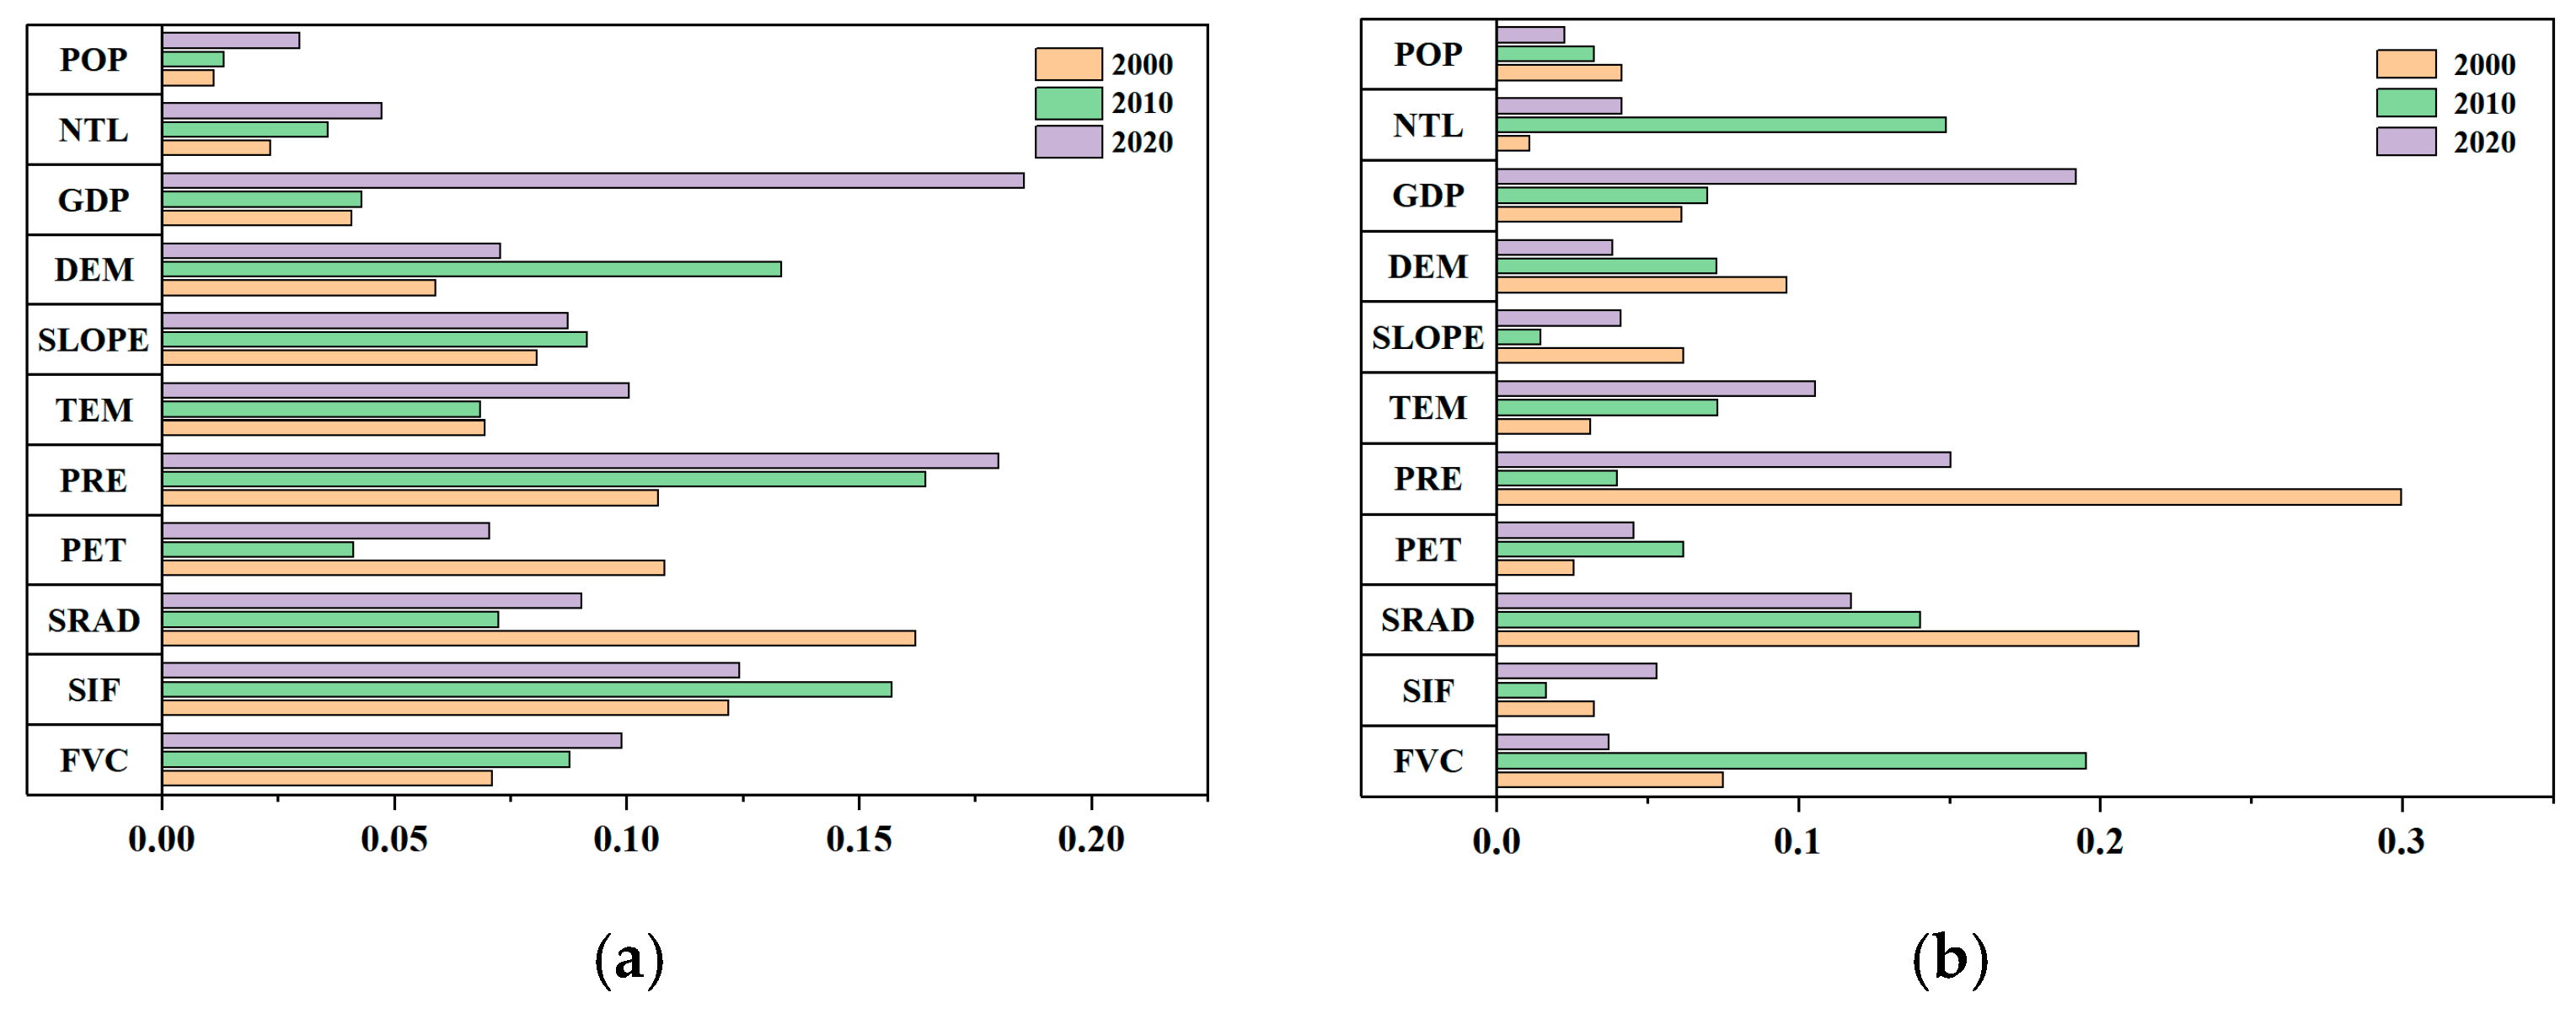
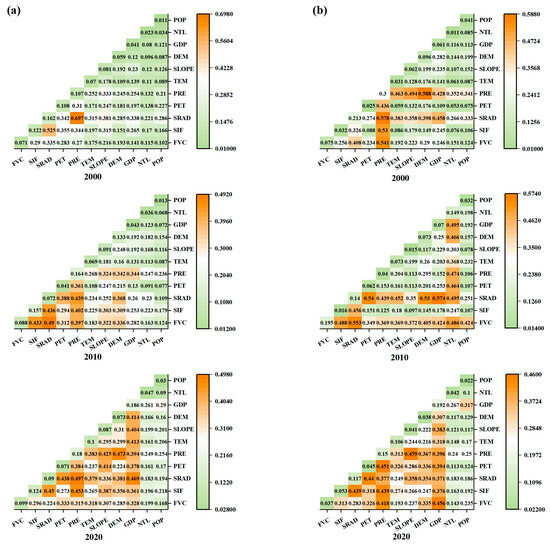
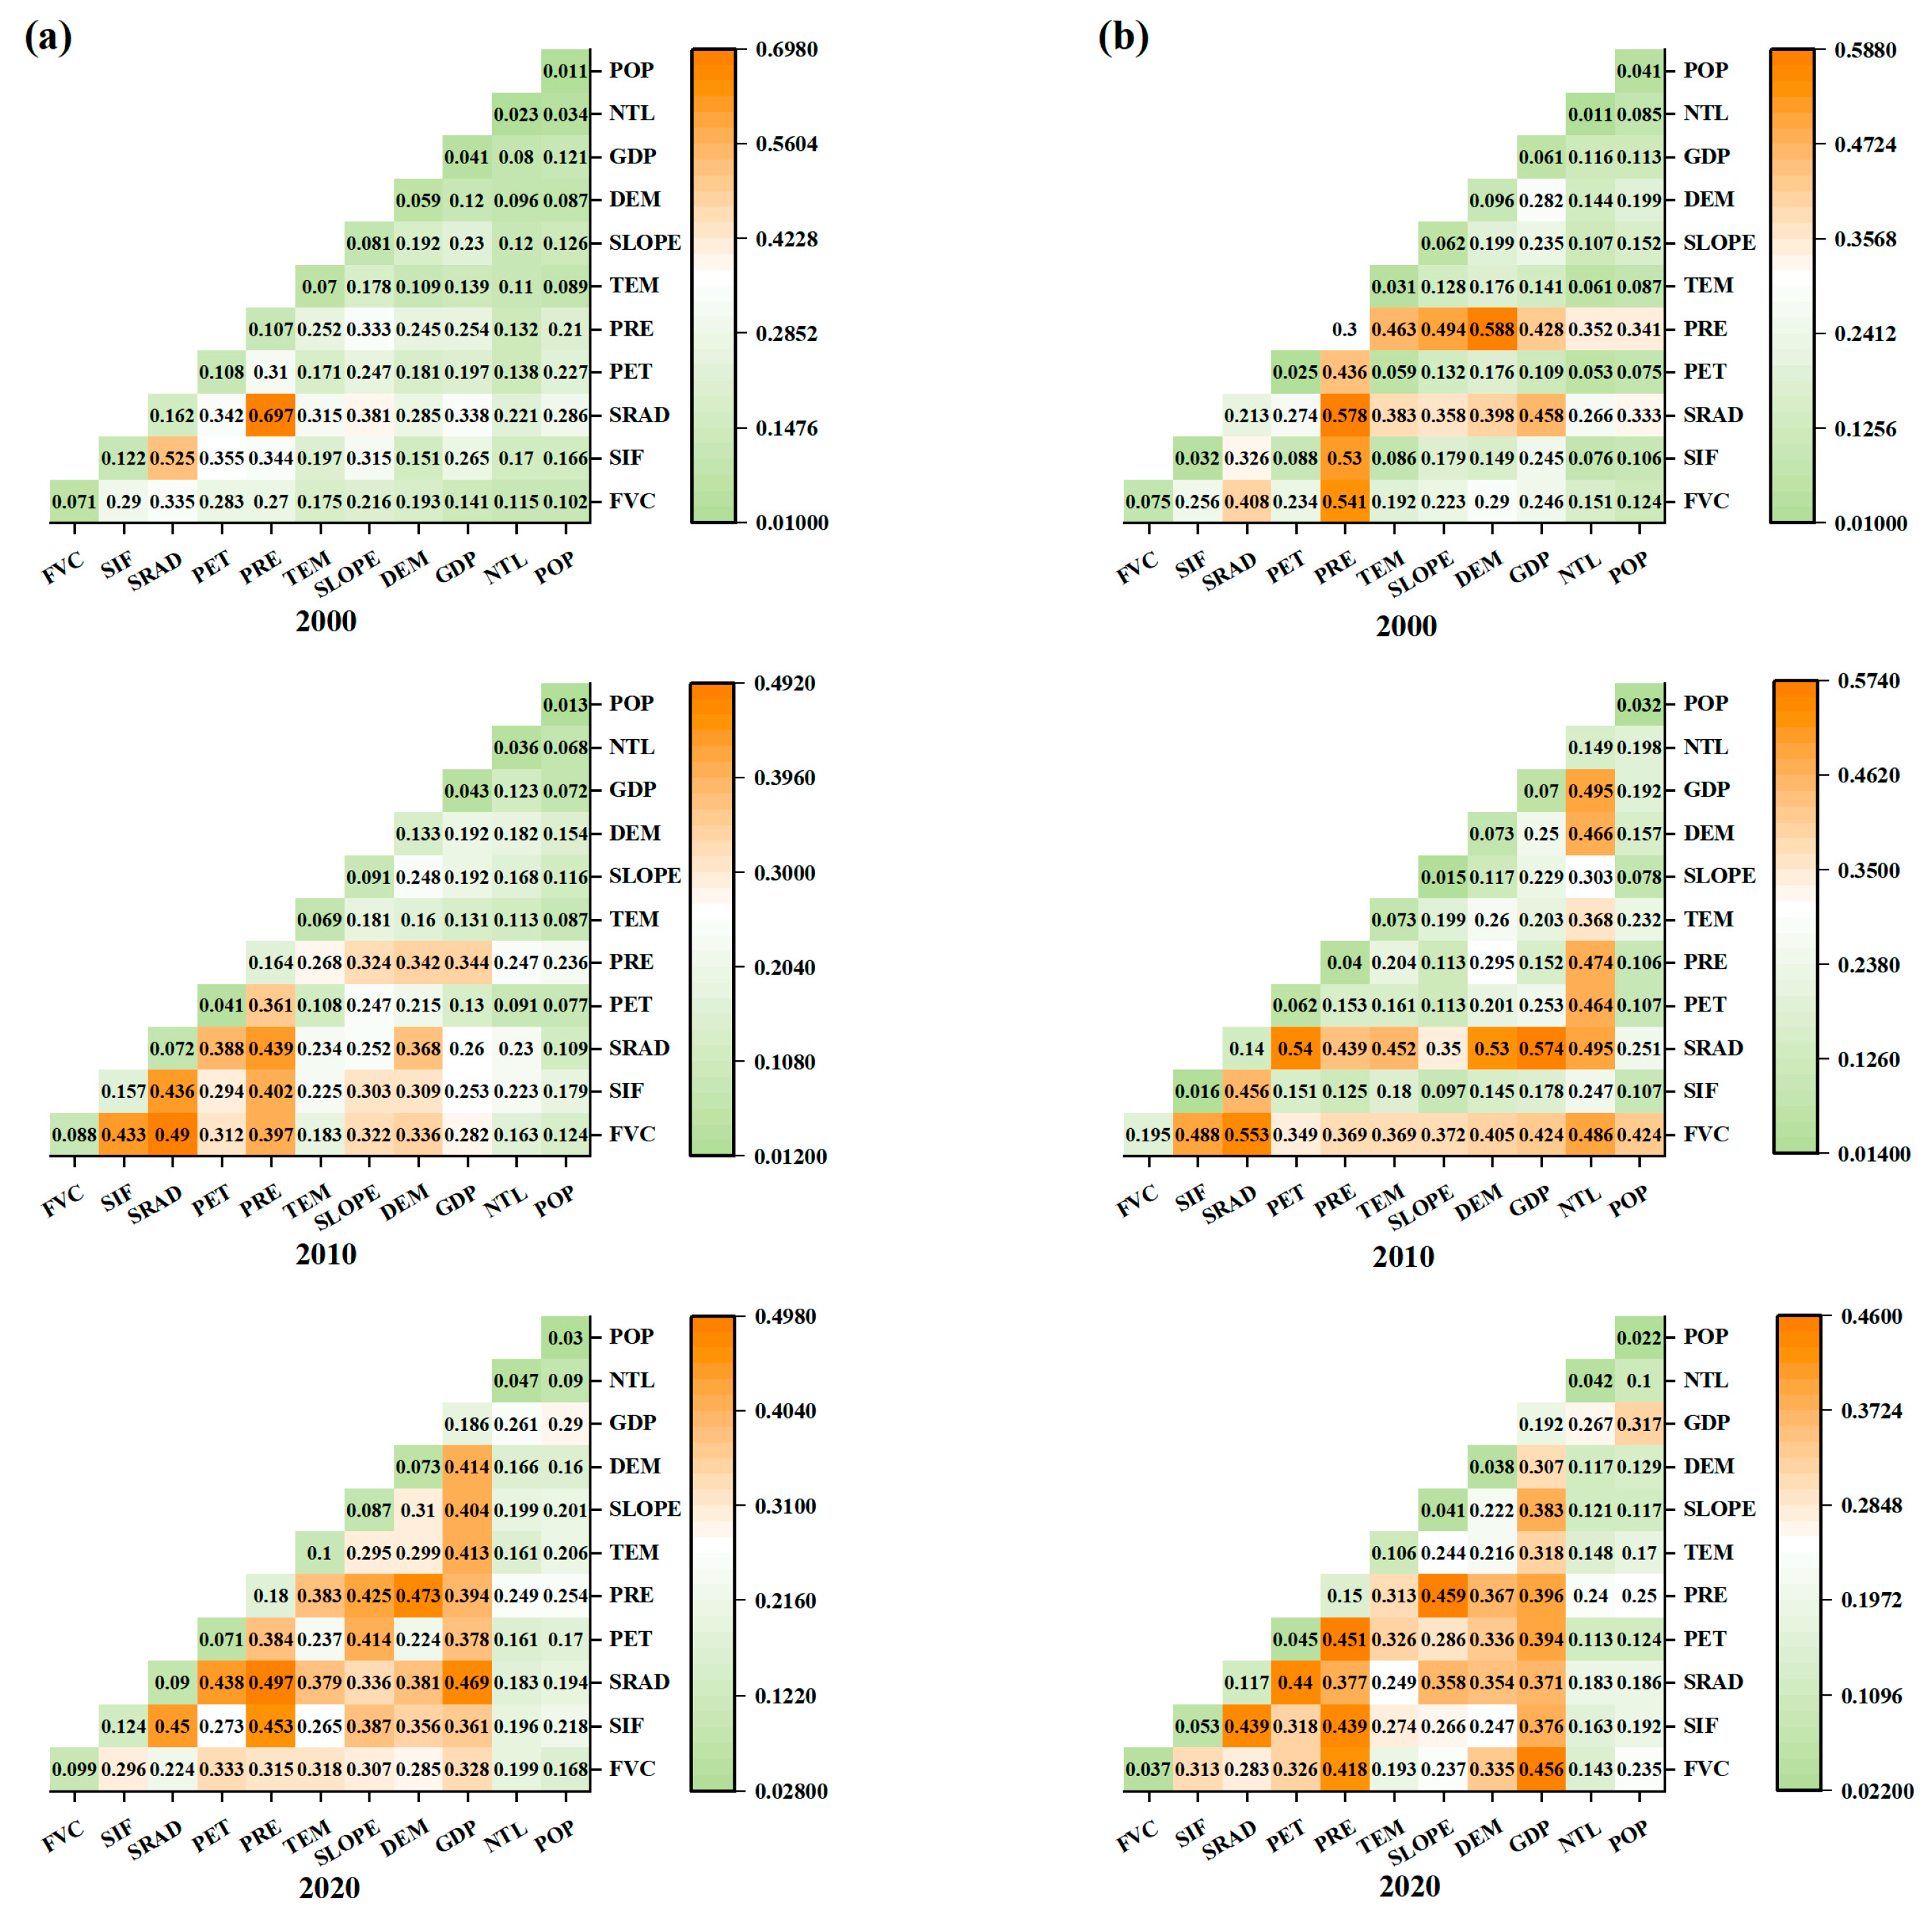
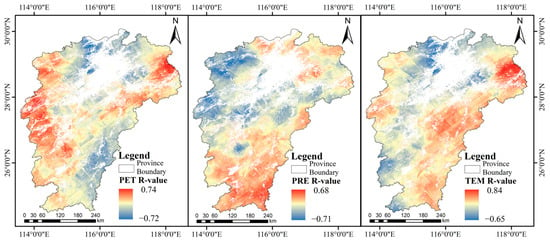
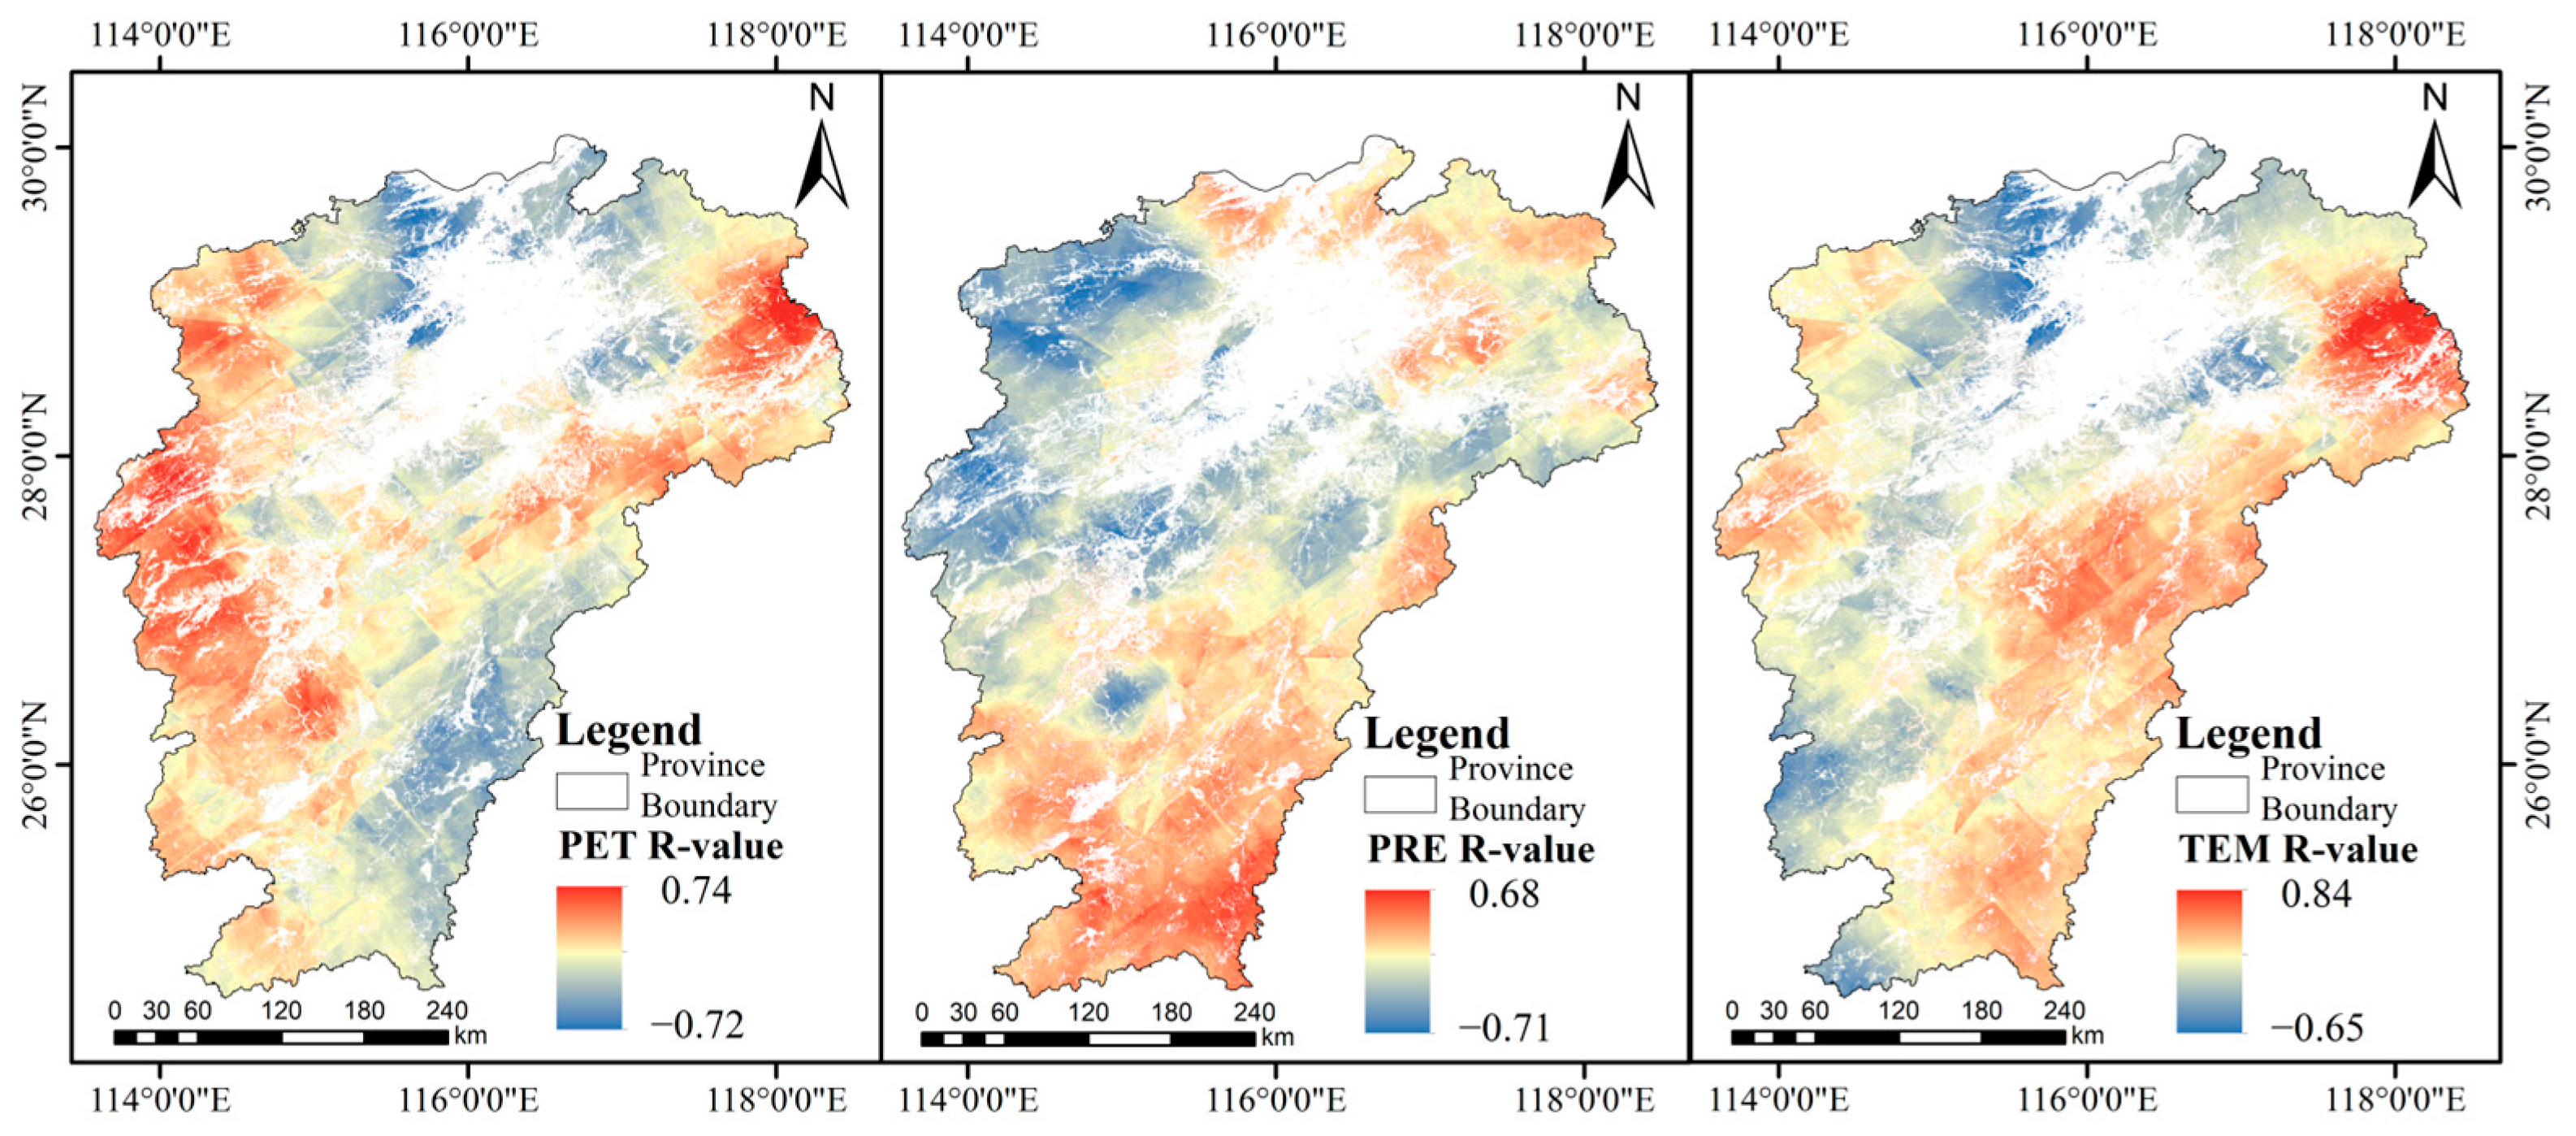
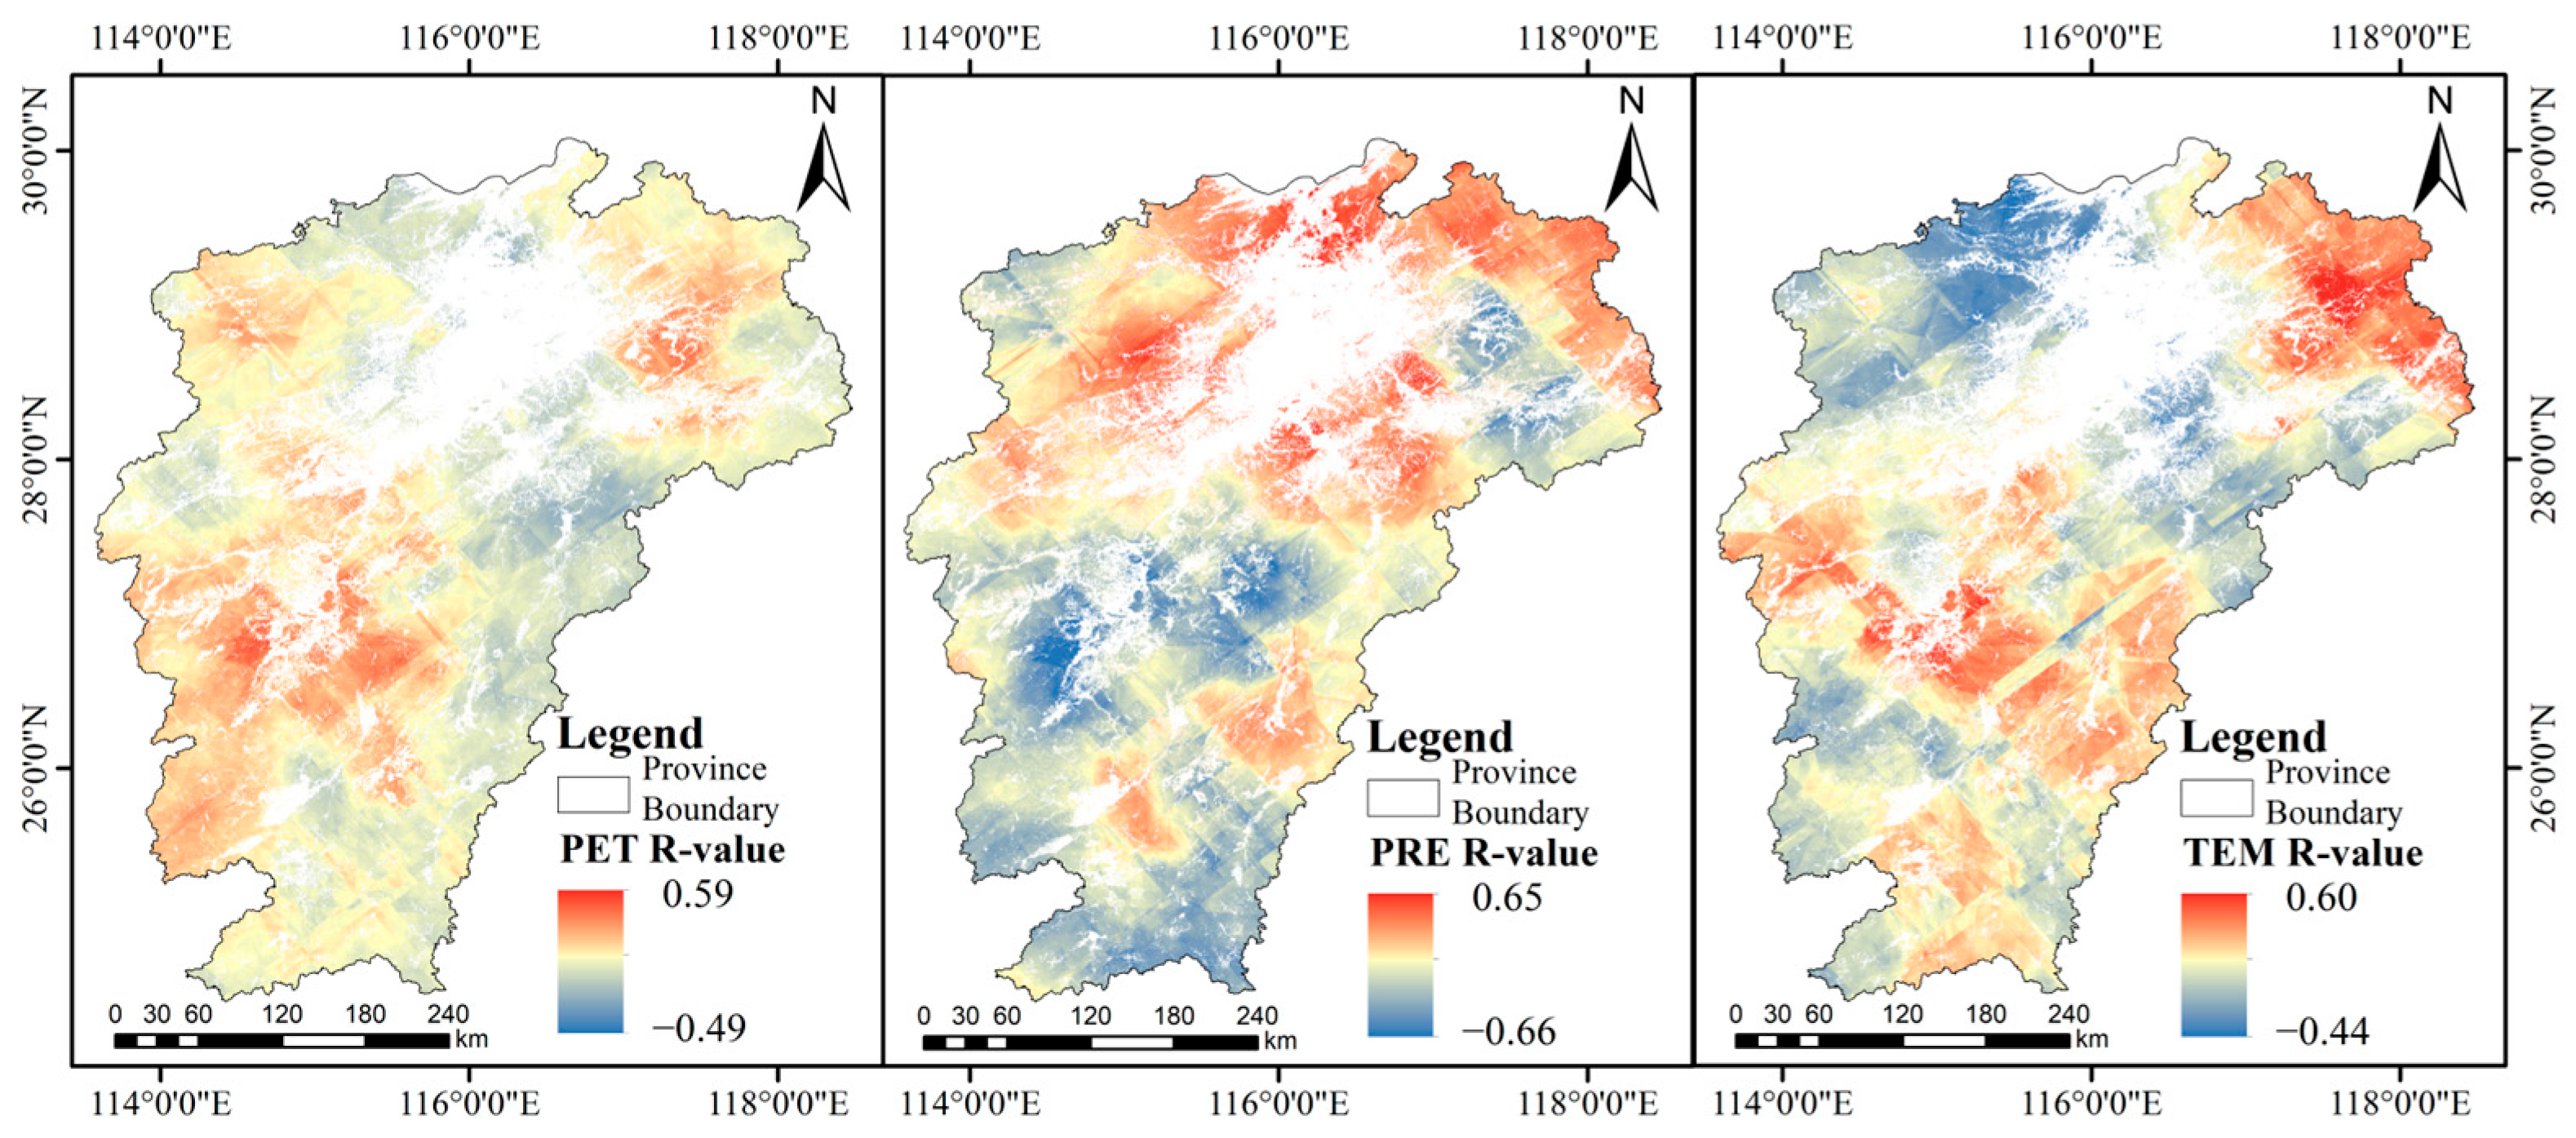
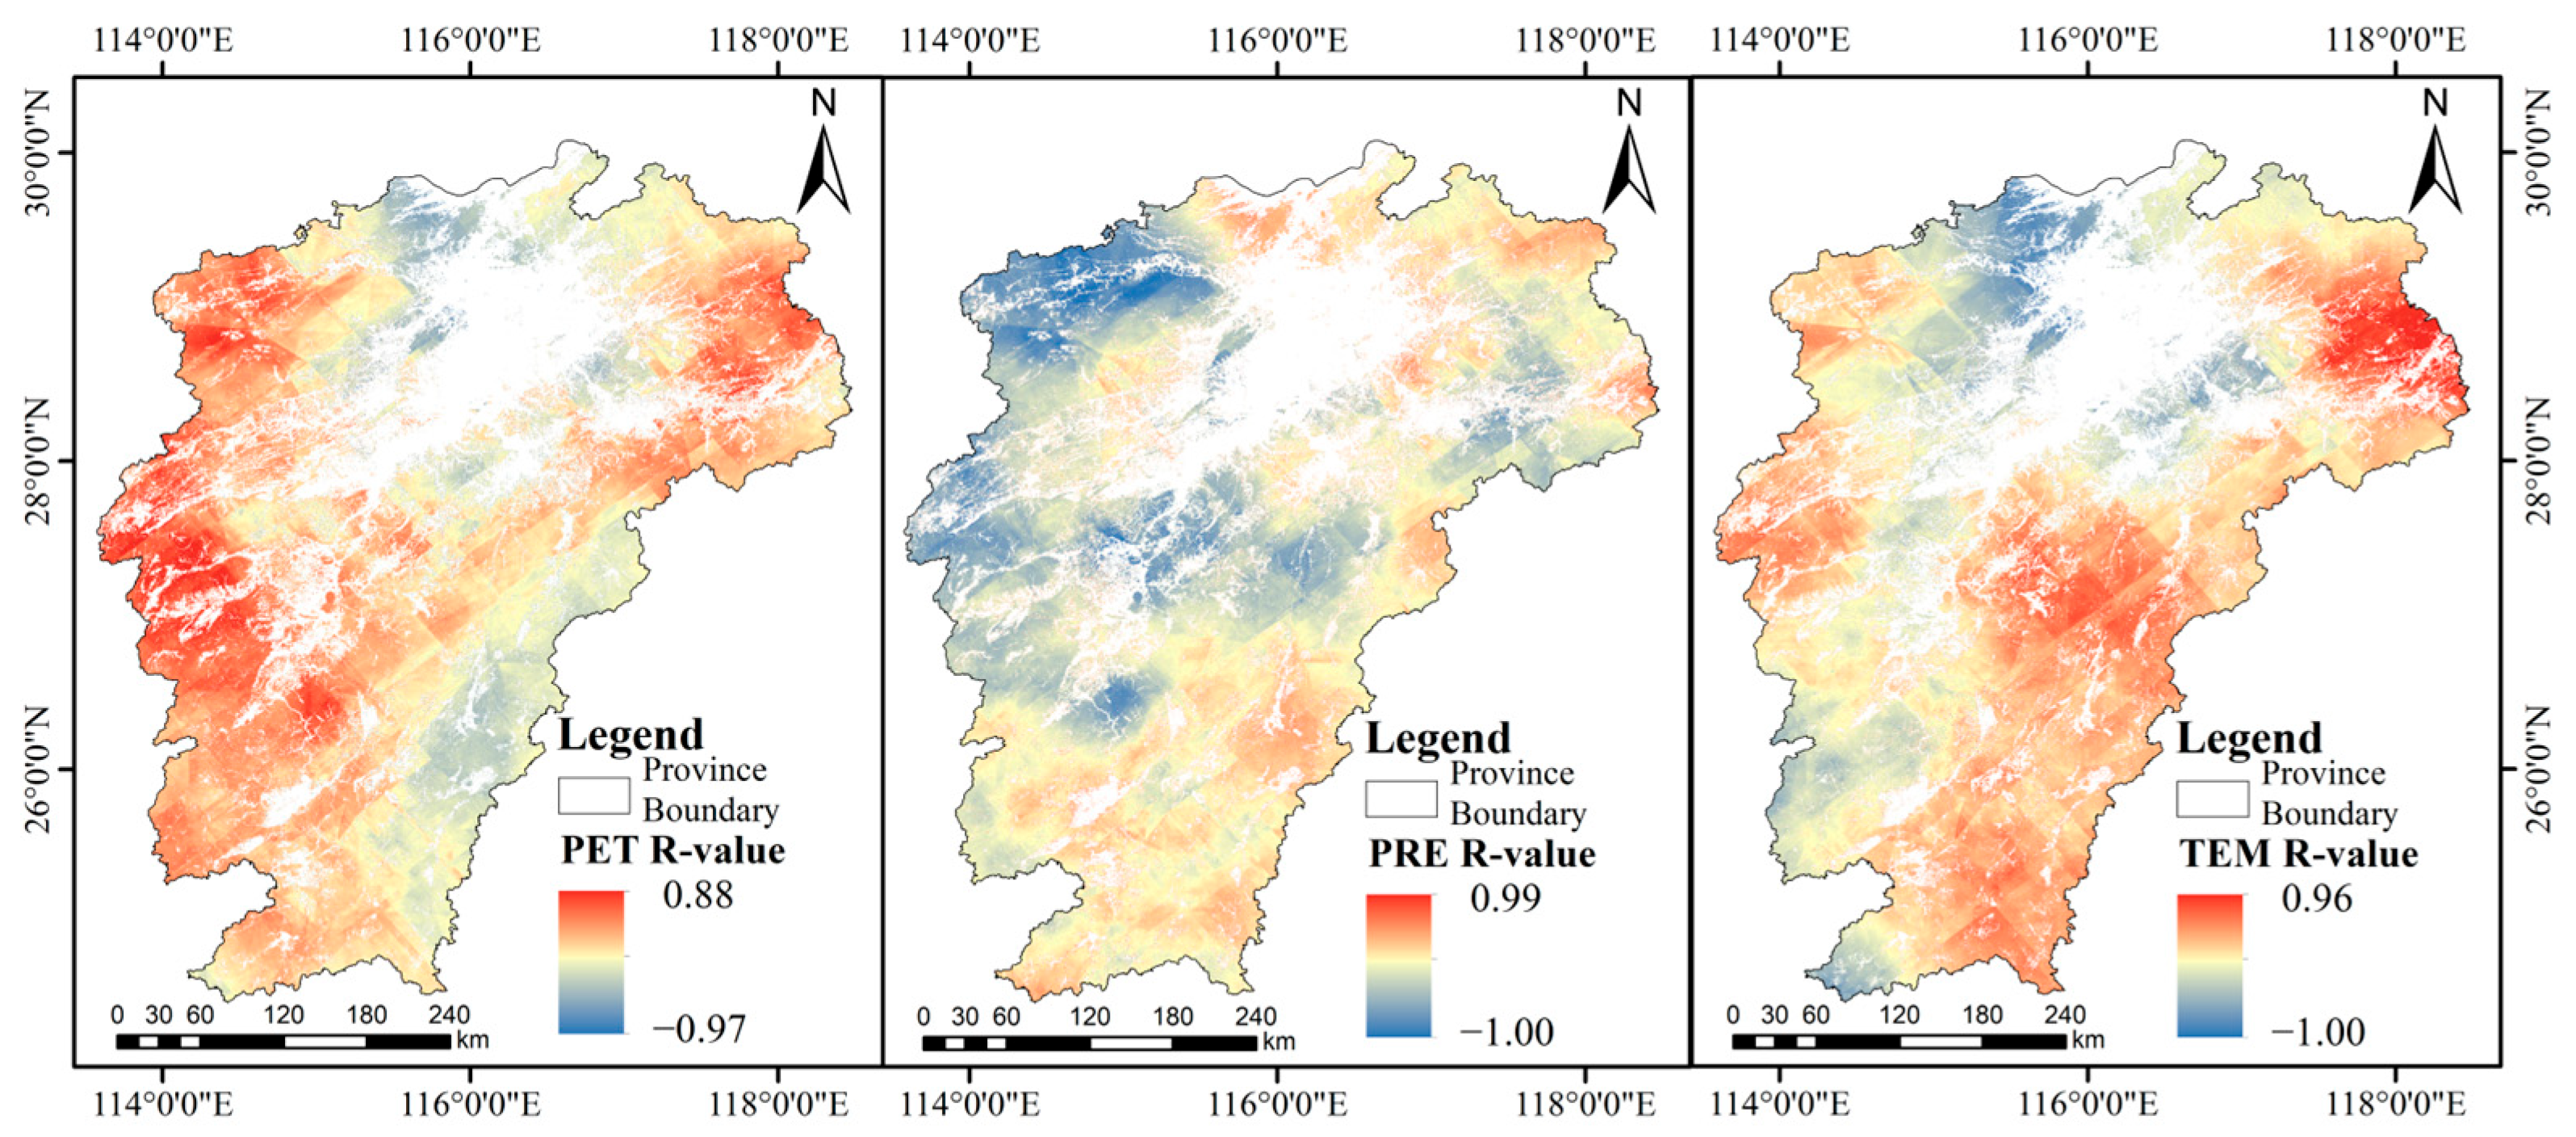
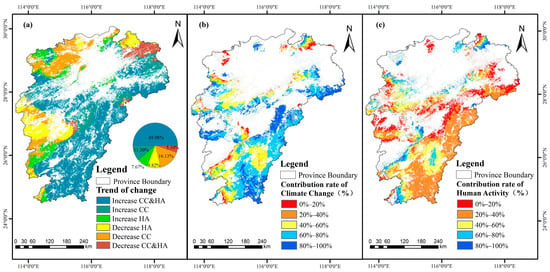
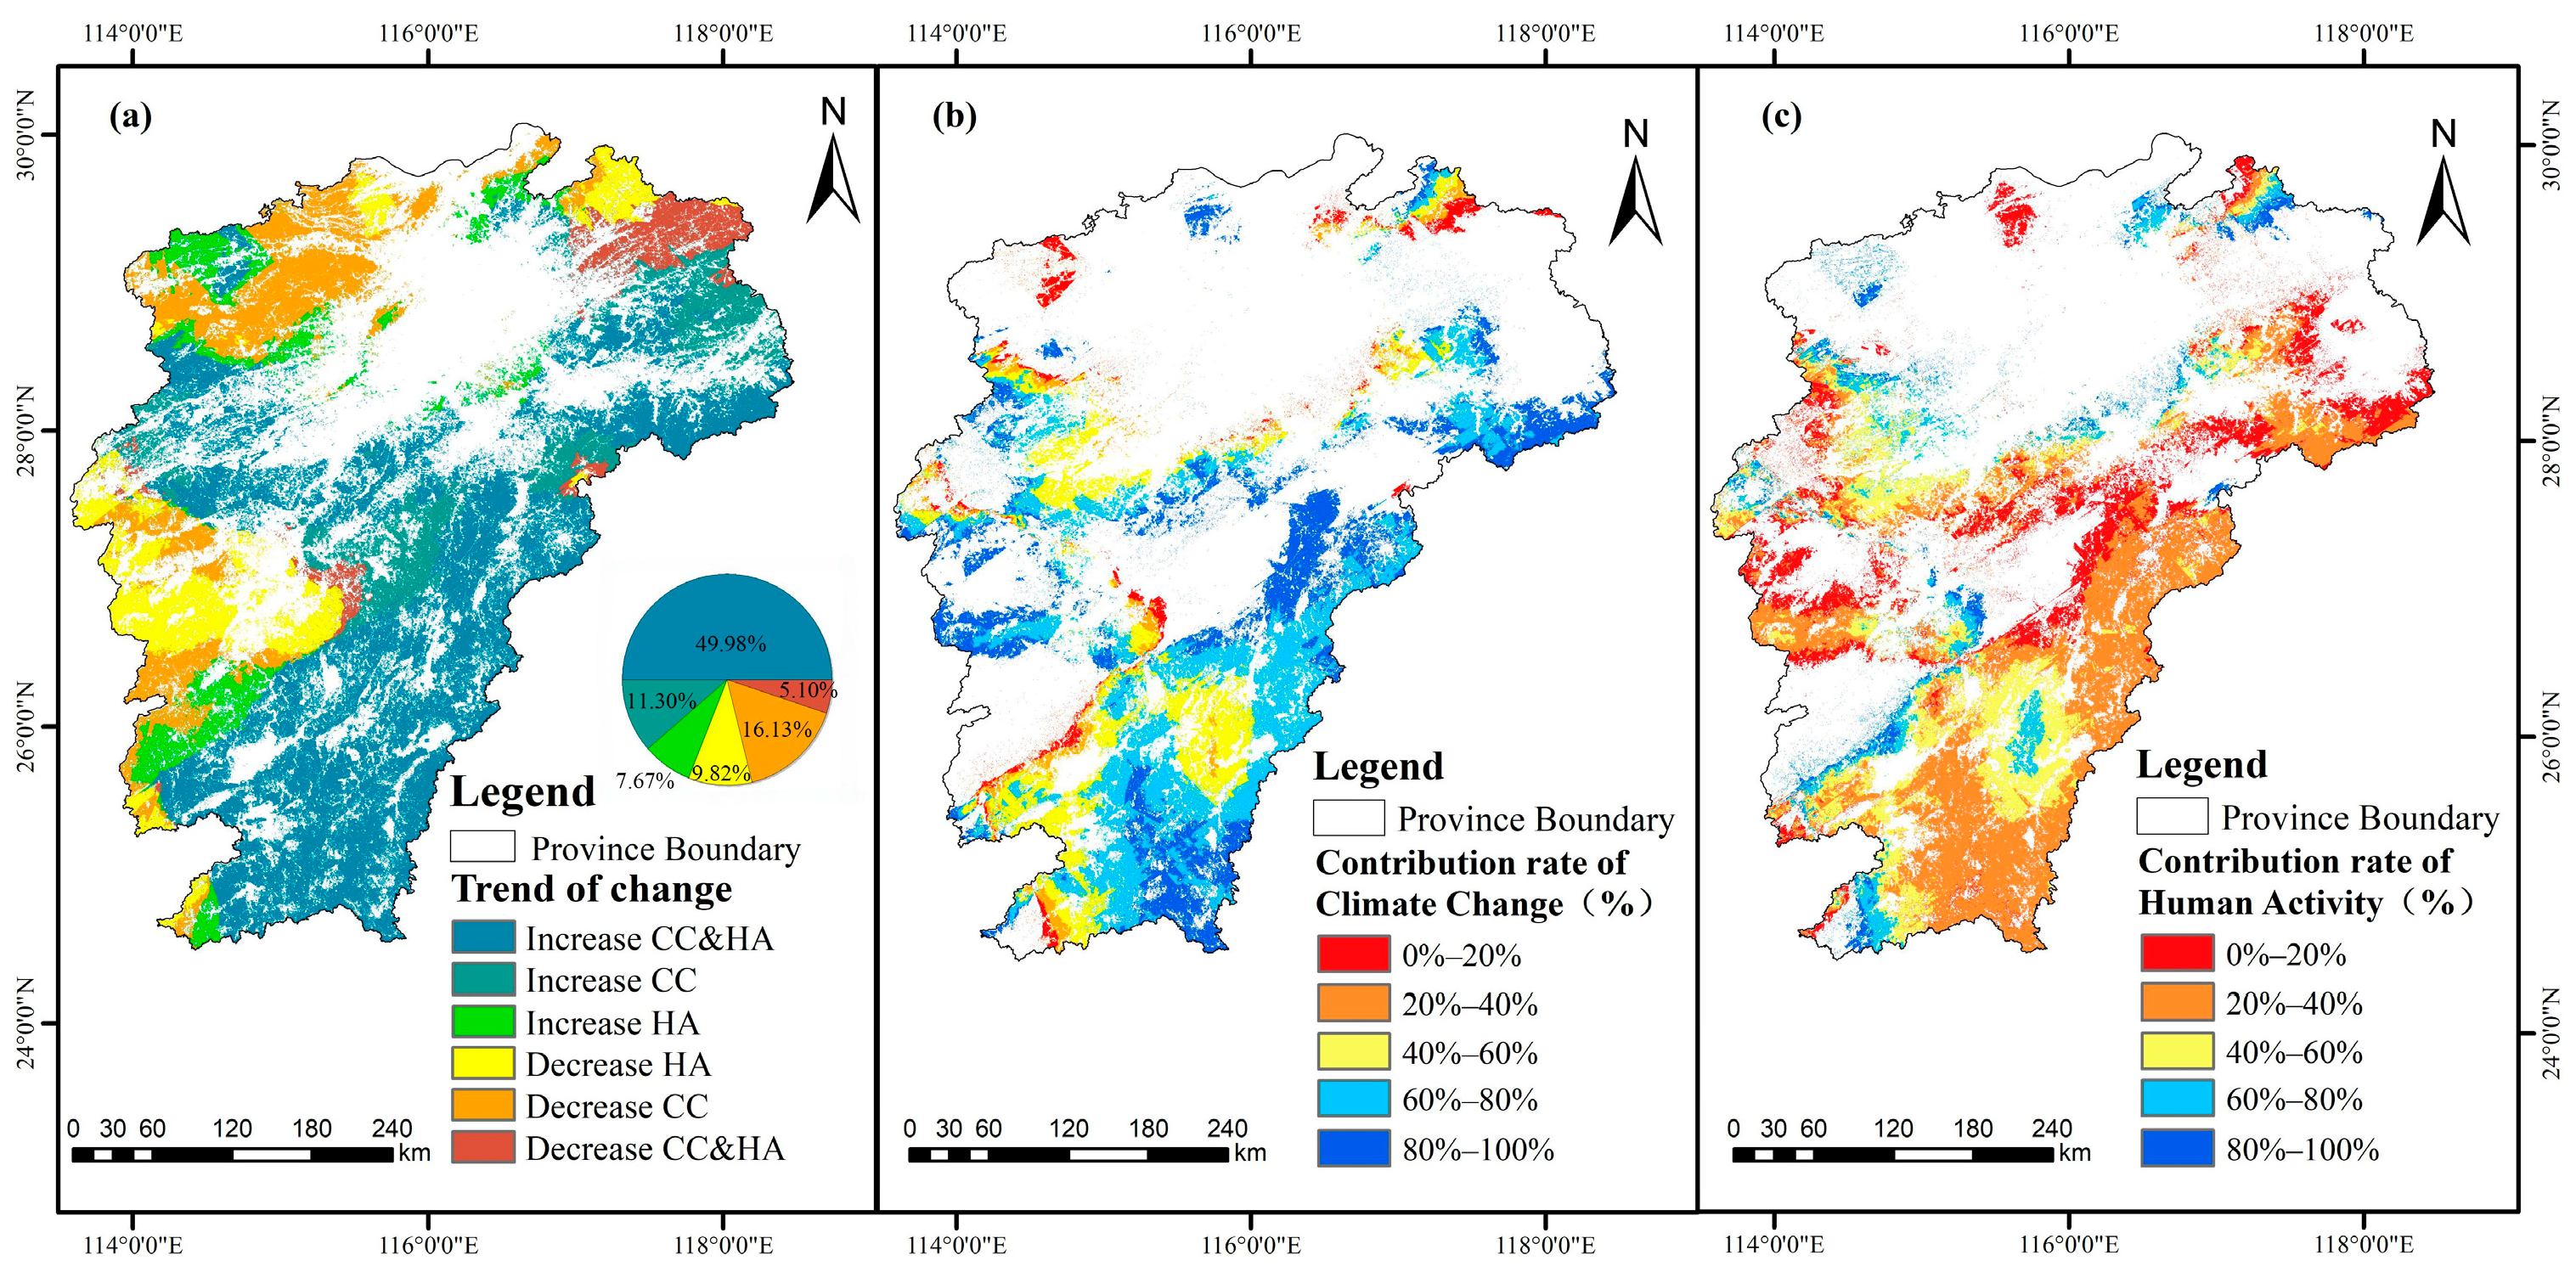
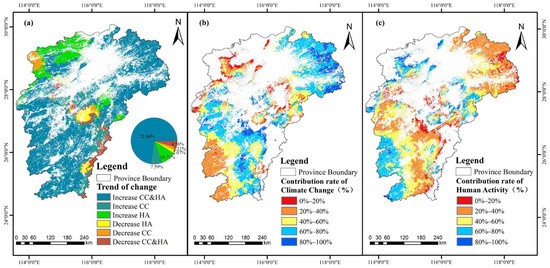
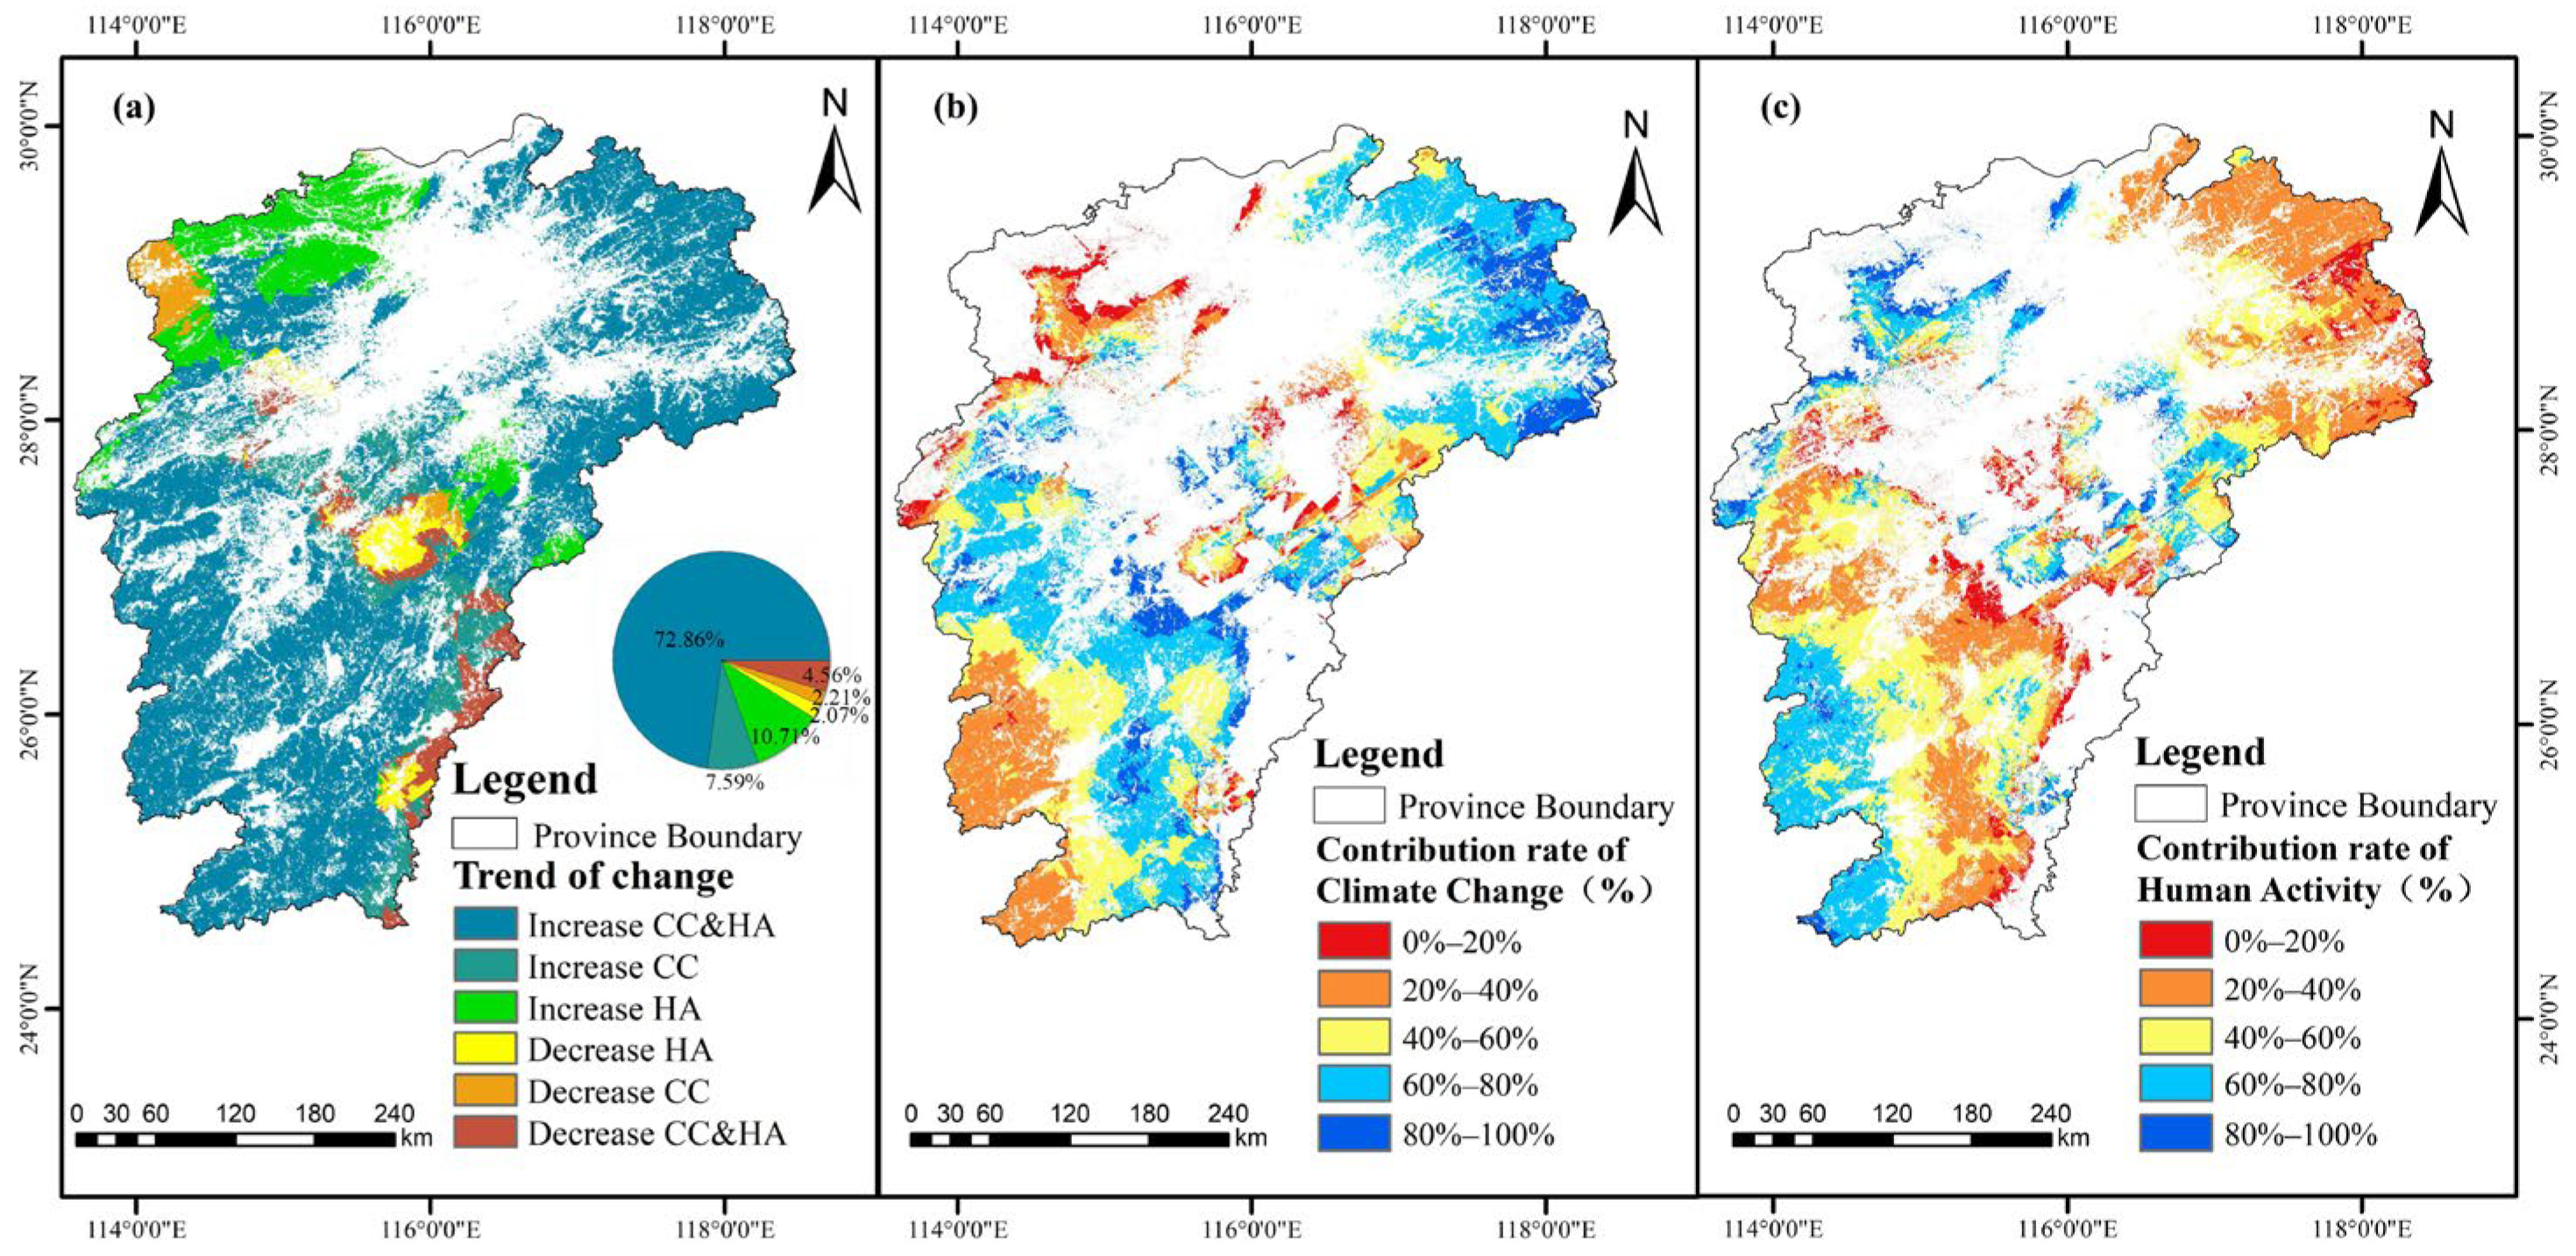
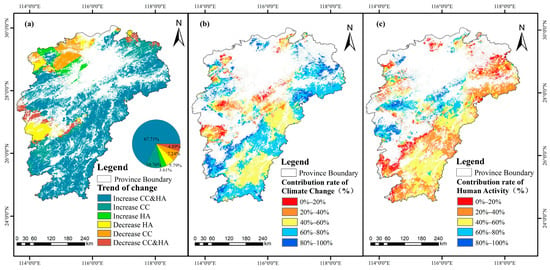
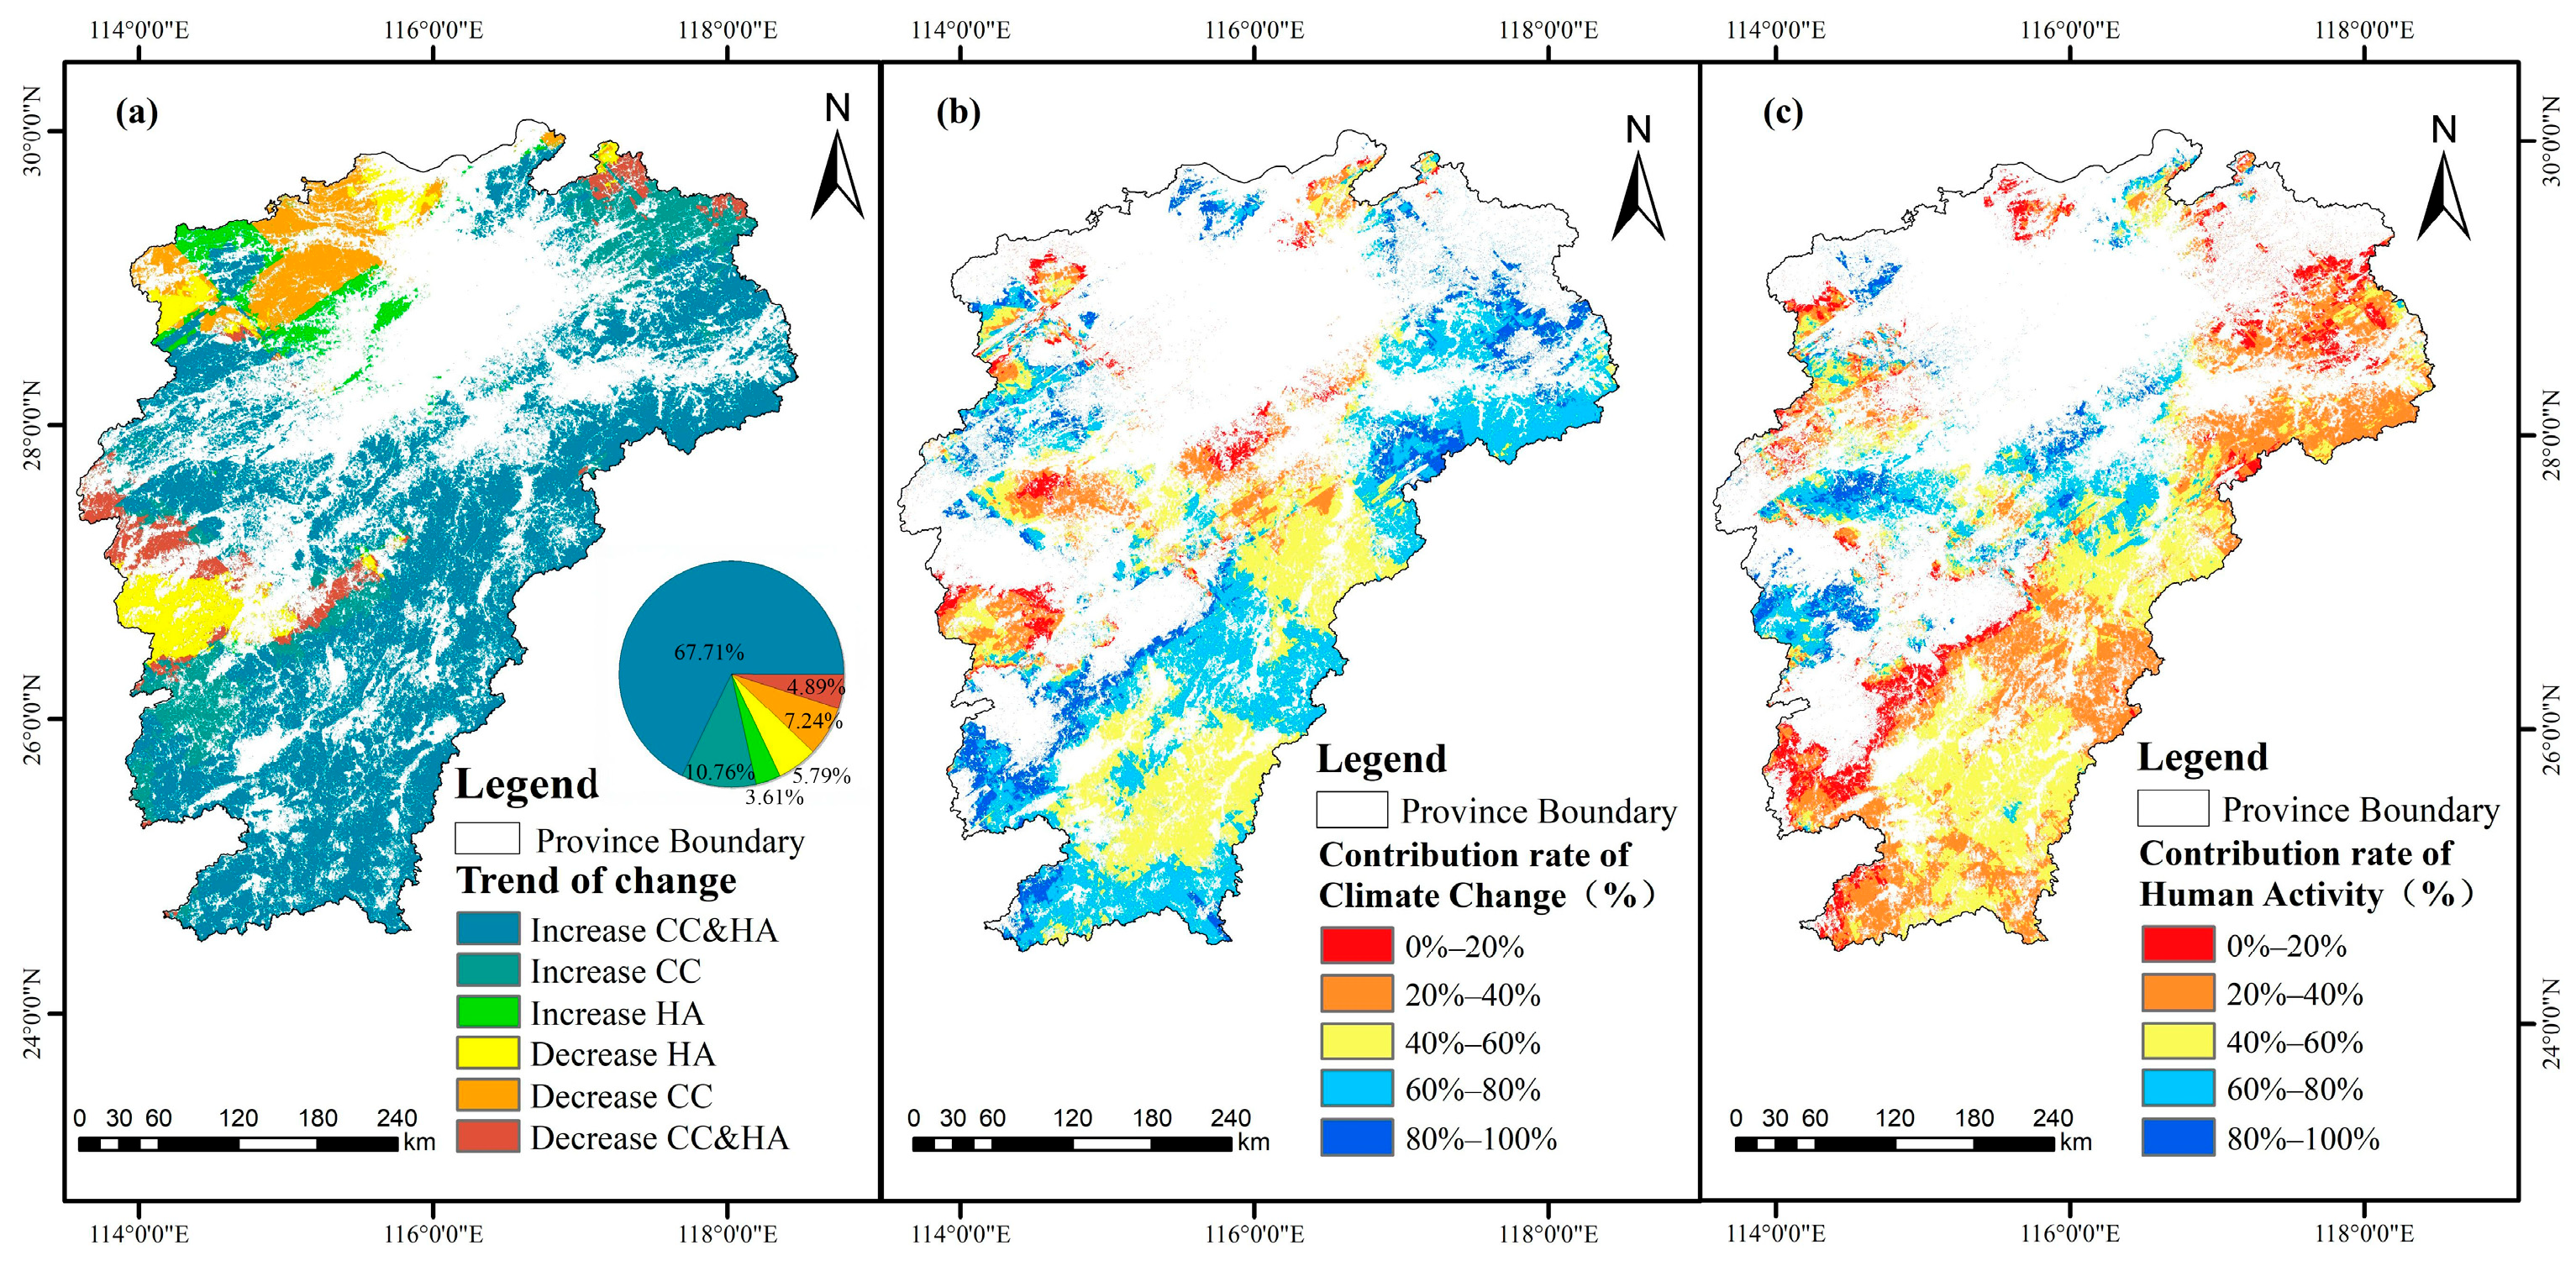
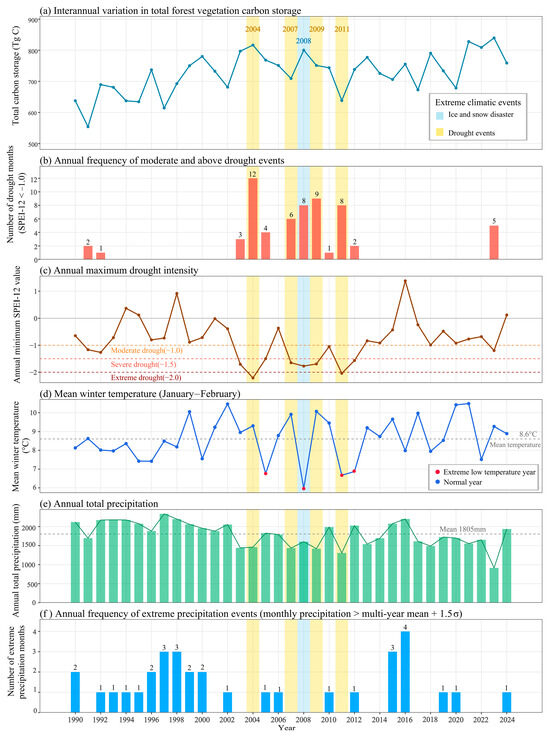
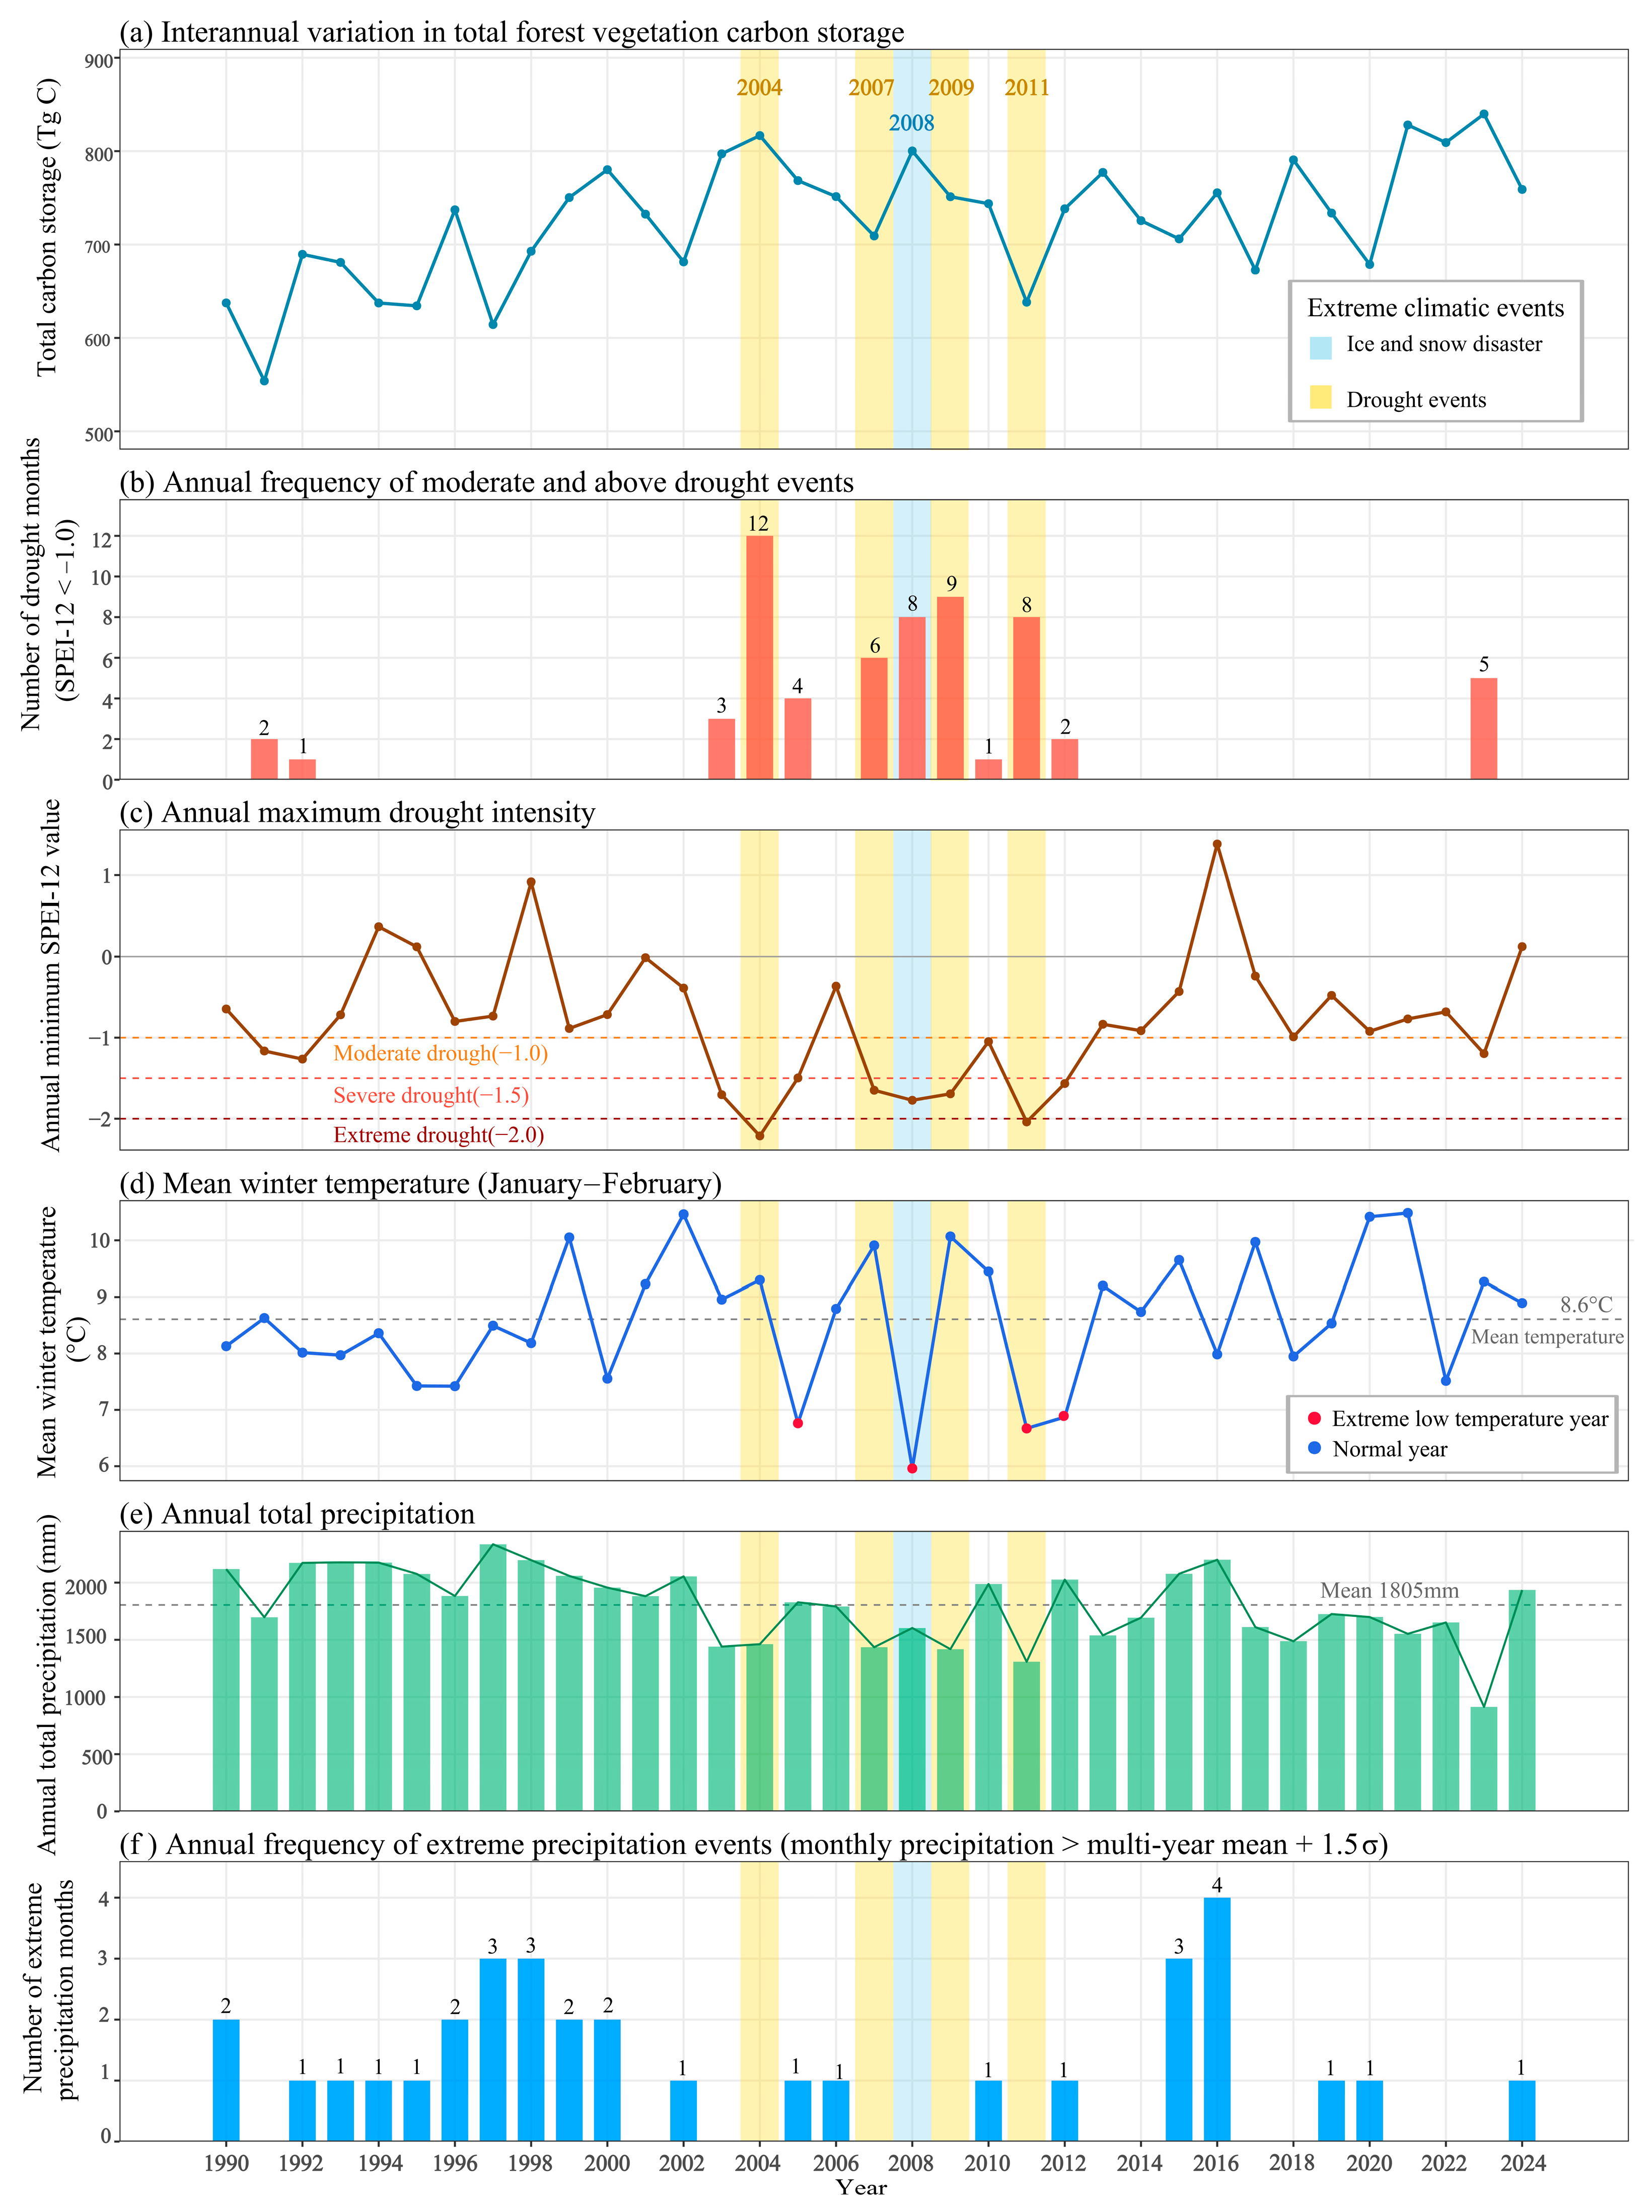

Disclaimer/Publisher’s Note: The statements, opinions and data contained in all publications are solely those of the individual author(s) and contributor(s) and not of MDPI and/or the editor(s). MDPI and/or the editor(s) disclaim responsibility for any injury to people or property resulting from any ideas, methods, instructions or products referred to in the content. |
© 2026 by the authors. Licensee MDPI, Basel, Switzerland. This article is an open access article distributed under the terms and conditions of the Creative Commons Attribution (CC BY) license.