


Highlights
What are the main findings?
- A novel zonal fusion strategy, guided by the InSAR detectable gradient, seamlessly integrates InSAR and the PIM to reconstruct a complete line-of-sight deformation field, overcoming limitations like decorrelation in high-strain areas.
- The proposed framework achieves superior 3D monitoring accuracy. Validation at the Yinying Mining Area shows an over 86% reduction in mean absolute error for 3D displacements at basin edges compared to the standalone PIM, capturing both large subsidence and subtle deformations.
What are the implications of the main findings?
- The fusion methodology provides a reliable and generalizable solution for reconstructing complete deformation fields in challenging environments like mining areas, where single-technique approaches are often inadequate.
- The enhanced accuracy in capturing full-field 3D displacements offers significant practical value for improved hazard assessment, infrastructure protection, and informed decision-making in mining and other geohazard-related industries.
Abstract
Accurate monitoring of mining-induced three-dimensional surface deformation is critical for safety and environmental protection. Conventional InSAR often loses coherence in high-deformation areas and provides only one-dimensional measurements, while the Probability Integral Model (PIM) suffers from low accuracy at subsidence edges, caused by premature numerical convergence of its error-function-based mathematical formulation—the model prediction rapidly drops to zero and fails to capture subtle real-world deformations in marginal zones. This study developed a fusion method integrating multi-source InSAR (Sentinel-1A and SAOCOM), PIM, and the Covariance Matrix Adaptation Evolution Strategy (CMA-ES). Applied in the Yinying Mining Area, Shanxi Province, the approach combined ascending and descending SAR data processed via SBAS-InSAR, used CMA-ES to optimize PIM parameter inversion, and employed a zonal fusion strategy to reconstruct complete deformation fields. The method demonstrated substantial improvement in monitoring accuracy, with mean absolute errors in the vertical, north–south, and east–west directions reduced by more than 86% compared with the standalone PIM model in edge zones. The fusion approach effectively captured both large-magnitude center deformations and subtle edge displacements. Multi-source data fusion with intelligent optimization algorithms significantly enhances the accuracy of 3D deformation monitoring in mining areas, providing reliable technical support for safety management and environmental protection.
1. Introduction
Coal remains a cornerstone of China’s energy system, fueling socioeconomic development yet simultaneously inducing widespread surface displacement that threatens infrastructure, ecosystems, and public safety [1,2,3,4]. Accurately monitoring mining-induced deformation is thus critical for risk mitigation, but conventional techniques such as leveling and GNSS are constrained by sparse spatial coverage and high costs [5], thereby limiting comprehensive assessment.
Interferometric Synthetic Aperture Radar (InSAR) has emerged as a powerful tool for wide-area deformation monitoring [6,7]. Time-series approaches such as Persistent Scatterer (PS-InSAR) and Small Baseline Subset (SBAS-InSAR) algorithms improve reliability by mitigating atmospheric artifacts and temporal decorrelation [8]. However, in mining contexts, rapid displacement often exceeds InSAR’s detectable gradient, causing signal decorrelation at the deformation center [9]. Moreover, InSAR measures only one-dimensional displacement along the line of sight, obscuring the full three-dimensional (3D) deformation field essential for mechanistic understanding [10,11]. A prevalent approach in the current literature is the use of InSAR data from ascending and descending orbits to resolve three-dimensional deformation [11,12,13]. However, this approach requires at least three InSAR measurements with distinct viewing geometries and proximate observation times. Given the limited inventory of operational SAR satellites, this prerequisite cannot be met for all study areas [14]. Furthermore, constrained by the storage and processing efficiency for large SAR datasets, the archive from a single satellite cannot provide concurrent ascending and descending observations over the same target globally. In practice, a given study area may be covered by multiple SAR satellites flying in identical directions. This scenario results in an ill-posed observation matrix for 3D deformation retrieval, where residual errors from multiple line-of-sight (LOS) measurements propagate into the solution, substantially degrading the accuracy of the derived 3D deformation [15]. Some scholars have also investigated the integration of InSAR with Offset Tracking (OT), the Global Navigation Satellite System (GNSS), UAV-based measurement, and conventional survey techniques [16,17,18], providing alternative approaches for deriving three-dimensional (3D) surface deformation from line-of-sight (LOS) measurements. However, multi-source data still face individual limitations in monitoring mining-induced surface deformation, and the effective fusion of monitoring results requires further investigation.
To overcome these limitations, the probability integral method (PIM)—a stochastic-medium-based prediction model—was integrated with InSAR to reconstruct complete displacement basins [19,20]. Previous fusion strategies often relied on single-band SAR data and heuristic parameter inversion, which struggled to balance sensitivity to both subtle and large deformations while avoiding error propagation in 3D retrieval [21]. For instance, while gradient-based fusion methods improved vertical displacement estimation, they neglected horizontal displacement, which is critical for assessing mining-induced strain. Other attempts to integrate multi-band data lacked robust optimization mechanisms, leading to unreliable boundary conditions or low accuracy in vegetated areas [22].
Monitoring mining subsidence with single-band InSAR data is challenging because it often fails to capture both subtle and large deformations simultaneously, thereby limiting reliable 3D displacement retrieval. To address the issue of insufficient observation geometry due to satellite resource limitations and overcome the inherent drawbacks of InSAR decorrelation and PIM edge errors, this study developed an integrated solution. The core of this solution is to supplement the missing observation geometry through PIM simulation and ensure the reliability of the fusion using intelligent optimization algorithms. We demonstrate our method at the 150316# longwall face in Yinying Mining Area, Yangquan City, Shanxi Province.
Notably, this study’s innovation extends beyond the mere combination of multi-source data and an optimization algorithm. The core of our methodology lies in a systematic solution designed to address the physical characteristics of mining subsidence, subtle edge deformations, and large-gradient displacements at the center. The integration of C-band Sentinel-1A (sensitive to minor deformations), L-band SAOCOM (robust against decorrelation in high-strain areas), and the physically based PIM framework creates a complementary data–model ecosystem. Furthermore, the CMA-ES algorithm is particularly suited for inverting the multi-parameter, nonlinear PIM because its adaptive covariance matrix update mechanism provides a more robust global search capability in complex parameter spaces compared with conventional heuristics (e.g., PSO and GA), effectively mitigating the risk of converging to local optima, as evidenced by our simulation experiments.
2. Materials and Methods
2.1. Study Area
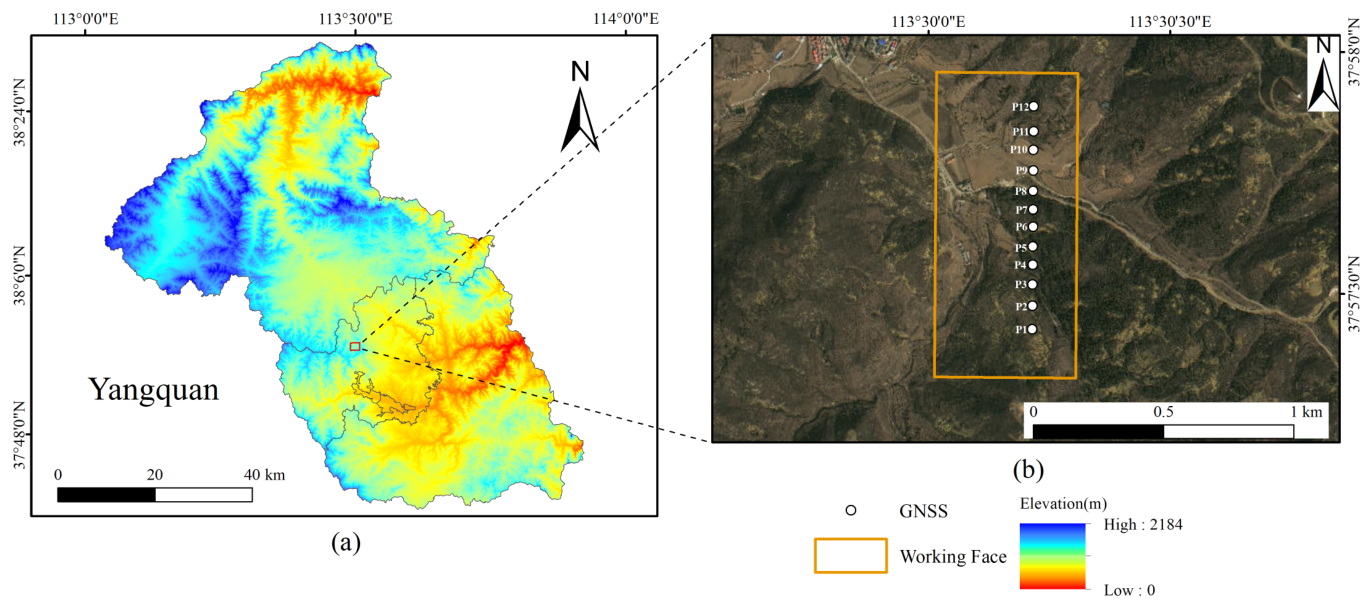
The study area is located in a mining area in the northern suburbs of Yangquan City, Shanxi Province (Figure 1). This area features crisscrossing valleys and a terrain that is high in the northwest and low in the southeast, belonging to a low mountain and hilly region. The altitude ranges from 660 to 1373 m. The surface is mainly covered by woodlands and grasslands, with some villages and towns in the surrounding area. Coal mining in this area needs to prioritize safety, its impact on the surface and surrounding areas, and surface maintenance. Therefore, it is necessary to monitor surface displacement. Figure 1b shows the mining range of the 150316 working face in this mining area and the distribution of ground monitoring points. This research mainly studies the surface displacement of this working face from January 2025 to June 2025. The strike of the working face is due north, with a strike length of 1173 m; the dip direction is due east, with a dip length of 551 m. The average coal seam thickness is 7.2 m, the coal seam dip angle is 6 degrees, and the mining depth of the working face is approximately 270 m.
Figure 1.
Overview of the study area: (a) the geographical location and scope of the study area; (b) the location of the working face and GNSS points.
To independently validate the InSAR-derived deformation, data from twelve permanent GNSS stations within the study area were utilized. These stations are part of an existing, commercial surface movement monitoring network operated at the mine site. Their installation followed standard mining subsidence monitoring practices, with stations distributed along the strike direction of the longwall panel to capture the characteristic deformation profile. The GNSS data processing adhered strictly to the Chinese National Standard “Specifications for Global Navigation Satellite System (GNSS) Surveys” (GB/T 18314-2024) [23], ensuring high-precision positioning. This study used the processed time series of cumulative vertical displacement from these stations as the ground truth for the quantitative accuracy assessment of our fusion-based results.
2.2. Data Sources
In this study, Sentinel-1A and SAOCOM data covering the study area from January to June 2025 were collected, including 13 Sentinel-1A scenes with a time range from 7 January to 31 May 2025, and 5 SAOCOM scenes with a time range from 2 January to 25 May 2025. The specific parameters are shown in Table 1. The Sentinel-1A data are ascending orbit data, with a heading angle of 346.69°, incidence angle of 35.458°, wavelength of approximately 5.6 cm, and resolution of 20 m. The SAOCOM data are descending orbit data, with a heading angle of 192.91°, incidence angle of 36.15°, wavelength of approximately 24 cm, and resolution of 10 m. Meanwhile, Sentinel-1A precise orbit files and 30 m DEMs are used to eliminate the effects of orbit errors and topographic phases. The Sentinel-1A data were processed using the Small Baseline Subset InSAR (SBAS-InSAR) technique, and the SAOCOM data were processed using the conventional two-pass Differential InSAR (DInSAR) method.
Table 1.
A comparison of the parameters of different SAR data.
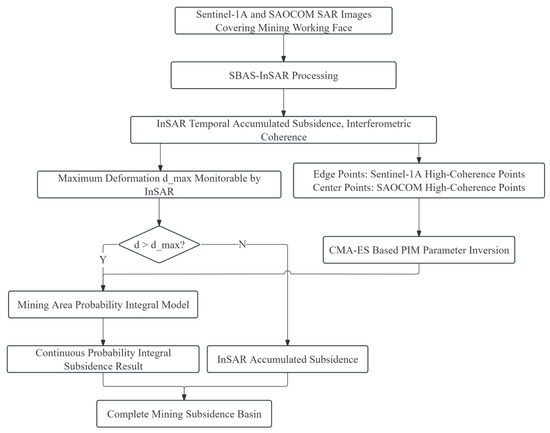
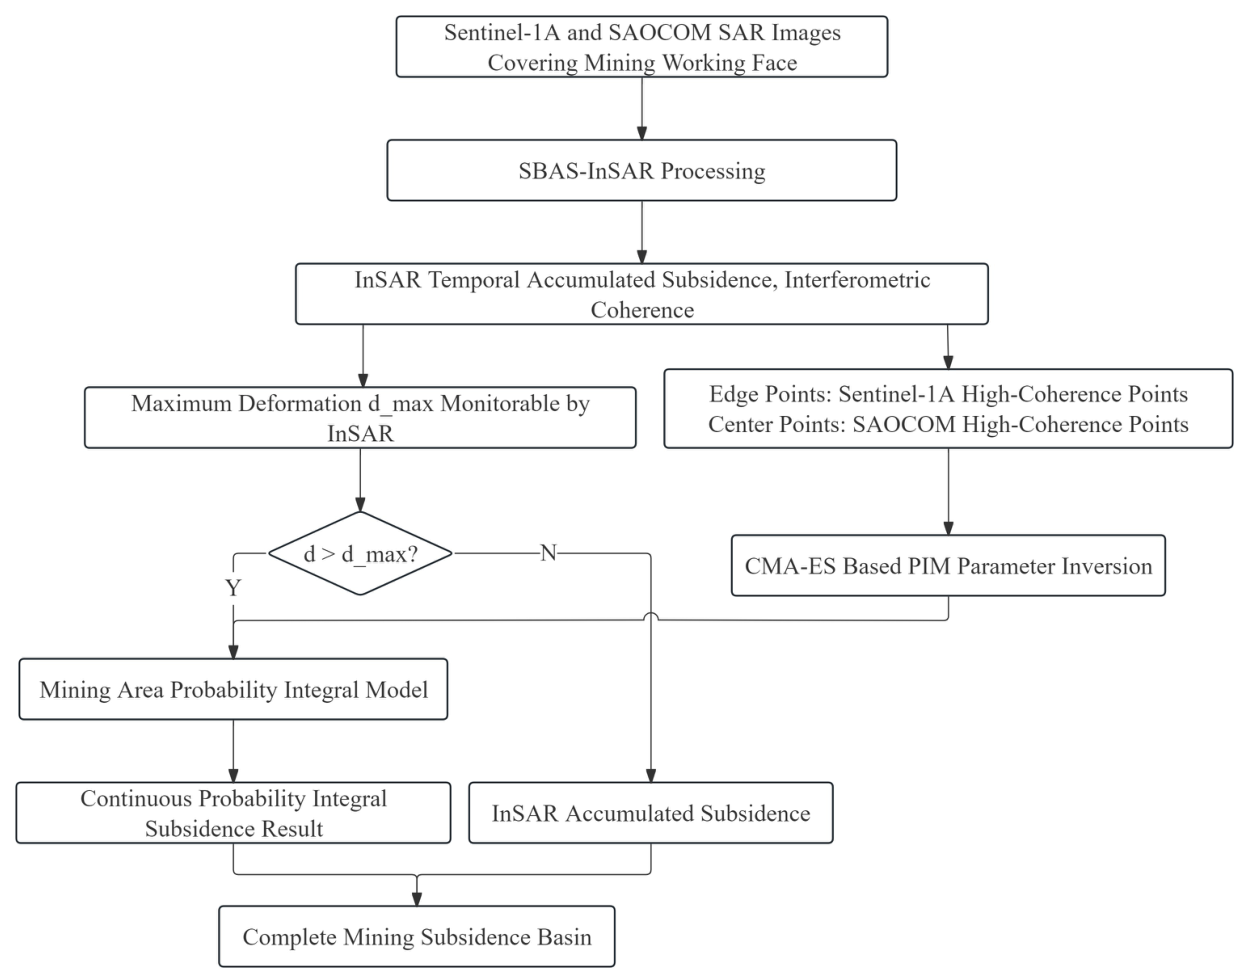
A flowchart of the workflow is shown in Figure 2.
Figure 2.
A workflow diagram of SBAS-InSAR.
2.3. InSAR Maximum Deformation Gradient Theory
The InSAR maximum deformation gradient theory is a core theory for assessing the capability of Synthetic Aperture Radar Interferometry (InSAR) technology to monitor surface deformation. Its principle can be defined from two aspects: ideal conditions and practical application scenarios. Under ideal conditions, InSAR captures the relative phase information of surface deformation through interference fringes, while the deformation gradient describes the intensity of relative displacement between any two points. Massonnet and Feigl [24] found that half of the ratio of the radar wavelength to pixel side length can be detected with only InSAR interferograms. They proposed that the theoretical maximum deformation gradient detectable with InSAR is determined by radar system parameters, with the following calculation formula:
Here, represents the radar wavelength, and is the pixel size. This formula indicates that the theoretical maximum deformation gradient is positively correlated with the radar wavelength and negatively correlated with the pixel size. Specifically, using InSAR, the longer the radar wavelength and the smaller the pixel size, the larger the theoretically detectable deformation gradient. For example, the theoretical maximum deformation gradient of the multi-looked C-band Sentinel-1A image (with a resolution of 20 m × 20 m) is approximately 1.4 × 10⁻³, while that of the L-band ALOS image (with a resolution of 10 m) can reach 11.5 × 10⁻³ [21].
The theoretical value under ideal conditions does not consider error interference in actual monitoring. In practical InSAR applications, factors such as orbital errors, spatiotemporal decorrelation (e.g., vegetation coverage and rapid deformation), and atmospheric delay significantly reduce the detectable maximum deformation gradient to below the theoretical value. By analyzing the impact of coherence on deformation gradient monitoring, the authors of [25] proposed the following calculation formula for the actual maximum deformation gradient:
Here, represents image coherence (with a value range of 0 to 1), which reflects the phase stability between pixels in SAR images. This formula indicates that the actual maximum deformation gradient is linearly and positively correlated with coherence: the higher the coherence, the greater InSAR’s ability to monitor large-gradient deformations. When the coherence is lower than a certain threshold, for example, Sentinel-1A data with a wavelength of 5.6 cm and a resolution of 20 m, if the coherence , then , meaning that InSAR cannot effectively extract deformation information.
Based on the actual maximum deformation gradient, the maximum detectable deformation magnitude of InSAR in multi-temporal interferometric processing can be further calculated. For N interference pairs with an average coherence of and independent accumulation, combined with the pixel size , the maximum detectable deformation magnitude is
This value, as a quantitative indicator of InSAR’s monitoring capability, is used to demarcate the deformation areas where it is applicable, thereby providing a threshold basis for fusion with methods such as the probability integral method [26].
2.4. Probability Integral Model
The Probability Integral Model (PIM) is employed to predict surface deformation in mining areas using random medium theory, which holds that underground goafs formed by mining activities cause movement of the overlying rock layers and the surface. The surface impact of a single tiny mining unit can be described with a probability density function, and the overall deformation resulting from the superposition effect of multiple units can be solved through integral operations [27]. Its core idea is to consider the movement of rock layers and the surface caused by mining as a random phenomenon that follows a normal distribution. It simulates the spatial morphology of surface displacement basins using probability density functions and then derives the three-dimensional deformation components in the vertical and horizontal directions (east–west and north–south). By integrating geological mining parameters and surface movement parameters, this model realizes the quantitative calculation of three-dimensional deformation in mining areas, with the following principles: For a working face with a strike length of and dip length of , vertical W, east–west , and north–south at any point can be calculated using the following formulas. The maximum vertical displacement value is determined by the coal seam thickness m, subsidence coefficient q, and coal seam dip angle :
The vertical displacement at any point is obtained by superimposing the displacement components on the main strike and dip sections:
Among them, the main strike section displacement component and main dip section displacement component are expressed by probability integrals:
In the formulas, the main influence of radii in the strike, downhill, and uphill directions are, respectively, given by
where H, , and are the mining depths in the corresponding directions; and , , and are the tangents of the main influence angles. The calculated lengths in the strike and dip directions are defined as
where are the inflection point offsets, is the mining influence propagation angle, and denotes the error function.
East–west and north–south are related to vertical displacement and are formed by superimposing the horizontal components in the strike and dip directions. The formulas for the northward and eastward surface deformation components are given by
Among them, the strike horizontal component and dip horizontal component are
where b is the horizontal movement coefficient, is the angle between the working face strike and the due north direction, and is the angle between the working face strike and due east direction.
2.5. Parameter Inversion Based on CMA-ES Algorithm
2.5.1. Principle of CMA-ES Algorithm
The CMA-ES (Covariance Matrix Adaptation Evolution Strategy) is a meta-heuristic algorithm based on evolutionary strategies developed by Nikolaus Hansen et al. [28]. It simulates the process of biological evolution in nature to achieve optimization. The core idea of CMA-ES is to iteratively search for optimal solutions by adapting a multivariate normal distribution. Unlike gradient-based methods, CMA-ES does not require computing the gradient of the objective function, making it suitable for non-smooth and nonlinear optimization problems. The algorithm generates a population by sampling from a multivariate normal distribution , where is the mean vector of the population distribution, is the step size (scaling factor), and C is the covariance matrix that characterizes the distribution shape.
- Initialization
The algorithm begins with the initialization of parameters: the mean vector , step size , evolution paths , covariance matrix (identity matrix), and generation counter .
- Iteration Process
- 1.
- Population Sampling
In each generation g, offspring individuals are generated by sampling from the current distribution:
where represents the k-th individual in the -th generation, and denotes a multivariate normal distribution with zero mean and covariance matrix .
- 2.
- Fitness Evaluation and Selection
The fitness function values of the offspring individuals are evaluated and sorted. The individuals with the highest fitness are selected to form the current optimal subgroup.
- 3.
- Mean Update
The mean vector is updated using a weighted recombination of the selected individuals:
where , with . The weights are assigned such that individuals with higher fitness receive larger weights, and typically, .
- 4.
- Covariance Matrix Adaptation
The covariance matrix is adapted to enhance exploration in promising directions. This involves updating the evolution path and adjusting the covariance matrix based on the distribution of selected individuals.
- 1.
- Evolution path update for the covariance matrix:where is the learning rate for the evolution path, and is the variance effective selection mass.
- 2.
- Covariance matrix update:where is the learning rate for the covariance matrix update, and .
- 3.
- Step size adaptation: The step size is updated using an evolution path specifically for step size control:where is the learning rate for the step size adaptation, is a damping parameter, and is the expected length of a standard normally distributed random vector.
The iteration continues until a stopping criterion is met, such as reaching the maximum number of generations or achieving a satisfactory fitness value. CMA-ES exhibits strong global search capability and adapts well to high-dimensional problems, with relatively fast convergence. However, it has drawbacks, including numerous algorithm parameters, complex adaptation processes, and high computational cost. In hyperparameter optimization, CMA-ES demonstrates good time performance and results with high stability, making it suitable for various learning tasks [29].
2.5.2. PIM Parameter Inversion Based on CMA-ES Algorithm
In the parameter inversion process of the Probability Integral Model (PIM), the Covariance Matrix Adaptation Evolution Strategy (CMA-ES) algorithm efficiently optimizes key parameters by adaptively adjusting the search distribution. The detailed procedure is outlined as follows.
First, the parameters to be inverted for the PIM are determined. As described in Section 3.3, the inversion parameters of PIM include the subsidence coefficient q; the main influence angles , , and (corresponding to the strike, uphill, and downhill directions, respectively); the inflection point offsets , , , and ; the mining influence propagation angle ; and the horizontal movement coefficient b. These parameters collectively form the parameter vector to be solved:
The line-of-sight (LOS) deformation obtained from Interferometric Synthetic Aperture Radar (InSAR) represents the projection of three-dimensional deformation onto the radar’s line-of-sight direction. The geometric relationship is governed by the satellite orbit parameters (incidence angle , azimuth angle ), expressed as
where denotes the radar wave incidence angle, represents the satellite orbit azimuth angle, indicates the vertical deformation (positive for upward movement), corresponds to the east–west deformation (positive for eastward displacement), and signifies the north–south deformation (positive for northward displacement).
Consequently, it is essential to project the vertical displacement W, east–west displacement , and north–south displacement predicted by the PIM onto the LOS direction corresponding to the InSAR results. The projection is formulated as
In SBAS-InSAR results, n high-coherence points are extracted from the displacement area as known points. Their deformation values constitute the SBAS-InSAR monitoring vector:
Simultaneously, the PIM-predicted LOS deformation values at the corresponding points are computed using the Probability Integral Model, forming the predicted value vector:
The optimization objective is to minimize the sum of the squared residuals between the SBAS-InSAR monitoring values and PIM-predicted values. The objective function is defined as
Subsequently, the CMA-ES algorithm is employed to optimize parameters iteratively. The main steps are as follows:
- 1.
- Initialization: Define the search range of the parameter vector , and initialize the mean , step size , and covariance matrix .
- 2.
- Population sampling: During the g-th iteration, generate a population of candidate parameter vectors by sampling from the normal distribution .
- 3.
- Fitness evaluation: Compute the objective function value for each candidate parameter vector, rank them by fitness, and select high-quality individuals.
- 4.
- Parameter update: Update the mean , covariance matrix , and step size based on the high-quality individuals to enhance the search capability in promising parameter regions.
- 5.
- Termination condition: Repeat the aforementioned steps until the iteration count reaches a predefined threshold or the objective function value converges, at which point the iteration is terminated.
The CMA-ES-based parameter inversion method effectively combines the adaptive search capability of the CMA-ES algorithm with the physical mechanism of the PIM, enabling high-precision inversion of mining displacement parameters.
2.6. Three-Dimensional Deformation Solution (TDS)
Synthetic Aperture Radar Interferometry (InSAR) provides one-dimensional deformation measurements along the radar line-of-sight (LOS) direction. However, in scenarios such as mining-induced subsidence and crustal deformation monitoring, three-dimensional displacement components (vertical , east–west , and north–south ) are often required. These can be retrieved through multi-source data fusion or model-constrained inversion approaches [30]. The fundamental principle involves constructing an overdetermined system of equations using surface deformation measurements from multiple viewing geometries.
When at least three non-coplanar LOS deformation measurements are available for the same area, a system of equations can be established to solve for the three-dimensional displacement components [31]. Let represent the LOS deformation from n different acquisition geometries, with corresponding incidence angles and azimuth angles . The geometric relationship between the LOS deformation and the three-dimensional displacement vector can be expressed as
Equation (23) can be expressed in matrix form as
where is the vector of LOS deformation measurements, is the design matrix composed of geometric coefficients, and is the three-dimensional displacement vector.
When , the system becomes overdetermined, and the three-dimensional displacement components can be estimated using the weighted least squares method:
where is the weight matrix of the observations, which accounts for the variance–covariance structure of the measurement errors. The diagonal elements of are typically set as the inverse of the variance of each LOS measurement, while off-diagonal elements may represent spatial or temporal correlations.
This approach enables the retrieval of three-dimensional surface deformation fields from multiple InSAR acquisitions with different viewing geometries, providing crucial information for geophysical modeling and hazard assessment.
2.7. Data Processing Workflow
To ensure the reproducibility of the study, the key processing parameters and strategies for the SBAS-InSAR workflow are detailed below:
- Interferometric Pairing Strategy: The SBAS-InSAR technique was employed to connect short baseline SAR images. The interferometric pairs were formed based on two main criteria: a spatial baseline threshold and a temporal baseline threshold. The maximum allowable spatial baseline was set to 300 m, and the maximum allowable temporal baseline was set to 200 days. This configuration aimed to minimize the geometric and temporal decorrelation effects.
- Phase Unwrapping Algorithm: Phase unwrapping was performed using the Minimum Cost Flow (MCF) algorithm. This method is effective in resolving the phase ambiguities by finding the smoothest possible phase surface that satisfies the interferometric closure.
- Differential Interferogram Filtering: Goldstein filter was applied to the wrapped differential interferograms to reduce noise while preserving the fringes. The filtering parameters were set as follows: the number of looks in the range direction () was 2, and that in the azimuth direction () was 4. The adaptive filter strength () was set to 0.5 to balance noise reduction and feature preservation.
- Atmospheric Correction: To mitigate the low-frequency atmospheric phase artifacts, the Generic Atmospheric Correction Online Service (GCPC) was utilized. This step corrected for stratified tropospheric delays caused by changes in elevation and weather conditions.
- Displacement Inversion: The Singular Value Decomposition (SVD) method was employed to solve for the deformation time series. The least squares method was applied to determine the deformation rate and cumulative displacement for each pixel.
The SBAS-InSAR processing parameters and procedures in this study are similar to those described in [32]. Therefore, only a brief overview is provided here, without extensive elaboration.
SBAS-InSAR processing was conducted separately for two types of satellite images, SAOCOM and Sentinel-1, covering the study area. Among these, five SAOCOM images span the period from 2 January to 25 May 2025, with the image acquired on 2 January serving as the master. A temporal baseline threshold of 48 days and a spatial baseline threshold of 600 m were set, yielding four interferometric pairs. Thirteen Sentinel-1 images cover the period from 7 January to 31 May 2025, with the 7 January image as the master. Here, a temporal baseline threshold of 12 days and a spatial baseline threshold of 400 m were applied, generating twelve interferometric pairs.
The same processing workflow was adopted for both datasets. High-coherence points were selected using a coherence threshold of 0.3 to ensure phase stability. A 30 m resolution digital elevation model (DEM) was introduced to remove topographic phases. After optimizing the interferograms through Goldstein filtering, phase unwrapping was performed using the Minimum Cost Flow (MCF) method. To mitigate atmospheric delay and residual topographic errors, two iterations of SBAS-InSAR inversion were performed: the first separated atmospheric phases from deformation signals, and the second corrected residual errors to improve accuracy.
3. Results
3.1. Simulation Experiment
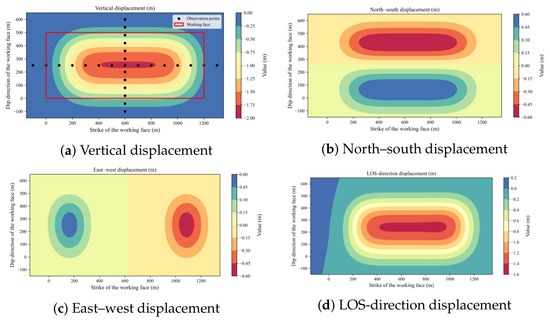
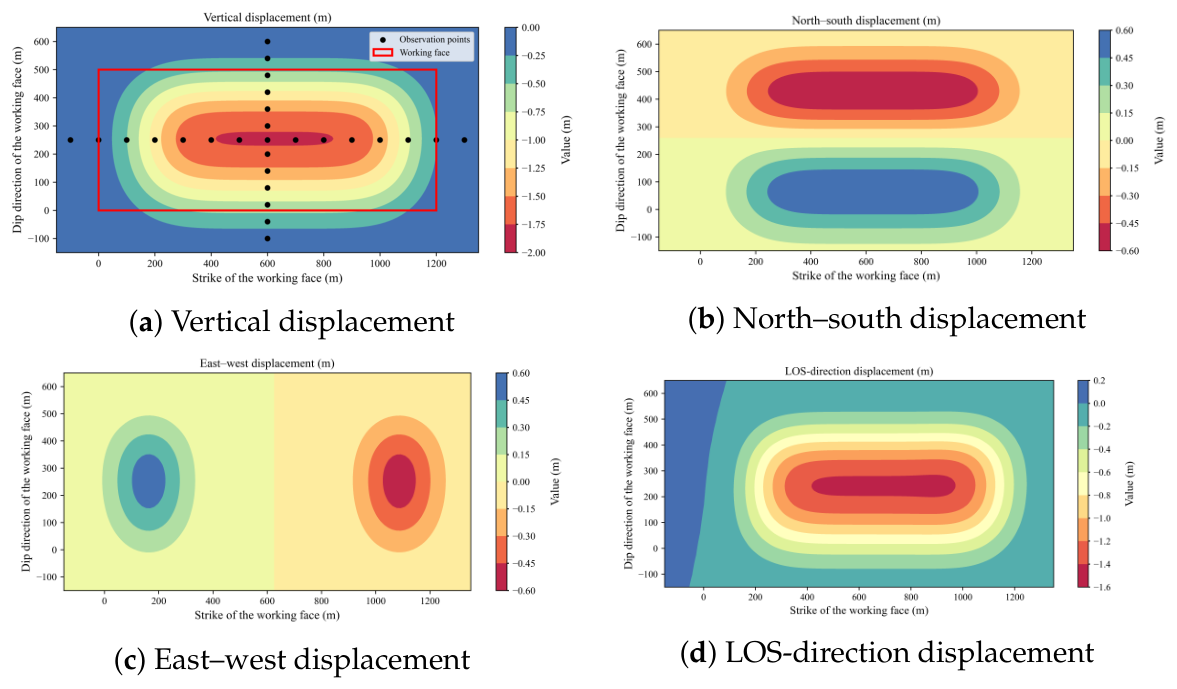
To verify the reliability of the Covariance Matrix Adaptation Evolution Strategy (CMA-ES) optimization algorithm, this study employed a numerical simulation approach. A simulated mining panel was designed with the parameters detailed in Table 2. Two observation lines were established along the strike and dip directions of the panel, comprising a total of 27 simulated monitoring points. Three-dimensional deformation results for the simulated panel were calculated using the Probability Integral Model (PIM), as illustrated in Figure 3.
Table 2.
The parameters of the simulated working face.
Figure 3.
Deformation map of the simulated working face.
Using only single-direction observation data (vertical or horizontal) for inversion can lead to unstable parameter estimates. To better simulate actual InSAR observation data, the three-dimensional deformation results from PIM are converted to SAOCOM line-of-sight (LOS) deformation using Equation (21). The SAOCOM LOS deformation integrates both vertical and horizontal displacement components, thereby providing more reliable inversion results.
Figure 3 illustrates the deformation patterns of the simulated working face, including (a) vertical, (b) north–south, (c) east–west, and (d) SAOCOM LOS-direction displacement. To better simulate actual InSAR observation data, the three-dimensional deformation results from PIM are converted to SAOCOM line-of-sight (LOS) deformation using Equation (21). To simulate real InSAR observation conditions, we added both atmospheric artifacts (including linear stratospheric delay and turbulent tropospheric delay) and Gaussian random noise to the synthetic LOS observations, consistent with the error characteristics of the SBAS-InSAR results. The SAOCOM LOS deformation integrates both vertical and horizontal displacement components, thereby providing more reliable inversion results.
To evaluate the reliability of the CMA-ES algorithm, a comparative analysis was conducted with three other optimization algorithms: Particle Swarm Optimization (PSO), simulated annealing (ANNEAL), and Genetic Algorithm (GA). Each algorithm performed 10 independent parameter inversions to mitigate random errors, and the average relative error was used to assess the inversion performance.
Table 3 presents the average value inversion parameters (AVIPs) and average relative errors (AREs) for the different optimization algorithms after 10 inversions. The CMA-ES algorithm demonstrates superior inversion performance for most parameters. Specifically, the ARE for parameters q, , , , , , and b are all 0%. For the remaining parameters (, , and ), the ARE obtained using CMA-ES are also lower than those of the other algorithms. These results indicate that the CMA-ES algorithm is more suitable for parameter inversion of the Probability Integral Model (PIM).
Table 3.
A comparison of the results of different optimization algorithms.
3.2. Data Processing Results
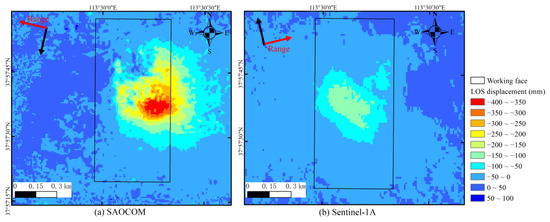
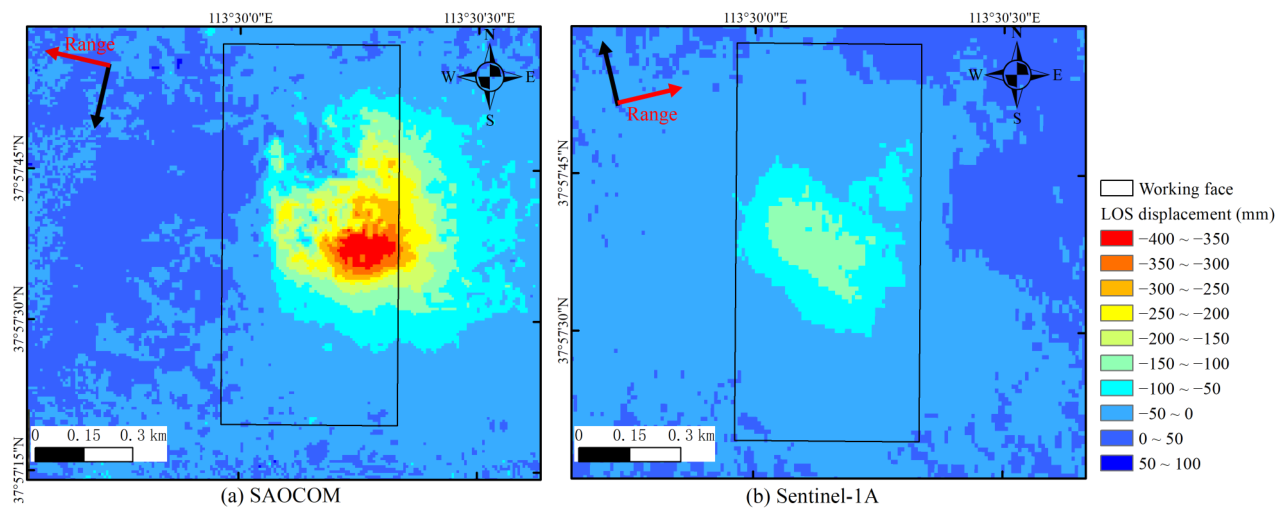
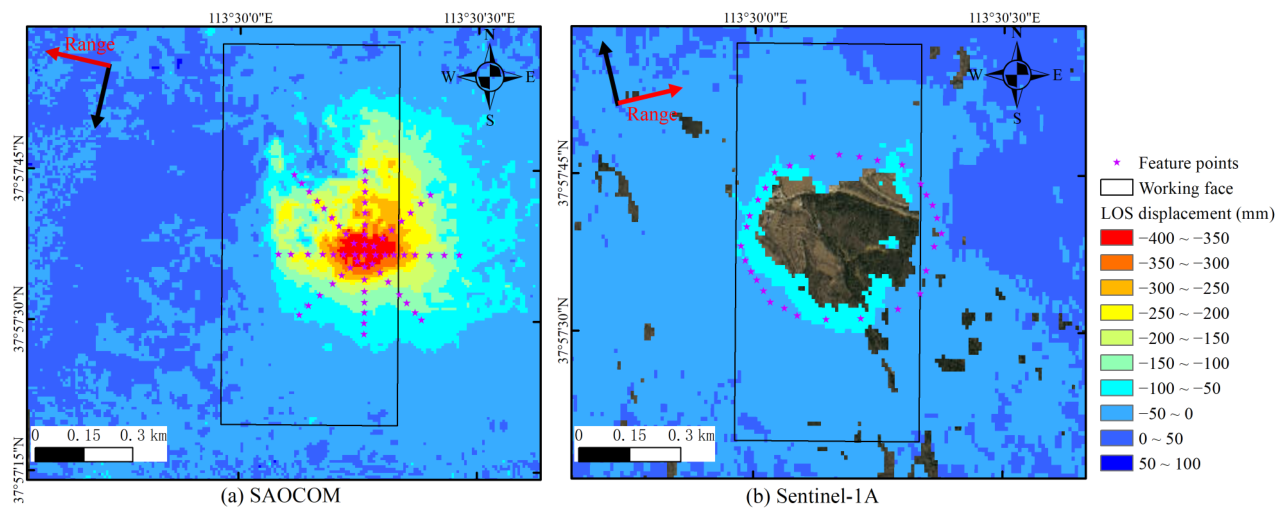
Finally, the cumulative line-of-sight (LOS) deformation results for the study area were obtained, as illustrated in Figure 4.
Figure 4.
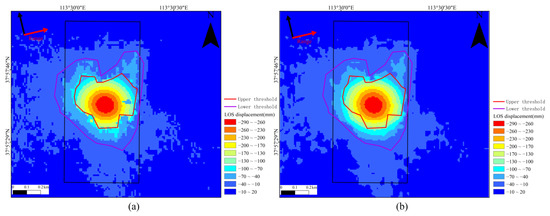
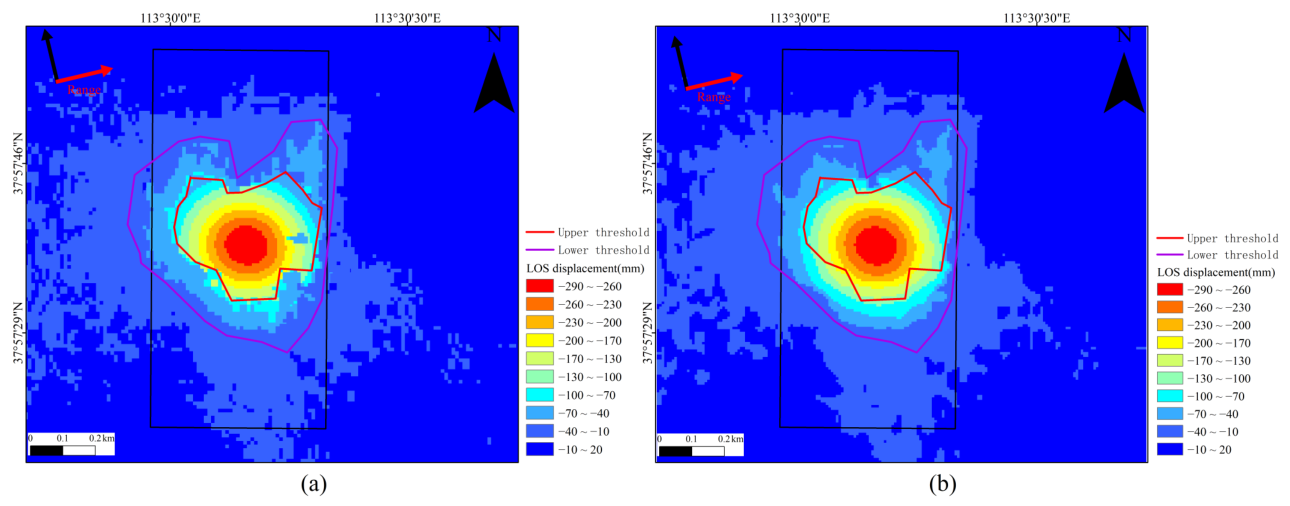
SBAS-InSAR result maps: (a) SAOCOM results; (b) Sentinel-1A results.
Figure 4 illustrates the differences in the results obtained from different datasets, and the locations of the displacement areas (negative values) vary between the two sets of results. This is because the deformation measurements derived from the SBAS-InSAR technique are not vertical but are instead projected along the satellite’s line-of-sight (LOS) direction. Different satellites possess distinct heading angles, incidence angles, and azimuth directions, which collectively lead to positional deviations in the identified displacement zones. Specifically, the area exhibiting displacement tends to elongate in the direction opposite to the satellite’s range direction.
Furthermore, the magnitude of displacement detected with the two datasets differs. The monitoring range of the SAOCOM satellite for LOS deformation over the mining area is . Compared with Sentinel-1A, SAOCOM exhibits a larger dynamic range for measuring deformation. This disparity is attributed to the differing operating wavelengths of the two satellites. The SAOCOM satellite operates in the L-band at a wavelength of approximately 24 cm, whereas Sentinel-1A operates in the C-band at a wavelength of only 5.6 cm. The longer L-band wavelength not only provides a higher upper limit for detectable deformation but is also less susceptible to decorrelation caused by vegetation growth and atmospheric disturbances.
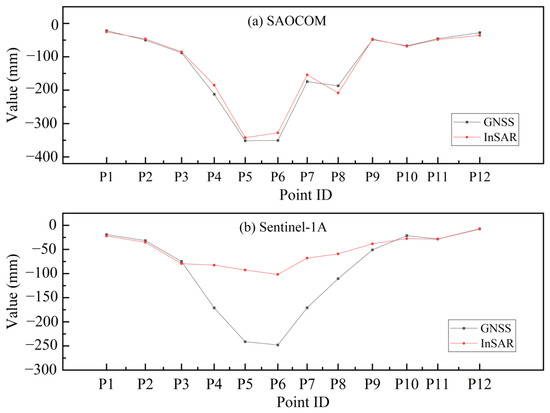
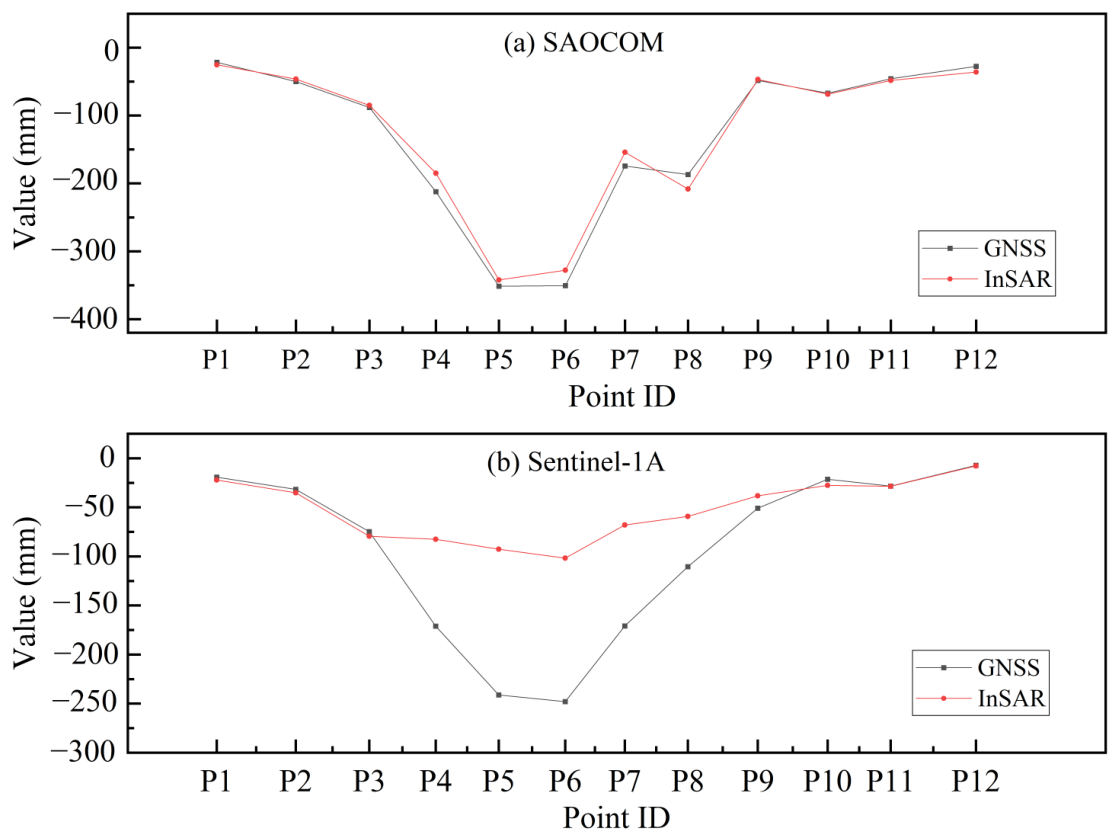
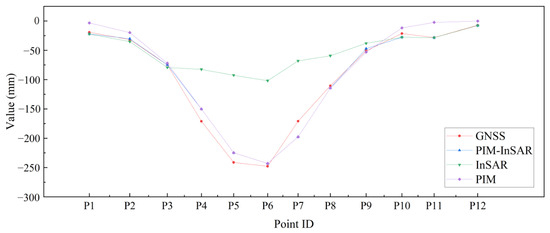
To validate the reliability of the InSAR processing results, the GNSS monitoring data (station locations are shown in Figure 1) were projected into the LOS direction of each satellite according to Equation (18) for comparison. The results of this comparison are presented in Figure 5. SAOCOM-derived deformations show high consistency with the GNSS projections both at the edges (points P1–P3, P10–P12) and the center (points P4–P9) of the displacement basin. This strong agreement is due to the robust anti-decorrelation capability of L-band data, which preserves high coherence even in areas of severe displacement and accommodates larger deformation gradients. In contrast, the Sentinel-1A results agree well with GNSS only at the basin edges (P1–P3, P10–P12) but show significant deviations in the central area. This inconsistency occurs because C-band data exhibit severe coherence loss in the central displacement zone, and the actual deformation likely exceeds the phase ambiguity limit of this wavelength, leading to measurement failure.
Figure 5.
A comparison between SBAS-InSAR results and GNSS data.
Based on the InSAR maximum detectable deformation gradient theory, the monitoring capabilities of the two datasets are evaluated. The Sentinel-1 data, operating in the C-band with a wavelength of 5.6 cm and a spatial resolution of 20 m, yield an average coherence of 0.47 after processing. The theoretical maximum detectable deformation of a radar system is positively correlated with its wavelength, inversely correlated with its pixel size, and directly influenced by coherence—higher coherence corresponds to stronger practical monitoring capability. Considering its configuration of 12 interferometric pairs, the composite calculation indicates that the maximum detectable deformation magnitude for this dataset is approximately 83 mm. The results become unreliable when the coherence falls below 0.3, as the monitoring capability approaches zero. In contrast, the SAOCOM data, operating in the L-band with a wavelength of 24 cm and a resolution of 10 m, achieves a higher average coherence of 0.62. The longer L-band wavelength not only provides a greater capacity for monitoring large-magnitude deformation but also exhibits stronger resistance to vegetation decorrelation. With its configuration of four interferometric pairs, the calculated maximum detectable deformation magnitude is approximately 449 mm, a threshold not exceeded by the actual SAOCOM results.
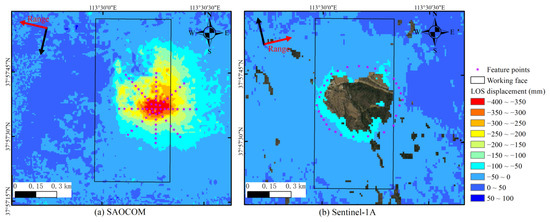
Guided by the above analysis, a strategy for selecting reliable InSAR monitoring points is implemented. For the Sentinel-1A results, areas with average coherence below 0.3 or with absolute deformation exceeding 83 mm are masked as unreliable. Monitoring points are then selected from the remaining valid areas. Due to the higher sensitivity of C-band Sentinel-1A data to subtle deformation, 30 points are chosen at the edges of the displacement basin, with their deformation values taken from the Sentinel-1A results. For other parts of the displacement area, 61 points are selected, with their values derived from the more robust SAOCOM results. The spatial distribution of all selected points is shown in Figure 6. Utilizing multi-source InSAR data in this manner enhances the robustness and stability of the subsequent inversion for the parameters of the Probability Integral Model.
Figure 6.
Distribution map of InSAR feature points: (a) 61 points in the displacement center; (b) 30 points at the displacement edge.
3.3. Displacement Prediction Using the PIM
Using the InSAR-derived deformation values from 91 feature points, the parameters of the PIM were inverted. The CMA-ES algorithm was employed for optimization with a detailed and fixed configuration to ensure stability and reproducibility. The parameter vector is defined as . The objective function (Equation (22)) minimizes the sum of squared residuals between the InSAR observations and the PIM-predicted line-of-sight deformation at the 91 feature points. The CMA-ES algorithm was configured with an initial step size determined as one-tenth of the average parameter range, a population size of 40, and a maximum iteration limit of 500. The optimization implements three integrated termination criteria, under which the algorithm terminates and is deemed converged when generation g exceeds 500, the standard deviation of the objective function over 20 consecutive generations is less than , or the relative variation of all inverted PIM parameters across 20 successive generations is below . The inverted PIM parameters for this working face are as follows:
These parameters were subsequently substituted into the PIM to calculate the surface deformation across the working face and its surrounding area. The Kriging interpolation method was then applied to generate a spatially continuous deformation field.
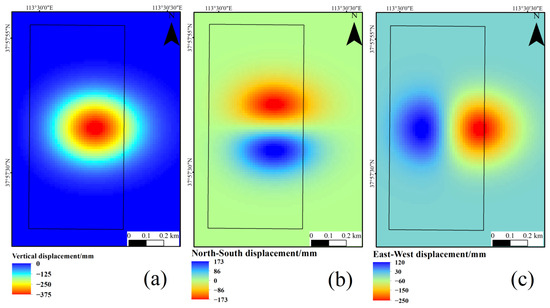
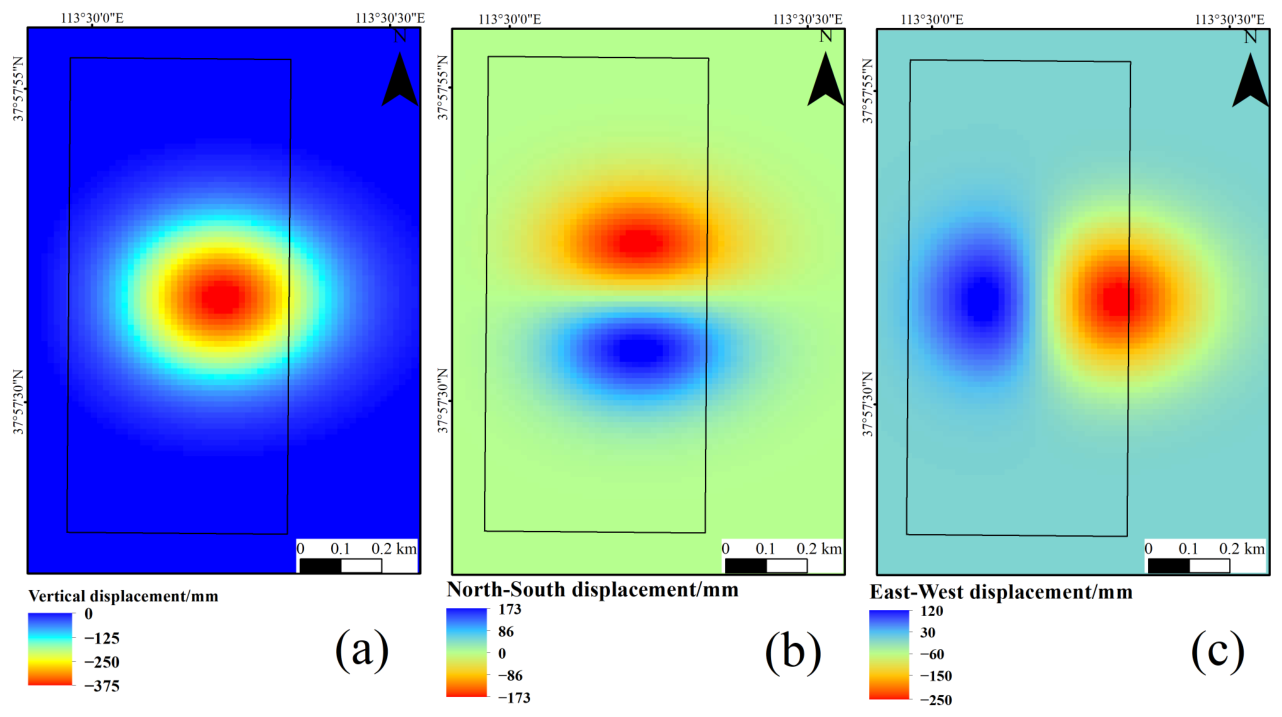
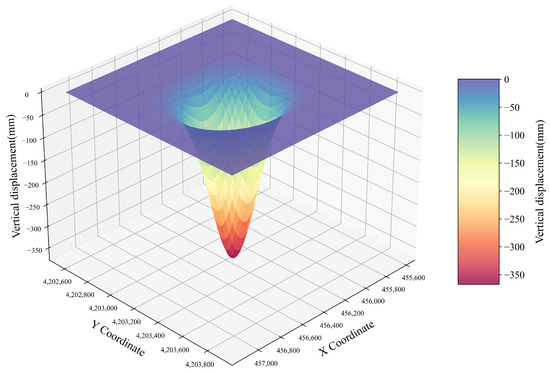
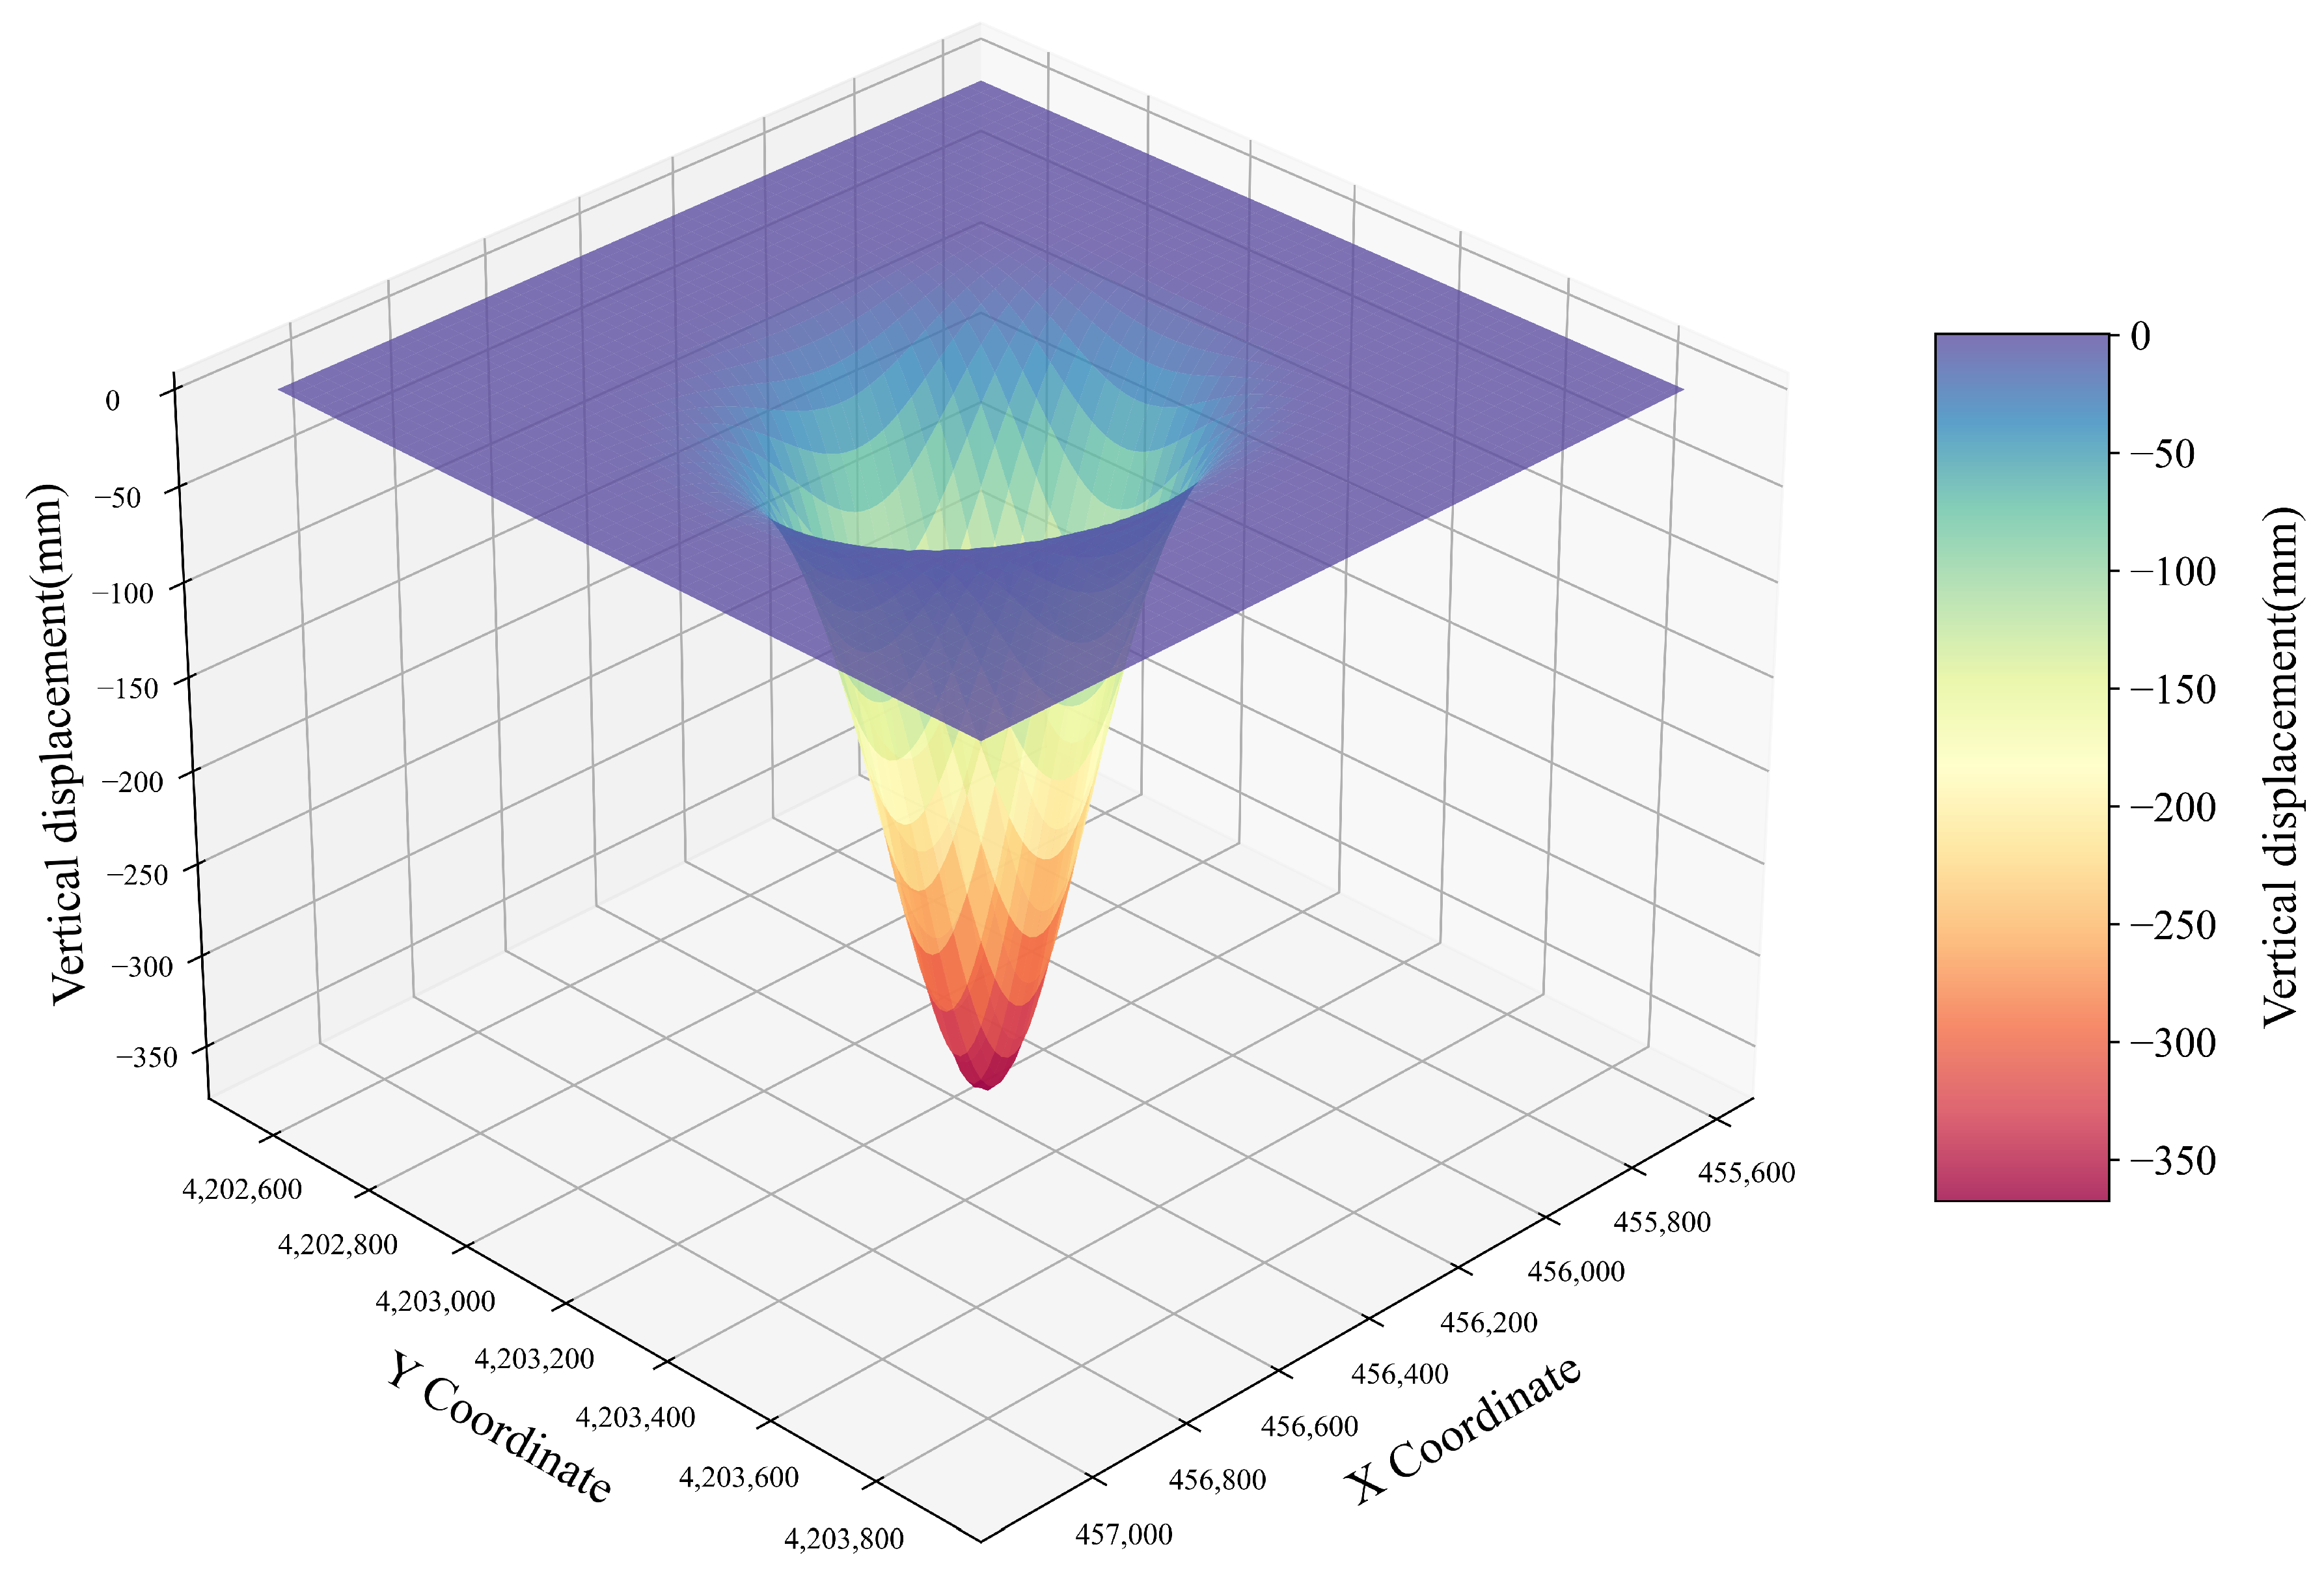
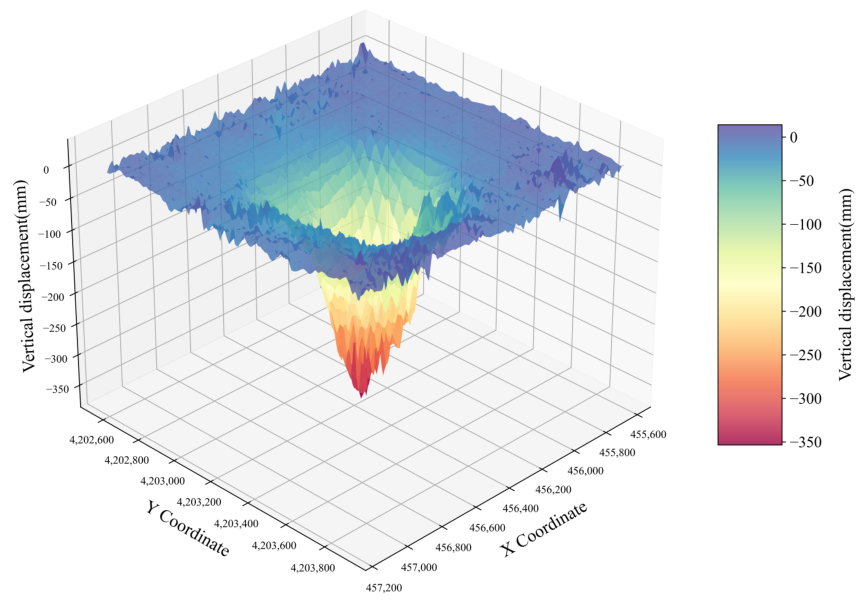
The three-dimensional surface deformation predicted by the PIM is shown in Figure 7 and Figure 8. The vertical displacement map indicates that the maximum displacement within the funnel is mm, with the displacement center located east of the working face’s geometric center. The north–south and east–west displacement maps reveal a convergent horizontal movement pattern: areas north of the displacement center displace southward, whereas those to the south move northward; similarly, areas east of the center shift westward, and those to the west shift eastward. Synthesizing the two horizontal components, the overall displacement field shows a clear inward trend toward the displacement center, consistent with the typical surface deformation characteristics observed above mining panels.
Figure 7.
PIM-predicted three-dimensional deformation result maps: (a) vertical displacement (upward displacement as positive); (b) north–south displacement (northward displacement as positive); (c) east–west displacement (eastward displacement as positive).
Figure 8.
A 3D visualization map of PIM-predicted results. X and Y are coordinates in the CGCS2000 coordinate system.
3.4. Data Fusion of SBAS-InSAR and PIM
The surface deformation predicted by the PIM typically shows negligible deformation around the periphery of the displacement funnel. In reality, however, the surrounding area of a mining panel is also affected by extraction activities, and actual surface deformation is influenced by external factors such as complex topography and groundwater fluctuations. Since the PIM primarily considers the impact of underground mining, it fails to capture these subtle peripheral deformations. In contrast, SBAS-InSAR technology is effective at monitoring small surface displacements but is limited to measurements along the line-of-sight (LOS) direction. Moreover, it suffers from decorrelation in areas of large deformation, such as the center of the displacement basin, rendering it unreliable for monitoring large-magnitude movements. Therefore, integrating the strengths of the PIM and SBAS-InSAR can yield a more accurate and comprehensive representation of surface deformation in the LOS direction.
Figure 9 shows that direct fusion of the two results can lead to discontinuities at the boundary. To address this, a maximum detectable deformation threshold is introduced to guide fusion:
Figure 9.
Data fusion result maps: (a) before weighted fusion; (b) after weighted fusion.
- 1.
- Upper threshold (): This is the maximum detectable deformation magnitude of InSAR, calculated by radar wavelength, pixel size, average coherence, and the number of interferometric pairs (Equation (3)). When , InSAR suffers from severe decorrelation and phase unwrapping failure, so only PIM predictions can provide reliable large-deformation information. In areas where the InSAR-measured deformation exceeds the maximum detectable threshold (), PIM prediction is adopted.
- 2.
- Lower threshold (0.4 × ): This is an optimized empirical threshold verified by GNSS measurements. We conducted comparative tests on multiple candidate thresholds ranging from 0.3 × to 0.7 × . The results demonstrate that when 0.4 × , the coherence of Sentinel-1A data is greater than 0.3 and favorable spatial continuity can be ensured. Thus, 0.4 × is determined to be an appropriate threshold. In areas where the InSAR measurement is less than 40% of the maximum detectable threshold ( 0.4 × ), SBAS-InSAR measurement is used directly.
In the transition zone where 0.4 × , weighted fusion of the SBAS-InSAR measurement and PIM prediction is performed using distance-squared weighting, which is adopted in the transition zone for three main reasons:
- 1.
- Guarantee spatial continuity: As a nonlinear weighting method, it eliminates abrupt boundary mutations between InSAR and PIM results, ensuring the fused deformation field matches the continuous, nonlinear variation characteristics of mining subsidence.
- 2.
- Adapt to error distribution: The squared weight nonlinearly amplifies the proportion of high-precision data. In the transition zone, the weight of InSAR decays rapidly as deformation approaches , while the weight of the PIM increases gradually—this matches the error pattern (InSAR is more accurate for small deformations; PIM is more reliable for large deformations).
- 3.
- Suppress noise oscillation: Compared with linear weighting, distance-squared weighting reduces weight fluctuation and noise superposition, significantly improving the stability and reliability of fusion results.
The fusion is mathematically described as follows:
where the weights are given by
Finally, a complete map of the line-of-sight (LOS) deformation over the surface of the mining area was obtained, as shown in Figure 9. The fused result spatially encompasses the entire displacement area: it retains the subtle deformation details captured by Sentinel-1A at the basin edges, while the large-magnitude deformations in the decorrelated central area are complemented by the PIM predictions, thereby ensuring spatial continuity of the displacement field.
To verify the reliability of the fusion result, a comparison with GNSS data was conducted. Quantitative error analysis (Figure 10 and Table 4) demonstrates that the consistency between the fused result and GNSS data is significantly better than that between the InSAR result and GNSS data. Specifically, after fusion, the mean absolute error (MAE) at the edges of the displacement basin decreased from 3.41 to 2.107 mm, and the MAE in the central area was substantially reduced from 91.669 to 12.752 mm. The high agreement between the fused deformation and GNSS measurements confirms the reliability of the proposed fusion method.
Figure 10.
Comparison map of fusion results.
Table 4.
Error statistics of fusion results.
4. Discussion
The core principle of calculating three-dimensional deformation is to construct a system of equations using line-of-sight (LOS) deformation measurements from multiple viewing geometries, thereby solving for the three-dimensional (vertical, east–west, and north–south) displacement components of the ground surface. This process requires at least three independent sets of LOS deformation data to avoid rank deficiency in the equation system. In this study, only two sets of measured LOS deformations were acquired via data fusion (using ascending Sentinel-1A and descending SAOCOM data). To meet the requirement for three independent observations, a third LOS deformation set was simulated using the Probability Integral Model (PIM). According to the description in [33], a mathematical model for deriving LOS spatial parameters based on the probability integral method was derived, and the simulated satellite parameters were set as follows: heading angle = and incidence angle = . First, the three-dimensional deformation field of the study area was predicted by the PIM and then projected onto the LOS direction of this simulated satellite according to Equation (13) to generate the third LOS deformation dataset.
Considering the difference in reliability between the measured and simulated data—the InSAR measurements were validated by GNSS and exhibit small errors in high-coherence areas, whereas the simulated data inherently carry uncertainties from the PIM parameter inversion—a weighted least squares method was employed to solve the overdetermined equation system. The two sets of measured LOS data were assigned a weight of 1.0, reflecting higher confidence in their accuracy, while the simulated LOS data were assigned a weight of 0.3 to mitigate the potential influence of their errors. This simulation enables a well-posed 3D inversion, and this weighting scheme represents a pragmatic and reasoned comp. The weights were initially set based on an a posteriorianalysis of the residuals between the PIM-simulated LOS deformation and the available SAOCOM measurements in coherent areas. This analysis indicated a higher level of confidence in the two direct InSAR measurements compared to the model simulation. The specific ratio was chosen empirically after a sensitivity test, which showed that the final 3D solution was robust to small variations around these values, with the chosen set yielding the minimal overall error against GNSS validation points in our case.
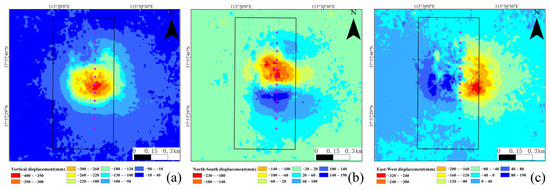
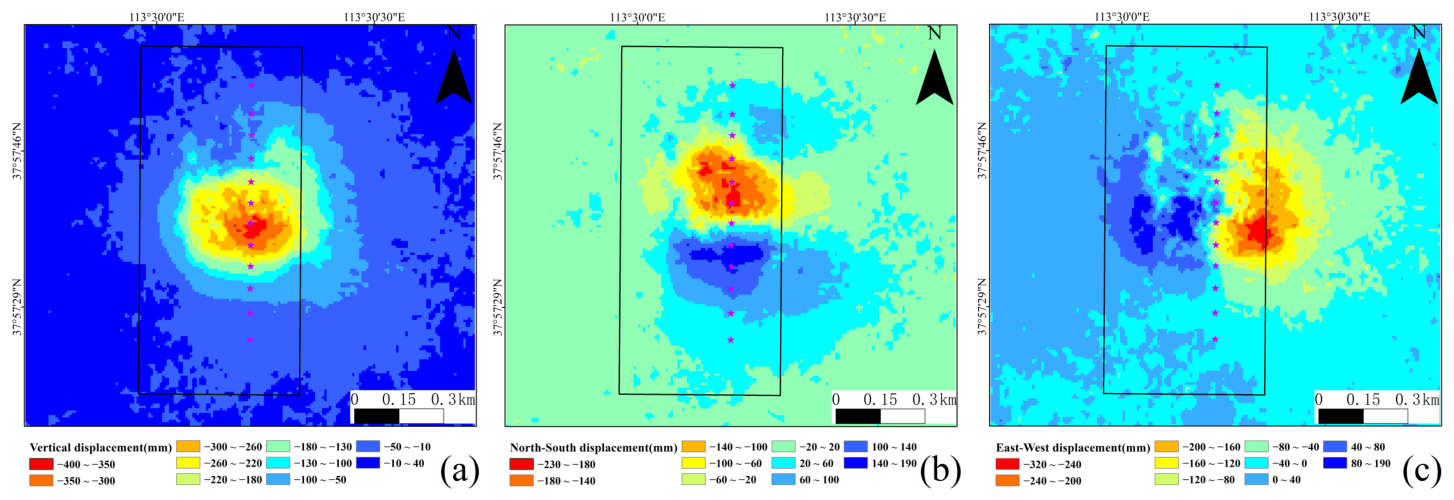
Figure 11 presents the three-dimensional surface deformation of the mining area obtained using the aforementioned calculation. From January to June 2025, significant ground displacement occurred in the 150316 working face. The displacement center is located east of the face’s central axis, which aligns well with the area of concentrated mining activity. Furthermore, the results successfully captured minor deformations induced by mining near the working face. The continuous advance of mining disturbs the overlying strata, affecting the surrounding environment to varying degrees, a finding consistent with the area’s actual mining and geological conditions. Such detailed deformation patterns are often smoothed or overlooked in predictions based on the PIM alone, underscoring the advantage of the proposed integrated method for monitoring the edges of the displacement basin.
Figure 11.
Three-dimensional deformation solution result maps: (a) vertical displacement (upward displacement as positive); (b) north–south displacement (northward displacement as positive); (c) east–west displacement (eastward displacement as positive).
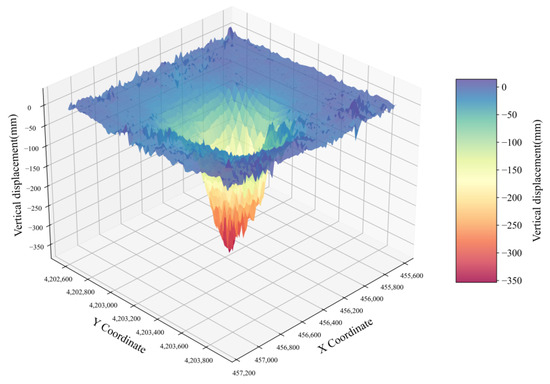
The results reveal a characteristic mining-induced subsidence basin above the 150316 longwall panel from January to June 2025. The maximum vertical displacement is located slightly east of the panel center, correlating with the area of intensive extraction. The horizontal displacement field shows ground movement directed radially inward toward the displacement center, consistent with the general mechanics of mining subsidence. Notably, the high-resolution 3D displacement field reveals distinct local anomalies and heterogeneous deformation patterns adjacent to the working panel, as evidenced by the distortion and discontinuity of displacement contours in Figure 12. To determine the causes of these abnormal spatial distribution patterns, further on-site investigations are necessary. However, the detectable non-uniformity of deformation indicates that the integrated InSAR-PIM dataset has high sensitivity in capturing the subtle and complex deformation features that would otherwise be isolated or overlooked.
Figure 12.
A 3D visualization map of the three-dimensional deformation solution results. X and Y are coordinates in the CGCS2000 coordinate system.
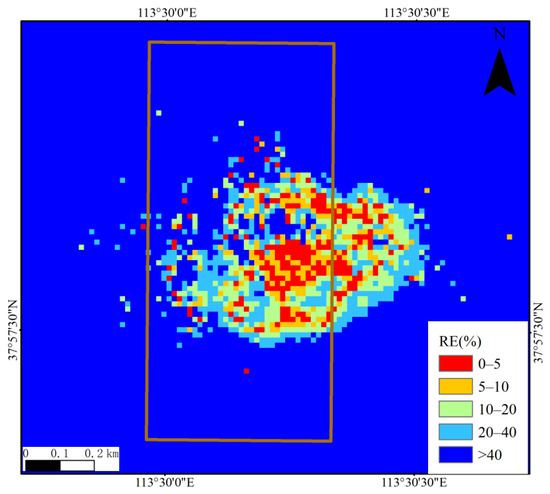
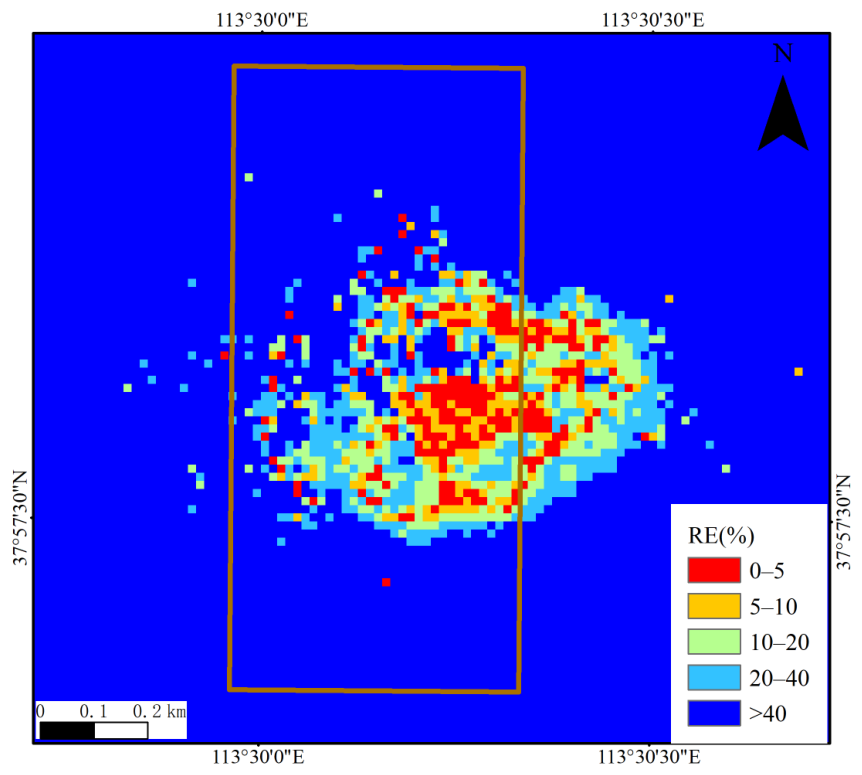
To quantitatively evaluate the performance of the CMA-ES-optimized PIM, we projected the 3D deformation field onto the SAOCOM LOS geometry and calculated the relative error (RE)—rather than absolute error, which would be misleading due to the large spatial variation in deformation magnitudes across the mining subsidence basin—between the projected results and real SAOCOM observations in Figure 13. As shown in the figure, the lowest relative error (<10%) is concentrated in the central subsidence zone, indicating that the PIM can accurately reproduce the large deformation at the mining subsidence center, which is the most critical region for mining safety monitoring. This quantitative validation confirms the reliability and superiority of the optimized PIM, especially its advantage in simulating large deformations at the subsidence center.
Figure 13.
Relative error distribution between the PIM-projected deformation results and SAOCOM observations.
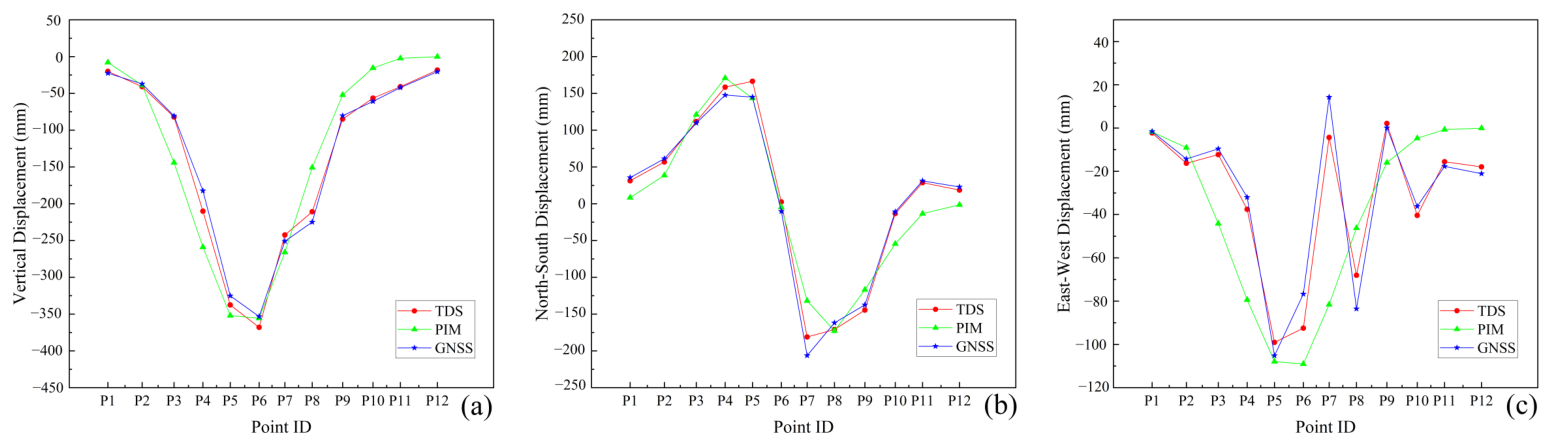
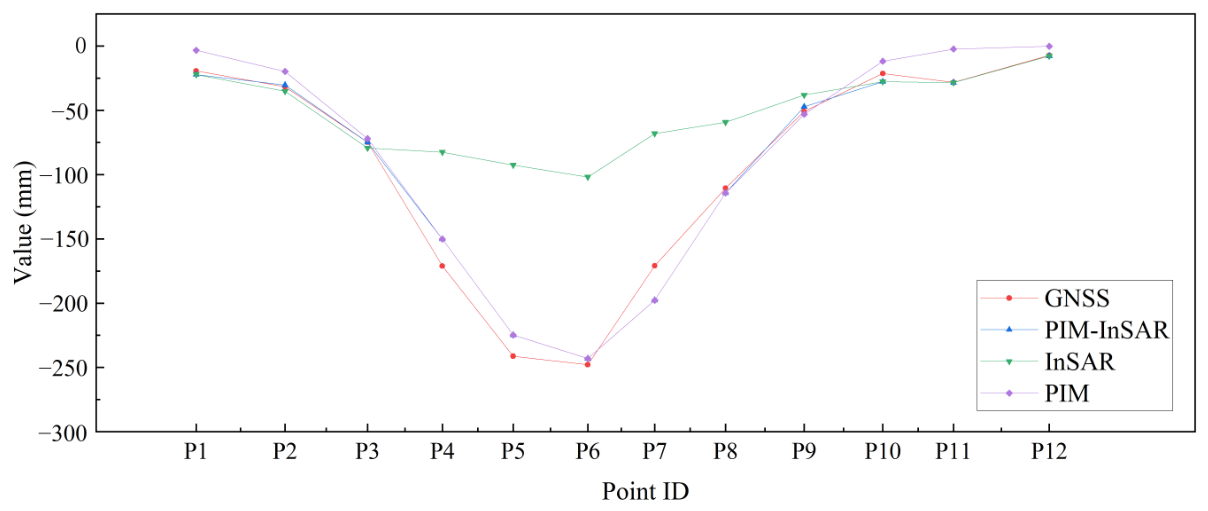
To further verify the reliability of the proposed method, monitoring values were extracted from 12 GNSS ground points distributed over the 150316 working face (the locations are shown in Figure 1b). A quantitative comparative analysis was performed on the three datasets: PIM predictions, 3D calculation results, and GNSS measurements. Points P1, P2, P3, P10, P11, and P12 are located in the edge region of the displacement basin, where deformation is relatively small, while points P4–P9 lie within the central area of severe displacement. The corresponding errors for points in these two regions are summarized in Table 5.
Table 5.
Error statistics of TDS and PIM.
A comparative analysis of the three-dimensional deformation solution (TDS) results, the PIM-predicted results, and GNSS measurements was conducted across three displacement components (see Table 5). The accuracy of the 3D solution is comprehensively superior to that of the PIM model. Specifically, the MAE for the TDS is lower than that for the PIM in all three directions—vertical, north–south, and east–west—in both the marginal and central zones of the displacement basin. This conclusively demonstrates that the PIM alone is inadequate for accurately representing the true 3D deformation field, particularly in capturing minor deformations at the basin edges and horizontal movements.
The advantage of the 3D solution is exceptionally pronounced in the marginal zone of displacement. Here, the MAE for vertical displacement is 2.599 mm, representing an accuracy improvement of approximately 91.0% compared with the PIM’s MAE of 28.961 mm. For the north–south component, the MAE is 3.335 mm (an 87.0% improvement over PIM’s 25.609 mm), and for the east–west component, it is 2.469 mm (an 86.3% improvement over PIM’s 17.999 mm). In this region, where deformation magnitudes are small, InSAR observations—particularly from C-band sensors—maintain high measurement precision. By integrating these high-precision InSAR observations, the 3D solution effectively corrects the systematic bias of the PIM, which tends to exhibit an overly rapid “convergence” at the basin edges. Consequently, our method demonstrates significantly enhanced sensitivity in detecting weak, asymmetric deformation induced by mining disturbances, which is crucial for assessing the impact of mining activities on surrounding sensitive infrastructure.
The 3D solution maintains its accuracy advantage in the central displacement zone as well. The MAEs in the three directions (13.614, 14.379, and 10.592 mm) are all lower than those of the PIM (32.023, 20.217, and 30.730 mm, respectively). Although the solution in this zone is primarily constrained by simulated PIM data, the incorporation of high-precision InSAR observations from the marginal and peripheral areas provides an overall “anchoring” and constraining effect on the inversion. This integration mitigates the accumulation and amplification of PIM parameter errors in the central zone, yielding a more reliable estimate of the 3D deformation field than that provided by the PIM alone.
Based on the comparative results presented in Figure 14 and Table 5, the following conclusions can be drawn:
- 1.
- From January to June 2025, both the PIM and 3D deformation decomposition method successfully detected ground displacement above the 150316 panel. The spatial extent of the displacement basin, the shape of the displacement profile, and the overall deformation trend obtained by the two methods are largely consistent with each other and agree well with the GNSS monitoring results.
- 2.
- The overall accuracy of the 3D calculation is superior to that of the PIM. In the vertical direction, the mean absolute error (MAE) of the 3D results in the edge area is 2.599, significantly lower than the PIM’s 28.961; in the center area, the 3D MAE is 13.614, also lower than the PIM’s 32.023. In the north–south direction, the 3D MAE at the edge is 3.335, much smaller than the 25.609 of the PIM; in the center, it is 14.379, compared to 20.217. Similarly, in the east–west direction, the 3D MAE at the edge is 2.469, markedly lower than the 17.999 of the PIM; in the center, it is 10.592, compared with 30.730. These results indicate that the 3D calculation yields smaller errors in both vertical and horizontal components, providing a more accurate representation of the actual surface deformation.
- 3.
- The advantage of the 3D calculation is particularly pronounced in the edge region of the displacement basin. For points P1–P3 and P10–P12, the 3D results show significantly smaller deviations from the GNSS data than the PIM results. Compared with the PIM, the average MAE of the 3D calculation decreased by 87.9% for vertical deformation, 87.0% for north–south deformation, and 86.3% for east–west deformation in this region. This demonstrates the 3D method’s enhanced capability to capture subtle peripheral deformations.
- 4.
- The fusion of multi-source data improves the reliability of deformation monitoring. The 3D calculation is based on the integrated use of SBAS-InSAR measurements and PIM simulations, combining the sensitivity of InSAR to small displacements and the strength of the PIM in capturing large-scale deformation trends. This synergy overcomes the individual limitations of each method (e.g., InSAR decorrelation in high-strain areas and the PIM’s neglect of minor edge deformations). As illustrated in the 3D deformation map, the fused result reveals fine-scale deformation heterogeneities and localized displacement anomalies near the working face. These abnormal spatial distribution patterns are associated with some linear structures. Our subsequent research efforts will be focused on whether these linear structures are related to small faults. Although specific structural attribution needs to be determined through specialized on-site mapping, the detection of this complex local deformation feature indicates that the proposed fusion method has a stronger descriptive ability in capturing the key details required for a comprehensive geological mechanics assessment.
- 5.
- Different regions exhibit distinct deformation characteristics, which in turn correspond to varying levels of adaptability of the monitoring methods. The edge of the displacement area is predominantly characterized by small-magnitude deformation. Here, the high sensitivity of SBAS-InSAR—especially that of C-band Sentinel-1A data—plays a key role in the fusion process, significantly improving the accuracy of the three-dimensional calculations. In contrast, the central part of the displacement area undergoes intense deformation. The combination of the large-deformation monitoring capability offered by L-band SAOCOM data and the trend simulation provided by the PIM helps reduce the errors inherent in either method. This demonstrates the complementary advantages of multi-source data in areas with different deformation intensities.
While this study obtained an optimal set of PIM parameters through CMA-ES optimization and subsequently performed data fusion and 3D displacement retrieval, the current framework offers room for deepening the quantitative analysis of how parameter uncertainty propagates into the final deformation field. Future work should aim to integrate a Monte Carlo approach, whose potential contributions could be realized at the following three levels:
- 1.
- Monte Carlo simulation can systematically explore the high-dimensional parameter space centered around the CMA-ES optimal solution. By repeatedly sampling from the joint posterior probability distribution of key parameters (e.g., the subsidence coefficient q, the main influence angle , and the inflection point offsets –), a large ensemble (e.g., tens of thousands) of physically credible parameter combinations can be generated. This would not only reveal the correlations between parameters but also provide a probabilistic foundation for the parameter estimates.
- 2.
- Introducing a Monte Carlo framework, combined with controlled variable experiments, would allow for the quantification of the relative contributions of different error sources (such as InSAR observation noise, threshold selection in the fusion strategy, and structural errors inherent to the PIM) to the final results. For instance, future studies could design experiments to address questions like: Compared to the uncertainty in PIM parameters, how significant is the impact of InSAR measurement noise itself on the final 3D displacement field? Such analysis can identify vulnerable links in the current methodological chain, providing clear priorities for future methodological improvements or data acquisition strategies.
- 3.
- Incorporating a Monte Carlo framework will help clarify the applicable boundaries of the method. Through extensive simulations of parameter and error propagation, the range of conditions (e.g., different geological settings and mining intensities) under which the method maintains its reliability can be more precisely defined. This will enable a more concrete and data-driven answer to the question of the method’s generality.
Figure 14.
A comparison of TDS and PIM results: (a) vertical displacement; (b) north–south displacement; (c) east–west displacement.
5. Conclusions
The core conclusion is that the systematic fusion of C-band (sensitive to minor deformations) and L-band (robust to large deformations) InSAR observations—achieved through a physics-based PIM model and the advanced CMA-ES optimizer—effectively resolves the longstanding challenges in mining areas: “central decorrelation” in InSAR and “edge neglect” in physical models. This approach realizes an adaptive, spatially optimal fusion of observational data and physical models. Furthermore, under the constraint of only two actual imaging geometries, the introduction of optimized PIM simulations as a “third perspective” enabled the construction of a robust 3D displacement retrieval framework. The investigation focused on the 150316 working face in the Yinying Mining Area, Yangquan City, Shanxi Province, yielding the following principal findings:
- 1.
- The CMA-ES algorithm significantly enhances the accuracy of PIM parameter inversion. Comparative simulation experiments demonstrate that the CMA-ES algorithm outperforms PSO, simulated annealing, and GA approaches in inverting key PIM parameters (e.g., the subsidence coefficient q, the main influence angle , and the inflection point offsets –). The average relative error for most parameters is minimized, and the remaining errors are also substantially lower than those of other algorithms. This confirms the reliability of CMA-ES in handling nonlinear, high-dimensional parameter optimization and provides an efficient inversion method for precisely applying the PIM.
- 2.
- Multi-source data fusion effectively compensates for the limitations inherent in single-method approaches. Sentinel-1A (C-band) data are sensitive to small-magnitude deformations, whereas SAOCOM (L-band) data are suitable for monitoring large-magnitude deformations. Their combination enables comprehensive coverage of displacement areas with varying degrees of deformation. Utilizing both datasets for PIM parameter inversion yields a predictive deformation field. Subsequently, a fusion strategy based on coherence thresholds—employing PIM predictions in low-coherence areas, InSAR measurements in high-coherence areas, and weighted fusion in transition zones—successfully mitigates InSAR decorrelation in regions of high deformation while capturing subtle edge deformations often neglected by the PIM. This process produces a complete and reliable line-of-sight (LOS) deformation map for the mining area.
- 3.
- The accuracy of the three-dimensional deformation retrieval is superior to that of the standalone PIM model. The 3D deformation field was calculated based on the fused LOS deformation and simulated data from a third orbital geometry. Validation against GNSS measurements shows that at the edge of the displacement basin, the mean absolute errors (MAEs) for vertical, north–south, and east–west deformations are 2.599, 3.335, and 2.469 mm, respectively. These values represent reductions of 87.9%, 87.0%, and 86.3% compared with the PIM results. In the central displacement area, the MAEs are 13.614, 14.379, and 10.592 mm, all lower than those from the PIM. This indicates that the proposed method more accurately represents actual surface deformation, demonstrating a significant advantage, particularly in monitoring minor deformations at the basin edges.
- 4.
- Case studies indicate that this method provides a more comprehensive view of mining-induced subsidence. By fusing InSAR’s sensitivity to minor deformation with the PIM’s ability to simulate large deformation trends, it more fully reveals the 3D deformation characteristics of a subsidence basin, including both intense central settlement and subtle peripheral deformation. This offers a refined analytical tool for monitoring surface displacement in mining areas.
- 5.
- The methodology has been validated as effective for the typical subsidence basin induced by underground mining in this region, as examined in this study. For other geological settings and deformation mechanisms, adjustments to the model or fusion strategy may be required. Future work should validate the method across mining sites with diverse geological conditions and extraction types to further assess its generality and adaptability, as well as focus on the implementation of Monte Carlo simulation, adaptive strategies for model weights, etc., in order to rigorously quantify the uncertainty propagation caused by the physical model. At the same time, the applicability of this framework in different mining and geological environments should also be verified.
Author Contributions
Conceptualization, F.M. and K.Y.; methodology, F.M. and J.Z. (Jianmei Zhang); software, W.L. and J.Z. (Jinran Zhang); validation, F.M., Z.Z., and Q.Z.; formal analysis, H.Z.; investigation, F.M.; resources, W.L.; data curation, Z.Z., and Q.Z.; writing—original draft preparation, F.M.; writing—review and editing, W.L.; visualization, F.M.; supervision, J.Z. (Jianmei Zhang); project administration, F.M.; funding acquisition, F.M. All authors have read and agreed to the published version of the manuscript.
Funding
This research was funded by the Fundamental Research Program of Shanxi Province (grant number 202103021223381, 202303021222271) and the Fundamental Research Program of Changzhi City (grant number JC202401). This work was supported by the Changzhi Key Laboratory of Intelligent Human–Machine Collaborative Operation (2024sy008), supported by a grant from the Changzhi University Key Laboratory of Intelligent Human–Machine Cooperative Control.
Institutional Review Board Statement
Not applicable.
Informed Consent Statement
Not applicable.
Data Availability Statement
The data presented in this study are available upon request from the corresponding author. The data are not publicly available to protect confidentiality.
Acknowledgments
The authors acknowledge the provision of the Sentinel-1 data by ESA and DEM data by NASA.
Conflicts of Interest
Authors Z.Z., Q.Z. and H.Z. are employed by Zhongjin Environmental Technology Co., Ltd. and Shaanxi Navy Data Technology Co., Ltd. Authors F.M., K.Y., J.Z. (Jianmei Zhang), J.Z. (Jinran Zhang) and W.L. declare no conflicts of interest. The company had no role in the study design, data collection and analysis, decision to publish, or preparation of the manuscript.
References
- Bai, X.; Ding, H.; Lian, J.; Ma, D.; Yang, X.; Sun, N.; Xue, W.; Chang, Y. Coal production in China: Past, present, and future projections. Int. Geol. Rev. 2018, 60, 535–547. [Google Scholar] [CrossRef] [Scilit]
- Chu, C.; Muradian, N. Safety and environmental implications of coal mining. Int. J. Environ. Pollut. 2016, 59, 250–268. [Google Scholar] [CrossRef] [Scilit]
- Dontala, S.P.; Reddy, T.B.; Vadde, R. Environmental Aspects and Impacts its Mitigation Measures of Corporate Coal Mining. Procedia Earth Planet. Sci. 2015, 11, 2–7. [Google Scholar] [CrossRef] [Scilit]
- Cooke, C.A.; Emmerton, C.A.; Drevnick, P.E. Legacy coal mining impacts downstream ecosystems for decades in the Canadian Rockies. Environ. Pollut. 2024, 344, 123328. [Google Scholar] [CrossRef] [Scilit]
- Liu, J.; Ma, F.; Li, G.; Guo, J.; Wan, Y.; Song, Y. Evolution Assessment of Mining Subsidence Characteristics Using SBAS and PS Interferometry in Sanshandao Gold Mine, China. Remote Sens. 2022, 14, 290. [Google Scholar] [CrossRef] [Scilit]
- Aobpaet, A.; Cuenca, M.C.; Hooper, A.; Trisirisatayawong, I. InSAR time-series analysis of land subsidence in Bangkok, Thailand. Int. J. Remote Sens. 2013, 34, 2969–2982. [Google Scholar] [CrossRef] [Scilit]
- Wu, P.C.; Wei, M.M.; D’Hondt, S. Subsidence in Coastal Cities Throughout the World Observed by InSAR. Geophys. Res. Lett. 2022, 49, e2022GL098477. [Google Scholar] [CrossRef] [Scilit]
- Fan, H.; Deng, K.; Ju, C.; Zhu, C.; Xue, J. Land subsidence monitoring by D-InSAR technique. Min. Sci. Technol. 2011, 21, 869–872. [Google Scholar] [CrossRef] [Scilit]
- Dai, H.; Cai, M.; Wang, J. Calculation for maximum subsidence induced by coal seam mining with different dip angles. Chin. J. Rock. Mech. Eng. 2003, 22, 1083–1087. [Google Scholar]
- Luo, H.; Li, Z.; Chen, J.; Pearson, C.; Wang, M.; Lv, W.; Ding, H. Integration of Range Split Spectrum Interferometry and conventional InSAR to monitor large gradient surface displacements. Int. J. Appl. Earth Obs. Geoinf. 2019, 74, 130–137. [Google Scholar] [CrossRef] [Scilit]
- Hu, J.; Li, Z.; Ding, X.; Zhu, J.; Zhang, L.; Sun, Q. Resolving three-dimensional surface displacements from InSAR measurements: A review. Earth-Sci. Rev. 2014, 133, 1–17. [Google Scholar] [CrossRef] [Scilit]
- Fuhrmann, T.; Garthwaite, M.C. Resolving Three-Dimensional Surface Motion with InSAR: Constraints from Multi-Geometry Data Fusion. Remote Sens. 2019, 11, 241. [Google Scholar] [CrossRef] [Scilit]
- Zhang, L.; Han, W.; Jiang, Z.; Kong, X.; Zeng, Q.; Xu, Y.; Huang, P. Error Propagation and Error Mitigation of Multitrack InSAR Observations to 3-D Surface Deformation Estimates. IEEE Trans. Geosci. Remote Sens. 2024, 62, 5210815. [Google Scholar] [CrossRef] [Scilit]
- Wang, L.; Deng, K.; Fan, H.; Zhou, F. Monitoring of large-scale deformation in mining areas using sub-band InSAR and the probability integral fusion method. Int. J. Remote Sens. 2019, 40, 2602–2622. [Google Scholar] [CrossRef] [Scilit]
- Wang, L.; Deng, K.; Zheng, M. Research on ground deformation monitoring method in mining areas using the probability integral model fusion D-InSAR, sub-band InSAR and offset-tracking. Int. J. Appl. Earth Obs. Geoinf. 2020, 85, 101981. [Google Scholar] [CrossRef] [Scilit]
- Ma, J.; Yang, J.; Zhu, Z.; Cao, H.; Li, S.; Du, X. Decision-making fusion of InSAR technology and offset tracking to study the deformation of large gradients in mining areas-Xuemiaotan mine as an example. Front. Earth Sci. 2022, 10, 962362. [Google Scholar] [CrossRef] [Scilit]
- He, X.; Li, G.; Xia, Z.; Xiao, R.; Jia, D.; Song, M. Research progress on integration of BDS/GNSS and InSAR for monitoring deformation of high-steep slopes. J. Hohai Univ. (Nat. Sci.) 2026, 54, 61–69. [Google Scholar] [CrossRef]
- Chen, Y.; Tong, Y.; Tan, K. Coal Mining Deformation Monitoring Using SBAS-InSAR and Offset Tracking: A Case Study of Yu County, China. IEEE J. Sel. Top. Appl. Earth Obs. Remote Sens. 2020, 13, 6077–6087. [Google Scholar] [CrossRef] [Scilit]
- Fan, H.D.; Cheng, D.; Deng, K.Z.; Chen, B.Q.; Zhu, C.G. Subsidence monitoring using D-InSAR and probability integral prediction modelling in deep mining areas. Surv. Rev. 2015, 47, 438–445. [Google Scholar] [CrossRef] [Scilit]
- Li, Z.W.; Yang, Z.F.; Zhu, J.J.; Hu, J.; Wang, Y.J.; Li, P.X.; Chen, G.L. Retrieving three-dimensional displacement fields of mining areas from a single InSAR pair. J. Geod. 2015, 89, 17–32. [Google Scholar] [CrossRef] [Scilit]
- Chen, Y.; Tao, Q.; Liu, G.; Wang, L.; Wang, F.; Wang, K. Detailed mining subsidence monitoring combined with InSAR and probability integral method. Chin. J. Geophtsics 2021, 64, 3554–3566. [Google Scholar] [CrossRef]
- Tao, Q.; Liu, R.; Li, X.; Gao, T.; Chen, Y.; Xiao, Y.; He, H.; Wei, Y. A method for monitoring three dimensional surface deformation in mining areas combining SBAS-InSAR, GNSS and probability integral method. Sci. Rep. 2025, 15, 2853. [Google Scholar] [CrossRef] [Scilit]
- GB/T 18314-2024; Specifications for Survey and Measurement of Global Navigation Satellite System. State Administration for Market Regulation—Standardization Administration of China: Beijing, China, 2024.
- Massonnet, D.; Feigl, K.L. Radar interferometry and its application to changes in the Earth’s surface. Rev. Geophys. 1998, 36, 441–500. [Google Scholar] [CrossRef] [Scilit]
- Baran, I.; Stewart, M.; Claessens, S. A new functional model for determining minimum and maximum detectable deformation gradient resolved by satellite radar interferometry. IEEE Trans. Geosci. Remote Sens. 2005, 43, 675–682. [Google Scholar] [CrossRef]
- Ding, X.; Li, P.; Kang, X.; Wang, M.; Zhang, T.; Hao, D. Calculation method for mining subsidence combining probability integral method and SBAS-InSAR. J. Min. Sci. Technol. 2025, 10, 48–56. [Google Scholar] [CrossRef]
- Litwiniszyn, J. Rarefaction shock waves, outbursts and consequential coal damage. Int. J. Rock Mech. Min. Sci. Geomech. Abstr. 2009, 27, 535–540. [Google Scholar] [CrossRef] [Scilit]
- Hansen, N.; Ostermeier, A. Completely Derandomized Self-Adaptation in Evolution Strategies. Evol. Comput. 2001, 9, 159–195. [Google Scholar] [CrossRef] [Scilit]
- Shar, L.K.; Binh Duong, T.N.; Yeo, Y.C.; Fan, J. Empirical Evaluation of Hyper-parameter Optimization Techniques for Deep Learning-based Malware Detectors. Procedia Comput. Sci. 2024, 246, 2090–2099. [Google Scholar] [CrossRef] [Scilit]
- Bi, Z.; Li, S.; Zhang, L.; Zhang, W.; Li, Y.; Yuan, L. Multi-track sequential InSAR mining 3D deformation monitoring and prediction combined with Prophet-CNN model. Bull. Surv. Mapp. 2024, 5, 53–59. [Google Scholar] [CrossRef]
- Zhang, J.; Singh, S. Visual-lidar odometry and mapping: Low-drift, robust, and fast. In Proceedings of the 2015 IEEE International Conference on Robotics and Automation (ICRA), Seattle, WA, USA, 26–30 May 2015; pp. 2174–2181. [Google Scholar] [CrossRef] [Scilit]
- Ma, F.; Sui, L.; Lian, W. Prediction of Mine Subsidence Based on InSAR Technology and the LSTM Algorithm: A Case Study of the Shigouyi Coalfield, Ningxia (China). Remote Sens. 2023, 15, 2755. [Google Scholar] [CrossRef] [Scilit]
- Li, Q.; Dai, H.; Wang, Z.; Wang, F. Reference phase retrieve and PIM fusion monitoring method for InSAR three-dimensional deformation in large gradient deformation mining areas. J. Min. Saf. Eng. 2025, 42, 660–672. [Google Scholar] [CrossRef]

Disclaimer/Publisher’s Note: The statements, opinions and data contained in all publications are solely those of the individual author(s) and contributor(s) and not of MDPI and/or the editor(s). MDPI and/or the editor(s) disclaim responsibility for any injury to people or property resulting from any ideas, methods, instructions or products referred to in the content. |
© 2026 by the authors. Licensee MDPI, Basel, Switzerland. This article is an open access article distributed under the terms and conditions of the Creative Commons Attribution (CC BY) license.