


Highlights
What are the main findings?
- The 2025 Mw 8.8 Kamchatka earthquake shows a NE-to-SW unilateral rupture (560 km, 200 s) with peak slip ~10 m at 15–30 km depth, jointly controlled by curved megathrust geometry and along-strike locking heterogeneity.
- High-frequency radiation migrated southwestward and concentrated at large-slip boundaries/structural segmentation zones, rather than peak-slip centers, indicating sensitivity to fault friction and geometric discontinuities.
What are the implications of the main findings?
- A curved fault model (instead of planar segments) improves the accuracy of rupture process inversion and tsunami simulation for subduction zone megathrust earthquakes.
- The north–south magnitude contrast along the Kamchatka subduction zone is attributed to along-strike variations in locking strength, megathrust smoothness, and subducted submarine tectonic features, providing key constraints for regional seismic hazard assessment.
Abstract
On 29 July 2025, an Mw 8.8 megathrust earthquake occurred offshore of the southeastern Kamchatka Peninsula, ranking among the ten largest earthquakes worldwide since 1900. Due to observational limitations, the rupture characteristics of large earthquakes along the Kamchatka subduction zone and the north–south contrast in earthquake magnitudes remain poorly understood. In this study, we combine InSAR data, GNSS displacements, and teleseismic waveforms to investigate the spatiotemporal evolution of the 2025 mainshock by constructing a curved fault geometry with along-strike and downdip variations and applying finite-fault inversion together with back-projection analysis. The inversion results show that the mainshock was characterized by unilateral rupture propagating from northeast to southwest, with a rupture length of about 560 km, a duration of about 200 s, and dominant slip concentrated at depths of 15–30 km, with a peak slip of about 10 m. Slip was weak during the initial nucleation stage near the hypocenter, whereas the main slip patch was located within a strongly locked region in the southern segment, and the rupture accelerated rapidly after entering that region. The back-projection results indicate that high-frequency radiation mainly migrated southwestward and was concentrated along the boundaries of the large-slip region and possible structural segmentation zones. These results indicate that the rupture behavior of the 2025 mainshock was jointly controlled by curved megathrust geometry and along-strike locking heterogeneity. The north–south contrast in earthquake size along the Kamchatka subduction zone may result from the combined effects of stronger locking and smoother megathrust geometry in the south, versus more complex fault geometry and submarine tectonic features in the north. This study provides new constraints on rupture processes, seismic cycle behavior, and regional seismic hazard along the Kamchatka subduction zone, and offers important implications for understanding the mechanisms and magnitude potential of future great earthquakes in the Kamchatka region.
1. Introduction
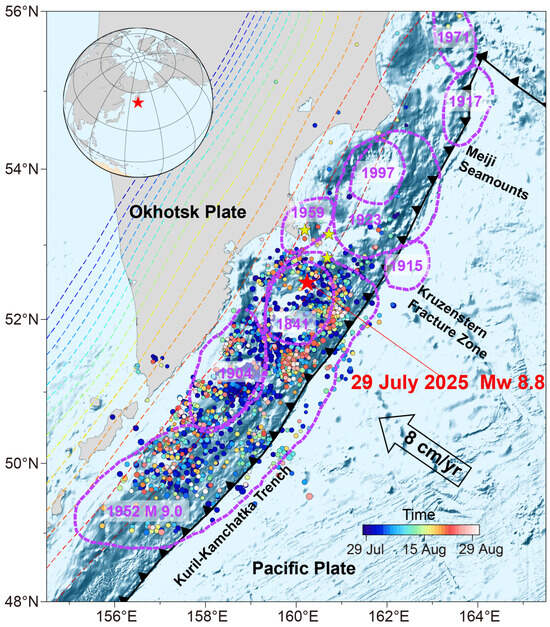
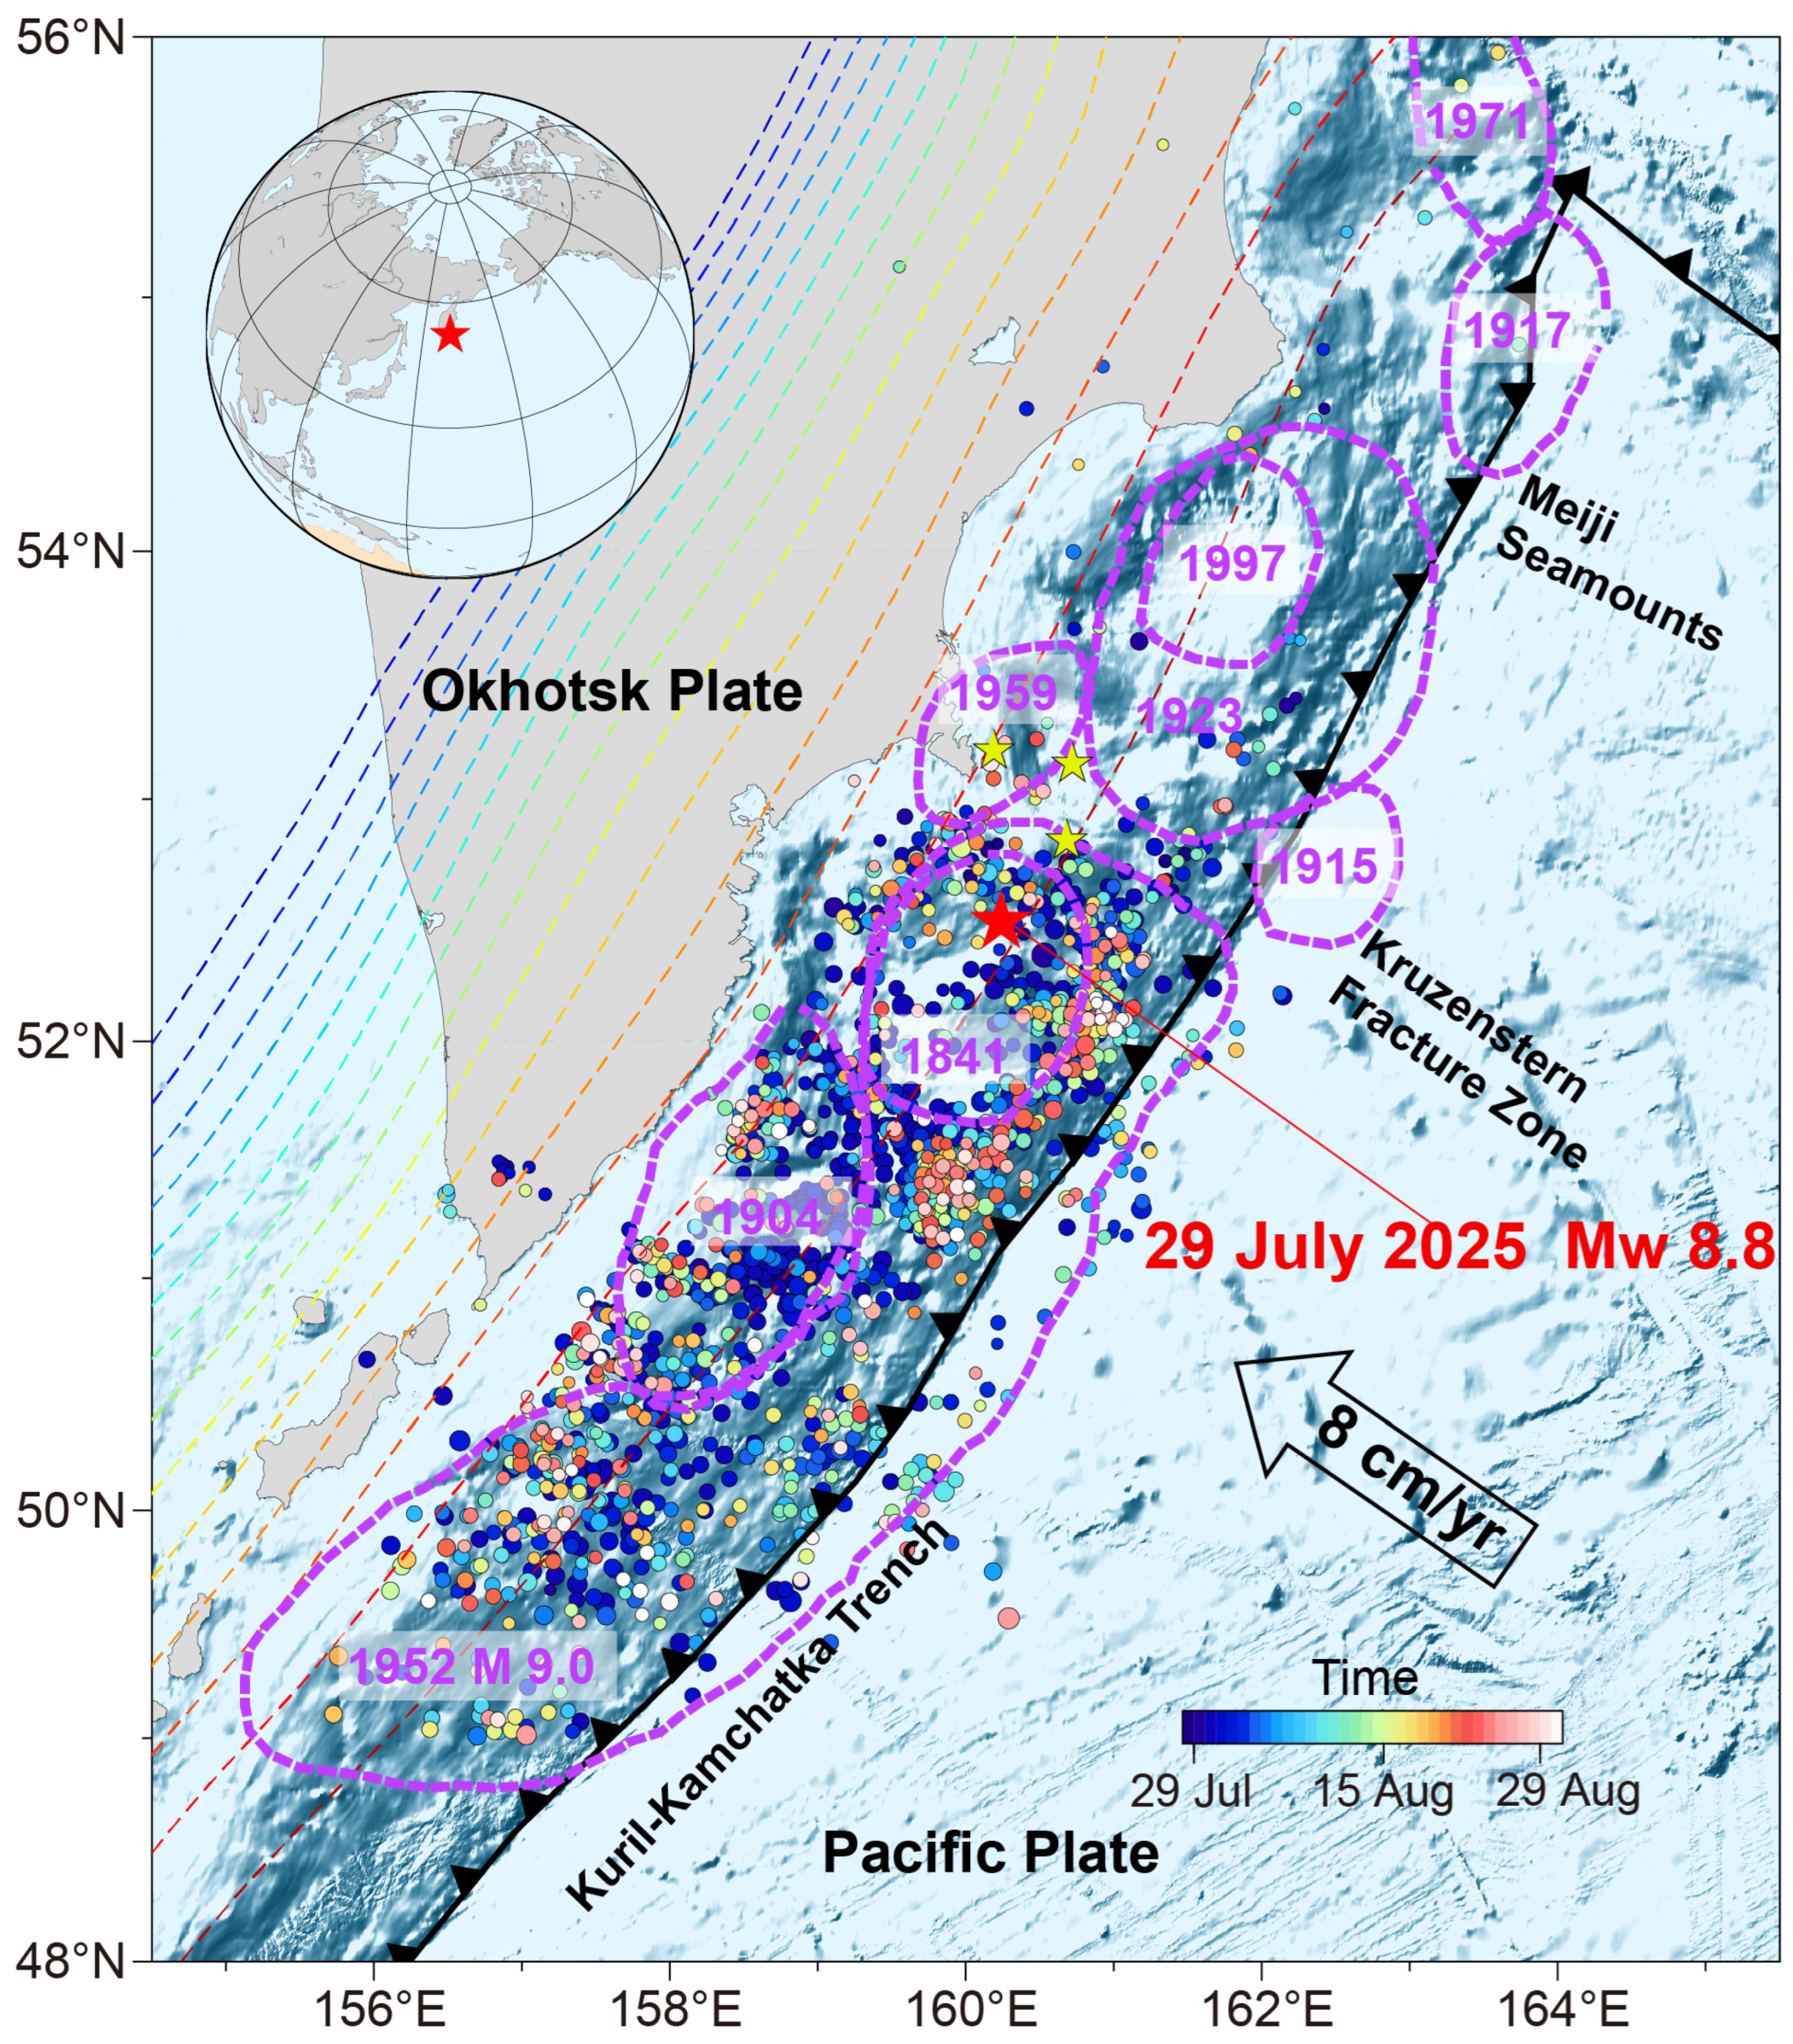
The Kamchatka subduction zone, located in the northern segment of the Circum-Pacific seismic belt, is one of the most seismically active subduction zones in the world. In this region, the Pacific Plate subducts northwestward beneath the Okhotsk microplate at a rate of about 8 cm/yr, forming the ~2000 km-long Kuril–Kamchatka trench–arc system (Figure 1). This rapid convergence leads to long-term strain accumulation on the plate interface and is accompanied by frequent large earthquakes, volcanism, and deep slab seismicity. Historical and instrumental records indicate that the Kamchatka subduction zone has hosted multiple M8-class or larger earthquakes, including the 1737, 1841, 1904, 1917, 1923, 1952, 1959, and 1997 events. Among them, the 1952 Mw 8.8–9.0 earthquake ruptured a segment about 600–700 km long, was one of the largest earthquakes of the twentieth century, and generated a devastating trans-Pacific tsunami [1,2,3]. The 1737 giant earthquake has been suggested to be a predecessor of the 1952-type event, implying a recurrence interval of about 200 years [2]. In addition to its high seismic activity, the Kamchatka subduction zone also exhibits pronounced along-strike segmentation. Early seismological studies showed that north of about 55°N, the dip angle of the subducting slab becomes significantly shallower, the maximum depth of seismicity decreases, and the volcanic front shifts landward, indicating strong along-strike variations in slab geometry and geodynamics. The convergence rate is about 77 mm/yr at 55°N and increases southward to about 83 mm/yr at 47°N [4,5]. Further GPS coupling studies indicate that interplate locking varies markedly along strike, with stronger locking in the southern segment and more pronounced aseismic slip or partial coupling in the northern segment [6,7]. Therefore, seismic and aseismic slip along the Kamchatka subduction zone may reflect complex interactions among fault geometry, locking heterogeneity, and tectonic complexity.
Figure 1.
Tectonic setting of the 2025 Kamchatka earthquake. The red star indicates the location of the 29 July 2025 mainshock. Yellow stars indicate the locations of the 20 July 2025 foreshock and the 13 September 2025 and 18 September 2025 aftershocks. Circles show the aftershock distribution of the mainshock, color-coded by time (https://sdis.emsd.ru/info/earthquakes/catalogue.php, accessed on 9 February 2026). Thick purple dashed lines mark the rupture areas of historical earthquakes and their years, inferred from aftershock distributions [2]. Thin dashed lines in different colors denote the slab depth contours of the Kamchatka subduction zone based on Slab2, with colors changing from red to blue indicating increasing depth. The black sawtooth line marks the trench, and the black arrow indicates the plate convergence direction.
At 23:24:52 UTC on 29 July 2025, an Mw 8.8 megathrust earthquake struck offshore of the southeastern Kamchatka Peninsula. According to the United States Geological Survey (USGS), the epicenter was located at approximately 52.495°N, 160.240°E, with a focal depth of about 35 km (Figure 1). This event was the largest global earthquake since the 2011 Tohoku earthquake and ranks among the ten largest earthquakes since 1900. Before the mainshock, a prominent Mw 7.4 foreshock occurred on 20 July 2025, accompanied by dense foreshock activity [8]. Within two months after the mainshock, two large aftershocks of Mw 7.4 and Mw 7.8 occurred, mainly concentrated north of the main rupture zone, suggesting complex segmentation and stress transfer near the source region [9]. Moreover, the spatial similarity between the 2025 Mw 8.8 event and the 1952 M8.8 earthquake, together with the anomalously short recurrence interval, has stimulated renewed discussion of repeated rupture of the same asperity and the recurrence behavior of giant megathrust earthquakes [10,11].
Substantial progress has already been made in understanding the 2025 Kamchatka earthquake. Multiple seismological, geodetic, and tsunami inversion studies have shown that the mainshock was characterized by unilateral rupture from northeast to southwest, with the main slip concentrated at intermediate shallow depths on the plate interface rather than extending broadly to the trench. At the same time, accurate fault geometry, especially downdip variations, has a significant impact on the inferred slip distribution and tsunami simulations [12]. In addition, several studies have examined the relationship between the 1952 and 2025 giant earthquakes and proposed different interpretations, including complementary shallow versus deep slip, local overshoot, and the release in 2025 of residual strain not fully released in 1952 [7,10,12,13,14].
Despite these advances, two key issues remain insufficiently resolved. First, although previous studies have constrained the overall rupture direction and the location of the main slip patch of the 2025 event, the processes of nucleation, acceleration, and unilateral rupture growth, the relationship between strong asperities and high-frequency radiation, and the combined effects of fault geometry and locking heterogeneity on rupture propagation remain poorly understood. In particular, many slip models still approximate the megathrust with only one to three planar fault segments and do not fully account for continuous along-strike and downdip variations in plate-interface geometry. A more physically realistic curved fault model may therefore be essential for resolving the actual rupture characteristics of this event. Moreover, some InSAR time windows may inevitably include deformation from the 20 July 2025 Mw 7.4 foreshock, thereby affecting recovery of the pure co-seismic slip of the mainshock. Second, previous studies have mainly focused on the anomalously short recurrence interval and its implications for the seismic cycle, whereas the long-term north–south contrast in earthquake magnitude along the Kamchatka subduction zone and its structural controls remain insufficiently explored. Current interpretations are still preliminary and generally invoke complex tectonic influences [12,15]. However, this issue is important not only for understanding the rupture boundaries and unilateral nature of the 2025 event, but also for assessing future great-earthquake hazards in the region.
To better understand the spatiotemporal evolution of the 2025 Mw 8.8 Kamchatka earthquake and its tectonic controls, this study aims to (1) construct a curved seismogenic fault consistent with the real plate-interface geometry based on the Slab2 model; (2) jointly invert InSAR, GNSS, and teleseismic waveform data to recover the spatiotemporal rupture evolution of the mainshock; (3) independently constrain the migration of high-frequency radiation using teleseismic P-wave back-projection; and (4) discuss how curved megathrust geometry, locking state, and regional tectonic segmentation controlled the rupture of the 2025 event and the north–south contrast in earthquake magnitude along the Kamchatka subduction zone. This study is intended to provide new constraints on rupture characteristics, seismic-cycle behavior, and regional seismic hazard in the Kamchatka subduction zone.
2. Data and Methods
2.1. Geodetic and Seismic Data
We used Sentinel-1 SAR imagery to derive the co-seismic line-of-sight (LOS) deformation field of the 29 July 2025 Mw 8.8 Kamchatka mainshock. To minimize contamination of the co-seismic deformation field by the 20 July 2025 Mw 7.4 foreshock, interferometric pairs that might include deformation from the foreshock were excluded from the mainshock inversion. We selected ascending track A111, with the pre-event and post-event acquisitions on 23 July 2025 and 4 August 2025, respectively, so that the deformation field used in the inversion mainly reflects slip from the 29 July mainshock. SAR data were processed in GAMMA (Version 20220615) using a standard differential interferometric synthetic aperture radar (D-InSAR) workflow to obtain the LOS co-seismic deformation field. The topographic phase was removed using the one-arc-second-resolution Shuttle Radar Topography Mission (SRTM) digital elevation model. To improve the signal-to-noise ratio, the interferograms were multilooked with a factor of 40 × 8. Goldstein filtering was then applied to suppress noise, and areas of low coherence or discontinuous fringes were masked to reduce the influence of low-quality pixels on subsequent phase unwrapping [16]. Phase unwrapping was carried out using the minimum cost flow (MCF) method [17], and the unwrapped results were finally geocoded into a geographic coordinate system. Considering that the deformation magnitude of this event reached up to 1.3 m and was concentrated on the southeastern side of the Kamchatka Peninsula, atmospheric correction was not applied. The processed LOS deformation field was then downsampled using the quadtree method [18], yielding 1388 samples for the subsequent joint inversion.
GNSS observations were taken from time series released by the Nevada Geodetic Laboratory. Due to the limited availability of publicly accessible continuous GNSS data in the Kamchatka Peninsula region during the co-seismic period, we were only able to identify four stations within 500 km that had relatively good temporal continuity. Although the number of stations is limited, their spatial distribution across southern Kamchatka and adjacent areas still provides an independent constraint on the direction and magnitude of onshore displacements. Stable trends were fitted to the time series over the three days before and the three days after the mainshock to estimate the instantaneous co-seismic displacement step associated with the 2025 Mw 8.8 Kamchatka earthquake.
Teleseismic data was obtained from the Incorporated Research Institutions for Seismology (IRIS) Data Management Center for finite-fault inversion. Because the duration of the 2025 Mw 8.8 mainshock was about 200 s, we used waveform windows of 280 s. To avoid interference from depth phases and complex near-source propagation effects, we selected 54 stations at epicentral distances of 30–90° and ensured adequate azimuthal coverage (Figure S1). To reduce contamination by spurious high-frequency signals introduced during long-distance propagation and by velocity-model simplifications, the waveforms were filtered in the 0.01–0.15 Hz band and integrated once from velocity to displacement.
2.2. Construction of Curved Fault Geometry
To improve the physical realism of the seismogenic fault model, we extracted the plate-interface geometry of the study region from the Slab2 model and constructed a curved fault surface with continuous along-strike and downdip variations [19]. Compared with conventional planar or a few segmented planar faults, this approach more faithfully represents the along-strike bending, dip changes, and depth variations of the Kamchatka megathrust. The upper edge, lower edge, and central axis of the fault were constrained by slab-depth contours from Slab2, and a smooth curved surface of 800 km × 180 km was generated by fitting these constraints using Gmsh (Version 4.15.2) [20]. The entire surface was then discretized into 40 × 9 subfaults, each measuring 20 km × 20 km, and each subfault was assigned its corresponding center position, strike, dip, and area.
2.3. Finite-Fault Inversion Method
We performed a joint finite-fault inversion of multiple data types to recover the spatiotemporal slip evolution of the mainshock [21]. A linear inversion was employed to minimize the residuals between observations and synthetics and to estimate the slip amplitude, rake, rupture onset time, and rupture duration for each subfault. The objective function consists of misfit terms for InSAR, GNSS, and teleseismic waveforms, together with spatial smoothing, temporal smoothing, and minimum seismic moment regularization:
Here, is the total objective function. , , and are the data-misfit terms for InSAR, GNSS, and teleseismic waveforms, respectively, and are computed as the squared L2 norms of the residuals between observations and synthetics. and represent the spatial and temporal smoothing constraints, respectively, and represents the minimum seismic moment constraint. , and denote the weights of the three observation types. Based on the error characteristics and constraining power of the different data types, we set the data weights to InSAR:GNSS:teleseismic = 1:2:1 [22]. Because GNSS data generally have higher accuracy than InSAR data, we assigned them greater weight in the inversion. , and denote the weights of spatial smoothing, temporal smoothing, and minimum seismic moment regularization, respectively. The spatial and temporal smoothing factors were selected from the corner points of the L-curve tests, giving = 30 and = 60 (Figure S2). The value = 0.01 was determined empirically. Green’s functions for the geodetic and teleseismic data were computed using a layered elastic model based on CRUST1.0. We extracted the crustal structure from the CRUST1.0 grid cell closest to the hypocenter, including the thickness, P-wave velocity, S-wave velocity, and density of each layer (Figure S3) [23].
The rupture process was represented as a linear superposition of time-window functions. The maximum rupture duration for each subfault was set to 30 s, and the total rupture duration of the earthquake was limited to 300 s. The maximum rupture propagation speed was set to 3.5 km/s. Using the curved fault geometry constructed in this study and considering the GCMT focal mechanism of the event (strike = 214°, dip = 18°, rake = 84°), which indicates thrust faulting, the initial rake was constrained to 84° and allowed to vary within ±45°. The hypocenter was fixed to the USGS location (160.240°, 52.495°, 35 km). A non-negative slip constraint was imposed to avoid unrealistic oscillatory slip distributions.
2.4. Teleseismic Back-Projection Method
Back-projection is a source-imaging approach based on waveform similarity within a seismic array and does not require prior assumptions about fault geometry or rupture speed. It can therefore effectively reveal rupture speed, rupture extent, and other key characteristics of earthquake rupture processes [24]. In this study, we used the MUSIC back-projection method, which can improve imaging resolution over a broader frequency band [25]. As is commonly done, arrays at epicentral distances of 30–90° were selected to avoid interference from strong depth phases. Based on array distribution and signal-to-noise ratio, we chose the Australian array, which lies in the rupture propagation direction, thereby reducing the systematic bias of high-frequency radiation sources along the array azimuth and providing a more stable constraint on rupture direction and speed. To improve the alignment of P-wave onsets, we combined four successive band-pass filters from low to high frequency with cross-correlation-based correction. Finally, using the source location as a reference, we imaged the temporal migration of high-frequency radiation sources on a reference plane near the focal depth of the mainshock. The imaging grid was centered on the epicenter, covering a latitude range of −5° to 1° and a longitude range of −6° to 2°. This region was discretized into a 200 × 200 grid, and the imaging duration was set to 240 s.
3. Results
3.1. Co-Seismic InSAR and GNSS Deformation Fields
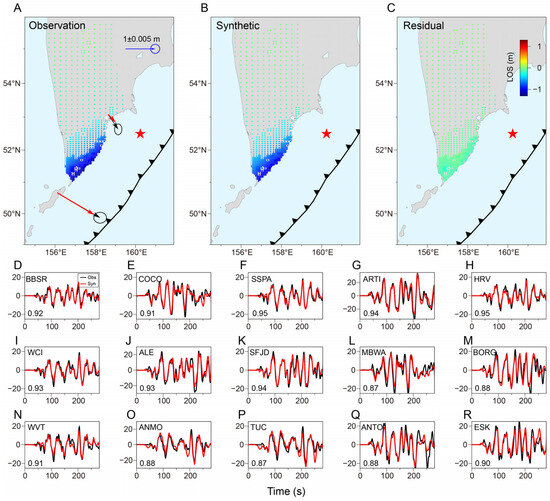
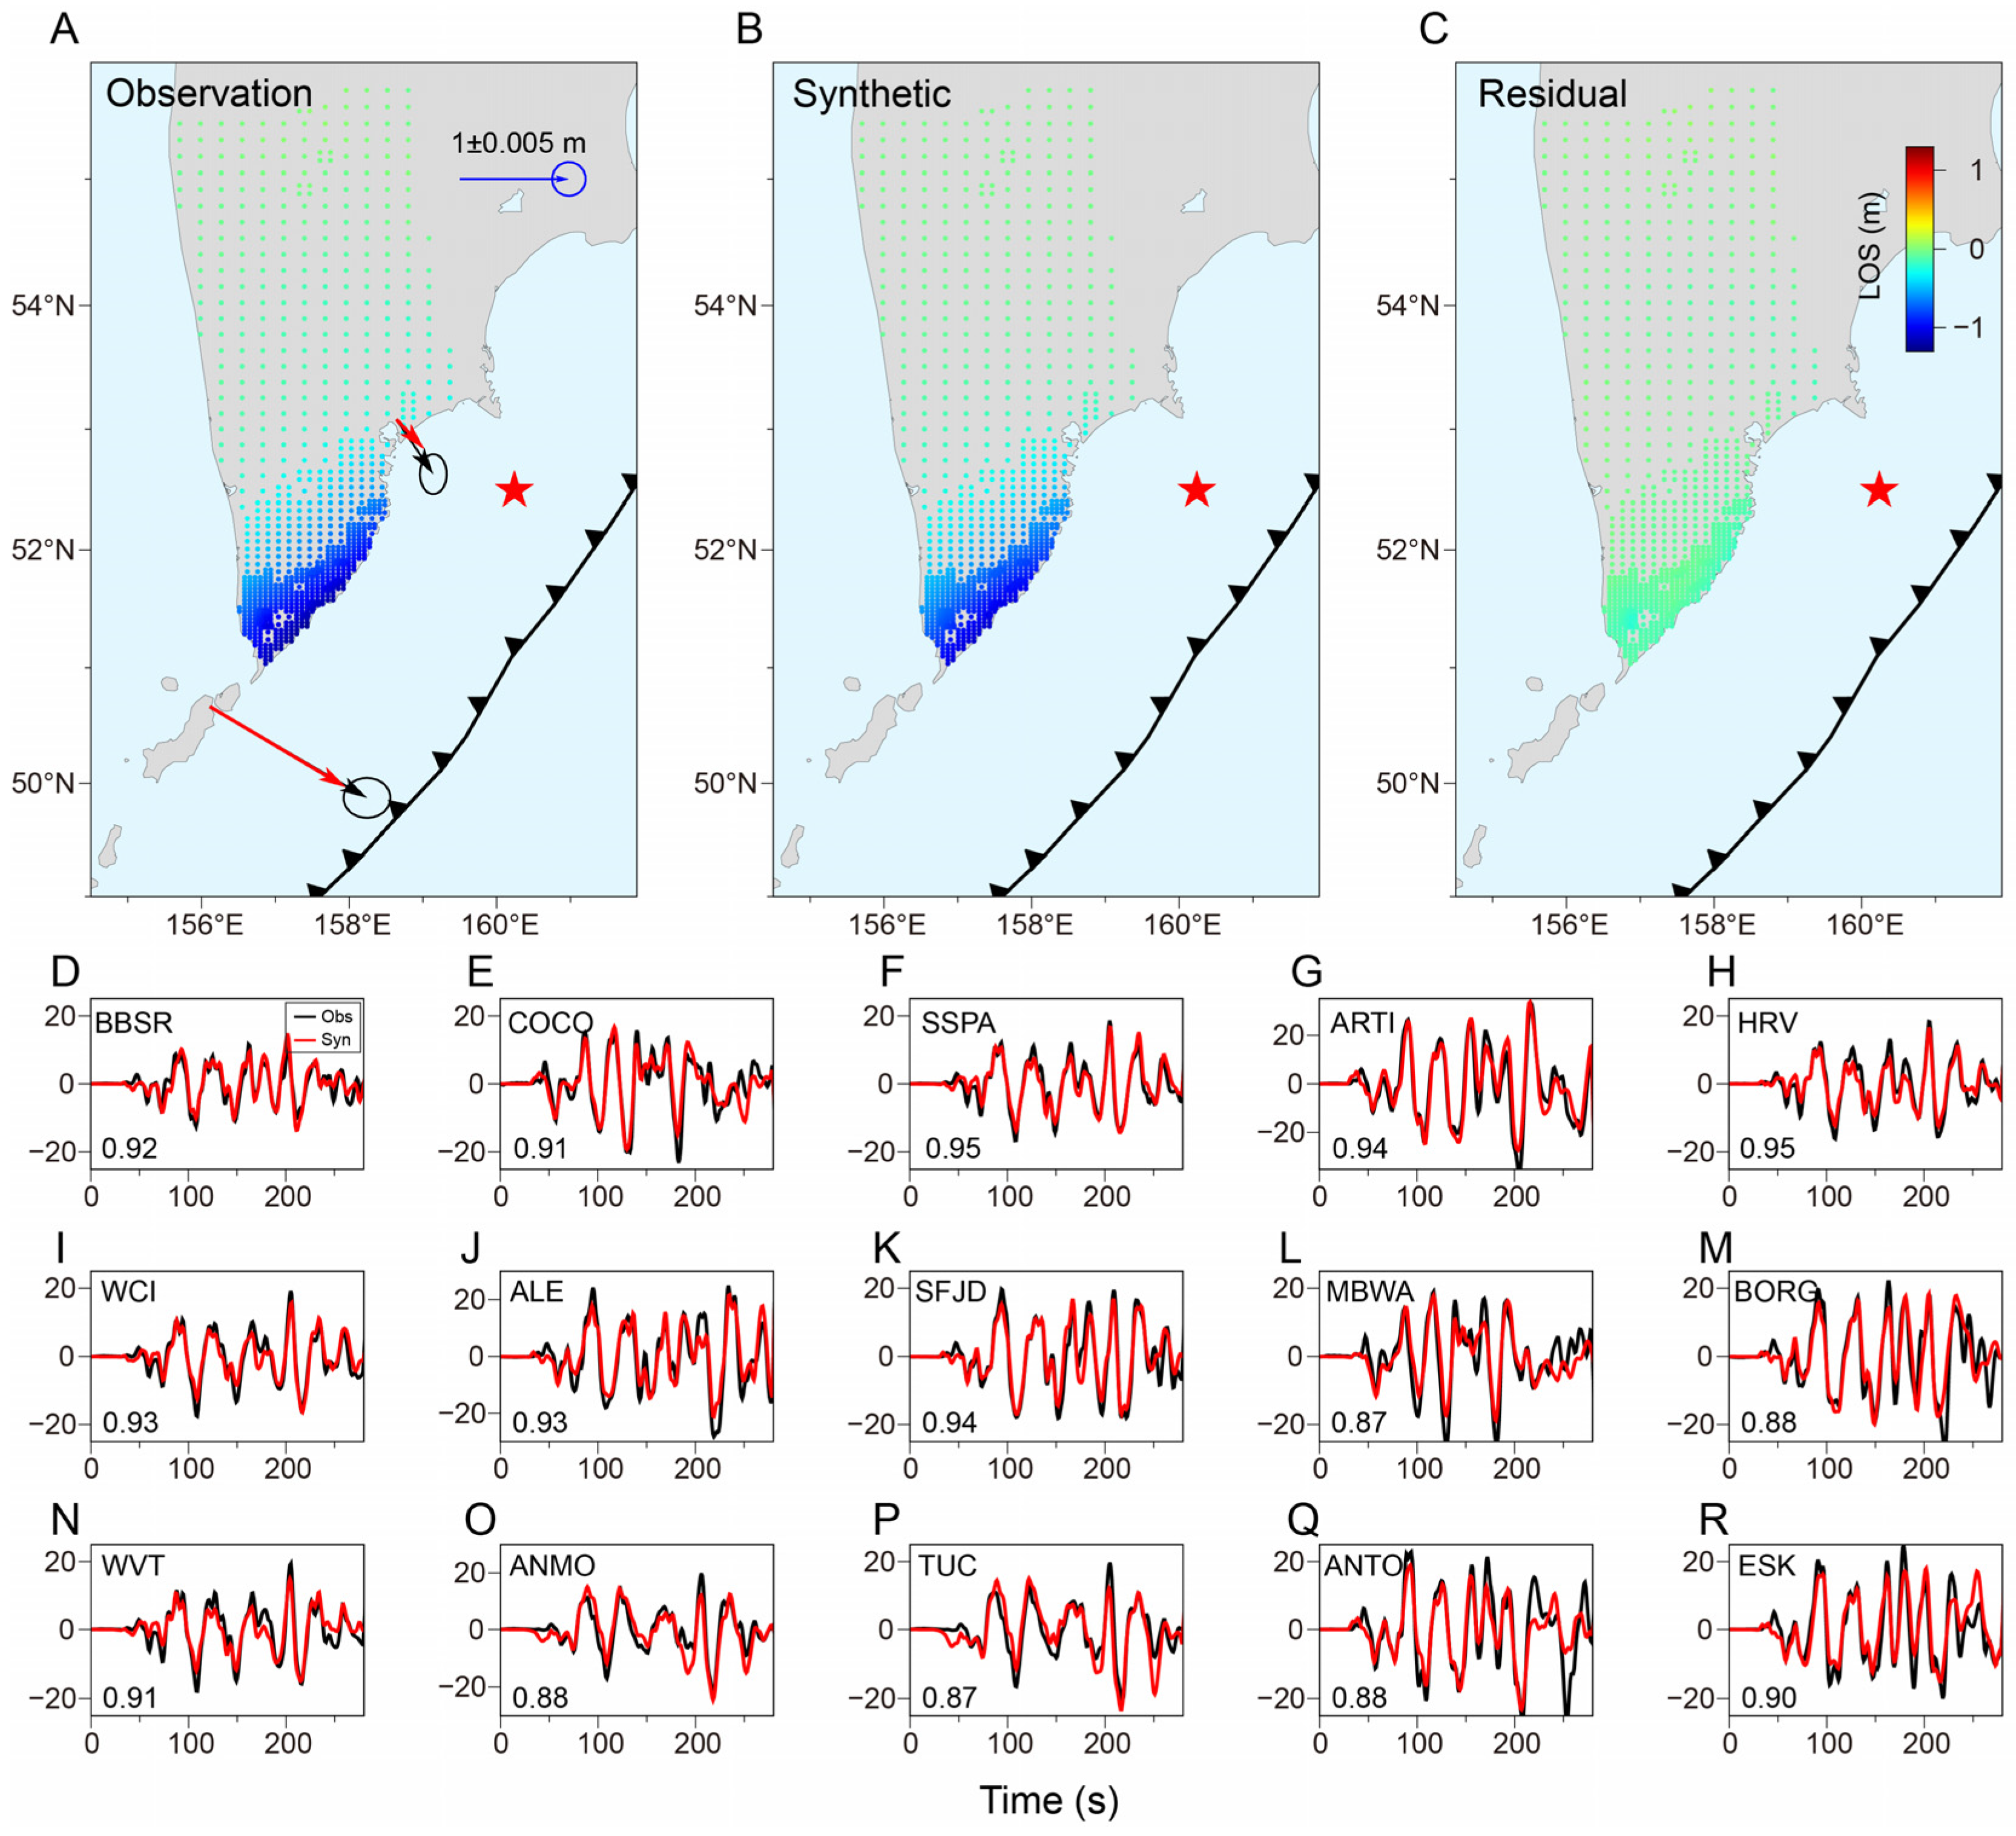
The InSAR LOS deformation field shows that the 2025 Kamchatka mainshock produced broad and spatially smooth co-seismic deformation over the onshore area, affecting distances greater than 150 km (Figure 2 and Figure S4). In general, LOS displacement decreases gradually from the coast inland, consistent with the classical long-wavelength surface response of a shallowly dipping megathrust earthquake. The maximum LOS displacement away from the satellite reached 1.31 m. The GNSS stations show a consistent regional displacement pattern: stations in the southern area recorded larger eastward horizontal displacements and pronounced subsidence, with a maximum displacement of 1.67 m, whereas the northern stations exhibited markedly smaller displacements. The broad-wavelength deformation pattern indicates that the main slip patch was located on the shallowly dipping offshore plate interface at intermediate shallow depths, rather than being confined to a narrow region near the trench.
Figure 2.
Fitting between observations and synthetics for the preferred inversion model. (A–C) Observed InSAR data, synthetic InSAR data, and residuals, respectively. In panel (A), black and red arrows denote observed and synthetic horizontal GNSS vectors, respectively. The red star marks the location of the mainshock hypocenter. Black sawtooth lines mark the trench of the Kamchatka subduction zone. The blue arrow with a circle indicates the GNSS vector scale and uncertainty. LOS denotes line of sight. (D–R) Fitting for selected teleseismic waveforms. The station name is shown in the upper left corner of each panel, and the correlation coefficient between the observation and synthetic is shown in the lower left corner. The complete set of waveform fits is provided in the Supplementary Materials.
3.2. Rupture Process from Joint Inversion
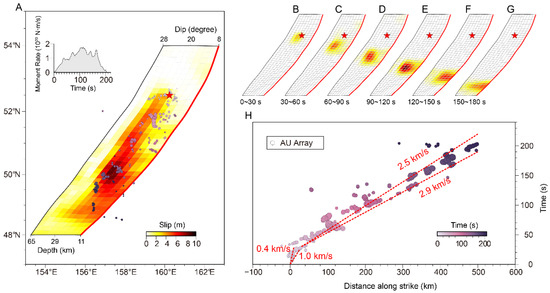
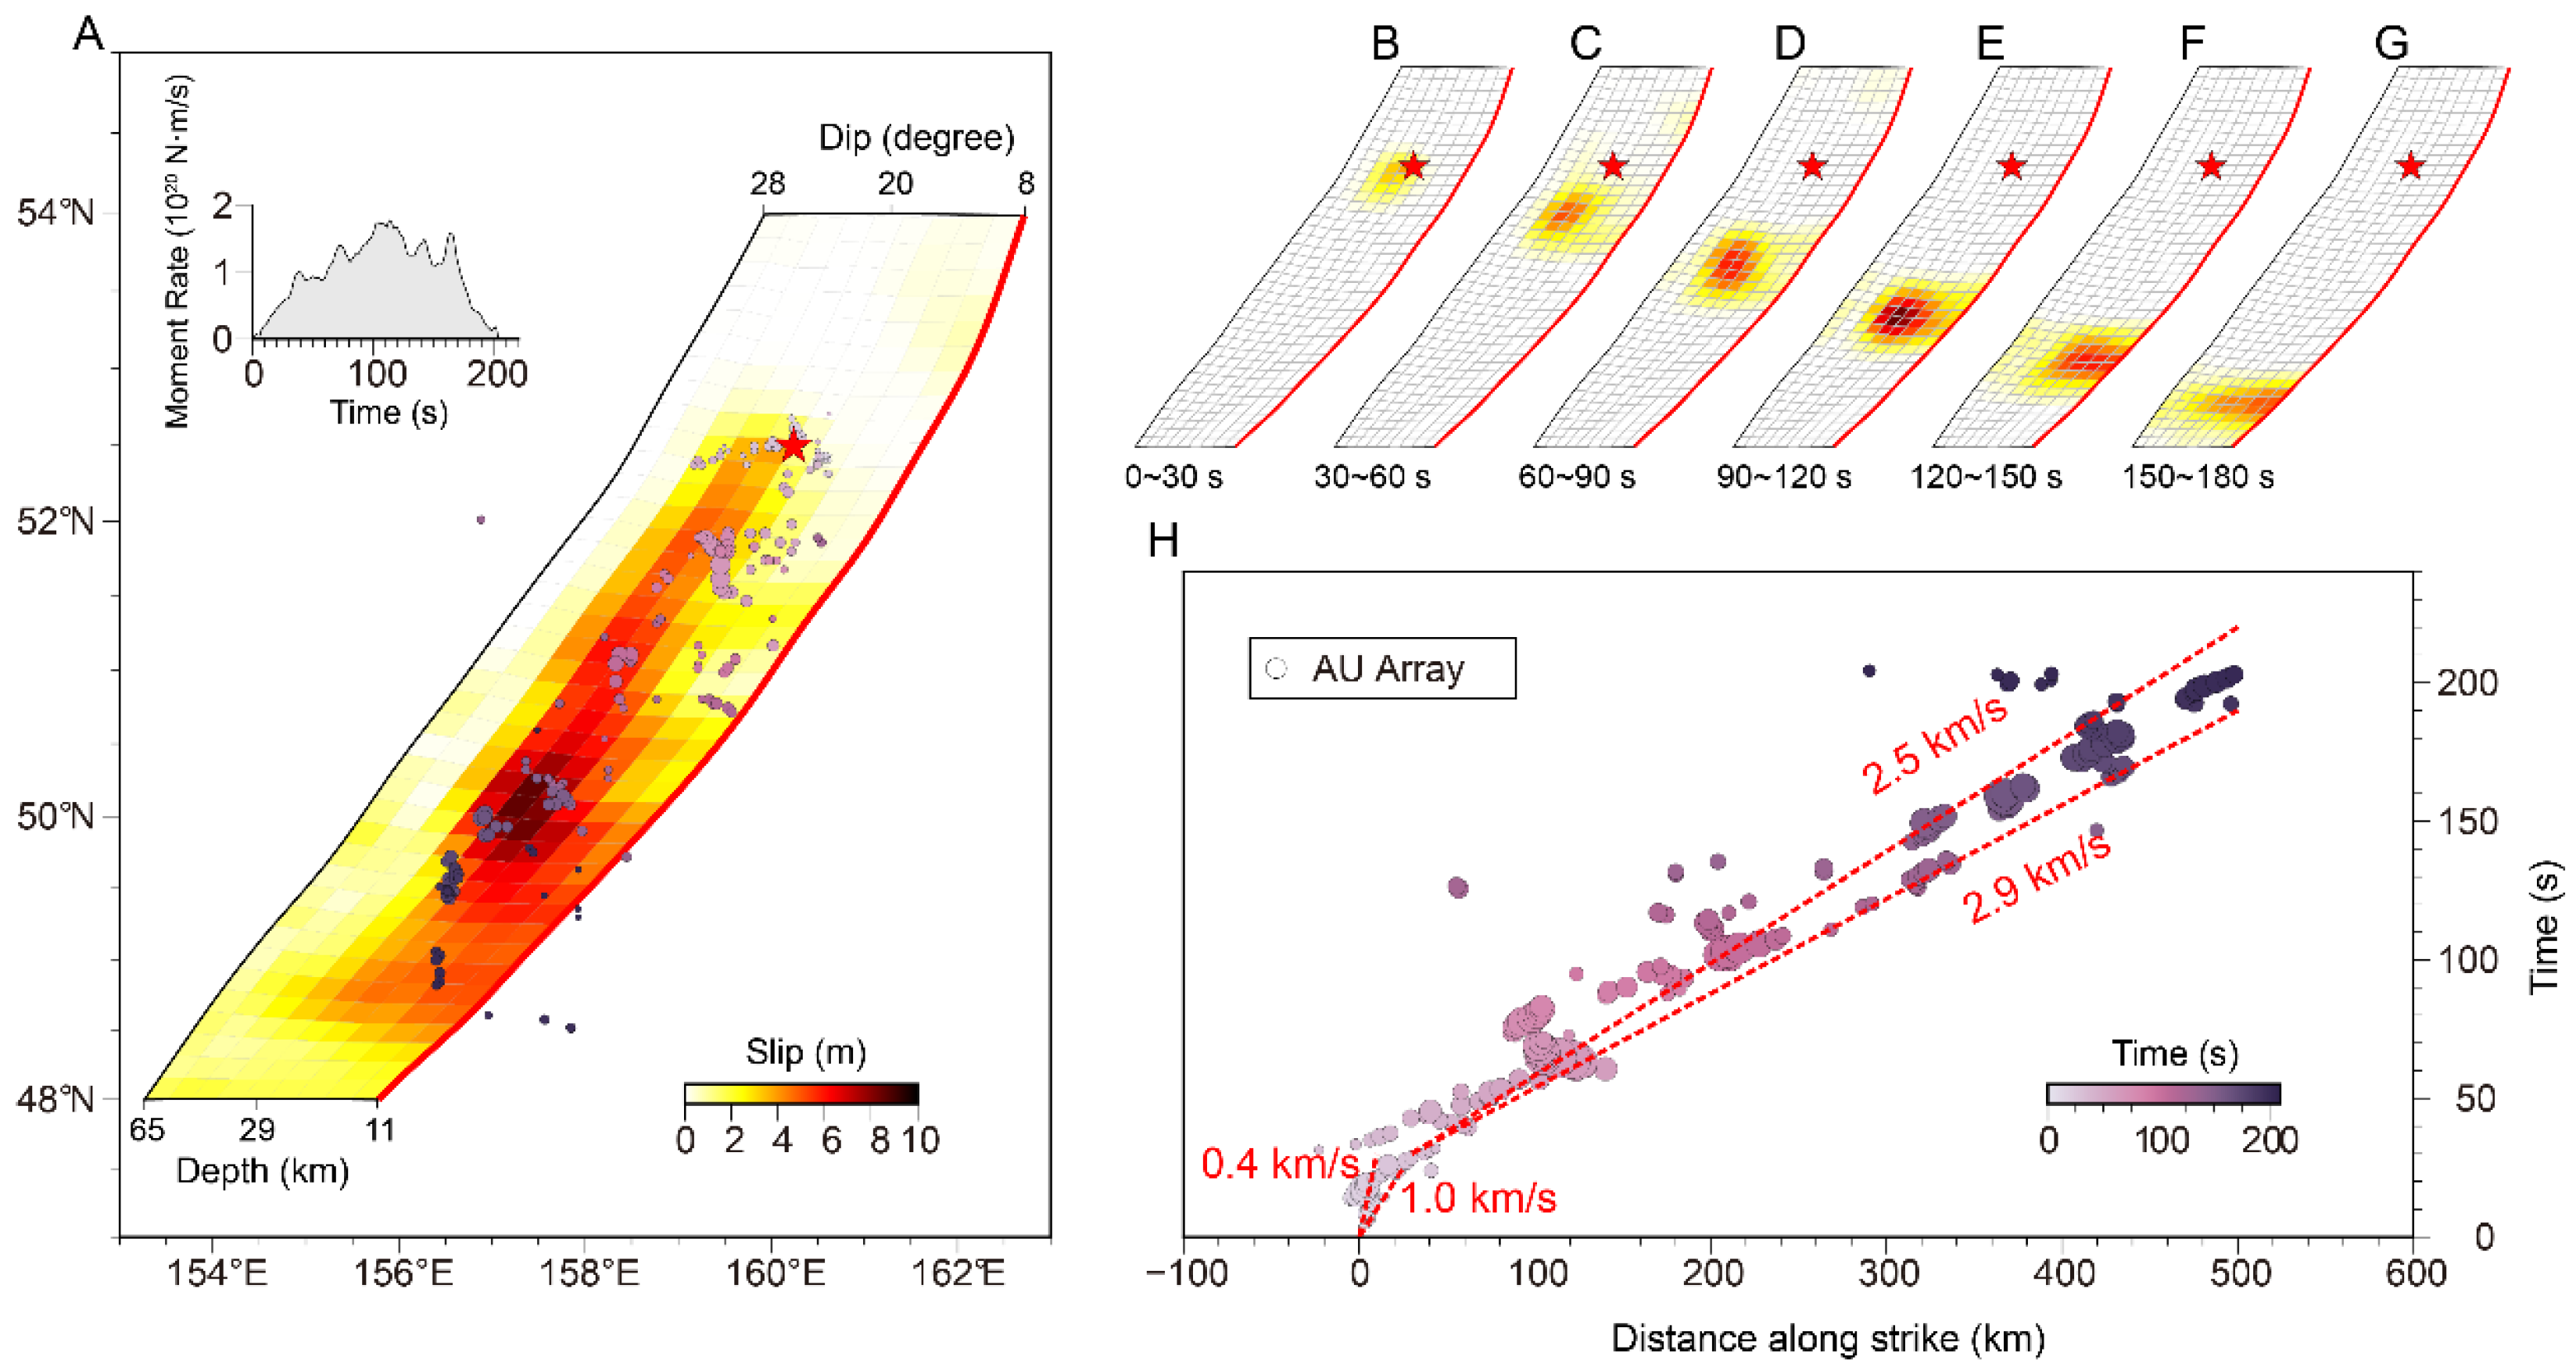
The preferred model fits the multi-source observations well, with an average waveform correlation coefficient of 0.84 for the teleseismic data and RMS values of 0.09 m and 0.10 m for the InSAR and GNSS data, respectively, indicating that the model captures the main features of both the surface deformation and the teleseismic waveforms (Figure 2 and Figure S5). Although the number of GNSS stations is limited, one station is located near the maximum slip area and therefore provides an important constraint on the slip magnitude. The 2025 Kamchatka mainshock was characterized by pronounced unilateral rupture propagating from northeast to southwest. The total rupture length was about 560 km, the rupture width was about 140 km, the overall duration was about 200 s, and the moment magnitude was Mw 8.81. The main slip patch was concentrated at depths of 15–30 km, with a peak slip of 10 m (Figure 3). Slip near the hypocenter was weak, generally less than 3 m, whereas the principal asperity was located about 350 km southwest of the hypocenter.
Figure 3.
Rupture process of the 29 July 2025 Mw 8.8 Kamchatka earthquake. (A) Slip distribution from finite-fault inversion together with the back-projection result. The red star marks the hypocenter of the mainshock. The inset in the upper left shows the moment-rate function. The red solid lines indicate the fault top edges. (B–G) Snapshots of rupture evolution at 30 s intervals. (H) Time–distance diagram of high-frequency radiation projected along strike, with the positive direction pointing southwest. The red dashed lines indicate the upper and lower bounds of rupture velocity.
Temporally, the rupture expanded relatively slowly during the first 20–30 s after nucleation, and slip release was weak. The rupture front then entered the southern main asperity region, where the slip rate and cumulative slip increased rapidly, forming a major along-strike slip belt. The moment release peaked at 110 s, corresponding to rupture of the strongest asperity, and the entire rupture process ended at about 200 s. Overall, rupture did not propagate uniformly over the entire fault plane, but instead showed clear segmented release: the hypocentral nucleation segment was weak, the central-to-southern asperity controlled most of the moment release, and the northern region was characterized by smaller slip and subsequent large aftershocks. The preferred model also indicates that the main slip did not extend broadly to the shallowest part of the trench, but only locally propagated updip. This is consistent with observations that the tsunami generated by this event was weaker than that of the 1952 giant earthquake, and is also broadly consistent with previous studies suggesting limited shallow trench slip in the 2025 event [11,12].
3.3. Migration of High-Frequency Radiation Revealed by Back-Projection
Teleseismic P-wave back-projection further reveals the spatiotemporal evolution of high-frequency radiation during the mainshock (Figure 3). Overall, high-frequency radiation initiated near the hypocenter and then migrated southwestward over a distance of about 500 km, consistent with the unilateral rupture direction inferred from the finite-fault inversion. During the first 20 s after nucleation, high-frequency radiation was relatively abundant but migrated slowly, at about 0.4–1.0 km/s, indicating that the rupture remained limited in scale and had not yet entered the rapid failure stage of the main asperity. At around 30 s, the high-frequency energy increased markedly and propagated rapidly southwestward, with an apparent rupture speed of about 2.5–2.9 km/s, corresponding to the rapid development of the main slip region in the finite-fault inversion. A pronounced concentration of high-frequency energy is observed near 52°N, and strong high-frequency radiation is also present around the largest-slip asperity near 50°N. The back-projection results indicate that the rupture duration of this earthquake was approximately 200 s, which is broadly consistent with the finite-fault inversion results.
4. Discussion
4.1. Nucleation and Unilateral Rupture of the 2025 Mainshock
The pronounced weak slip and slow rupture during the initial stage may reflect relatively weak fault properties in the nucleation region. Both the finite-fault inversion and the back-projection results indicate that during the first 20 s after rupture initiation near the hypocenter, the 2025 mainshock was characterized by relatively slow rupture expansion, weak slip release, and abundant high-frequency radiation (Figure 3). This suggests that the hypocentral region was probably not the main asperity itself, but rather a relatively weakly coupled, conditionally stable sliding patch or a fault segment that had been partially weakened by preceding activity. Previous studies have suggested that the anomalously high aftershock productivity of the 20 July foreshock and the possible afterslip it triggered may have played a key role in the nucleation of the mainshock [8]. Although fluid involvement cannot be ruled out, there is currently no direct observational evidence for it. Therefore, we favor the more direct and robust interpretation that local weakening and/or afterslip associated with the foreshock facilitated nucleation.
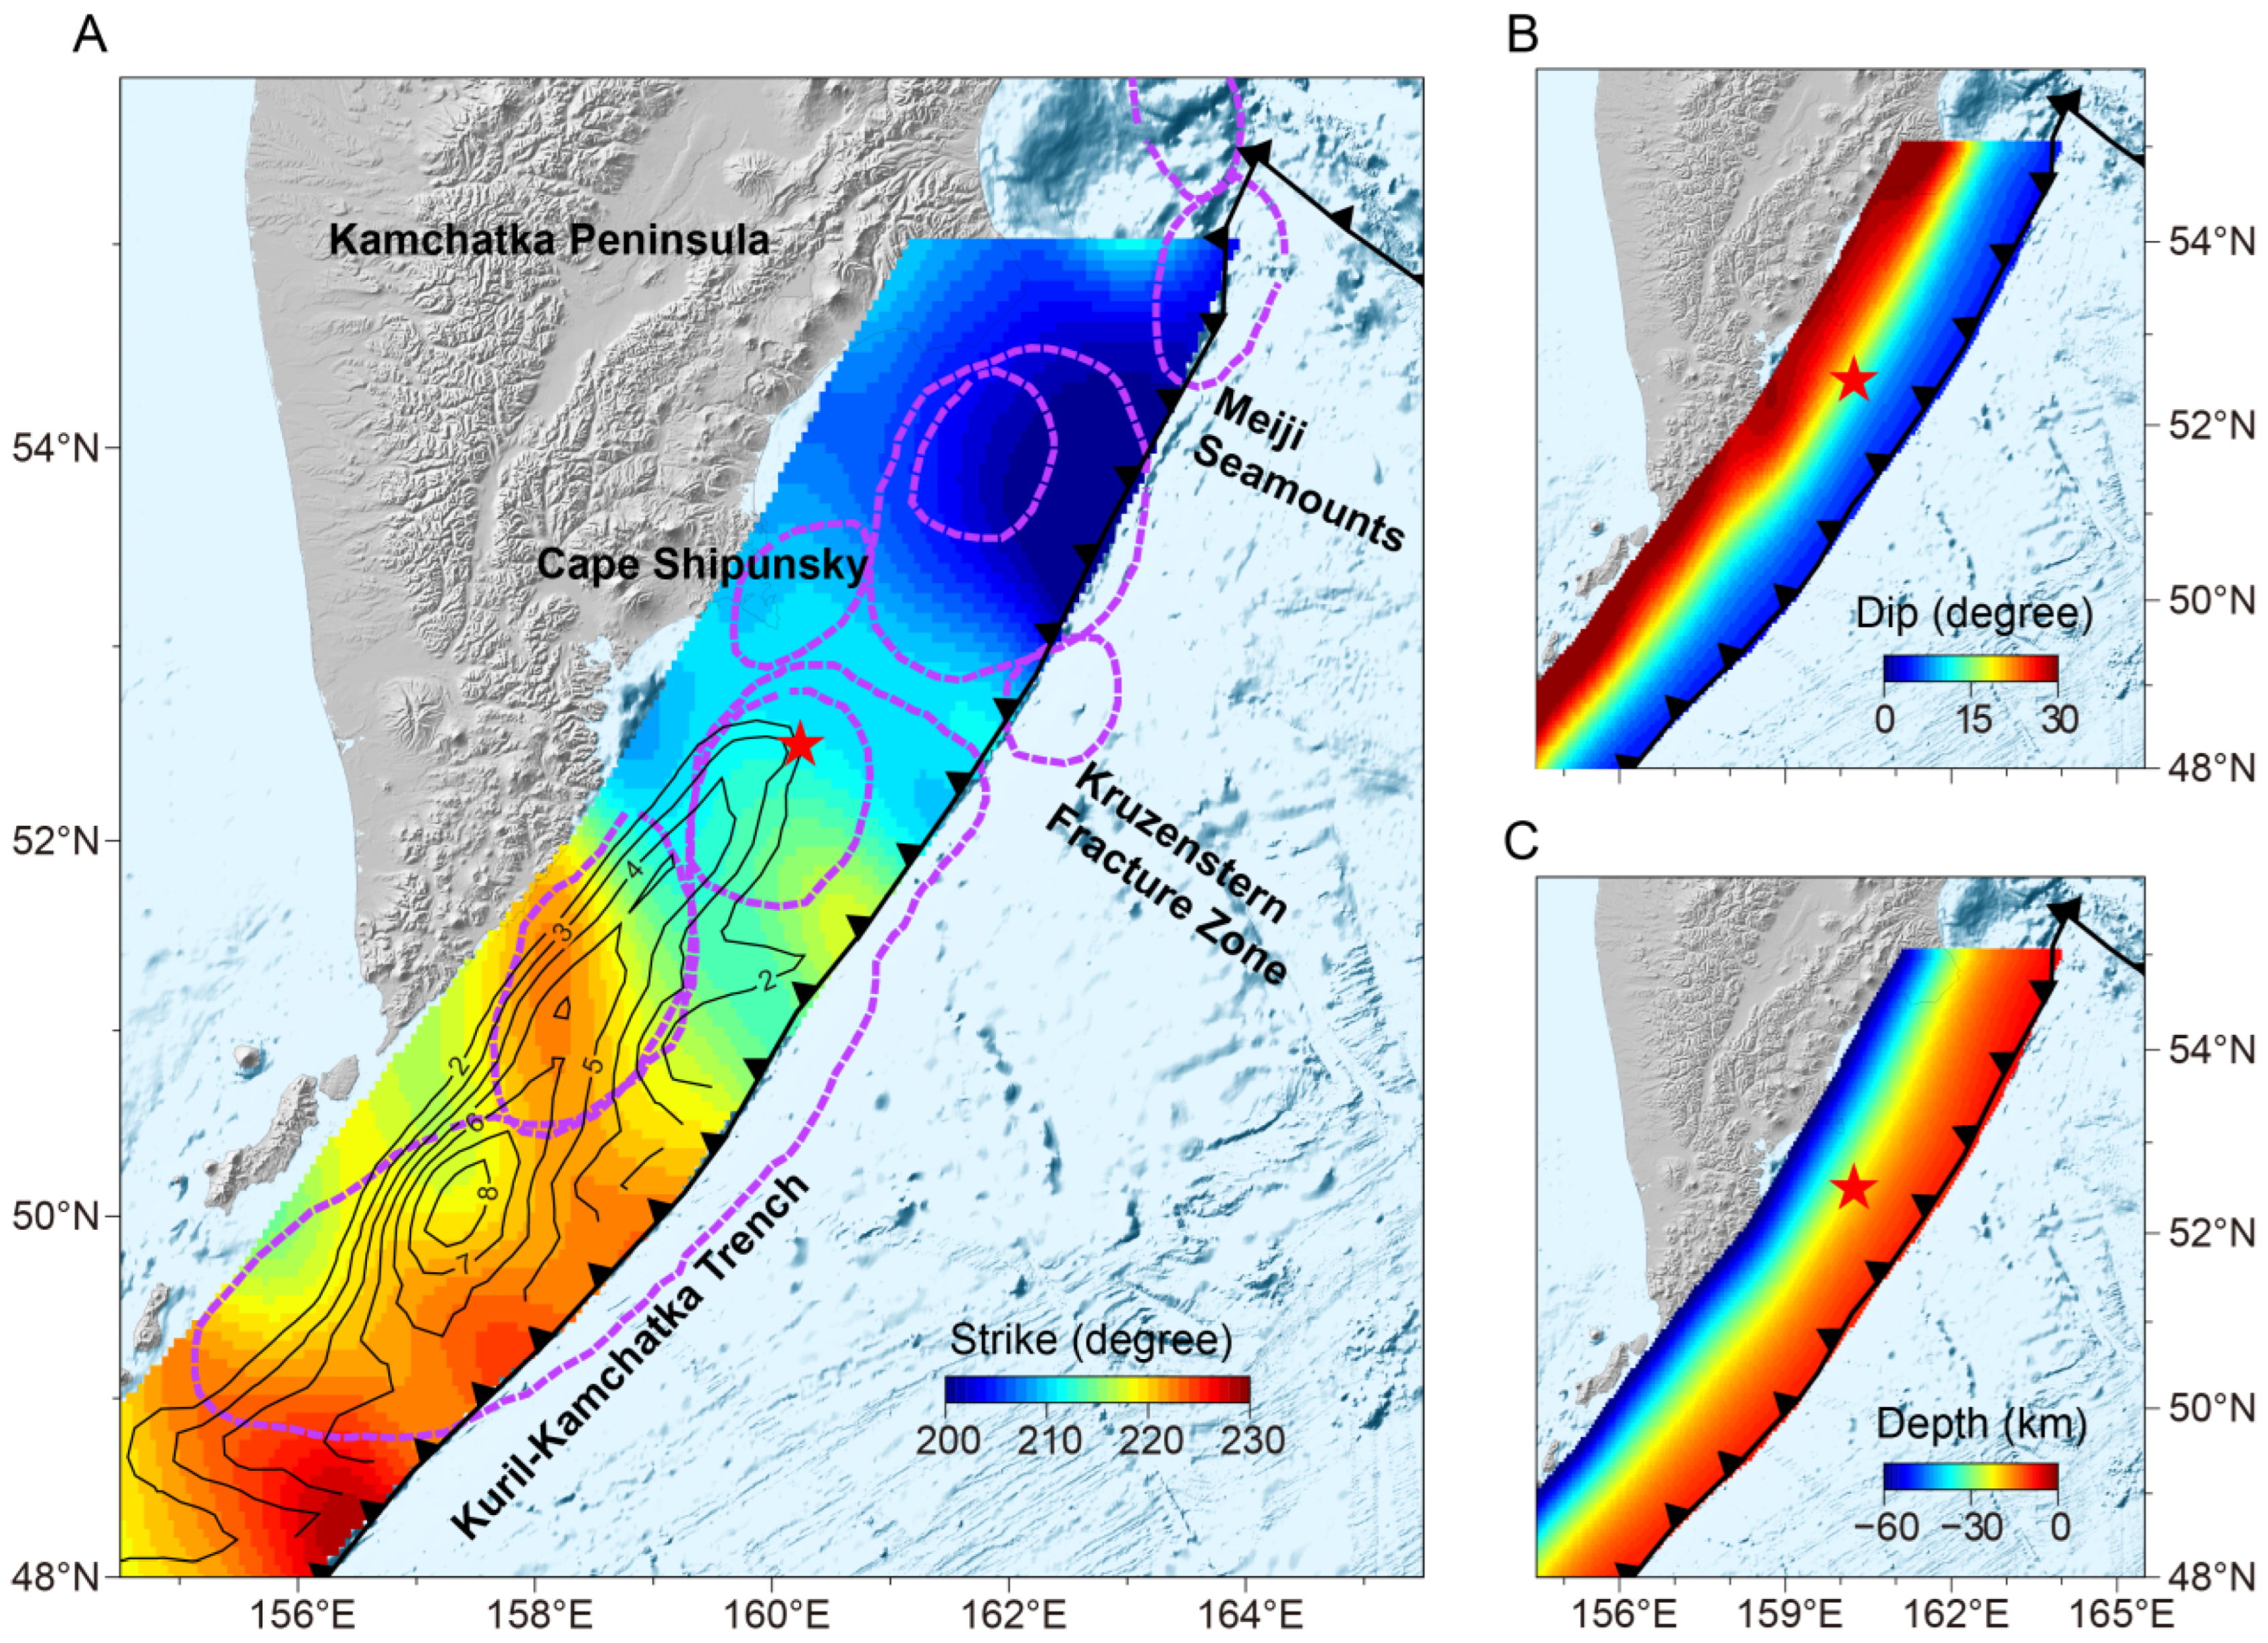
In strong contrast to the weak slip in the nucleation region, once the rupture front propagated southwestward into the southern main asperity, both slip magnitude and high-frequency radiation increased rapidly, indicating a strong enhancement of rupture after entering a more strongly coupled and highly stressed portion of the megathrust. Near 50°N, high-frequency radiation is concentrated mainly along the edges of the large-slip region rather than at the center of peak slip. This suggests that high-frequency seismic radiation more likely reflects heterogeneous stress release and variations in fault frictional properties near the rupture front, rather than simply corresponding to maximum slip itself. It also indicates that back-projection techniques have the potential to reveal fault heterogeneity [26]. The pronounced high-frequency radiation band near 52°N may represent a structural boundary between a relatively weakly coupled patch and a strongly locked patch, where the strike of the subduction zone also changes markedly, or it may reflect local bending of the plate interface or enhanced slip gradients. Previous coupling studies have shown that the southern Kamchatka megathrust contains strongly locked regions at depths of 15–60 km, capable of accumulating sufficient slip deficit to generate Mw 8.8–9-class giant earthquakes [6,7]. The location of the main asperity in our inversion agrees broadly with these strongly locked patches, indicating that long-term locking controlled the formation of the main slip region. In addition, the curved fault geometry may have facilitated continuous rupture propagation in this stage. Compared with the northern segment, the southern megathrust is geometrically smoother and exhibits smaller along-strike changes, favoring sustained rupture propagation with lower energy loss [27]. By contrast, pronounced fault bends, abrupt dip changes, or local roughness can form rupture barriers, increase energy dissipation, and inhibit long-distance rupture propagation (Figure 4) [1]. We therefore infer that the rapid transition of the 2025 mainshock into a long unilateral rupture after entering the southern segment was controlled not by a single factor, but by the combined effects of strong long-term locking and relatively smooth curved megathrust geometry in southern Kamchatka.
Figure 4.
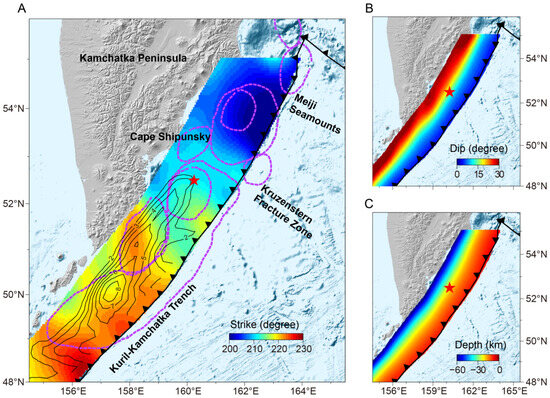
Regional tectonic setting and subduction geometry of the Kamchatka subduction zone. (A) Along-strike variation in megathrust geometry. Purple dashed lines indicate rupture extents of large historical earthquakes. The black sawtooth line marks the Kamchatka subduction trench. The red star denotes the epicenter of the 29 July 2025 mainshock. Black contours show slip contours of the mainshock, with numbers indicating slip amplitudes in meters. The locations of the Kruzenstern fracture zone and Meiji seamounts are also indicated. (B,C) Downdip and depth variations of the Kamchatka subduction zone, respectively.
4.2. Controls on the North–South Contrast in Earthquake Magnitude Along the Kamchatka Subduction Zone
The Kamchatka subduction zone exhibits a pronounced along-strike contrast in maximum earthquake size, with repeated Mw 8.8–9 giant earthquakes in the southern segment, whereas the northern segment more commonly produces Mw ~8 earthquakes or smaller ruptures [1]. We suggest that this contrast may be controlled by several interacting factors. The first factor is locking heterogeneity. GPS coupling studies indicate that the megathrust south of 53°N is overall more strongly locked, allowing sufficient elastic strain to accumulate for Mw 8.8–9 long ruptures, whereas the segment farther north is characterized by more pronounced aseismic slip or partial coupling, thereby limiting the long-term accumulation of large slip deficits [6,7]. The second factor is differences in plate-boundary geometry. Figure 4A shows that the strike of the Kamchatka subduction zone undergoes significant changes, from 200° at 54°N to 230° at 48°N, involving several abrupt variations. The locations associated with these strike changes are well aligned with the rupture areas of historical earthquakes. This geometric complexity may increase energy dissipation and barrier effects during rupture propagation, thereby limiting long-distance continuous rupture (Figure 4). The third factor is the additional segmentation imposed by subducting seamount chains and fracture zones. Previous studies have shown that subduction of the Meiji seamount chain and the Kruzenstern fracture zone perturbs the forearc structure, alters the local stress state, and affects interplate locking. In particular, the Kruzenstern fracture zone subducts near 52°N, whereas the Meiji seamount chain is closely related to slab-geometry changes and rupture segmentation farther north [6,12,15].
Consequently, the greater difficulty in generating ultra-long ruptures in the northern segment may result from geometric discontinuities and changes in frictional properties associated with these submarine tectonic structures. Overall, the long-term “strong south, weak north” contrast in earthquake size along the Kamchatka subduction zone is unlikely to be controlled by coupling or geometry alone. Rather, it probably reflects the combined effects of strong long-term locking, smoother curved megathrust geometry, and the subduction of seamount and fracture-zone structures. In addition, the maximum earthquake size contrast between the northern and southern segments may also be influenced by upper-plate structure, the evolution of forearc basins and peninsulas, and stress-transfer history on different timescales. The locking–geometry–tectonic-unit framework proposed here should therefore be regarded as the most direct current interpretation, but not the only possible one.
5. Conclusions
Based on a curved plate-interface geometry, joint inversion of InSAR, GNSS, and teleseismic waveforms, and teleseismic P-wave back-projection, we investigated the rupture process of the 2025 Mw 8.8 Kamchatka earthquake and its tectonic controls. The main conclusions are as follows.
- The 2025 Kamchatka mainshock was characterized by a long unilateral rupture propagating from northeast to southwest, with a total duration of about 200 s, dominant slip concentrated at depths of 15–30 km on the plate interface, and a peak slip of about 10 m.
- Rupture near the nucleation stage was weak and slow, indicating that the mainshock likely nucleated within a relatively weakened segment. The rupture then accelerated rapidly after entering a strongly locked asperity in the southern segment.
- High-frequency radiation migrated southwestward, but its strongest concentrations were located mainly along slip gradients and possible structural boundaries rather than at the center of peak slip. This indicates that high-frequency radiation is more sensitive to frictional-property variations and geometric discontinuities.
- Curved megathrust geometry and along-strike locking heterogeneity jointly controlled the rupture of the 2025 mainshock. The contrast in earthquake size between the northern and southern Kamchatka subduction zone may be governed by differences in locking strength, smoothness of the geometry, and subducting submarine tectonic features.
Supplementary Materials
The following supporting information can be downloaded at: https://www.mdpi.com/article/10.3390/rs18111803/s1, Figure S1: Distribution of broadband seismic station. Figure S2: Based on the L-curve search for the spatiotemporal smoothing factor. Figure S3: The velocity model used in the finite fault inversion. Figure S4: InSAR deformation field of the 2025 Mw 8.8 Kamchatka earthquake. Figure S5: Fit of P-wave data based on the optimal model.
Author Contributions
Conceptualization, G.S. and P.S.; methodology, G.S. and G.Z.; software, G.S.; validation, G.S., G.Z. and P.S.; formal analysis, G.S.; investigation, G.S. and P.S.; resources, G.Z. and P.S.; data curation, G.S. and P.S.; writing—original draft preparation, G.S.; writing—review and editing, G.Z. and P.S.; visualization, G.S. and P.S.; supervision, G.Z. and P.S.; project administration, G.S. and P.S.; funding acquisition, G.S. and P.S. All authors have read and agreed to the published version of the manuscript.
Funding
This research was funded by the Teachers’ Scientific Research Fund of China Earthquake Administration (Grant No. 20150105), State Key Laboratory of Earthquake Dynamics and Forecasting (Grant No. LEDF2025B05), Science Research Project of HeBei Education Department (Grant No. ZC2024098), Spark Program of Earthquake Sciences (Grant No. XH24062A), the National Natural Science Foundation of China (Grant No. 52274165), the Self-Funded Project of Scientific Research and Development Plan of Langfang Science and Technology Bureau (Grant No. 2025013216 and Grant No. 2022013087), 2025 Gansu Provincial Joint Scientific Research Fund (Grant No. 25JRRA1104), and the Special Fund of Fundamental Scientific Research Business Expense for Higher School of Central Government (Grant No. ZY20215160).
Data Availability Statement
The moment tensor solutions for the 2025 Mw 8.8 Kamchatka earthquake were provided by the Global Centroid-Moment-Tensor (CMT; https://www.globalcmt.org/, accessed on 9 March 2026). The aftershock catalog for the 2025 Mw 8.8 Kamchatka earthquake was sourced from Emergency Situations Ministry of Russia (https://sdis.emsd.ru/info/earthquakes/catalogue.php, accessed on 9 February 2026).
Acknowledgments
The authors are grateful to the European Space Agency (ESA) for providing the Sentinel-1 SAR data used in this study. We acknowledge the Nevada Geodetic Laboratory for making the GNSS time series data publicly available. We also thank the Incorporated Research Institutions for Seismology (IRIS) Data Management Center for providing the teleseismic waveform data.
Conflicts of Interest
The authors declare no conflicts of interest.
References
- Gorbatov, A.; Kostoglodov, V.; Suárez, G.; Gordeev, E. Seismicity and structure of the Kamchatka subduction zone. J. Geophys. Res. Solid Earth 1997, 102, 17883–17898. [Google Scholar] [CrossRef] [Scilit]
- Johnson, J.M.; Satake, K. Asperity distribution of the 1952 great Kamchatka earthquake and its relation to future earthquake potential in Kamchatka. Pure Appl. Geophys. 1999, 154, 541–553. [Google Scholar] [CrossRef] [Scilit]
- MacInnes, B.T.; Weiss, R.; Bourgeois, J.; Pinegina, T.K. Slip distribution of the 1952 Kamchatka great earthquake based on near-field tsunami deposits and historical records. Bull. Seismol. Soc. Am. 2010, 100, 1695–1709. [Google Scholar] [CrossRef] [Scilit]
- DeMets, C.; Gordon, R.G.; Argus, D.F.; Stein, S. Current plate motions. Geophys. J. Int. 1990, 101, 425–478. [Google Scholar] [CrossRef] [Scilit]
- Steblov, G.; Kogan, M.; King, R.; Scholz, C.; Bürgmann, R.; Frolov, D. Imprint of the North American plate in Siberia revealed by GPS. Geophys. Res. Lett. 2003, 30, 1924. [Google Scholar] [CrossRef] [Scilit]
- Bürgmann, R.; Kogan, M.G.; Steblov, G.M.; Hilley, G.; Levin, V.E.; Apel, E. Interseismic coupling and asperity distribution along the Kamchatka subduction zone. J. Geophys. Res. Solid Earth 2005, 110, B07405. [Google Scholar] [CrossRef] [Scilit]
- Tomita, F. Re-evaluation of the interseismic slip deficit rates along the Kamchatka subduction zone. Earth Planets Space 2026, 78, 41. [Google Scholar] [CrossRef] [Scilit]
- Mach, P.; Si, X.; Wang, D.; Shcherbakov, R.; He, P.; Taymaz, T.; Ding, C.; Peng, Z. Foreshock behaviors and mainshock rupture properties associated with the 2025 Mw 8.8 Kamchatka earthquake sequence. Earthq. Res. Adv. 2026, 100457. Available online: https://eartharxiv.org/repository/object/10943/download/23143/ (accessed on 9 February 2026).
- Stein, R.; Toda, S.; Lotto, G.; Gonzalez-Huizar, H.; Sevilgen, V. Huge July 2025 Kamchatka earthquake followed unusually productive foreshock sequence. Temblor 2025. [Google Scholar] [CrossRef] [Scilit]
- Yagi, Y.; Fukahata, Y.; Okuwaki, R.; Takagawa, T.; Toda, S. Breaking the Cycle: Short Recurrence and Overshoot of an M9-class Kamchatka Earthquake. Seismica 2025, 4, 1–18. [Google Scholar] [CrossRef] [Scilit]
- Yamanaka, Y.; Atobe, Y.; Tsutsui, Y.; Okada, K.; Takahashi, H.; Tanioka, Y. Comparison of the tsunamis following the 2025 and 1952 Kamchatka Earthquakes, Russia: Field observations along the Japanese coast. Earth Planets Space 2025, 77, 193. [Google Scholar] [CrossRef] [Scilit]
- Liu, C.L.; Bai, Y.F.; Lay, T.; He, P.; Wen, Y.M.; Xiong, X.; Taymaz, T. Simple unilateral rupture of the great Mw8.8 2025 Kamchatka earthquake. Science 2026, 391, 812–817. [Google Scholar] [CrossRef] [Scilit]
- Mikhailov, V.O.; Konvisar, A.M.; Smirnov, V.B.; Timoshkina, E.P.; Titkov, N.N.; Khairetdinov, S.A.; Chebrov, D.V. The Rupture Surface Model of the July 29, 2025 Mw 8.8 Kamchatka Earthquake Based on Satellite Geodesy and Interferometry Data. Dokl. Earth Sci. 2025, 525, 35. [Google Scholar] [CrossRef] [Scilit]
- Xu, D.; Wang, W.; Ren, Z. Preliminary slip distribution of the 29 July 2025 Mw 8.8 Kamchatka, Russia earthquake. Earthq. Res. Adv. 2025, 6, 100427. [Google Scholar] [CrossRef] [Scilit]
- Zhou, Y.; Wang, W.; Xu, D.; Wang, X.; Pan, Z.; He, J.; Yao, Z. Rupture and tectonic controls of the 2025 Mw 8.8 Kamchatka subduction earthquake in Far East Russia. Sci. Bull. 2025, 71, 2192–2195. [Google Scholar] [CrossRef] [Scilit]
- Goldstein, R.M.; Werner, C.L. Radar interferogram filtering for geophysical applications. Geophys. Res. Lett. 1998, 25, 4035–4038. [Google Scholar] [CrossRef] [Scilit]
- Costantini, M. A novel phase unwrapping method based on network programming. IEEE Trans. Geosci. Remote Sens. 2002, 36, 813–821. [Google Scholar] [CrossRef] [Scilit]
- Gao, H.; Liao, M.; Feng, G. An improved quadtree sampling method for InSAR seismic deformation inversion. Remote Sens. 2021, 13, 1678. [Google Scholar] [CrossRef] [Scilit]
- Hayes, G.P.; Moore, G.L.; Portner, D.E.; Hearne, M.; Flamme, H.; Furtney, M.; Smoczyk, G.M. Slab2, a comprehensive subduction zone geometry model. Science 2018, 362, 58–61. [Google Scholar] [CrossRef] [Scilit]
- Geuzaine, C.; Remacle, J.F. Gmsh: A 3-D finite element mesh generator with built-in pre-and post-processing facilities. Int. J. Numer. Methods Eng. 2009, 79, 1309–1331. [Google Scholar] [CrossRef] [Scilit]
- Zhang, Y.; Feng, W.; Chen, Y.; Xu, L.; Li, Z.; Forrest, D. The 2009 L’Aquila MW 6.3 earthquake: A new technique to locate the hypocentre in the joint inversion of earthquake rupture process. Geophys. J. Int. 2012, 191, 1417–1426. [Google Scholar]
- Goldberg, D.E.; Koch, P.; Melgar, D.; Riquelme, S.; Yeck, W.L. Beyond the teleseism: Introducing regional seismic and geodetic data into routine USGS finite-fault modeling. Seismol. Soc. Am. 2022, 93, 3308–3323. [Google Scholar] [CrossRef] [Scilit]
- Laske, G.; Masters, G.; Ma, Z.; Pasyanos, M. Update on CRUST1.0—A 1-Degree Global Model of Earth’s Crust. In Proceedings of the Geophysical Research Abstracts, Vienna, Austria, 7–12 April 2013. [Google Scholar]
- Kiser, E.; Ishii, M. Back-projection imaging of earthquakes. Annu. Rev. Earth Planet. Sci. 2017, 45, 271–299. [Google Scholar] [CrossRef] [Scilit]
- Meng, L.; Inbal, A.; Ampuero, J.P. A window into the complexity of the dynamic rupture of the 2011 Mw 9 Tohoku-Oki earthquake. Geophys. Res. Lett. 2011, 38, L00G07. [Google Scholar] [CrossRef] [Scilit]
- Huang, C.; Xu, W.; Bürgmann, R.; Xie, L.; Feng, G.; Shan, B.; Li, Z.; Aoki, Y.; Zhang, Y.; Zhu, J.; et al. Heterogeneous strong asperities and tectonic complexity control irregular cascading ruptures. Sci. Adv. 2025, 11, eadv6771. [Google Scholar] [CrossRef] [Scilit] [PubMed]
- Liu, J.; Huang, C.; Zhang, G.; Shan, X.; Korzhenkov, A.; Taymaz, T. Immature characteristics of the East Anatolian Fault Zone from SAR, GNSS and strong motion data of the 2023 Türkiye–Syria earthquake doublet. Sci. Rep. 2024, 14, 10625. [Google Scholar] [CrossRef] [Scilit]
Disclaimer/Publisher’s Note: The statements, opinions and data contained in all publications are solely those of the individual author(s) and contributor(s) and not of MDPI and/or the editor(s). MDPI and/or the editor(s) disclaim responsibility for any injury to people or property resulting from any ideas, methods, instructions or products referred to in the content. |
© 2026 by the authors. Licensee MDPI, Basel, Switzerland. This article is an open access article distributed under the terms and conditions of the Creative Commons Attribution (CC BY) license.