


Highlights
What are the main findings?
- Present-day strain and rotation rates are estimated using updated GNSS velocities in the Pamir–Tian Shan region.
- The derived strain field is consistent with major active tectonic structures.
- Deformation patterns reflect ongoing India–Eurasia convergence and interactions among regional blocks.
What are the implications of the main findings?
- This study presents precise strain and rotation rates, enabling tighter constraints for the interpretation of the formation and evolution of Pamir–Tian Shan zone.
- This study highlights that GNSS-based strain rate mapping provides an additional, physically independent constraint on the long-term seismic potential of active structures, thereby contributing to more robust regional seismic hazard evaluations.
Abstract
The Pamir–Tian Shan domain constitutes one of the most actively deforming intracontinental orogenic systems associated with continued India–Eurasia convergence. Characterizing present-day deformation in this region is fundamental to deciphering its geodynamic evolution and assessing seismic risk. Existing strain rate models based on GNSS measurements display noticeable discrepancies, largely attributable to variations in analytical strategies and uneven station distribution. In this study, we determine the present crustal strain and rotation fields across the Pamir–Tian Shan area using the most updated GNSS velocity solution referenced to stable Eurasia. To address the issues of inconsistent strain rate field results and lack of reliability verification in previous studies based on GNSS data, this paper computes the crustal strain rate field (principal strain rate, maximum shear strain rate, dilatation strain rate, and rotational strain rate) with a grid spacing of 0.75° × 0.75° in the study area, followed by numerical validation of the results’ reliability. The derived strain field is characterized by dominant NNW–SSE shortening throughout much of the orogenic system, with peak compressional strain rates (~1.0 × 10⁻⁷ yr−1) concentrated along the Pamir Frontal Thrust. By contrast, the interior of the Pamir Plateau exhibits clear EW extension, consistent with areas affected by normal-faulting earthquakes. High values of shear strain rates are primarily localized along major active fault systems, whereas negative dilatational components indicate overall contraction within the Tian Shan. The rotation-rate distribution reveals clockwise rotation of the Tarim Basin (approximately 0.6°/Myr) together with counterclockwise rotation affecting the Pamir and Tian Shan blocks, accommodated by prominent strike–slip fault networks. The close spatial agreement between the modeled strain patterns, active tectonic structures, and focal mechanism solutions supports the reliability of the inferred deformation field. The research results of this paper are of great scientific significance for in-depth study of the tectonic evolution and earthquake disaster assessment in the Pamir–Tian Shan region.
1. Introduction
The Tian Shan underwent pronounced tectonic rejuvenation in the late Cenozoic, following a prolonged interval of relative tectonic stability [1,2,3,4,5,6,7,8,9]. This phase of renewed deformation is generally attributed to far-field stresses generated by the continuing India–Eurasia collision and the progressive northward advance of the Pamir salient [10,11,12,13]. Integrating geological reconstructions with geodetic observations suggests cumulative crustal shortening exceeding ~200 km [1,14], expressed as significant uplift, large-scale folding, and widespread thrust faulting. Owing to these characteristics, the Tian Shan provides an outstanding setting for investigating how intracontinental mountain belts absorb and redistribute stresses transmitted from distant plate boundaries.
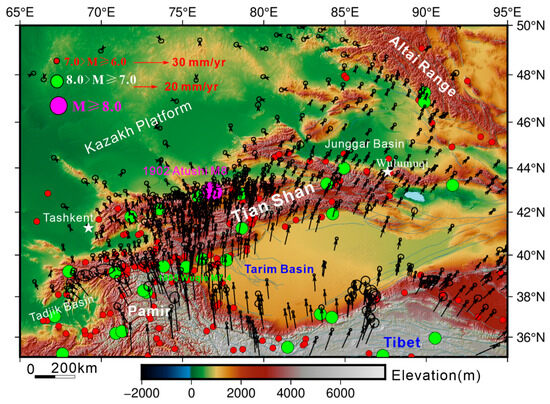
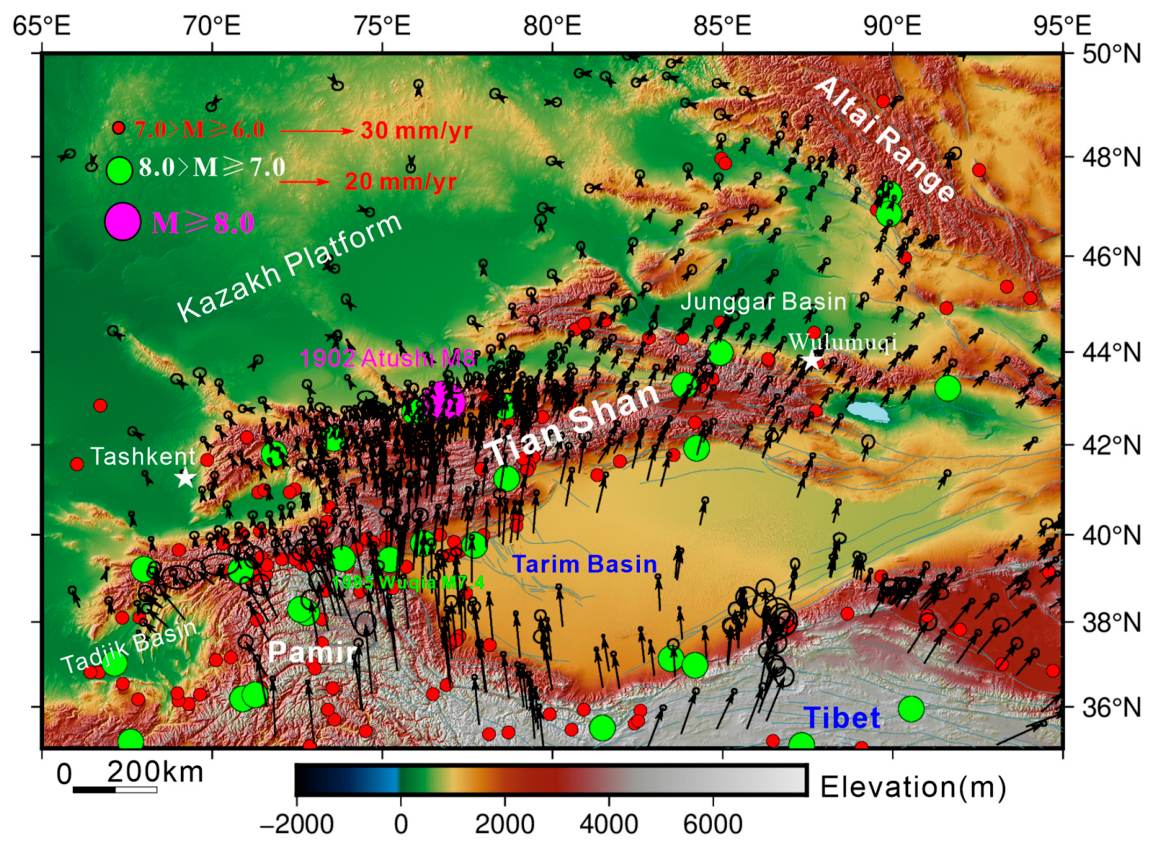
The Pamir–Tian Shan region is further distinguished by frequent and sometimes destructive earthquakes. Historical and instrumental records document numerous major events, including the 1812 M 8.0 Nilke great earthquake, the 1902 M 8.0 Artux earthquake, and the 1906 M 8.0 Manas earthquake, the Chilik M 8.3 earthquake in 1889 and the Kebin M 8.2 earthquake in 1911 near Lake Issyk Kul [15,16,17,18,19], as shown in Figure 1. Seismicity shows strong spatial clustering along primary structural boundaries and zones of sharp velocity gradients in the western Tarim Basin, suggesting that mechanical interactions among rigid blocks and active faults govern strain accumulation [20,21]. Importantly, several earthquakes—including the 1997–1998 Jiashi sequence and the 2020 Jiashi events—occurred within the interior of the Tarim Basin rather than strictly along its margins. These intra-basin events have been interpreted as evidence for buried crustal structures and inward transmission of deformation from the Tian Shan toward the basin center [15,17,18,19]. Collectively, these findings underscore the need for quantitative constraints on present-day strain and rotational deformation in order to better resolve regional seismotectonic processes and associated seismic hazards.
Figure 1.
GNSS velocity field with respect to the Eurasian plate [22]. Error ellipses represent 70% confidence. Significant historical seismic events with M ≥ 6.0 occurred from 1 January 1900 to 31 December 2025 (earthquake data were retrieved from the following website: https://earthquake.usgs.gov/earthquakes/search/ (accessed on 31 December 2025)).
During the last three decades, the expansion of Global Navigation Satellite System (GNSS) observations has greatly improved constraints on present-day crustal motion in Central Asia. Contemporary geodetic observations indicate that ~20 mm/yr of north–south shortening is presently absorbed within the western Tian Shan, accounting for a significant portion of the India–Eurasia convergence across this longitudinal sector (e.g., Refs. [13,14,22,23]). These results highlight the importance of the Tian Shan as a key locus of intracontinental deformation. Shortening is mainly manifested by thrust faulting, crustal folding, and the formation of east–west-oriented intermontane basins (e.g., Refs. [8,24,25]). Meanwhile, large strike–slip fault systems play an important role in strain partitioning throughout the orogenic belt [26].
Although GNSS velocity fields directly record crustal displacement, velocity vector information alone does not fully resolve how deformation is distributed spatially. To obtain a more quantitative description of strain patterns, multiple studies have constructed strain rate models for the Tian Shan and neighboring regions (e.g., Refs. [27,28,29,30]). At the broadest scale, these models consistently show predominant north–south compression. However, inter-model comparisons reveal noticeable differences in both the amplitude and orientation of strain across the region. Comparable discrepancies are reported in strain rate solutions for mainland China and adjacent areas (e.g., Refs. [22,23,31,32,33]).
Such inconsistencies are commonly attributed to differences in methodological implementation, including interpolation schemes, smoothing choices, grid spacing, and the handling of irregular station geometry. In particular, the uneven spatial distribution of GNSS sites remains a persistent obstacle in strain rate estimation. Distinct computational strategies may therefore produce contrasting local strain features, even when derived from comparable velocity datasets. For this reason, establishing a modeling framework that effectively mitigates bias arising from heterogeneous station spacing is crucial for generating a robust, internally coherent strain rate field.
Using updated GNSS velocity data and a unified methodological framework, we estimate the current crustal strain and rotation rate fields across the Pamir–Tian Shan region. We adopt the approach proposed by Zhu et al. [34,35], which combines Kriging interpolation with grid-based strain calculation, to minimize errors caused by uneven spatial observations. Additionally, synthetic numerical experiments are conducted to evaluate the methodological approach’s stability and reliability. The resulting strain rate field is then analyzed in terms of regional tectonics and geodynamic processes.
2. GNSS Data
Since the 1980s, a comprehensive array of GNSS stations has been established throughout China to monitor crustal deformation. Notably, the implementation of the Crustal Movement Observation Network of China (CMONOC) over the preceding three decades has yielded a substantial corpus of high-precision geodetic observations. The GNSS dataset analyzed in this study is derived mainly from stations operated within the CMONOC program.
To maintain methodological rigor, we use published velocity solutions rather than reprocess the original GNSS observations. Specifically, we use the GNSS velocity field referenced to a stable Eurasia, compiled by Wang and Shen [22], as depicted in Figure 1. This dataset amalgamates CMONOC observations with findings from prior regional and global investigations (e.g., Refs. [36,37,38]). As indicated by Wang and Shen [22], coseismic and postseismic deformation associated with significant seismic events during the observation timeframe, including the 2008 Wenchuan earthquake and the 2015 Ms 7.2 Tajikistan earthquake, has been systematically excluded. Consequently, the velocity vectors predominantly encapsulate long-term interseismic crustal motion within the Pamir–Tian Shan domain.
As depicted in Figure 1, the spatial distribution of GNSS stations is characterized by heterogeneity. A dense concentration of stations is observed in certain segments of the southern Tian Shan in China, whereas station coverage is relatively sparse near the borders with Kyrgyzstan and Tajikistan. Notwithstanding this irregular distribution, the velocity field manifests a coherent large-scale pattern. The majority of GNSS stations exhibit a northward movement relative to stable Eurasia, with the velocity magnitude typically diminishing from south to north. The most pronounced velocities (30–40 mm/yr) are recorded in the central and eastern Pamir. Within the Pamir region, the velocity vectors exhibit a fan-shaped configuration, with orientations transitioning from nearly north–south in the eastern sectors to more northwesterly in the western sectors.
Between the Pamir and the Tian Shan, the velocity field becomes more complex, with significant variations along the strike of the orogenic belt. The Tian Shan exhibits a clear EW gradient in velocity magnitude. In the western Tian Shan, NS shortening between the Tarim Basin and the Kazakh Platform reaches approximately 20 mm/yr. Deformation in this segment appears to be distributed across multiple ranges and intermontane basins rather than localized to a single structure. In the central Tian Shan, northward velocities relative to stable Eurasia are typically 10–15 mm/yr, with more gradual spatial gradients. In the eastern Tian Shan, shortening rates decrease further to approximately 5–10 mm/yr, and velocity gradients become comparatively diffuse.
Overall, the GNSS velocity field offers a quantitative characterization of present-day deformation within the Pamir–Tian Shan orogenic system and serves as the essential observational foundation for subsequent strain rate analyses.
3. Results
3.1. Calculation Method
The spatial distribution of crustal strain rates can provide important constraints for studying the evolution of geological structures and the preparation process of great earthquakes. However, it is unfortunate that, despite using nearly identical GNSS observational data, different researchers have yielded varying strain rate calculations. For instance, Wang and Shen [22] calculated the crustal strain rate in Chinese Mainland based on a dataset with 2403 GNSS velocity vectors spanning 25 years. Zheng et al. [23] also computed the crustal strain rate in Chinese Mainland using 2576 GNSS vectors measured from 1991 to 2015. Yet, significant discrepancies are evident between their results: the maximum principal strain rate (PSR) from Wang and Shen [22] is concentrated near the Eastern Himalayan Syntaxis (EHS), while Zheng et al. [23] show no clear distribution of their maximum principal strain rate. Additionally, in Zheng et al. [23], the maximum shear strain rate (MSR) is primarily concentrated along the Sagaing Fault Zone, whereas Wang and Shen [22] locate it in other regions. Furthermore, many authors have calculated strain rates in the Tibetan Plateau using GNSS observational data, yet they also report markedly different results (e.g., Refs. [32,39,40,41]).
Theoretically, calculating the strain rate from GNSS-observed velocity vectors involves only a simple first-order derivative operation. So why do different researchers produce inconsistent strain rate distributions using nearly identical GNSS observational data? The primary reason is likely the sparse and uneven spatial distribution of GNSS observation stations [42]. To address this, Zhu et al. [35] employed a two-step interpolation method (first using kriging interpolation, followed by Lagrange interpolation similar to shape functions in finite element method) to compute strain rate components within uniformly spaced small grid cells. In the first step, we interpolate the east and north-trending components of GNSS velocities onto an evenly spaced grid at 0.75° intervals along the longitude and latitude directions, respectively [34,35]. Then, we compute the strain rate in each element cell on the Earth’s surface, similar to calculating shape functions in the finite element method [34,35].
Concerning the 4-node iso-parametric element, under a spherical coordinate system, coordinates (θ, φ) and surface velocity () can be written as shape functions as follows.
where (i = 1, 2, 3, 4) stand for shape functions in finite element method, namely , , , ; in which denote local coordinates, and , (i = 1, 2, 2, 4) are velocities estimated by kriging technique at four nodes in each element with a spacing of 0.75° × 0.75° in the study area, and and represent the velocity values in the east and north directions, respectively. Therefore, the derivative of the velocity component in spherical coordinates can be calculated, and the specific mathematical expression is as follows [34,35]:
Then, based on the geometric equation of elasticity in spherical coordinates, the component of strain rate at any point inside the cell can be calculated.
where R stands for the radius of the Earthe, represents the eastward strain rate component, and denotes the northward strain rate component).
Based on the strain rate components on the grid nodes, the principal strain rate () can be expressed as:
Similarly, other strain rates, such as maximum shear strain rate (MSR), dilatation strain rate (DSR), and rotational strain rate (RRV), can be described using Equations (6)–(8), respectively.
Unlike the Euler vector, the rotational strain rate in Formula (8) is a rotation around a positive vertical axis pointing upwards, so its counterclockwise rotation is positive and clockwise rotation is negative [36]. Therefore, positive (negative) rotational strain rates correspond to the sinistral (dextral) motion of the medium near strike slip faults [42,43].
3.2. Strain Rate Results
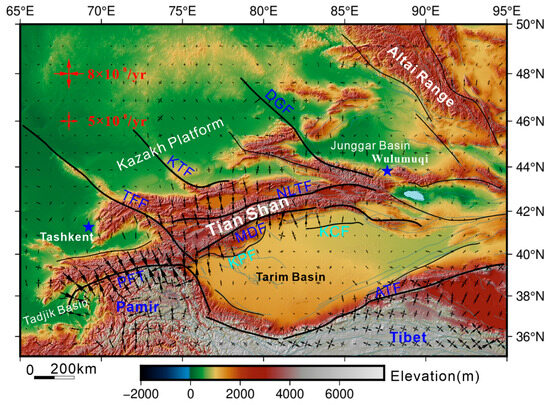
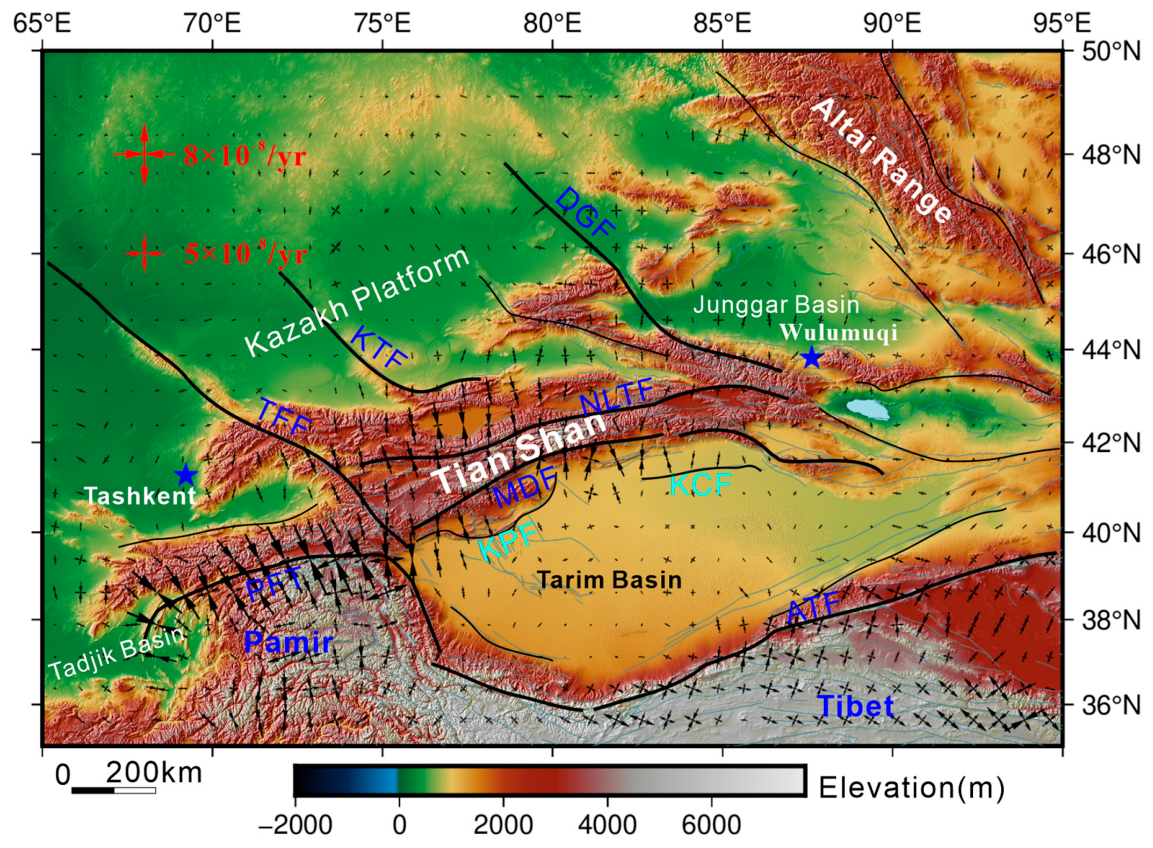
Figure 2 shows the spatial variation of the principal strain rates (PSR) in the Pamir–Tian Shan region and nearby areas at grid spacing of 0.75° × 0.75°. Outwardly directed arrows denote tensile strain rates, while inwardly directed arrows denote compressive strain rates. The figure indicates that the strain rate field exhibits remarkable spatial heterogeneity, reflecting the intricate interactions among the northward indentation of the India plate, the southward subduction of the Tian Shan crust, and the westward extrusion of the Pamir crust.
Figure 2.
The spatial configuration of principal strain rates in the Pamir–Tian Shan region is characterized by a grid size of 0.75° × 0.75° (the outward arrow indicates tensile strain, in contrast to the inward arrow, which indicates compressive strain). ATF: Altyn Tagh fault; PFT: Pamir Frontal Thrust; TFF: Talas-Fergana fault; MDF: Maidan fault; NLTF: Nalati fault; KTF: Kindytash fault; DGF: Dzhungarian fault; KPF: Kalpin thrusting system; KCF: Kuche thrusting system.
The figure reveals that strain rates are negligible in the inner part of the Tarim Basin and the Kazakh Platform, whereas significantly high values are observed to the north of the Pamir and centrally within the Tian Shan region.
The entire research area is primarily characterized by compression. The principal strain rate in the Pamir–Tian Shan domain primarily reflects compressive deformation associated with the active convergence of the Indian and Eurasian tectonic plates. The strain rate fields reveal widespread contraction, with the principal shortening axes oriented approximately NNW–SSE, perpendicular to the major tectonic structures. The magnitude of the PSR, however, exhibits significant spatial variability, with the highest values localized along the margins of the orogenic system. The highest values (~1.0 × 10⁻⁷/yr) are localized along the Pamir Frontal Thrust (PFT), where the Pamir Plateau thrusts over the Alai Valley, as shown in Figure 2. The orientation of the compressive PSR is almost perpendicular to the PFT. The next-largest magnitude (~7.0 × 10⁻⁸/yr) of the PSR is concentrated in the Tian Shan region, with an orientation nearly NS. But, in general, the magnitudes of the maximum compressive PSR gradually decrease from west to east.
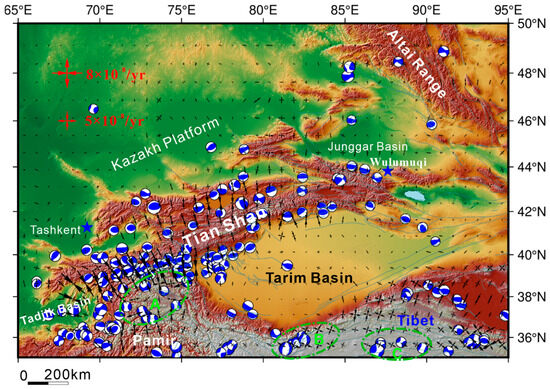
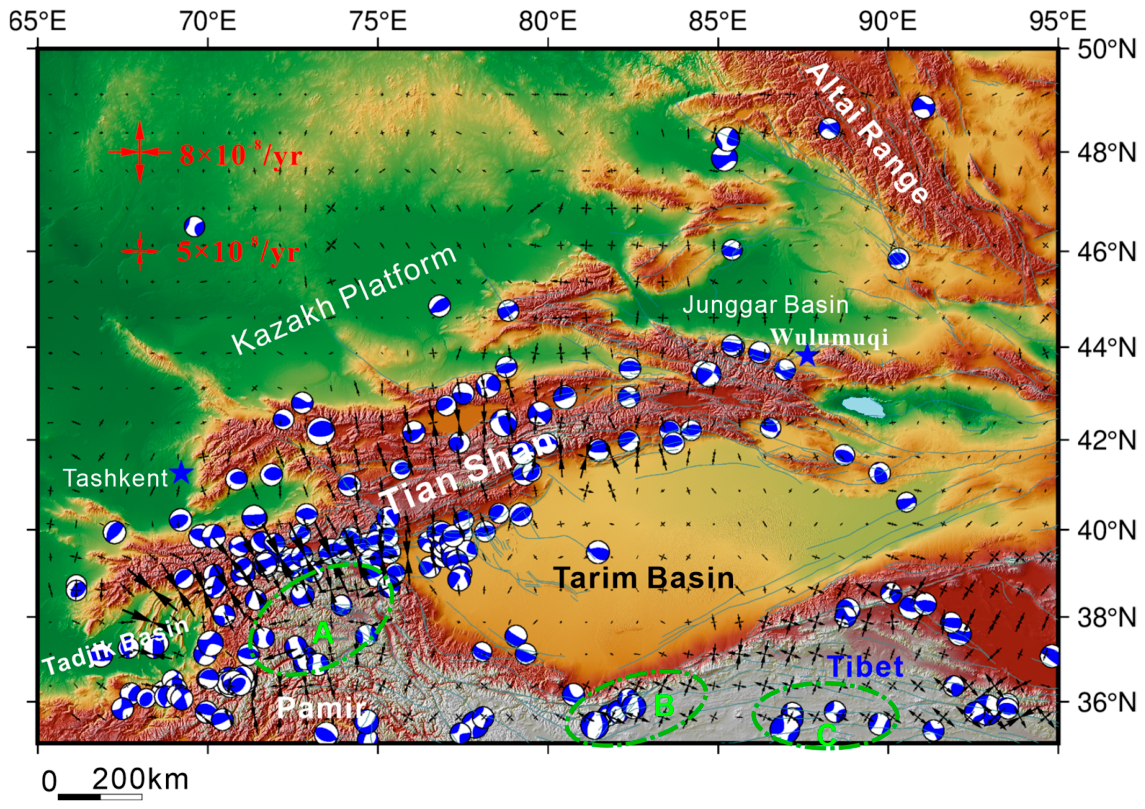
The largest magnitude of extensional PSR in the Pamir–Tian Shan region and surrounding areas is distributed in the interior of the Pamir Plateau to the south of PFT, between 36.5°N and 38.5°N latitude, as displayed in Figure 2. In this place, the Pamir uplifts and escapes due to the collision and compression between the Pamir and the Tian Shan. This extensional regime is consistent with geological observations of active normal faulting and with earthquake focal mechanisms that show normal fault solutions, as shown in Figure 3. The consistency between normal earthquakes and the extensional deformation regions, as indicated by strain rates, suggests that the strain rate results presented in the paper are reasonable and accurate. Furthermore, the main part of the Tian Shan crust is in a compressive environment, consistent with the observation that earthquakes in the Tian Shan region are mainly thrust earthquakes, as shown in Figure 3.
Figure 3.
Spatial distribution of earthquakes with Mw ≥ 6.0 from 1 January 1976 to 31 December 2025 (data from Harvard CMT: https://www.globalcmt.org/CMTsearch.html (accessed on 31 December 2025)). Normal earthquakes occurred mainly in three elliptical regions marked A, B, and C, where the magnitude of the extensional PSR exceeds that of the compressive PSR, corresponding to a tensile stress state.
In addition, it is noted that the magnitude of the compressive PSR is almost equal to that of the extensional PSR along the Altyn Tagh fault zone. The PSR orientation is approximately 45° relative to the fault strike, suggesting that the motion involves not solely pure strike–slip dynamics but also validates the accuracy of the employed calculation methodology. The most intriguing characteristic shown in Figure 2 is that three extensional regions, where the magnitude of the extensional PSR exceeds that of the compressive one, have earthquakes with normal fault mechanisms, as shown in Figure 3, with three green elliptical regions.
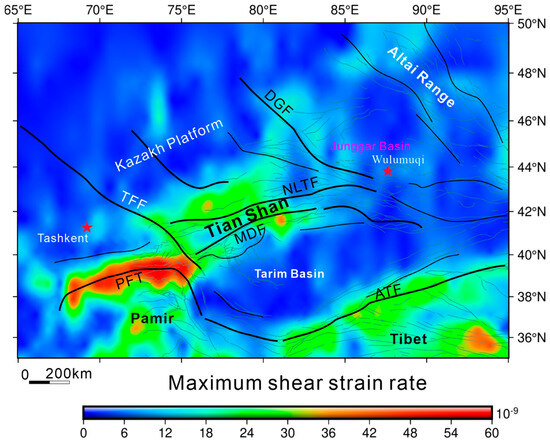
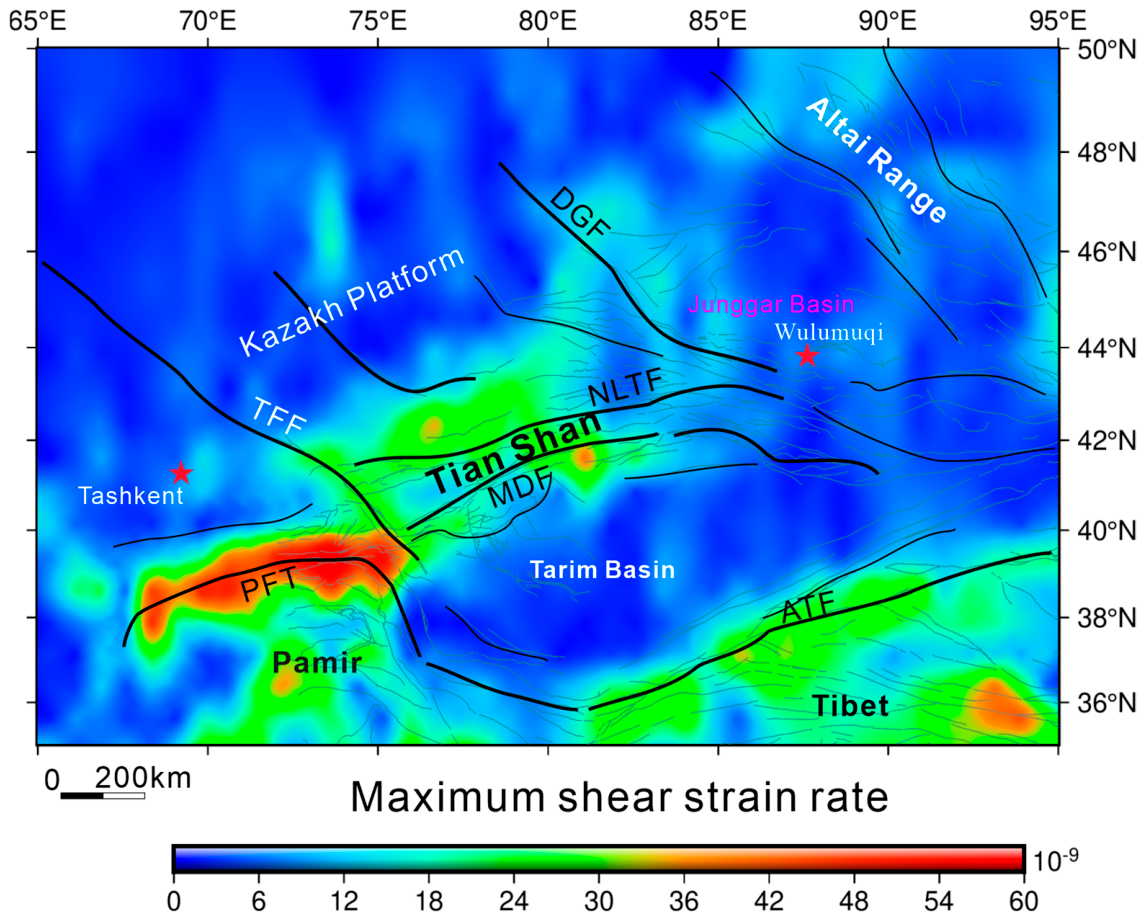
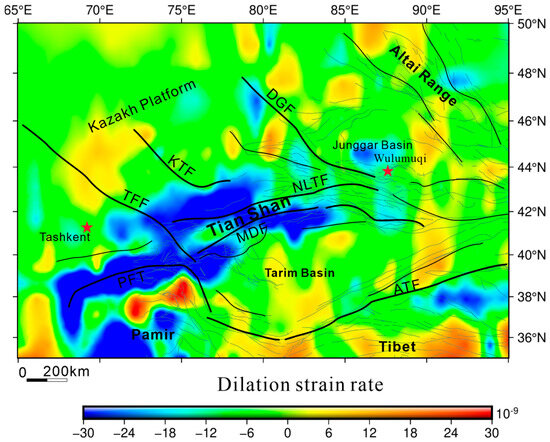
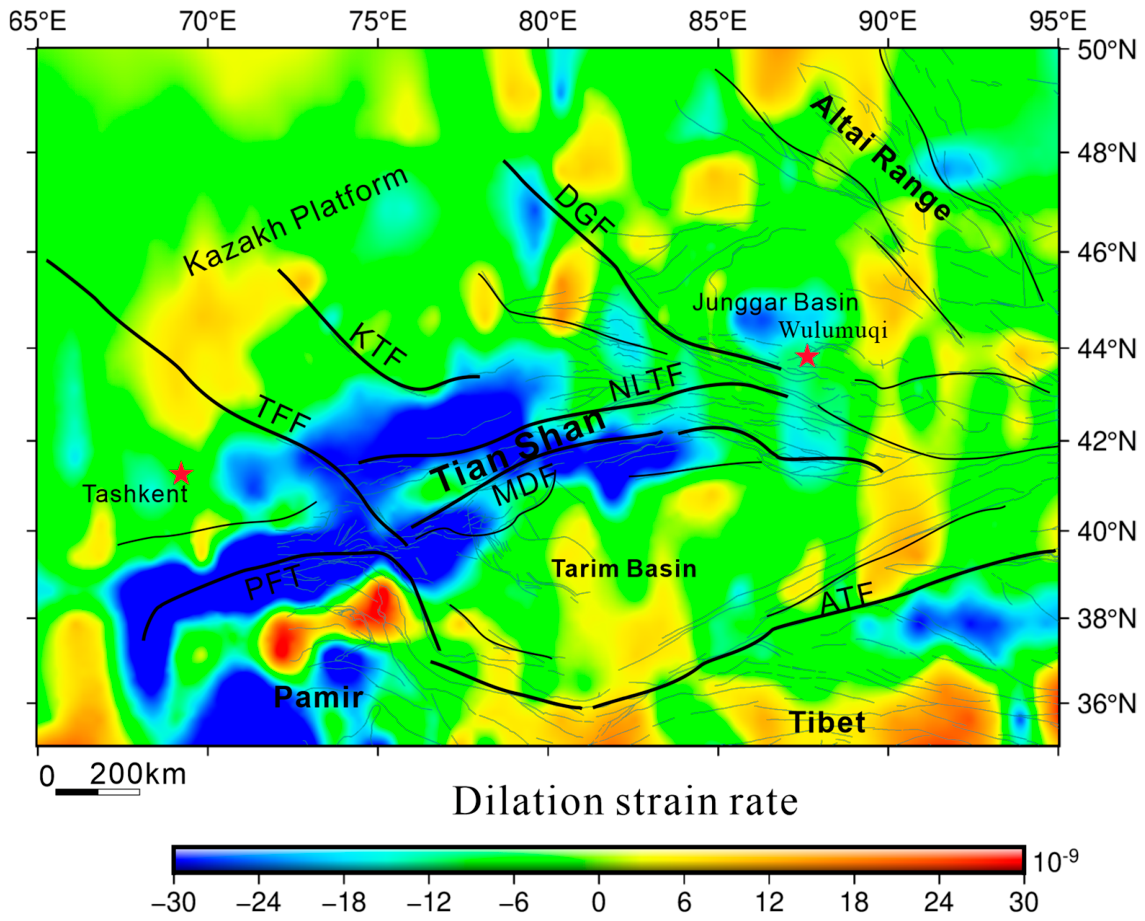
Figure 4 illustrates the spatial pattern of the maximum shear strain rate (MSR). This figure unequivocally demonstrates that high maximum shear strain rates are concentrated along the Pamir Frontal Thrust, with values approximately equal to 6.0 × 10⁻⁸/yr, whereas comparatively lower values are situated within the interior regions of the stable Tarim Basin and the Kazakh Platform, which correlates with the underlying tectonic regime. The dilatational strain rate (DSR) characterizes areal change, with positive values denoting extension and negative values corresponding to contraction. Figure 5 shows a cloud map of DSR in the Pamir–Tian Shan area. In general, the spatial distribution of DSR corresponds closely to the structural framework of the Tian Shan orogenic belt. The central Tian Shan is characterized by predominantly negative DSR values, indicative of ongoing crustal shortening, whereas the Tarim Basin exhibits positive DSR signals. A subtle east–west extensional component is identified in the eastern Tian Shan, which may reflect gravitational adjustment of the uplifted terrain or complex tectonic coupling between neighboring blocks.
Figure 4.
Spatial contour map of maximum shear strain rates (MSR) in the Pamir–Tian Shan region. The capitalized English abbreviations in the figure represent the same meanings as in Figure 2.
Figure 5.
Spatial contour map of dilatation strain rates (DSR) in the Pamir–Tian Shan region. The capitalized English abbreviations in the figure represent the same meanings as in Figure 2.
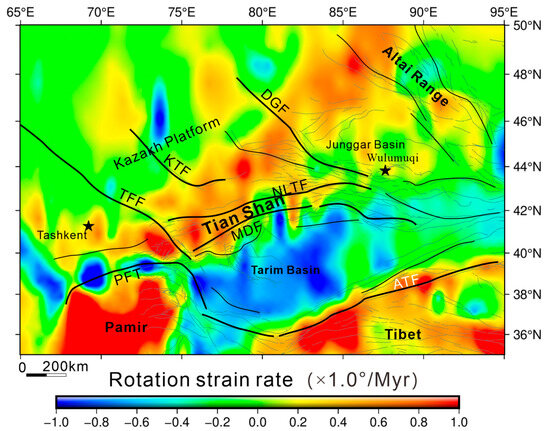
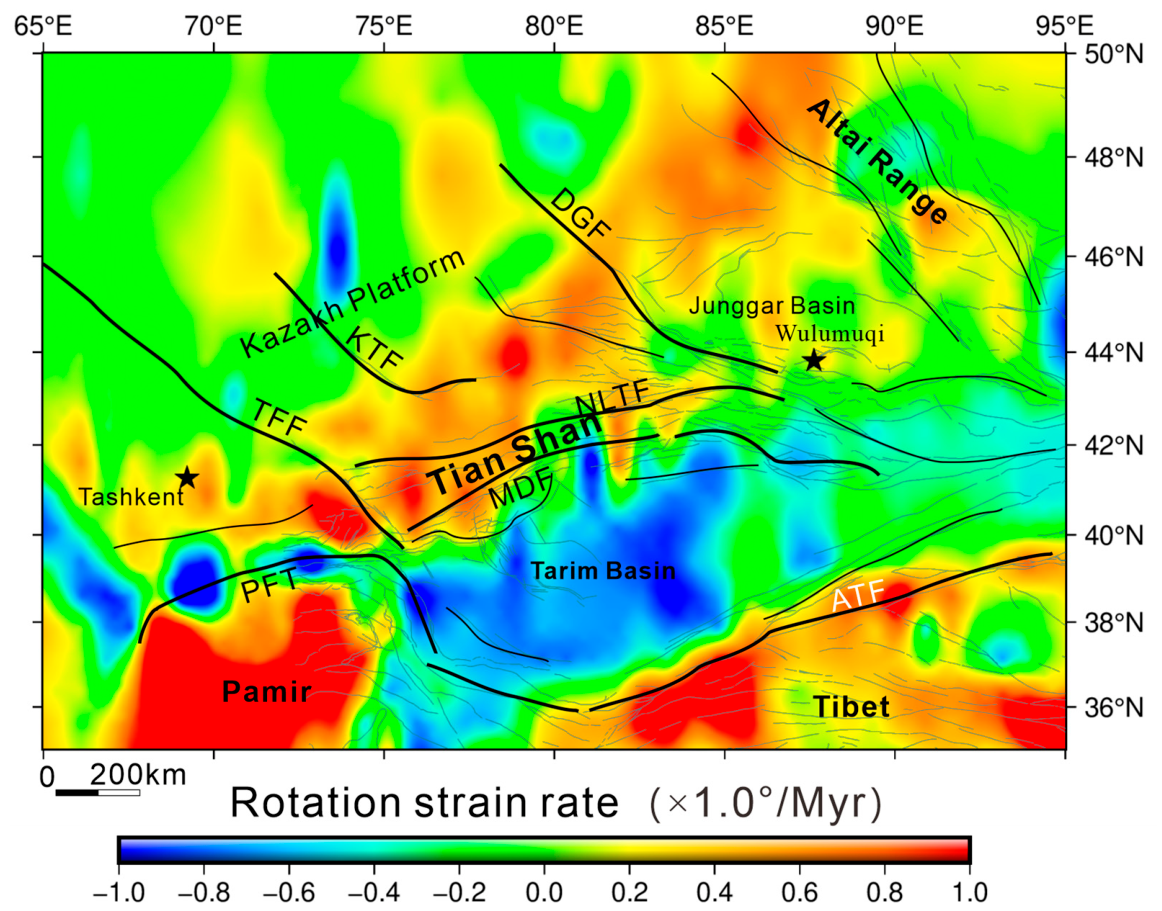
Figure 6 illustrates the spatial distribution of the rotational strain rate (RRV). It shows that both the Pamirs and Tianshan regions are characterized by positive values, indicating counterclockwise rotational deformation. In contrast, the Tarim Basin has a negative rotation strain rate, suggesting clockwise rotation; the rotation angle is approximately 0.5–0.7° per million years, which aligns closely with the 0.8°/Myr rotation angle reported by Reigber et al. [44] and is consistent with the 0.461°/Myr reported by Zhao et al. [45]. Furthermore, the Altyn Tagh fault zone lies within the positive RRV zone, indicating its sinistral strike–slip movement. The Ferghana Valley exhibits a clear counterclockwise rotation that influences slip rates on neighboring faults. There may also be smaller rotations within individual ranges and basins of the Tian Shan, reflecting the distributed deformation across this extensive orogenic system. These rotational patterns are significant for seismic hazard assessment because they affect slip rates and earthquake potential along major faults throughout the region.
Figure 6.
Spatial contour map of rotation strain rates (vorticity) (RRV) in the Pamir–Tian Shan region. The capitalized English abbreviations in the figure represent the same meanings as in Figure 2.
3.3. Numerical Test of the Validity of the Calculation Method
Deriving strain rate fields from GNSS velocity vectors appears straightforward in principle; however, practical applications demonstrate that the problem is far from trivial. Numerous studies have used similar GNSS datasets to estimate strain rates in mainland China [22,46], the Tibetan Plateau [23,32,33,39,40,41,47,48], the Ordos block [20,49,50,51,52,53,54], the southeastern Tibetan Plateau [43,55,56,57,58,59,60,61,62,63], and the Tian Shan orogenic belt [27,28,29,30]. Although many of these studies used comparable GNSS velocity datasets, their derived strain rate fields show noticeable differences [42,53,63].
Such variability likely arises from methodological factors, particularly the spatially uneven distribution of GNSS stations [34,35,53,63,64]. Because no direct and independent measurements of regional strain rates exist at the scale resolved by GNSS networks, it is difficult to determine which computational approach most faithfully represents the underlying deformation field. Therefore, numerical verification provides an effective way to assess the internal reliability of a given calculation method.
In this work, we assess the applicability of the strain rate estimation scheme proposed by Zhu et al. [34,35] using the real spatial configuration of GNSS stations across the Pamir–Tian Shan region.
To assess the method’s robustness, a synthetic analytical function was constructed to prescribe a known deformation field. Surface velocity vectors (CSV) at the GNSS station locations were then generated from this function, and the corresponding strain rate tensors (ASR) were obtained analytically by differentiating the prescribed velocity field.
Surface velocity components in the θ- and φ-directions (corresponding to eastward and northward directions in the spherical coordinate system) are defined according to the functional form given in Equation (9):
In practical implementation, Equation (9) can take various forms. In this study, a spatially periodic function is adopted. Specifically, the velocity components are expressed as:
where Θ represents colatitude, and Φ denotes longitude.
Based on Equation (10), velocity vectors at the GNSS station locations in the Pamir–Tian Shan region as shown in Figure 1, are generated. Because the functional form is fully prescribed, the analytical strain rate tensors (ASR) can be obtained directly from the governing mathematical expressions.
To ensure realistic deformation amplitudes, the parameters in Equation (10) are selected such that the resulting velocity magnitudes are comparable to observed GNSS vectors. The parameters used in this study are:
a1 = −2.0, a2 = 12.0, a3 = 10.0, a4 = 3.0, a5 = 22.0, a6 = 2.0;
b1 = 1.0, b2 = 21.0, b3 = 10.0, b4 = 4.0, b5 = 7.0, b6 = 40.0.
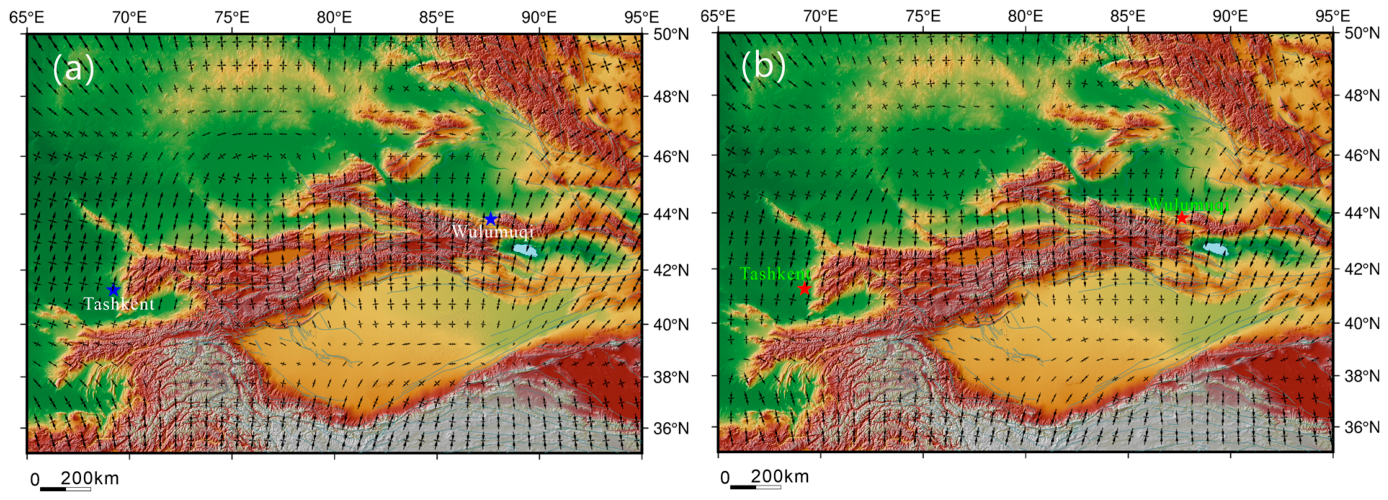
The strain rate field was subsequently estimated from the same synthetic velocity dataset (CSV) using the approach of Zhu et al. [34,35], producing a computed strain rate solution (CSR). Since both the analytical strain rates (ASR) and the computed results (CSR) originate from the same velocity field, differences between the two solutions can be attributed solely to the calculation procedure rather than to the input data.
A comparison of ASR and CSR is illustrated in Figure 7. The analytically derived principal strain rates based on the prescribed function are presented in panel (a), whereas panel (b) depicts the principal strain rates recovered from the synthetic velocities through the interpolation–derivative scheme.
Figure 7.
Comparison between the analytical strain rate solution (ASR) and the numerically recovered solution (CSR) derived from the identical surface velocity dataset. (a) Principal strain rates obtained analytically from the prescribed elastic formulation; (b) Principal strain rates reconstructed from the synthetic velocity field (Equation (6)) using the strain rate estimation scheme of Zhu et al. [34,35].
A detailed comparison of Figure 7a,b indicates that CSR closely reproduces ASR across both principal strain orientations and magnitudes. No artificial strain concentrations or systematic distortions are observed. The consistency between the two fields demonstrates that the computational procedure preserves the deformation characteristics encoded in the velocity data. As long as the GNSS stations are sufficiently dense, the ASR is generally consistent with the CSR. However, in areas where GNSS stations are sparse, inconsistencies appear in the calculated results.
Extensive additional tests with alternative parameter combinations yield similarly consistent results, further confirming the method’s robustness under the GNSS station distribution pattern in the Pamir–Tian Shan region.
However, it should be noted that this method is still qualitative, providing only a rough estimate and, mathematically, lacking completeness.
4. Discussion
4.1. Comparison with Previously Published Strain Rate Fields
A number of earlier studies, including Mansurov [27], Pan et al. [28,29], and Qiu et al. [30], have derived strain rate fields for the Pamir–Tian Shan region using distinct analytical or numerical strategies. Although these works consistently discuss ongoing crustal shortening associated with India–Eurasia convergence, their resulting strain rate patterns exhibit non-negligible differences. Such inconsistencies suggest that strain rate computation is highly sensitive to methodological design, interpolation schemes, and the spatial distribution of GNSS stations.
In the model proposed by Mansurov [27], relatively large compressive principal strain magnitudes are observed near 74.5°E, 43.2°N, along the northern margin of the central Tian Shan, as well as within the longitude range of 82°E–83.5°E. At the same time, Mansurov’s model [27] showed an anomalous case in which the principal compressive strain rate in the northeastern region of Urumqi (~88°E, 44°N) was significantly higher than that in the central Tian Shan region. This finding is clearly inconsistent with the basic geological survey results. In contrast, the results presented in this paper do not exhibit this abnormal phenomenon.
In the model of Pan et al. [28], the Pamir–Tian Shan region is characterized predominantly by north–south-oriented compressive principal strain rates with relatively uniform orientations. Regions exhibiting extensional deformation are limited. Although this pattern captures the first-order north–south shortening associated with India–Eurasia convergence, it may underestimate the localized extensional components suggested by geological observations in parts of the Pamir Plateau.
The solution of Qiu et al. [30] exhibits a spatial configuration that differs from the patterns reported by Mansurov [27] and Pan et al. [28]. In particular, north–south-oriented extensional principal strains are inferred within parts of the Pamir region, and extension is also indicated north of 44°N latitude. These features suggest a deformation regime distinct from that inferred in other models. Such differences may arise from variations in smoothing scales, interpolation schemes, or data selection criteria.
The overall spatial pattern of the strain rates from Pan et al. [29] is generally more consistent with the strain distribution obtained in this study. However, localized orientation differences are observed within the Pamir Plateau, where one compressive principal strain axis trends nearly north–south relative to surrounding deformation patterns. In addition, portions of the study area are masked, limiting direct spatial comparison in some regions.
Zhou et al. [12] Based on GNSS data observed from 2011 to 2015, the strain rate field of the Pamir and adjacent areas was calculated. The Pamir region was found to be in near-NS compression. Although there was a certain degree of tension component in the EW direction of the southern Pamir region, it was claimed that the magnitude of the strain rate was still smaller than that of the principal compressive strain rate, indicating that it was still in a compressive strain environment. This is inconsistent with the geological results, especially as it does not reflect the tensile deformation in the Kongur Mountain extension system [11,12]. In addition, the strain rate field in Chinese Mainland calculated by Wang and Shen [22] is NNE in the direction of the principal compressive strain rate in the Tianshan area, which is also inconsistent with NNW [65], the dominant direction of the principal compressive stress in the Tianshan area based on seismic data.
Overall, the diversity of published strain rate models underscores the methodological dependence of geodetic strain estimation. Differences in interpolation strategy, regularization parameters, and treatment of uneven station distribution can significantly influence local strain magnitudes and orientations. The strain rate field derived in this study exhibits spatial patterns that are broadly consistent with regional geological structures and independent geophysical observations, including focal mechanism solutions and borehole measurements [66]. This agreement supports the reliability of the present results in resolving the first-order crustal deformation characteristics of the Pamir–Tian Shan region.
4.2. Geodynamic Implications of the Strain Rates
The high-resolution strain rate field derived from GNSS observations quantitatively characterizes present deformation linked to the Indo–Eurasian collision, which represents the primary driver of Central Asian orogenic evolution.
Marked spatial heterogeneity characterizes the strain distribution, broadly aligning with major tectonic domains. In the western Pamir and the adjoining South Tian Shan, elevated north–south compressional strain (up to ~8 × 10⁻⁸/yr) coincides with the Pamir Thrust System and the Trans-Alai Range, indicating pronounced crustal shortening driven by northward indentation of the Pamir salient. As part of the northwestern Himalayan syntaxis, the Pamir effectively transfers convergence-related stresses into the continental interior, contributing to Cenozoic rejuvenation of the Tian Shan orogen [3,11,12,67,68].
NS shortening decreases systematically eastward, from ~8.0 × 10⁻⁸/yr in the western Tian Shan (70°E–77°E) to ~1.3 × 10⁻⁸/yr in the eastern sector (85°E–87°E). This gradient implies progressive attenuation of transmitted compressional stresses away from the indentation front. The pattern may further reflect clockwise rotation of the Tarim Basin (~0.6°/Myr) and along-strike variations in lithospheric strength. Such partitioning suggests that deformation within the Tian Shan is spatially segmented, governed by both far-field collision forces and inherited structural heterogeneity [69,70,71].
In contrast, the interior of the Pamir Plateau exhibits appreciable EW extension (up to ~7.0 × 10⁻⁸/yr), coexisting with marginal compression. This combination indicates a mechanically complex response to continental convergence.
Clear evidence for active extension is observed in the Lake Karakul region of the Northern Pamirs. The basin forms an asymmetric graben bounded by active normal faults, with major displacement concentrated along its western margin. Structural observations and bathymetric data indicate substantial tectonic subsidence, with vertical offsets exceeding ~1200 m along the principal border fault. Fault-slip indicators consistently define an east–west-oriented tension axis, supporting a regional extensional regime [11]. Additionally, an NS seismic belt within the orogen interior includes earthquakes exhibiting near-pure normal faulting mechanisms with EW directions of T-axes. This seismotectonic configuration resembles the extension documented in southern Tibet, suggesting comparable geodynamic controls on plateau uplift and crustal thickening.
The high elevation (~4000 m) and thickened crust of the Pamir Plateau generate substantial gravitational potential energy, which may promote lateral spreading and crustal thinning through normal faulting, particularly where steep topographic gradients exist adjacent to the Tadjik Basin and Tarim Basin. Therefore, internal extension within the Pamir should be interpreted as an intrinsic component of its present-day deformation rather than an anomalous feature.
Collectively, the extensional strain likely reflects the combined effects of gravitational collapse of an overthickened crust, strain partitioning around the arcuate orogenic geometry, and kinematic interactions along major strike–slip systems [11,12]. These processes underscore the mechanical complexity typical of active intracontinental collision zones.
The region’s intense tectonic deformation is accompanied by frequent large earthquakes, making it one of the most seismically active areas in Central Asia. For example, the region has experienced several major earthquakes, such as the 1812 M 8.0 Nilke great earthquake and the Chilik M 8.3 earthquake in 1889 [15,16,17,18,19]. Seismicity clusters preferentially near high-velocity blocks in the western Tarim Basin, suggesting that block interaction and stress transfer contribute significantly to earthquake occurrence.
In addition, a series of strong earthquake clusters with M ≥ 6.0 occurred in Jiashi County, southwestern Tianshan Mountains from 1996 to 1998. In recent years, strong earthquake activity in the region has continued to be active, with Jinghe County and Jiashi County experiencing M ≥ 6.0 strong earthquakes in 2017 and 2020, respectively. Furthermore, these events occurred within the interior of the Tarim basin rather than strictly along basin–mountain boundary faults and have been attributed to deep concealed structures and inward transmission of Tian Shan deformation. The spatial correspondence between high-strain zones and seismic activity emphasizes the importance of accurately resolving present-day strain rates and rotation fields for seismic hazard assessment.
From a broader geodynamic perspective, the strain rate distribution reflects the coupling between deep-lithospheric processes and shallow-crustal deformation. Northward underthrusting and indentation of the Indian lithosphere—evidenced by the C-shaped intermediate-depth seismic zone—modulates the spatial organization of surface strain. Orthogonal collision in the eastern Pamir and Tian Shan promotes dominant compressional shortening, whereas oblique convergence in the western Pamir facilitates strain partitioning and localized crustal extension.
The compressional domains resolved in this study are further supported by independent seismic imaging, which reveals crustal velocity structures consistent with shortening and thickening beneath the Tian Shan and western Kunlun, as well as possible thermal anomalies close to the Moho discontinuity [72,73]. Taken together, these geodetic and geophysical observations indicate that the Pamir–Tian Shan region represents an active intracontinental deformation system in which far-field Indo–Eurasian convergence is accommodated by interacting processes of crustal shortening, block rotation, and gravitational collapse.
In addition, the discrepancies—especially between seismological and geodetic data—may reflect either a specific rheological behavior of the crust [74] or the coexistence of multiple seismotectonic domains at depth [75]. These discrepancies warrant closer attention in future investigations.
5. Conclusions
This study presents a high-resolution estimate of present-day crustal strain and rotation rates in the Pamir–Tian Shan region based on the most updated GNSS velocity field and a computational framework that reduces bias from uneven station distribution. The principal findings are summarized as follows:
- (1)
- Spatial Pattern of Deformation:
The derived strain rate field reveals a heterogeneous yet systematically organized deformation pattern across the orogenic system. The region is dominated by NNW–SSE compression, with the largest strain magnitudes concentrated along major tectonic boundaries, particularly the Pamir Frontal Thrust (PFT). In contrast, relatively stable domains—including the interior of the Tarim Basin and the Kazakh Platform—exhibit comparatively low strain accumulation. Furthermore, the compressive principal strain rate in the Tian Shan decreases from approximately 6.5 × 10⁻⁸/yr in the west to about 1.0 × 10⁻⁸/yr in the east, while significant tensile deformation develops in the central Pamir.
- (2)
- Consistency with Independent Observations:
The mapped strain rate pattern shows overall agreement with independent geological and geophysical evidence. Extensional strain identified within the Pamir Plateau coincides with regions characterized by normal-faulting earthquakes, while compressional strain in the Tian Shan corresponds to thrust-related seismicity. Along the Altyn Tagh fault, the strain pattern suggests combined strike–slip and compressional components. These correlations support the internal consistency of the strain rate model.
- (3)
- Geodynamic Implications:
The regional strain distribution indicates that crustal deformation is largely governed by the northward indentation of the Pamir block within the broader Indo–Eurasian collision system. The systematic eastward reduction in compressional strain suggests attenuation of transmitted collisional stresses away from the indentation front. The coexistence of internal extension within the elevated Pamir Plateau and marginal compression is consistent with gravitational spreading of an overthickened crustal layer interacting with forces at a convergent boundary.
- (4)
- Methodological Robustness:
Numerical verification shows that the adopted computational process can reliably reproduce analytically prescribed strain fields based on the actual GNSS station distribution in the study area. Comparing the present model with previously published strain models emphasizes how sensitive strain rate estimation is to methodological choices and data treatment strategies. The approach used in this study offers a spatially consistent representation of crustal deformation that aligns with regional structural and seismic observations.
- (5)
- Implications for Seismic Hazard Assessment:
The geodetically derived strain rate field, calculated from GNSS observations, reveals zones of elevated strain accumulation that are spatially correlated with major active fault systems in the study area. Specifically, prominent strain rate anomalies are resolved along the Pamir Frontal Thrust (PFT) and the Keping Tagh fault system—regions that have historically generated significant seismic events.
This spatial correspondence between modeled strain concentrations and the distribution of documented earthquakes supports the use of geodetic strain analysis as a complementary tool to traditional seismotectonic assessments. In regions where seismic records are temporally incomplete or historically short, GNSS-derived strain rates can help identify fault segments that are currently accumulating elastic strain but have not yet ruptured in recent catalogs, i.e., potential seismic gaps.
Consequently, integrating geodetic strain information into probabilistic seismic hazard assessment frameworks can improve the characterization of seismic sources, particularly for slow-slipping faults or areas with low to moderate historical seismicity. Overall, this study highlights that GNSS-based strain rate mapping provides an additional, physically independent constraint on the long-term seismic potential of active structures, thereby contributing to more robust regional seismic hazard evaluations.
In summary, this work establishes a quantitatively consistent strain rate framework for the Pamir–Tian Shan region. The results provide improved insight into intracontinental deformation mechanisms and provide a geodetically constrained basis for future tectonic and seismic hazard studies in Central Asia.
Author Contributions
R.Y.: Investigation, Validation, Visualization, Writing—Original draft. S.Z.: Conceptualization, Investigation, Visualization, Writing—Original draft, Supervision, Writing—Review and editing. All authors have read and agreed to the published version of the manuscript.
Funding
This research was funded by the Deep Earth Probe and Mineral Resources Exploration-National Science and Technology Major Project (2024ZD1000703), National Natural Science Foundation of China (42374074, 41874060).
Data Availability Statement
All the GNSS data used in the current study are available from Wang and Shen [22], and all earthquake data are from Harvard CMT and from USGS (downloaded from: https://www.globalcmt.org/CMTsearch.html; https://earthquake.usgs.gov/earthquakes/search/). All websites were last accessed on 31 December 2025.
Acknowledgments
We thank the Editor and four reviewers for their valuable comments and suggestions, which substantially improved the paper.
Conflicts of Interest
The authors declare no conflicts of interest relevant to this study.
References
- Avouac, J.P.; Tapponnier, P.; Bai, M.; You, H.; Wang, G. Active thrusting and folding along the northern Tien Shan and late Cenozoic rotation of the Tarim relative to Dzungaria and Kazakhstan. J. Geophys. Res. Solid Earth 1993, 98, 6755–6804. [Google Scholar] [CrossRef] [Scilit]
- Jolivet, M.; Dominguez, S.; Charreau, J.; Chen, Y.; Li, Y.; Wang, Q. Mesozoic and Cenozoic tectonic history of the central Chinese Tian Shan: Reactivated tectonic structures and active deformation. Tectonics 2010, 29, TC6019. [Google Scholar] [CrossRef] [Scilit]
- Molnar, P.; Tapponnier, P. Cenozoic tectonics of Asia: Effects of a continental collision: Features of recent continental tectonics in Asia can be interpreted as results of the India-Eurasia collision. Science 1975, 189, 419–426. [Google Scholar] [CrossRef] [Scilit] [PubMed]
- Ni, J.F. Contemporary tectonics in the Tien Shan region. Earth Planet. Sci. Lett. 1978, 41, 347–354. [Google Scholar] [CrossRef] [Scilit]
- Tapponnier, P.; Molnar, P. Active faulting and tectonics in China. J. Geophys. Res. 1977, 82, 2905–2930. [Google Scholar] [CrossRef] [Scilit]
- Tapponnier, P.; Molnar, P. Active faulting and Cenozoic tectonics of the Tien Shan, Mongolia, and Baykal regions. J. Geophys. Res. Solid Earth 1979, 84, 3425–3459. [Google Scholar] [CrossRef] [Scilit]
- Yin, A. Cenozoic tectonic evolution of Asia: A preliminary synthesis. Tectonophysics 2010, 488, 293–325. [Google Scholar] [CrossRef] [Scilit]
- Yin, A.; Nie, S.; Craig, P.; Harrison, T.M.; Ryerson, F.J.; Qian, X.; Geng, Y. Late Cenozoic tectonic evolution of the southern Chinese Tian Shan. Tectonics 1998, 17, 1–27. [Google Scholar] [CrossRef] [Scilit]
- Zhang, P.; Burchfiel, B.C.; Molnar, P.; Zhang, W.; Jiao, D.; Deng, Q.; Wang, Y.; Royden, L.; Song, F. Late Cenozoic tectonic deformation and mechanism along the Tianshan Mountain, North Western China. Earthq. Res. China 1996, 12, 127–140. [Google Scholar]
- Rizza, M.; Abdrakhmatov, K.; Walker, R.; Braucher, R.; Guillou, V.; Carr, A.S.; Campbell, G.; McKenzie, D.; Jackson, J.; Aumaître, G.; et al. Rate of slip from multiple Quaternary dating methods and paleoseismic investigations along the Talas-Fergana Fault: Tectonic implications for the Tien Shan Range. Tectonics 2019, 38, 2477–2505. [Google Scholar] [CrossRef] [Scilit]
- Strecker, M.R.; Frisch, W.; Hamburger, M.W.; Ratschbacher, L.; Semiletkin, S.; Zamoruyev, A.; Sturchio, N. Quaternary deformation in the eastern Pamirs, Tadzhikistan and Kyrgyzstan. Tectonics 1995, 14, 1061–1079. [Google Scholar] [CrossRef] [Scilit]
- Zhou, Y.; He, J.; Oimahmadov, I.; Gadoev, M.; Pan, Z.; Wang, W.; Abdulov, S.; Rajabov, N. Present-day crustal motion around the Pamir Plateau from GPS measurements. Gondwana Res. 2016, 35, 144–154. [Google Scholar] [CrossRef] [Scilit]
- Zubovich, A.V.; Wang, X.Q.; Scherba, Y.G.; Schelochkov, G.G.; Reilinger, R.; Reigber, C.; Mosienko, O.I.; Molnar, P.; Michajljow, W.; Makarov, V.I.; et al. GPS Velocity Field for the Tien Shan and Surrounding Regions. Tectonics 2010, 29, TC6014. [Google Scholar] [CrossRef] [Scilit]
- Abdrakhmatov, K.Y.; Aldazhanov, S.A.; Hager, B.H.; Hamburger, M.W.; Herring, T.A.; Kalabaev, K.B.; Makarov, V.I.; Molnar, P.; Panasyuk, S.V.; Prilepin, M.T.; et al. Relatively recent construction of the Tien Shan inferred from GPS measurements of present-day crustal deformation rates. Nature 1996, 384, 450–453. [Google Scholar] [CrossRef] [Scilit]
- He, X.; Zhao, L.; Xie, X.; Tian, X.; Yao, Z. Weak crust in southeast Tibetan Plateau revealed by Lg-wave attenuation tomography: Implications for crustal material escape. J. Geophys. Res. Solid Earth 2021, 126, e2020JB020756. [Google Scholar] [CrossRef] [Scilit]
- Lü, L.; Li, T.; Chen, Z.; Chen, J.; Jobe, J.; Fang, L. Active structural geometries and their correlation with moderate (M 5.5-7.0) earthquakes in the Jiashi-Keping region, Tian Shan southwestern front. Tectonics 2021, 40, e2021TC006760. [Google Scholar] [CrossRef] [Scilit]
- Wang, S.; Nissen, E.; Pousse-Beltran, L.; Craig, T.J.; Jiao, R.; Bergman, E.A. Structural controls on coseismic rupture revealed by the 2020 Mw 6.0 Jiashi earthquake (Kepingtag belt, SW Tian Shan, China). Geophys. J. Int. 2022, 230, 1895–1910. [Google Scholar] [CrossRef] [Scilit]
- Wu, D.; Chen, Z.; Zimin, M. InSAR coseismic deformation field and seismogenic structure of the 2020 Mw6. 0 Jiashi earthquake and the implication for the moderate-magnitude seismicity in the southwestern Tian Shan, western China. Front. Earth Sci. 2024, 11, 1305519. [Google Scholar] [CrossRef] [Scilit]
- Yao, Q.; Yang, W.; Jiang, X.; Guo, Y.; Liu, J.; Zhang, Y.; Wang, H.; Ren, J.; Yu, C.; Yue, C.; et al. The 2020 M6. 4 Jiashi earthquake: An event that occurred under the décollement on the Kaping Fold-and-Thrust Belt in the Southwestern Tien Shan Mountains, China. Front. Earth Sci. 2021, 9, 647577. [Google Scholar] [CrossRef] [Scilit]
- Cui, J.W.; Tang, Z.M. Tectonic framework of the Tarim Basin and its evolution. Acta Petrol. Sin. 2011, 27, 231–242. [Google Scholar]
- Xu, Y.; Liu, J.H.; Liu, F.T.; Zhu, L.R.; Long, H.Y.; Wei, B. Crustal velocity structure and seismic activity in the Tianshan-Pamir conjunctive zone. Chin. J. Geophys. 2006, 49, 417–425. [Google Scholar] [CrossRef] [Scilit]
- Wang, M.; Shen, Z.K. Present-day crustal deformation of continental China derived from GPS and its tectonic implications. J. Geophys. Res. Solid Earth 2020, 125, e2019JB018774. [Google Scholar] [CrossRef] [Scilit]
- Zheng, G.; Wang, H.; Wright, T.J.; Lou, Y.; Zhang, R.; Zhang, W.; Shi, C.; Huang, J.; Wei, N. Crustal deformation in the India-Eurasia collision zone from 25 years of GPS measurements. J. Geophys. Res. Solid Earth 2017, 122, 9290–9312. [Google Scholar] [CrossRef] [Scilit]
- Molnar, P.; Ghose, S. Seismic moments of major earthquakes and the rate of shortening across the Tien Shan. Geophys. Res. Lett. 2000, 27, 2377–2380. [Google Scholar] [CrossRef] [Scilit]
- Zhang, P.; Deng, Q.; Zhang, G.; Ma, J.; Gan, W.; Min, W.; Mao, F.; Wang, Q. Active tectonic blocks and strong earthquakes in the continent of China. Sci. China Ser. D Earth Sci. 2003, 46, 13–24. [Google Scholar] [CrossRef] [Scilit]
- Wu, C.; Zhang, P.; Zhang, Z.; Zheng, W.; Xu, B.; Wang, W.; Yu, Z.; Dai, X.; Zhang, B.; Zang, K. Slip partitioning and crustal deformation patterns in the Tianshan orogenic belt derived from GPS measurements and their tectonic implications. Earth-Sci. Rev. 2023, 238, 104362. [Google Scholar] [CrossRef] [Scilit]
- Mansurov, M.N. A continuum model of present-day crustal deformation in the Pamir–Tien Shan region constrained by GPS data. Russ. Geol. Geophys. 2017, 58, 787–802. [Google Scholar] [CrossRef] [Scilit]
- Pan, Y.; Chen, R.; Yi, S.; Wang, W.; Ding, H.; Shen, W.; Chen, L. Contemporary Mountain-Building of the Tianshan and its Relevance to Geodynamics Constrained by Integrating GPS and GRACE Measurements. J. Geophys. Res. Solid Earth 2019, 124, 12171–12188. [Google Scholar] [CrossRef] [Scilit]
- Pan, Y.; Jiang, W.; Ding, H.; Shum, C.K.; Jiao, J.; Li, J. Intradecadal Fluctuations and Three-dimensional Crustal Kinematic Deformation of the Tianshan and Pamir derived from Multi-Geodetic Imaging. J. Geophys. Res. Solid Earth 2023, 128, e2022JB025325. [Google Scholar] [CrossRef] [Scilit]
- Qiu, J.; Ji, L.; Zhu, L.; Wang, Q. Present-Day Tectonic Deformation Partitioning Across South Tianshan from Satellite Geodetic Imaging. Front. Earth Sci. 2022, 9, 793890. [Google Scholar] [CrossRef] [Scilit]
- Calais, E.; Dong, L.; Wang, M.; Shen, Z.K.; Vergnolle, M. Continental deformation in Asia from a combined GPS solution. Geophys. Res. Lett. 2006, 33, L24319. [Google Scholar] [CrossRef] [Scilit]
- Wang, L.; Barbot, S. Three-dimensional kinematics of the India–Eurasia collision. Commun. Earth Environ. 2023, 4, 164. [Google Scholar] [CrossRef] [Scilit]
- Xiang, Y.; Wang, H.; Chen, Y.; Xing, Y. GNSS imaging of strain rate changes and vertical crustal motions over the Tibetan Plateau. Remote Sens. 2021, 13, 4937. [Google Scholar] [CrossRef] [Scilit]
- Zhu, S.B.; Cai, Y.E.; Shi, Y.L. Computation of the present-day strain rate field of the Qinghai-Tibetan plateau and its geodynamic implications. Chin. J. Geophys. 2005, 48, 1053–1061. [Google Scholar]
- Zhu, S.B.; Cai, Y.E.; Shi, Y.L. The contemporary tectonic strain rate field of continental China predicted from GPS measurements and its geodynamic implications. Pure Appl. Geophys. 2006, 163, 1477–1493. [Google Scholar] [CrossRef] [Scilit]
- Kreemer, C.; Blewitt, G.; Klein, E.C. A geodetic plate motion and Global Strain Rate Mode. Geochem. Geophys. Geosyst. 2014, 15, 3849–3889. [Google Scholar] [CrossRef] [Scilit]
- Marechal, A.; Mazzotti, S.; Cattin, R.; Cazes, G.; Vernant, P.; Drukpa, D. Evidence of interseismic coupling variations along the Bhutan Himalayan arc from new GPS data. Geophys. Res. Lett. 2016, 43, 12399–12406. [Google Scholar] [CrossRef] [Scilit]
- Vernant, P.; Bilham, R.; Szeliga, W.; Drukpa, D.; Kalita, S.; Bhattacharyya, A.K.; Gaur, V.K.; Pelgay, P.; Cattin, R.; Berthet, T. Clockwise rotation of the Brahmaputra Valley relative to India: Tectonic convergence in the eastern Himalaya, Naga Hills, and Shillong Plateau. J. Geophys. Res. Solid Earth 2014, 119, 6558–6571. [Google Scholar] [CrossRef] [Scilit]
- Allmendinger, R.W.; Reilinger, R.; Loveless, J.P. Strain and rotation rate from GPS in Tibet, Anatolia, and the Altiplano. Tectonics 2007, 26, TC3013. [Google Scholar] [CrossRef] [Scilit]
- Gan, W.; Zhang, P.; Shen, Z.K.; Niu, Z.; Wang, M.; Wan, Y.; Zhou, D.; Cheng, J. Present-day crustal motion within the Tibetan Plateau inferred from GPS measurements. J. Geophys. Res. Solid Earth 2007, 112, B08416. [Google Scholar] [CrossRef] [Scilit]
- Ge, W.P.; Molnar, P.; Shen, Z.K.; Li, Q. Present-day crustal thinning in the southern and northern Tibetan Plateau revealed by GPS measurements. Geophys. Res. Lett. 2015, 42, 5227–5235. [Google Scholar] [CrossRef] [Scilit]
- Zhu, S.; Wu, K.; Cui, Z.; Shi, Y. Mechanical mechanism on the 2025 MS7.9 Mandalay, Myanmar Earthquake. Chin. J. Geophys. 2026, 69, 702–716, (In Chinese with English Abstract). [Google Scholar] [CrossRef]
- Zhu, S. Contemporary crustal strain rates derived from GPS measurements in southwestern China. J. Asian Earth Sci. 2025, 277, 106378. [Google Scholar] [CrossRef] [Scilit]
- Reigber, C.; Michel, G.W.; Galas, R.; Angermann, D.; Klotz, J.; Chen, J.Y.; Papschev, A.; Arslanov, R.; Tzurkov, V.E.; Ishanov, M.C. New space geodetic constraints on the distribution of deformation in Central Asia. Earth Planet. Earth Planet. Sci. Lett. 2001, 191, 157–165. [Google Scholar] [CrossRef] [Scilit]
- Zhao, J.; Zhang, P.; Yuan, X.; Gan, W.; Sun, J.; Deng, T.; van der Hilst, R.; Zhang, X.; Liu, H.; Yang, X.; et al. Clockwise rotation of the Tarim basin driven by Indian plate impact. Earth Sci. Subsoil Use 2019, 42, 425–436. [Google Scholar] [CrossRef] [Scilit]
- Rui, X.; Stamps, D.S. A geodetic strain rate and tectonic velocity model for China. Geochem. Geophys. Geosyst. 2019, 20, 1280–1297. [Google Scholar] [CrossRef] [Scilit]
- Pietrolungo, F.; Lavecchia, G.; Madarieta-Txurruka, A.; Cirillo, D.; De Nardis, R.; Brozzetti, F. Comparison of crustal stress and strain fields in the Himalaya–Tibet region: Geodynamic implications. Remote Sens. 2024, 16, 4765. [Google Scholar] [CrossRef] [Scilit]
- Stevens, V.L.; Avouac, J.P. On the relationship between strain rate and seismicity in the India–Asia collision zone: Implications for probabilistic seismic hazard. Geophys. J. Int. 2021, 226, 220–245. [Google Scholar] [CrossRef] [Scilit]
- Hao, M.; Wang, Q.; Zhang, P.; Shen, Z.K.; Cui, D.; Ji, L. “Frame wobbling” causing crustal deformation around the Ordos block. Geophys. Res. Lett. 2021, 48, e2020GL091008. [Google Scholar] [CrossRef] [Scilit]
- Li, S.; Li, C.; Zhou, Q. Kinematic analysis of the Ordos block and surrounding area based on GPS data: An initiative–passive vortex structure model. Arab. J. Geosci. 2018, 11, 627. [Google Scholar] [CrossRef] [Scilit]
- Middleton, T.A.; Parsons, B.; Walker, R.T. Comparison of seismic and geodetic strain rates at the margins of the Ordos Plateau, northern China. Geophys. J. Int. 2018, 212, 988–1009. [Google Scholar] [CrossRef] [Scilit]
- Qu, W.; Lu, Z.; Zhang, M.; Zhang, Q.; Wang, Q.; Zhu, W.; Qu, F. Crustal strain fields in the surrounding areas of the Ordos Block, central China, estimated by the least-squares collocation technique. J. Geodyn. 2017, 106, 1–11. [Google Scholar] [CrossRef] [Scilit]
- Zhu, S. Strain rates from GPS measurements in the Ordos Block, China: Implications for geodynamics and seismic hazards. Remote Sens. 2022, 14, 779. [Google Scholar] [CrossRef] [Scilit]
- Zhu, S.; Chen, J.; Shi, Y. Earthquake potential in the peripheral zones of the Ordos Block based on contemporary GPS strain rates and seismicity. Tectonophysics 2022, 824, 229224. [Google Scholar] [CrossRef] [Scilit]
- Copley, A. Kinematics and dynamics of the southeastern margin of the Tibetan Plateau. Geophys. J. Int. 2008, 174, 1081–1100. [Google Scholar] [CrossRef] [Scilit]
- Jin, H.; Gao, Y.; Su, X.; Fu, G. Contemporary crustal tectonic movement in the southern Sichuan-Yunnan block based on dense GPS observation data. Earth Planet. Phys. 2019, 3, 53–61. [Google Scholar] [CrossRef] [Scilit]
- Li, Z.; Wang, Y.; Gan, W.; Fang, L.; Zhou, R.; Seagren, E.; Yang, F. Diffuse deformation in the SE Tibetan Plateau: New insights from geodetic observations. J. Geophys. Res. Solid Earth 2020, 125, e2020JB019383. [Google Scholar] [CrossRef] [Scilit]
- Pan, Y.; Shen, W.B. Contemporary crustal movement of southeastern Tibet: Constraints from dense GPS measurements. Sci. Rep. 2017, 7, 45348. [Google Scholar] [CrossRef] [Scilit]
- Shen, Z.K.; Lü, J.; Wang, M.; Bürgmann, R. Contemporary crustal deformation around the southeast borderland of the Tibetan Plateau. J. Geophys. Res. Solid Earth 2005, 110, B11409. [Google Scholar] [CrossRef] [Scilit]
- Wang, W.; Qiao, X.; Ding, K. Present-day kinematics in southeastern Tibet inferred from GPS measurements. J. Geophys. Res. Solid Earth 2021, 126, e2020JB021305. [Google Scholar] [CrossRef] [Scilit]
- Zhang, K.L.; Liang, S.M.; Gan, W.J. Crustal strain rates of southeastern Tibetan Plateau derived from GPS measurements and implications to lithospheric deformation of the Shan-Thai terrane. Earth Planet. Phys. 2019, 3, 45–52. [Google Scholar] [CrossRef] [Scilit]
- Zhao, G.; Meng, G.; Wu, W.; Su, X.; Pan, Z. Earthquake potential assessment around the southeastern Tibetan plateau based on seismic and geodetic data. Pure Appl. Geophys. 2022, 179, 11–44. [Google Scholar] [CrossRef] [Scilit]
- Zhu, S. Present-day crustal deformation based on GPS measurements in southeastern Tibetan Plateau: Implications for geodynamics and earthquake hazard. Geomat. Nat. Hazards Risk 2023, 14, 2286902. [Google Scholar] [CrossRef] [Scilit]
- Zhu, S.B.; Shi, Y.L. Estimation of GPS strain rate and its error analysis in the Chinese continent. J. Asian Earth Sci. 2011, 40, 351–362. [Google Scholar] [CrossRef] [Scilit]
- Sycheva, N.A.; Yunga, S.L.; Bogomolov, L.M.; Makarov, V.I. Seismotectonic deformations and recent tectonics of the Tien Shan. Izv. Phys. Solid Earth 2008, 44, 351–363. [Google Scholar] [CrossRef] [Scilit]
- Hu, X.P.; Wang, Y.; Li, S.Y.; Li, J.; Wang, R.; Wang, Q. Crustal stress pattern in China and its adjacent areas. J. Asian Earth Sci. 2017, 149, 20–28. [Google Scholar] [CrossRef] [Scilit]
- Arrowsmith, J.R.; Strecker, M.R. Seismotectonic range-front segmentation and mountain-belt growth in the Pamir-Alai region, Kyrgyzstan (India-Eurasia collision zone). Geol. Soc. Am. Bull. 1999, 111, 1665–1683. [Google Scholar] [CrossRef] [Scilit]
- Rowley, D.B. Age of initiation of collision between India and Asia: A review of stratigraphic data. Earth Planet. Sci. Lett. 1996, 145, 1–13. [Google Scholar] [CrossRef] [Scilit]
- Kufner, S.K.; Eken, T.; Tilmann, F.; Schurr, B.; Yuan, X.; Mechie, J.; Ratschbacher, L.; Ischuk, A.; Murodkulov, S. Seismic anisotropy beneath the Pamir and the Hindu Kush: Evidence for contributions from crust, mantle lithosphere, and asthenosphere. J. Geophys. Res. Solid Earth 2018, 123, 10727–10748. [Google Scholar] [CrossRef] [Scilit]
- Sabitova, T.M.; Lesik, O.M.; Adamova, A.A. Velocity and density heterogeneities of the Tien-Shan lithosphere. Pure Appl. Geophys. 1998, 151, 539–548. [Google Scholar] [CrossRef] [Scilit]
- Wüstefeld, A.; Bokelmann, G.; Barruol, G.; Montagner, J.P. Identifying global seismic anisotropy patterns by correlating shear-wave splitting and surface-wave data. Phys. Earth Planet. Inter. 2009, 176, 198–212. [Google Scholar] [CrossRef] [Scilit]
- Li, W.; Yuan, X.; Chen, Y.; Wei, Y.; Xiong, X. Crustal deformation modes in the Pamir-Tianshan inferred from crustal anisotropy: Compressional shortening versus gravitational collapse. Geophys. Res. Lett. 2025, 52, e2025GL116917. [Google Scholar] [CrossRef] [Scilit]
- Mechie, J.; Yuan, X.; Schurr, B.; Schneider, F.; Sippl, C.; Ratschbacher, L.; Minaev, V.; Gadoev, M.; Oimahmadov, I.; Abdybachaev, U. Crustal and uppermost mantle velocity structure along a profile across the Pamir and southern Tien Shan as derived from project TIPAGE wide-angle seismic data. Geophys. J. Int. 2012, 188, 385–407. [Google Scholar] [CrossRef] [Scilit]
- Porkoláb, K.; Békési, E.; Győri, E.; Broerse, T.; Czecze, B.; Kenyeres, A.; Tari, G.; Wéber, Z. Present-day stress field, strain rate field and seismicity of the Pannonian region: Overview and integrated analysis. Geol. Soc. Lond. Spec. Publ. 2026, 554, SP554-SP2023-219. [Google Scholar] [CrossRef] [Scilit]
- de Nardis, R.; Pandolfi, C.; Cattaneo, M.; Monachesi, G.; Cirillo, D.; Ferrarini, F.; Bello, S.; Brozzetti, F.; Lavecchia, G. Lithospheric double shear zone unveiled by microseismicity in a region of slow deformation. Sci. Rep. 2022, 12, 21066. [Google Scholar] [CrossRef] [Scilit] [PubMed]
Disclaimer/Publisher’s Note: The statements, opinions and data contained in all publications are solely those of the individual author(s) and contributor(s) and not of MDPI and/or the editor(s). MDPI and/or the editor(s) disclaim responsibility for any injury to people or property resulting from any ideas, methods, instructions or products referred to in the content. |
© 2026 by the authors. Licensee MDPI, Basel, Switzerland. This article is an open access article distributed under the terms and conditions of the Creative Commons Attribution (CC BY) license.