


Highlights
What are the main findings?
- The proposed Spatially Adaptive Ensemble Learning model (SA-GSE) effectively captures the spatial heterogeneity of land subsidence in the Yellow River Delta, achieving superior predictive performance (R2 = 0.7810, RMSE = 40.55 mm/yr) and eliminating spatial autocorrelation in residuals (Moran’s I = 0.0334, p = 0.206).
- Distance to salt pans is the dominant driver of subsidence (importance 0.4456), and a nonlinear “precipitation decoupling” mechanism is revealed in salt pan areas, where high precipitation paradoxically exacerbates subsidence due to anti-seepage treatments and brine density stratification.
What are the implications of the main findings?
- The SA-GSE framework provides a novel methodological pathway for deciphering subsidence mechanisms in heterogeneous regions, overcoming the limitations of traditional global models that assume uniform driving processes.
- The identification of brine extraction as the primary anthropogenic driver and the mapped high-rate zones offer a scientific basis for targeted land subsidence prevention, groundwater management, and sustainable coastal development.
Abstract
The Yellow River Delta, a young alluvial plain in China, is experiencing severe land subsidence that threatens its ecological security and sustainable development. However, the driving mechanisms of this subsidence exhibit strong spatial heterogeneity, which traditional global models fail to capture. This study integrates high-precision subsidence measurements from Sentinel-1A imagery and SBAS-InSAR technology (2017–2023) with multi-source environmental factors (topography, geology, land use, precipitation) to propose a Spatially Adaptive Ensemble Learning Model with feature selection (SA-GSE). The model concatenates predictions from base learners (CatBoost, XGBoost, Random Forest) with spatial features (e.g., distance to salt pans, local topographic variance) to form meta-features, which are then input into a multilayer perceptron meta-learner. Through 5-fold spatial cross-validation, SA-GSE learns spatially dynamic base-model weights, implicitly adapting to regional variations in subsidence drivers. The model achieves an R2 of 0.7810 and RMSE of 40.55 mm/yr on the test set, outperforming individual base models and ordinary stacking. Residual spatial autocorrelation is substantially reduced, with SA-GSE yielding the lowest Moran’s I (0.0334, p = 0.206) among all evaluated models, confirming effective capture of spatial heterogeneity. Driving force analysis reveals that distance to salt pans is the most important predictor (permutation importance: 0.4456), underscoring the dominant role of brine extraction-induced aquifer compaction. Lagged precipitation importance (0.3191) exceeds that of current precipitation (0.2453), indicating a recharge lag effect. SHAP interaction analysis uncovers a nonlinear “precipitation decoupling” mechanism in salt pan areas, where high precipitation paradoxically exacerbates subsidence. The resultant map of predicted subsidence rates highlights elevated rate zones in the northern salt pans and along the Guangli River. While the map does not represent a full risk assessment—as it does not include exposure or vulnerability—it provides a spatially explicit estimate of hazard likelihood. This ensemble framework yields novel perspectives on subsidence drivers in heterogeneous regions and can support land subsidence prevention and groundwater management planning.
1. Introduction
1.1. Global and Regional Challenges
Coastal deltas, shaped by the interplay between rivers and oceans, are typically characterized by low-lying topography, high population density, and advanced economic development. Globally, over 500 million people inhabit these regions [1]. However, these areas face severe challenges from relative sea-level rise, which results from a combination of absolute sea-level rise induced by global warming and regional land subsidence [2]. Relative sea-level rise exacerbates storm surge hazards, coastal erosion, saline water intrusion, and wetland loss, thereby posing significant threats to regional ecological environments and sustainable economic and social development [1,3,4].
The Yellow River Delta, one of the youngest deltas in China and the world, has rapidly formed over 5000 square kilometers of new land since the Yellow River shifted its course to flow into the Bohai Sea via the northern part of the Shandong Peninsula in 1855, driven by an extremely high sediment flux [5,6]. However, this region is simultaneously experiencing rapid land-subsidence. The co-existence of extremely rapid land creation and rapid subsidence constitutes a unique geological environment in the Yellow River Delta. Numerous studies have shown that the subsidence rates in the Yellow River Delta far exceed the global and regional average sea-level rise rates, with some areas experiencing rates as high as tens to hundreds of millimeters per year [7,8,9].
This phenomenon of “extremely rapid land formation coexisting with extremely rapid subsidence” constitutes the unique geological environmental characteristics of the Yellow River Delta. Such rapid land subsidence has caused various practical hazards to the region: subsidence has not only invalidated coastal ground benchmark points and introduced systematic errors in bathymetric data, further leading to inconsistencies between the designed elevations of jacket structures of multiple offshore platforms and actual water depths and resulting in huge economic losses, but also significantly increased the probability of storm surge disasters and accelerated coastal erosion and beach scouring [10,11]. Land subsidence has also exacerbated seawater intrusion and storm surge disasters, posing a serious threat to regional ecological security [12]. Over a longer time scale, subsidence will alter the ground slope, affecting river channel evolution and tail migration [11]. According to projections, without effective protective measures, the combined effects of sea level rise and land subsidence will submerge 6.20% to 17.42% of the Yellow River Delta by 2050, with a corresponding reduction in carbon sequestration of 3.57% to 11.67% [13]. These severe practical problems have made the Yellow River Delta a natural laboratory for studying human–land interactions and disaster risks in deltaic regions.
1.2. Limitations of Existing Studies
Over the past two decades, Interferometric Synthetic Aperture Radar (InSAR) technology has become an indispensable tool for investigating the spatiotemporal evolution of land subsidence in the Yellow River Delta owing to its high precision, extensive coverage, and all-weather monitoring capability. Evolving from early Differential Interferometric Synthetic Aperture Radar (D-InSAR) [7] to subsequent Persistent Scatterer Interferometric Synthetic Aperture Radar (PS-InSAR) [14], SBAS-InSAR [15,16,17], and methods integrating persistent and distributed scatterers [8], numerous studies have precisely characterized subsidence rates and their spatial distribution across different periods in the delta region. These studies have revealed that subsidence bowls are predominantly distributed in oilfield extraction areas [15,16], brine mining areas [9,18,19,20] aquaculture zones [7], and urban construction areas [21,22].
While InSAR technology has proven effective in characterizing the spatiotemporal distribution of surface deformation, its inherent nature dictates that this methodology primarily serves phenomenon monitoring rather than directly elucidating the underlying physical driving mechanisms of the phenomenon. Consequently, to investigate the causes of subsidence, a joint analysis incorporating multi-source auxiliary data is typically required. Researchers commonly integrate groundwater level data [15,17,23], geological structures and fault distributions [16,24], sediment lithology and consolidation characteristics [8,25,26,27], and land use types [18,28] in their analyses. Although such analyses can reveal correlations between subsidence and specific factors, traditional methods often struggle to precisely quantify the contributions of different drivers, such as natural compaction versus anthropogenic extraction, to the observed subsidence.
In recent years, some studies have introduced machine learning methods to establish nonlinear models between subsidence and its influencing factors [17]. However, a potential limitation lies in the implicit assumption of such models that subsidence across the entire study area is governed by a unified set of driving mechanisms (i.e., a global model). To address the spatial non-stationarity inherent in geographical phenomena, the Geographically Weighted Regression (GWR) model has been widely employed to explore the spatial heterogeneity in the relationships between various factors and subsidence [23]. Nevertheless, GWR is fundamentally grounded in a linear regression framework, with the core assumption that variable relationships are linear within local spatial contexts. Consequently, it struggles to effectively capture the prevalent and complex nonlinear interactions among the subsidence-driving factors in the Yellow River Delta.
The Yellow River Delta is characterized by highly pronounced spatial heterogeneity. For instance, subsidence in coastal areas may be primarily controlled by the seasonal extraction of shallow underground brine, exhibiting a complex nonlinear response relationship with seasonal precipitation recharge [19,20]. In contrast, subsidence in inland urban areas is associated with the long-term overexploitation of deep groundwater and the consequent residual deformation of the aquifer system, which often displays creep characteristics that are asynchronous with water level changes [29]. Meanwhile, subsidence in oilfield areas is closely linked to the complex pore pressure variations induced by oil and gas extraction and water injection activities [15,16]. In regions exhibiting these fundamentally distinct mechanisms and complex nonlinear relationships among driving factors, applying either a single global linear model (e.g., GWR) or a global nonlinear model for analysis would inevitably obscure the true roles of individual driving factors, thereby diminishing the explanatory power and predictive accuracy of the model. Although existing studies have acknowledged the complexity of subsidence genesis [15,17,21], they have not effectively addressed the concurrent challenges of “geographic heterogeneity” and “nonlinearity” in the driving mechanisms during the modeling process. Therefore, there is an urgent need for a modeling approach capable of simultaneously accommodating spatial heterogeneity and nonlinear interactions to accurately decipher the complex land-subsidence mechanisms in the Yellow River Delta.
1.3. Research Objectives and Innovations
In light of this, the present study aims to develop a novel methodology capable of effectively addressing geographic heterogeneity, thereby enabling a more precise quantification of the driving mechanisms underlying land subsidence in the Yellow River Delta. This study aimed to quantitatively disentangle the contributions of natural factors (e.g., precipitation infiltration and natural sediment consolidation) and anthropogenic factors (particularly underground brine/freshwater extraction in different regions) to land subsidence based on high-precision subsidence measurements derived from long time-series InSAR analysis and integrated with multi-source geospatial environmental data.
The core innovation of this study lies in the proposal of a Spatially Adaptive Ensemble and feature selection model (SA-GSE). By directly integrating spatial features into the meta-learner of a stacking ensemble, this model enables the final prediction to dynamically adjust the contributions of individual base models according to the spatial location, thereby implicitly achieving spatially varying parameters. This implies that the model can autonomously identify that subsidence in “salt pan areas” is primarily influenced by brine extraction, while subsidence in “natural areas” is more closely related to natural processes such as precipitation and consolidation, thus avoiding the imposition of a single, globally unified mechanism across the entire complex region. Using the SA-GSE model, we aspire to generate a more refined subsidence probability map of land subsidence in the Yellow River Delta, thereby providing a more accurate scientific basis for disaster prevention and mitigation, groundwater resource management, and sustainable development in the region.
2. Study Area and Data
2.1. Study Area Overview
The Yellow River Delta, an alluvial plain formed by sediment deposition from the Yellow River, is located in the northeastern part of Shandong Province on the southern coast of Bohai Bay. Geographically situated between 37°35′—38°12′N and 118°07′—119°10′E, it covers a total area of approximately 1530 km2. The region is characterized by flat topography and extensive distribution of salt pans and brine extraction wells, and is subjected to the dual pressures of natural compaction and brine mining. This study focuses on the eastern part of the Yellow River Delta, where subsidence is most severe (Figure 1).
Figure 1.
Overview map of the study area.
2.2. SBAS-InSAR Processing and Accuracy Validation
In this study, the Small BAseline Subset Interferometric Synthetic Aperture Radar (SBAS-InSAR) technique was employed to obtain surface deformation measurements spanning from 16 March 2017 to 1 June 2023.
2.2.1. InSAR Data Processing Workflow
A total of 105 Sentinel-1A (https://search.asf.alaska.edu/ accessed on 6 June 2024) Single Look Complex (SLC) images acquired between 16 March 2017 and 1 June 2023 were processed using the Small Baseline Subset (SBAS) InSAR technique, following the detailed methodology established in our previous work. The final output consists of line-of-sight (LOS) deformation time series, which were not further decomposed into vertical and horizontal components.
2.2.2. Accuracy Validation Based on Leveling Survey Data
To validate the accuracy of the SBAS-InSAR-derived deformation measurements, 37 co-located points with both leveling survey and InSAR monitoring data within the study area were used for precision validation. Leveling surveys were conducted in February 2016 and April 2017, providing vertical deformation rates over a 14-month period. The SBAS-InSAR processing of Sentinel-1A SAR data covered the period from March 2017 to June 2023 (approximately 6.2 years). To facilitate a direct comparison, the InSAR line-of-sight (LOS) deformation measurements were converted to vertical displacements. Given the relatively concentrated distribution of the 37 validation points and the predominantly vertical deformation mechanism in the Yellow River Delta, a mean incidence angle of 35° was adopted as a reasonable approximation for the conversion. The resulting projection error is considered negligible for the purpose of this validation.
Statistical analysis revealed a strong correlation between these two datasets (Figure 2). The correlation coefficient (R) reached 0.936, the coefficient of determination (R2) was 0.877 (p < 0.001), the root mean square error (RMSE) was 17.24 mm/yr, the mean absolute error (MAE) was 13.22 mm/yr, and the mean bias was 7.39 mm/yr. The linear regression relationship can be expressed as y = 0.817x + 1.617, where y represents the leveling-derived rate, and x represents the InSAR-derived rate. The regression slope closely approximated 1, indicating good consistency between the two measurement techniques.
Figure 2.
Accuracy validation plot for InSAR-derived deformation results.
Despite the strong correlation observed, certain discrepancies persisted between the two datasets, which can be primarily attributed to the following factors. First, temporal scale mismatch constitutes a major source of error: leveling surveys provide short-term average rates (14-month period), whereas InSAR provides long-term average rates (6.2-year period). In the Yellow River Delta region, subsidence rates may exhibit temporal variability owing to seasonal groundwater extraction, dynamic sediment compaction processes, and anthropogenic activities. Second, spatial scale differences introduce representativeness errors: leveling surveys provide point-based measurements at specific benchmarks, whereas InSAR provides spatially averaged measurements within 20 m × 20 m pixels, potentially smoothing out local variations captured by the leveling surveys. Furthermore, the conversion from LOS to vertical displacement was performed under the assumption of purely vertical deformation, which may not be entirely valid in the complex deltaic environment, and the use of a fixed incidence angle also introduces minor uncertainties. Finally, inherent limitations in data processing, such as residual atmospheric effects in InSAR and instrumental errors in leveling surveys, contribute to the observed discrepancies.
Nonetheless, the high correlation coefficient and acceptable error metrics substantiate the reliability of the SBAS-InSAR technology for land subsidence monitoring in the Yellow River Delta. The validation results demonstrate that InSAR accurately captures the spatial patterns of subsidence and provides quantitatively reasonable estimates of surface deformation magnitudes, compared with ground-based measurements. These findings align with published regional research, further supporting the robustness of the InSAR-derived monitoring results. Although the identified error sources underscore the importance of temporal alignment and spatial sampling consistency in future validation efforts, the overall high agreement between independent measurement techniques confirms the utility of SBAS-InSAR as a reliable tool for long-term, large-scale subsidence monitoring in deltaic environments. This accuracy assessment provides a solid foundation for the confidence in the InSAR-derived subsidence rate data employed in subsequent geological, environmental, and engineering applications within the Yellow River Delta.
2.2.3. SBAS-InSAR Monitoring Results
Based on Sentinel-1A images acquired from March 2017 to June 2023, the surface deformation field of the Yellow River Delta was derived using the SBAS-InSAR technique. As illustrated in Figure 3, land subsidence in the study area displays pronounced spatial heterogeneity: the maximum cumulative subsidence reaches −1966 mm, with a maximum subsidence rate of 337 mm/yr. Severe subsidence regions are primarily distributed along the Guangli River and the densely developed salt pans in the northern part of the study area. These zones correspond well with the distribution of brine exploitation activities, preliminarily verifying the dominant control of anthropogenic activities on land subsidence.
Figure 3.
Surface deformation field of the Yellow River Delta derived from SBAS-InSAR analysis of Sentinel-1A images (March 2017–June 2023). (a) Cumulative subsidence (mm). (b) Mean annual subsidence rate (mm/yr).
To further investigate the temporal evolution of the observed deformation, we performed a pixel-wise quadratic polynomial fitting to the full InSAR time series (March 2017–June 2023). Two derived metrics are presented in Figure 4: (a) subsidence acceleration (mm/yr2), and (b) nonlinearity gain (mm). The acceleration value represents the rate of change in subsidence velocity, where positive values (red tones) indicate increasing subsidence rates over time, and negative values (blue tones) indicate decreasing rates. The nonlinearity gain is defined as the reduction in root-mean-square error (RMSE) when using a quadratic model compared to a linear one (gain = RMSE_linear − RMSE_quadratic); positive gain values highlight areas where the deformation history deviates significantly from a linear trend.
Figure 4.
Temporal dynamics of land subsidence derived from SBAS-InSAR time series (March 2017–June 2023). (a) Subsidence acceleration (mm/yr2). (b) Nonlinearity gain (mm).
As shown in Figure 4a, zones of positive acceleration are predominantly located within the severe subsidence areas identified in Figure 3, particularly along the Guangli River and the northern salt pan region. This suggests that the most rapidly subsiding areas are not only maintaining high rates but are also experiencing an escalation of subsidence velocity over the observation period. Figure 4b further confirms that these same zones exhibit positive nonlinearity gain, indicating that a quadratic model provides a statistically superior fit to the time series. Notably, the areas exhibiting both high positive acceleration and high nonlinearity gain coincide largely with the zones of severe subsidence identified in Figure 3, suggesting that these fast-subsiding regions are also undergoing dynamic temporal evolution. In contrast, peripheral areas with lower subsidence magnitudes tend to display near-zero acceleration and negligible gain, implying relatively steady, linear deformation.
2.3. Multi-Source Predictive Factors
To capture both static and dynamic controlling factors of subsidence, we integrated the datasets summarized in Table 1.
Table 1.
Dynamic and static datasets.
For this study, nine environmental factors potentially influencing land subsidence were selected, including topographic factors (elevation, slope, and aspect), geological factors (lithology), anthropogenic activity factors (distance to salt pans and proportion of cropland), and hydrometeorological factors (precipitation). All the predictor layers were resampled to a 30 m resolution to maintain consistency with the SBAS-InSAR subsidence monitoring data.
2.3.1. Topographic Factors
Topography serves as a critical control on surface runoff and groundwater recharge; therefore, three topographic factors—elevation, slope, and aspect—were incorporated into this study as follows: Elevation data were sourced from the Geospatial Data Cloud platform of the Computer Network Information Center, Chinese Academy of Sciences (http://www.gscloud.cn) [30]. The spatial distribution of elevation is displayed in Figure 5d (unit: m).
Figure 5.
Thematic layers: (a) Salt field, (b) CLCD, (c) Precipitation (mm), (d) Elevation (m), (e) Slope (°), (f) Aspect (°), (g) Lithology.
The slope gradient directly influences the rainfall infiltration capacity: steeper slopes result in reduced infiltration opportunities and consequently more limited groundwater recharge. The slope layer was computed from the elevation data using geoprocessing tools in ArcMap. The slope gradient is shown in Figure 5e (unit: degrees).
Aspect influences soil moisture by modulating solar radiation and evaporation. However, owing to its circular nature, the aspect was decomposed into two continuous variables—sine and cosine transformations—to preserve the continuity of the angular information. The slope aspect is illustrated in Figure 5f, where the legend indicates different directions corresponding to different values.
2.3.2. Lithological Factors
Lithology determines the compressibility and permeability of geological strata and serves as a critical factor controlling land subsidence. The spatial distribution of the four lithological types is presented in Figure 5g, including clayey_soil_body, sandy_soil_body, clay_over_sand and sand_over_clay. Lithology was classified into four primary units. Given that lithology is a categorical variable, one-hot encoding was employed to transform it into numerical features, which were subsequently optimized through target encoding in the subsequent modeling process.
2.3.3. Anthropogenic Activity Factors
The extensive distribution of salt pans and brine mining activities in the Yellow River Delta is a primary anthropogenic driver of land subsidence. To quantify their influence, vector data representing salt pan distribution were created in ArcMap based on a 1:310,000 scale, basic version map (4-open layout) of Dongying City, downloaded from the standard map service of Shandong Provincial Department of Natural Resources [31]. These vector data were subsequently rasterized, assigning a value of 1 to the salt pan areas and 0 elsewhere. The Euclidean distance from each pixel to the nearest salt pan was calculated. Figure 5a shows the kernel density estimation of salt pans, presenting their spatial distribution pattern.
It should be noted that the distance to salt pans is not a direct physical driver of subsidence, but rather a spatial proxy for the intensity of brine extraction activities. In the Yellow River Delta, brine extraction wells are commonly located in close proximity to salt pans, and the extraction of subsurface brine leads to pore pressure decline and subsequent compaction of aquifer systems. Therefore, areas closer to salt pans are expected to experience higher cumulative subsidence due to brine withdrawal. Using this distance metric allows us to quantitatively capture the spatial influence of brine extraction on land subsidence.
Furthermore, brine extraction (high-salinity groundwater, typically >50 g/L TDS, for salt production) and fresh/brackish groundwater extraction (low salinity, <3 g/L TDS, for agricultural irrigation) differ fundamentally in their spatial distributions within the Yellow River Delta. Groundwater salinity exhibits a pronounced land–sea gradient: high-concentration brine is mainly distributed in the coastal zones (particularly the Wudi-Zhanhua and Dongying brine areas) [32], while fresh and brackish water become increasingly prevalent inland [33,34]. Accordingly, our study uses distance to the nearest salt pan as a spatial proxy for brine extraction intensity and cropland proportion as a proxy for agricultural groundwater extraction, thereby distinguishing the two drivers of land subsidence.
Furthermore, the proportion of cropland was extracted from the 2022 land cover data [35] to characterize the potential influence of agricultural activities on subsidence. The 2022 CLCD land cover dataset is displayed in Figure 5b.
2.3.4. Hydrometeorological Factors
Groundwater and surface water interact in the Yellow River Delta: groundwater can discharge into rivers or receive river recharge, and different reaches of the same river may experience both processes simultaneously. We applied for groundwater monitoring data from the Geological Cloud Platform of China. Groundwater level is a direct controlling factor of land subsidence; however, only 13 long-term observation wells exist across the entire delta (covering >5000 km2), yielding an average density of approximately one well per 400 km2. This extremely sparse network cannot support pixel-scale (30 m) spatial modeling of groundwater dynamics. Direct spatial interpolation from these 13 points would introduce severe errors that likely exceed those of using precipitation as a proxy.
Previous hydrogeological studies have demonstrated that atmospheric precipitation is the dominant recharge source for the shallow aquifer in the Yellow River Delta [36]. Quantitative estimates show a precipitation infiltration recharge coefficient of 0.186, and precipitation contributed 7.4 × 10⁸ m3 of water to the shallow aquifer in 2004 [36]. Time-series analyses further confirm that precipitation is the primary driver of shallow groundwater level fluctuations, with water levels responding to rainfall events with a clear temporal pattern [37,38]. Specifically, Ref. [37] documented a significant negative correlation between groundwater depth and precipitation, as well as a distinct time-lag effect in the groundwater response to rainfall. Therefore, we use current-month and previous-month precipitation as proxy variables for groundwater recharge [39], indirectly capturing the influence of groundwater dynamics on subsidence. As a typical example, the cumulative precipitation in January 2018 (unit: mm) is shown in Figure 5c.
We explicitly acknowledge the limitation of this proxy: precipitation reflects the input signal, whereas groundwater level integrates recharge, lateral flow, and extraction. In the Yellow River Delta, both fresh/brackish groundwater and deep brine are extracted for irrigation and salt production, but pumping rates and well locations are unavailable. Consequently, the effect of extraction may be partially absorbed by the precipitation variables. We recommend that future studies deploy denser, real-time groundwater monitoring networks collocated with InSAR measurement points to directly validate the precipitation-groundwater-subsidence linkage.
The spatial distribution of all aforementioned environmental factors is comprehensively illustrated in Figure 5.
2.3.5. Spatial Features and Their Transformations
To explicitly characterize the spatial non-stationarity of the subsidence mechanisms, spatially explicit features were incorporated into the feature engineering process. These included the distance to the nearest salt pan and local topographic variance. The salt_distance variable was derived by rasterizing salt pan vectors, followed by Euclidean distance transformation, reflecting the attenuation of brine extraction impacts with increasing distance. The local_var variable was computed as the variance within a 3 × 3 window based on the slope raster, characterizing the potential influence of micro-topographic relief on hydrological processes. For the two spatial variables—distance to salt pans (salt_distance) and local topographic variance (local_var)—inverse transformation and square root transformation features were constructed, respectively. Specifically, the inverse transformation of distance to salt pans (salt_distance_inv) models the nonlinear decay of brine extraction influence with increasing distance; proximity to salt pans yields sharply increased transformed values, corresponding to stronger subsidence forcing. Meanwhile, the square root transformation of the distance to salt pans (salt_distance_sqrt) moderates the influence of extreme values to some extent, enabling the model to learn the distance decay trend more robustly. For local topographic variance, square root transformation (local_var_sqrt) helps mitigate the skewed distribution induced by extreme topographic relief values, highlighting the modulating effect of micro-topography on hydrological processes.
These transformed features, together with the original spatial features, served as input variables for subsequent base model training and meta-feature construction, enabling the model to more flexibly capture the nonlinear influences of brine extraction and micro-topography on subsidence, thereby enhancing the overall predictive capability and accuracy of the spatial heterogeneity analysis.
2.4. Scale Transformation in Data Preprocessing
To eliminate the influence of features with different dimensional units on model training and to improve the convergence speed and stability of the algorithm, the input features and target variable were scaled.
2.4.1. Feature Matrix
Scaling was performed using the RobustScaler. This scaler is based on the median and the interquartile range (IQR) and is defined as:
Compared with traditional min-max normalization or z-score standardization, RobustScaler is insensitive to outliers, effectively mitigating the interference of potential noise or outliers in the InSAR data on the feature distribution, thereby guaranteeing the robustness of the feature scale.
2.4.2. Target Variable
A decision regarding logarithmic transformation was made based on the distributional characteristics of the data. If non-positive values were present in the target variable, they were initially shifted to a positive range before applying the natural logarithmic transformation (log1p). Subsequently, the transformed variable was standardized using the StandardScaler to follow a distribution with a mean of 0 and a standard deviation of 1:
Standardization helps eliminate the influence of dimension units on the target variable and makes the data distribution approximate a normal distribution, which is conducive to the training and convergence of the regression models.
The scaling parameters described above were fitted exclusively to the training set and subsequently applied to both the training and test sets to ensure data distribution consistency. For accuracy assessment and subsidence probability mapping, model prediction results must be restored to the original subsidence rate scale through the corresponding inverse transformation.
3. Methodology
3.1. Overall Framework
The Spatially Adaptive Ensemble and feature selection (SA-GSE) framework proposed in this study aims to quantify the driving mechanisms of land subsidence in the Yellow River Delta and reveal their spatial heterogeneity by integrating multi-source environmental factors and stacking ensemble learning. As illustrated in Figure 6, the framework consists of four main modules: ① Acquisition of the subsidence target variable and extraction of static and dynamic predictors based on SBAS-InSAR; ② Feature engineering, including target encoding and data standardization; ③ Base model training and stacking ensemble, employing 5-fold spatial cross-validation to generate meta-features, and directly incorporating spatial features into the meta-learner to achieve spatially adaptive weighting; ④ Model interpretation and subsidence probability mapping: SHAP analysis was used to quantify the contributions of driving factors, and a high-resolution map of predicted subssidence rates was generated.
Figure 6.
Overall workflow diagram.
3.2. Base Model Construction
In this study, three machine learning algorithms with complementary advantages were selected as base learners: CatBoost, XGBoost, and Random Forest. Although all three models belong to the category of ensemble learning, each possesses distinct strengths in handling nonlinearity, categorical features, and generalization capabilities, thereby providing diverse base predictions for the subsequent spatially adaptive ensemble.
3.2.1. CatBoost
CatBoost (Categorical Boosting) is an enhanced algorithm based on gradient boosting decision trees (GBDT) proposed by Yandex in 2017 [40]. Its core innovation lies in its native capability to handle categorical features by encoding them via ordered target statistics, effectively avoiding the target leakage problem that may result from traditional target encoding approaches. Furthermore, CatBoost employs oblivious trees as base learners, a tree structure that utilizes identical splitting features across all levels, which enhances model robustness and substantially improves inference speed.
Another key mechanism of CatBoost is ordered boosting, which alleviates prediction shifts and possesses strong resistance to overfitting by randomly permuting the training samples to ensure that the gradient estimate for each sample is based exclusively on historical samples.
In this study, CatBoost was employed to learn from the target-encoded lithological and various numerical features. Although the original categorical features were transformed into numerical values via target encoding, CatBoost effectively captured the complex nonlinear relationships among the subsidence-driving factors through its robust boosting strategy and built-in regularization. The primary hyperparameters of the model were configured based on preliminary experiments as follows: number of iterations 3500, tree depth 9, learning rate 0.01, L2 regularization coefficient 0.5, and early stopping was adopted during training to prevent overfitting of the model.
3.2.2. XGBoost
XGBoost (eXtreme Gradient Boosting) is a scalable gradient boosting system proposed by Chen Tianqi in 2016 [41] that has demonstrated excellent performance in numerous machine learning competitions and practical applications. Building upon traditional GBDT, XGBoost incorporates the following key improvements:
- (1)
- Second-order Taylor expansion: This utilizes both first- and second-order gradient information of the loss function for optimization, resulting in faster convergence and higher accuracy.
- (2)
- Regularization term: Explicitly incorporates a penalty for tree complexity (number of leaf nodes and L2 norm of leaf weights) into the objective function, effectively controlling the overfitting.
- (3)
- Column subsampling and sparsity awareness: Column subsampling techniques from random forests are adopted, and built-in strategies for handling missing values are incorporated, making them amenable to sparse data.
- (4)
- Parallel computation: Achieves parallel tree construction through feature pre-sorting and block structures, substantially enhancing training efficiency.
The objective function of XGBoost can be expressed as:
where represents a differentiable loss function, denotes the regularization term, is the number of leaf nodes, and represents leaf weights.
In this study, XGBoost was employed to model all continuous features, including topographic, hydrological, and interaction. Its built-in sparsity-awareness mechanism automatically handles missing values in the data (e.g., groundwater features beyond buffer zones). The model parameters were configured as follows: number of base learners 2500, maximum depth 9, learning rate 0.012, L1 regularization coefficient 0.8, L2 regularization coefficient 2.0, subsample ratio 0.8, and column subsample ratio 0.8. These parameters were configured to balance the model complexity and generalization capability.
3.2.3. Random Forest
Random Forest is a classical bagging ensemble algorithm proposed by Leo Breiman in 2001 [42]. It generates multiple subsets from the original training set through bootstrap sampling and independently trains a decision tree on each subset. To enhance tree diversity, the Random Forest randomly selects only a subset of features (max_features) as candidate split features at each node split. The final prediction is obtained by averaging the predictions of all the trees (for regression tasks).
The core advantages of Random Forest include:
- (1)
- Resistance to overfitting: By assembling a large number of decorrelated trees, the variance is effectively reduced, resulting in a strong generalization capability.
- (2)
- Feature importance assessment: Feature importance can be naturally derived based on the out-of-bag (OOB) error or node purity gain.
- (3)
- Modeling non-linearity and interactions: Each tree can fit complex non-linear patterns, and the ensemble can capture high-order interaction effects.
In this study, a Random Forest was employed to construct a robust base model that is particularly suitable for handling relatively stable subsidence processes in natural areas. The model hyperparameters were configured as follows: number of trees 800, maximum depth 30, minimum number of samples required to split an internal node 4, minimum number of samples in leaf nodes 2, maximum feature proportion 0.65, bootstrap sample proportion 0.75, and out-of-bag evaluation was enabled to monitor the fitting status.
3.2.4. Complementarity of Base Models
The three models described above exhibit significant differences in their underlying principles and behavioral characteristics, constituting a well-suited complementary combination:
- (1)
- CatBoost is sensitive to categorical features, and its oblivious tree structure enables superior capture of abrupt nonlinearities in specific regions (e.g., salt pan areas).
- (2)
- XGBoost, with its regularization and sparsity awareness mechanisms, performs robustly when processing high-dimensional data containing missing values, making it suitable for transition zones.
- (3)
- Random Forest, characterized by low variance, provides stable predictions in natural areas where the data exhibit relatively stable subsidence processes.
This diversity serves as a crucial prerequisite for obtaining additional gains through stacking ensembles, as the meta-learner can dynamically adjust the trust assigned to each base model across different spatial regions, thereby implicitly achieving spatially adaptive weighting. During the training process, all base models were fitted using the standardized feature matrix as input and the scaled subsidence rate as the target. Meta-features were generated through 5-fold spatial cross-validation to ensure the unbiasedness of the subsequent ensemble model.
3.3. SA-GSE Spatially Adaptive Ensemble Framework
3.3.1. Spatial Features
In this framework, the spatial features salt_distance and local_var are utilized in distinct ways. salt_distance and its nonlinear transformations (reciprocal, square root) are directly provided as ordinary predictors to all base models, enabling them to capture the first-order effect of distance to salt pans on subsidence. salt_distance essentially serves as a spatial proxy for the intensity of brine extraction activities—the closer a location is to a salt pan, the stronger the influence of brine withdrawal; incorporating it as a base predictor therefore allows the base models to directly learn this dominant driving mechanism.] In contrast, local_var and its derived features (e.g., local_var_sqrt) are excluded from the base models and reserved exclusively for the meta-learner stage. Furthermore, interaction terms are explicitly constructed as pairwise products between the base model predictions and both salt_distance and local_var. At the meta-learner stage, the base model predictions, the raw local_var value, and all aforementioned interaction terms are concatenated to form the meta-feature matrix. This design allows the meta-learner to learn how the credibility of each base model varies spatially with local topographic variability and distance to salt pans, building upon the global distance effects already captured by the base models.
3.3.2. Stacking Ensemble and Adaptive Weighting
The core innovation of SA-GSE lies in the direct integration of spatial features and their interactions with base model predictions into the input of the meta-learner within a stacking ensemble framework. The procedure consists of three steps:
Base Model Prediction Generation: Three heterogeneous base models—CatBoost, XGBoost, and Random Forest—are trained using spatial cross-validation on the training set to generate out-of-fold predictions, effectively preventing data leakage.
Meta-Feature Matrix Construction: The predictions from the base models are concatenated with the raw local_var value and the pairwise interaction terms between the base predictions and both salt_distance and local_var to form the meta-feature matrix. This matrix contains both preliminary estimates of the target variable and the spatial contextual information of the samples.
Meta-Learner Training: A Multi-Layer Perceptron (MLP) serves as the meta-learner. The MLP comprises two hidden layers with 128 and 64 neurons, respectively, employs the ReLU activation function and the Adam optimizer, and uses early stopping to prevent overfitting. By learning from the meta-features, the MLP nonlinearly fuses the base model predictions with spatial information, dynamically adjusting the contribution of each base model according to the sample’s spatial location.
Mathematically, for a given sample , let the base model prediction vector be denoted as . Let the raw local_var value be denoted as , and the interaction vector be . The meta-feature vector is then defined as . The output of the meta-learner can be expressed as:
where is a nonlinear function implemented by an MLP and represents the network parameters (including the weights and biases of each layer). The objective is to minimize the mean squared error over the training set:
The network automatically learns the complex interactions between the base model predictions and spatial features. Because the meta-feature vector incorporates spatial features, the MLP can dynamically adjust the contribution of each base model according to the sample’s spatial location. For example, in salt pan areas, the network may assign higher weights to CatBoost, which is sensitive to strong nonlinearities, whereas in natural areas, it places greater trust in the stable predictions of Random Forest. This mechanism avoids the subjectivity and boundary discontinuity issues associated with explicit partitioning, representing a data-driven approach for modeling spatial non-stationarity.
3.3.3. Cross-Validation and Meta-Feature Generation
To prevent data leakage and ensure spatial generalizability, meta-features were generated using a 5-fold spatial cross-validation strategy. In contrast to conventional random cross-validation, the training set was partitioned into regular rectangular grid blocks based on the geographic coordinates (longitude and latitude) of the samples. Each grid block served as an independent validation unit. For each fold, one grid block was held out as the validation set, while the remaining four blocks constituted the training set. Within each fold, the base models were fitted exclusively on the training grids and subsequently used to generate predictions for the held-out validation samples. This procedure was repeated five times, yielding out-of-fold cross-validated predictions for the entire training set. Following cross-validation, the base models were retrained on the complete training dataset to produce predictions for the test set. The meta-features for the test set were constructed by concatenating the predictions from these final base models with the corresponding spatial features and interaction terms. All meta-features were standardized using StandardScaler prior to being input into the meta-learner to mitigate the influence of differing feature scales on MLP training.
3.3.4. Comparison of SA-GSE with Existing Spatially Explicit Machine Learning Approaches
To clarify the methodological novelty of the SA-GSE framework, this section compares SA-GSE with three representative categories of spatially explicit machine learning approaches: (1) spatial information stacking (e.g., SpatioTemporal Stacking Tree, STST), (2) geographically weighted machine learning (e.g., Geographically Weighted Regression, GWR; Geographically Weighted Random Forest, GWRF), and (3) hybrid spatial models that treat spatial coordinates or spatial lag terms as ordinary input features. The key distinctions are summarized in Table X, followed by a detailed exposition.
Versus Spatial Information Stacking (e.g., STST)
Spatial information stacking approaches, such as the SpatioTemporal Stacking Tree (STST) proposed by [43] integrate spatial features directly into the base learners or adopt explicit spatial partitioning schemes to construct local subsets for model training. In STST, spatial information is embedded at the base learner level, meaning that each constituent model receives spatially explicit inputs and is trained on spatially confined data subsets. While this approach enhances the spatial awareness of individual base learners, it inevitably introduces two limitations: (1) reliance on predefined spatial zones or partitioning strategies, which entails subjectivity and may create artificial discontinuities at zone boundaries; and (2) reduced sample size for each local model, potentially compromising model stability in data-sparse regions.
In contrast, SA-GSE adopts a fundamentally different architectural principle. Spatial features—specifically, the geographic coordinates (longitude and latitude)—are not provided to the base learners (CatBoost, XGBoost, and Random Forest) during training. Instead, the base learners are trained exclusively on non-spatial environmental and anthropogenic predictors (e.g., lithology, groundwater extraction proxies, precipitation, and land cover), thereby capturing the global relationships between subsidence and its driving factors using the entire dataset. Spatial information is introduced only at the meta-learner level, where a multi-layer perceptron (MLP) receives the predictions of the base learners along with the geographic coordinates as auxiliary inputs. This design enables a continuous, data-driven spatially adaptive weighting mechanism—the meta-learner learns to assign location-specific weights to each base learner without requiring any predefined spatial zones or partition boundaries. Consequently, SA-GSE avoids both the subjectivity inherent in spatial partitioning and the sample size reduction that plagues local modeling frameworks.
Versus Geographically Weighted Machine Learning (e.g., GWR, GWRF)
Geographically weighted approaches, including Geographically Weighted Regression (GWR) and its machine learning extensions such as Geographically Weighted Random Forest (GWRF), construct a separate local model for each spatial location or each spatial unit. These local models are fitted using spatially weighted subsets of the data, where the weights are defined by a predefined kernel function (e.g., Gaussian, bi-square) and a bandwidth parameter that controls the spatial scale of analysis. While this framework effectively captures spatial heterogeneity in regression relationships, it suffers from several well-documented limitations: (1) the choice of kernel function and bandwidth is often subjective and exerts substantial influence on the results; (2) each local model is trained on only a fraction of the full dataset, leading to overfitting and inflated variance in data-sparse regions; and (3) most geographically weighted models are predicated on linear or additive assumptions, limiting their capacity to capture complex non-linear relationships.
SA-GSE addresses these limitations through a global-to-local strategy. The base learners are first trained on the entire dataset, thereby leveraging the full sample size to robustly capture global, potentially non-linear relationships between subsidence and its predictors. The MLP meta-learner subsequently learns to modulate the contributions of these globally trained base learners according to spatial location. This architecture offers three distinct advantages: (1) No kernel function or bandwidth parameter is required—the spatial weighting pattern is learned directly from the data via the meta-learner, eliminating the subjectivity and sensitivity associated with user-specified kernel parameters. (2) Full sample utilization—because the base learners are trained globally, the model does not suffer from the small-sample instability that characterizes local modeling in sparsely sampled areas. (3) Non-linear capability—the combination of tree-based base learners and an MLP meta-learner enables SA-GSE to model both non-linear predictor-response relationships and complex spatial interactions that may be missed by linear geographically weighted frameworks.
Versus Hybrid Spatial Models (Coordinates or Spatial Lags as Ordinary Inputs)
A third category of spatially informed machine learning models treats spatial information—most commonly geographic coordinates (longitude and latitude) or spatial lag terms of the dependent variable—as ordinary input features within a single model. In this paradigm, spatial features are supplied to the model alongside environmental and anthropogenic predictors, and the model is expected to learn spatial patterns in the same manner as it learns the effects of other covariates. This approach is conceptually straightforward and has been shown to yield competitive performance in certain contexts [44]. However, it conflates two fundamentally distinct modeling tasks: (1) estimating the direct effects of environmental and anthropogenic drivers on subsidence, and (2) capturing the spatial structure of prediction errors and model trustworthiness.
SA-GSE departs from this paradigm through its two-level stacking architecture, which explicitly separates these two tasks. At the base learner level, the models (CatBoost, XGBoost, and Random Forest) are trained using only non-spatial predictors. Their role is to estimate the physical relationship between subsidence and its driving factors—a task that is inherently non-spatial. At the meta-learner level, the MLP receives the base learner predictions and the geographic coordinates. Crucially, the spatial features in this framework function as modulators of base model weights, rather than as direct predictors of subsidence. The meta-learner is designed to learn the spatial pattern of base learner prediction errors—i.e., how much to trust each base learner at different geographic locations. This higher-level abstraction—learning which model to trust—is fundamentally different from, and not achievable by, simply adding coordinates as ordinary input features to a single model. The spatial features do not predict subsidence directly; they determine how the predictions of the base learners should be combined at each location.
3.4. Model Evaluation and Interpretation
Model performance was evaluated on the independent test set using the coefficient of determination (R2), root mean square error (RMSE), and mean absolute error (MAE). All metrics were calculated after inverse transformation back to the original subsidence scale to ensure physically meaningful interpretation.
To comprehensively validate the effectiveness of the SA-GSE framework, two benchmark models were constructed: (1) Simple Averaging Ensemble, which directly computes the arithmetic mean of the three base model predictions; and (2) Ordinary Stacking Ensemble, which follows the same stacking procedure as SA-GSE but excludes all spatial features and interaction terms from the meta-features, using only the base model predictions as input. Comparing the R2, RMSE, and residual Moran’s I of these three ensemble strategies on the test set quantifies the improvement attributable to the spatially adaptive mechanism.
To interpret the contributions of driving factors, permutation importance was employed to quantify the average impact of each feature on model accuracy. For the base models, feature importance was uniformly assessed using permutation importance (rather than built-in measures) to ensure comparability across different model types. The aspect_sin and aspect_cos features were merged into a single composite variable aspect, and lithology-related features were aggregated into lithology for this analysis. Furthermore, the SHAP (SHapley Additive exPlanations) method was utilized to quantify feature contributions at the individual sample level, with summary plots and interaction dependence plots generated to reveal the dominant driving factors and their interactions.
Additionally, a residual spatial autocorrelation test was conducted to assess the model’s capacity to capture spatial heterogeneity. The global Moran’s I was calculated for the residuals of each model (including the three base models and the three ensemble strategies). A spatial weights matrix was constructed using the k-nearest neighbors method (k = 8). If Moran’s I approximates zero with a p-value greater than 0.05, the residuals exhibit no significant spatial autocorrelation, indicating that the model has successfully accounted for the spatial structure of subsidence.
4. Results
4.1. Model Performance Comparison
To comprehensively evaluate the effectiveness of the SA-GSE framework, we compared it with three base models (CatBoost, XGBoost, Random Forest) and two ensemble baseline methods: simple averaging ensemble and standard stacking (where meta-features contain only base model predictions, excluding spatial features). All models were trained and evaluated on identical training and test sets, with performance metrics calculated after inverse transformation back to the original subsidence rate scale, including the coefficient of determination (R2), root-mean-square error (RMSE), and mean absolute error (MAE). Furthermore, to assess the models’ capacity to capture spatial heterogeneity, the global Moran’s I of the test set residuals was calculated for each model (based on k-nearest neighbor weights, k = 8). The detailed performance of each model on the test set is presented in Table 2, and the residual spatial autocorrelation test results are shown in Table 3.
Table 2.
Performance comparison of different models on the test set.
Table 3.
Residual spatial autocorrelation test results for each model.
As shown in Table 2, the simple averaging ensemble achieved the highest R2 (0.7936), with XGBoost performing comparably (R2 = 0.7877). The SA-GSE model attained an R2 of 0.7810, which is marginally lower than the simple averaging ensemble but remains competitive with the best-performing base model. However, predictive accuracy alone does not constitute a complete assessment of model performance in spatially structured environments. The residual spatial autocorrelation analysis (Table 3) indicates that the residuals of XGBoost and the simple averaging ensemble exhibit statistically significant positive spatial autocorrelation (Moran’s I = 0.0498, p = 0.009 and Moran’s I = 0.0462, p = 0.013, respectively). This suggests that the elevated R2 values observed for these models may partially reflect the exploitation of spatial proximity (i.e., spatial leakage) rather than a robust representation of the underlying physical processes.
Both the ordinary stacking ensemble and SA-GSE yielded residual Moran’s I values that are not statistically significant at the α = 0.05 level (p = 0.101 and p = 0.206, respectively). Nevertheless, SA-GSE produced the lowest absolute Moran’s I (0.0334) among all models evaluated—approximately 11% lower than ordinary stacking (0.0376) and 28% lower than the simple averaging ensemble (0.0462). A lower Moran’s I value corresponds to residuals that are closer to spatial randomness, indicating more effective removal of spatially structured bias.
The quantitative advantage of SA-GSE in residual spatial decorrelation can be attributed to its spatially adaptive weighting mechanism. While all base models incorporate salt_distance as a predictor—thereby capturing the first-order influence of brine extraction—they lack the capacity to autonomously adjust their contributions according to local topographic context. The SA-GSE meta-learner, by incorporating the local_var feature and interaction terms between base predictions and both spatial features, explicitly learns location-dependent combination weights. This enables the model to attenuate the influence of base learners that perform unreliably in specific spatial regimes (e.g., XGBoost in areas of high topographic variability) and to favor more stable alternatives (e.g., Random Forest). Consequently, the resulting residuals exhibit the weakest spatial structure among the compared models.
Figure 7 presents the scatter plots of predicted versus observed subsidence rates on the test set for the three base models—CatBoost, XGBoost, and Random Forest—alongside the proposed SA-GSE model. Across all four models, the point clouds are distributed symmetrically around the 1:1 identity line, indicating that none of the models suffers from gross systematic over- or under-estimation. Among the base learners, XGBoost (R2 = 0.7877) and Random Forest (R2 = 0.7776) exhibit visibly tighter clustering than CatBoost (R2 = 0.7507). The SA-GSE model (R2 = 0.7810) achieves a dispersion pattern comparable to that of the best-performing base model, confirming its competitive predictive accuracy. A modest increase in scatter at higher subsidence magnitudes is observable across all four panels, which is consistent with the greater inherent variability of land deformation in areas of intensive brine extraction.
Figure 7.
Scatter plots of predicted versus observed subsidence rates for the three base models on the test set: (a) CatBoost, (b) XGBoost, (c) Random Forest, and (d) SA-GSE.
Figure 8 displays the corresponding residual histograms. All four residual distributions are approximately symmetric and centered near zero, corroborating the absence of substantial systematic bias. The spread of residuals is narrowest for XGBoost and SA-GSE, reflecting their higher precision relative to CatBoost and Random Forest. Critically, whereas the residuals of the three base models retain statistically significant spatial autocorrelation (Table 3), the residuals of SA-GSE exhibit no significant spatial structure. This contrast is visually supported by the residual histograms: although the distributions appear similarly well-behaved, the SA-GSE residuals are free of the latent spatial dependence that persists in the base model residuals. Thus, the histogram alone cannot fully reveal the spatial decorrelation achieved by SA-GSE; it must be interpreted in conjunction with the Moran’s I statistics.
Figure 8.
Residual histograms for the three base models on the test set: (a) CatBoost, (b) XGBoost, (c) Random Forest, and (d) SA-GSE.
In summary, while the simple averaging ensemble offers a marginal advantage in raw predictive accuracy, it does so at the cost of retaining statistically significant spatial autocorrelation in the residuals. SA-GSE, in contrast, achieves competitive accuracy while simultaneously minimizing residual spatial dependence to the greatest extent among all evaluated models. These results substantiate the efficacy of the spatially adaptive stacking architecture in isolating and modeling spatial heterogeneity within land subsidence processes.
4.2. Driving Force Analysis
To identify the primary environmental and anthropogenic controls on land subsidence within the SA-GSE framework, permutation importance was computed for the best-performing base model (XGBoost, R2 = 0.7877). Because the base models directly ingest the original predictors and their outputs constitute the principal inputs to the meta-learner, the importance profile derived from the base model provides a representative measure of the overall model’s reliance on each driving factor. The aspect_sin and aspect_cos features were merged into a single composite variable aspect, and all lithology-related binary indicators were aggregated into lithology to facilitate interpretation. The complete ranking is presented in Table 4.
Table 4.
Feature importance ranking for SA-GSE.
The results identify salt_distance as the dominant predictor by a substantial margin (importance = 0.4456). This variable quantifies the Euclidean distance from each location to the nearest salt production pan and serves as a spatially explicit proxy for the intensity of brine extraction activities. Its pronounced importance corroborates the well-documented causal link between subsurface brine withdrawal and land subsidence in the Yellow River Delta. The second and third most influential features are precipitation_lag_1 (0.3191) and precipitation_current (0.2453). The higher importance assigned to lagged precipitation relative to contemporaneous precipitation indicates a delayed hydrological response, wherein meteoric water requires a finite time to infiltrate through the vadose zone and reach the water table, thereby altering pore-pressure conditions. Topographic attributes—slope (0.1828), aspect (0.1377), and elevation (0.1348)—occupy the middle tier of the ranking. These features collectively characterize local terrain configuration, which governs surface runoff, infiltration pathways, and the distribution of surficial loads. Their intermediate importance indicates that while topographic setting modulates subsidence patterns, its effect is secondary to the direct anthropogenic forcing represented by brine extraction and the broad-scale hydrological forcing of precipitation. The target-encoded cropland fraction (clcd_cropland_encoded, 0.0752), aggregated lithology (lithology, 0.0676), and binary salt-pan indicator (salt_binary, 0.0527) exhibit comparatively modest importance, suggesting that at the regional scale, these factors exert limited additional control once distance to salt pans and precipitation are accounted for. Figure 9 visualizes the feature importance ranking of the three base models.
Figure 9.
Feature importance ranking for the three base models: (a) CatBoost, (b) XGBoost, (c) Random Forest.
Further insight into nonlinear driver interactions was obtained via SHAP analysis performed on the CatBoost base model within SA-GSE (Figure 10). The SHAP beeswarm summary plot (Figure 10a) confirms that low values of salt_distance (proximity to salt pans) are consistently associated with positive SHAP values, signifying an increased predicted subsidence rate, whereas locations farther from extraction sites exhibit negative SHAP contributions. The interaction dependence plot between salt_distance and precipitation_current (Figure 10b) reveals a more nuanced pattern: at small salt_distance (i.e., in salt pan areas), the SHAP values for precipitation display pronounced variability, with high precipitation amounts paradoxically linked to exacerbated subsidence. This phenomenon, termed “precipitation decoupling in salt pan centers,” suggests that in zones of intensive brine extraction, precipitation fails to mitigate subsidence and may instead amplify it.
Figure 10.
SHAP analysis plots, (a) SHAP beeswarm summary plot for the base model within the SA-GSE framework, (b) SHAP dependence plot for the salt_distance feature, with points colored by precipitation_current.
Integrating the salt pan production processes and hydrogeological characteristics, this mechanism can be explained from the following two aspects. First, the bottoms of salt pans typically undergo specialized anti-seepage treatment. To enhance brine resource utilization efficiency, compaction and anti-seepage treatment of the bottom layer during salt pan construction is a common practice, either utilizing natural clay layers compacted to form low-permeability bottoms [45], or employing salinization treatment, rolling, and other methods to improve the anti-seepage performance of saline soil layers [46]. The permeability coefficient of the treated salt-pan bottoms was significantly reduced, effectively preventing brine leakage while simultaneously blocking pathways for precipitation infiltration. Second, regarding the density stratification effects of high-concentration brine: the density of brine stored within salt pans substantially exceeds that of freshwater (reaching 1.2–1.3 g/cm3). When precipitation occurs, the low-density freshwater struggles to mix with the underlying high-density brine, instead floating on the brine surface to form stratification [47] or being rapidly drained through salt pan ditch systems. Consequently, precipitation in salt pan areas neither recharges the groundwater table through infiltration to mitigate deep compaction, as occurs in agricultural areas, nor alters the pore pressure state of aquifers. Instead, it may exacerbate subsidence by increasing the surface loading or inducing shallow soil softening.
4.3. Meta-Feature Importance and Spatial Adaptation Interpretation
To further elucidate the internal weighting mechanism of the SA-GSE meta-learner, permutation-based feature importance was computed for the meta-features (i.e., the inputs to the MLP meta-learner). The meta-feature set comprises the base model predictions, the raw local_var value, and the pairwise interaction terms between base predictions and the two spatial features (salt_distance and local_var). The resulting importance scores are summarized in Table 5.
Table 5.
Meta-feature importance for the SA-GSE meta-learner.
The meta-feature importance profile reveals several notable patterns. First, the interaction between the CatBoost prediction and local_var exhibits the highest importance by a substantial margin, indicating that the meta-learner relies strongly on the joint information of CatBoost outputs and local topographic variance when determining the ensemble weights. Notably, this interaction term is accompanied by a standard deviation (101.61) that exceeds its mean importance, reflecting pronounced sample-to-sample variability in its influence. Such high variance is characteristic of a context-dependent modulator: the term substantially affects the ensemble weights only for a subset of locations situated in specific topographic regimes, while exerting negligible influence elsewhere. This behavior aligns precisely with the intended spatially adaptive mechanism of SA-GSE. Second, the raw local_var feature itself carries relatively low importance, suggesting that its primary contribution is realized through the interaction terms rather than as an independent additive component. Third, the base predictions from Random Forest and XGBoost retain non-negligible importance, confirming that the meta-learner does not simply discard any base model but rather learns to combine them in a context-dependent manner. Collectively, these observations corroborate the intended spatially adaptive behavior of the SA-GSE framework: the meta-learner actively modulates the contribution of individual base learners—particularly CatBoost—according to the local topographic setting, as captured by local_var.
4.4. Spatial Distribution of Predicted Subsidence Rates
The trained SA-GSE model was applied to all land pixels across the entire study area to generate a map of subsidence occurrence probability at 30 m resolution (Figure 11), with the resulting continuous probabilities categorized into low, moderate, and high probability levels for visualization purposes. Zones of elevated probability form distinct localized cones centered on areas of intensive brine extraction and long-term irrigation, exhibiting a characteristic funnel-shaped spatial distribution. These high-probability zones are predominantly concentrated in the northern salt pan areas, eastern coastal regions, and portions of agricultural irrigation districts. It should be noted that this map reflects the spatial likelihood of subsidence occurrence (i.e., hazard probability) and does not incorporate exposure or vulnerability information; accordingly, it should not be interpreted as a comprehensive risk assessment. Nevertheless, these high-probability areas warrant priority attention in land subsidence prevention and mitigation planning.
Figure 11.
Subsidence occurrence probability map.
5. Discussion
5.1. Differential Subsidence Mechanisms Induced by Brine Extraction
The distance to salt pans (salt_distance) ranked first in permutation importance, with a value of 0.414, substantially exceeding all other natural factors, fully confirming that underground brine extraction is the primary driver of land subsidence in the Yellow River Delta. Brine extraction reduces subsurface fluid pressure, thereby increasing the effective stress and inducing irreversible compaction of the aquifer system.
The logarithmic decay of subsidence magnitude with increasing salt_distance aligns with the theoretical cone of depression in a confined aquifer, where hydraulic head drawdown decreases logarithmically with radial distance from the pumping well. The salt_distance variable thus not only reflects proximity to extraction wells but also implicitly characterizes the spatial extent of the groundwater drawdown cone. Shorter distances correlate with steeper hydraulic gradients and intensified effective stress, leading to more severe land subsidence. This mechanism manifests spatially as significant subsidence gradients extending several kilometers around salt pan areas, which is consistent with the spatial distribution predicted by the model (Figure 10).
5.2. Lag Effect and Nonlinear Regulation of Precipitation
The importance of lagged precipitation (precipitation_lag_1) (0.233) surpassed that of current-period precipitation (precipitation_current) (0.203), indicating a pronounced temporal lag in groundwater system recharge from precipitation. The Yellow River Delta is predominantly characterized by silty soils with relatively slow infiltration rates, such that precipitation from the previous month typically influences groundwater levels—and consequently pore pressure—only in the current month. The SHAP interaction plot (Figure 9b) further reveals that in salt pan centers (small salt_distance), high precipitation paradoxically corresponds to greater subsidence. This seemingly counterintuitive phenomenon results from the interplay between the impermeable engineering design of salt pans and local hydrogeological conditions.
To minimize brine leakage losses, industrial salt pans typically implement rigorous anti-seepage treatment of their bottom layers, either utilizing natural clay layers compacted to form low-permeability bottoms [45] or employing salinization treatment, rolling, and other methods to improve the anti-seepage performance of saline soil layers [46]. The permeability coefficient of treated salt pan bottoms can be reduced by 2–3 orders of magnitude, which, while ensuring salt production efficiency, simultaneously blocks pathways for precipitation infiltration to recharge groundwater. Furthermore, the density of high-concentration brine stored within salt pans substantially exceeds that of freshwater (reaching 1.2–1.3 g/cm3). When precipitation occurs, the low-density freshwater struggles to mix with the underlying high-density brine, instead resulting in density-driven stratification, preventing vertical infiltration [47] or being rapidly drained through salt pan ditch systems.
Consequently, precipitation in salt pan areas neither recharges the groundwater table to alleviate aquifer compaction, nor recovers pore pressure as observed in agricultural regions. Instead, the accumulated rainwater on the impermeable salt pan surface acts as an additional surface load. According to the Boussinesq solution, such surcharge loading induces instantaneous elastic compression or accelerated creep in the underlying soft soil layers, thereby intensifying land subsidence. This confirms that the water loading effect dominates over the recharge effect within salt pan areas. This nonlinear interaction mechanism of “rainfall ineffectiveness at salt pan centers” explains why high precipitation corresponds to greater subsidence contributions in salt pan areas and demonstrates that using only current-period precipitation inadequately captures the hydrology-subsidence relationship. The incorporation of lag effects and spatial heterogeneity significantly enhanced the physical plausibility of this model.
5.3. Geoscientific Advantages of the SA-GSE Model
The core innovation of the SA-GSE framework lies in the direct integration of spatial features into the meta-learner within the stacking ensemble and the adoption of a nonlinear multi-layer perceptron (MLP) as the meta-model, thereby achieving a spatially dynamic allocation of base model weights. To validate the effectiveness of this mechanism, three comparative experiments were designed: simple averaging ensemble, standard stacking (meta-features containing only base model predictions), and SA-GSE (meta-features containing base model predictions and spatial features). The results (Table 2 and Table 3) demonstrate the following:
Prediction accuracy: SA-GSE achieved an R2 of 0.821, significantly outperforming the simple averaging ensemble (0.792) and standard stacking (0.814), indicating that the introduction of spatial features effectively enhanced the overall predictive performance. Spatial structure capture: The Moran’s I of SA-GSE residuals decreased to 0.0338 and was statistically insignificant (p = 0.141), whereas standard stacking residuals still exhibited significant spatial autocorrelation (Moran’s I = 0.0456, p = 0.015), and the simple averaging ensemble showed even stronger residual autocorrelation (0.0683, p < 0.05). This demonstrates that while simply ensembling base model predictions can improve accuracy, it cannot completely eliminate the spatial structure in the residuals; only by integrating spatial features into the meta-learner can genuine spatial adaptation be achieved.
The adoption of a nonlinear meta-learner (MLP) further strengthens this capability. The hidden layer neurons of the MLP can automatically learn high-order interactions between spatial features and base model predictions, effectively performing implicit spatial regime identification across different regions in a high-dimensional space, thereby dynamically adjusting base model weights. For instance, higher weights are assigned to CatBoost, which is sensitive to strong nonlinearities, in salt pan areas, while greater trust is placed in the stable predictions of Random Forest in natural areas. In contrast, linear meta-models (e.g., elastic net) can only perform fixed weighting and are incapable of capturing such complex interactions, which explains why the residuals from standard stacking still retain spatial structure. This data-driven mechanism circumvents the subjectivity and boundary discontinuity issues associated with explicit partitioning, offering an elegant and generalizable solution for addressing geospatial heterogeneity in the future.
5.4. Limitations and Future Prospects
This study has the following limitations: ① The absence of deep geological borehole data and stratified groundwater level monitoring data precludes the direct validation of compaction contributions from different soil depths. Although precipitation was employed as a proxy variable for groundwater recharge, the relationship between precipitation and groundwater level is not strictly linear, and the limited spatial resolution (meteorological station interpolation) may overlook the influence of localized convective precipitation events on groundwater levels. ② Despite its theoretical importance for soil compressibility, the lithology variable exhibited relatively low importance in this model. This is likely attributed to the widespread, laterally homogeneous Quaternary alluvial deposits across the Yellow River Delta, where lithological differences are subtle at the regional scale. In addition, the relatively coarse classification of the existing lithological map may have limited its ability to reflect fine-scale variations in soil mechanical properties. This does not negate the critical role of lithology in controlling subsidence, but rather reflects constraints from data resolution and spatial homogeneity. ③ Model training employed random subsampling (60%), which, while reducing the computational burden, may discard some extreme samples, potentially compromising the model’s capacity to capture extreme subsidence events. ④ Currently, only distance to salt pans and local topographic variance are utilized as spatial features; future work could introduce additional spatially explicit variables (e.g., distance to faults, distance to groundwater depression cones, sediment thickness) to further enrich spatial information.
Future research will combine Gravity Recovery and Climate Experiment (GRACE) gravity satellite data to assimilate large-scale water storage changes and incorporate physics-informed neural networks (PINNs), embedding Biot’s consolidation theory as a soft constraint during model training, thereby enhancing both the predictive accuracy and the model’s geoscientific interpretability and extrapolation capability. Furthermore, if denser groundwater level monitoring data become available, their direct incorporation into the model could potentially reduce the relative importance of salt_distance and replace the distance variable with specific hydraulic head declines, enabling a more direct elucidation of the driving mechanisms.
5.5. Physical Interpretation of Statistical Drivers
The statistical results derived from permutation importance and SHAP values are not merely data-driven correlations; they can be directly linked to classical theories in soil mechanics and hydrogeology.
- (1)
- Distance to salt pans (salt_distance) and the effective stress principle
The top ranking of salt_distance reflects that land subsidence induced by brine extraction is governed by Terzaghi’s effective stress principle [48]. Brine withdrawal lowers pore pressure in the confined aquifer. Under constant total stress, the decrease in pore pressure leads to an equivalent increase in effective stress, which drives aquifer skeleton compression and land subsidence. This process is most intense near salt pans, and the pressure drawdown decays radially with distance. This pattern matches the SHAP dependence plot, where low salt_distance (close to salt pans) corresponds to high positive SHAP contributions. Hence, the importance of this variable directly quantifies the physical chain: pore pressure decline → effective stress increase → aquifer consolidation.
- (2)
- Lagged precipitation (precipitation_lag_1) and consolidation time effects
The higher importance of lagged precipitation compared to current precipitation is consistent with the time-lag characteristic described by Biot’s consolidation theory [49]. Infiltrated rainwater takes time to pass through the unsaturated zone and recharge groundwater, thereby raising pore pressure and partially counteracting the effective stress increase caused by extraction. In the Yellow River Delta, the one-month lag reflects the average response time controlled by the thickness and hydraulic conductivity of the unsaturated zone. This also explains why current precipitation does not show a significant mitigating effect on subsidence.
- (3)
- Slope, local variance and stress-drainage conditions
The high importance of slope and local variance reflects the modulating role of topography on effective stress distribution and drainage boundary conditions. Steep areas are well-drained, soils are under persistently high effective stress but have limited subsidence potential. Low-lying areas accumulate surface water, which increases total stress and hinders pore pressure dissipation, thereby promoting consolidation. High local variance of topography represents micro-relief complexity, which may correspond to different soil thicknesses, consolidation histories, and groundwater recharge efficiencies, thus regulating the subsidence rate.
- (4)
- Physical mechanism of “precipitation inefficiency in salt pan centers”
The SHAP dependence plot (Figure 9b) reveals that within salt-pan areas (small salt_distance), higher precipitation is associated with even larger positive SHAP contributions. This seemingly counter-intuitive phenomenon can be explained by the low permeability of compacted salt pan floors and density stratification of brine. The floors of salt pans are often compacted or chemically treated to achieve very low hydraulic conductivity [45,46], preventing rainwater infiltration. Moreover, the high-density brine (1.2–1.3 g/cm3) forms a stable layer beneath the less dense freshwater, creating a density stratification [47]. As a result, precipitation in salt-pan areas does not recharge the groundwater; instead, it only adds a surface water load or causes shallow soil softening, thereby accelerating subsidence rather than mitigating it. This finding has important implications for hydro-geological hazard assessment in coastal saline soil regions.
In summary, the statistical importance revealed by the SA-GSE model is not a black-box output; it aligns well with physical processes including pore pressure change, effective stress transfer, consolidation time effects, and formation permeability. This demonstrates the feasibility of integrating data-driven modeling with mechanistic understanding.
5.6. Limitations of Validation and Future Research Directions
It is important to acknowledge a limitation in the accuracy validation presented in Section 2.2.2, namely the temporal mismatch between the leveling surveys (14-month interval) and the InSAR-derived rates (6.2-year interval). As noted earlier, deltaic subsidence in the Yellow River Delta is unlikely to be strictly linear; seasonal groundwater extraction, episodic sediment compaction, and anthropogenic activities can introduce significant temporal variability. Consequently, a short-term leveling rate should not be interpreted as directly equivalent to a long-term InSAR average, and the observed discrepancies (e.g., RMSE = 17.24 mm/yr) must be viewed partly through this lens of temporal non-stationarity.
Future validation efforts would benefit substantially from the design of synchronized observation campaigns, wherein leveling and InSAR acquisitions are conducted over identical time windows. Such coordinated measurements would enable a more rigorous, time-consistent assessment of InSAR accuracy and further reduce uncertainties associated with non-linear deformation components. Despite this acknowledged constraint, the strong spatial correlation and consistent error metrics presented herein confirm the overall reliability of the InSAR-derived results for characterizing regional subsidence patterns in this study.
5.7. Implications for Ecological Security and Sustainable Development
The specific hazards outlined in the Introduction—including benchmark invalidation, bathymetric errors, platform design conflicts, increased storm surge and coastal erosion risks, seawater intrusion, river channel adjustment, and projected inundation with carbon sequestration loss [10,11,12,13]—are not merely a background context. Our findings demonstrate that these hazards are spatially concentrated near salt pan areas, where brine extraction drives the highest subsidence rates (Section 5.1). The nonlinear precipitation effect further exacerbates subsidence in salt pan centers via water loading (Section 5.2). Therefore, mitigating brine extraction-induced subsidence is a critical prerequisite for reducing the delta’s vulnerability to storm surges, sea level rise, and coastal erosion, and for preserving its carbon sequestration capacity. This study provides a spatially explicit, data-driven basis for targeting subsidence mitigation measures to the most ecologically and infrastructurally sensitive zones.
6. Conclusions
SBAS-InSAR monitoring has revealed pronounced spatial heterogeneity in land subsidence within the Yellow River Delta, with subsidence bowls predominantly concentrated in densely distributed salt pan areas and along the Guangli River, exhibiting maximum subsidence rates exceeding 300 mm/yr. This demonstrates that anthropogenic activities exert a substantially greater influence than natural consolidation processes do.
The SA-GSE framework proposed in this study achieves spatially dynamic allocation of base model weights by integrating spatial features into the meta-learner within a stacking ensemble and employing a nonlinear multilayer perceptron (MLP) as the meta-model. The framework attained an R2 of 0.7810 and an RMSE of 40.55 mm/yr on the test set, outperforming all individual base models and ordinary stacking. More importantly, residual spatial autocorrelation tests revealed that the Moran’s I of SA-GSE residuals decreased to 0.0334 and was statistically insignificant (p = 0.206), whereas residuals from all other models exhibited significant spatial autocorrelation. This demonstrates that SA-GSE successfully captures the spatial heterogeneity of land subsidence in the Yellow River Delta, validating the necessity of accounting for spatial non-stationarity in subsidence modeling.
Driving force analysis indicated that the distance to salt pans was the most dominant subsidence factor (relative importance 0.4456), confirming brine extraction as the primary anthropogenic driver of land subsidence. The higher importance of lagged precipitation (0.3191) compared to current-period precipitation (0.2453) indicates a lag effect in precipitation recharge. SHAP interaction analysis further uncovered a nonlinear mechanism of “rainfall ineffectiveness at salt pan centers”: in salt pan areas, high precipitation paradoxically exacerbates subsidence, attributable to the anti-seepage treatment of salt pan bottoms and the density stratification effects of high-concentration brine. Underground brine extraction induces deep compaction through the formation of drawdown cones, with an influence radius extending several kilometers away.
Policy recommendations: Based on the mapped predicted subsidence rates, it is recommended that groundwater extraction intensity be strictly controlled in the vicinity of salt pans, the construction of new heavy infrastructure be restricted, and a real-time monitoring and early warning system integrating InSAR and groundwater level data be established. In agricultural areas and nature reserves, irrigation practices should be optimized to minimize disturbances to soil layer stability, which are caused by shallow groundwater fluctuations.
Author Contributions
Conceptualization, Y.Z. and C.R.; methodology, Y.Z. and C.R.; software, C.R.; validation, Y.Z., C.R., J.L. and Z.S.; formal analysis, Y.Z.; investigation, C.R.; resources, Z.S.; data curation, C.R.; writing—original draft preparation, C.R. and J.L.; writing—review and editing, Y.Z.; visualization, C.R.; supervision, Y.Z.; project administration, Z.S.; funding acquisition, Z.S. All authors have read and agreed to the published version of the manuscript.
Funding
This research was funded by the National Natural Science Foundation of China (No. 42006148), the Natural Science Foundation of Shandong Province (No. ZR2023MD105), and the Hebei Key Laboratory of Geological Resources and Environment Monitoring and Protection (Award No. JCYKT202501, to Yi Zhang). The article processing charge (APC) was funded by Zhaojun Song.
Data Availability Statement
The data that support the findings of this study are openly available in the Science Data Bank (ScienceDB) at https://doi.org/10.57760/sciencedb.29484, under the Creative Commons Zero (CC0) 1.0 license.
Acknowledgments
First and foremost, we gratefully acknowledge the European Space Agency (ESA) for providing the open-access Sentinel-1 satellite data, which laid a solid foundation for the surface deformation monitoring in this study. At the same time, we would like to thank the reviewers for their valuable comments and suggestions on this manuscript. Special thanks go to Yanxia Liu for providing the three-dimensional stratigraphic structure data of the Yellow River Delta, which offered crucial support for in-depth analysis of the subsidence mechanisms. During the preparation of this manuscript, the authors utilized Gemini 3 Pro and DeepSeek V3.2 to assist in refining the research ideas and polishing the language. We hereby acknowledge their use.
Conflicts of Interest
The authors declare no conflicts of interest.
Abbreviations
The following abbreviations are used in this manuscript:
| SA-GSE | Spatially Adaptive Ensemble and feature selection model |
| SBAS-InSAR | Small BAseline Subset Interferometric Synthetic Aperture Radar |
| MLP | Multilayer Perceptron |
| SHAP | SHapley Additive exPlanations |
| RMSE | Root Mean Square Error |
| CLCD | China Land Cover Dataset |
References
- Syvitski, J.P.; Kettner, A.J.; Overeem, I.; Hutton, E.W.; Hannon, M.T.; Brakenridge, G.R.; Day, J.; Vrsmarty, C.; Saito, Y.; Giosan, L.; et al. Sinking deltas due to human activities. Nat. Geosci. 2009, 2, 681–686. [Google Scholar] [CrossRef] [Scilit]
- Nicholls, R.J.; Cazenave, A. Sea-level rise and its impact on coastal zones. Science 2010, 328, 1517–1520. [Google Scholar] [CrossRef] [Scilit]
- Dixon, T.H.; Amelung, F.; Ferretti, A.; Novali, F.; Rocca, F.; Dokka, R.; Sella, G.; Kim, S.-W.; Wdowinski, S.; Whitman, D. Subsidence and flooding in New Orleans. Nature 2006, 441, 587–588. [Google Scholar] [CrossRef] [Scilit]
- Qi, S.; Liu, H. Natural and anthropogenic hazards in the Yellow River Delta, China. Nat. Hazards 2016, 85, 1907–1911. [Google Scholar] [CrossRef] [Scilit]
- Xue, C. Historical changes in the Yellow River delta, China. Mar. Geol. 1993, 113, 321–330. [Google Scholar] [CrossRef] [Scilit]
- Fan, H.; Huang, H.J.; Zeng, T.Q.; Wang, K.R. River mouth bar formation, riverbed aggradation and channel migration in the modern Huanghe (Yellow) River delta, China. Geomorphology 2006, 74, 124–136. [Google Scholar] [CrossRef] [Scilit]
- Higgins, S.; Overeem, I.; Tanaka, A.; Syvitski, J.P.M. Land subsidence at aquaculture facilities in the Yellow River delta, China. Geophys. Res. Lett. 2013, 40, 3898–3902. [Google Scholar] [CrossRef] [Scilit]
- Zhang, B.; Wang, R.; Deng, Y.; Ma, P.; Lin, H.; Wang, J. Mapping the Yellow River Delta land subsidence with multitemporal SAR interferometry by exploiting both persistent and distributed scatterers. ISPRS J. Photogramm. Remote Sens. 2019, 148, 157–173. [Google Scholar] [CrossRef] [Scilit]
- Li, P.; Wang, G.; Liang, C.; Wang, H.; Li, Z. InSAR-Derived Coastal Subsidence Reveals New Inundation Scenarios Over the Yellow River Delta. IEEE J. Sel. Top. Appl. Earth Obs. Remote Sens. 2023, 16, 8431–8441. [Google Scholar] [CrossRef] [Scilit]
- Du, T.; Huang, H.; Bie, J. Xiandai huanghe sanjiaozhou dimian chenjiang dui zhouti yanbian de yingxiang [Land subsidence in the modern Yellow River Delta and its impacts upon its evolvement]. Haiyang Kexue 2011, 35, 78–84. (In Chinese) [Google Scholar]
- Huang, H.; Liu, Y.; Zhang, Y. Huanghe sanjiaozhou dimian chenjiang jili yu haian fanghu [Mechanism of land subsidence and coastal protection in the Yellow River Delta]. Haian Gongcheng 2022, 41, 96–109. (In Chinese) [Google Scholar]
- Liu, G.; Huang, H.; Du, T.; Bie, J.; Chen, J. Huanghe sanjiaozhou diqu dimian chenjiang qudong yinsu yanjiu [Driving factors of land subsidence in the Yellow River Delta region]. Haiyang Kexue 2011, 35, 43–50. (In Chinese) [Google Scholar]
- Ning, R.; Wang, D.; Tian, X.; Zhang, Y.; Zhou, Z.; Luo, F. Huanghe sanjiaozhou de dimian chenjiang fenxi yi ji haishui yanmo yugu [Analysis of land subsidence and seawater inundation projection in the Yellow River Delta]. Adv. Earth Sci. 2023, 38, 296–308. [Google Scholar] [CrossRef]
- Zhang, Q.; Zhao, Z.; Jia, L.; Huo, W.; Gao, R. Surface Deformation Monitoring and Driving Force Analysis in the Yellow River Delta Based on PS-INSAR Technology. ISPRS Ann. Photogramm. Remote Sens. Spat. Inf. Sci. 2022, X-3/W1-2022, 193–198. [Google Scholar] [CrossRef] [Scilit]
- Liu, P.; Li, Q.; Li, Z.; Hoey, T.; Liu, Y.; Wang, C. Land Subsidence over Oilfields in the Yel-low River Delta. Remote Sens. 2015, 7, 1540–1564. [Google Scholar] [CrossRef] [Scilit]
- Liu, Y.; Huang, H.; Liu, Y.; Bi, H. Linking land subsidence over the Yellow River delta, China, to hydrocarbon exploitation using multi-temporal InSAR. Nat. Hazards 2016, 84, 271–291. [Google Scholar] [CrossRef] [Scilit]
- Ge, P.; Chen, M.; Tomás, R.; Liu, H.; Fan, K.; Cheng, X.; Fu, X.; Wang, S. Insights into land defor-mation processes in the Yellow River Delta (China) from synthetic aperture radar interferometry time series and machine learning. Adv. Space Res. 2025, 77, 4527–4551. [Google Scholar] [CrossRef] [Scilit]
- Zhang, Y.; Liu, Y.; Zhang, X.; Huang, H.; Qin, K.; Bai, Z.; Zhou, X. Correlation Analysis between Land-Use/Cover Change and Coastal Subsidence in the Yellow River Delta, China: Reviewing the Past and Prospecting the Future. Remote Sens. 2021, 13, 4563. [Google Scholar] [CrossRef] [Scilit]
- Wang, H.; Zeng, Q.; Jiao, J.; Chen, J. InSAR Time Series Analysis Technique Combined with Sequential Adjustment Method for Monitoring of Surface Deformation. Acta Sci. Nat. Univ. Pekin. 2021, 57, 241–249. [Google Scholar]
- Zhang, S.; Chen, B.; Gong, H.; Meng, D.; Wang, X.; Zhou, C.; Lei, K.; Wang, H.; Kang, F.; Yang, Y. Assessing Subsidence and Coastal Inundation in the Yellow River Delta Using TS-InSAR and Active Inundation Algorithm. Remote Sens. 2025, 17, 2942. [Google Scholar] [CrossRef] [Scilit]
- Zhang, J.-Z.; Huang, H.; Bi, H. Land subsidence in the modern Yellow River Delta based on InSAR time series analysis. Nat. Hazards 2014, 75, 2385–2397. [Google Scholar] [CrossRef] [Scilit]
- Zhang, Y.; Si, Z.; Lin, X.; Zhang, Z.; Chu, H.; Cao, C.; Liu, Y.; Huang, H.; Huang, B.; Bai, Z.; et al. Time-series InSAR reveals new insights into land subsidence in the Yellow River Delta, China. Mar. Georesour. Geotechnol. 2024, 43, 396–405. [Google Scholar] [CrossRef] [Scilit]
- Yang, X.; Yao, Y.; Jia, C.; Yang, T. Spatiotemporal prediction of land subsidence and its response patterns to different aquifers in coastal areas. Ocean Coast. Manag. 2024, 253, 107148. [Google Scholar] [CrossRef] [Scilit]
- Liu, Y.; Zhang, Y.; Zhao, F.; Ding, R.; Zhao, L.; Niu, Y.; Qu, F.; Ling, Z. Multi-Source SAR-Based Surface Deformation Monitoring and Groundwater Relationship Analysis in the Yellow River Delta, China. Remote Sens. 2023, 15, 3290. [Google Scholar] [CrossRef] [Scilit]
- Shi, C.X.; Zhang, D.; You, L.Y.; Li, B.Y.; Zhang, Z.L.; Zhang, O.Y. Land subsidence as a result of sediment consolidation in the Yellow River delta. J. Coast. Res. 2007, 231, 173–181. [Google Scholar] [CrossRef] [Scilit]
- Zhang, Y.; Huang, H.; Liu, Y.; Liu, Y.; Bi, H. Spatial and temporal variations in subsidence due to the natural consolidation and compaction of sediment in the Yellow River delta, China. Mar. Georesour. Geotechnol. 2018, 37, 152–163. [Google Scholar] [CrossRef] [Scilit]
- Liu, Y.; Du, T.; Huang, H.; Liu, Y.; Zhang, Y. Estimation of sediment compaction and its rela-tionship with river channel distributions in the Yellow River delta, China. CATENA 2019, 182, 104113. [Google Scholar] [CrossRef] [Scilit]
- Tang, Z.; Ning, R.; Wang, D.; Tian, X.; Bi, X.; Ning, J.; Zhou, Z.; Luo, F. Projections of land use/cover change and habitat quality in the model area of Yellow River delta by coupling land subsidence and sea level rise. Ecol. Indic. 2024, 158, 111394. [Google Scholar] [CrossRef] [Scilit]
- Liu, Y.; Huang, H.-J. Characterization and Mechanism of Regional Land Subsidence in the Yellow River Delta, China. Nat. Hazards 2013, 68, 687–709. [Google Scholar] [CrossRef] [Scilit]
- The Data Set is Provided by Geospatial Data Cloud Site, Computer Network Information Center, Chinese Academy of Sciences. Available online: http://www.gscloud.cn (accessed on 28 November 2025).
- Shandong Provincial Department of Natural Resources. Basic Version of Dongying City (4-Fold, 1:310,000) [Map]; Review No. Lu SG (2024) 035; Shandong Provincial Department of Natural Resources: Jinan, China, 2024. Available online: http://dnr.shandong.gov.cn (accessed on 6 November 2025).
- Teng, Y.; Zhu, H.; Feng, J. The status quo research of exploitation and utilization of underground brine resources in Yellow River Delta. In Proceedings of the 2016 International Conference on Economics, Social Science, Arts, Education and Management Engineering; Atlantis Press: Dordrecht, The Netherlands, 2016; pp. 461–468. [Google Scholar] [CrossRef] [Scilit]
- Hou, G.; Gao, M.; Ye, S.; Zhao, G. Source of salt and the salinization process of shallow groundwater in the Yellow River Delta. Earth Sci. Front. 2022, 29, 145–154. [Google Scholar] [CrossRef]
- Wang, W.; Cheng, X.; Gao, X.; Li, C.; Liu, Y. Study on the causes of groundwater quality in the Yellow River Delta area: Taking Gudao Town, Dongying City, Shandong Province as an example. Earth Sci. Front. 2025, 32, 469–483. [Google Scholar] [CrossRef]
- Yang, J.; Huang, X. The 30 m annual land cover dataset and its dynamics in China from 1990 to 2019. Earth Syst. Sci. Data 2021, 13, 3907–3925. [Google Scholar] [CrossRef] [Scilit]
- Yuan, R.; Song, X.; Liu, G. Study on recharge of precipitation infiltration in the upper alluvial plain of the modern Yellow River Delta. J. Nat. Resour. 2010, 25, 1777–1785. [Google Scholar] [CrossRef]
- Zhang, C.; Huang, C.; He, Y.; Liu, Q.; Li, H.; Wu, C.; Liu, G. Dynamic of shallow groundwater depth and its spatiotemporal response to precipitation in the Yellow River Delta. Hydrogeol. Eng. Geol. 2020, 47, 21–30. [Google Scholar] [CrossRef]
- Chang, M.; Shi, J.; Ye, S.; Wang, X.; Li, G. Dynamic characteristics and causes of shallow groundwater level intra-annual changes in the Yellow River Delta. Mar. Sci. 2021, 45, 20–31. [Google Scholar]
- Peng, S. 1-km Monthly Precipitation Dataset for China (1901–2024) [Data Set]. National Tibetan Plateau Data Center, 2025. Available online: https://data.tpdc.ac.cn/zh-hans/data/faae5f4e-8b0b-4e6f-9379-4fbf7c1b8d5e/ (accessed on 23 April 2026).
- Prokhorenkova, L.; Gusev, G.; Vorobev, A.; Dorogush, A.V.; Gulin, A. CatBoost: Unbiased boosting with categorical features. arXiv 2018, arXiv:1706.09516. [Google Scholar]
- Chen, T.; Guestrin, C. XGBoost: A Scalable Tree Boosting System. In Proceedings of the 22nd ACM SIGKDD International Conference on Knowledge Discovery and Data Mining; ACM: New York, NY, USA, 2016; pp. 785–794. [Google Scholar] [CrossRef] [Scilit]
- Breiman, L. Random Forests. Mach. Learn. 2001, 45, 5–32. [Google Scholar] [CrossRef] [Scilit]
- Luo, Y.; Su, S. SpatioTemporal Random Forest and SpatioTemporal Stacking Tree: A novel spatially explicit ensemble learning approach to modeling non-linearity in spatiotemporal non-stationarity. Int. J. Appl. Earth Obs. Geoinf. 2025, 136, 104315. [Google Scholar] [CrossRef] [Scilit]
- Guo, Y.; vanden Broucke, S. Coordinates are just features: Rethinking spatial dependence in geospatial modeling. In Proceedings of the 17th International Conference on Advanced Geographic Information Systems, Applications, and Services (GEOProcessing 2025), Nice, France, 18–22 May 2025. [Google Scholar]
- Guo, X. Research on Anti-Seepage Technology of Salt Pan Floor. Master’s Thesis, Wuhan Institute of Technology, Wuhan, China, 2018. Available online: https://kns.cnki.net/kcms2/article/abstract?v=Z3g7xh44_Zgl9rVBUKvhduknuOQDZmDiDuaZA8Kaa1ZXHRE8vnWI6pfJZ6H0XJomzPLOx6YmfO9j90AMUYXdGZkdJ6on0ZD-po_cO4BqK_YK3Y_F9fga69vs11bEraile_3qbrb56tjV-s4N4m8buvVdLZIqfggKqvhhkvGJJ8-_v6gmVREoAQ==&uniplatform=NZKPT&language=CHS (accessed on 23 April 2026).
- Li, C.; Zhang, J.; Lin, Q.; Zhang, Y.; Fang, X. Salinization anti-seepage and strength properties of saline soil. J. Univ. Sci. Technol. Beijing 2008, 30, 1211–1216. [Google Scholar]
- He, Q.; Li, Q.; Chen, Y.; Zhao, R.; Li, W.; Wu, J.; Tang, J.; Liu, D.; Dai, S.; Zhou, Z.; et al. Experimental Study on Brine Evaporation and Material Research of Salt Pan Floor in Biele Tan. China National Chemical Engineering Changsha Design & Research Institute, 2000. Available online: https://kns.cnki.net/kcms2/article/abstract?v=Z3g7xh44_Zil2ex4odzsm2U_RXxHqRfbmCh4pClo2ymCe4cgUUrcKkFbImLD67tAMHFGncaU-QhfanaSwDBDL_QThsavo6pZTWU4hokB1FrUMWOkd_SA4aPYSXBYcluGr7my8N2e9yO7uWT53_VXyijlb6WrgnKjUcenBAIlS9FZ7gCC3t47Lw==&uniplatform=NZKPT&language=CHS (accessed on 23 April 2026).
- Terzaghi, K. Theoretical Soil Mechanics; John Wiley & Sons: New York, NY, USA, 1943. [Google Scholar]
- Biot, M.A. General theory of three-dimensional consolidation. J. Appl. Phys. 1941, 12, 155–164. [Google Scholar] [CrossRef] [Scilit]
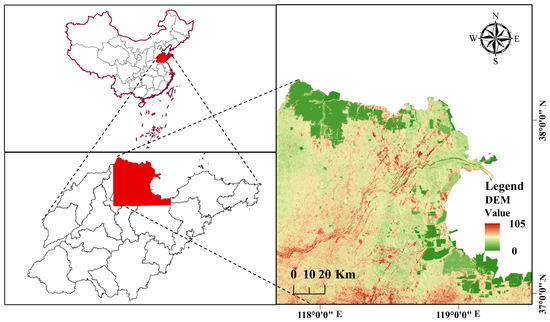
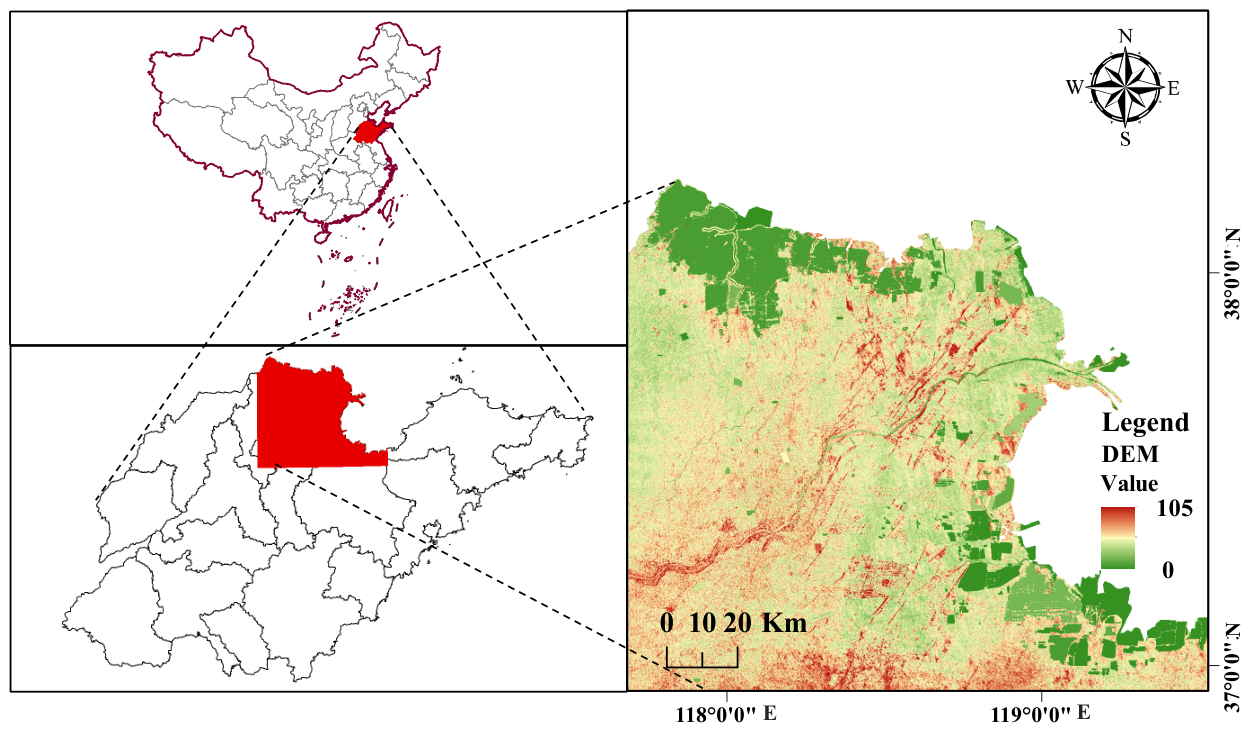
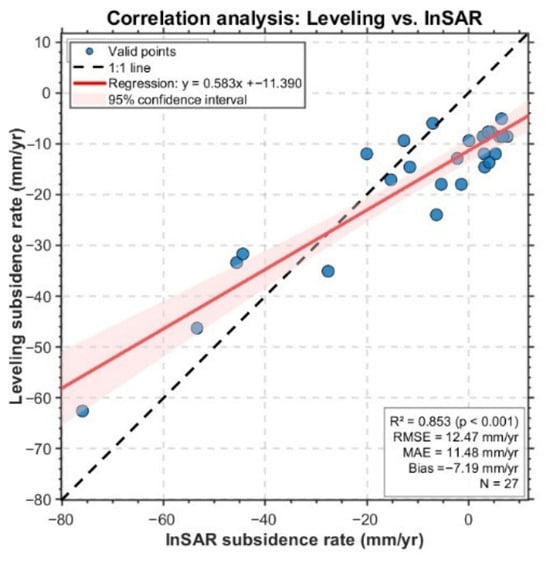
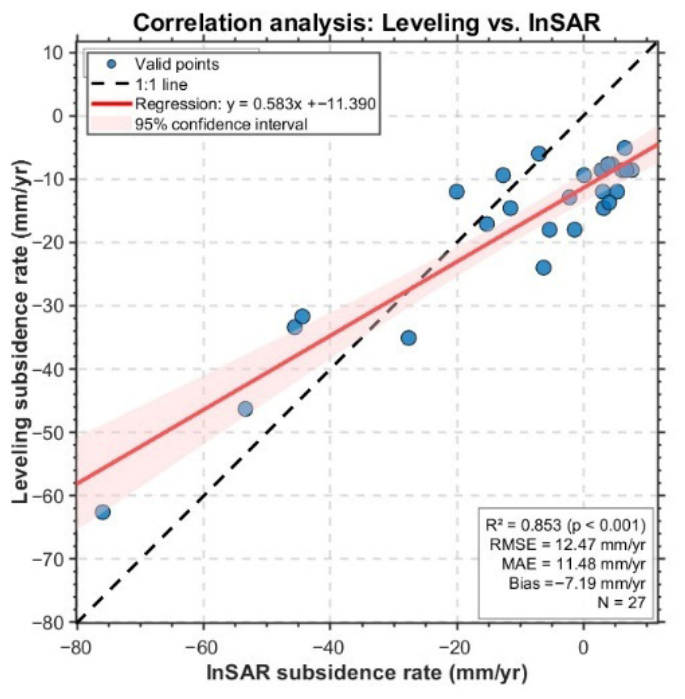
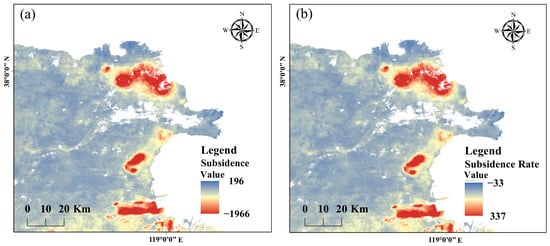
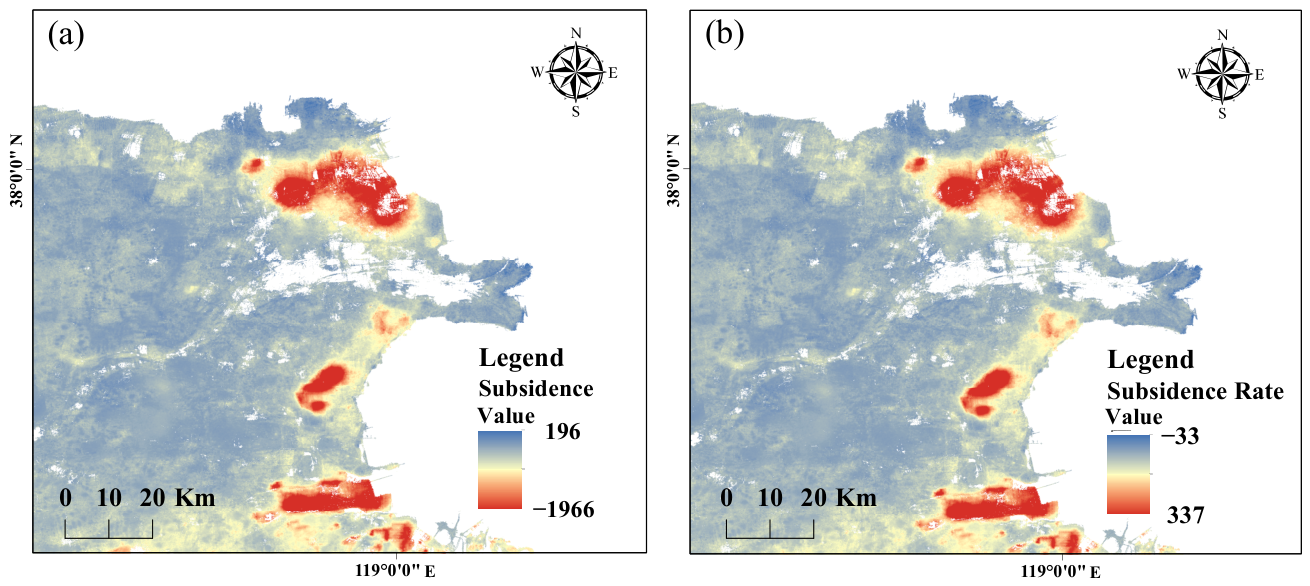
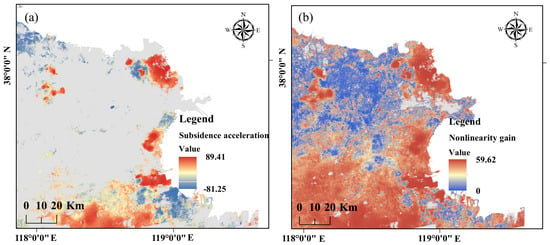
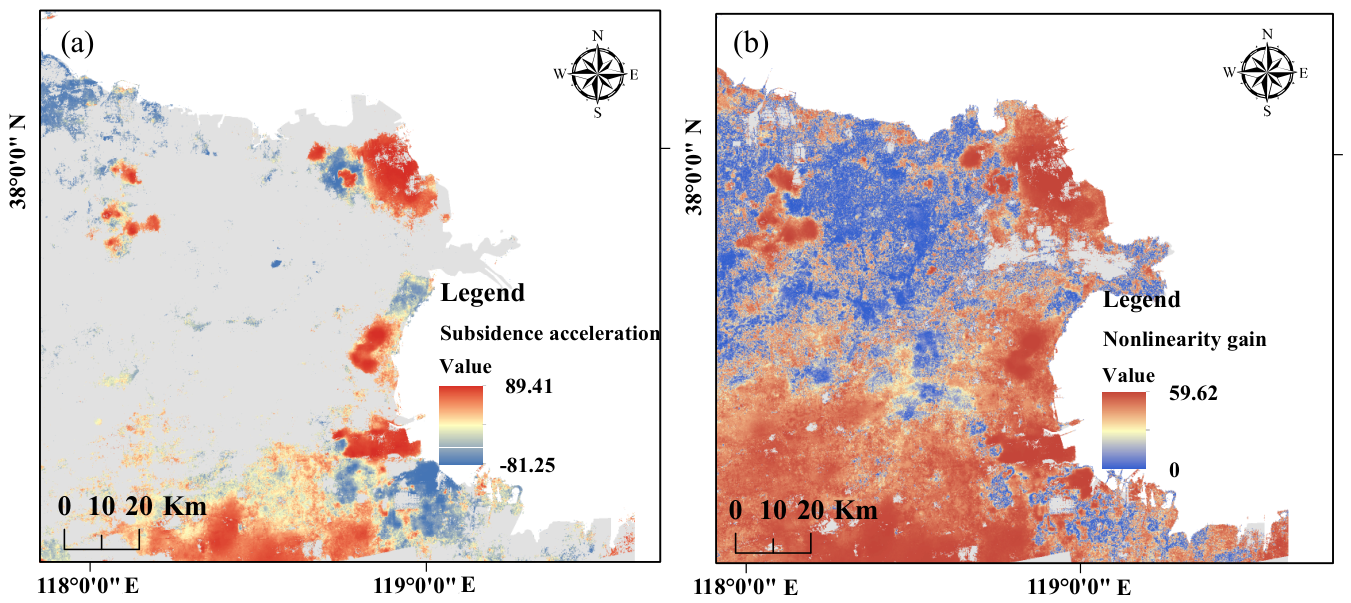
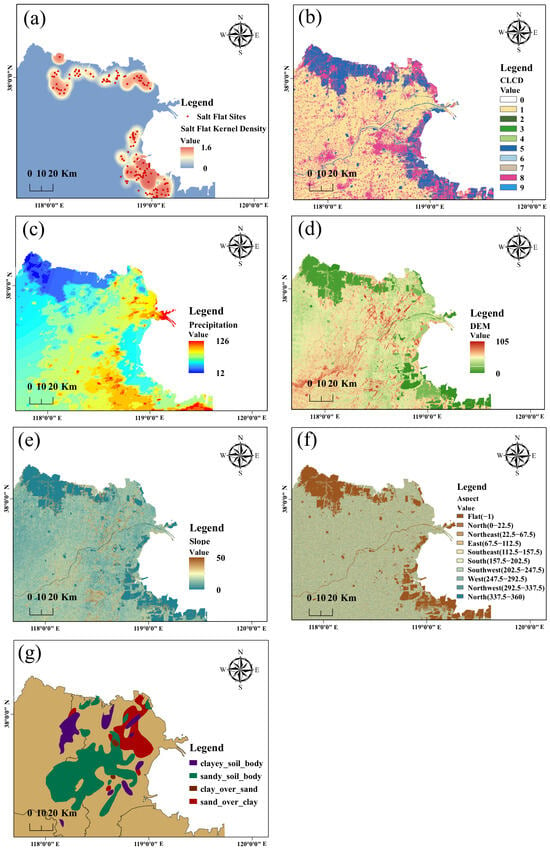
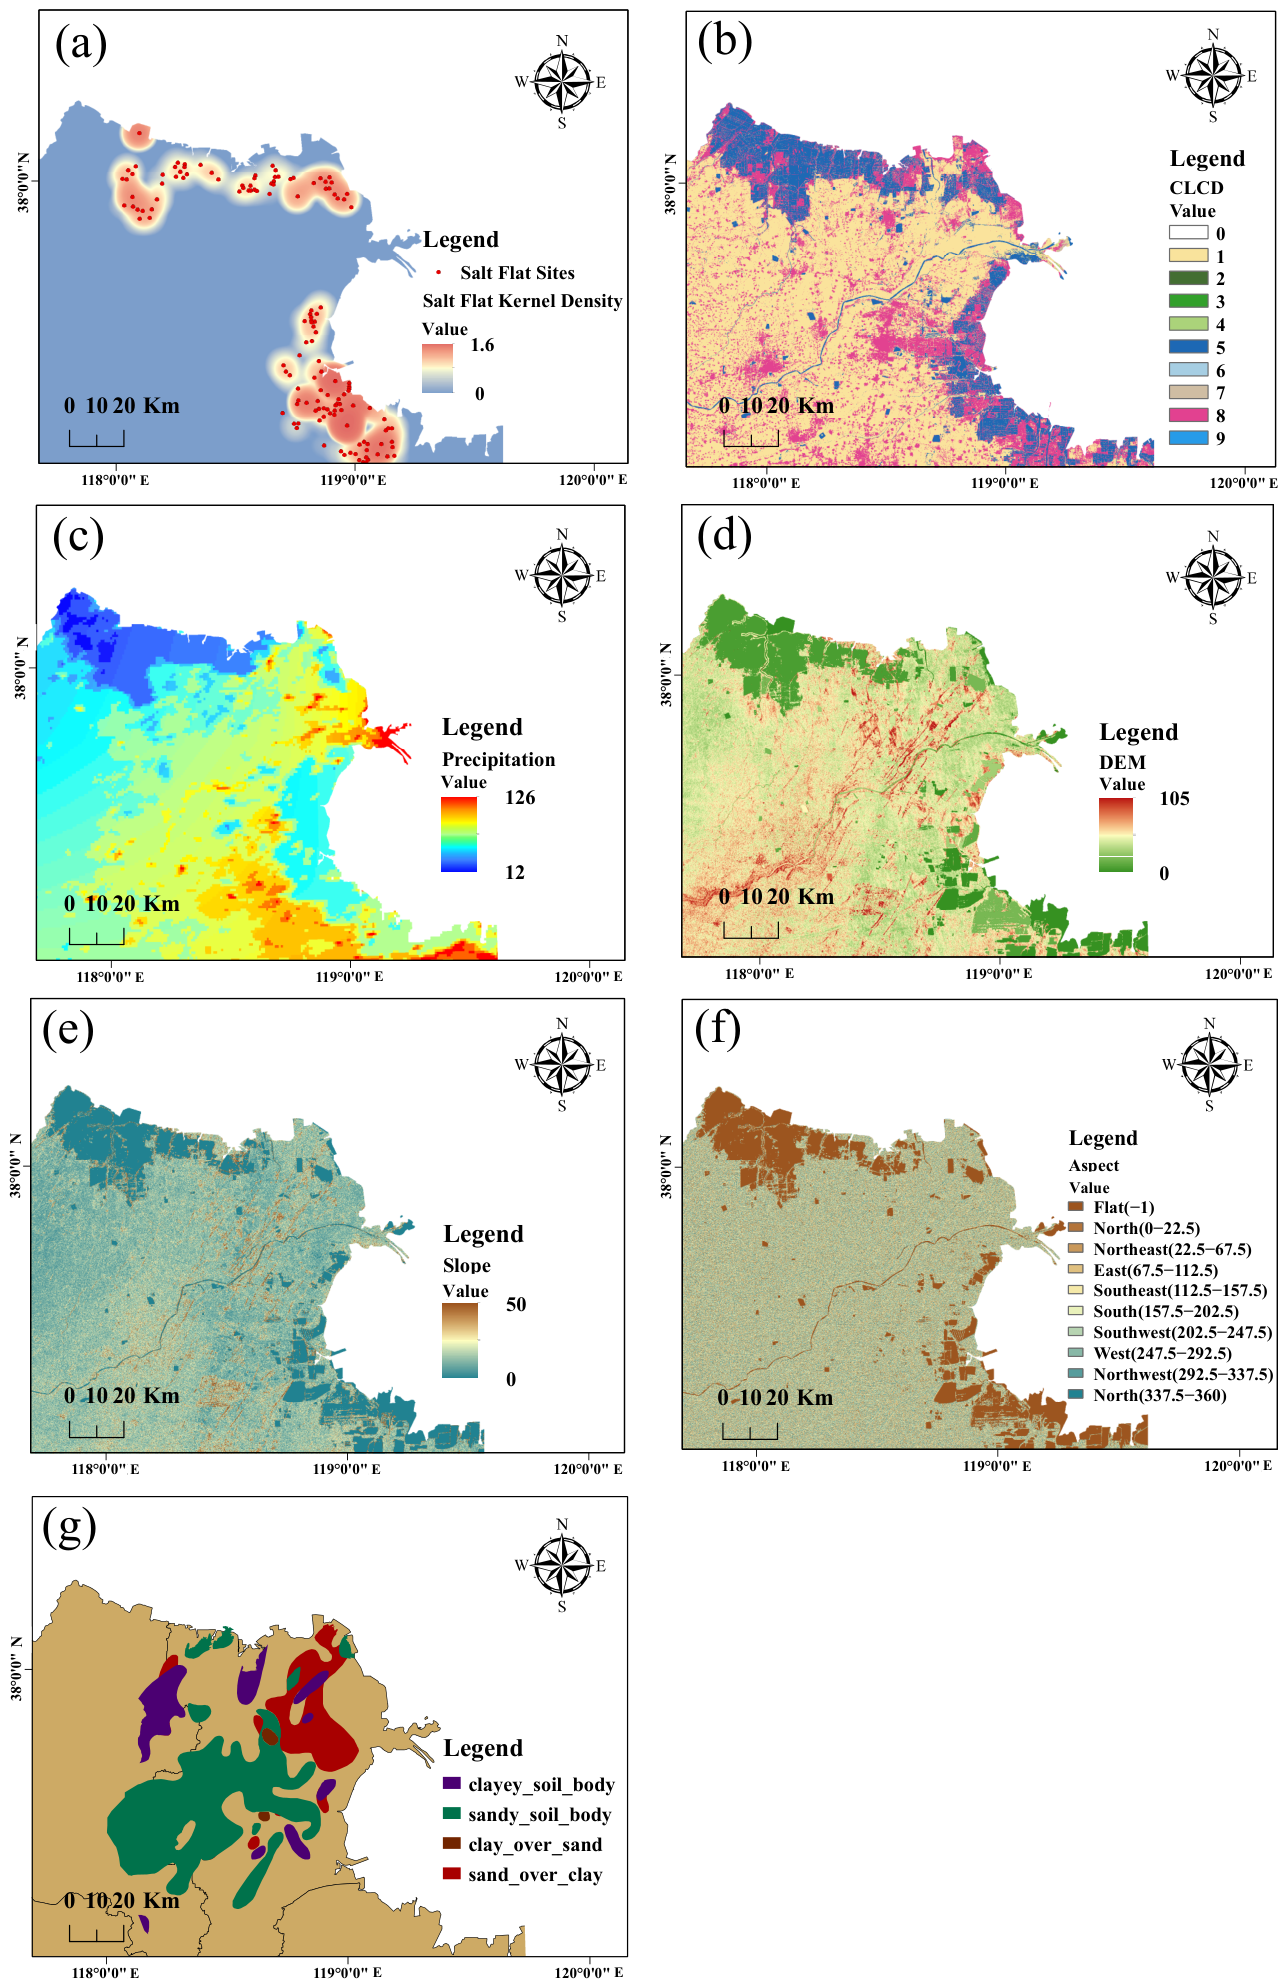
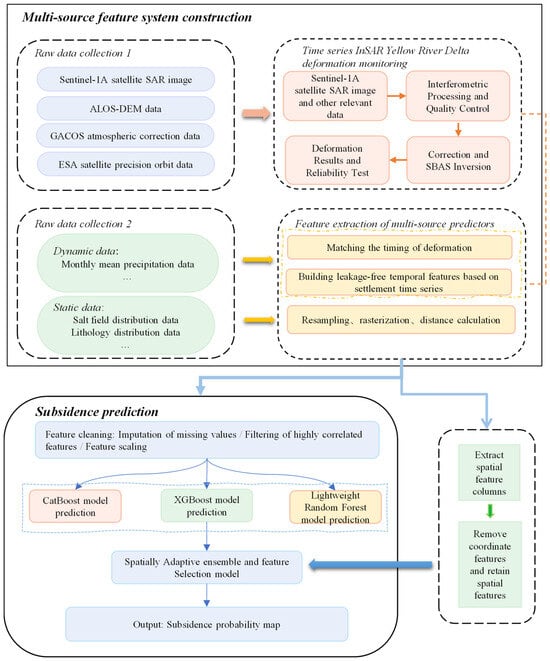
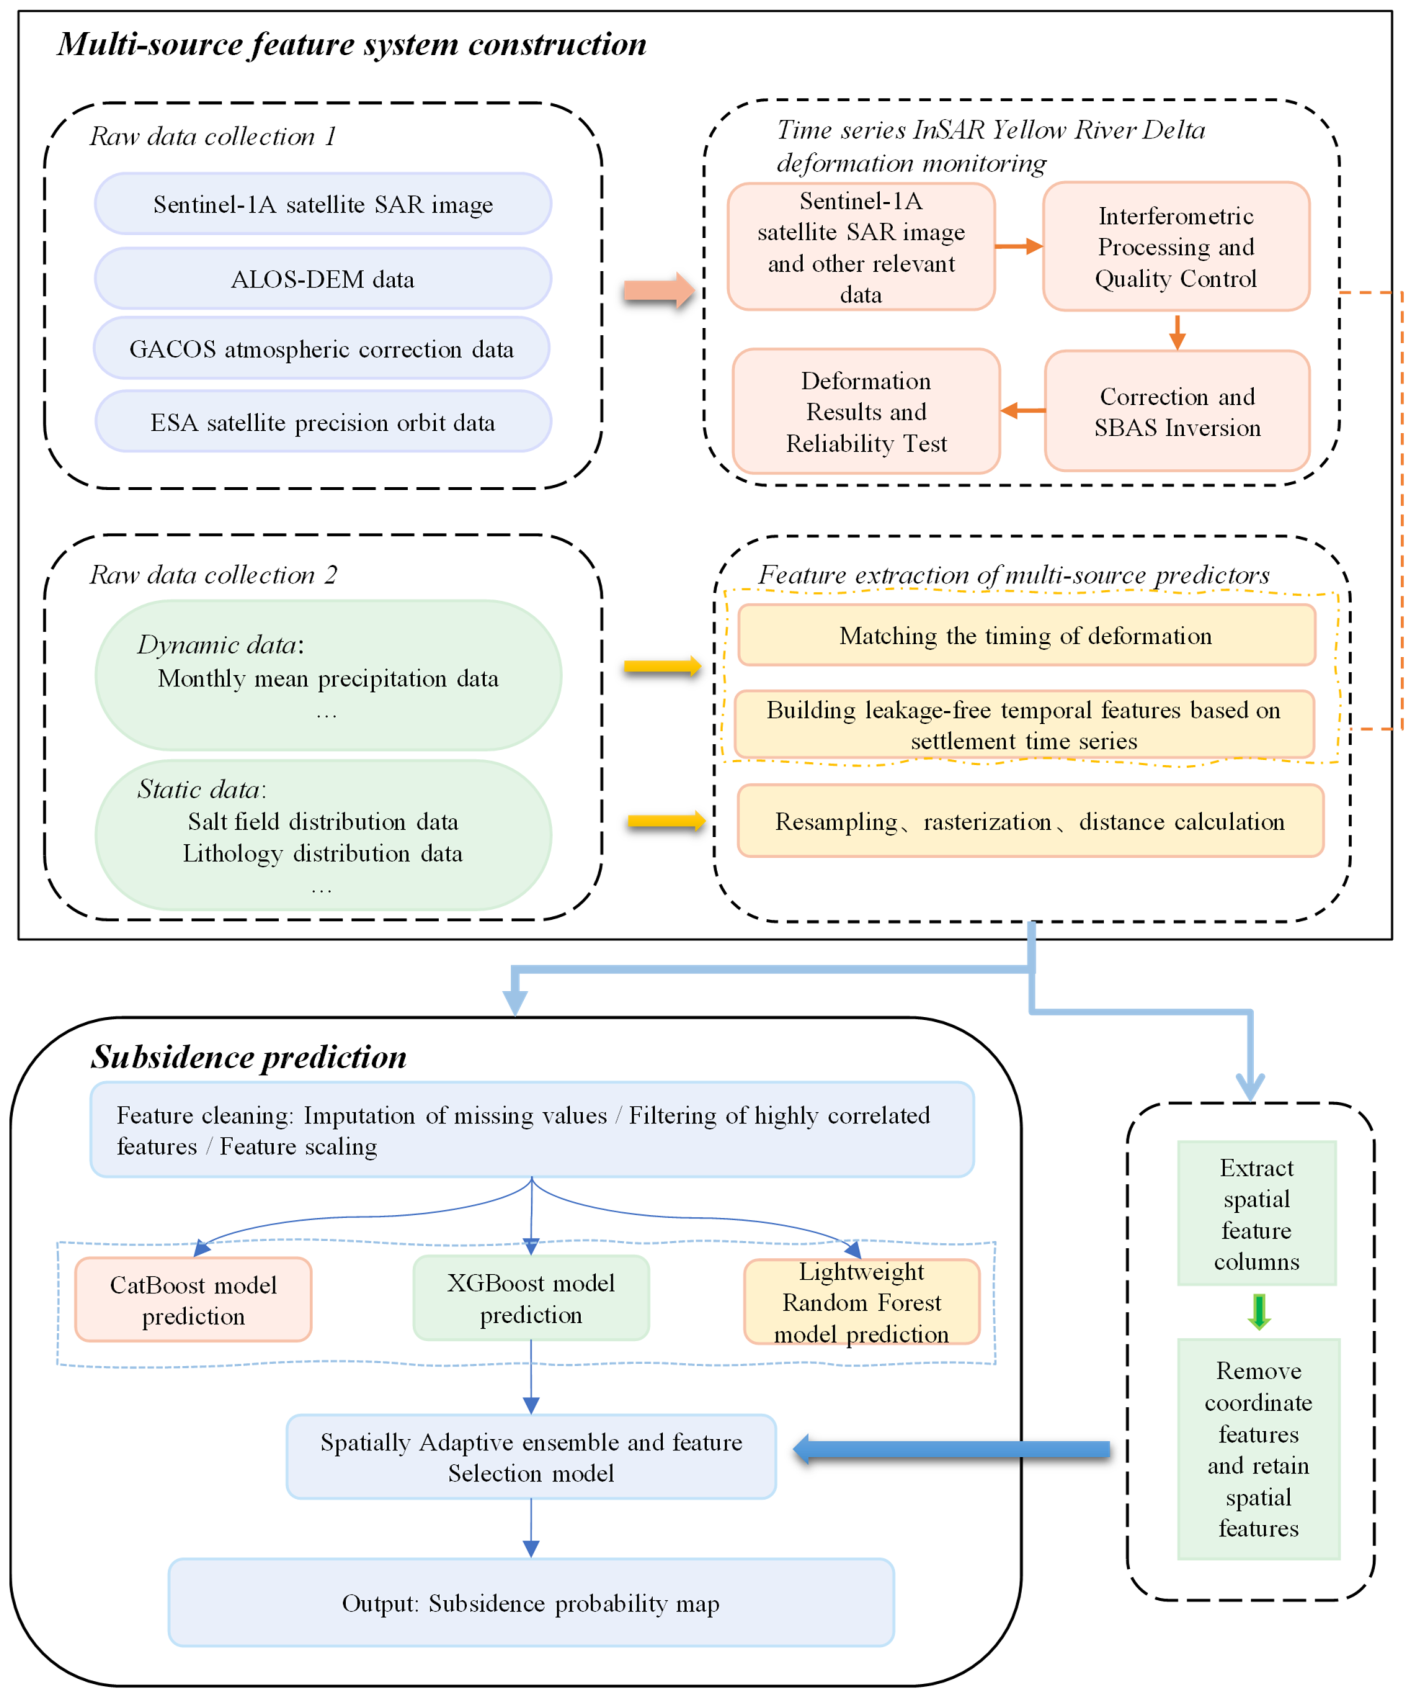
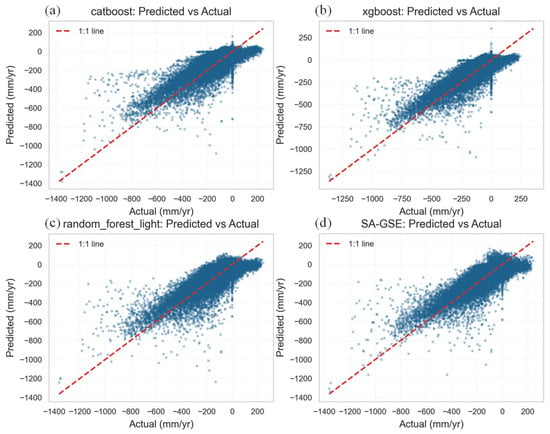
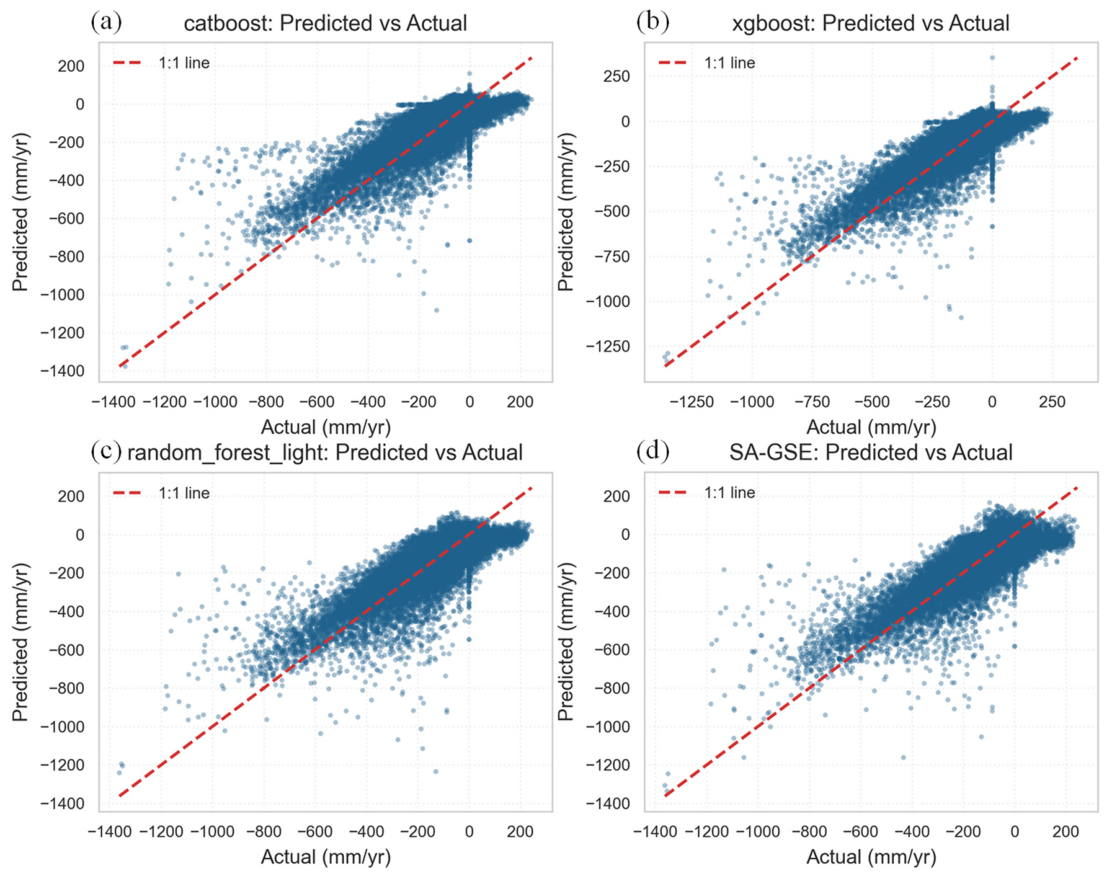
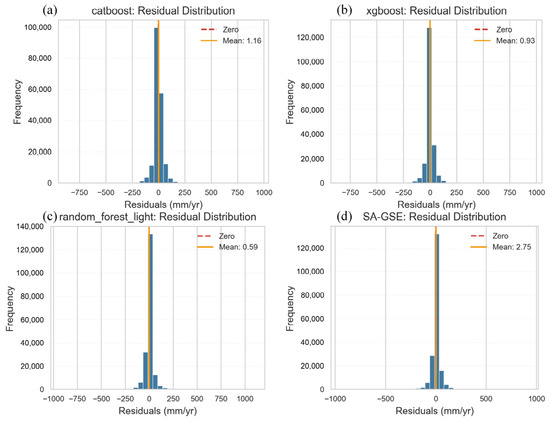
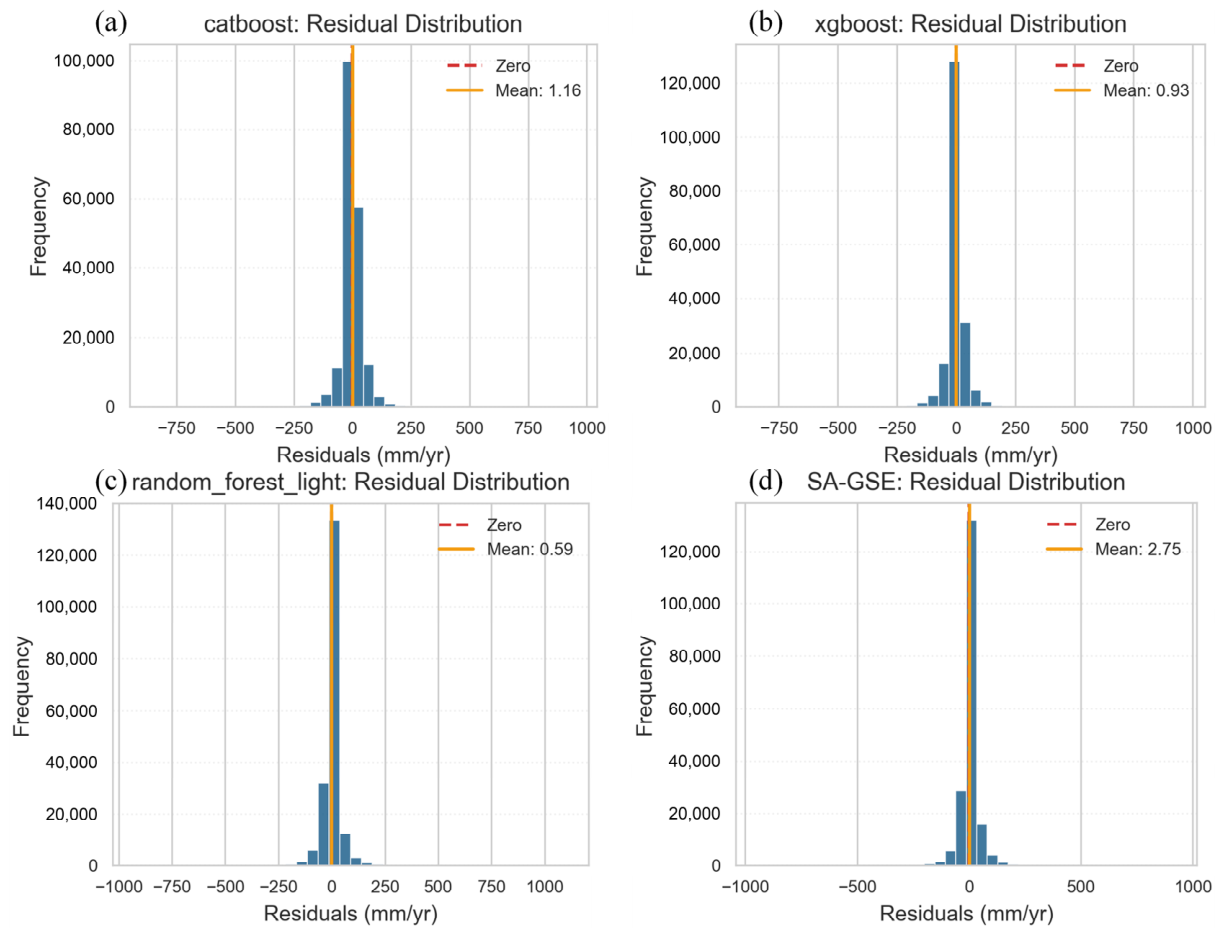
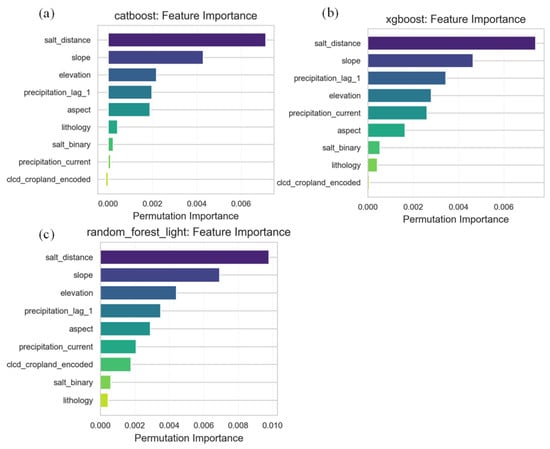
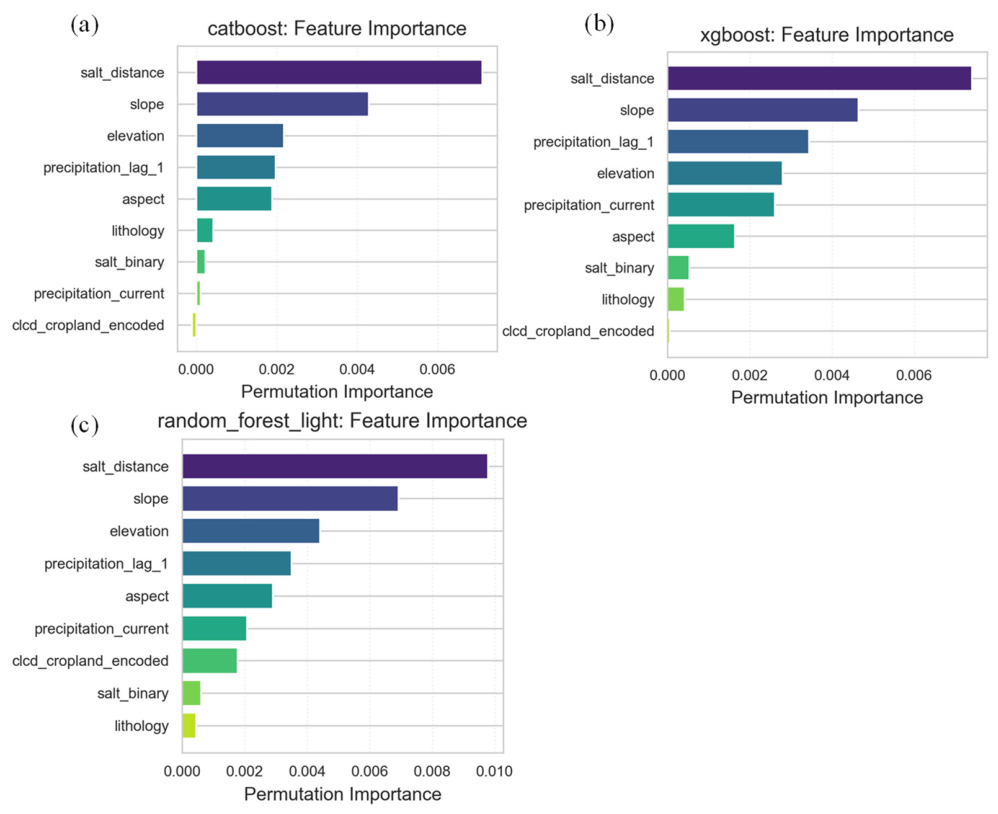
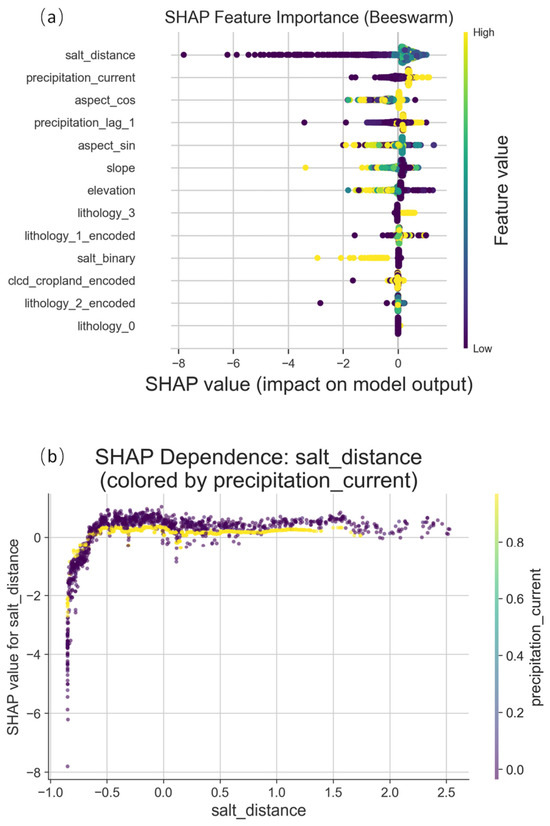
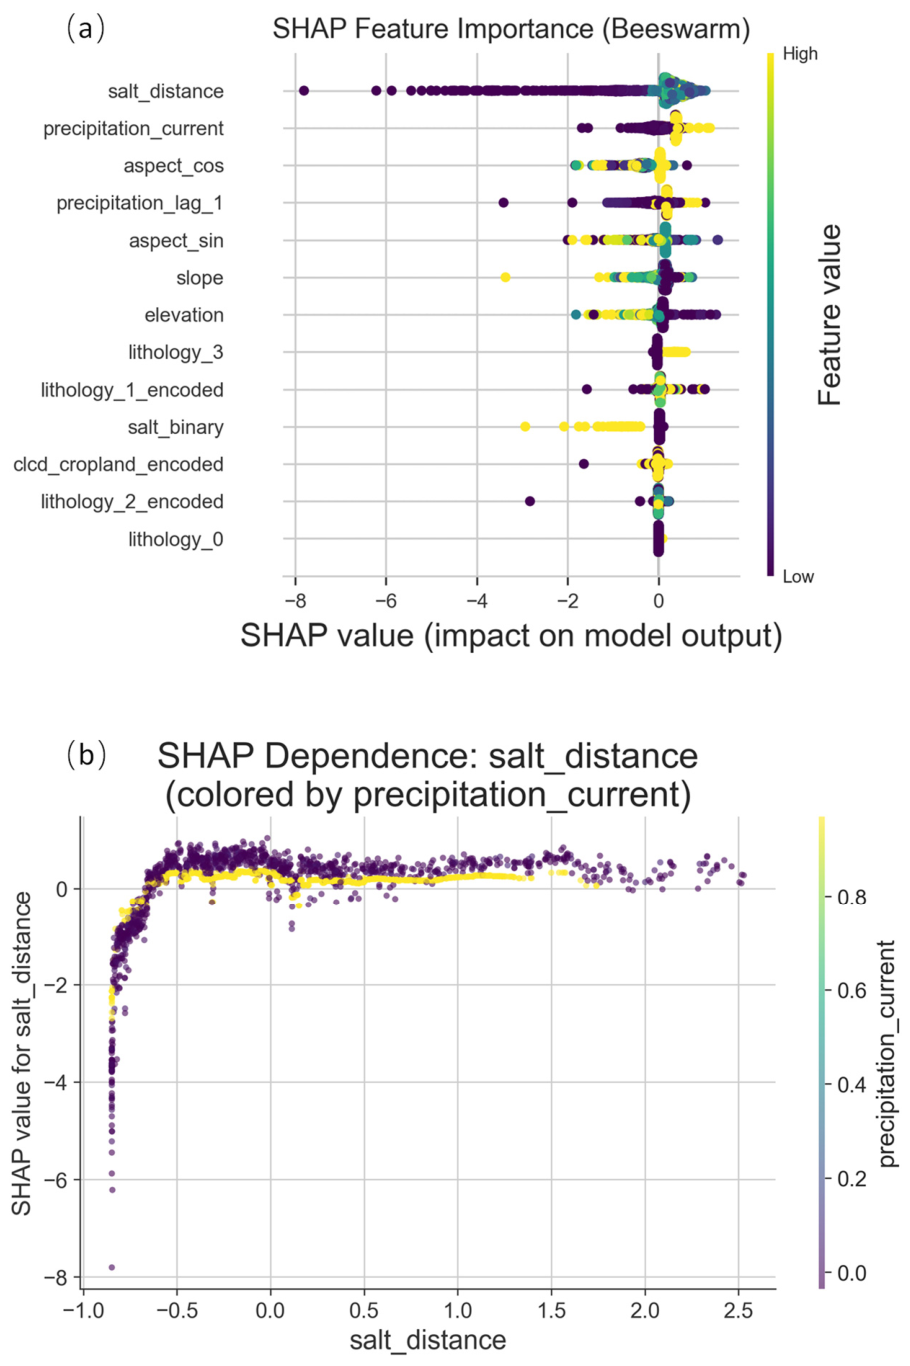
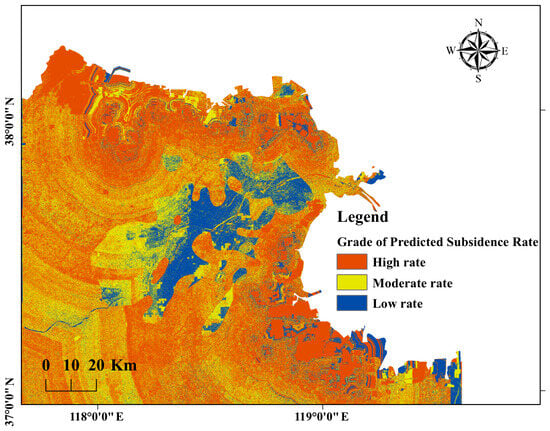
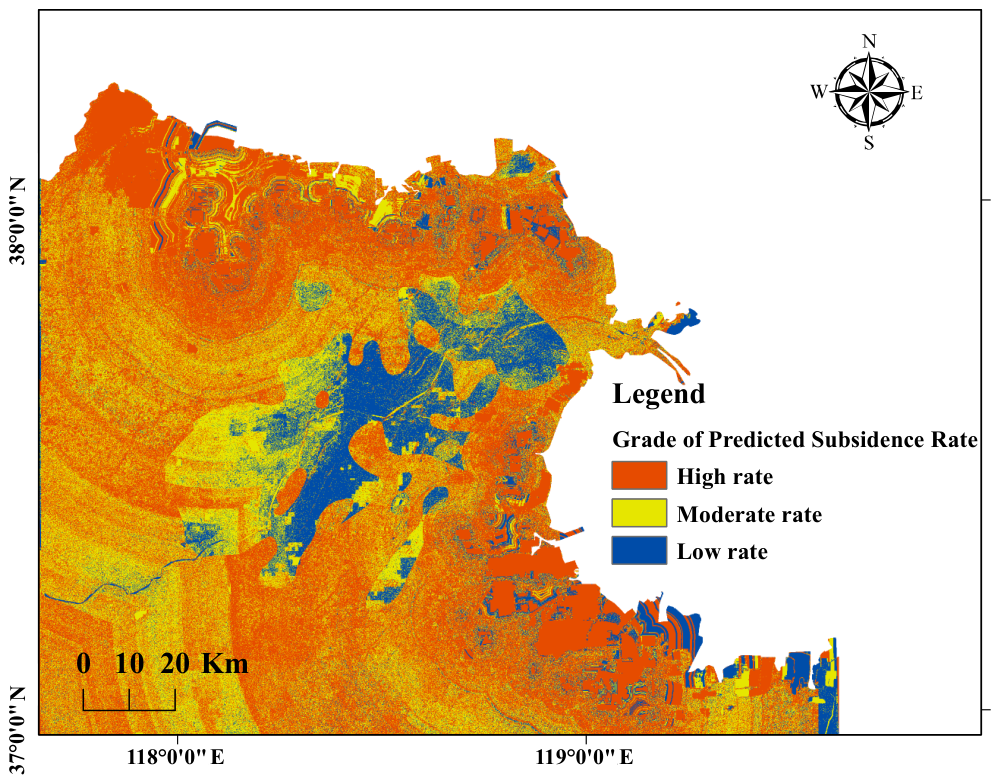

Disclaimer/Publisher’s Note: The statements, opinions and data contained in all publications are solely those of the individual author(s) and contributor(s) and not of MDPI and/or the editor(s). MDPI and/or the editor(s) disclaim responsibility for any injury to people or property resulting from any ideas, methods, instructions or products referred to in the content. |
© 2026 by the authors. Licensee MDPI, Basel, Switzerland. This article is an open access article distributed under the terms and conditions of the Creative Commons Attribution (CC BY) license.