Article

Monitoring Post-Mining Surface Uplift Induced by Mine Flooding Using EGMS and PSInSAR: A Case Study from the Upper Silesian Coal Basin (Poland)


by
Violetta Sokoła-Szewioła
1,
Paweł Sopata
2 and
Dawid Mrocheń
3,*
1
Faculty of Mining, Safety Engineering and Industrial Automation, Silesian University of Technology, 44-100 Gliwice, Poland
2
Faculty of Geo-Data Science, Geodesy, and Environmental Engineering, AGH University of Krakow, 30-059 Kraków, Poland
3
Strata Mechanics Research Institute, Polish Academy of Sciences, 30-059 Kraków, Poland
*
Author to whom correspondence should be addressed.
Remote Sens. 2026, 18(10), 1548; https://doi.org/10.3390/rs18101548
Submission received: 17 March 2026 / Revised: 28 April 2026 / Accepted: 9 May 2026 / Published: 13 May 2026

Highlights

What are the main findings?
  • The study confirmed a slow, long-term post-mining surface uplift trend in the area of the closed “Kazimierz-Juliusz” coal mine, with maximum vertical displacement reaching approximately 3.5 cm over nearly five years.
  • Quantitative validation demonstrated a high level of agreement between satellite data (EGMS) and precise leveling, with a mean absolute difference below 1 mm.
What are the implications of the main findings?
  • The research proves that satellite-based radar interferometry, particularly EGMS products, is a highly reliable tool for monitoring low-magnitude, spatially smooth deformation processes in post-mining areas.
  • The detected millimeter-scale uplift rates (approx. 7–9 mm/year) are considered low-magnitude and do not pose a significant threat to buildings or technical infrastructure on the surface.

Abstract

This study investigates vertical surface displacements in an area previously impacted by extensive underground hard coal extraction, specifically focusing on the closed “Kazimierz-Juliusz” mine in the Upper Silesian Coal Basin (Poland). The cessation of mining operations and formal decommissioning do not necessarily signify the termination of ground instability; rather, the discontinuation of mine water pumping triggers a progressive groundwater rebound within the rock mass. This hydrogeological shift leads to a redistribution of stresses in the geological structure, inducing deformation processes that manifest as surface uplift. This research aims to characterize the temporal evolution and magnitude of post-closure surface elevation changes by integrating satellite radar interferometry with conventional geodetic surveys. The analysis, spanning a 28-month observation period, utilizes both Persistent Scatterer Interferometry (PSInSAR) and European Ground Motion Service (EGMS) data, complemented by precise geometric leveling. The results reveal a low-magnitude deformation process, with detected uplift rates reaching approximately 1 cm/year. The synergistic integration of InSAR-based monitoring and classical geodesy allowed for robust cross-validation, significantly enhancing the reliability of the findings both qualitatively and quantitatively.

1. Introduction

The termination of underground mineral extraction and the associated mine closure do not necessarily result in the immediate stabilization of the ground surface [1]. The post-mining geomechanical response depends on the scale of exploitation, the duration of mining activity, and the adopted closure strategy. In the case of large coal mines operating over several decades, continuous mine water drainage maintained throughout the extraction period leads to long-term dewatering of overlying saturated strata. This process results in the development of an extensive and typically shallow depression cone at the surface, representing a significant indirect hydrogeological impact of mining activity [2]. The cessation of mine water pumping during the closure phase initiates groundwater rebound, which directly influences ground surface stability. The inflow of water into the rock mass and the associated stress redistribution within geological structures induce gradual upward-directed vertical ground movements, commonly referred to as surface uplift [3,4,5]. This process is generally characterized by low deformation rates and a long temporal horizon measured in years or even decades [6]. Under specific hydrogeological conditions, mine flooding may also be accompanied by induced seismicity [7,8], as well as sinkhole appearance. Recent studies [9] have further emphasized the importance of hydro-mechanical coupling processes, particularly in cases where flooding occurs close to the land surface. This phenomenon significantly increases the risk of sinkhole occurrence, which results from increased pore pressure weakening the overburden strata, coupled with groundwater-induced suffosion that destabilizes the rock mass.
Surface deformation in post-mining areas is monitored using conventional geodetic techniques, satellite-based Interferometric Synthetic Aperture Radar (InSAR), and airborne or terrestrial Light Detection and Ranging measurements (LiDAR) [10]. These methods are complementary. Precise levelling surveys provide high-accuracy, long-term observations often initiated during the operational phase of the mine and serve as a reference dataset for InSAR-based analyses. LiDAR surveys, in turn, offer high-resolution three-dimensional topographic data, enabling detailed characterization of surface morphology and the detection of localized deformation features, particularly in areas with complex terrain or limited radar coherence. In contrast, radar interferometry enables quasi-continuous spatial monitoring of deformation, which is particularly valuable in areas lacking dense ground control networks [11]. Advanced time-series InSAR techniques are widely applied in post-mining monitoring [12,13,14], including Persistent Scatterer InSAR (PSInSAR) [15], the combined Persistent Scatterer and Distributed Scatterer (PS + DS) approach known as Enhanced Persistent Scatterer Interferometry (E-PSInSAR) [16], and the Small Baseline Subset method (SBAS) [17].
InSAR-detected uplift related to underground coal mine closure typically exhibits cumulative displacements on the order of several centimeters over multi-annual periods, locally exceeding a dozen centimeters. Deformation rates commonly amount to several mm/year, while maximum velocities in some areas exceed 10 mm/year. For example, in the Campine Coal Basin (Belgium), maximum uplift rates between 1991 and 2022 reached up to 18 mm/year [18]. Along the French–German border in the Lorraine–Saar Basin, uplift rates of up to 5 mm/year were recorded within the first three years after the onset of mine flooding [19]. On the French side of the Lorraine Basin, where mining ceased in 2004, PSInSAR analyses based on Sentinel-1 data from 2014–2019 revealed uplift with maximum mean Line-of-Sight (LOS) velocities of approximately 9 mm/year [20]. The uplift rate was highest during the initial phase of the analyzed period and gradually decreased over time. In the Ahlen area of the Ruhr Basin (Germany), coal extraction ended in the early 2000s. Following mine closure and termination of pumping operations, groundwater levels progressively increased, resulting in measurable surface uplift. Data from the European Ground Motion Service (EGMS) indicate that, between 2015 and 2020, a distinct uplift zone developed in the Ahlen region, with maximum deformation rates approaching 20 mm/year [21]. In the South Wales Coalfield (United Kingdom), uplift associated with mine water level recovery reached up to 13 mm/year between 1992 and 1999 [22]. Similar findings were reported for the Northumberland and Durham coalfields in northern England [23], where surface deformation observed between 1995–2000 and 2002–2008 showed strong correlation with the flooding process. Residual subsidence observed after the cessation of mining gradually diminished following the onset of mine flooding. Uplift subsequently developed in areas that had previously experienced subsidence. The cumulative displacements recorded during the analyzed period did not exceed 40–50 mm, corresponding to annual deformation rates of up to 7.5 mm/year. After groundwater levels reached their target equilibrium, the uplift rate markedly decreased. Comparable magnitudes of uplift have been reported in Chinese coal mines. Uplift rates of up to 25 mm/year were documented in the Jiahe mine [24], while cumulative uplift reached 168 mm in the Xinzhuangzi mine. In the Xuzhou region [25], maximum uplift rates during the first five years after closure reached 29 mm/year, with cumulative uplift up to 135 mm. Similarly, for the Taiji and Guanshan coal mines [26], cumulative uplift of up to 65 mm was recorded between 2017 and 2021, approximately five years after dewatering operations had ceased in 2014. Despite numerous global examples, a notable research gap exists regarding the Upper Silesian Coal Basin (USCB), where the energy and climate transition has led to an accelerated mine closure process. This study represents one of the first documented cases in the USCB to provide a detailed analysis of the surface uplift process for the former Kazimierz-Juliusz coal mine, recorded using InSAR methods.
Similar phenomena have also been observed in underground mines extracting other types of mineral resources. One example is the former copper and anhydrite mining area in Lower Silesia (Poland), where extraction was conducted between 1944 and 2015. PSInSAR observations from 2014–2018 in the area of the former Lubichów mine revealed surface uplift of up to approximately 70 mm, with maximum vertical velocities reaching 28 mm/year. A temporal delay of approximately five months was also identified between the initiation of mine flooding and the onset of the surface deformation response [27]. In the same mining region, conventional geodetic observations along leveling lines were carried out during the flooding of the Konrad mine, which was closed in 2001. These measurements recorded maximum vertical displacements of approximately 90 mm between 2001 and 2008 [28]. Another example is the former zinc and lead mining area in the Olkusz region (Poland), where room-and-pillar extraction was conducted at depths of up to 120 m until 2020. Following mine closure, the dewatering system was shut down at the turn of 2021–2022. Analysis of EGMS satellite data from 2018–2023 revealed distinct uplift zones with deformation rates of 1–2 mm/year during the flooding process, spatially corresponding to the extent of the former depression cone. The maximum recorded uplift rates, reaching 3.6 mm/year, were observed in the vicinity of mine shafts, where the greatest groundwater level increase occurred during the analyzed period [29].
The reviewed studies demonstrate that post-mining uplift induced by groundwater rebound is a widespread and long-lasting phenomenon observed in numerous mining basins worldwide. Despite differences in geological settings, mining depth, and closure strategies, the deformation process typically exhibits low-to-moderate uplift rates followed by gradual attenuation over time. Although surface deformation in the Upper Silesian Coal Basin has been extensively investigated during active mining operations, detailed analyses of uplift processes associated with mine closure and controlled flooding remain relatively limited.
This study aims to analyze and quantify post-mining surface uplift in the area of the former Kazimierz-Juliusz coal mine by integrating regional EGMS products with local PSI time-series data complemented by precise leveling measurements. The integration of traditional geodetic measurements enabled the validation and accuracy assessment of EGMS interferometric data. PSI data were also utilized, which, despite being provided in the Line-of-Sight (LOS) geometry, allow for a qualitative assessment of the uplift phenomenon in terms of the scale and extent of surface deformation. Particular emphasis is placed on characterizing the temporal evolution of deformation, evaluating the consistency between satellite-based and ground-based observations, and assessing the reliability of radar-derived displacement estimates in the context of groundwater rebound. Consequently, the results obtained may serve as a benchmark for predicting the environmental and structural impacts of future mine closures and for assessing the potential consequences for other mining plants in the USCB region undergoing similar decommissioning processes.

2. Materials

The dataset used to investigate surface elevation changes in the post-mining area was derived from three sources. The first two consisted of satellite-based observations, while the third comprised results of precise leveling surveys conducted within the study area. The satellite component included both a time series of radar scenes acquired by the European Space Agency (ESA) under the Copernicus Programme (Sentinel-1A and Sentinel-1B missions) and processed deformation products obtained from the European Ground Motion Service (EGMS). The integration of these data sources enabled comparative analyses, forming the basis for interpretation of the deformation process over an observation period of approximately two and a half years.
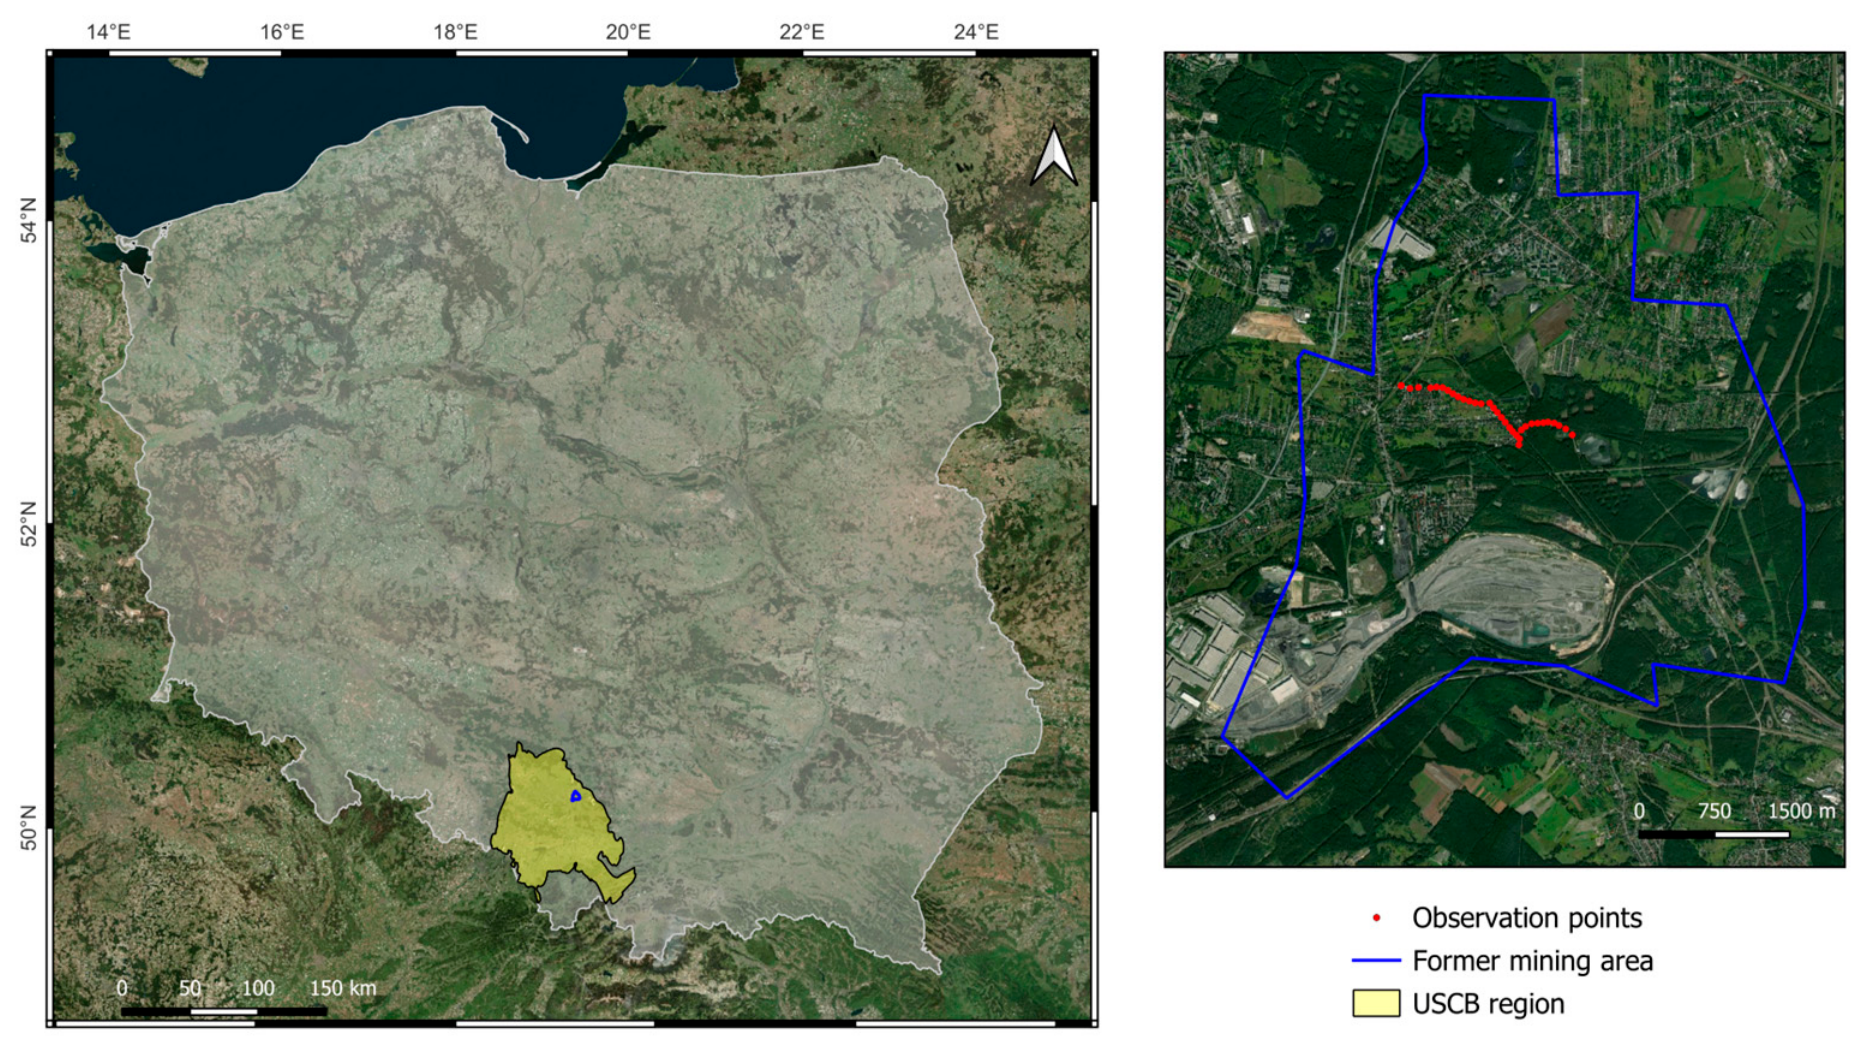
The study area is located within the former Kazimierz-Juliusz hard coal mine, situated in the Upper Silesian Coal Basin (Poland), as shown in Figure 1. The multi-seam coal deposit in this area was exploited for more than 100 years. Coal production continued until 2015, while the mining plant was formally closed at the end of 2018. At that time, the mine dewatering system was also shut down, initiating the controlled flooding process. Surface deformation monitoring in this area was conducted between 2020 and 2023 within the framework of the European research project PostMinQuake—Induced earthquake and rock mass movements in coal post-mining areas: mechanisms, hazard and risk assessment, funded by the Research Fund for Coal and Steel (RFCS) and co-financed in Poland by the Ministry of Science and Higher Education. The main outcomes of the project are presented in Sokoła-Szewioła et al. [30]. Observational data acquired during that period were also used in the analyses presented in this study.

2.1. Sentinel-1 Radar Data

Between 3 December 2020 and 16 April 2023, a total of 104 radar scenes acquired along ascending orbit 102 were collected for the observational dataset. Until 22 December 2021, Sentinel-1 acquisitions were performed at 6-day intervals. Due to a missing acquisition on 16 November 2021, a single 12-day interval occurred during this period. On 23 December 2021, the Sentinel-1B satellite experienced a technical failure, resulting in the termination of data acquisition from this platform. Consequently, from 3 January 2022 onward, radar scenes were acquired at 12-day intervals using Sentinel-1A only. An exception occurred due to the lack of acquisition on 23 November 2022, resulting in a single 24-day interval. From an interpretative perspective, the available dataset provided sufficient temporal sampling to detect small vertical ground movements over a long observation period of nearly 2.5 years. The main characteristics of the utilized radar scenes are summarized in Table 1.

2.2. European Ground Motion Service Data

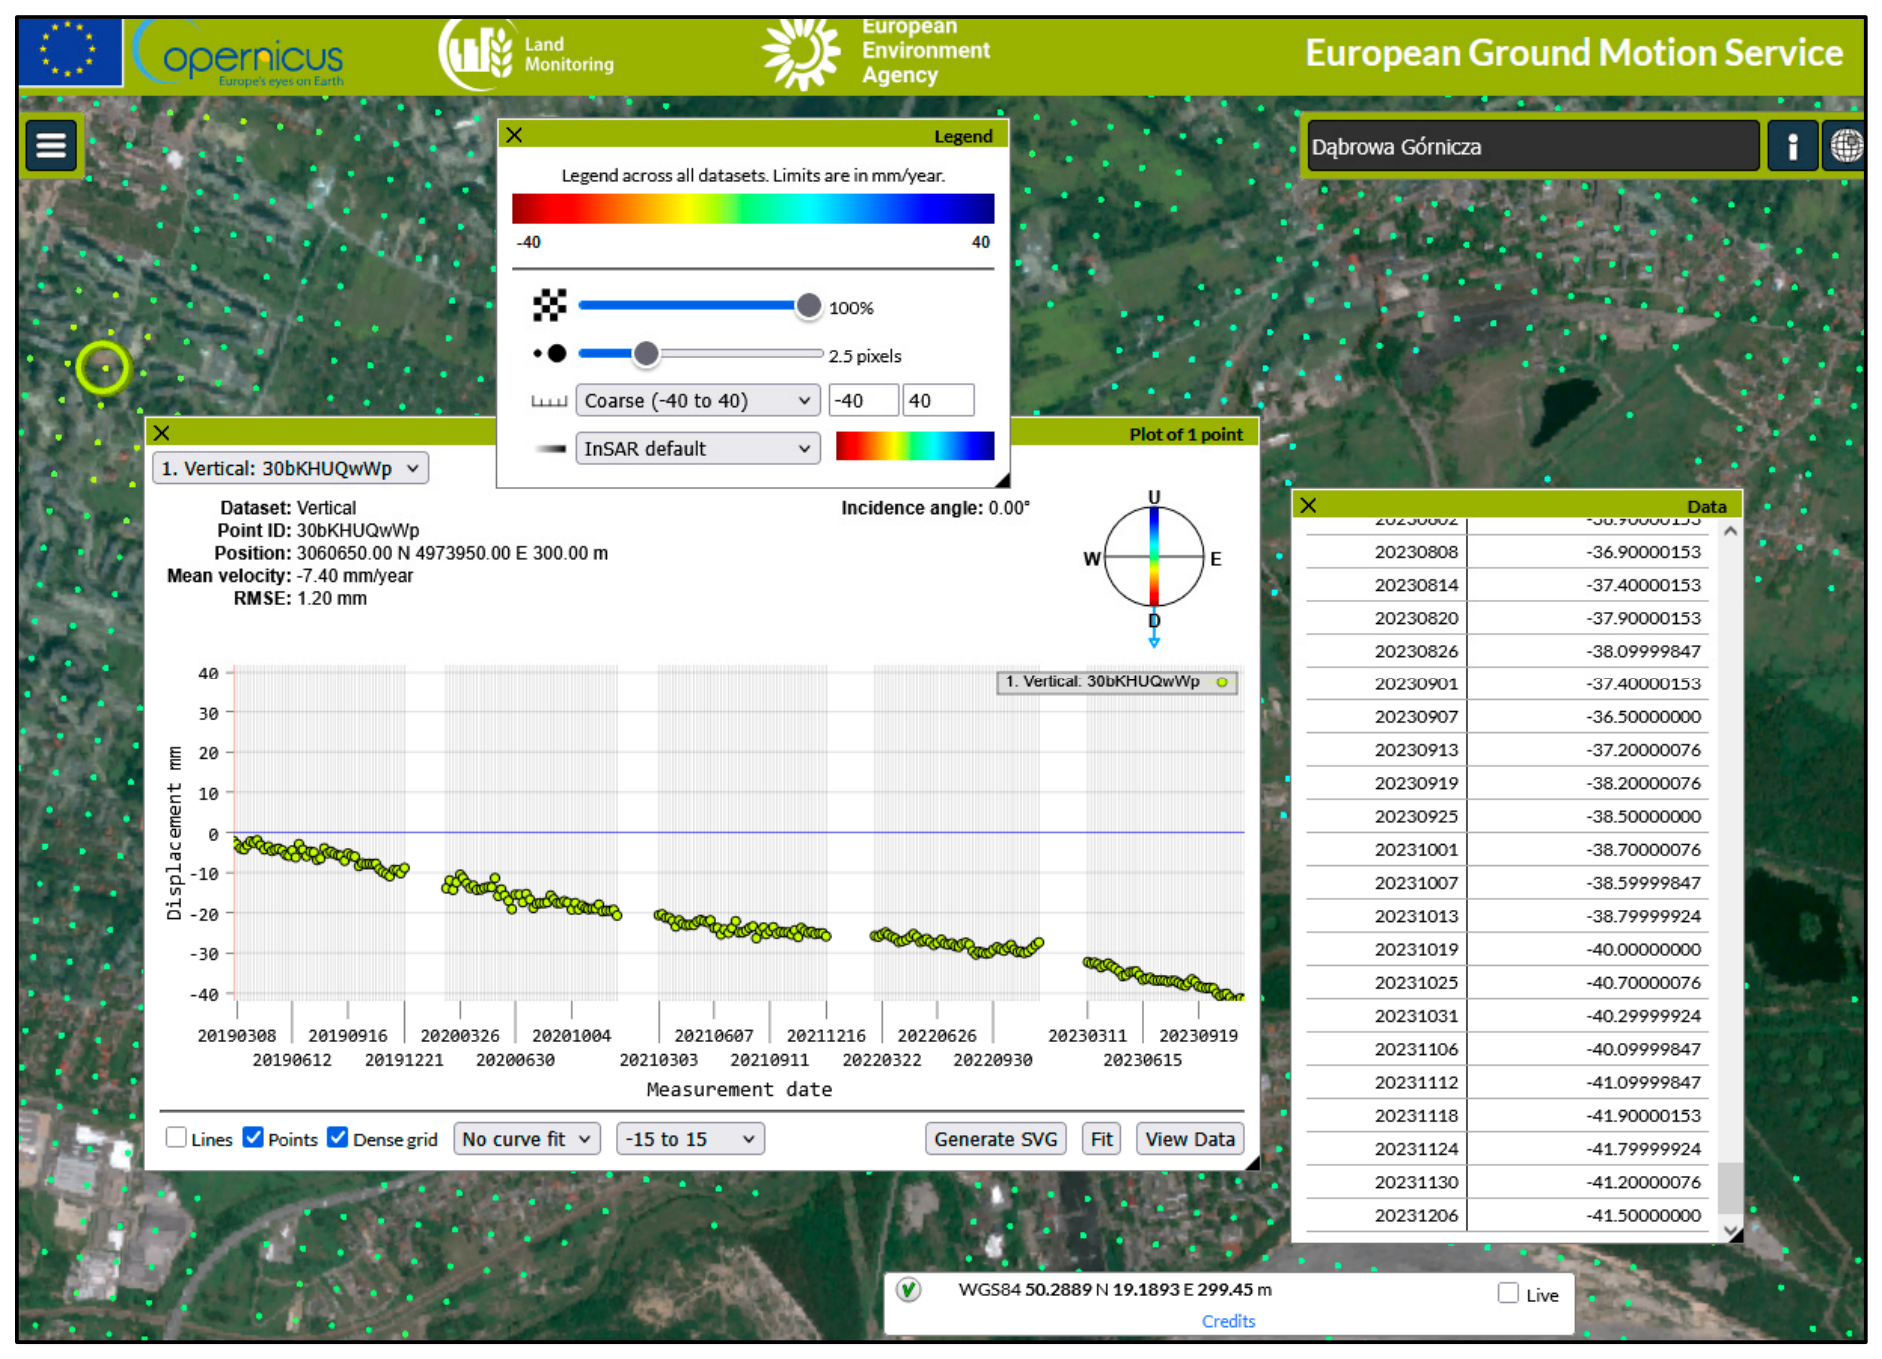
The data provided within the framework of the European Ground Motion Service (EGMS) [31] are distributed at three processing levels: Basic, Calibrated, and Ortho. In this study, Ortho-level products covering vertical displacement for the period 2019–2023 were used. These products are based on the integration of two classes of interferometric scatterers: Persistent Scatterers (PSs) and Distributed Scatterers (DSs). Line-of-Sight (LOS) displacements, estimated independently for ascending and descending orbits, are decomposed into orthogonal displacement components: vertical (U) and horizontal in the east–west direction (E), while the north–south (N) component is not resolved. The resulting deformation parameters are spatially averaged onto a common grid with a resolution of 100 m, which is made available to users for download (Figure 2).

2.3. Precise Levelling Observations

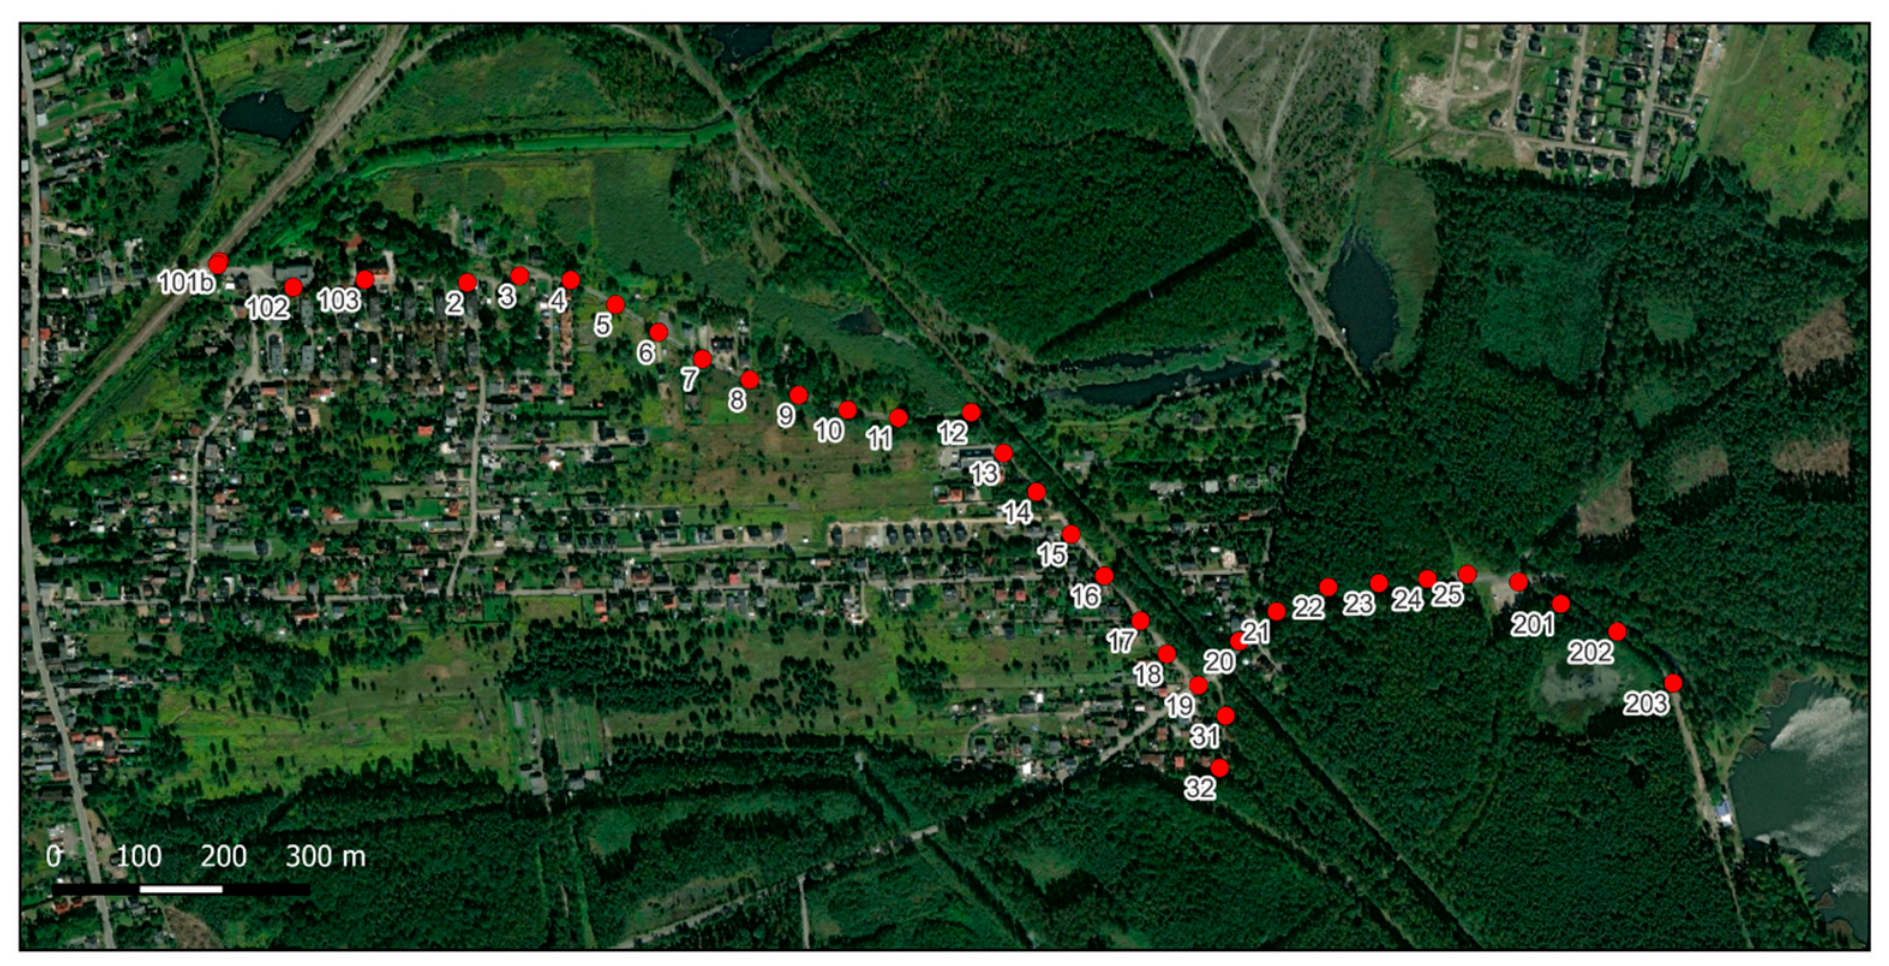
Within the study area, 33 ground benchmarks were permanently stabilized and configured into a single observation line, the course of which is shown in Figure 1 and Figure 3. The benchmarks were installed along existing road infrastructure. Most segments between adjacent points ranged from 50 to 60 m in length. Only at both ends of the line, comprising three points on each side, were the segment lengths slightly longer, varying from approximately 70 m to just over 90 m. The established benchmark line was used for periodic monitoring of surface elevation changes along a longitudinal profile exceeding 2 km in length. Elevation measurements were performed using precise levelling techniques, with the initial reference campaign (so-called “zero cycle”) conducted on 12 December 2020. A total of 16 observation cycles were completed between that date and 3 March 2023. All subsequent levelling campaigns were referenced to benchmark No. 203, whose elevation was determined during the zero cycle and assumed to remain stable over time. Consequently, the directly derived elevation changes of the remaining benchmarks represent relative vertical displacements (Section 3.3). Throughout the observation period, the computed vertical changes were referenced to a constant datum defined by the assumed fixed elevation of the reference benchmark. The systematic effect associated with potential elevation changes of the reference point was accounted for in the final displacement estimates of the remaining benchmarks derived from the levelling data (Section 4.3).

3. Methods

3.1. PSInSAR Processing Workflow

Given the availability of an extensive observational dataset (Section 4.3) as well as deformation products from the EGMS service (Section 4.2), additional processing of the radar scenes was performed using the PSInSAR method. This approach is primarily applied for the detection of small-magnitude vertical surface displacements, typically at the millimeter scale occurring over extended time periods ranging from several months to multiple years.
Surface deformation monitoring within the study area was carried out using the StaMPS (Stanford Method for Persistent Scatterers) technique [32], which enables the identification and analysis of coherent Persistent Scatterers based on phase stability over time. A stack of Sentinel-1 Interferometric Wide-Swath (IW) Single-Look Complex (SLC) scenes, acquired in a consistent viewing geometry, was processed using a single-master PSInSAR approach. The master image (acquired on 17 September 2021) was selected to minimize the perpendicular baseline and temporal decorrelation, thereby optimizing the overall interferometric phase quality of the generated stack. Interferometric preprocessing was performed in SNAP (S1TBX) using automated TOPS workflows, including precise orbit correction, subswath and burst selection, area-of-interest subsetting, and TOPS coregistration with Enhanced Spectral Diversity. Interferograms were generated after the removal of the topographic phase component using the Shuttle Radar Topography Mission 1 Arc-Second Global digital elevation model. The interferometric products were subsequently exported to a StaMPS-compatible format using the SNAP2StaMPS script.
PSInSAR time-series analysis was carried out in StaMPS following a standard processing chain. Because the StaMPS algorithm was utilized, a traditional coherence threshold was not applied. Instead, Persistent Scatterer Candidates (PSCs) were initially selected based on the Amplitude Dispersion Index (DA), with an initial threshold of DA = 0.4 applied during the preliminary selection phase. The filtering of the selected points included several steps to ensure data reliability. First, phase noise was estimated and the spatial correlation of the phase was evaluated, allowing adjacent noisy pixels to be removed using the StaMPS weeding parameter. Subsequently, spatially correlated phase noise was mitigated during the phase correction step. Two-dimensional phase unwrapping was then performed using SNAPHU, which applies a statistical-cost network-flow algorithm, with masking implemented to reduce errors in decorrelated areas. Spatially correlated residual phase components were estimated through iterative refinement to stabilize the final deformation solution. Finally, atmospheric delays were mitigated using a linear tropospheric correction provided by TRAIN (Toolbox for Reducing Atmospheric InSAR Noise, version v2) software. The final outputs consisted of mean Line-of-Sight (LOS) deformation velocity maps and displacement time series for individual persistent scatterers. These products were exported for subsequent spatial analysis and interpretation of post-mining ground deformation associated with mine flooding.
Finally, the cumulative displacement increments were referenced to the date of the first radar acquisition, i.e., 3 December 2020. The displacement time series were estimated assuming a linear deformation model. The discrete, point-based character of the PS dataset enabled interpretation of spatial patterns of ground movement within the study area. Detailed results of the PSInSAR processing are presented in Section 4.1.

3.2. Processing of EGMS Data

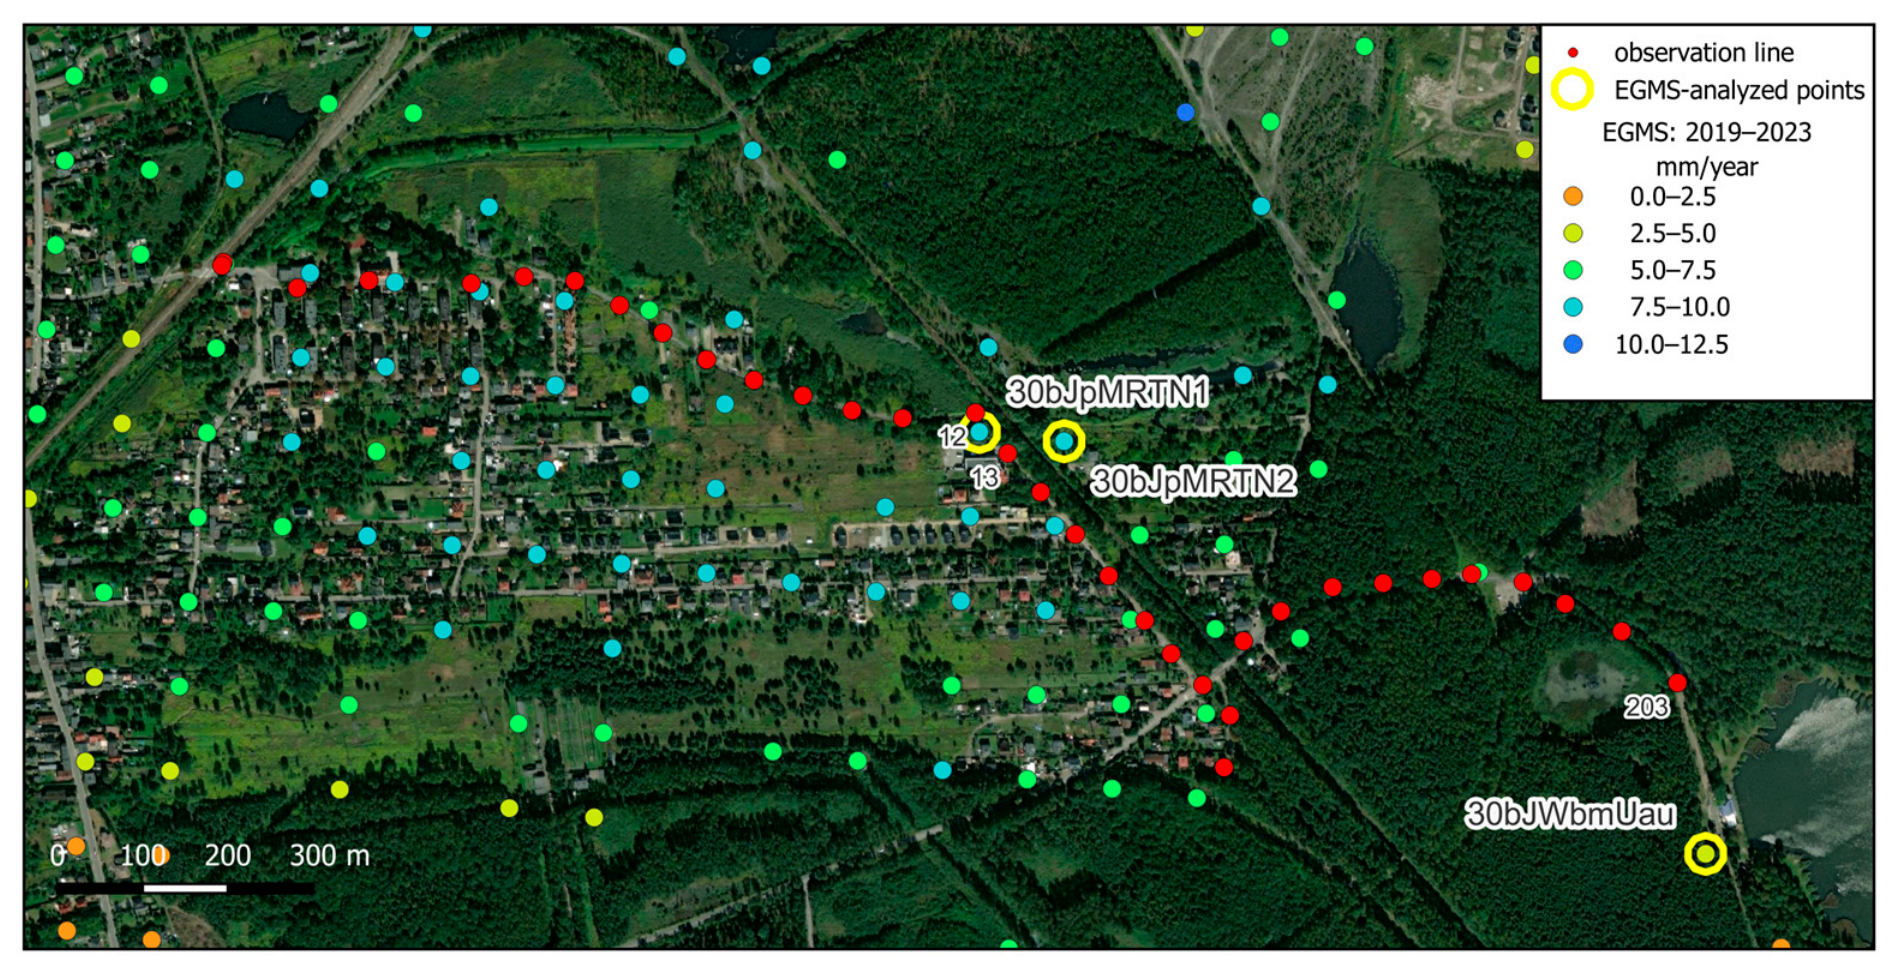
The processed satellite products made available through the EGMS service at the Ortho processing level provide information on surface elevation changes within a regular grid of points with a spatial resolution of 100 m × 100 m. However, this grid does not ensure complete spatial coverage, which is directly related to inherent limitations of the InSAR technique and its detection capabilities [33,34]. The spatial coverage of EGMS grid points in the vicinity of the established leveling observation line is presented in Figure 4. For the purpose of comparison and quality assessment of the EGMS dataset, displacement values were extracted from grid points located in proximity to the stabilized benchmarks of the observation line. Only the leveling benchmarks characterized by high-quality and highly reliable geodetic measurements were included in the analysis (Section 3.3).
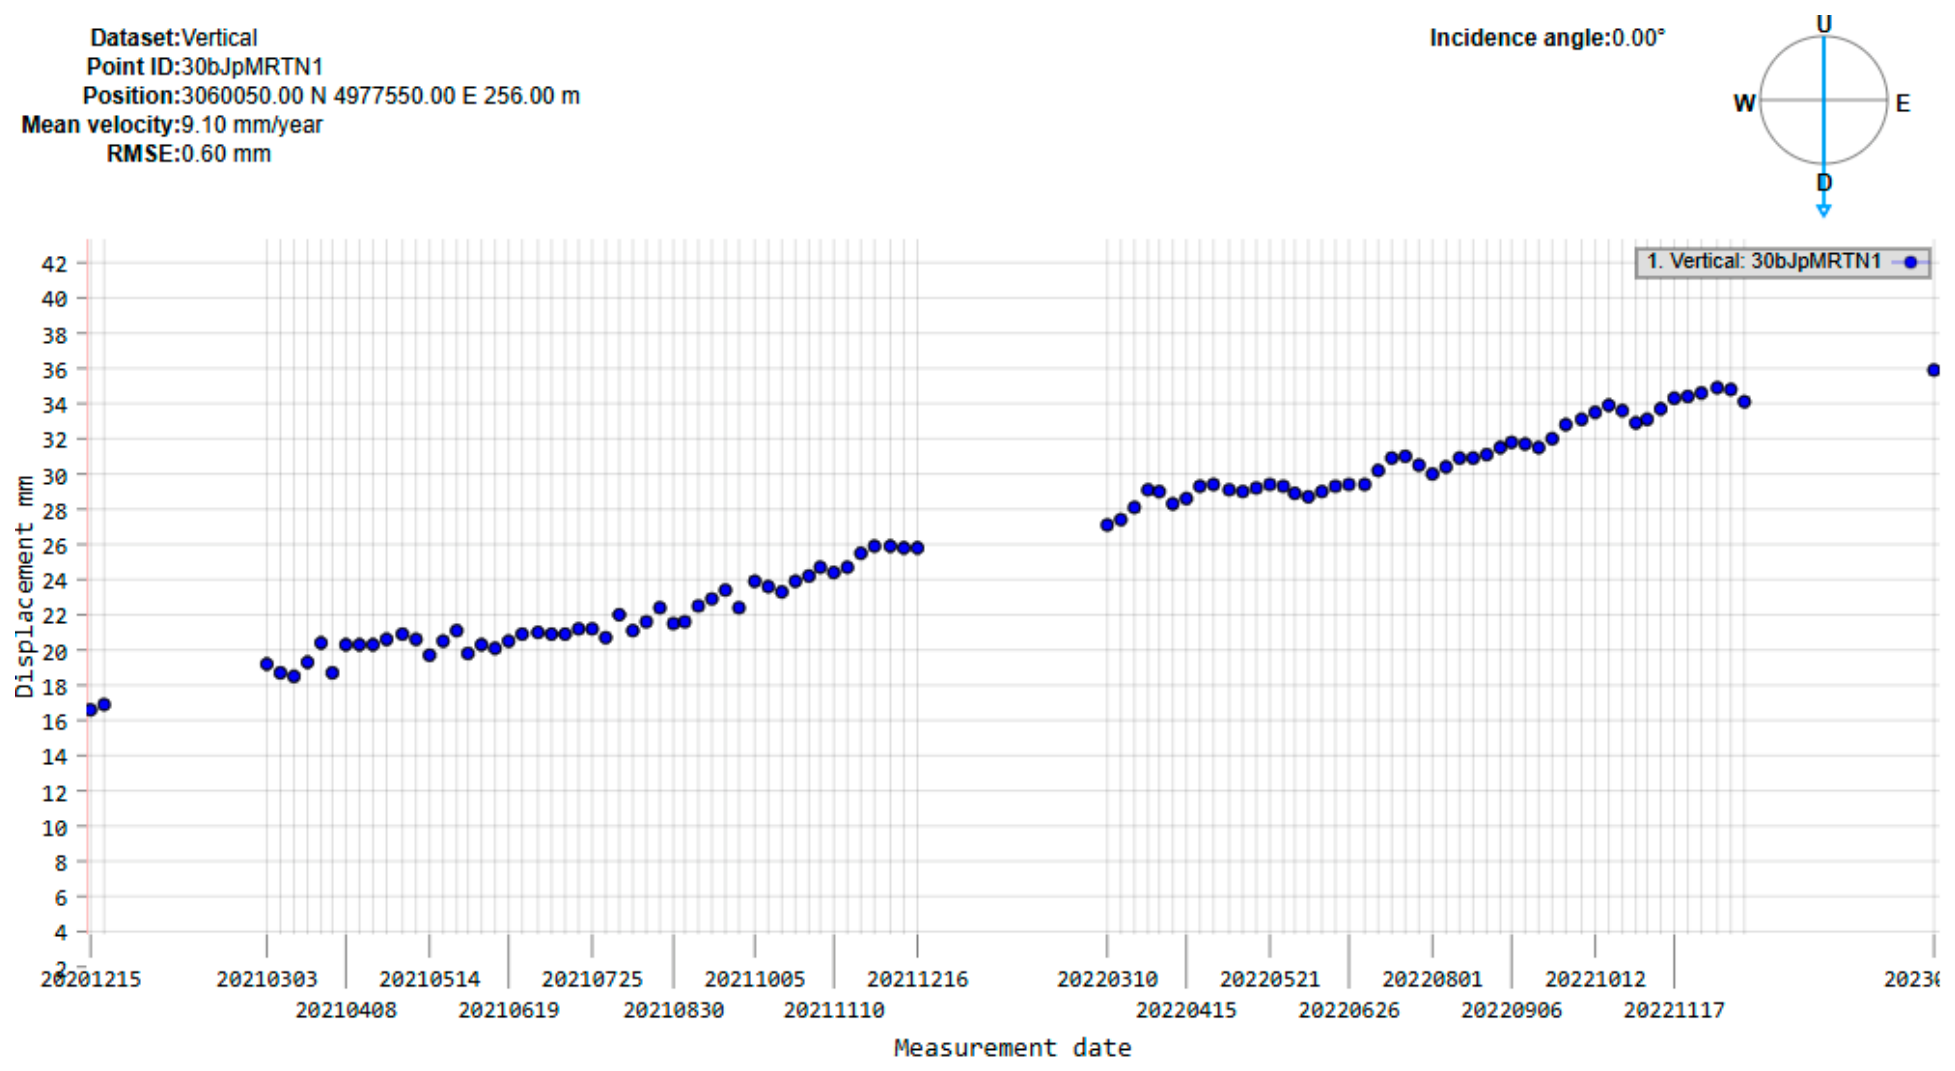
For each grid point in the EGMS dataset, a time series representing periodic vertical displacement is available. The quality of the derived displacement trend, estimated on the basis of a large number of radar scenes, may vary between grid points. This variability is primarily related to differences in radar backscatter characteristics within the resolution cell corresponding to a given grid location. Such differences are associated with land cover type and surface infrastructure, which influence signal stability and coherence. To quantitatively assess this overall data quality and ensure the representativeness of the measurements, a statistical analysis was performed for all 47 grid points located within a 200 m buffer of the leveling observation line. The analysis of the Root Mean Square Error (RMSE) for the linear trend fit yielded a low mean of 0.94 mm (standard deviation: 0.60 mm) and a median of 0.70 mm, with values ranging from 0.40 mm to 3.10 mm. Correspondingly, the estimated mean vertical velocity across these points averaged 7.68 mm/year (standard deviation: 1.17 mm/year) with a median of 7.70 mm/year, with minimum and maximum values of 5.00 mm/year and 9.60 mm/year, respectively. This low overall mean RMSE—falling below 1 mm—combined with the consistent uplift velocity distribution, quantitatively confirms the high signal stability and overall reliability of the long-term vertical displacement estimations across the analyzed post-mining area. Examples illustrating differences in data quality for two adjacent grid points located near benchmarks 12 and 13 of the leveling observation line during the period of leveling measurements are presented in Figure 5 and Figure 6.
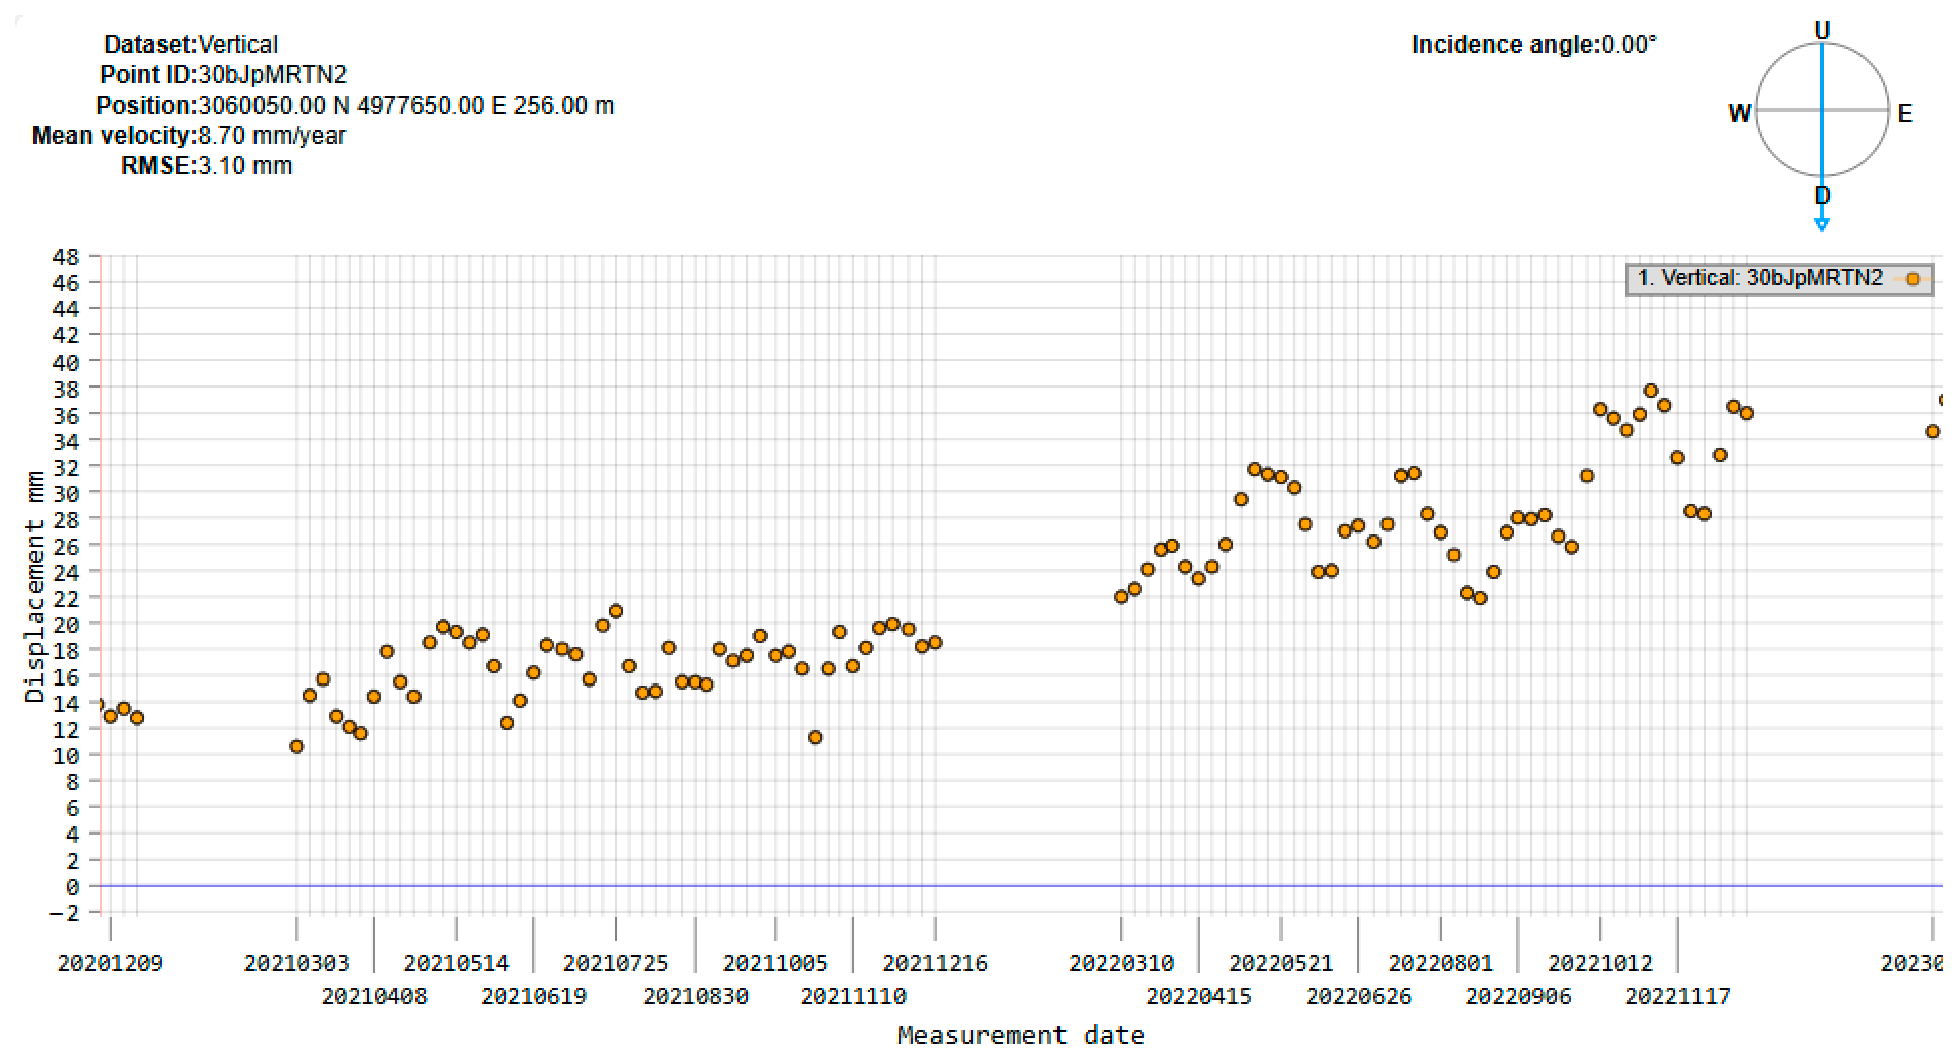
The displacement time series presented in the above figures exhibit different degrees of data dispersion. This dispersion can be quantified by the root mean square deviation of the observations from the estimated long-term deformation trend. From a quantitative perspective, greater dispersion results in a higher Root Mean Square Error (RMSE). In the examples shown, this is reflected by a lower RMSE value (0.6 mm) for the higher-quality dataset (Figure 5) and a higher RMSE value (3.1 mm) for the lower-quality dataset (Figure 6). Despite these differences in data dispersion, the estimated long-term deformation trends are comparable, as indicated by the calculated mean annual uplift rates of 9.1 mm/year and 8.7 mm/year, respectively. This demonstrates that EGMS data of varying quality can still support reliable interpretation of long-term deformation trends. Once the deformation trend is determined for a given grid point, surface elevation changes over selected analysis intervals can be readily computed based on displacement differences between two acquisition dates. In the authors’ view, appropriate verification of such trend-based estimates constitutes a necessary condition for their reliable application in deformation analyses.

3.3. Processing of Precise Levelling Data

During the leveling campaigns conducted between 12 December 2020 and 3 March 2023, relative elevations of all benchmarks along the observation line were determined. In each of the sixteen observation cycles, benchmark elevations were referenced to an assumed constant datum represented by benchmark No. 203 (Section 2.3). The derived elevations were used to compute height changes between consecutive observation cycles as well as over the entire study period of nearly 27 months. During each campaign, the results were subjected to both qualitative and quantitative assessments. Measurements that clearly deviated from the established deformation trends along the longitudinal profile were excluded from further analysis. Such outliers were attributed to disturbance, damage, or destruction of certain benchmarks installed along road infrastructure. Over the course of the monitoring period, as many as 14 benchmarks were disturbed or destroyed (Nos. 101, 2–4, 6, 7, 9, 12, 15–17, 21, 25, and 32). Benchmark No. 101, which was destroyed at an early stage of the study, was re-established as point 101b. The lack of temporal stability of the affected benchmarks precluded reliable interpretation of surface elevation changes at these locations. Consequently, results derived from these points were excluded from the final analysis. For the remaining undisturbed benchmarks, elevation changes were determined relative to the assumed constant elevation of benchmark No. 203, which served as the reference point in all levelling campaigns (0.0 value in Table 2).
However, the initial assumption of the stability of this benchmark, i.e., zero vertical displacement over the entire observation period, was later found to be incorrect due to detected vertical ground movement at its location. This issue was addressed in a subsequent stage of the analysis (Section 4.3). Apart from this correction, the elevation changes obtained directly from the final observation cycle were relative in nature. Displacements of individual benchmarks were computed with respect to the temporally constant reference level defined by benchmark No. 203. The resulting values are presented in Table 2.

4. Results

4.1. PSInSAR Results

The results obtained from PSInSAR processing constitute an additional dataset subjected to detailed analysis. A total of 104 radar scenes acquired along orbit 102 were used in the processing workflow. The processed SAR data cover a period exceeding 28 months, from 3 December 2020 to 16 April 2023, corresponding to nearly the entire duration of surface deformation monitoring in the area of the former coal mine.
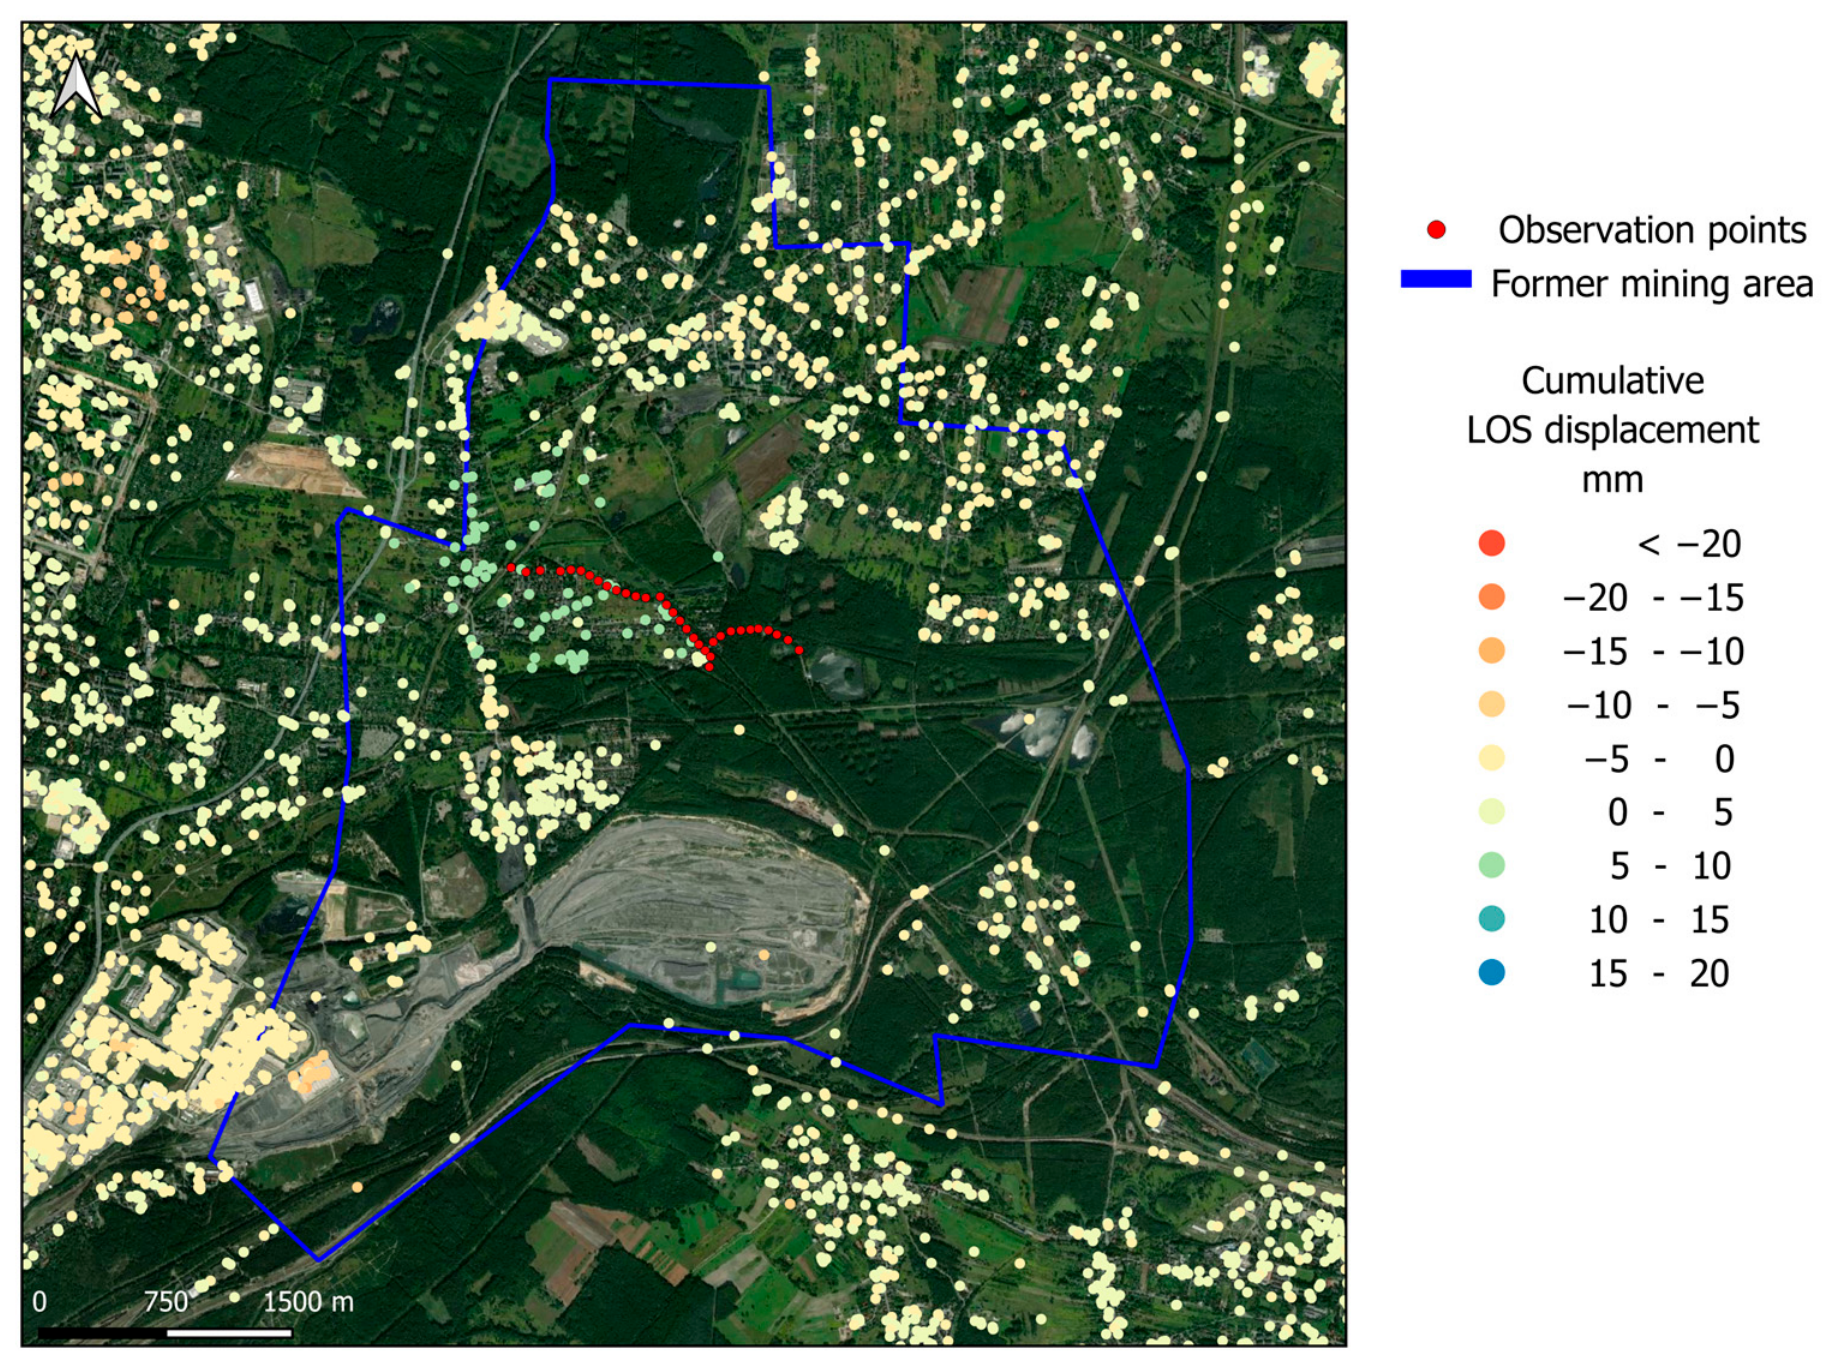
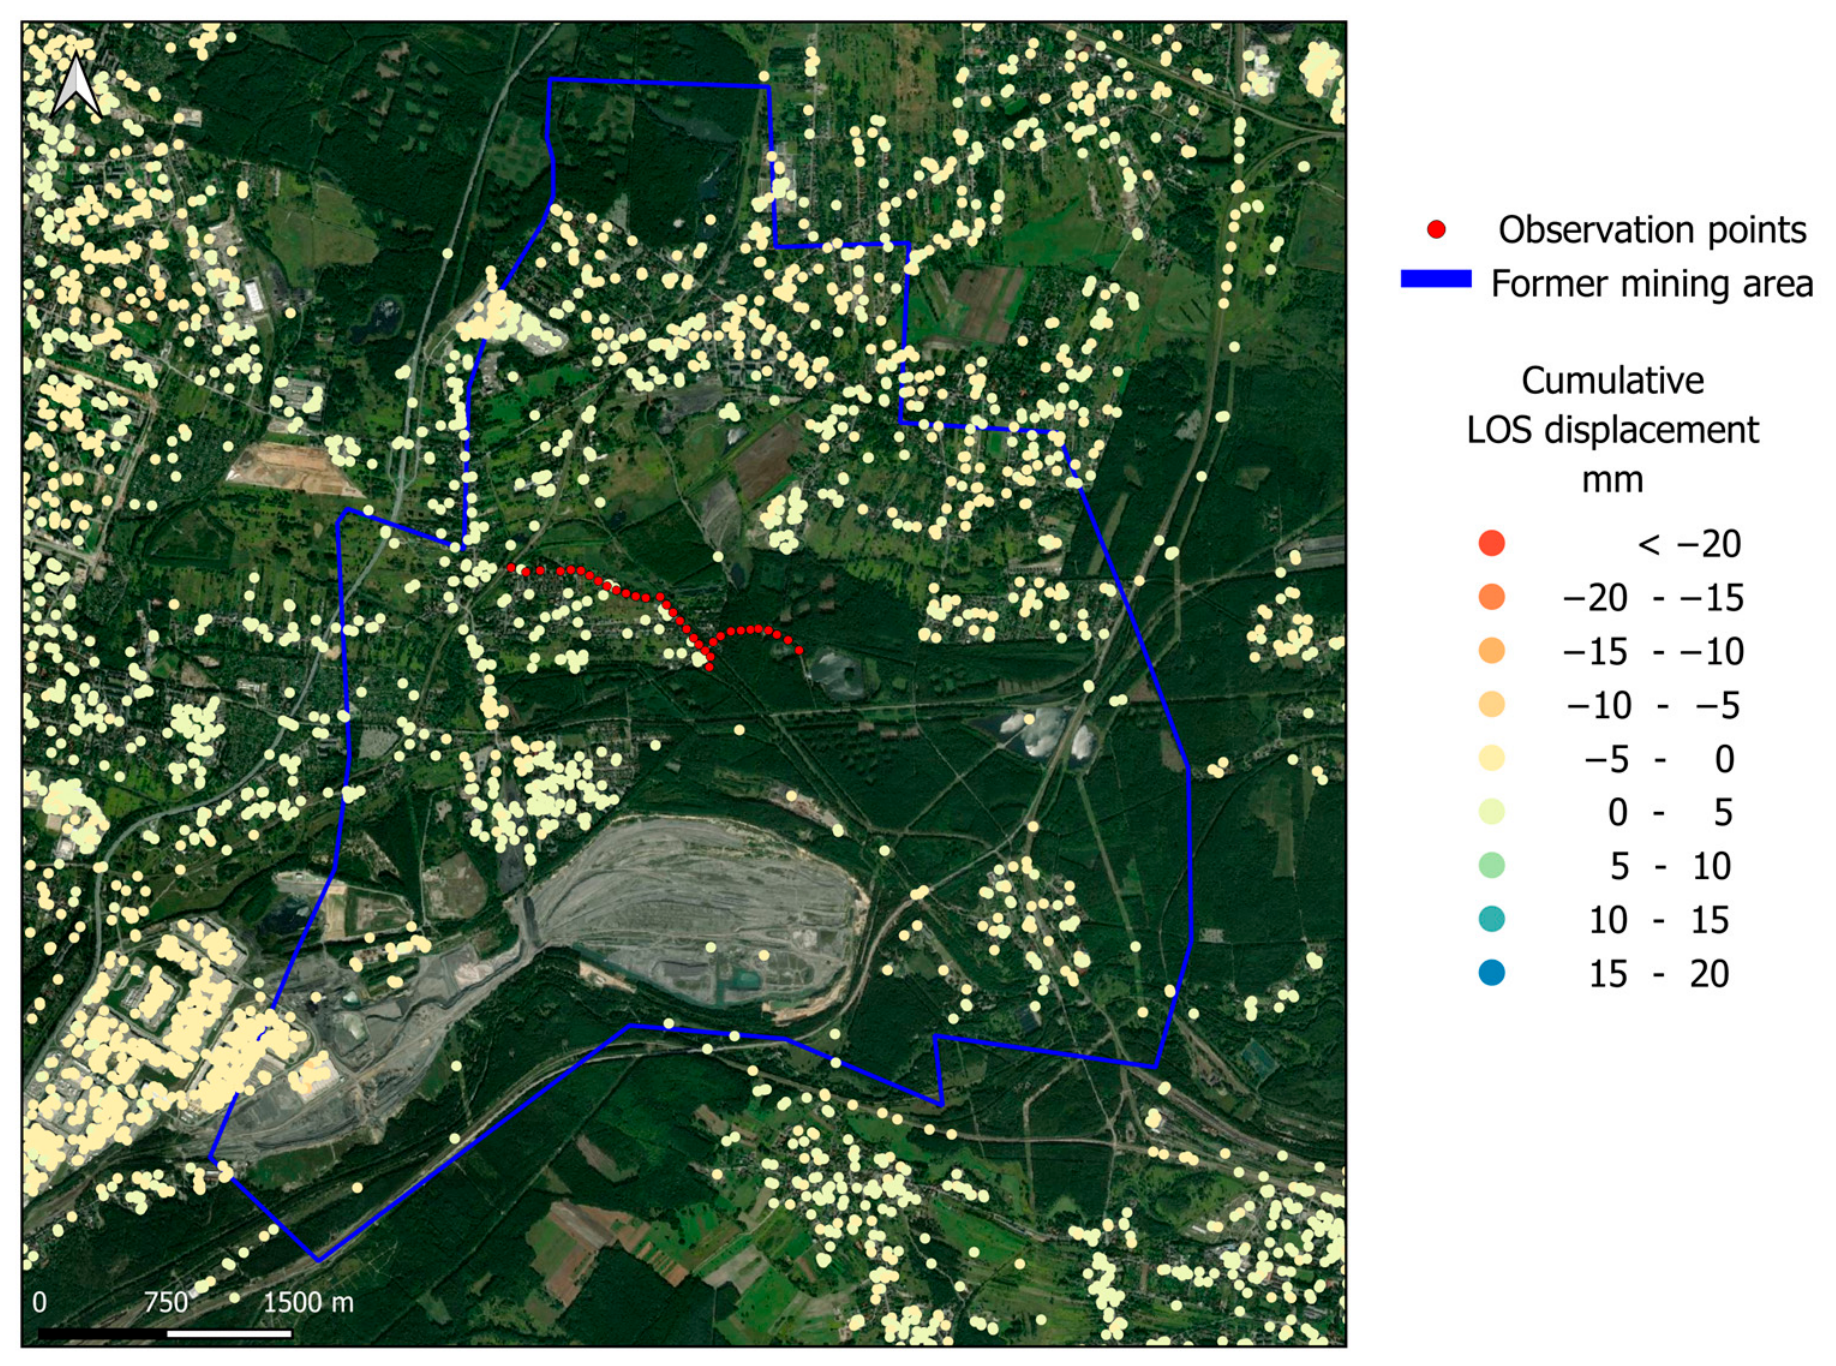
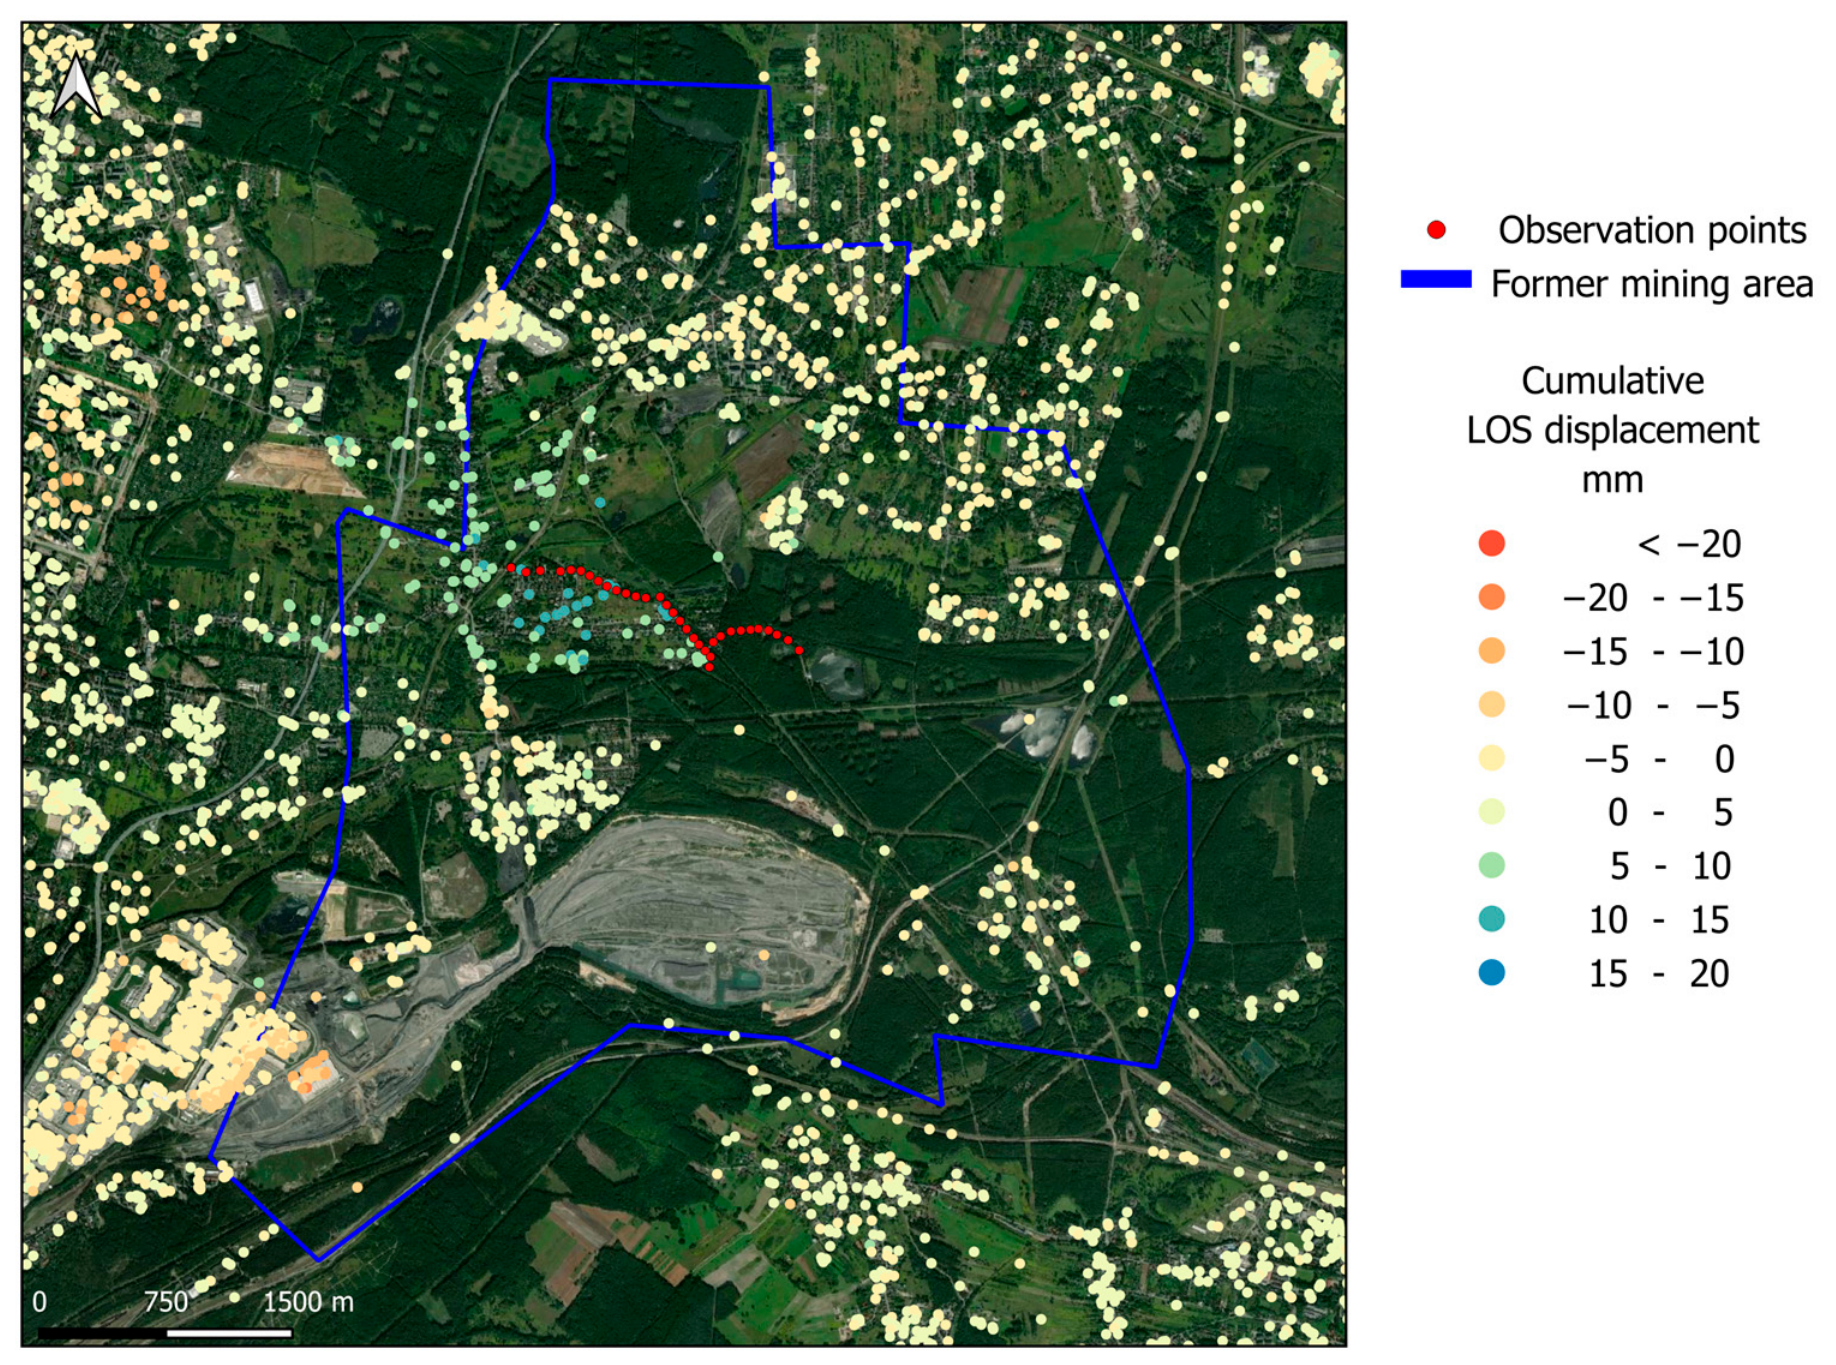
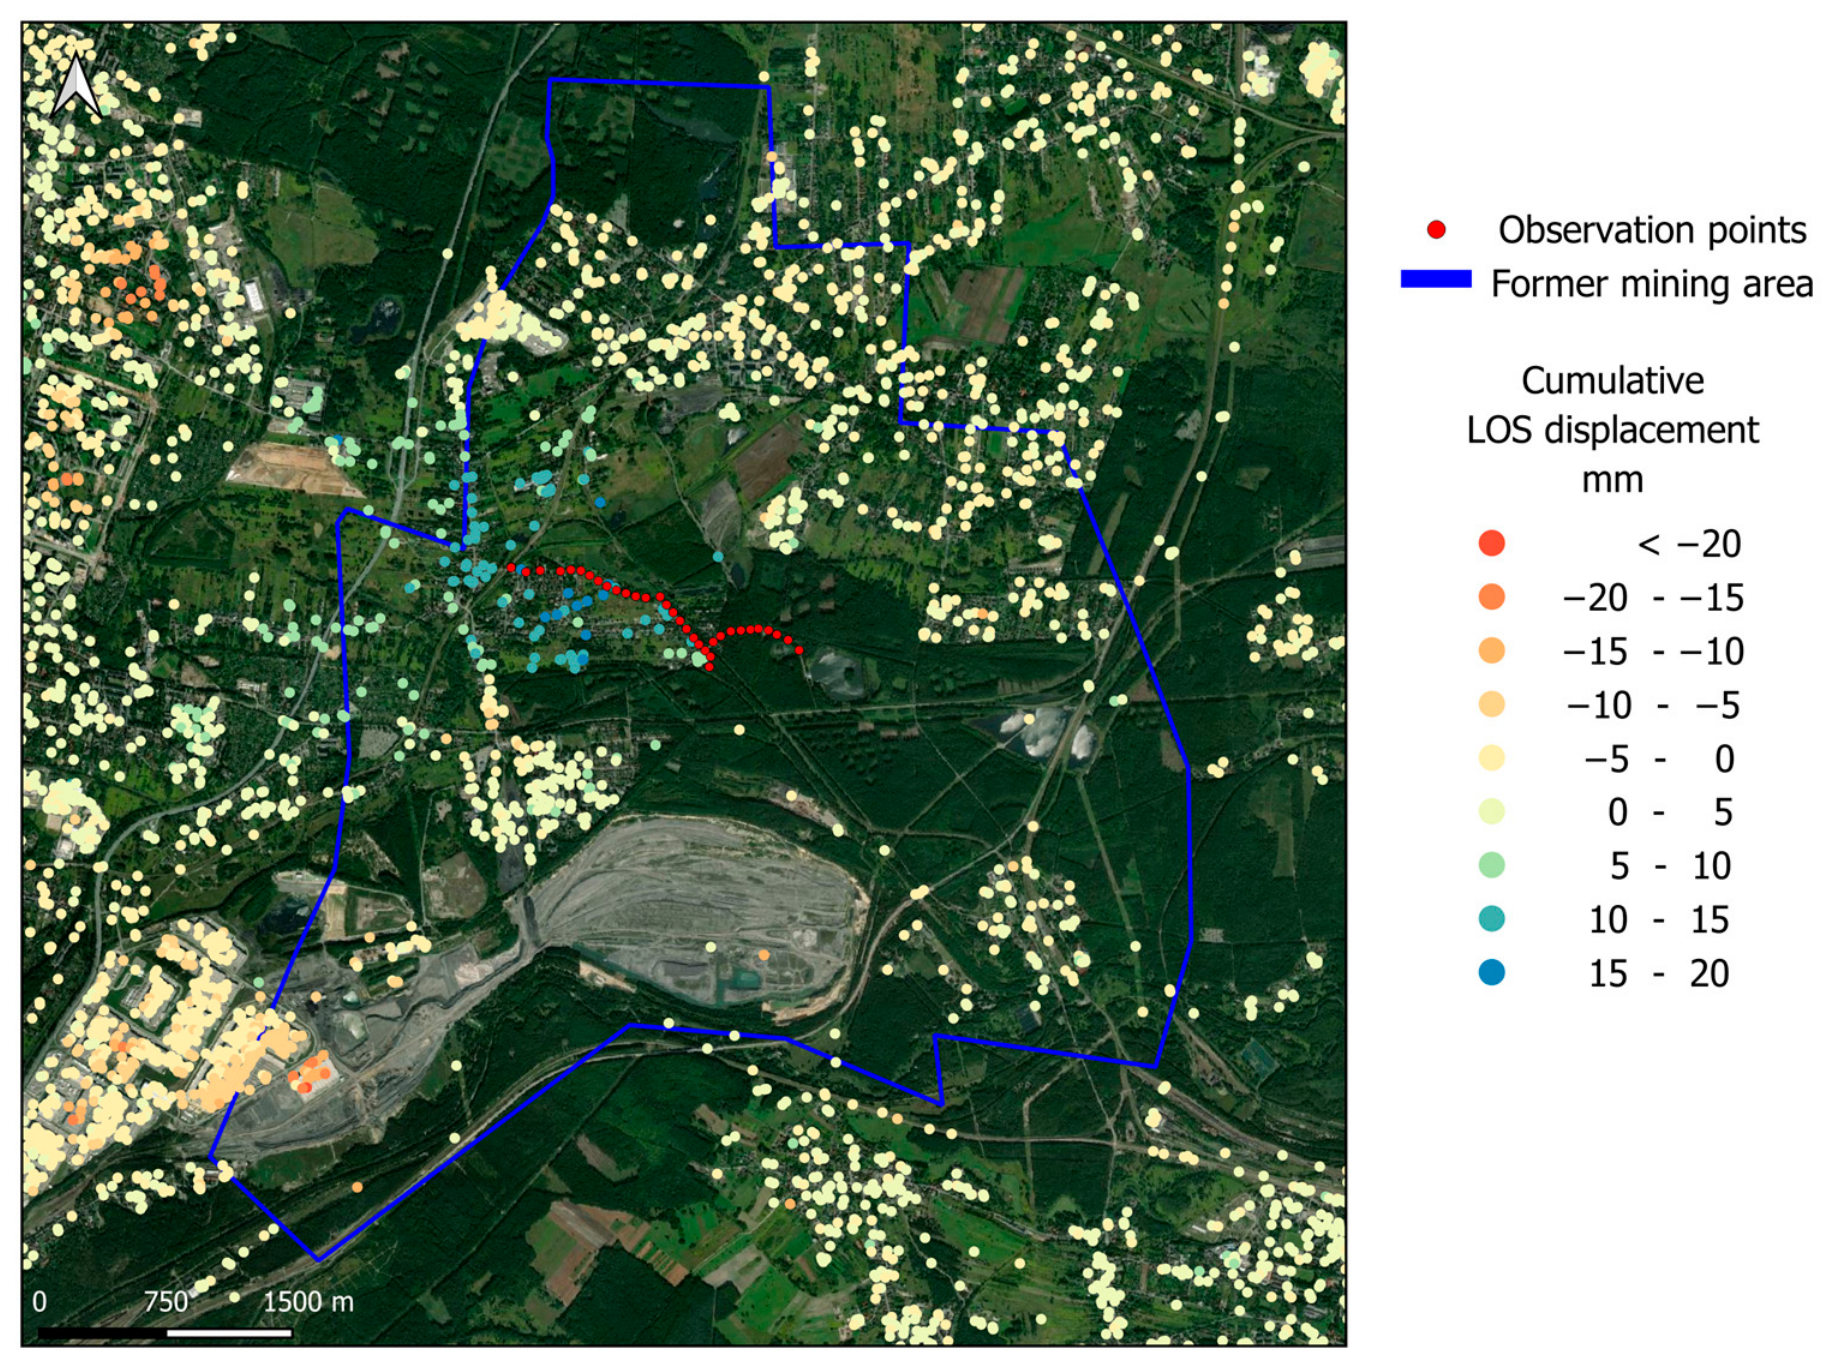
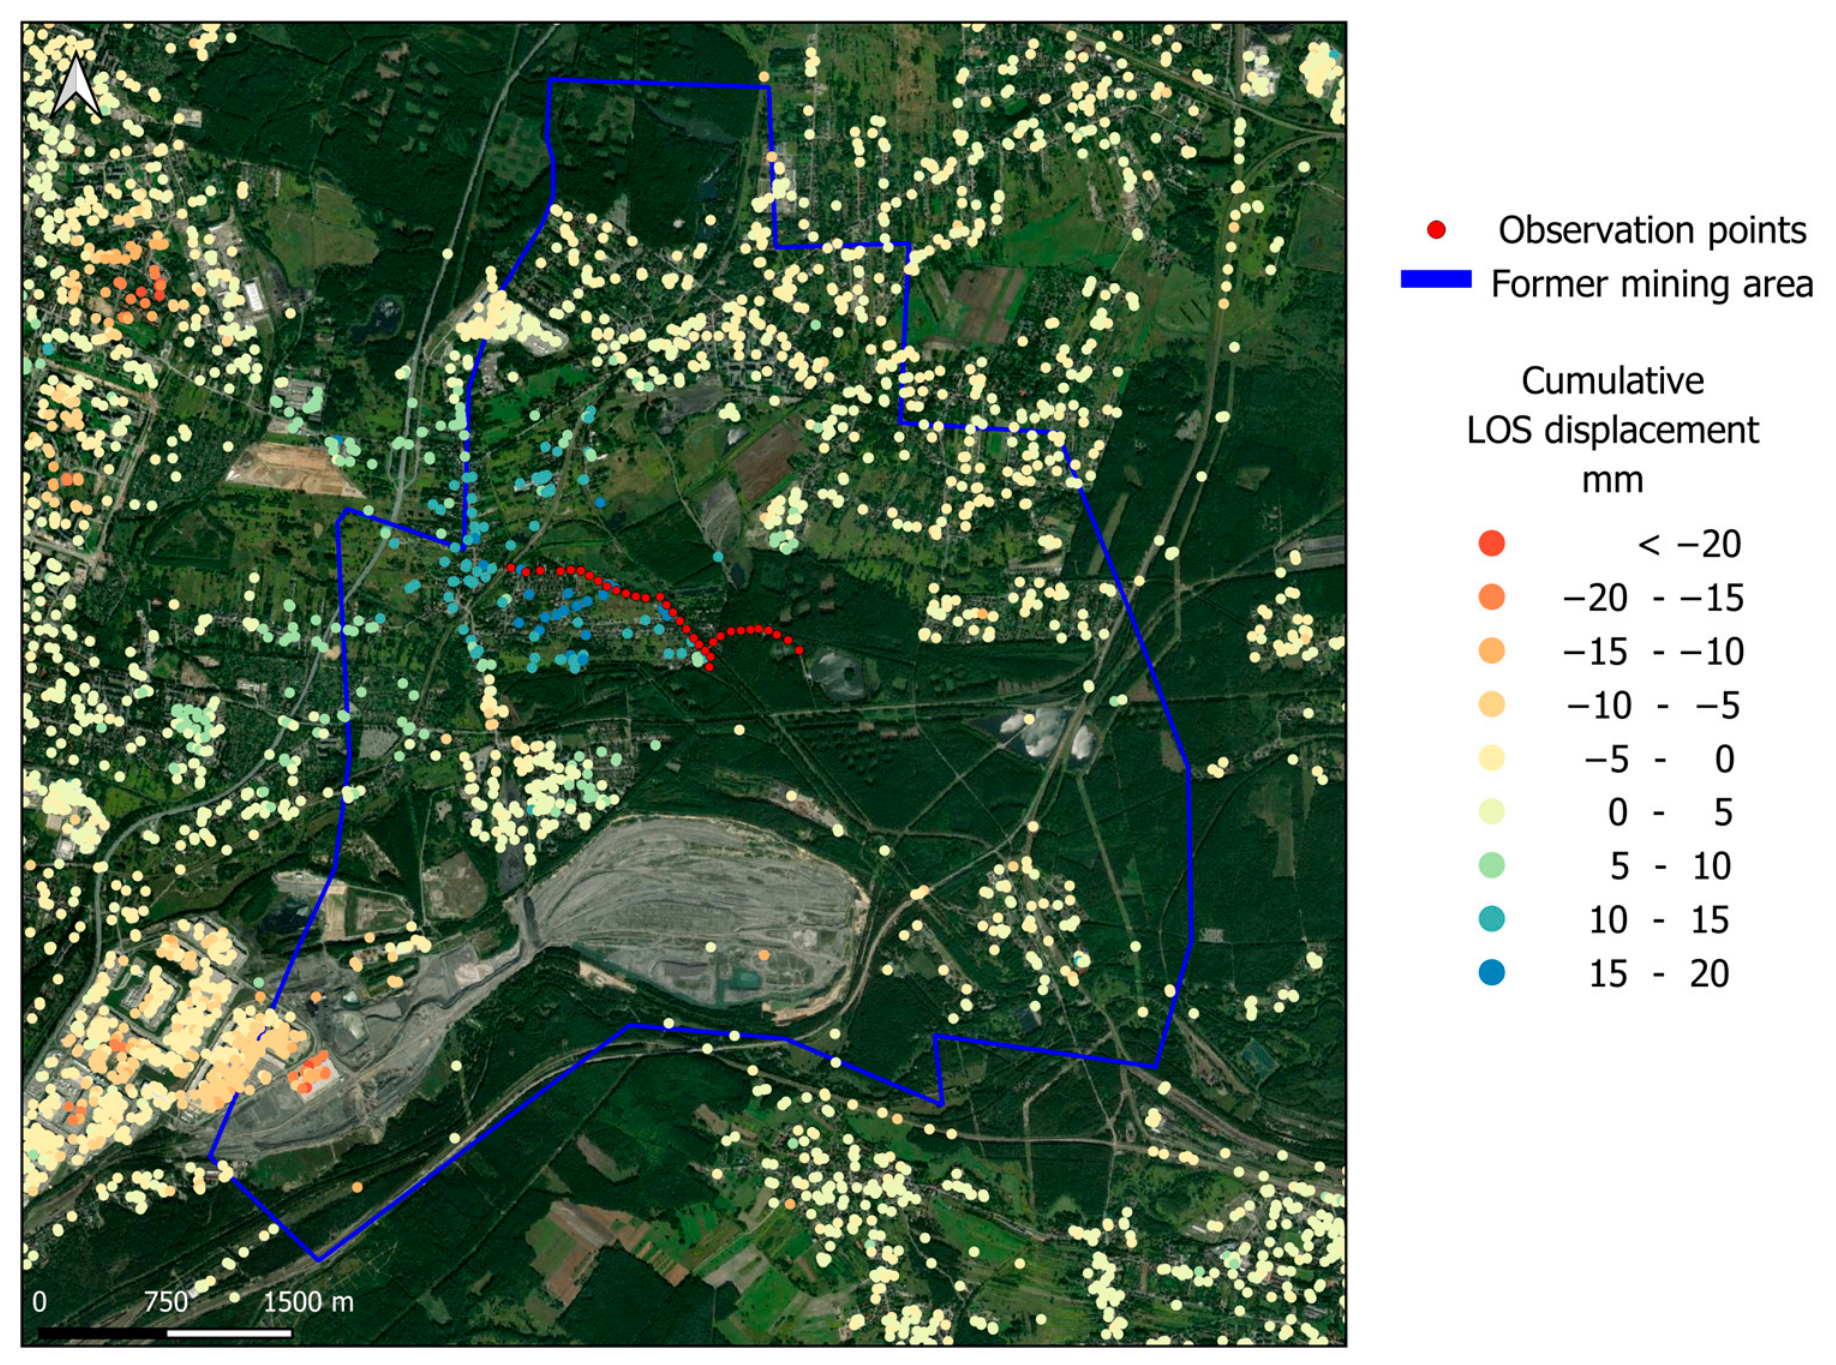
The PSInSAR outputs provide spatially distributed point-based information on surface displacement in the LOS direction for five selected time intervals, increasing in approximately semi-annual steps from the reference acquisition date. The reference image was the radar scene acquired on 3 December 2020. The displacement results for the individual time intervals are presented in the following figures:
  • Figure 7—surface elevation changes between 3 December 2020 and 25 June 2021 (7 months),
  • Figure 8—surface elevation changes between 3 December 2020 and 3 January 2022 (13 months),
  • Figure 9—surface elevation changes between 3 December 2020 and 2 July 2022 (19 months),
  • Figure 10—surface elevation changes between 3 December 2020 and 29 December 2022 (25 months),
  • Figure 11—surface elevation changes between 3 December 2020 and 16 April 2023 (28 months).

4.2. EGMS Results

In order to verify the reliability of the EGMS dataset within the study area, vertical displacement values were determined for selected grid points located in close proximity to stable benchmarks of the levelling observation line, i.e., benchmarks that remained undisturbed throughout the entire monitoring period (Section 3.3). Elevation changes were evaluated for the period between 15 December 2020 and 11 March 2023, corresponding to the time frame of the levelling measurements conducted along the observation line (12 December 2020–3 March 2023). For the specified dates, relative vertical displacement values (WEGMS) were extracted from the EGMS service for each selected grid point. Based on these values, vertical displacements over the analyzed period (ΔHEGMS) were computed using a differential approach.
The detailed calculation results are presented in Table 3, including both the derived displacement values (Column 4) and the source data used for their computation (Columns 2 and 3). The final two columns of the table provide the planar coordinates of the grid points in the EGMS reference system, namely ETRS89/LAEA Europe (EPSG:3035).
The vertical displacement values presented in Column 4 of Table 3 indicate surface uplift at all analyzed EGMS grid points over the 27-month period (December 2020–March 2023). The recorded uplift ranges from approximately +11 mm in the vicinity of benchmark No. 203 to slightly over +21 mm near benchmark No. 13 along the observation line. This uplift pattern is consistently reflected in the displacement time series of all analyzed grid points, examples of which are shown in Figure 5 and Figure 6.

4.3. Results of Precise Levelling Observations

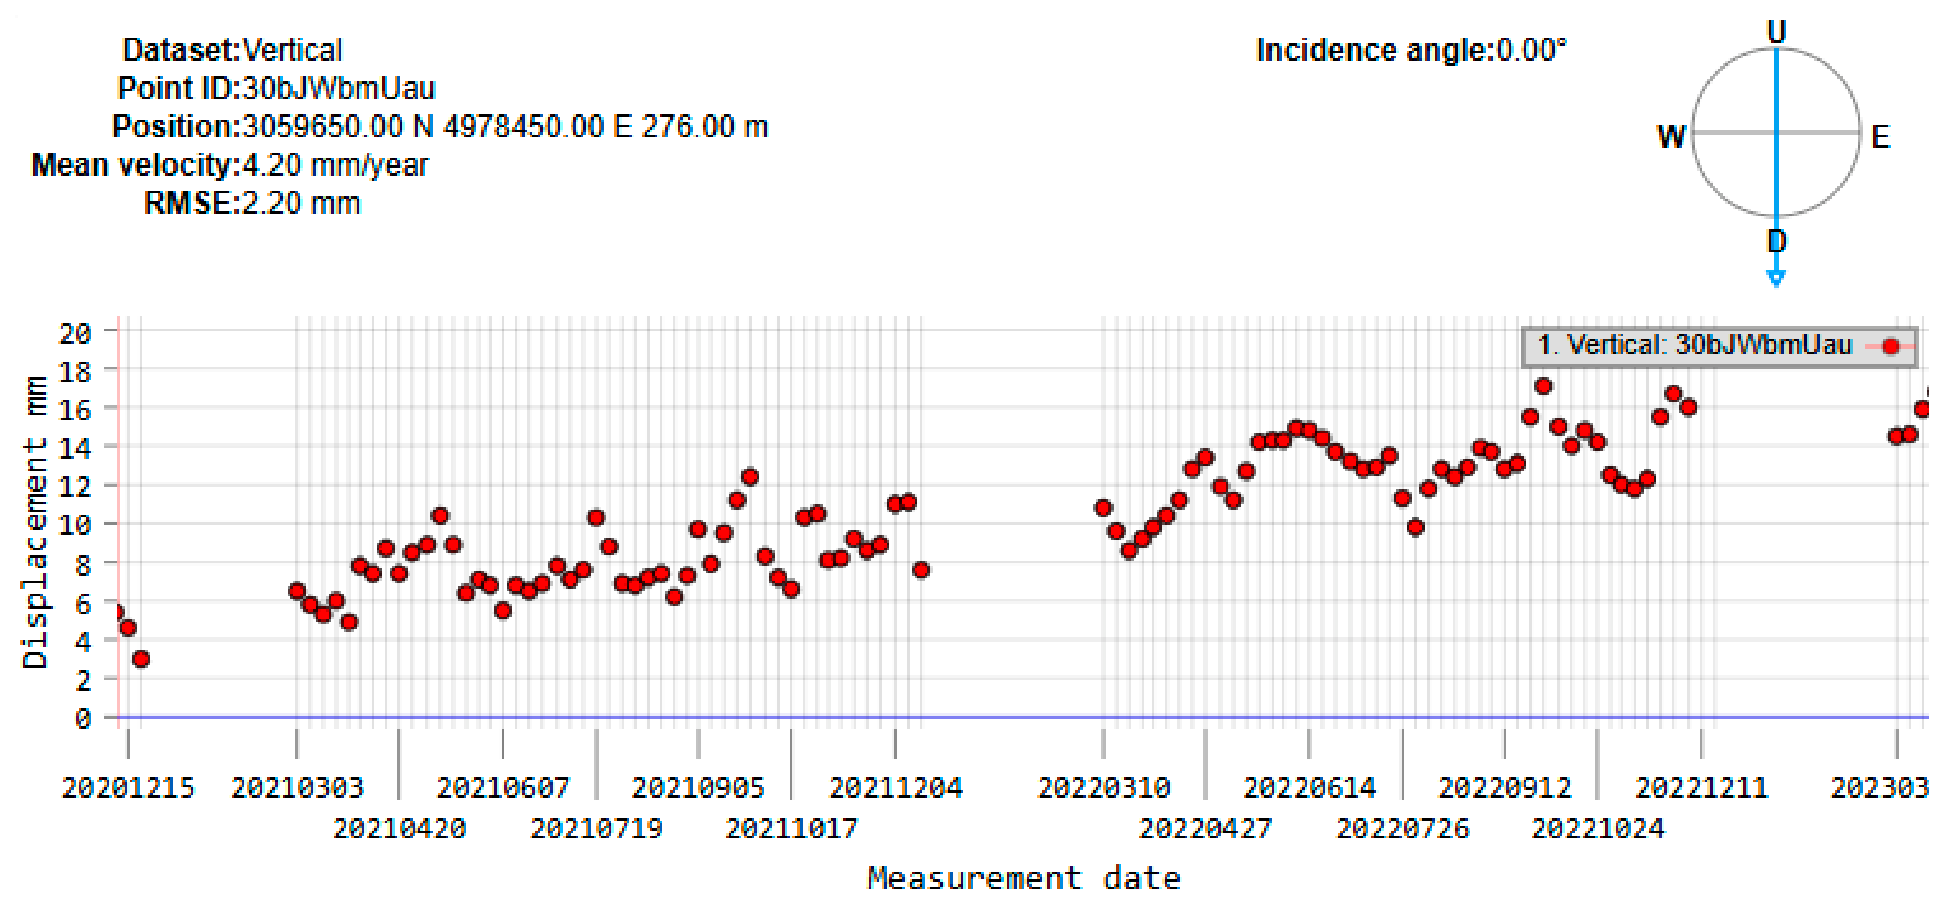
The elevation changes of the benchmarks presented in Section 3.3 were referenced to a temporally constant datum defined in the zero cycle, corresponding to the assumed fixed elevation of benchmark No. 203. This assumption was adopted based on the classical theory of mining influence [35,36], under the premise that the benchmark was located outside the primary influence zone of the previously exploited underground workings. Accordingly, it was assumed during the project implementation that the ground surface at the location of benchmark No. 203 had not been subjected to direct mining-induced deformation resulting from void formation within the rock mass. However, this assumption did not account for indirect influences, which may extend over considerably larger areas [2]. Such influences include deformation associated with changes in hydrogeological conditions, particularly within deeper strata of the rock mass. These effects result from long-term mine water drainage from overlying aquifers during active exploitation. Prolonged dewatering leads to the development of a so-called depression cone, typically characterized by relatively small but spatially extensive surface subsidence [37,38]. Following mine closure and the termination of pumping operations, the progressive flooding of underground voids initiates groundwater rebound. As demonstrated by the results presented in this study, this process induces gradual surface uplift [39,40]. Such vertical ground movement was also detected at the location of benchmark No. 203, as confirmed by interferometric data obtained from the EGMS service. Between December 2020 and March 2023, the ground surface in the vicinity of benchmark No. 203 experienced uplift estimated at approximately 11 mm. This value was derived from long-term vertical displacement trends of the EGMS grid point located in close proximity to the benchmark. The corresponding time series is presented in Figure 12.
The detected slight uplift at the levelling reference benchmark introduced a systematic bias into all elevation change results obtained during the monitoring period. Considering the estimated cumulative uplift at benchmark No. 203 over the entire observation period (+11 mm), the previously derived relative elevation changes for the remaining benchmarks (as presented in Table 2) were corrected accordingly. After applying this correction, the final elevation changes for all analyzed benchmarks along the observation line indicate consistent surface uplift over the 27-month period (December 2020–March 2023). Along the longitudinal profile defined by the levelling line, the uplift ranges from +11 mm at benchmark No. 203 to nearly +21 mm at benchmark No. 13.
The detailed corrected (final) leveling results (ΔH15-0, 12 December 2020–3 March 2023), representing surface elevation changes during the monitoring period, are presented in Table 4.
The analysis of the results indicates a slow and long-term trend of surface uplift. From a quantitative perspective, high-accuracy data were obtained using the classical method of precise levelling. However, these measurements were limited to the longitudinal profile defined by the established observation line. A broader spatial assessment of the deformation process was made possible through the use of satellite data, including both processed radar scenes and deformation information provided by the EGMS service. In this case, verification of the satellite-derived data was necessary in order to determine their reliability. This verification was carried out using the validated results of the precise levelling measurements along the observation profile. A comparison of surface elevation changes obtained at selected benchmarks of the levelling observation line and the corresponding values derived from the EGMS dataset at nearby grid points is presented in Table 5.
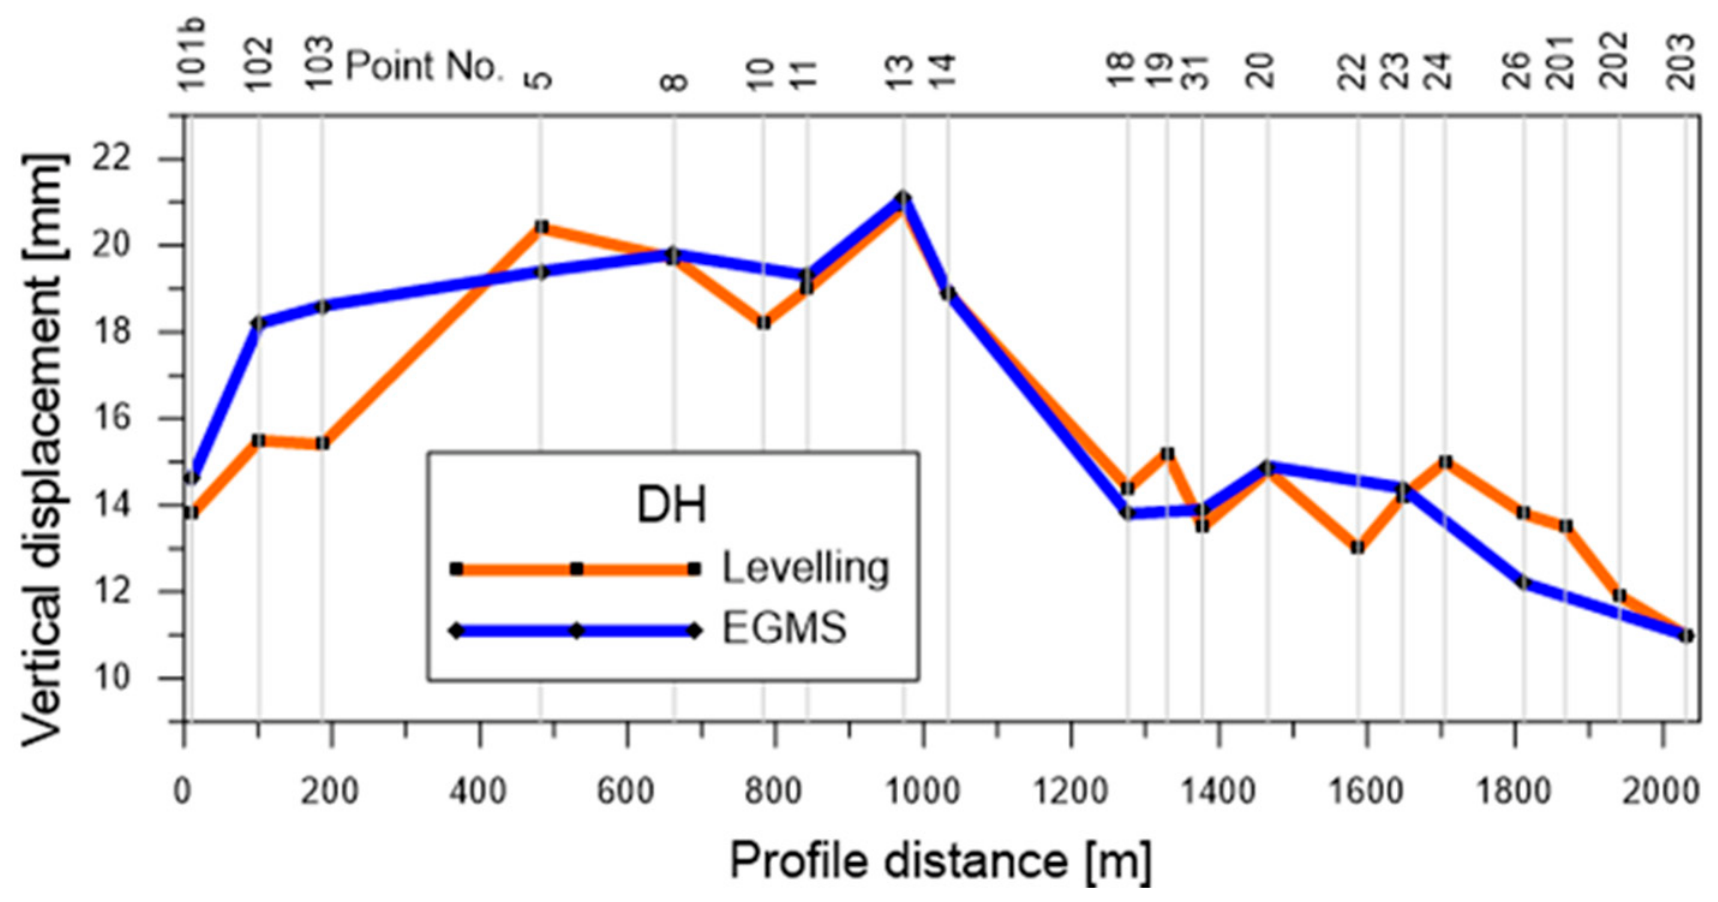
The analysis of the results presented in Table 5 demonstrates a high level of agreement between the compared datasets. The differences between surface elevation changes derived from precise levelling and the corresponding values obtained from the EGMS service reach a maximum of approximately 3 mm. Such discrepancies were observed only at two benchmarks (Nos. 102 and 103). For the remaining analyzed points along the observation line, the absolute differences did not exceed 1 mm. The mean absolute difference amounts to only 0.8 mm and may be interpreted as an indicator of the average deviation of satellite-derived results from those obtained using the conventional geodetic method of precise levelling within the study area. This confirms the high reliability of the satellite-based deformation data in the investigated region. On this basis, it can be concluded that the satellite data adequately represent the spatially distributed character of the surface uplift process, also in quantitative terms. The strong agreement between the classical and remote sensing methods is further supported by the elevation change profiles derived along the approximately 2 km-long leveling observation line. These profiles are presented in Figure 13.
The identified uplift trend is consistently supported by the results obtained from processing the radar scene stack using the PSInSAR method (Section 4.1). The results are presented as displacements along the satellite’s Line-of-Sight (LOS). However, given the predominantly vertical nature of post-mining rebound and the high sensitivity of the Sentinel-1 ascending geometry to vertical motion, these values are interpreted as surface uplift.
The analysis indicates that stress redistribution within the rock mass may have already induced minor surface uplift during the initial phase of monitoring (within the first seven months), with LOS-projected vertical values ranging from 0 mm to approximately +5 mm (Figure 7). During this early stage, the occurrence of slight subsidence, on the order of a few millimeters, cannot be entirely excluded. However, given the small magnitude of the detected changes, the interpretation for this period remains inconclusive. A clear and systematic increase in LOS-projected vertical displacement becomes evident in the subsequent observation intervals. This trend is distinctly visible in Figure 8, Figure 9, Figure 10 and Figure 11. After more than one year of monitoring, LOS-projected vertical displacement of approximately 5 mm can be unambiguously identified (Figure 8), particularly at PS points located immediately west of the leveling observation line. In this area, over the entire InSAR monitoring period from early December 2020 to mid-April 2023, cumulative LOS-projected vertical displacement ranging between 15 mm and 20 mm was observed (Figure 11). These results indicate a relatively low dynamic character of the deformation process. The average LOS-projected vertical movement rate over the nearly 2.5-year observation period (December 2020–April 2023) can be estimated at approximately 8 mm/year and appears to remain nearly constant throughout the analyzed timeframe. The deformation pattern derived from PSInSAR analysis is consistent with the trends identified in the EGMS dataset and is further corroborated by the precise levelling measurements.
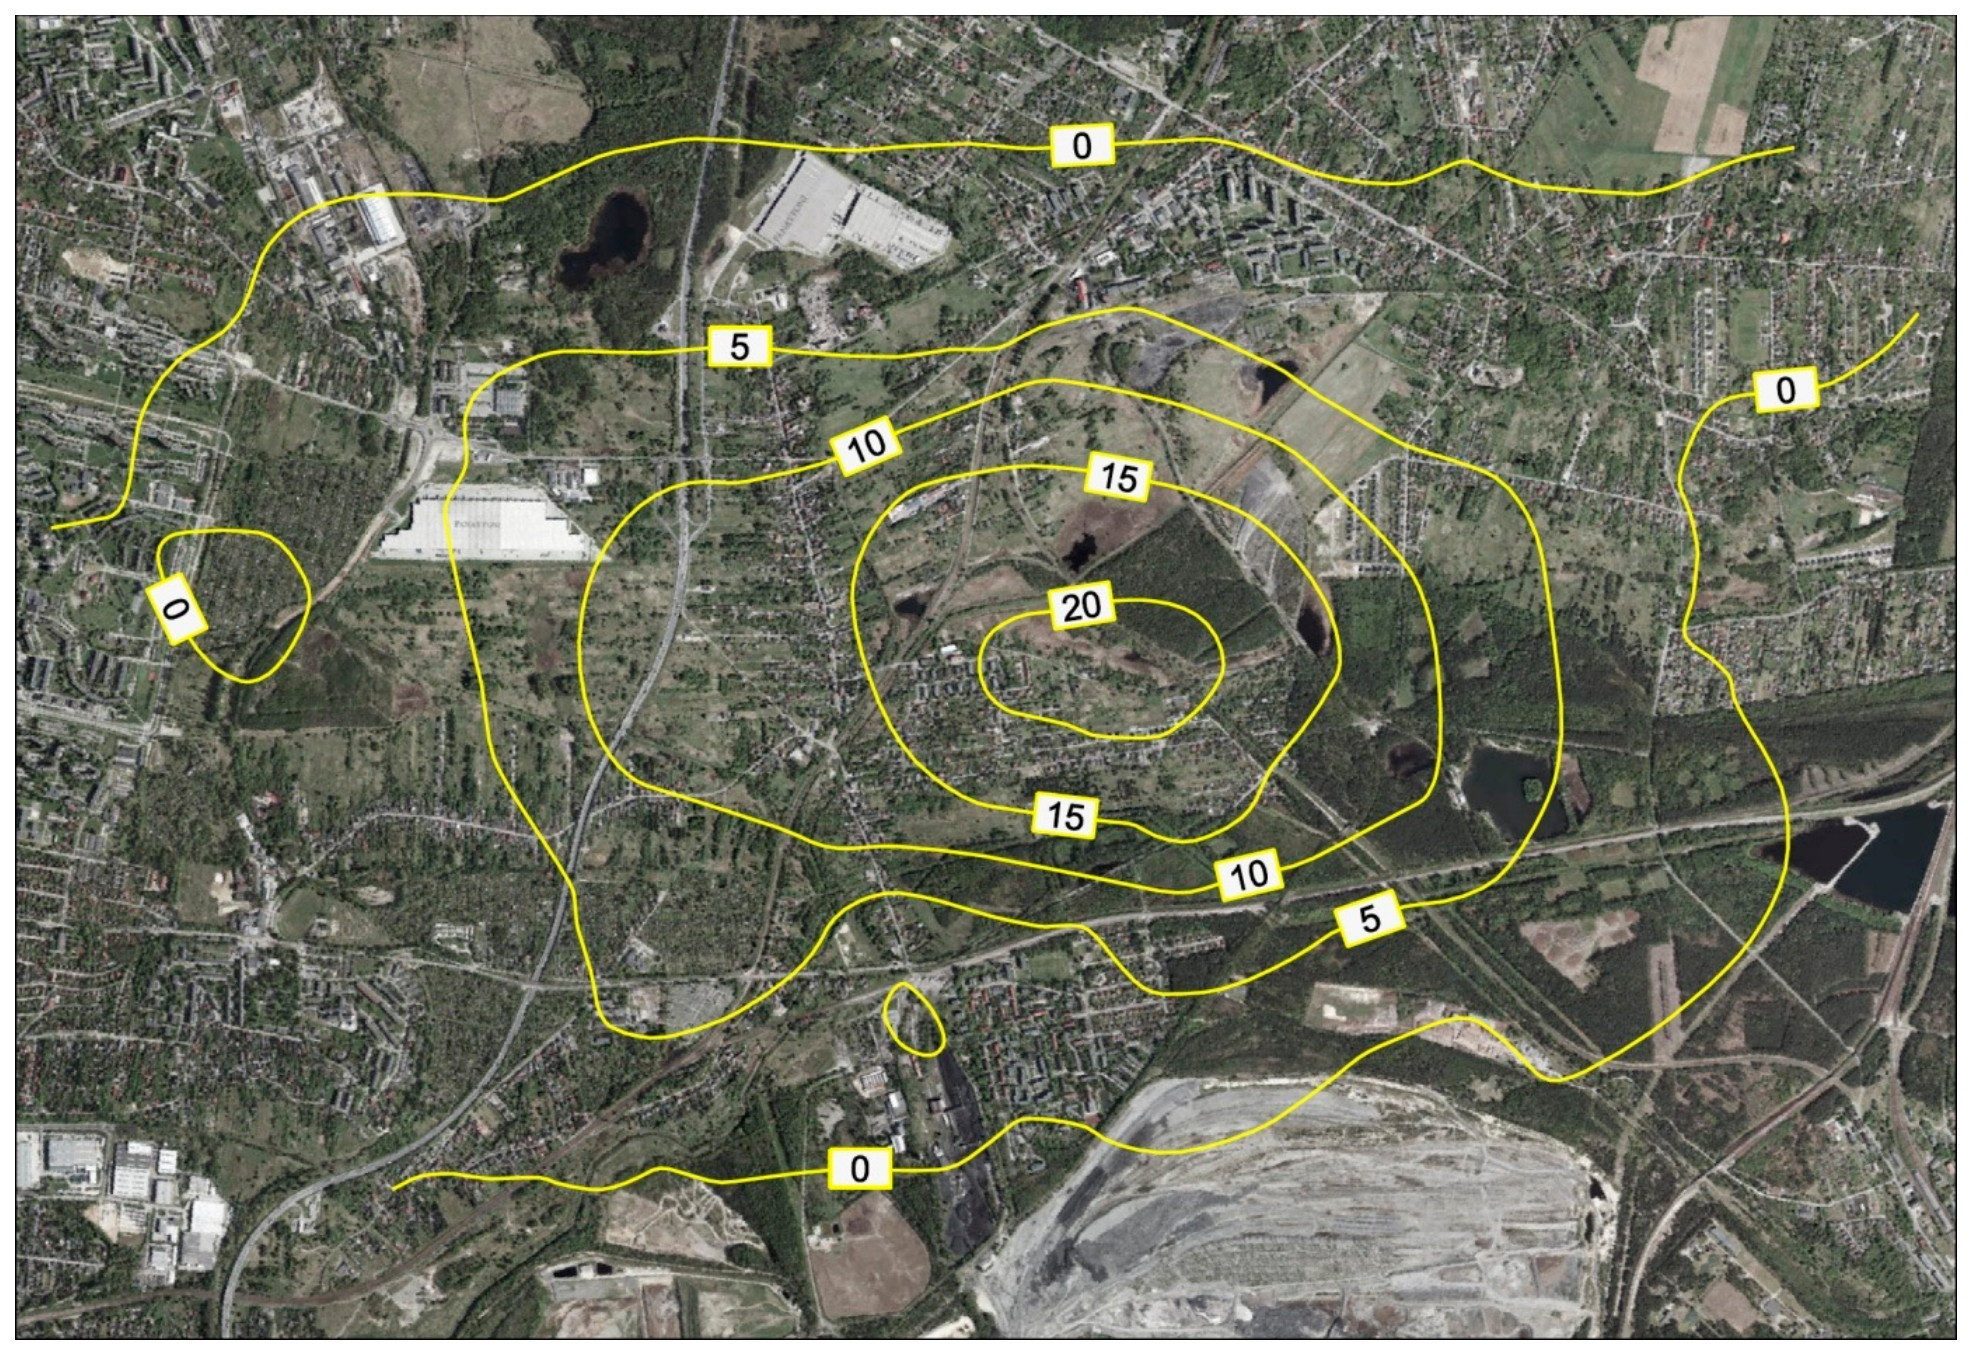
The verification of satellite-derived data against precise levelling measurements confirmed the high reliability of the elevation information provided by the EGMS service within the study area. This validation enabled the use of EGMS data to develop a map of surface elevation changes for the period from December 2020 to March 2023. To this end, relative vertical displacement values were collected and processed for all available EGMS grid points within the study area. Based on the point-based dataset, contour lines were interpolated to produce a surface uplift map, presented in Figure 14. The interpolation was performed using Golden Software Surfer (version 12.0.626) and implemented with the geostatistical kriging method [41]. The resulting map indicates that, during the analyzed period, maximum surface uplift reached approximately 20 mm. This corresponds to a maximum mean annual uplift rate of nearly 9 mm/year. In addition to the quantitative assessment of uplift magnitude, the spatial extent of the detected vertical movements was also determined. Over the nearly 28-month monitoring period, surface uplift was identified across an area of approximately 12 km2.

5. Discussion

Remote sensing techniques based on satellite radar data are currently increasingly applied in the investigation and detection of ground surface movements. This is reflected in the continuous development of advanced processing approaches, enabling the estimation not only of vertical displacements but also of horizontal motion components. However, raw InSAR-derived results should not be interpreted uncritically [42]. One important limitation arises from the non-zero probability of losing a full phase cycle of the radar wavelength between two interferometric acquisitions. During phase unwrapping within a time series, this may lead to the so-called phase unwrapping error or “cycle slip” effect. Such an effect results directly in the underestimation of detected vertical displacements due to the loss of one or several wavelength segments used in surface deformation detection.
These difficulties occur more frequently in areas characterized by relatively high deformation dynamics over short time intervals. Steep gradients of incremental subsidence troughs between consecutive acquisitions may further reduce phase stability. In contrast, long-term, low-magnitude, and spatially smooth deformation processes are less susceptible to this type of error. For these reasons, InSAR-derived deformation results, in the authors’ opinion, require quantitative verification in virtually every case. Even a limited number of highly reliable reference measurements may be sufficient for this purpose.
Such reference data may be obtained from classical geodetic measurements or, alternatively, from high-precision remote techniques. In the case of small-magnitude deformation, precise levelling or static GNSS observations with sufficiently long observation sessions are required. Reliable point-based information derived from these methods enables robust validation of spatially distributed deformation data obtained from radar scene processing.
The methodology described above was implemented in the present study. Surface morphology changes detected using the PSInSAR approach occurred across a substantial area above the underground workings of the closed hard coal mine. The flooding of mine voids led to gradual groundwater rebound within the rock mass, and the associated stress redistribution induced slow upward (LOS-projected vertical displacement) ground movement. Both the independently processed radar scene stack and the EGMS dataset consistently documented the long-term evolution of this process. In accordance with the verification principle outlined above, the satellite-derived results were validated against precise levelling measurements performed specifically for the purposes of this study. After appropriate correction for the reference benchmark displacement, the comparison of results demonstrated very high agreement, with mean absolute differences below 1 mm. This confirmed the high reliability of the analyzed satellite-derived deformation data. Consequently, for the 28-month study period (December 2020–March 2023), a spatial distribution map of surface uplift was developed (Figure 14). The map provides a quantitatively reliable representation of minor elevation changes reaching up to approximately 20 mm during this interval. The validated results obtained for the shorter monitoring period also support the credibility of EGMS data over a longer time span.
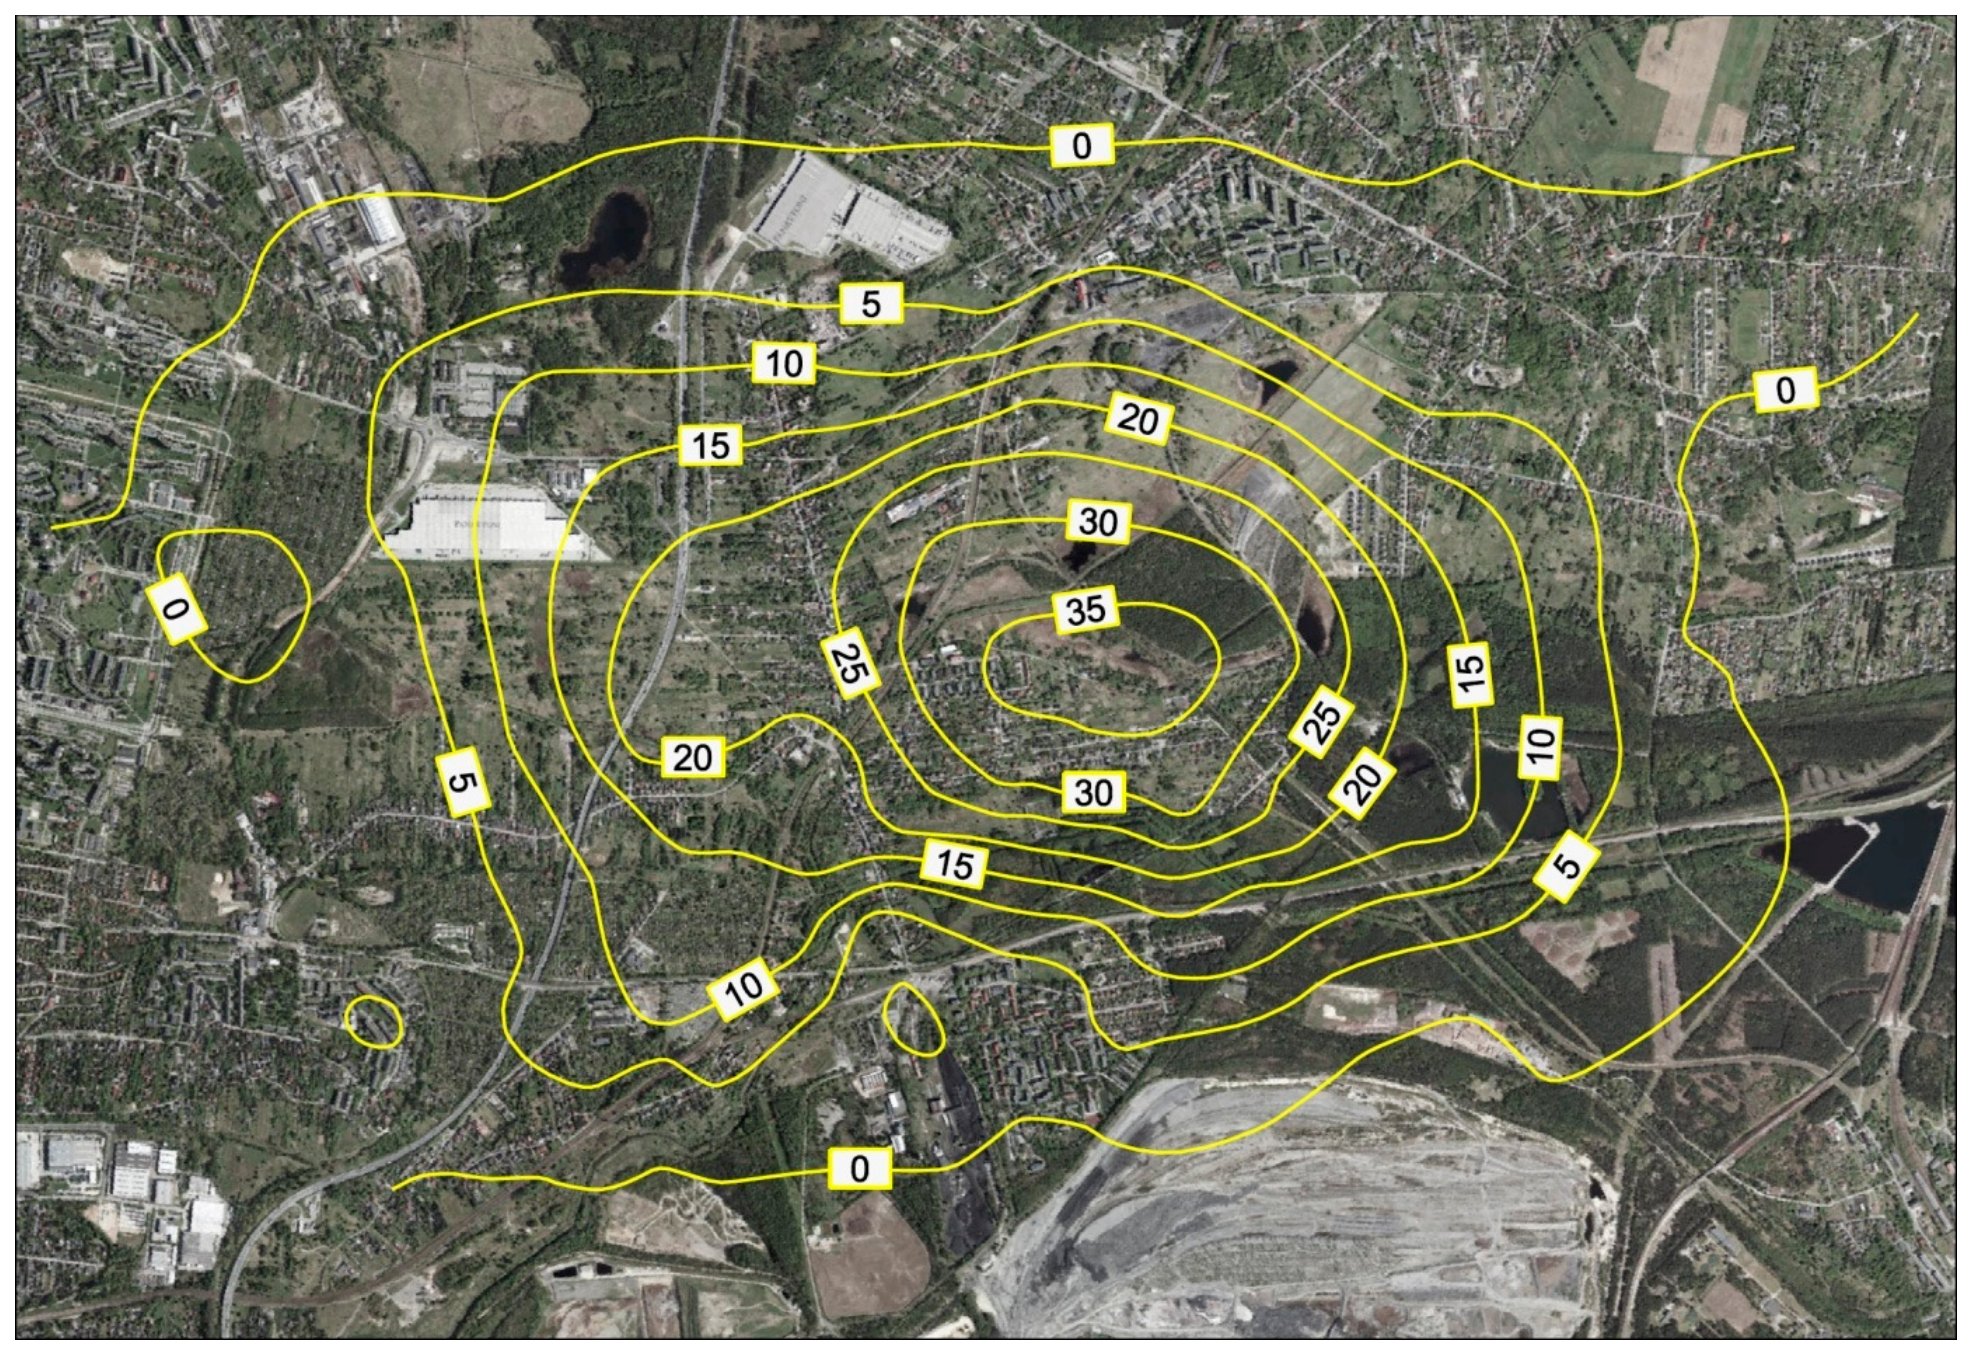
The EGMS dataset covers a total period of 4 years and 9 months, from March 2019 to December 2023, exceeding the duration of the field-based monitoring. Based on these data, a corresponding uplift map for the extended time interval was developed (Figure 15). The quantitative reliability of the presented map is supported by the validation results obtained for its 28-month subset. Specifically, a comparative analysis of the EGMS-derived vertical displacements and precise in situ leveling measurements (ΔH15−0) along the observation line between December 2020 and March 2023 demonstrated a highly consistent match. This comparison validated the assumption of omitting the North–South displacement component (dN = 0) in the EGMS data decomposition. The absolute differences between the leveling and satellite data were remarkably small, with the vast majority of points exhibiting sub-millimeter to millimeter-level differences (ranging from 0.0 mm to 1.0 mm) and only isolated cases showing minor discrepancies up to 3.2 mm. This empirical agreement strongly aligns with the findings of Fuhrmann and Garthwaite [43]. Their research demonstrated that omitting the N-S component during data decomposition actually introduces fewer errors into the vertical displacement estimates, assuming the actual N-S motion is of a similar magnitude to the E-W motion (which is characteristic of relatively isotropic post-mining deformations [44]). Consequently, within this validated subset, setting dN = 0 did not introduce significant geometric artifacts, and no evidence of the previously discussed phase unwrapping errors was identified. This reliability is favored by the low-dynamic and smooth character of the deformation process observed over multi-annual time scales. Therefore, it can be confidently stated that over the nearly five-year period covered by EGMS data, maximum uplift within the analyzed post-mining area reached approximately 35 mm. This corresponds to a mean maximum uplift rate slightly exceeding 7 mm/year, or approximately 0.6 mm/month.
The cumulative uplift of approximately 35 mm observed in this study represents a relatively small fraction of the historical mining-induced subsidence, a proportion consistent with the geomechanical findings of Vervoort [45] who noted that poroelastic rebound typically accounts for only 1–5% of total subsidence. The relationship between groundwater rebound and the observed surface uplift is primarily governed by the principles of poroelasticity and effective stress theory. During the active mining phase, continuous drainage creates a regional depression cone that reduces pore water pressure, thereby increasing the effective stress on the rock matrix and contributing to compaction. In the post-mining phase, however, the cessation of drainage and subsequent flooding of underground workings causes a rise in groundwater levels. This rebound gradually restores hydrostatic pressure, leading to a significant increase in pore fluid pressure in the surrounding rock mass. According to Terzaghi’s principle [46], an increase in pore pressure causes a proportional decrease in effective stress, assuming the total lithostatic stress remains constant. This mechanism is further formalized by Biot’s theory of poroelasticity [47], which describes the coupled interaction between fluid flow and solid matrix deformation in a three-dimensional elastic medium. In this framework, the reduction in effective stress modulated by the Biot coefficient, which accounts for the compressibility of the rock grains—induces a volumetric expansion of the rock matrix. Macroscopically, this expansion propagates upward through the overburden, manifesting as the continuous, low-dynamic surface uplift recorded by Time Series InSAR measurements.

6. Conclusions

The objective of this study was to detect and quantify surface elevation changes in a post-mining area resulting from groundwater rebound within the rock mass. The process was initiated by the adopted mine closure strategy, which involved controlled flooding of underground workings. The investigations were carried out in a selected sector of the former Kazimierz-Juliusz hard coal mine. Ground monitoring was conducted using a dual approach between December 2020 and March 2023. Precise levelling surveys were performed along a permanently stabilized observation line approximately 2 km in length. Simultaneously, satellite radar data (SAR imagery) covering the study area were acquired. In total, 104 Sentinel-1 scenes from orbit 102 were collected, mainly at 6- or 12-day intervals, forming a continuous dataset spanning from 3 December 2020 to 16 April 2023.
Progressive processing of the radar scene stack using the PSInSAR method revealed a gradual uplift trend (LOS-projected vertical movement) that became increasingly evident over longer temporal intervals. Prior to interpretation, the satellite-derived deformation results were quantitatively verified using carefully processed precise levelling measurements along the observation profile. Additionally, processed satellite products provided by the EGMS service were incorporated to extend the spatial and temporal scope of the analysis. In the authors’ view, quantitative validation of InSAR-derived results is an essential step in deformation analysis, as it significantly reduces methodological limitations that may lead to deformation underestimation [48].
In the present study, the mean absolute difference between classical levelling results and satellite-derived displacements at the benchmark locations did not exceed 1 mm. This strong agreement confirmed the high reliability of the analyzed satellite data. The positive outcome of the validation procedure enabled the development of uplift maps for both the 28-month monitoring period and for a longer time interval of 4 years and 9 months (March 2019–December 2023) using EGMS data. The validated subset of the dataset indicates that no phase unwrapping errors occurred in the analyzed time series. This reliability is directly related to the low-dynamic and spatially smooth character of the deformation process observed over a relatively large area. During the 28-month monitoring period, the maximum detected uplift reached approximately 2 cm. Over the nearly five-year interval covered by EGMS data, maximum uplift amounted to approximately 3.5 cm. This corresponds to a mean maximum uplift rate of approximately 7 mm/year (0.6 mm/month).
From the perspective of ground hazard associated with surface morphology changes in post-mining areas, the detected uplift is of low magnitude and does not pose a significant threat to the terrain surface [1,49]. Millimeter-scale annual vertical displacements of this order are comparable to deformation values typically observed within the zone of influence of active underground mining operations, which are generally not considered hazardous to buildings or technical infrastructure. This conclusion can be directly extended to post-mining areas undergoing gradual groundwater rebound.

Author Contributions

Conceptualization, P.S. and V.S.-S.; methodology, P.S.; software, D.M.; validation, P.S. and D.M.; formal analysis, P.S.; investigation, D.M.; resources, D.M.; data curation, P.S. and D.M.; writing—original draft preparation, P.S.; writing—review and editing, V.S.-S. and D.M.; visualization, P.S. and D.M.; supervision, V.S.-S.; project administration, V.S.-S.; funding acquisition, V.S.-S. All authors have read and agreed to the published version of the manuscript.

Funding

This research was funded by Research Fund for Coal and Steel under grant agreement No 899192 (PostMinQuake project), co-financing in Poland by Ministry of Science and Higher Education: “Scientific work published within the framework of an international project” co-funded by the program of the Ministry of Science and Higher Education entitled “PMW” in 2020–2023; contract No. 5124/FBWiS/2020/2, by the AGH University of Krakow, Faculty of Geo-Data Science, Geodesy, and Environmental Engineering (subsidy No. 16.16.150.545), and by the Strata Mechanics Research Institute of the Polish Academy of Sciences through the Own Research Program (project No. FBW/S/2021–2022/R/2023/03).

Data Availability Statement

The European Ground Motion Service (EGMS) data used in this study are publicly available and can be accessed at https://egms.land.copernicus.eu/. The Sentinel-1 radar imagery is publicly available through the Copernicus Data Space Ecosystem (https://dataspace.copernicus.eu/). Other datasets analyzed during the current study (such as the leveling measurement results) are available from the corresponding author upon reasonable request.

Acknowledgments

During the preparation of this manuscript, the authors used ChatGPT (version 5.2) and Google Gemini (version 3) for language translation and editorial support. The authors have reviewed and edited the output and take full responsibility for the content of this publication.

Conflicts of Interest

The authors declare no conflicts of interest.

References

  1. Misa, R.; Sroka, A.; Mrocheń, D. Evaluating Surface Stability for Sustainable Development Following Cessation of Mining Exploitation. Sustainability 2025, 17, 878. [Google Scholar] [CrossRef] [Scilit]
  2. Guzy, A.; Malinowska, A.A. Assessment of the Impact of the Spatial Extent of Land Subsidence and Aquifer System Drainage Induced by Underground Mining. Sustainability 2020, 12, 7871. [Google Scholar] [CrossRef] [Scilit]
  3. Bekendam, R.F.; Pöttgens, J.J.E. Ground Movements over the Coal Mines of Southern Limburg, The Netherlands, and Their Relation to Rising Mine Waters. In Proceedings of the 5th International Symposium on Land Subsidence, The Hague, The Netherlands, 16–20 October 1995; pp. 3–12. [Google Scholar]
  4. Dudek, M.; Tajduś, K.; Misa, R.; Sroka, A. Predicting of Land Surface Uplift Caused by the Flooding of Underground Coal Mines—A Case Study. Int. J. Rock Mech. Min. Sci. 2020, 132, 104377. [Google Scholar] [CrossRef] [Scilit]
  5. Zhao, J.; Konietzky, H.; Herbst, M.; Morgenstern, R. Numerical Simulation of Flooding Induced Uplift for Abandoned Coal Mines: Simulation Schemes and Parameter Sensitivity. Int. J. Coal Sci. Technol. 2021, 8, 1238–1249. [Google Scholar] [CrossRef] [Scilit]
  6. Vervoort, A. Impact of the Hydrogeological Conditions on the Calculated Surface Uplift above Abandoned and Flooded Coal Mines. Geosciences 2022, 12, 454. [Google Scholar] [CrossRef] [Scilit]
  7. Sopata, P.; Sokoła-Szewioła, V. Qualitative Relationship of Seismic Activity with Vertical Displacements of Terrain After Mine Closure with the Use of Dinsar Technology. Geoinform. Pol. 2022, 21, 83–93. [Google Scholar] [CrossRef] [Scilit]
  8. Niederhuber, T.; Rische, M.; Müller, B.; Röckel, T.; Allgaier, F.; Fischer, K.D.; Schilling, F.; Friederich, W. Geomechanics of Flooding-Induced Microseismicity—Implications for Post-Mining Environments. J. Geophys. Res. Solid Earth 2025, 130, e2025JB031323. [Google Scholar] [CrossRef] [Scilit]
  9. Szmigiel, A.; Tajduś, K. A Comprehensive Review of Sinkhole Modeling and Prediction Methods. Arch. Min. Sci. 2025, 70, 293–312. [Google Scholar] [CrossRef] [Scilit]
  10. Blachowski, J.; Wajs, J.; Walerysiak, N.; Becker, M. Monitoring of Post-Mining Subsidence Using Airborne and Terrestrial Laser Scanning Approach. Arch. Min. Sci. 2024, 69, 431–446. [Google Scholar] [CrossRef] [Scilit]
  11. Krawczyk, A.; Perski, Z.; Hanssen, R.F. Application of ASAR Interferometry for Motorway Deformation Monitoring. In Proceedings of the ESA ENVISAT Symposium, Montreux, Switzerland, 23–27 April 2007; Volume 4, pp. 23–27. [Google Scholar]
  12. Raucoules, D.; Foumelis, M. Mining/Post-Mining Surface Deformation. In Remote Sensing for Characterization of Geohazards and Natural Resources; Chaussard, E., Jones, C., Chen, J.A., Donnellan, A., Eds.; Springer Remote Sensing/Photogrammetry; Springer International Publishing: Cham, Switzerland, 2024; pp. 359–369. [Google Scholar]
  13. Apanowicz, B.; Milczarek, W.; Warchala, E. Combination of InSAR Techniques for Modeling the Decay Time of Surface Deformation Rates in Mining-Impacted Areas. Can. J. Remote Sens. 2026, 52, 2640691. [Google Scholar] [CrossRef] [Scilit]
  14. Kovács, D.M.; Kovács, I.P.; Ronczyk, L. Spatiotemporal Evolution of Post-Mining Deformations in Pécs, Hungary: A Multi-Sensor Approach Using Comparative Assessment of PS-InSAR and Geodetic Data. Geomatics 2026, 6, 32. [Google Scholar] [CrossRef] [Scilit]
  15. Ferretti, A.; Prati, C.; Rocca, F. Permanent Scatterers in SAR Interferometry. IEEE Trans. Geosci. Remote Sens. 2001, 39, 8–20. [Google Scholar] [CrossRef] [Scilit]
  16. Ferretti, A.; Fumagalli, A.; Novali, F.; Prati, C.; Rocca, F.; Rucci, A. A New Algorithm for Processing Interferometric Data-Stacks: SqueeSAR. IEEE Trans. Geosci. Remote Sens. 2011, 49, 3460–3470. [Google Scholar] [CrossRef] [Scilit]
  17. Berardino, P.; Fornaro, G.; Lanari, R.; Sansosti, E. A New Algorithm for Surface Deformation Monitoring Based on Small Baseline Differential SAR Interferograms. IEEE Trans. Geosci. Remote Sens. 2002, 40, 2375–2383. [Google Scholar] [CrossRef] [Scilit]
  18. Declercq, P.-Y.; Dusar, M.; Pirard, E.; Verbeurgt, J.; Choopani, A.; Devleeschouwer, X. Post Mining Ground Deformations Transition Related to Coal Mines Closure in the Campine Coal Basin, Belgium, Evidenced by Three Decades of MT-InSAR Data. Remote Sens. 2023, 15, 725. [Google Scholar] [CrossRef] [Scilit]
  19. Samsonov, S.; d’Oreye, N.; Smets, B. Ground Deformation Associated with Post-Mining Activity at the French-German Border Revealed by Novel InSAR Time Series Method. Int. J. Appl. Earth Obs. Geoinf. 2013, 23, 142–154. [Google Scholar] [CrossRef] [Scilit]
  20. Modeste, G.; Gunzburger, Y.; Conin, M.; Diallo, M. Surface Displacements Induced by Underground Activities from 2014 to 2019 in the Former Lorraine Coalfield, Northeastern France. BSGF-Earth Sci. Bull. 2025, 196, 7. [Google Scholar] [CrossRef] [Scilit]
  21. Yang, C.H.; Stemmler, C.; Müterthies, A. Ground Movement Analysis in Post-Mining City Using MTInSAR with Help of European Ground Motion Service. ISPRS Ann. Photogramm. Remote Sens. Spat. Inf. Sci. 2023, X-1/W1-2023, 739–745. [Google Scholar] [CrossRef] [Scilit]
  22. Bateson, L.; Cigna, F.; Boon, D.; Sowter, A. The Application of the Intermittent SBAS (ISBAS) InSAR Method to the South Wales Coalfield, UK. Int. J. Appl. Earth Obs. Geoinf. 2015, 34, 249–257. [Google Scholar] [CrossRef] [Scilit]
  23. Banton, C.; Bateson, L.; McCormack, H.; Holley, R.; Watson, I.; Burren, R.; Lawrence, D.; Cigna, F. Monitoring Post-Closure Large Scale Surface Deformation in Mining Areas. In Proceedings of the Eighth International Conference on Mine Closure, Cornwall, UK, 17–19 September 2013; Australian Centre for Geomechanics: Crawley, Australia, 2013; pp. 97–108. [Google Scholar]
  24. Zhao, R.; Du, S.; Zheng, M.; Guo, Q.; Wang, L.; Wang, T.; Guo, X.; Fernández, J. Advances and Future Directions in Monitoring and Predicting Secondary Surface Subsidence in Abandoned Mines. Remote Sens. 2025, 17, 379. [Google Scholar] [CrossRef] [Scilit]
  25. Chen, B.; Yu, H.; Zhang, X.; Li, Z.; Kang, J.; Yu, Y.; Yang, J.; Qin, L. Time-Varying Surface Deformation Retrieval and Prediction in Closed Mines through Integration of SBAS InSAR Measurements and LSTM Algorithm. Remote Sens. 2022, 14, 788. [Google Scholar] [CrossRef] [Scilit]
  26. Yin, X.; Chai, J.; Deng, W.; Yang, Z.; Tian, G.; Gao, C. Pointwise Modelling and Prediction for Ground Surface Uplifts in Abandoned Coal Mines from InSAR Observations. Remote Sens. 2023, 15, 2337. [Google Scholar] [CrossRef] [Scilit]
  27. Malinowska, A.A.; Witkowski, W.T.; Guzy, A.; Hejmanowski, R. Satellite-Based Monitoring and Modeling of Ground Movements Caused by Water Rebound. Remote Sens. 2020, 12, 1786. [Google Scholar] [CrossRef] [Scilit]
  28. Głowacki, T.; Milczarek, W. Powierzchniowe Deformacje Wtórne Dawnych Terenów Górniczych. Min. Sci. 2013, 20, 39–55. [Google Scholar] [CrossRef]
  29. Guzy, A. Environmental Impacts of Post-Closure Mine Flooding: An Integrated Remote Sensing and Geospatial Analysis of the Olkusz-Pomorzany Mine, Poland. Water 2025, 17, 3337. [Google Scholar] [CrossRef] [Scilit]
  30. Sokoła-Szewioła, V.; Kotyrba, A.; Alheib, M. Methods on Assessment and Monitoring of Seismic Hazards in Coal Post-Mining Areas Guidelines; Silesian University of Technology Publishing House: Gliwice, Poland, 2023. [Google Scholar]
  31. Costantini, M.; Minati, F.; Trillo, F.; Ferretti, A.; Novali, F.; Passera, E.; Dehls, J.; Larsen, Y.; Marinkovic, P.; Eineder, M.; et al. European Ground Motion Service (EGMS). In Proceedings of the 2021 IEEE International Geoscience and Remote Sensing Symposium IGARSS; IEEE: New York, NY, USA, 2021; pp. 3293–3296. [Google Scholar]
  32. Hooper, A. A Multi-temporal InSAR Method Incorporating Both Persistent Scatterer and Small Baseline Approaches. Geophys. Res. Lett. 2008, 35, L16302–L16309. [Google Scholar] [CrossRef] [Scilit]
  33. Crosetto, M.; Monserrat, O.; Cuevas-González, M.; Devanthéry, N.; Crippa, B. Persistent Scatterer Interferometry: A Review. ISPRS J. Photogramm. Remote Sens. 2016, 115, 78–89. [Google Scholar] [CrossRef] [Scilit]
  34. Gee, D.; Sowter, A.; Novellino, A.; Marsh, S.; Gluyas, J. Monitoring Land Motion Due to Natural Gas Extraction: Validation of the Intermittent SBAS (ISBAS) DInSAR Algorithm over Gas Fields of North Holland, the Netherlands. Mar. Pet. Geol. 2016, 77, 1338–1354. [Google Scholar] [CrossRef] [Scilit]
  35. Kratzsch, H. Mining Subsidence Engineering; Springer: Berlin/Heidelberg, Germany; New York, NY, USA, 1983. [Google Scholar]
  36. Reddish, D.J.; Whittaker, B.N. Subsidence: Occurrence, Prediction and Control; Elsevier Science: Amsterdam, The Netherlands, 2012. [Google Scholar]
  37. Guzy, A.; Witkowski, W.T. Land Subsidence Estimation for Aquifer Drainage Induced by Underground Mining. Energies 2021, 14, 4658. [Google Scholar] [CrossRef] [Scilit]
  38. Vervoort, A.; Declercq, P.-Y. Upward Surface Movement above Deep Coal Mines after Closure and Flooding of Underground Workings. Int. J. Min. Sci. Technol. 2018, 28, 53–59. [Google Scholar] [CrossRef] [Scilit]
  39. Fenk, J. Zur Prognose Flutungsbedingter Bergschäden. Markscheidewesen 2015, 118, 8–9. [Google Scholar]
  40. Sroka, A. Ein Beitrag Zur Vorausberechnung Der Durch Den Grubenwasseranstieg Bedingten Hebungen. In Proceedings of the Conference Proceedings 5. Altbergbaukolloquium, Technische Universität Clausthal; Verlag Glückauf: Essen, Germany, 2005; pp. 453–464. [Google Scholar]
  41. Matheron, G. Principles of Geostatistics. Econ. Geol. 1963, 58, 1246–1266. [Google Scholar] [CrossRef] [Scilit]
  42. Sopata, P. Application of Satellite Radar Interferometry InSAR in the Studies and Prediction of Post-Mining Changes in the Surface of the Terrain. Doctoral Thesis, AGH-UST, Kraków, Poland, 2008. (In Polish) [Google Scholar]
  43. Fuhrmann, T.; Garthwaite, M.C. Resolving Three-Dimensional Surface Motion with InSAR: Constraints from Multi-Geometry Data Fusion. Remote Sens. 2019, 11, 241. [Google Scholar] [CrossRef] [Scilit]
  44. Sroka, A.; Preuße, A. Zur Prognose Flutungsbedingter Hebungen. In Proceedings of the 9. Altbergbau-Kolloquium, Leoben, Austria, 5–7 November 2009; pp. 184–196. [Google Scholar]
  45. Vervoort, A. Surface Movement above an Underground Coal Longwall Mine after Closure. Nat. Hazards Earth Syst. Sci. 2016, 16, 2107–2121. [Google Scholar] [CrossRef] [Scilit]
  46. Terzaghi, K. Theoretical Soil Mechanics, 1st ed.; Wiley: Hoboken, NJ, USA, 1943. [Google Scholar]
  47. Biot, M.A. General Theory of Three-dimensional Consolidation. J. Appl. Phys. 1941, 12, 155–164. [Google Scholar] [CrossRef] [Scilit]
  48. Cigna, F.; Esquivel Ramírez, R.; Tapete, D. Accuracy of Sentinel-1 PSI and SBAS InSAR Displacement Velocities against GNSS and Geodetic Leveling Monitoring Data. Remote Sens. 2021, 13, 4800. [Google Scholar] [CrossRef] [Scilit]
  49. Tajduś, K.; Sroka, A.; Dudek, M.; Misa, R.; Hager, S.; Rusek, J. Effect of the Entire Coal Basin Flooding on the Land Surface Deformation. Arch. Min. Sci. 2023, 68, 375–392. [Google Scholar] [CrossRef] [Scilit]
Figure 1. Location of the study area within the Upper Silesian Coal Basin (Poland).
Remotesensing 18 01548 g001
Figure 2. Example of long-term surface elevation changes for a grid point in the EGMS dataset (subsidence observed between March 2019 and December 2023).
Remotesensing 18 01548 g002
Figure 3. Layout of the levelling observation line within the study area.
Remotesensing 18 01548 g003
Figure 4. Layout of the leveling observation line overlaid on the EGMS deformation data in the study area.
Remotesensing 18 01548 g004
Figure 5. Vertical surface displacement recorded in the EGMS dataset (point ID: 30bJpMRTN1) near benchmark 12 of the levelling observation line between December 2020 and March 2023.
Remotesensing 18 01548 g005
Figure 6. Vertical surface displacement recorded in the EGMS dataset (point ID: 30bJpMRTN2) near benchmark 12 of the levelling observation line between December 2020 and March 2023.
Remotesensing 18 01548 g006
Figure 7. Cumulative LOS displacement derived from PSInSAR between 3 December 2020 and 25 June 2021 (7 months).
Remotesensing 18 01548 g007
Figure 8. Cumulative LOS displacement derived from PSInSAR between 3 December 2020 and 3 January 2022 (13 months).
Remotesensing 18 01548 g008
Figure 9. Cumulative LOS displacement derived from PSInSAR between 3 December 2020 and 2 July 2022 (19 months).
Remotesensing 18 01548 g009
Figure 10. Cumulative LOS displacement derived from PSInSAR between 3 December 2020 and 29 December 2022 (25 months).
Remotesensing 18 01548 g010
Figure 11. Cumulative LOS displacement derived from PSInSAR between 3 December 2020 and 16 April 2023 (28 months).
Remotesensing 18 01548 g011
Figure 12. Vertical surface displacement recorded in the EGMS dataset near benchmark No. 203 of the levelling observation line between December 2020 and March 2023 (Point ID: 30bJWbmaUau—reference area for levelling observations).
Remotesensing 18 01548 g012
Figure 13. Surface elevation change profiles along the leveling observation line.
Remotesensing 18 01548 g013
Figure 14. Spatial distribution of land uplift derived from EGMS data (December 2020–March 2023).
Remotesensing 18 01548 g014
Figure 15. Spatial distribution of land uplift derived from EGMS data (March 2019–December 2023).
Remotesensing 18 01548 g015
Table 1. Sentinel-1 SAR data characteristics.
ParameterValue
Track102 (Ascending)
Acquisition period3 December 2020–16 April 2023
Number of SAR scenes104
Temporal interval6 days/12 days
Imaging modeInterferometric Wide Swath (IW)
Frequency bandC-band
Table 2. Relative surface elevation changes at the benchmarks of the levelling observation line between December 2020 and March 2023.
Point No.ΔH15-0 [mm]
12 December 2020–3 March 2023
Point No.ΔH15-0 [mm]
12 December 2020–3 March 2023
Point No.ΔH15-0 [mm]
12 December 2020–3 March 2023
Point No.ΔH15-0 [mm]
12 December 2020–3 March 2023
101b2.8107.2194.2244.0
1024.5118.0312.5262.8
1034.4139.9203.82012.5
59.4147.9222.02020.9
88.7183.4233.22030.0
Table 3. Comparison of vertical displacement results obtained from precise leveling and the EGMS dataset.
Point No.WEGMS
[mm]
15 December 2020
WEGMS
[mm]
11 March 2023
ΔHEGMS
[mm]
15 December 2020–11 March 2023
NEGMS
[m]
EEGMS
[m]
101b14.228.814.63,060,1504,976,650
10215.033.218.23,060,1504,976,750
10316.535.118.63,060,1504,976,850
52.722.119.43,060,1504,977,150
819.439.219.83,060,0504,977,250
10
1116.635.919.33,060,0504,977,550
1313.534.621.13,060,0504,977,650
1414.933.818.93,059,9504,977,650
1810.224.013.83,059,7504,977,850
19
3111.125.013.93,059,6504,977,850
2011.826.714.93,059,8504,977,850
22
239.824.214.43,059,8504,977,950
24
269.121.312.23,059,9504,978,150
201
202
2034.815.811.03,059,6504,978,450
Table 4. Corrected surface elevation changes at the benchmarks of the levelling observation line between December 2020 and March 2023.
Point No.ΔH15-0 [mm]
12 December 2020–3 March 2023
Point No.ΔH15-0 [mm]
12 December 2020–3 March 2023
Point No.ΔH15-0 [mm]
12 December 2020–3 March 2023
Point No.ΔH15-0 [mm]
12 December 2020–3 March 2023
101b13.81018.21915.22415.0
10215.51119.03113.52613.8
10315.41320.92014.820113.5
520.41418.92213.020211.9
819.71814.42314.220311.0
Table 5. Comparison between leveling measurements and data from the EGMS service.
Point No.ΔH15-0 [mm]
12 December 2020–3 March 2023
ΔHEGMS [mm]
15 December 2020–11 March 2023
Absolute Difference [mm]
101b13.814.60.8
10215.518.22.7
10315.418.63.2
520.419.41.0
819.719.80.1
1018.2--
1119.019.30.3
1320.921.10.2
1418.918.90.0
1814.413.80.6
1915.2--
3113.513.90.4
2014.814.90.1
2213.0--
2314.214.40.2
2415.0--
2613.812.20.4
20113.5--
20211.9--
20311.011.0-
Disclaimer/Publisher’s Note: The statements, opinions and data contained in all publications are solely those of the individual author(s) and contributor(s) and not of MDPI and/or the editor(s). MDPI and/or the editor(s) disclaim responsibility for any injury to people or property resulting from any ideas, methods, instructions or products referred to in the content.