


Highlights
What are the main findings?
- The Sea and Land Surface Temperature Radiometer (SLSTR) performs better than its design accuracy of , when validated with ships4sst SST at the skin interface (SSTskin) data, showing Robust Standard Deviations (RSDs) as low as for nighttime data.
- SLSTR stability is excellent throughout the validation period of 2018 to 2025 and can be seen as a Climate Data Record (CDR).
What are the implications of the main findings?
- Fiducial Reference Measurement (FRM) data are essential for the validation of CDRs.
- Shipborne FRM data organized through ships4sst provides an invaluable resource for satellite SST validation.
Abstract
SST data derived from multi-spectral infrared measurements made by the SLSTR instruments onboard the Copernicus Sentinel-3 satellites are considered reference measurements based on the design features of the SLSTR instrument. This means that regular long-term validation of the end-to-end performance using independent reference data is essential. This paper presents a sustained SLSTR SST validation activity between 2018 and 2025 based on an extensive set of near-contemporaneous and co-located in situ reference measurements. In situ measurements are derived from high-performance shipborne infrared radiometers that are calibrated regularly against International System of Units (SI) reference standards maintained by a National Metrology Institute (NMI). As such, they are classified as FRMs. The shipborne radiometers are operated by several organizations that co-operate within the International Shipborne FRM Radiometer Network (ISFRN), under the auspices of the European Space Agency (ESA) ships4sst project (a quasi-operational SSTskin measurement program with a common data format and traceable measurements). The mean measured differences between the SLSTR on Sentinel-3A (S3A) and the ships4sst FRM data are with a RSD of for nighttime retrievals and with an RSD of for daytime retrievals. For Sentinel-3B (S3B), the mean measured differences between the SLSTR and the ships4sst data are with an RSD of for nighttime retrievals, and with an RSD of for daytime retrievals. Our comparisons validate the consistency and performance of the Copernicus Sentinel-3 SLSTR SST data and provide the means to link these satellite measurements to NMI reference standards, which is essential for justifying the status of SLSTR SST data as a CDR.
1. Introduction
Sea Surface Temperature (SST) is one of the most readily measurable essential climate variables (ECVs) [1], and SST derived from satellite sensors is widely used for a number of applications and from a number of different satellite payloads [2]. However, if satellite-derived SST data are to be considered a true Climate Data Record (CDR), they need to be traceable to International System of Units (SI) [3]. The pre-launch characterization and calibration of a satellite sensor provides a radiometric calibration of the sensor validated against accurate and traceable reference blackbody reference radiance sources under a flight-representative thermal vacuum environment [4]. Once in flight, it is the pre-launch calibration and characterization data that define the on-board calibration and overall instrument performance. To qualify as a CDR, the satellite SST data must be accompanied by an independent set of ground reference SST measurements that are traceable to SI as part of a validation program throughout the satellite mission. Such ground reference data are known as Fiducial Reference Measurements (FRMs) [5]. The pre-launch satellite calibration and characterization tests provide an essential reference that ensures that the flight data of the satellite instrument are calibrated to SI standards needed for surface temperature measurements and to FRM quality SST provided by shipborne radiometers. The validation of SST using FRMs differs from, for example, the CDR described by [6]. FRMs are independent ground measurements that provide users with confidence in satellite data products through independent validation results and the estimation of satellite measurement uncertainties over the lifetime of the satellite mission. To achieve this, FRMs must possess the following mandatory characteristics [7]:
- FRMs provide documented evidence of SI traceability through inter-comparison of instruments under operational conditions;
- FRMs are independent of the satellite SST retrieval process;
- An uncertainty budget for all FRM instruments and derived measurements is available and maintained, traceable to SI, ideally via a National Metrology Institute (NMI);
- FRM protocols and community-wide management practices (measurement, processing, archive, documents, etc.) are defined and consistently followed.
SST data derived from multi-spectral infrared measurements made by the Sea and Land Surface Temperature Radiometer (SLSTR) instruments [8,9] on board the Copernicus Sentinel-3 satellites [10] are considered reference measurements based on the design features of the SLSTR instrument [8]. This means that regular long-term validation of the end-to-end performance using independent reference data is essential [11]. In the context of the Copernicus Sentinel-3 SLSTR instrument, the European Space Agency (ESA) implemented the ships4sst project that introduced the FRM requirements consistently across a number of shipborne infrared radiometer data providers and over the lifetime of the Sentinel-3 satellite mission. This paper presents a sustained SLSTR SST validation activity between 2018 and 2025 based on an extensive set of near-contemporaneous and co-located in situ reference measurements. Section 2 provides a summary overview of the Sentinel-3 SLSTR instrument. Section 3 describes the ships4sst project. Section 4 introduces the FRM radiometers used to collect the FRMs that are used in the analysis presented in Section 5. A discussion follows in Section 6 with conclusions drawn in the final section of the paper.
2. The Copernicus Sentinel-3 SLSTR
The SLSTR instrument [8] extends the heritage of the Advanced Along Track Scanning Radiometer (AATSR) instrument series [12] into an operational context. The SLSTR includes a wider dual view swath of 740 km compared to the AATSR swath of 512 km and an even wider nadir swath of 1400 km. Other changes are the addition of extra visible channels for improved cloud masking and fire channels for detecting wildfires. The primary mission objective for the instrument is to retrieve SST at the skin interface (SSTskin) with an uncertainty of ± (1 ) for a degree latitude/longitude area with a temporal stability of /decade [13]. SLSTR is a conical scanning imaging radiometer implementing the along-track-scanning dual view measurement technique [14] to provide robust atmospheric correction for SST retrieval. Channels in the Visible (VIS), Sortwave Infrared (SWIR) and Thermal Infrared (TIR) spectrum (0.55 μm, 0.66 μm, 0.85 μm, 1.6 μm, 3.7 μm, 10.8 μm and 12 μm) are included in the design with additional channels at and to enhance thin cirrus cloud detection [15]. Oblique and nadir view optical scan chains are implemented, which can be selected via an innovative “flip” mirror mechanism. Each optical chain views alternatively one of two identical calibration reference black body cavities every second scan. A sun diffuser for visible channel gain calibration is viewed once per orbit. The SLSTR design ensures the spectral and radiometric integrity of all measurements because both oblique and nadir measurements are made through common focal plane optics and detectors and share the same calibration Black Bodies (BBs) and VISCAL unit [13]. A full description of the Sentinel-3 SLSTR can be found in [8]. Sentinel-3A was launched in 2016 into a sun-synchronous orbit, similar to that of the AATSR. Sentinel-3B was launched in 2018 into the same orbital plane but separated in phase by 140 degrees. Sentinel-3 SLSTR-A and SLSTR-B have operated continuously after commissioning and remain operational at this time. Sentinel-3C is due for launch in 2026 and Sentinel-3D in 2028 as replacements for the A and B units, which will be de-orbited at the end of their operational lifetime in line with the ESA policy on clean space.
3. Ships4sst Project
The ships4sst project was initiated by ESA as the International Shipborne FRM Radiometer Network (ISFRN) in 2014 to coordinate the international shipborne TIR satellite validation activities in support of the Copernicus Sentinel-3 SLSTR. The project was designed to ensure that SI traceable standards would be available to “bridge the gap” and tie the SLSTR sensor to the long-term AATSR data, which stopped operating in 2012. In addition, the project included activities that ensured shipborne TIR measurements are fully traceable to SI standards including corresponding uncertainty budgets. Ref. [7] lists the requirements for such a network:
- To validate, using independent measurements, the performance and validity of the atmospheric compensation algorithm used in the satellite SST retrieval.
- To monitor any degradation or change of specific satellite instrument performance across the entire mission lifetime.
- To validate the performance of data products derived from a satellite SST mission.
- To provide an independent reference data set that can be used to bridge between different satellite missions.
- For satellite SST algorithm development in its own right.
- For fundamental research and development related to air–sea interactions and the emission of TIR electromagnetic waves from the sea surface.
- To provide an independent CDR in its own right (although limited in geographical coverage).
The ISFRN brought together world leaders in the field of ship-borne infrared radiometers and organized a radiometer inter-comparison exercise at the National Physical Laboratory, Teddington, UK (NPL) in 2016 [16]. The network was continued as the ESA ships4sst project to ensure that the time series of Infrared Sea Surface Temperature Autonomous Radiometer (ISAR) [17] and Scanning Infrared Sea Surface Temperature Radiometer (SISTeR) [18] measurements that were used to validate the AATSR, and other TIR satellite SST measurements since 2004 continue for the lifetime of SLSTR. The ships4sst project predominantly aims to validate Sentinel-3A and Sentinel-3B SLSTR SSTs and other satellite data products using FRMs from in situ TIR radiometers. The project provides ESA and its partners with a long-term time series of accurate and stable in situ measurements of SST for climate applications across the globe. Ships4sst also provides a forum for an international network of ocean and remote sensing scientists to develop the use of shipborne infrared radiometers for measurements of SSTskin. The network includes operators, designers, and builders of such instruments, as well as the users of the data. The ships4sst website, www.ships4sst.org, provides a central hub for all users and providers of shipborne FRM data. This includes measurement protocols, a netCDF data format, a central data archive and information on the activities of the group.
4. Validation Data
4.1. Fiducial Reference Measurement Data
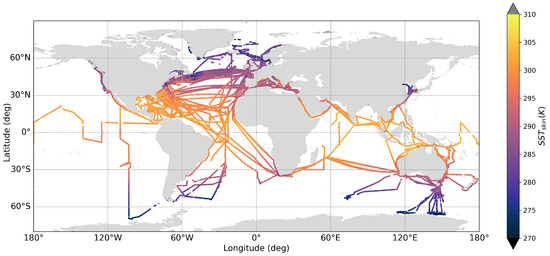
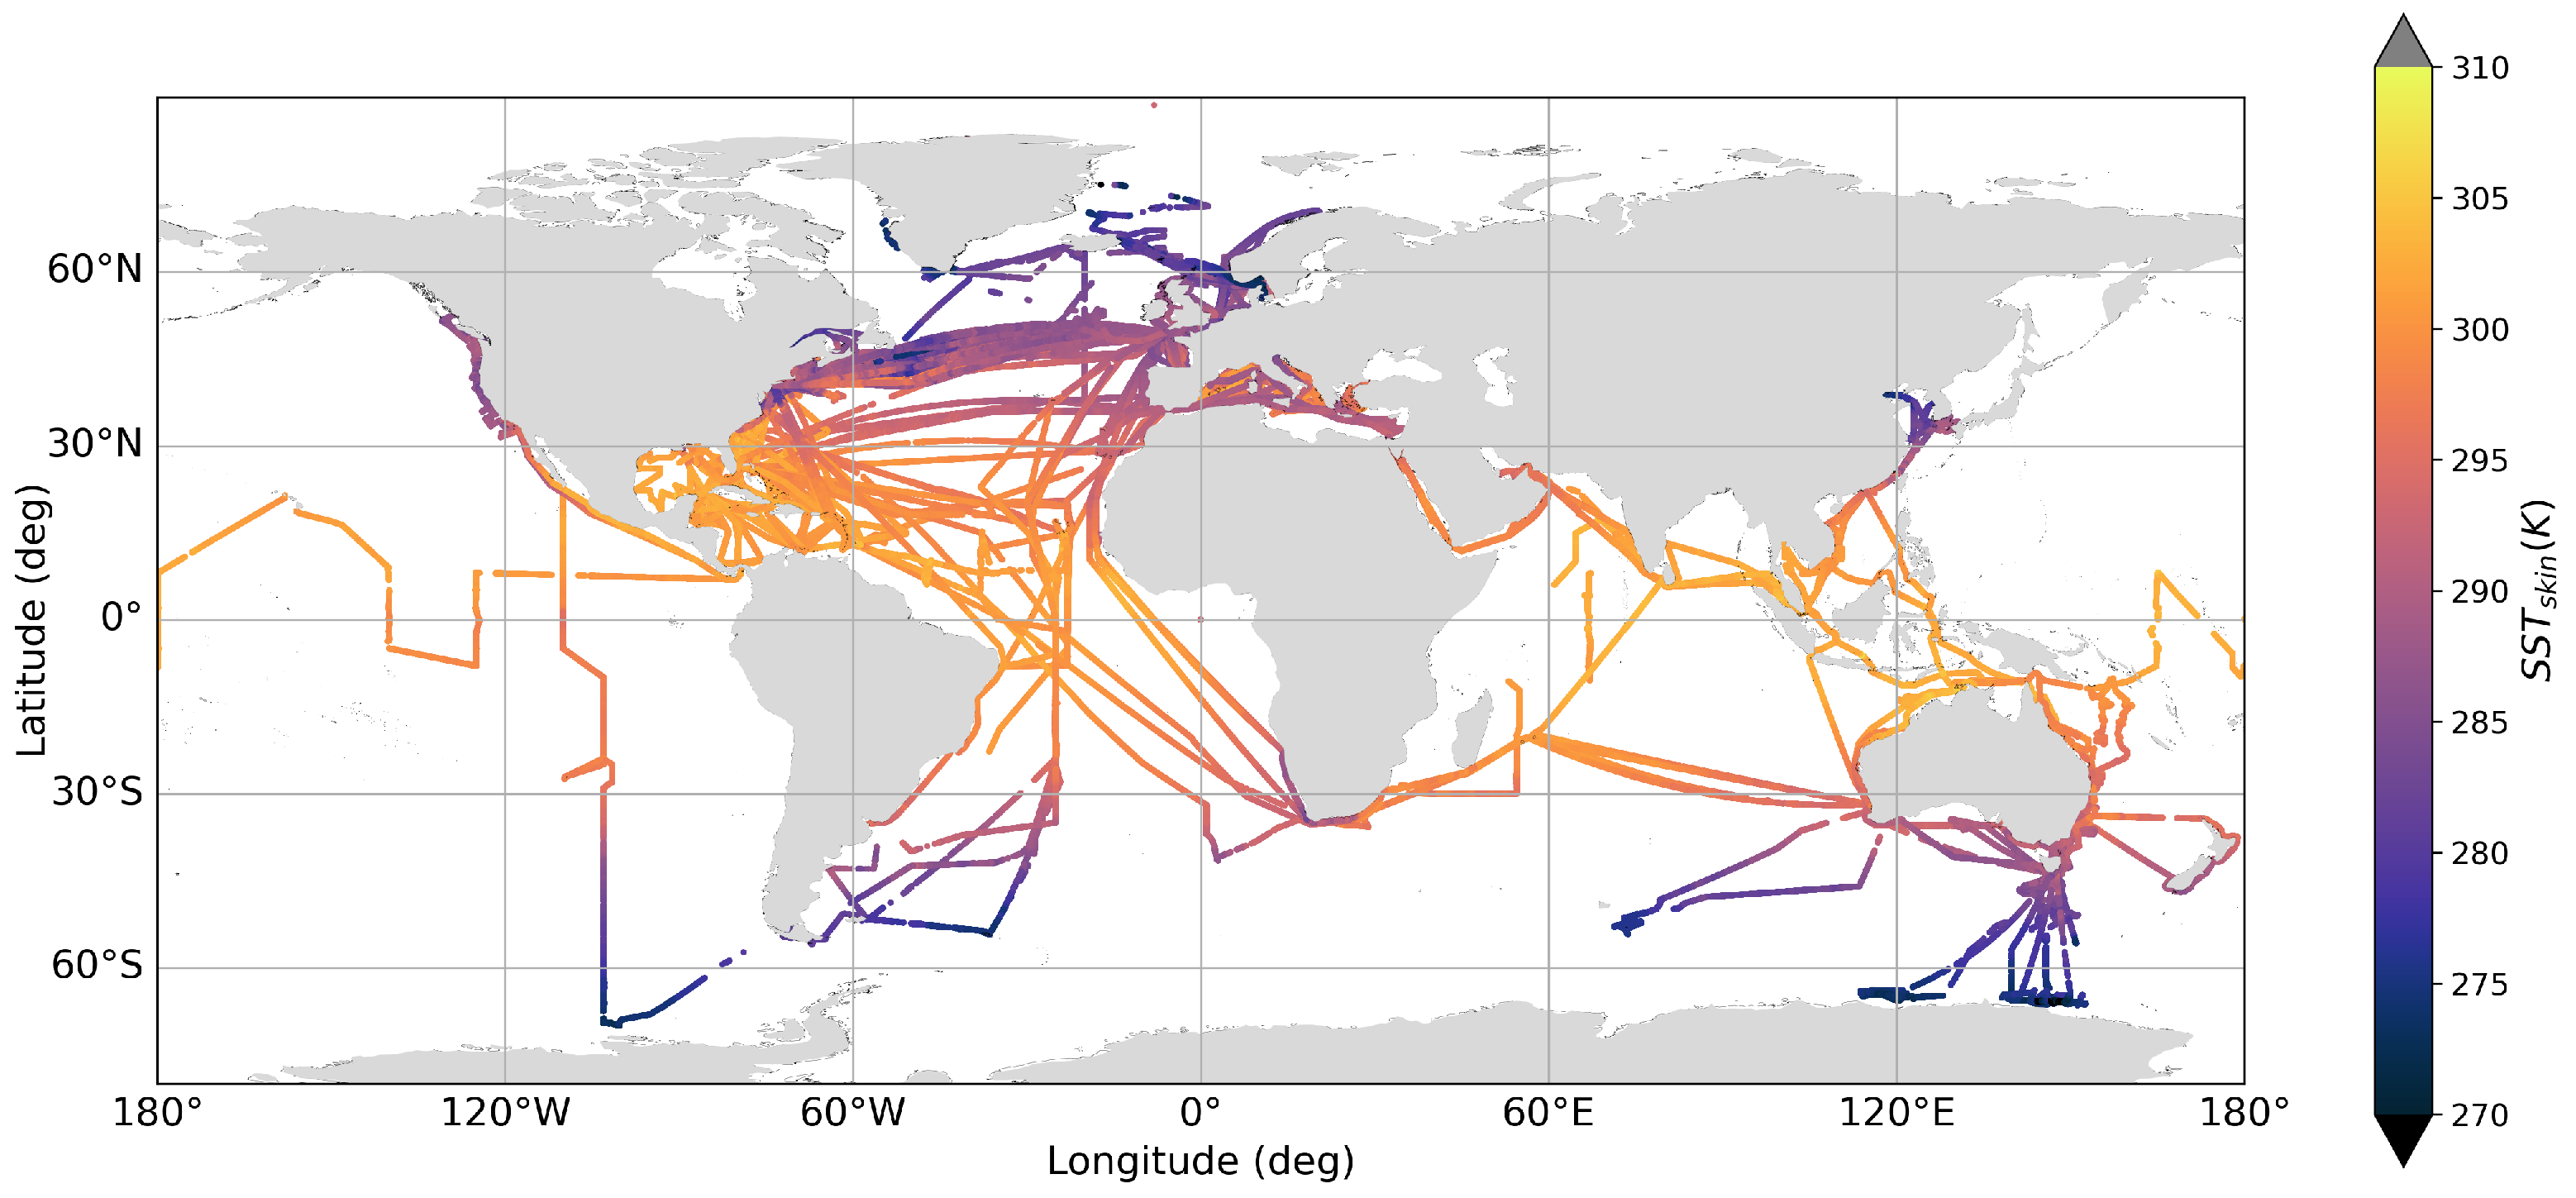
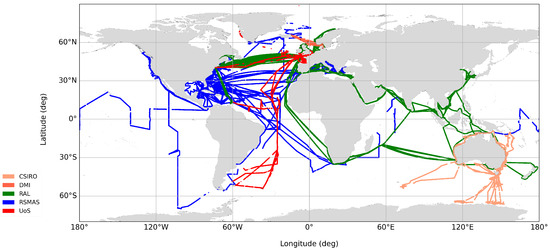
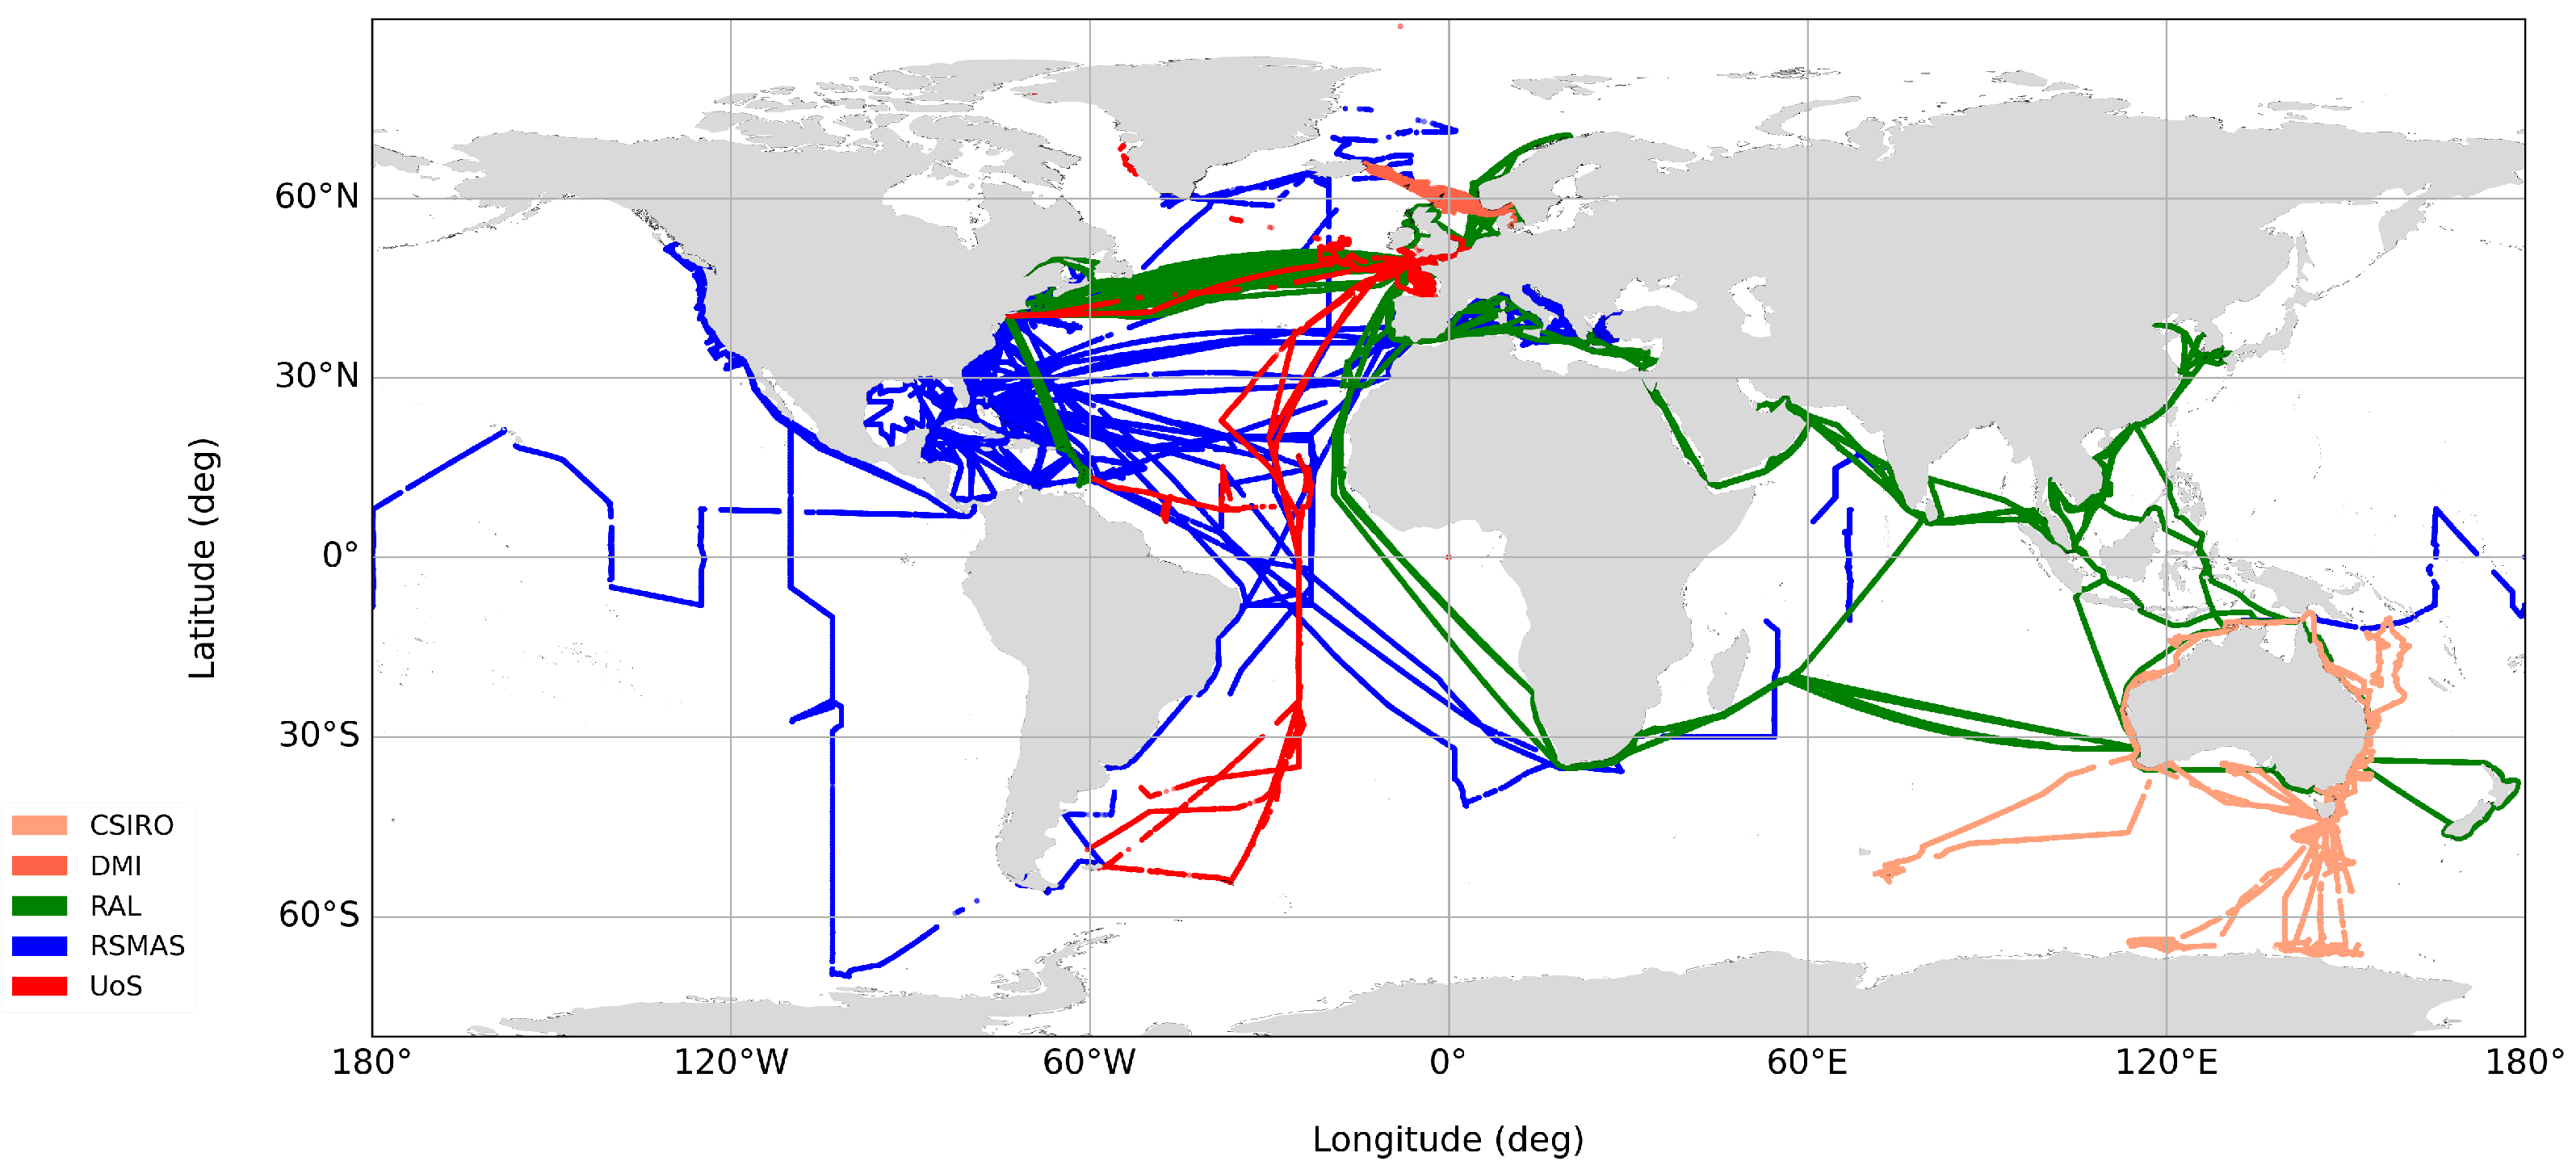
FRM data for SST are mainly acquired with Infrared Shipborne Radiometers (ISRs), such as ISAR [17,19], SISTeR [18] and Marine Atmospheric Emitted Radiance Interferometer (M-AERI) [20]. The ships4sst project provides a platform to coordinate the collection and storage of FRM data sets in a standardized netCDF format. Figure 1 shows a SST map of the ships4sst archive data and Figure 2 shows the ships4sst data color-coded by the partner organization who collected the data.
Figure 1.
The ships4sst data archive L2R files plotted as SST on a world map.
Figure 2.
The ships4sst data archive L2R files plotted as by data provider and instrument type. Routes shown in red tones were collected with ISARs (UoS, DMI and CSIRO), routes shown in green were collected with a SISTeR (RAL) and routes shown in blue were collected with M-AERI (RSMAS) instruments.
In order to make ISR data a FRM, the instruments are calibrated before and after each deployment against an TIR BB source traceable to SI units through an NMI, such as the Combined Action for the Study of the Ocean Thermal Skin (CASOTS) II [7] BB. Additionally, the traceability of both the shipborne radiometers and the laboratory calibration targets are confirmed on a regular basis through inter-comparisons such as the ESA-funded FRM for validation of Surface Temperature from Satellites (FRM4STS) campaign, held in 2016 at NPL [16], and the subsequent FRM for validation of Sea Surface Temperature (FRM4SST) inter-comparison that took place in 2022 [21,22].
Each in situ radiometer measurement has an individual uncertainty assigned. All SST data in the ships4sst archive contain associated SST uncertainties based on a dedicated uncertainty model [19] derived from first principles. Each instrument component is analyzed and assigned an uncertainty that is propagated through an instrument model to estimate the uncertainty in the measured SST.
The vertical temperature structure of the ocean is complex and varies with time. At wavelengths near to 10 , the penetration depth of radiation in water is of order 10 and consequently the ISRs sample the extreme sea surface, or SSTskin [23]. This is the same temperature that is observed by satellite radiometers and can be compared directly, unlike thermometric temperatures collected at depth. The characteristic timescale of variability for the skin temperature is on the order of seconds at scales of centimetres, which complicates the matching of in situ radiometer SSTskin measurements with those derived over a 1 km spatial area from the SLSTR instrument in space.
4.1.1. The Infrared Sea Surface Temperature Autonomous Radiometer (ISAR)
The ISAR [17] is a self-calibrating, single-channel (9.6 μm to 11.5 μm) scanning radiometer with two internal calibration BBs; one BB is operated at ambient temperature and the other BB is heated to about 12 above ambient. Since there is no protective window in the sky view or sea view, the ISAR design incorporates a shutter that closes to prevent the ingress of rain or sea spray, thus protecting the optical components inside the casing but preventing temperature measurements during precipitation events. The shutter is controlled by a rain detector mounted close to the instrument, providing the control for autonomous operation of ISAR for up to 3 months. The ISAR’s internal calibration is checked against a CASOTS II BB [24] before and after each deployment in line with ships4sst protocols [7], ch5.2. ISARs are deployed routinely on Ferries in the English Channel, the Bay of Biscay and the Irish Sea. They have also been deployed on British research vessels such as the Royal Research Ship (RRS) Discovery, RRS James Cook and RRS James Clark Ross on Atlantic meridional transects as well as in Greenland and Namibia.
4.1.2. The Scanning Infrared Sea Surface Temperature Radiometer (SISTeR)
The SISTeR is an autonomous chopped, self-calibrating infrared filter radiometer. It has a divergent beam with a full cone angle of 12° and is usually operated with a filter centred at . The Noise Equivalent Differential Temperature (NEDT) for a measurement near to ambient temperatures is 30 . SISTeR was designed in 1994, made its first deployment in 1997, and has been deployed regularly from 2006 on the Color Line Color Festival and Prinsesse Ragnhild Ferries (Skagerrak) and from 2010 on the Cunard Line Queen Mary 2 liner (North Atlantic and worldwide). The instrument is programmed to take a repeating pattern of radiometric measurements of the sea surface, the sky, and two internal BB calibration sources. These data, along with housekeeping measurements of the instrument state, are stored locally and forwarded daily by email for processing to SST. The instrument calibration is checked both before and after every deployment against an independent CASOTS BB source. The consistency of these tests and their repeatability validate the performance of the instrument over a deployment. The instrument is overhauled as required between deployments. Typically, this might include the replacement of the weather door seal and scan mirror, depending on condition.
4.1.3. The Marine Atmospheric Emitted Radiance Interferometer (M-AERI)
The M-AERI [20] is a seagoing development of the Atmospheric Emitted Radiance Interferometer (AERI), and is a robust, accurate, self-calibrating, seagoing Fourier Transform Infrared (FTIR) spectroradiometer that is deployed on marine platforms to measure the emission spectra from the sea surface and marine atmosphere. The M-AERI performs spectral measurements in a range from 3 to 18 with a resolution of 0.5 cm−1, using two Infrared (IR) detectors to cover the wide spectral range. The detectors are cooled to 78 with a Stirling cycle cooler to reduce the detector noise to an equivalent temperature difference of less than . The M-AERI design includes two BBs, one heated and one at ambient temperature to provide real-time calibration of each measurement. The gold-plated scan mirror, which can be programmed to step through a pre-selected range of angles, directs the field of view from the FTIR to scan the BB targets or views of the sea or sky. The FTIR averages measurements over a pre-selected time frame in order to improve the signal to noise ratio. A typical measurement cycle has a duration of 5 to 12 min, includes the two BB views, two sky views and one sea view. The absolute accuracy of the IR spectra produced is determined by the quality of the onboard BB cavities and [20] states it as better than . The M-AERI is calibrated before and after each deployment and is traceable to National Institute of Standards and Technology, USA (NIST) reference standards. The various M-AERIs, spanning three generations, have been deployed on a number of research vessels and cruise liners over 25 years [25].
4.2. Copernicus Sentinel-3 SLSTR Data
SLSTR data are obtained in subsets provided by the High-Resolution Diagnostic Data Set (HRDDS) system Felyx tool running at the European Organization for the Exploitation of Meteorological Satellites (EUMETSAT). Felyx is used to access and study long-term archives of satellite earth observations [26]. It allows users to extract and match satellite and in situ data from various sources to provide Match-up Database (MDB) files in netCDF data format, including all the SLSTR data and the ships4sst data. The MDB files are generated first by finding the match-up pairs between SLSTR and ships4sst data, secondly by extracting a pixel area of SLSTR data around the match-up point and thirdly by extracting six hours of ships4sst data before and after the match-up point. The Felyx MDB includes the Level-1b products, and the Level 2 Water Surface Temperature (WST) and Water Composed Temperature (WCT) products as produced by EUMETSAT and described in [27,28]. For this study, we focused on the Level 2 products including the WST data, the SLSTR dual view three-channel product (D3), SLSTR dual view two-channel product (D2), SLSTR nadir view three-channel product (N3) and SLSTR nadir view two-channel product (N2), which are part of the WCT product as shown in Table 1.
Table 1.
SLSTR SST data product description (see [27]).
The WST product is considered the best performing single-coefficient SST field for any given part of the SLSTR swath, using an atmospherically smoothed pixel average of the difference between the SSTs and the mean Brightness Temperature (BT) value [27]. The Felyx MDB files were reprocessed to allow multiple match-up pairs per satellite overpass following the approach set out in [29] and summarized in Table 2. Each satellite pixel is matched to one FRM SSTskin data point, with no averaging applied, either to the satellite data or to the FRM data. The nominal resolution of a SLSTR pixel is 1 km and a FRM SSTskin measurement represents between 1 km and 2 km of surface track, assuming a target measurement time of 1 to 3 min and a ship speed of 20 knots.
Table 2.
SLSTR—ships4sst match-up grades and the relating match-up window size (from [29]).
Different match-up grades are defined, based on the temporal and spatial criteria used to determine coincidences between the SLSTR and ships4sst. Only the highest quality satellite data, as defined by the the Group for High-Resolution Sea Surface Temperature (GHRSST) quality level, were used. Table 3 shows the definition of the GHRSST quality levels for SLSTR data and only Quality Level 5 data were used for this paper.
Table 3.
SLSTR GHRSST quality levels (from [28], Tables 7 and 8).
5. Results
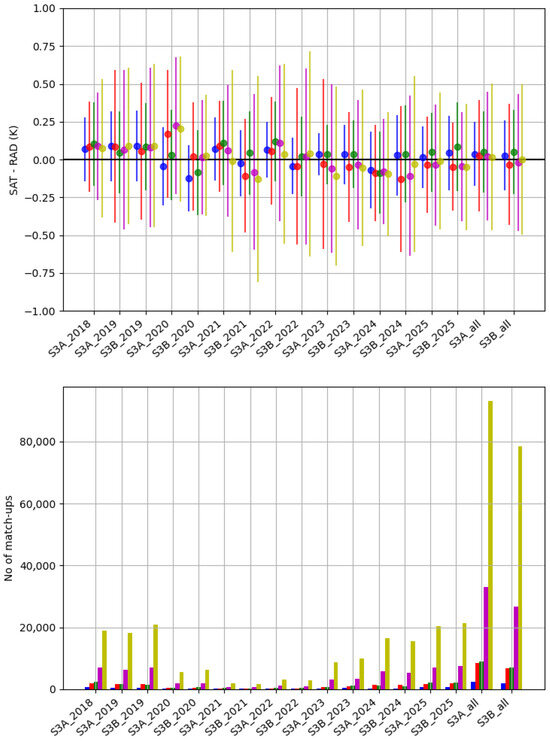
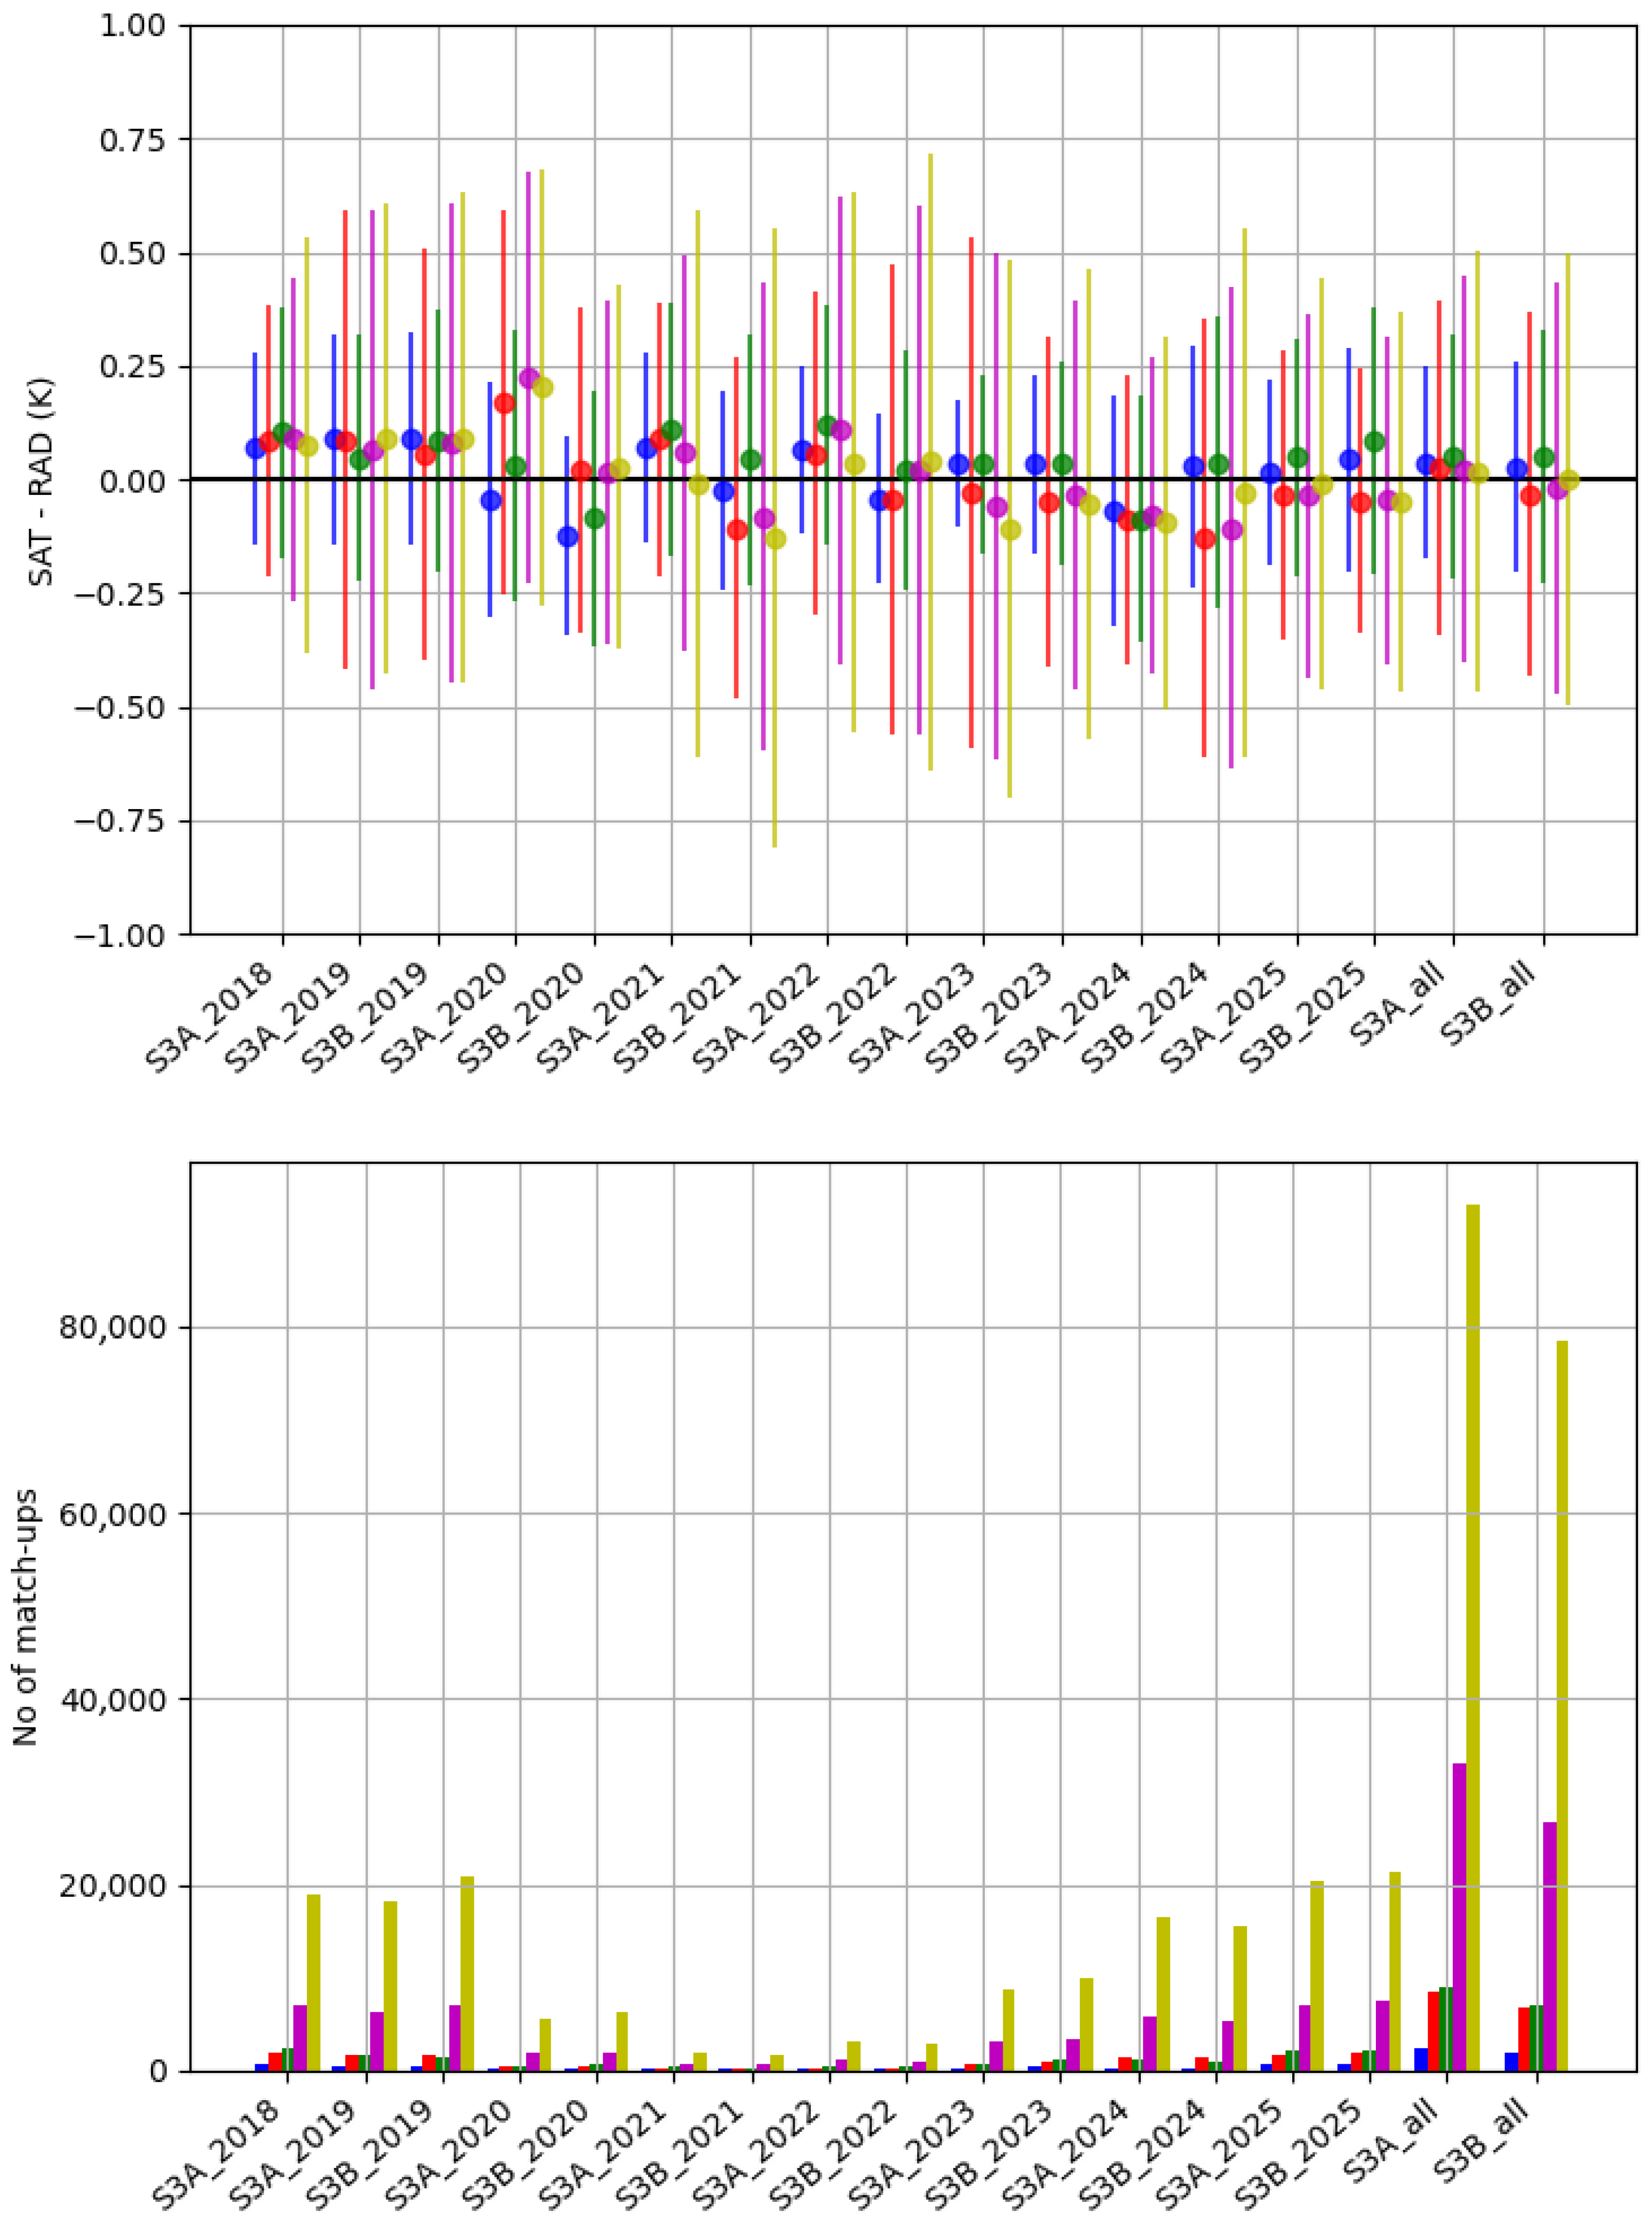
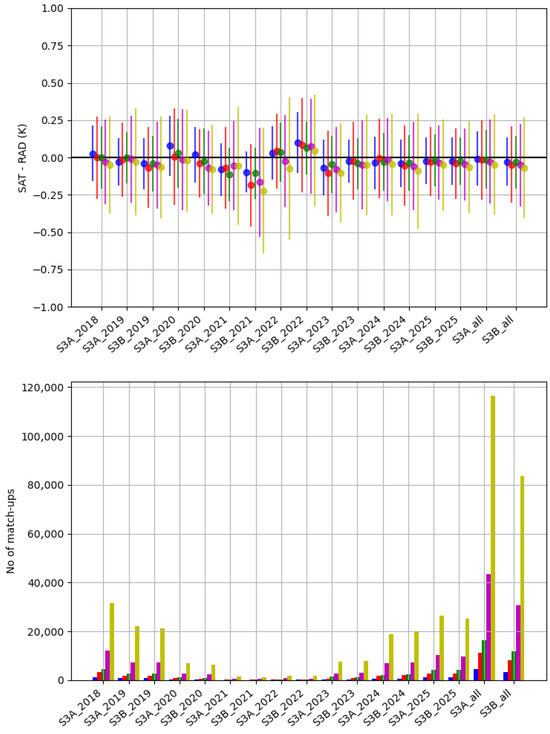
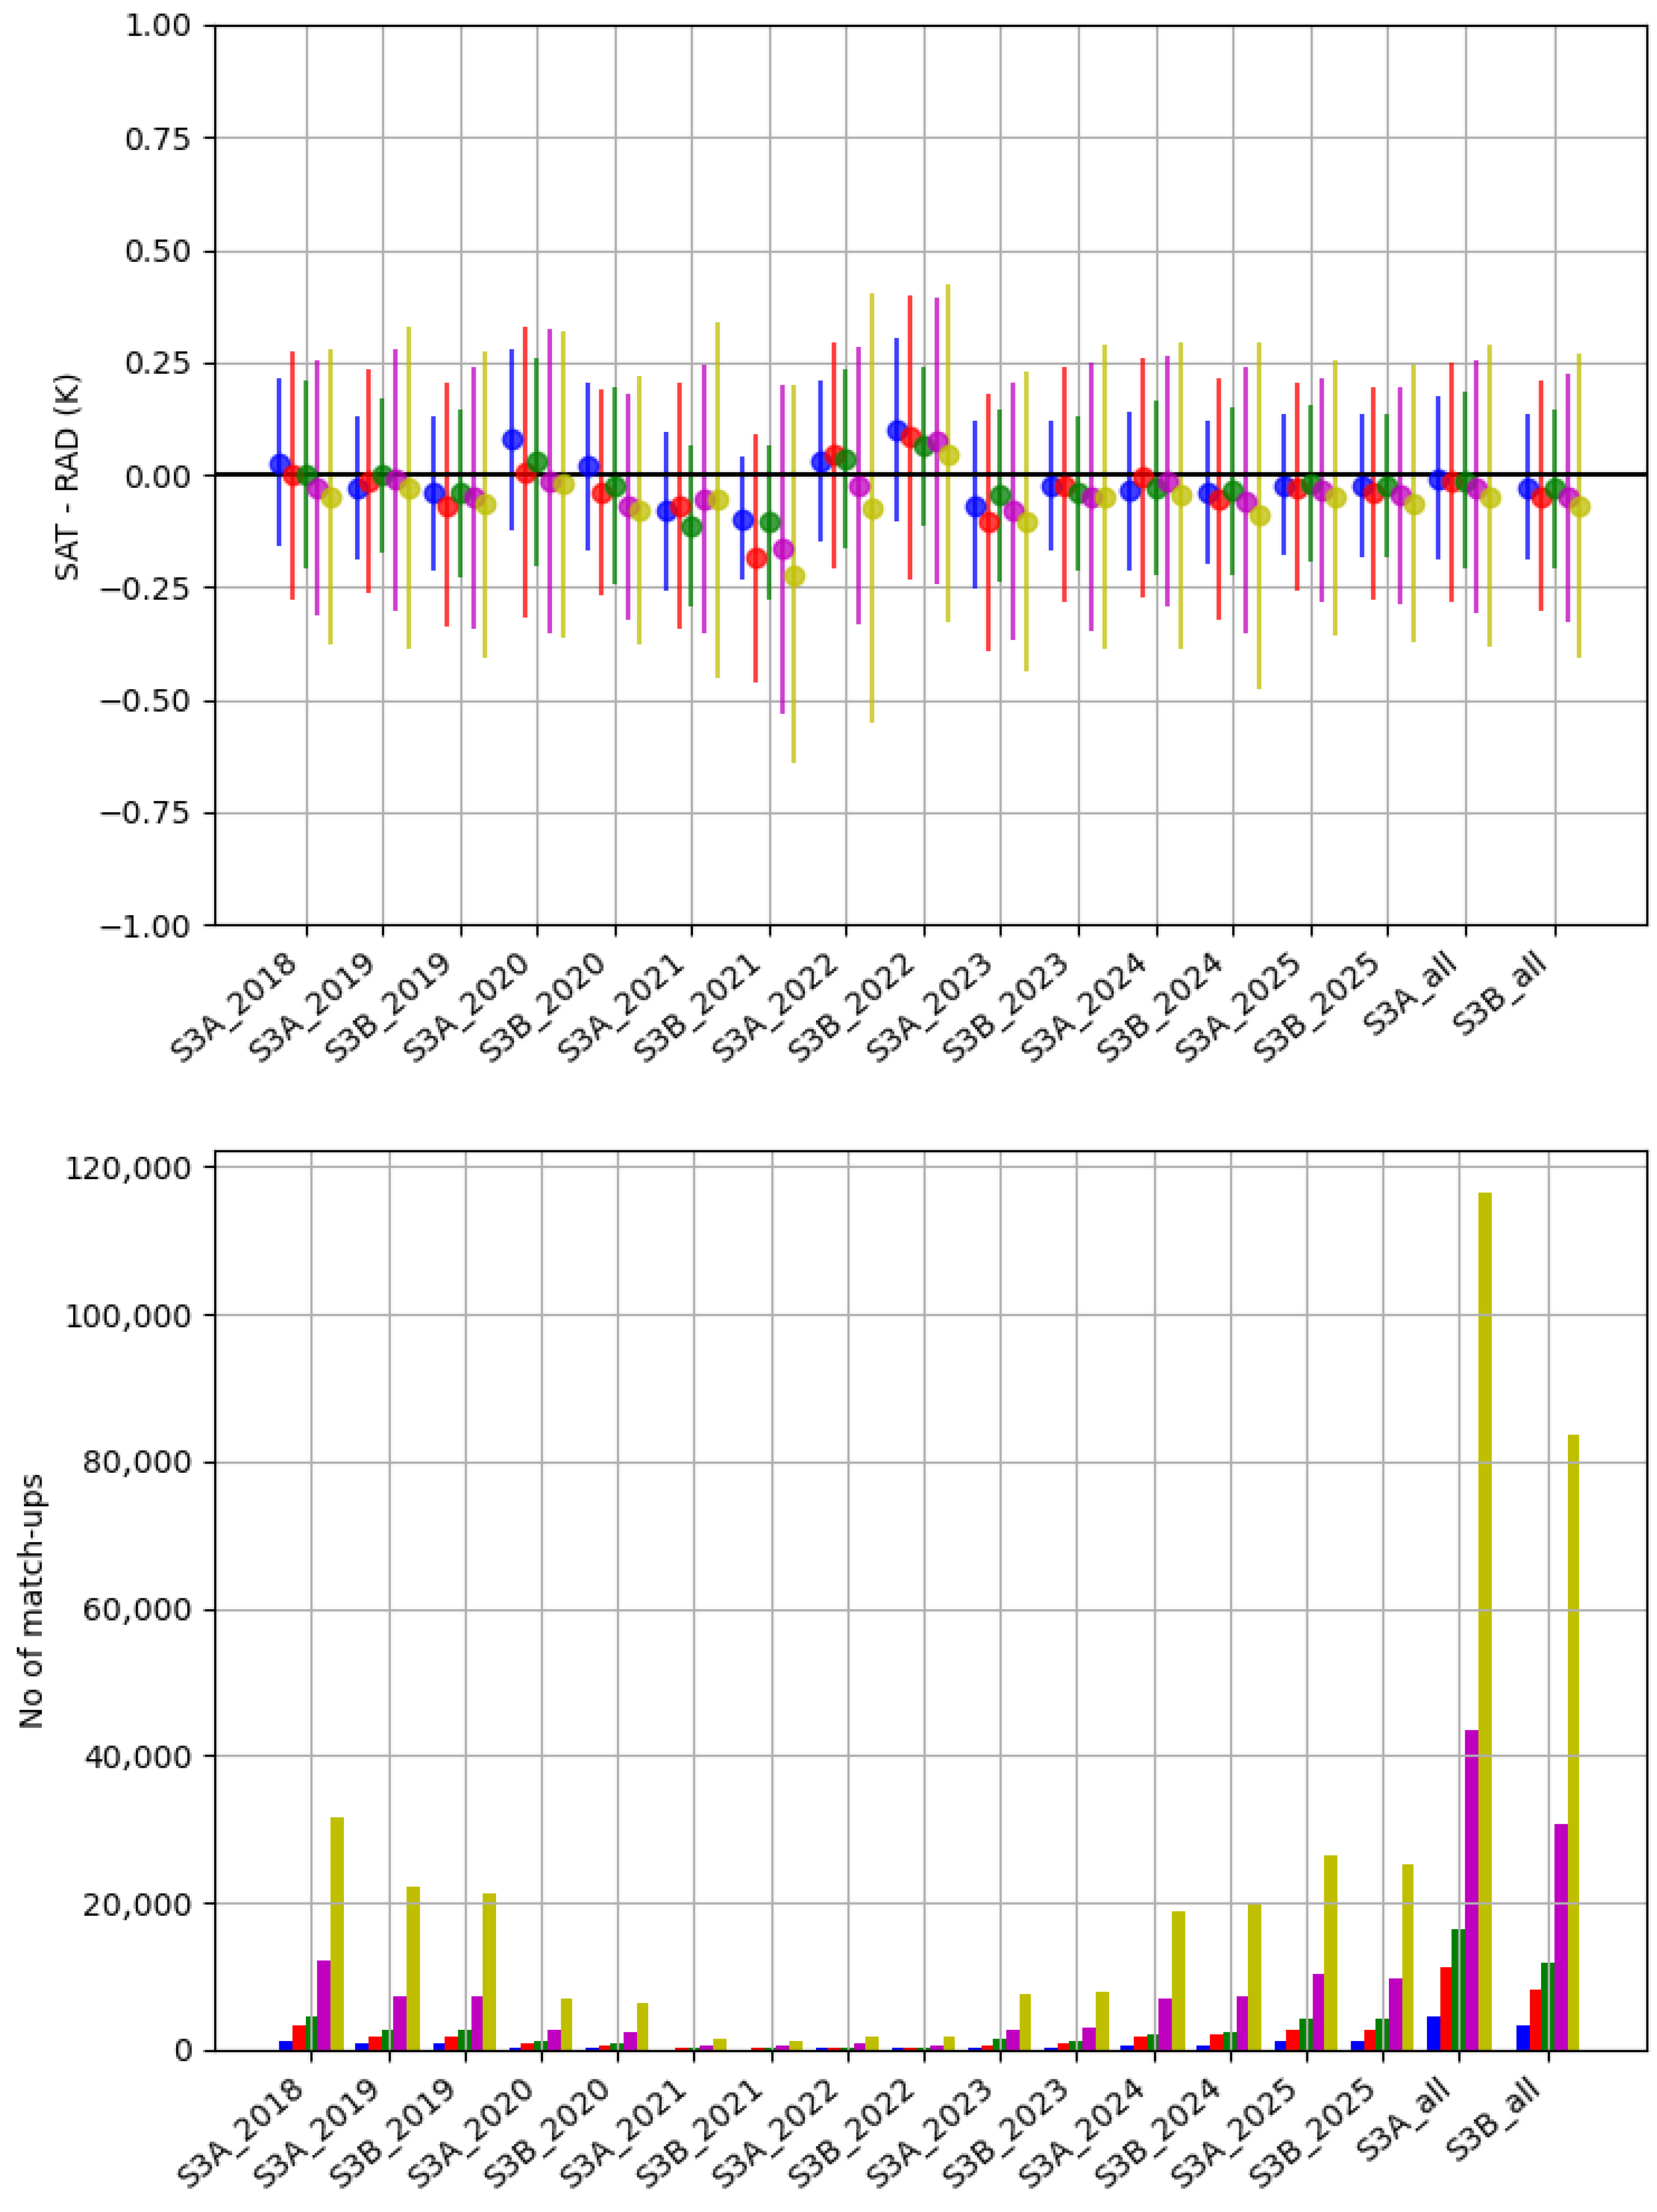
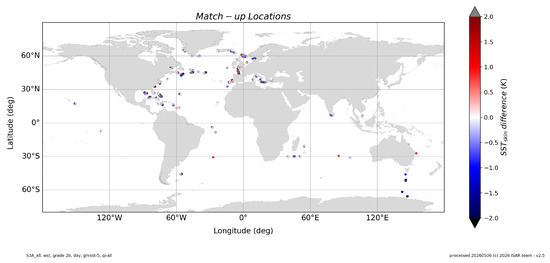
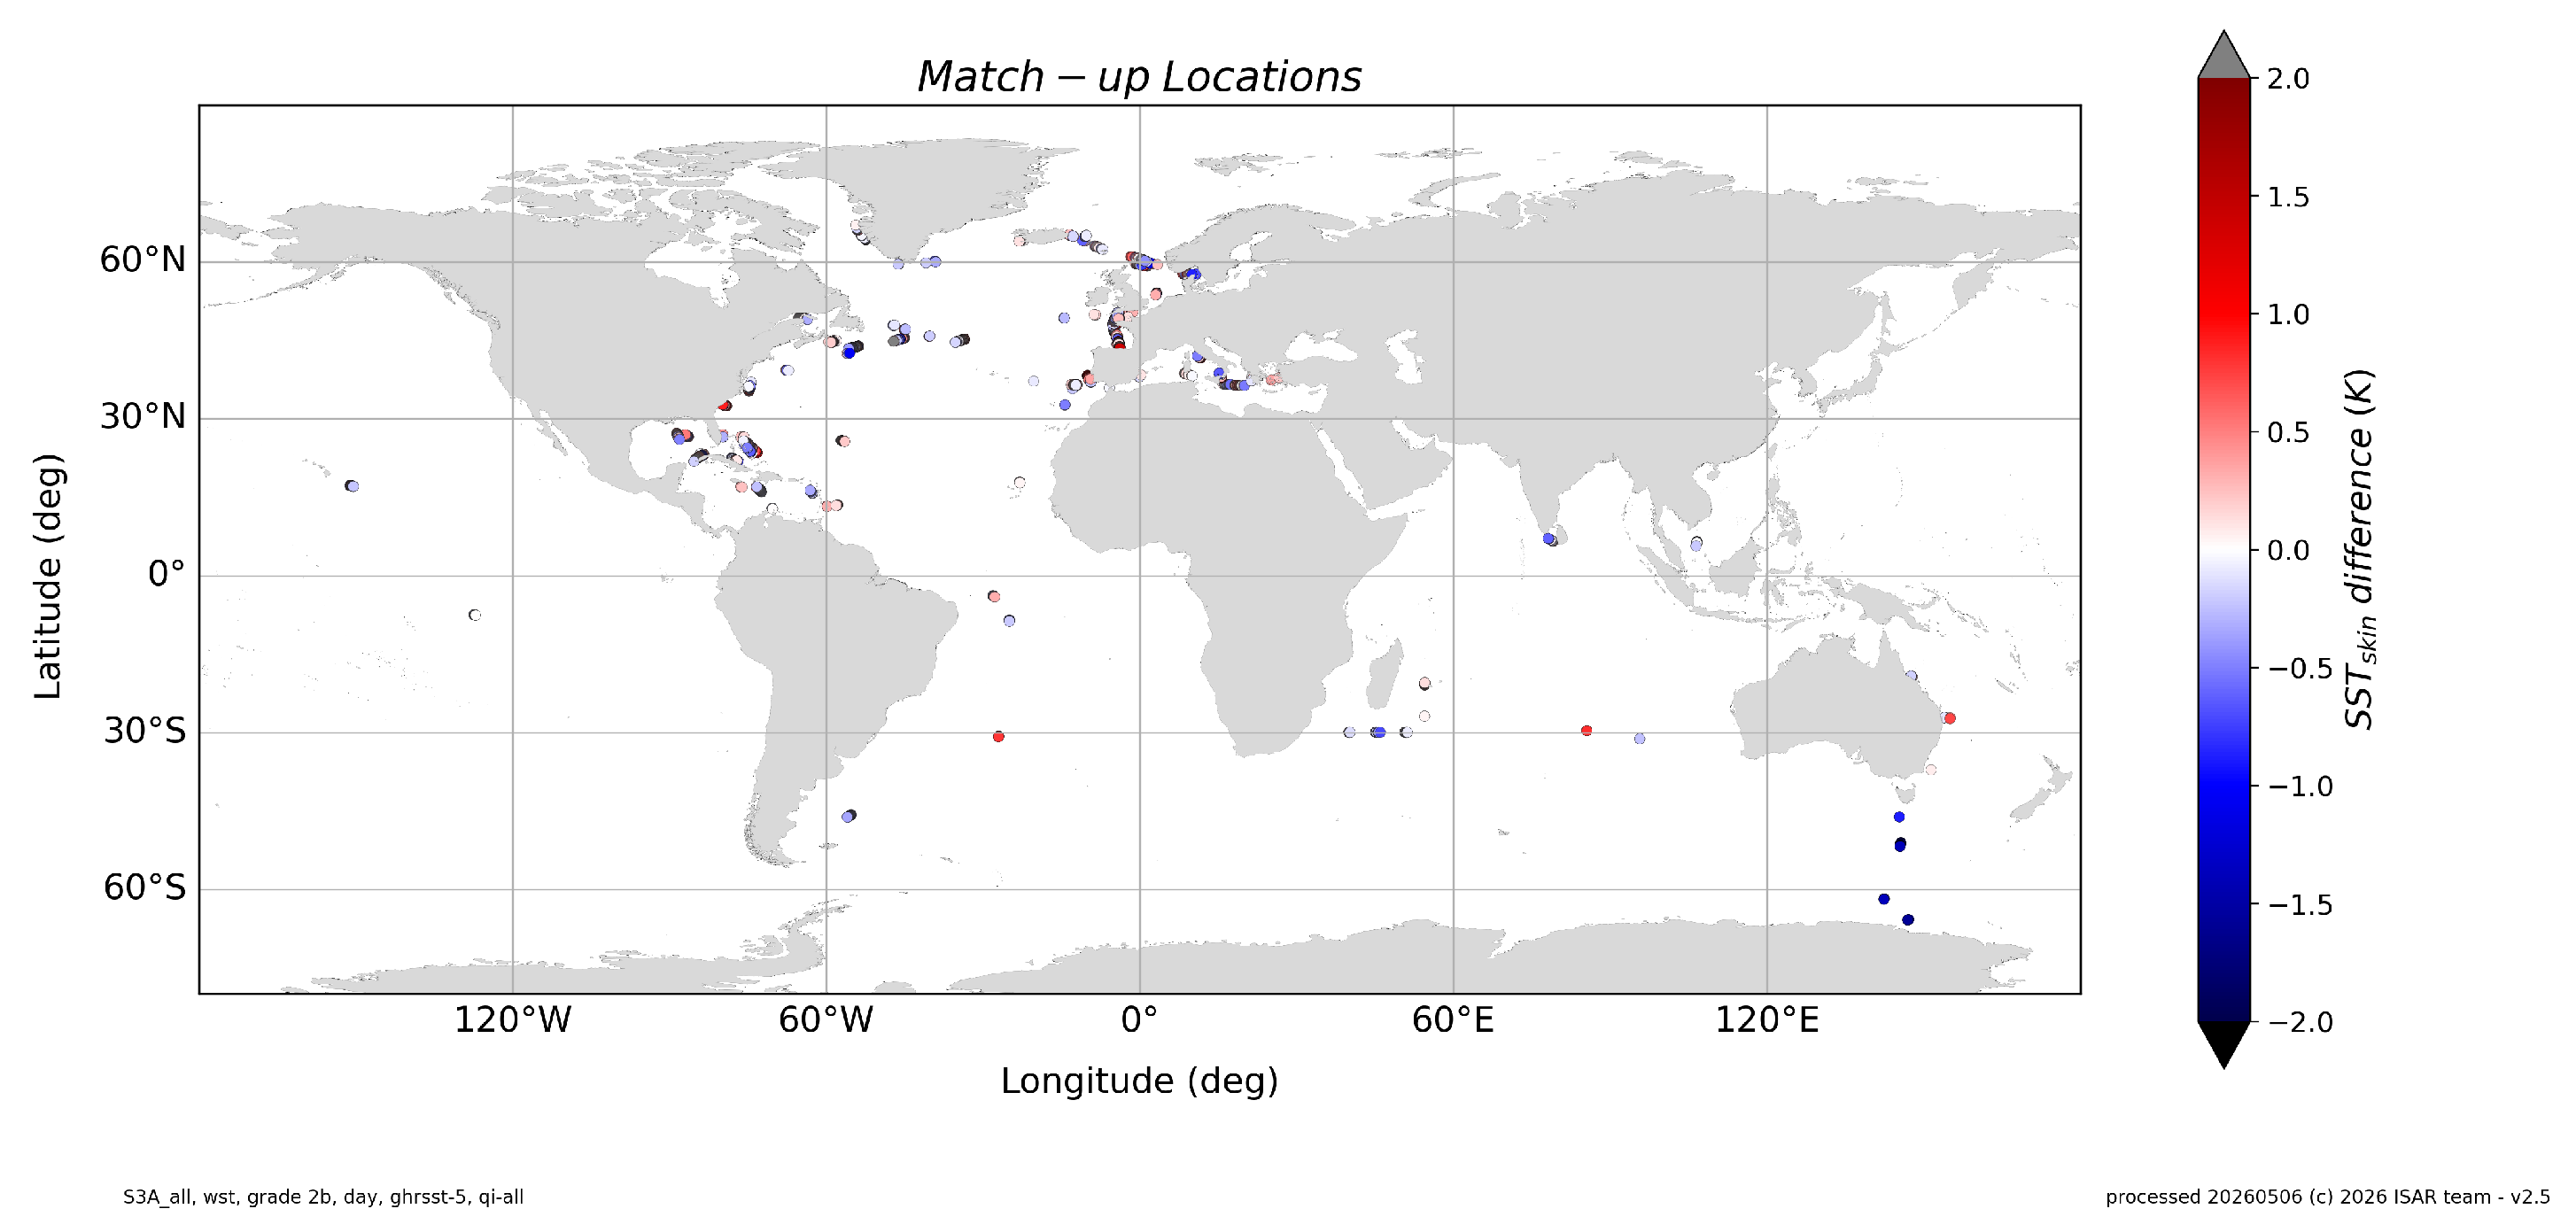
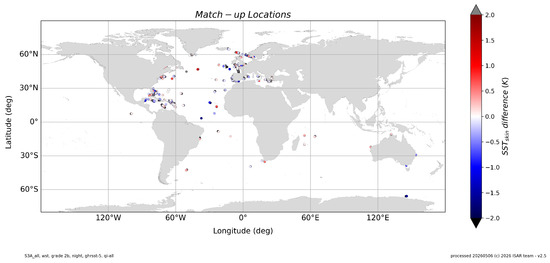
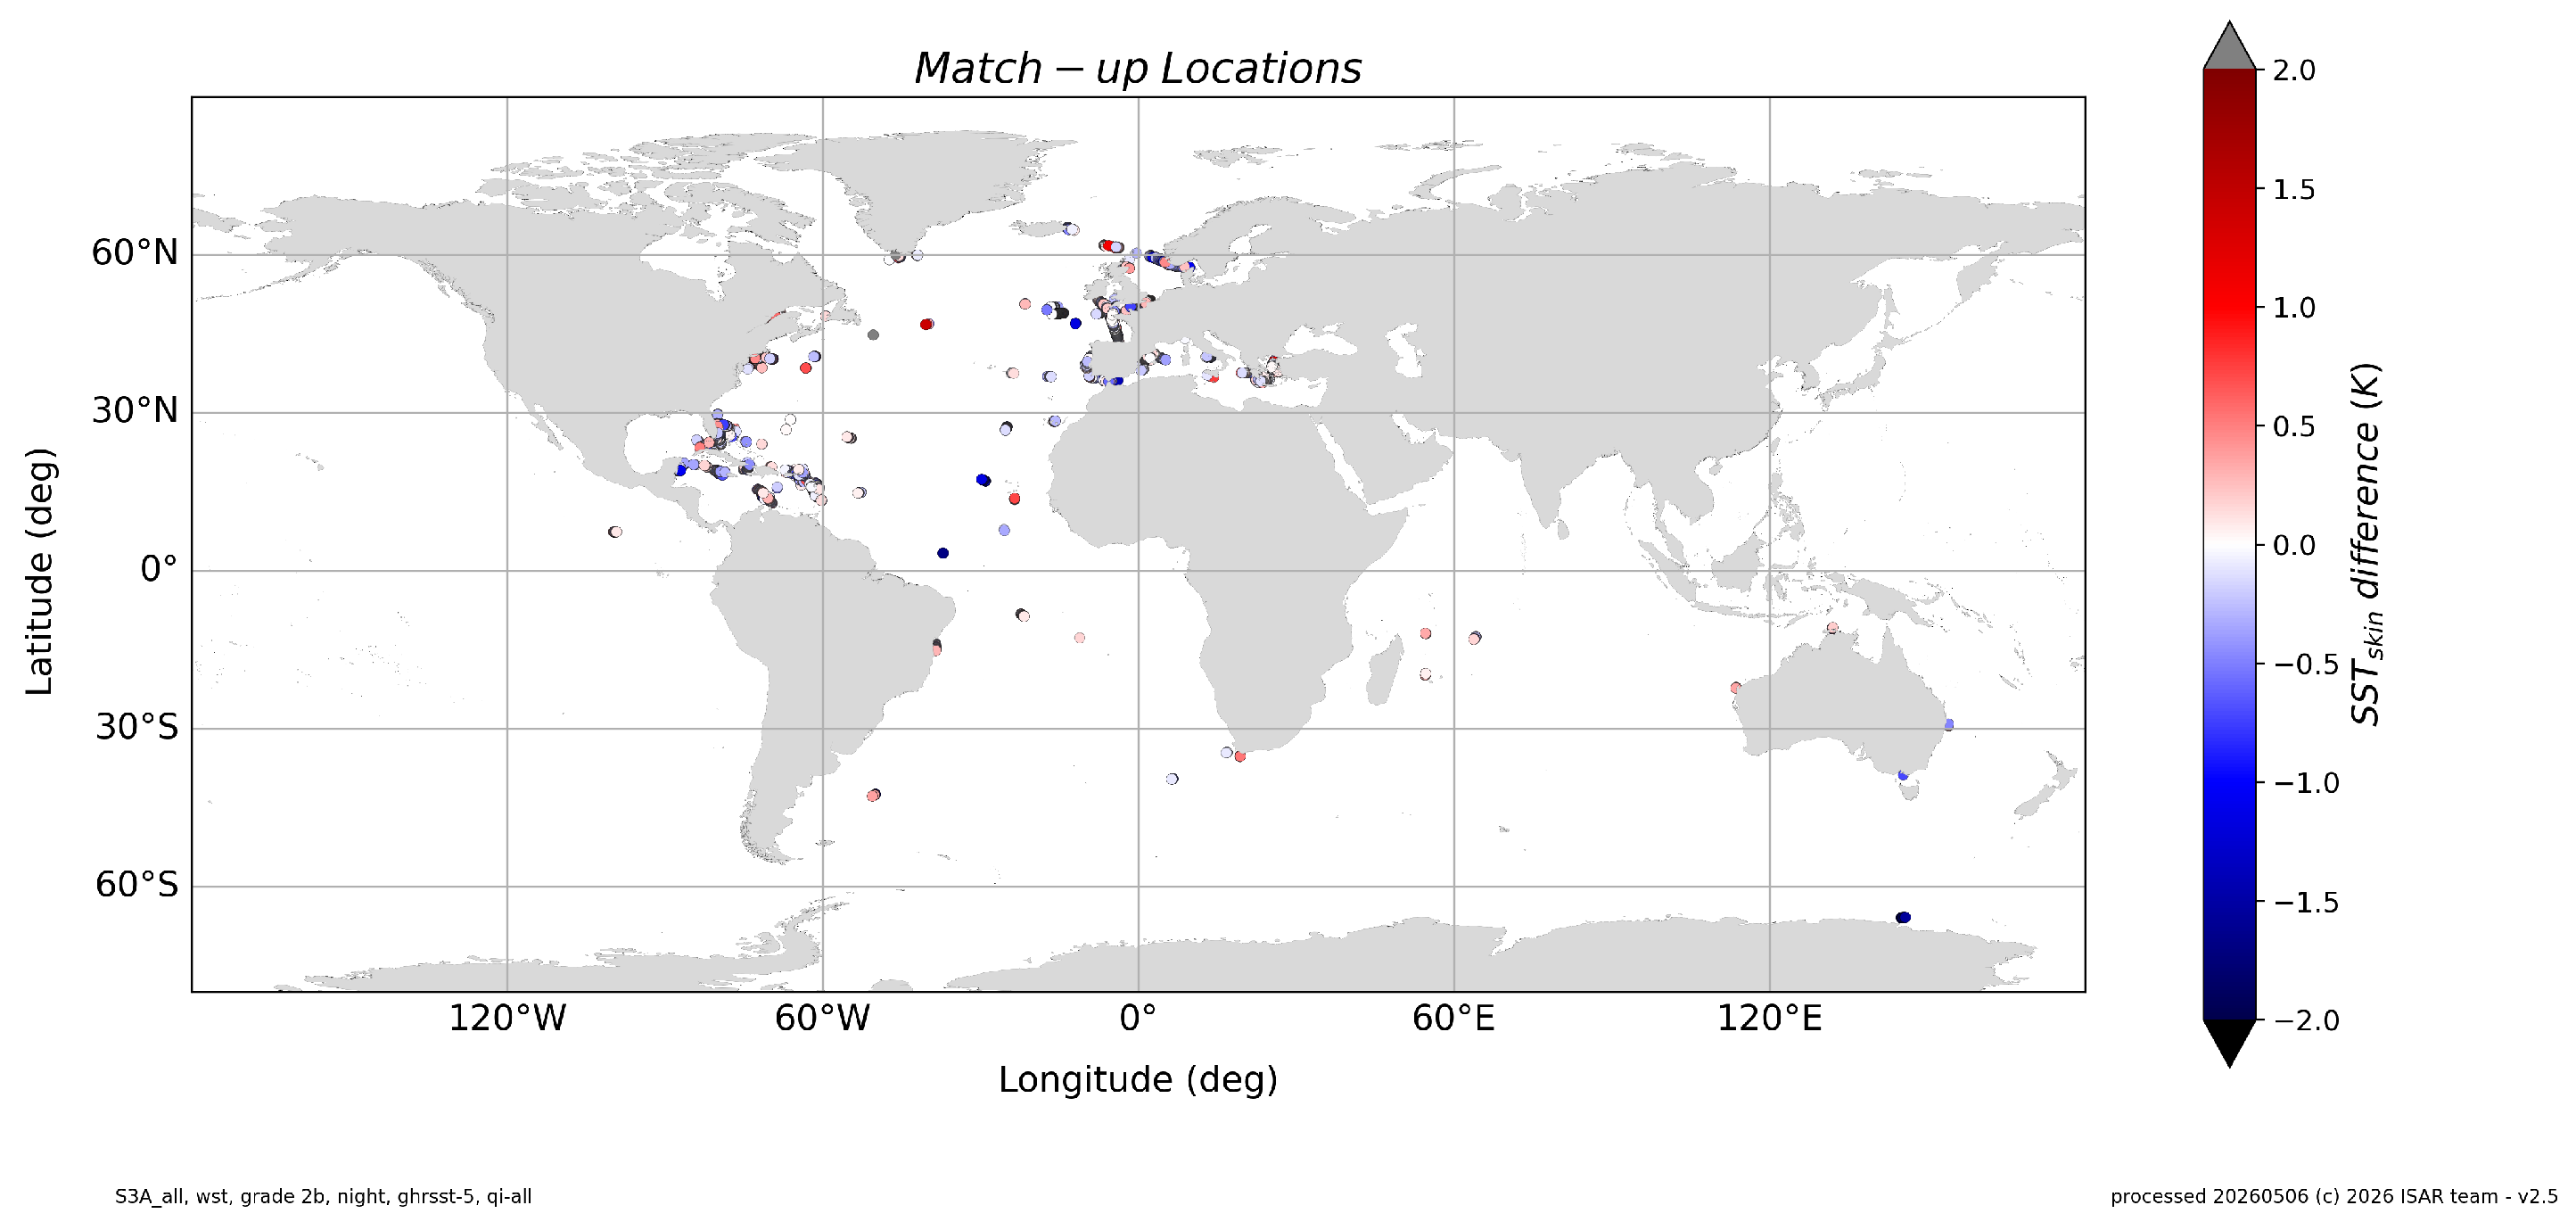
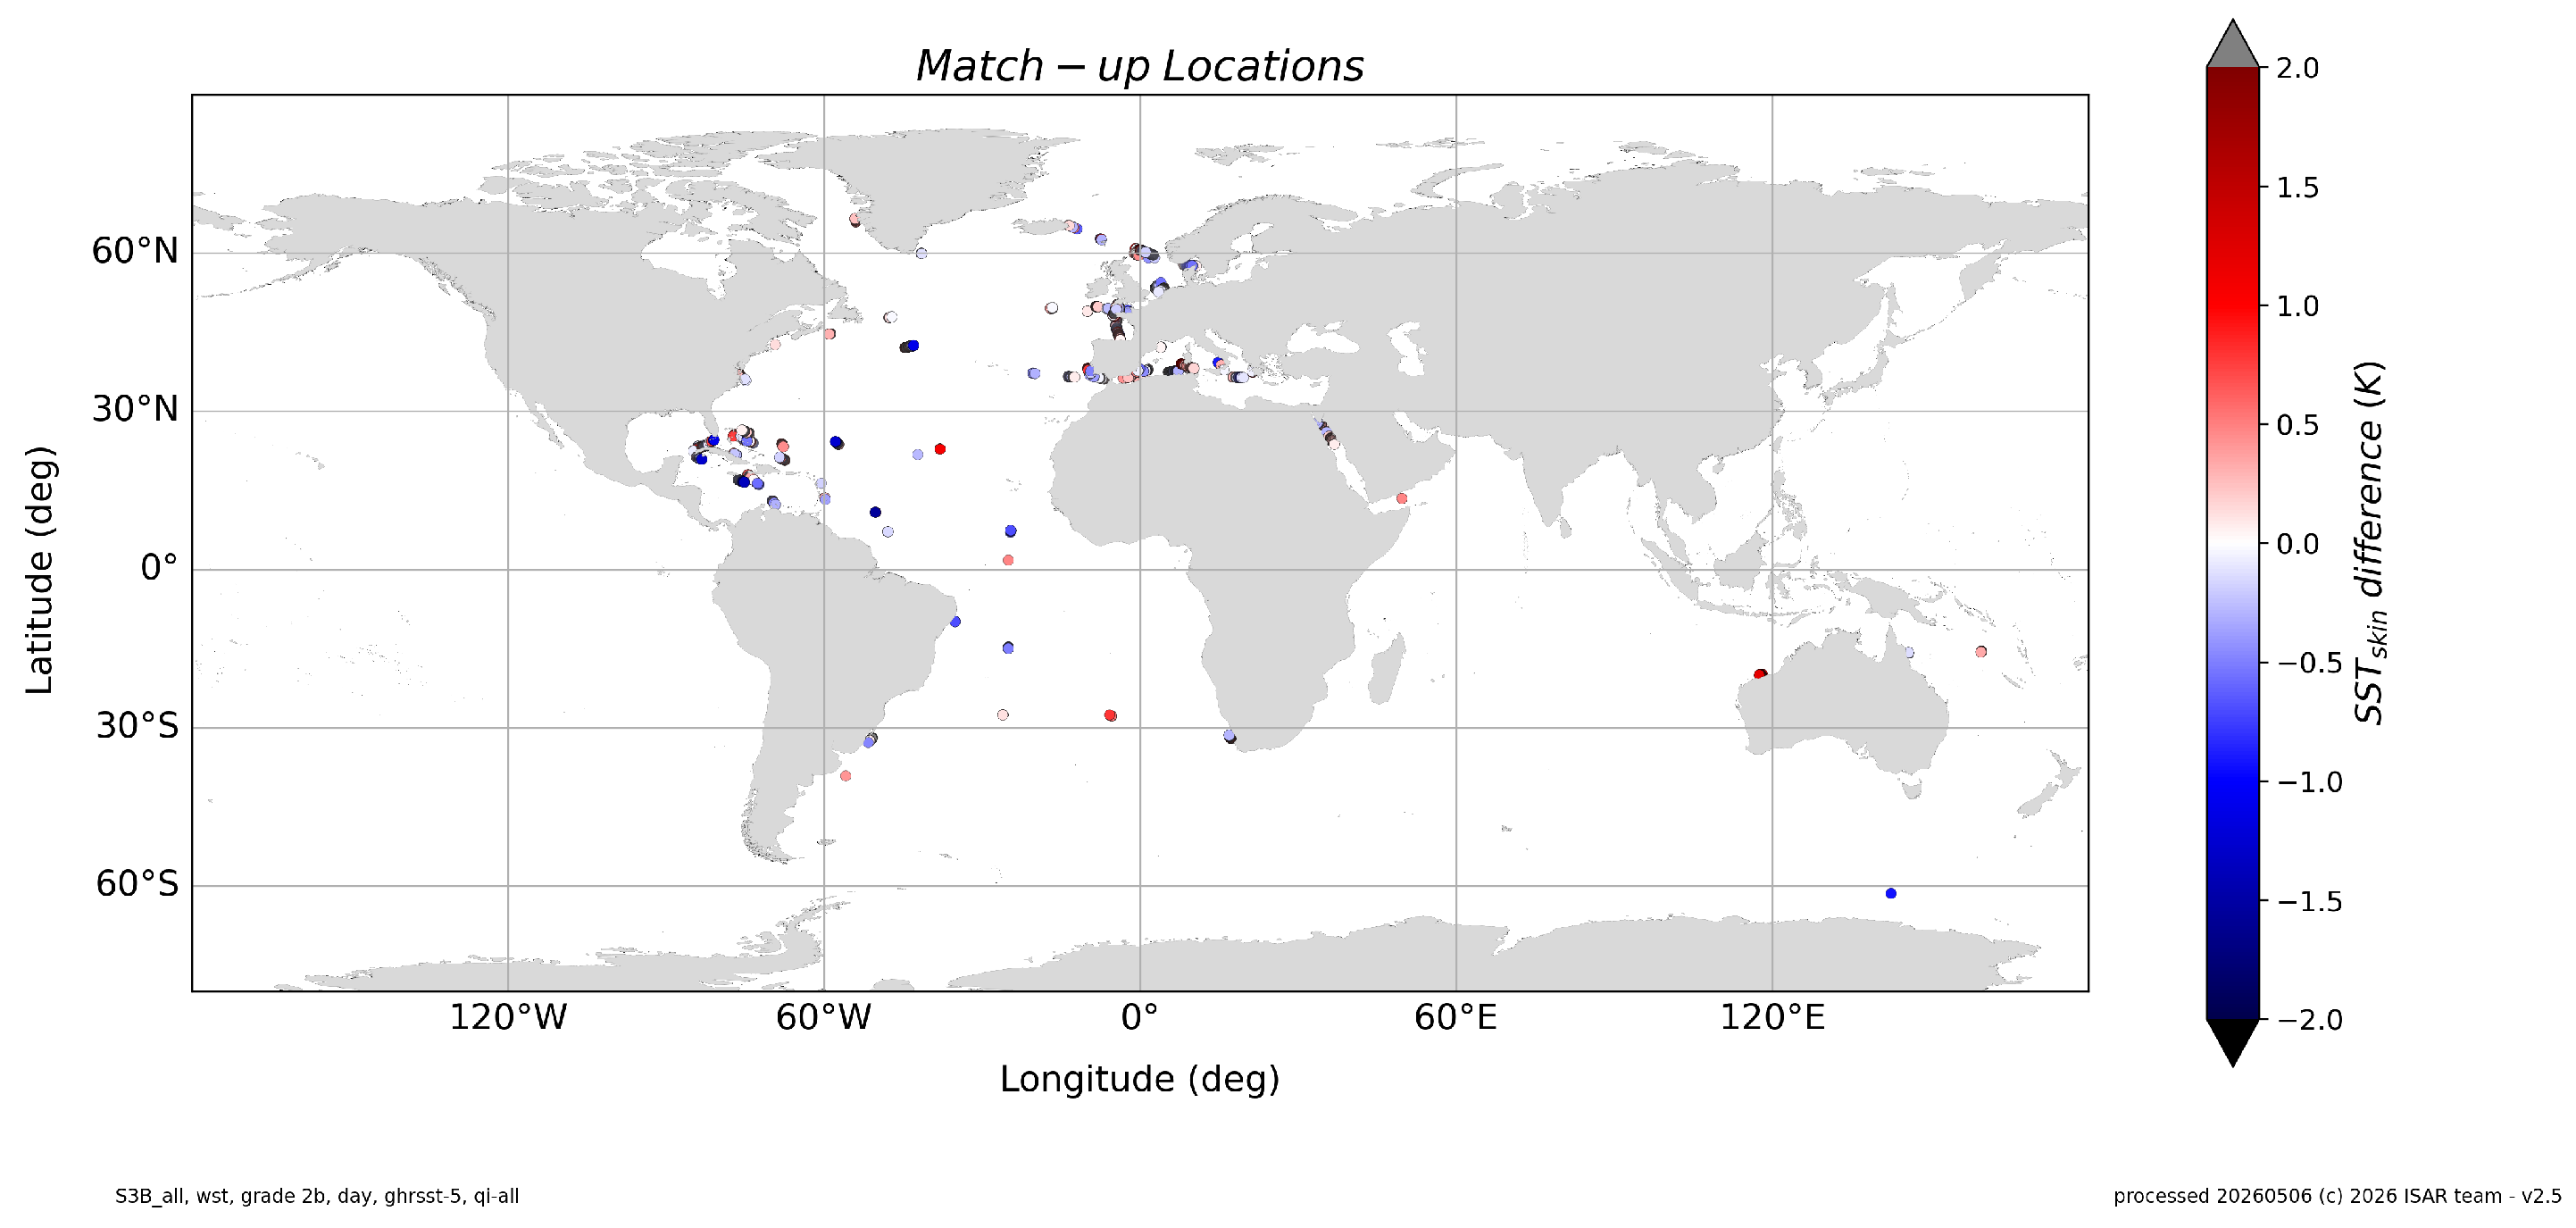
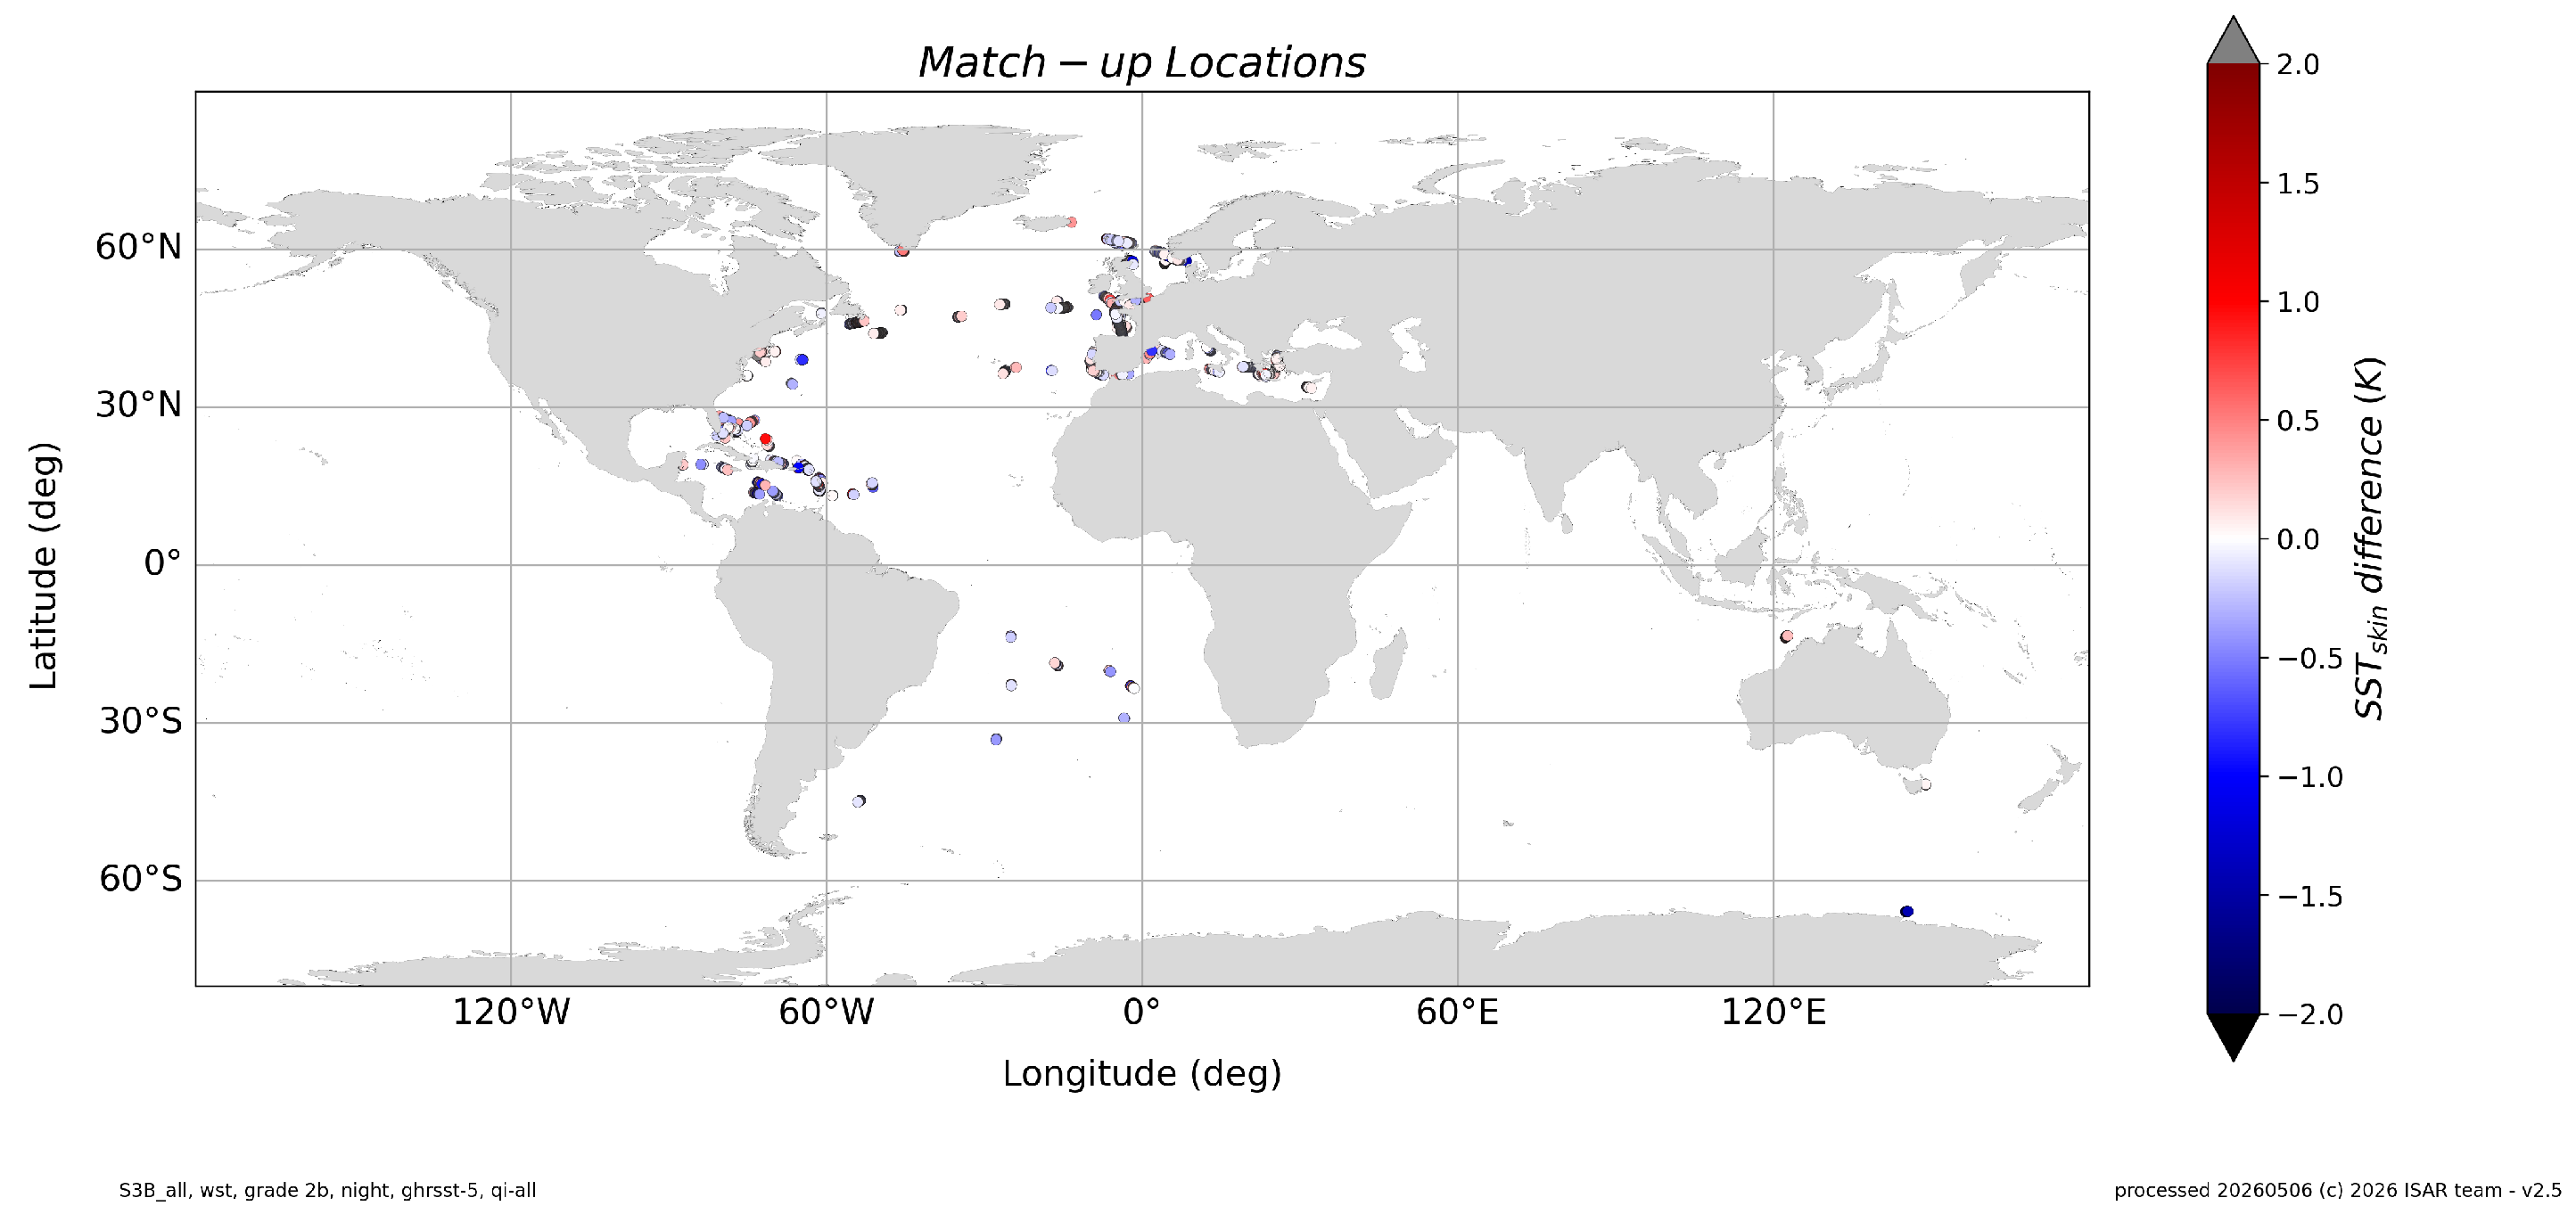
In this section, the differences between Sentinel-3A (S3A) and Sentinel-3B (S3B) SLSTR SST data and coincident ships4sst data are summarized across seven years from 2018 to 2025. The top panel in Figure 3 shows the median difference between the SLSTR WST day time product and the ships4sst SST, stratified by satellite sensor (S3A and S3B), by year and by match-up grade (see Table 2). The error bars show the corresponding Robust Standard Deviation (RSD). The bottom panel in Figure 3 shows the number of matches contributing to the match-up statistics shown in the top panel. In Figure 4 the results for nighttime match-ups are shown in the same way as the daytime plots. The locations of the match-ups are shown in Figure 5 for S3A daytime data and in Figure 6 for nighttime data. Figure 7 shows the daytime match-up locations for S3B and Figure 8 shows the nighttime match-up locations for S3B. The concentration of match-up locations around Europe and the mid-Atlantic is coincidence and purely down to available shipping routes in the validation time period.
Figure 3.
SLSTR-ships4sst validation results for 2018 to 2025 WST data, daytime only data split by year and satellite sensor. The yellow data show Grade 4 data, purple show Grade 3 data, green show Grade 2b, red show Grade 2a data, and the blue show Grade 1 data. Match-up grades are explained in Table 2.
Figure 4.
SLSTR-ships4sst validation results for 2018 to 2025 WST data, nighttime only data split by year and satellite sensor. The yellow data show Grade 4 data, purple show Grade 3 data, green show Grade 2b, red show Grade 2a data, and the blue show Grade 1 data. Match-up grades are explained in Table 2.
Figure 5.
SLSTR match-up locations, S3A WST daytime data, Grade 2b and GHRSST Quality Level 5, between 2018 and 2025.
Figure 6.
SLSTR match-up locations, S3A WST nighttime data, Grade 2b and GHRSST Quality Level 5, between 2018 and 2025.
Figure 7.
SLSTR match-up locations, S3B WST daytime data, Grade 2b and GHRSST Quality Level 5, between 2018 and 2025.
Figure 8.
SLSTR match-up locations, S3B WST nighttime data, Grade 2b and GHRSST Quality Level 5, between 2018 and 2025.
Apart from separating the validation data by satellite sensor, it is also necessary to separate the results for the five different algorithms used by the SLSTR data products; WST, D3, D2, N3 and N2, as described in Table 1. The WST product shown in Table 4 is available for daytime and nighttime data; however, results are split between daytime and nighttime because of different algorithms used in day and nighttime, to align it with the D3 (Table 6 and Table 10), D2 (Table 7 and Table 11), N3 (Table 8 and Table 12), N2 (Table 9 and Table 13) results. The D3 and N3 products are only available during the night because solar contamination during the day is a significant problem in the channel. D2 and N2 are available day and night and are presented here to evaluate how the nighttime D2 and N2 products compare with the D3 and N3 nighttime products.
The primary SST product of SLSTR is the WST product. This product is a composite of the four (D3, D2, N3 and N2) SST retrieval algorithms. The highest quality algorithm for a particular time and swath position is selected (and is flagged in the WST product). The validation results for the WST products for SLSTR S3A and S3B are shown in Table 4 and Table 5, respectively. An excellent agreement between the SLSTR and the ships4sst data is shown with very small median differences of or better from all but the S3A N2 data. The N2 data have slightly larger median differences of up to for the grade 2b data. The RSD is lower at nighttime than daytime for both S3A and S3B data, with values of for S3A and for S3B nighttime match-ups. The daytime data results show an RSD of for S3A and an RSD of for S3B. Note that the differences are remarkably small and well within the uncertainty estimates of the combined satellite and in situ data.
Table 4.
Match-up statistics for SLSTR S3A WST data and GHRSST Quality Level 5 between 2018 and 2025.
Table 5.
Match-up statistics for SLSTR S3B WST data and GHRSST Quality Level 5 between 2018 and 2025.
Table 6.
Match-up statistics for SLSTR S3A D3 data and GHRSST Quality Level 5 between 2018 and 2025.
Table 7.
Match-up statistics for SLSTR S3A D2 data and GHRSST Quality Level 5 between 2018 and 2025.
Table 8.
Match-up statistics for SLSTR S3A N3 data and GHRSST Quality Level 5 between 2018 and 2025.
Table 9.
Match-up statistics for SLSTR S3A N2 data and GHRSST Quality Level 5 between 2018 and 2025.
Table 10.
Match-up statistics for SLSTR S3B D3 data and GHRSST Quality Level 5 between 2018 and 2025.
Table 11.
Match-up statistics for SLSTR S3B D2 data and GHRSST Quality Level 5 between 2018 and 2025.
Table 12.
Match-up statistics for SLSTR S3B N3 data and GHRSST Quality Level 5 between 2018 and 2025.
Table 13.
Match-up statistics for SLSTR S3B N2 data and GHRSST Quality Level 5 between 2018 and 2025.
The validation results for the remaining S3A data products are shown in Table 6 for D3, Table 7 for D2, Table 8 for N3 and Table 9 for N2. For the D2 and N2 products, both the daytime and nighttime statistics are shown. The results show a very low median difference between SLSTR and ships4sst grade 2b data of less than for the nighttime products and a zero median difference for daytime D2 data, but a slightly larger median difference of for daytime N2 data. The RSDs for S3A are also lower for the nighttime products than the daytime products, with RSDs of for D3 and for N3 during the night and RSDs of for D2 and for N2 during the day. The statistics also show that the larger median difference for the WST daytime product has its origin in the N2 algorithm. This performs slightly worse than the other algorithms but is still well with the target uncertainty of less than .
For S3B, the D3 product is shown in Table 10, D2 in Table 11, N3 in Table 12 and N2 in Table 13. Again, there is a low median difference for the nighttime data with for D3 and for N3 data. The daytime products are slightly worse, with a median difference of for the D2 data and a median difference for the N2 daytime data. The RSDs are excellent with for D3 and for N3 and slightly larger in the daytime for D2 and N2, with RSDs of and , respectively. The nighttime N2 product performs similarly to the S3A N2 product with a slightly smaller RSD of . The D2 nighttime product also is very similar to the S3A D2 product and has a median difference of and an RSD of .
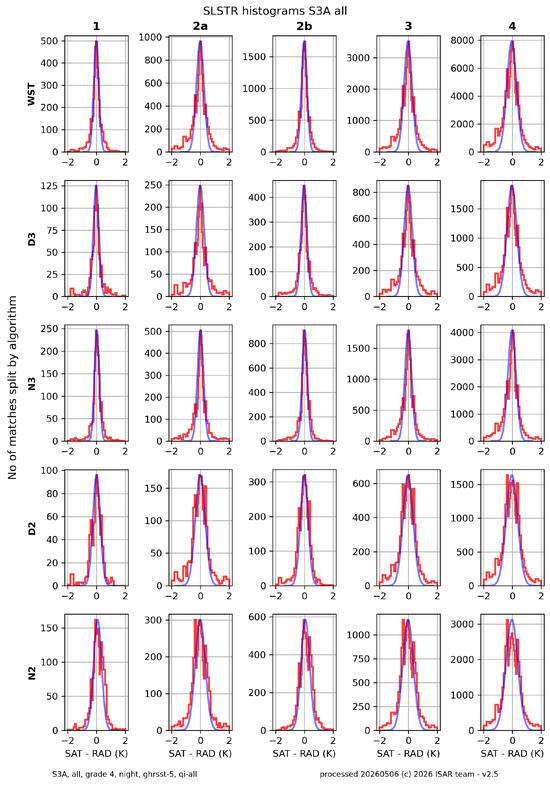
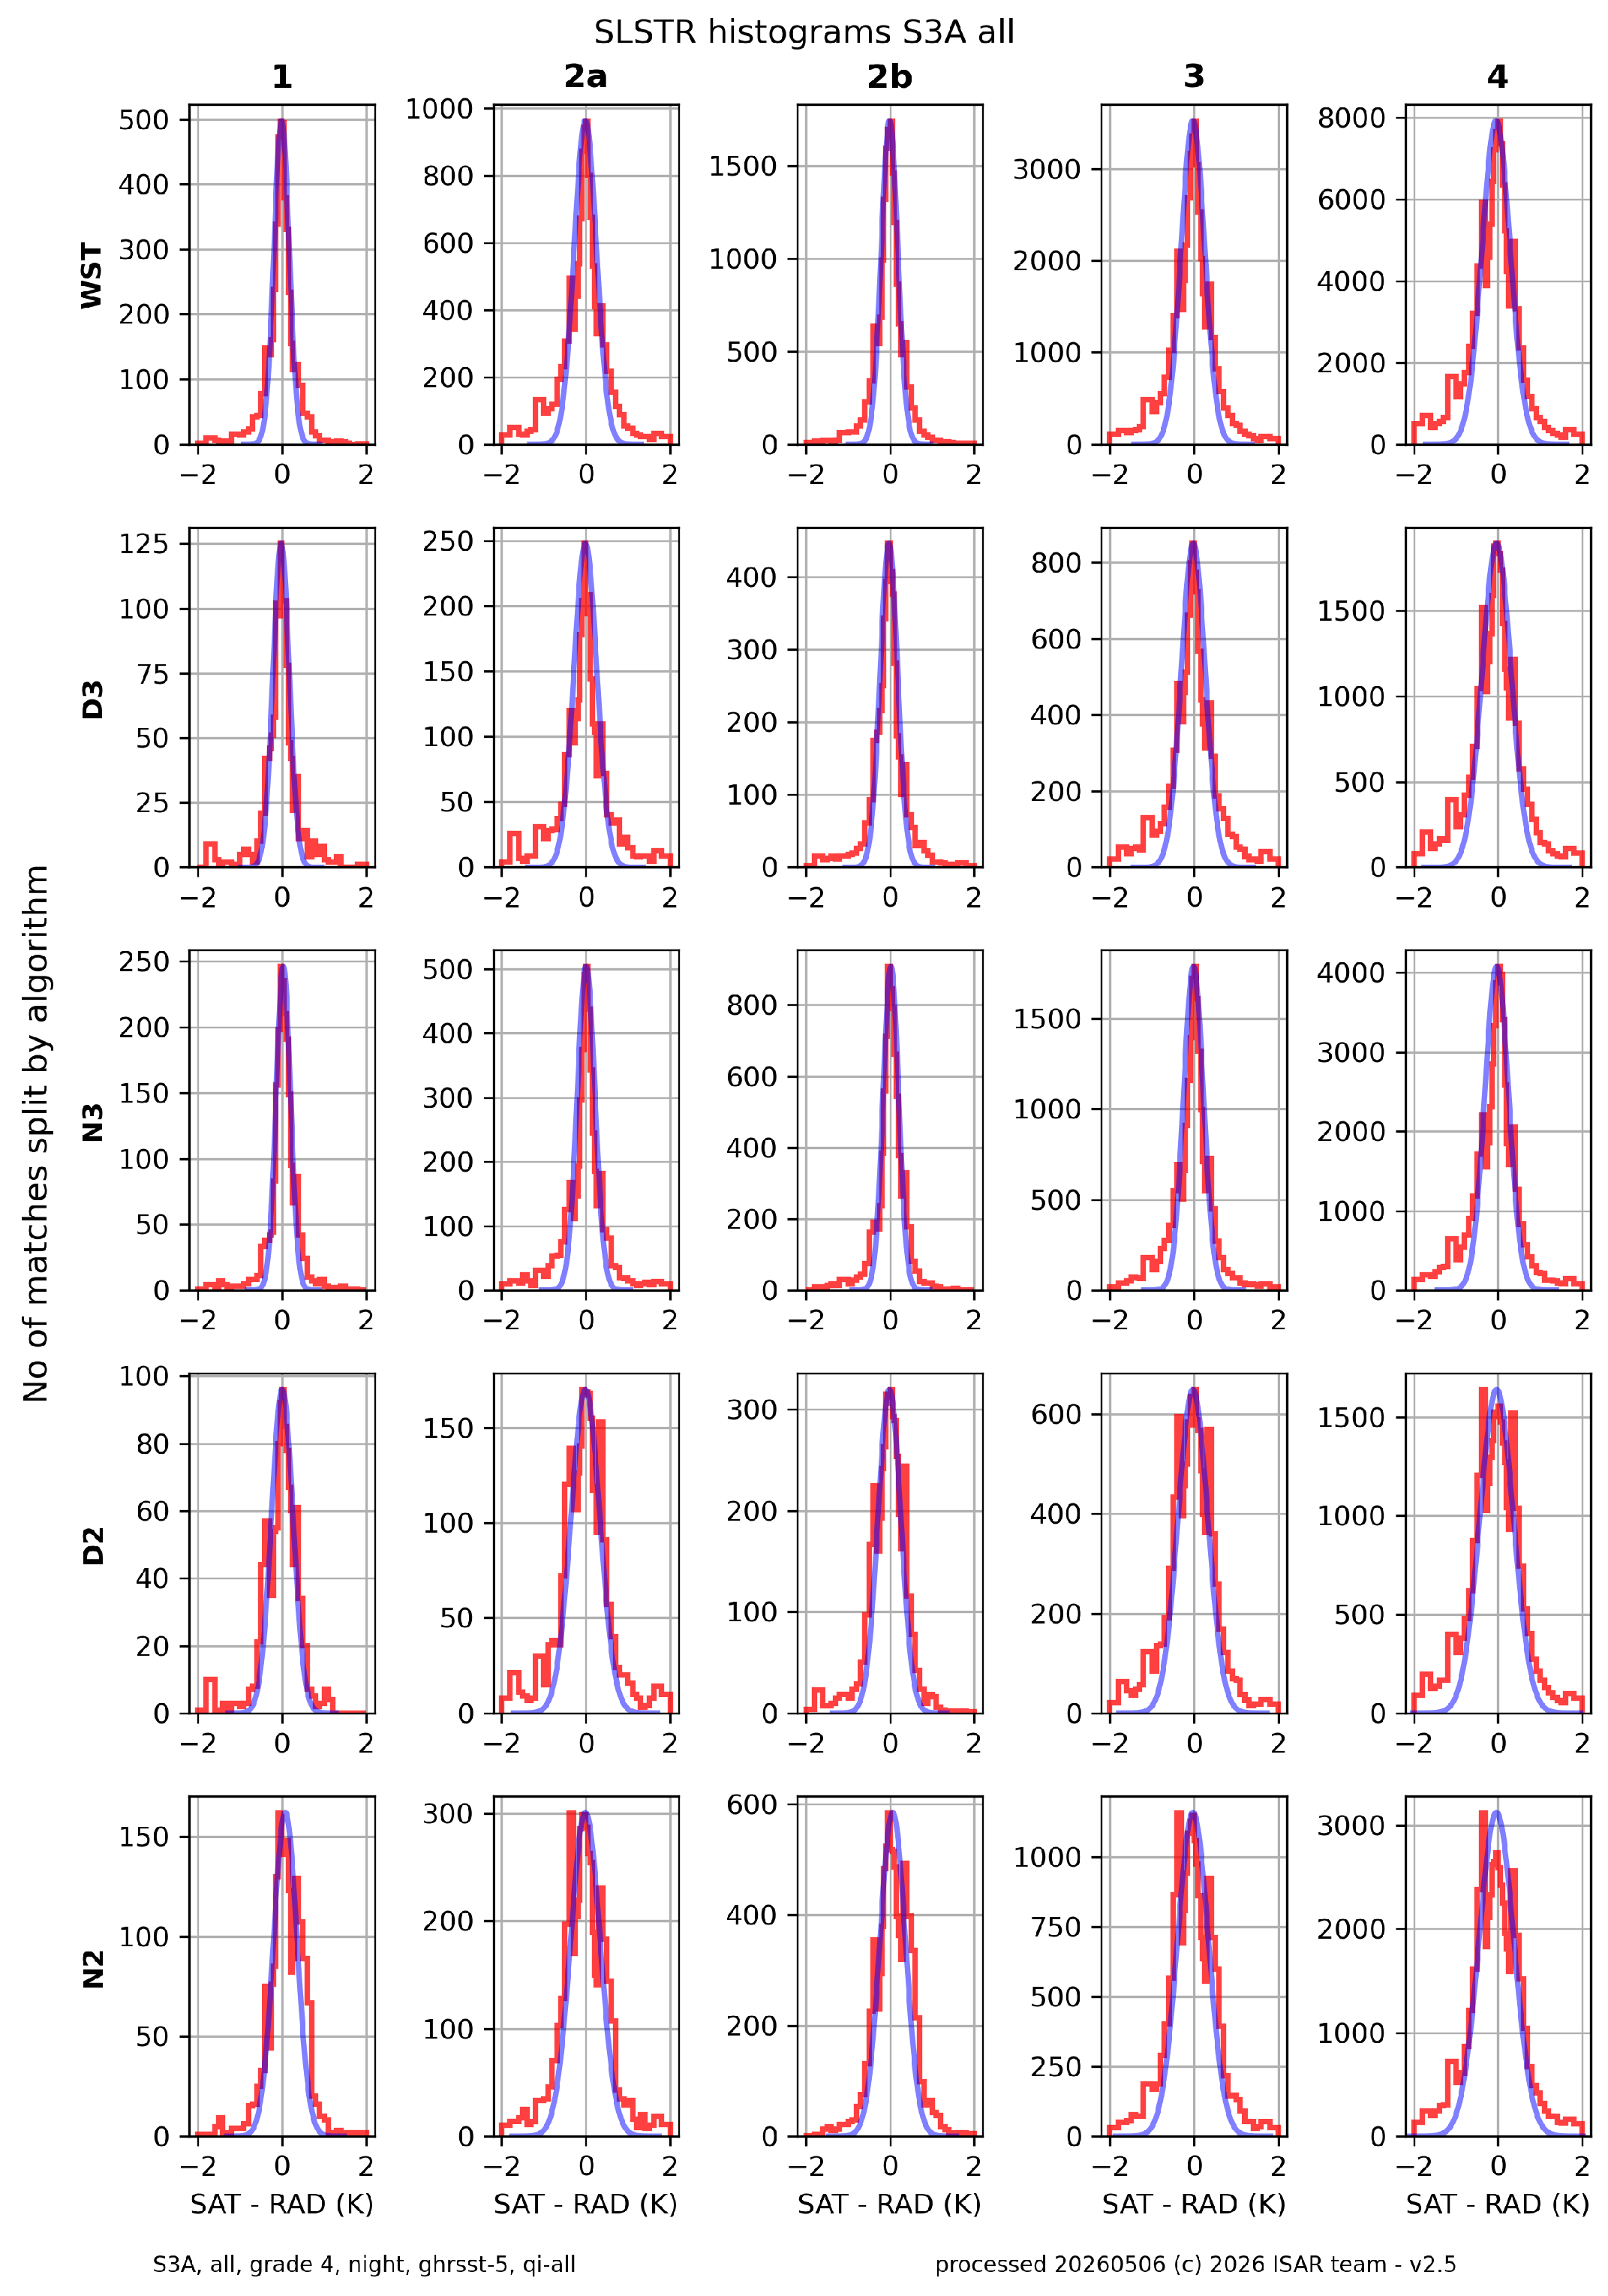
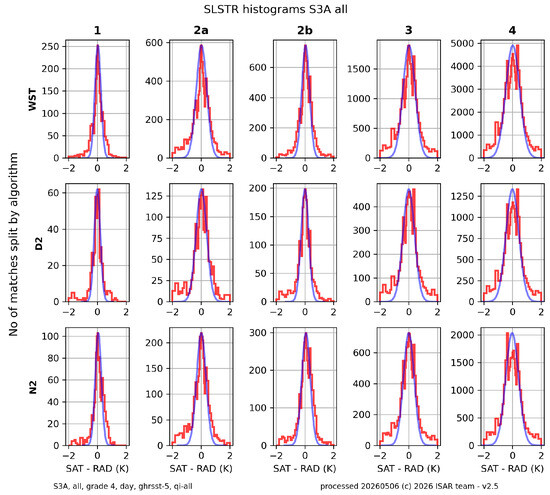
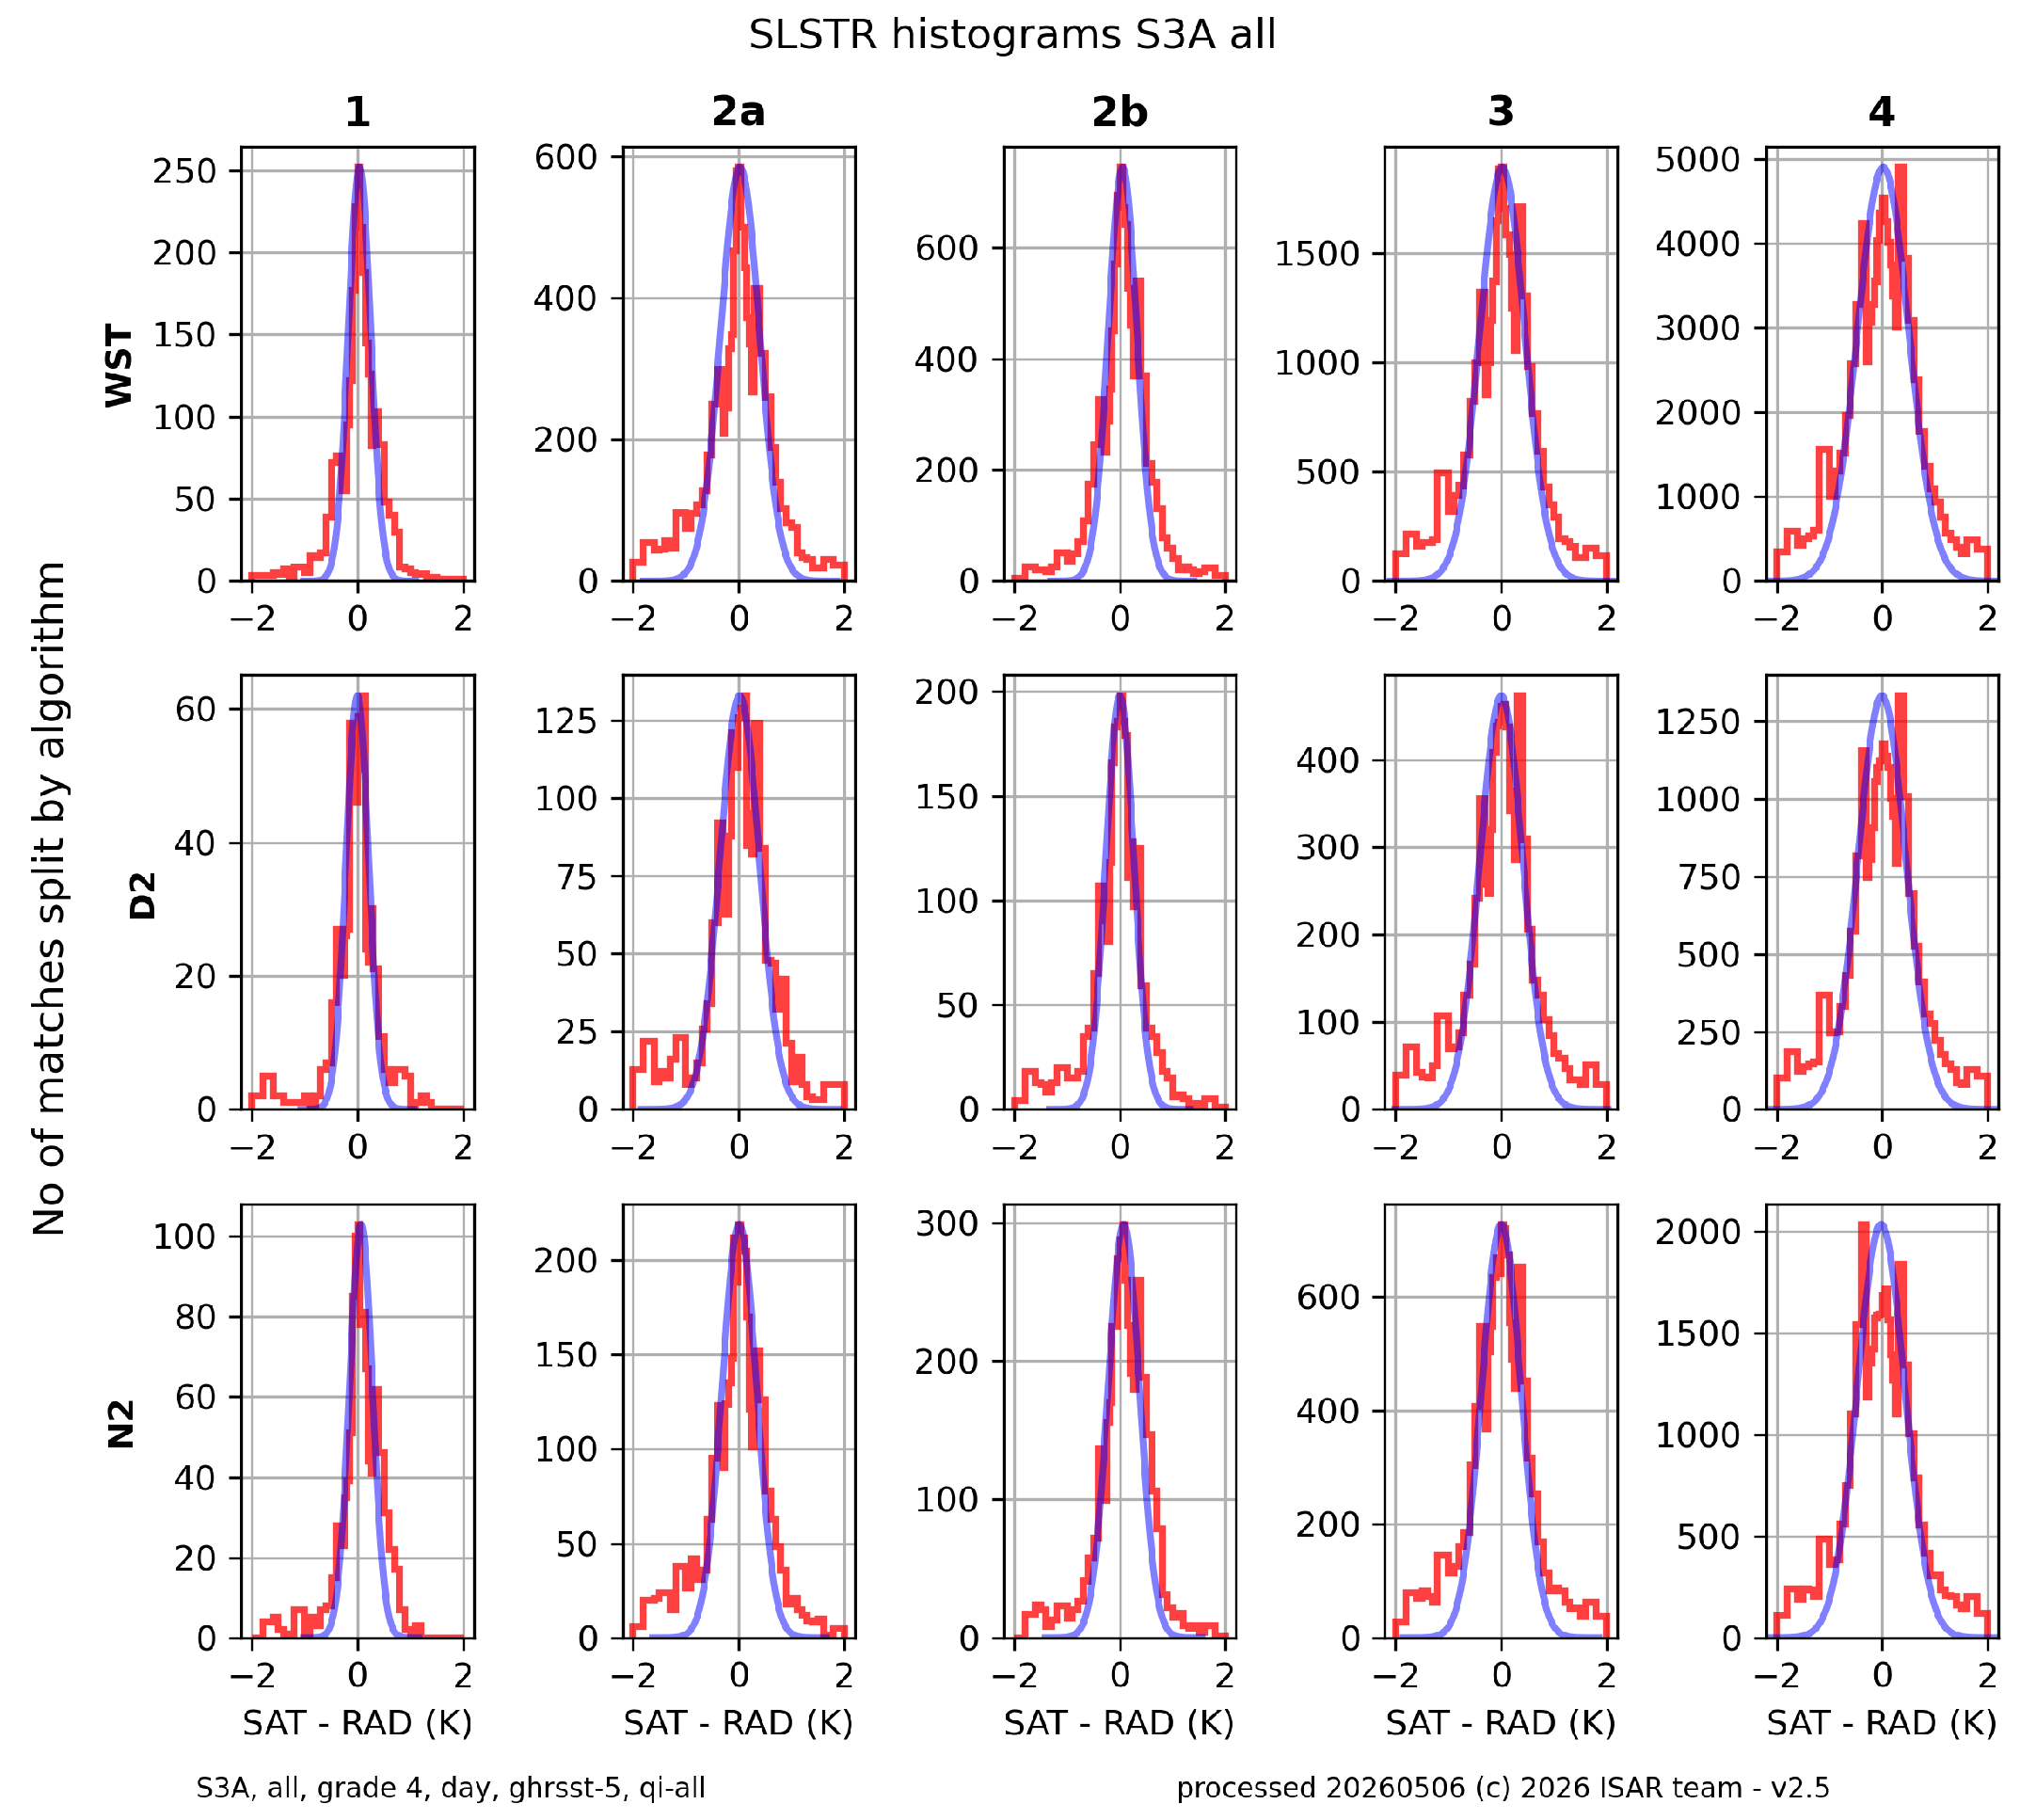
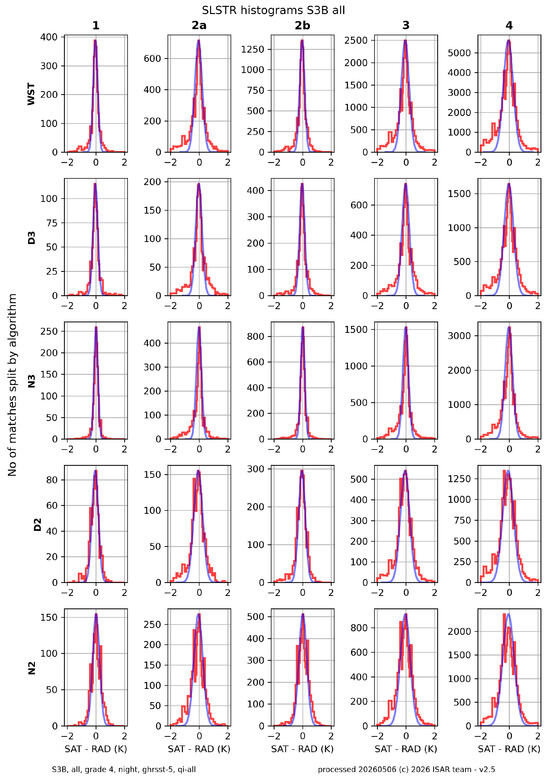
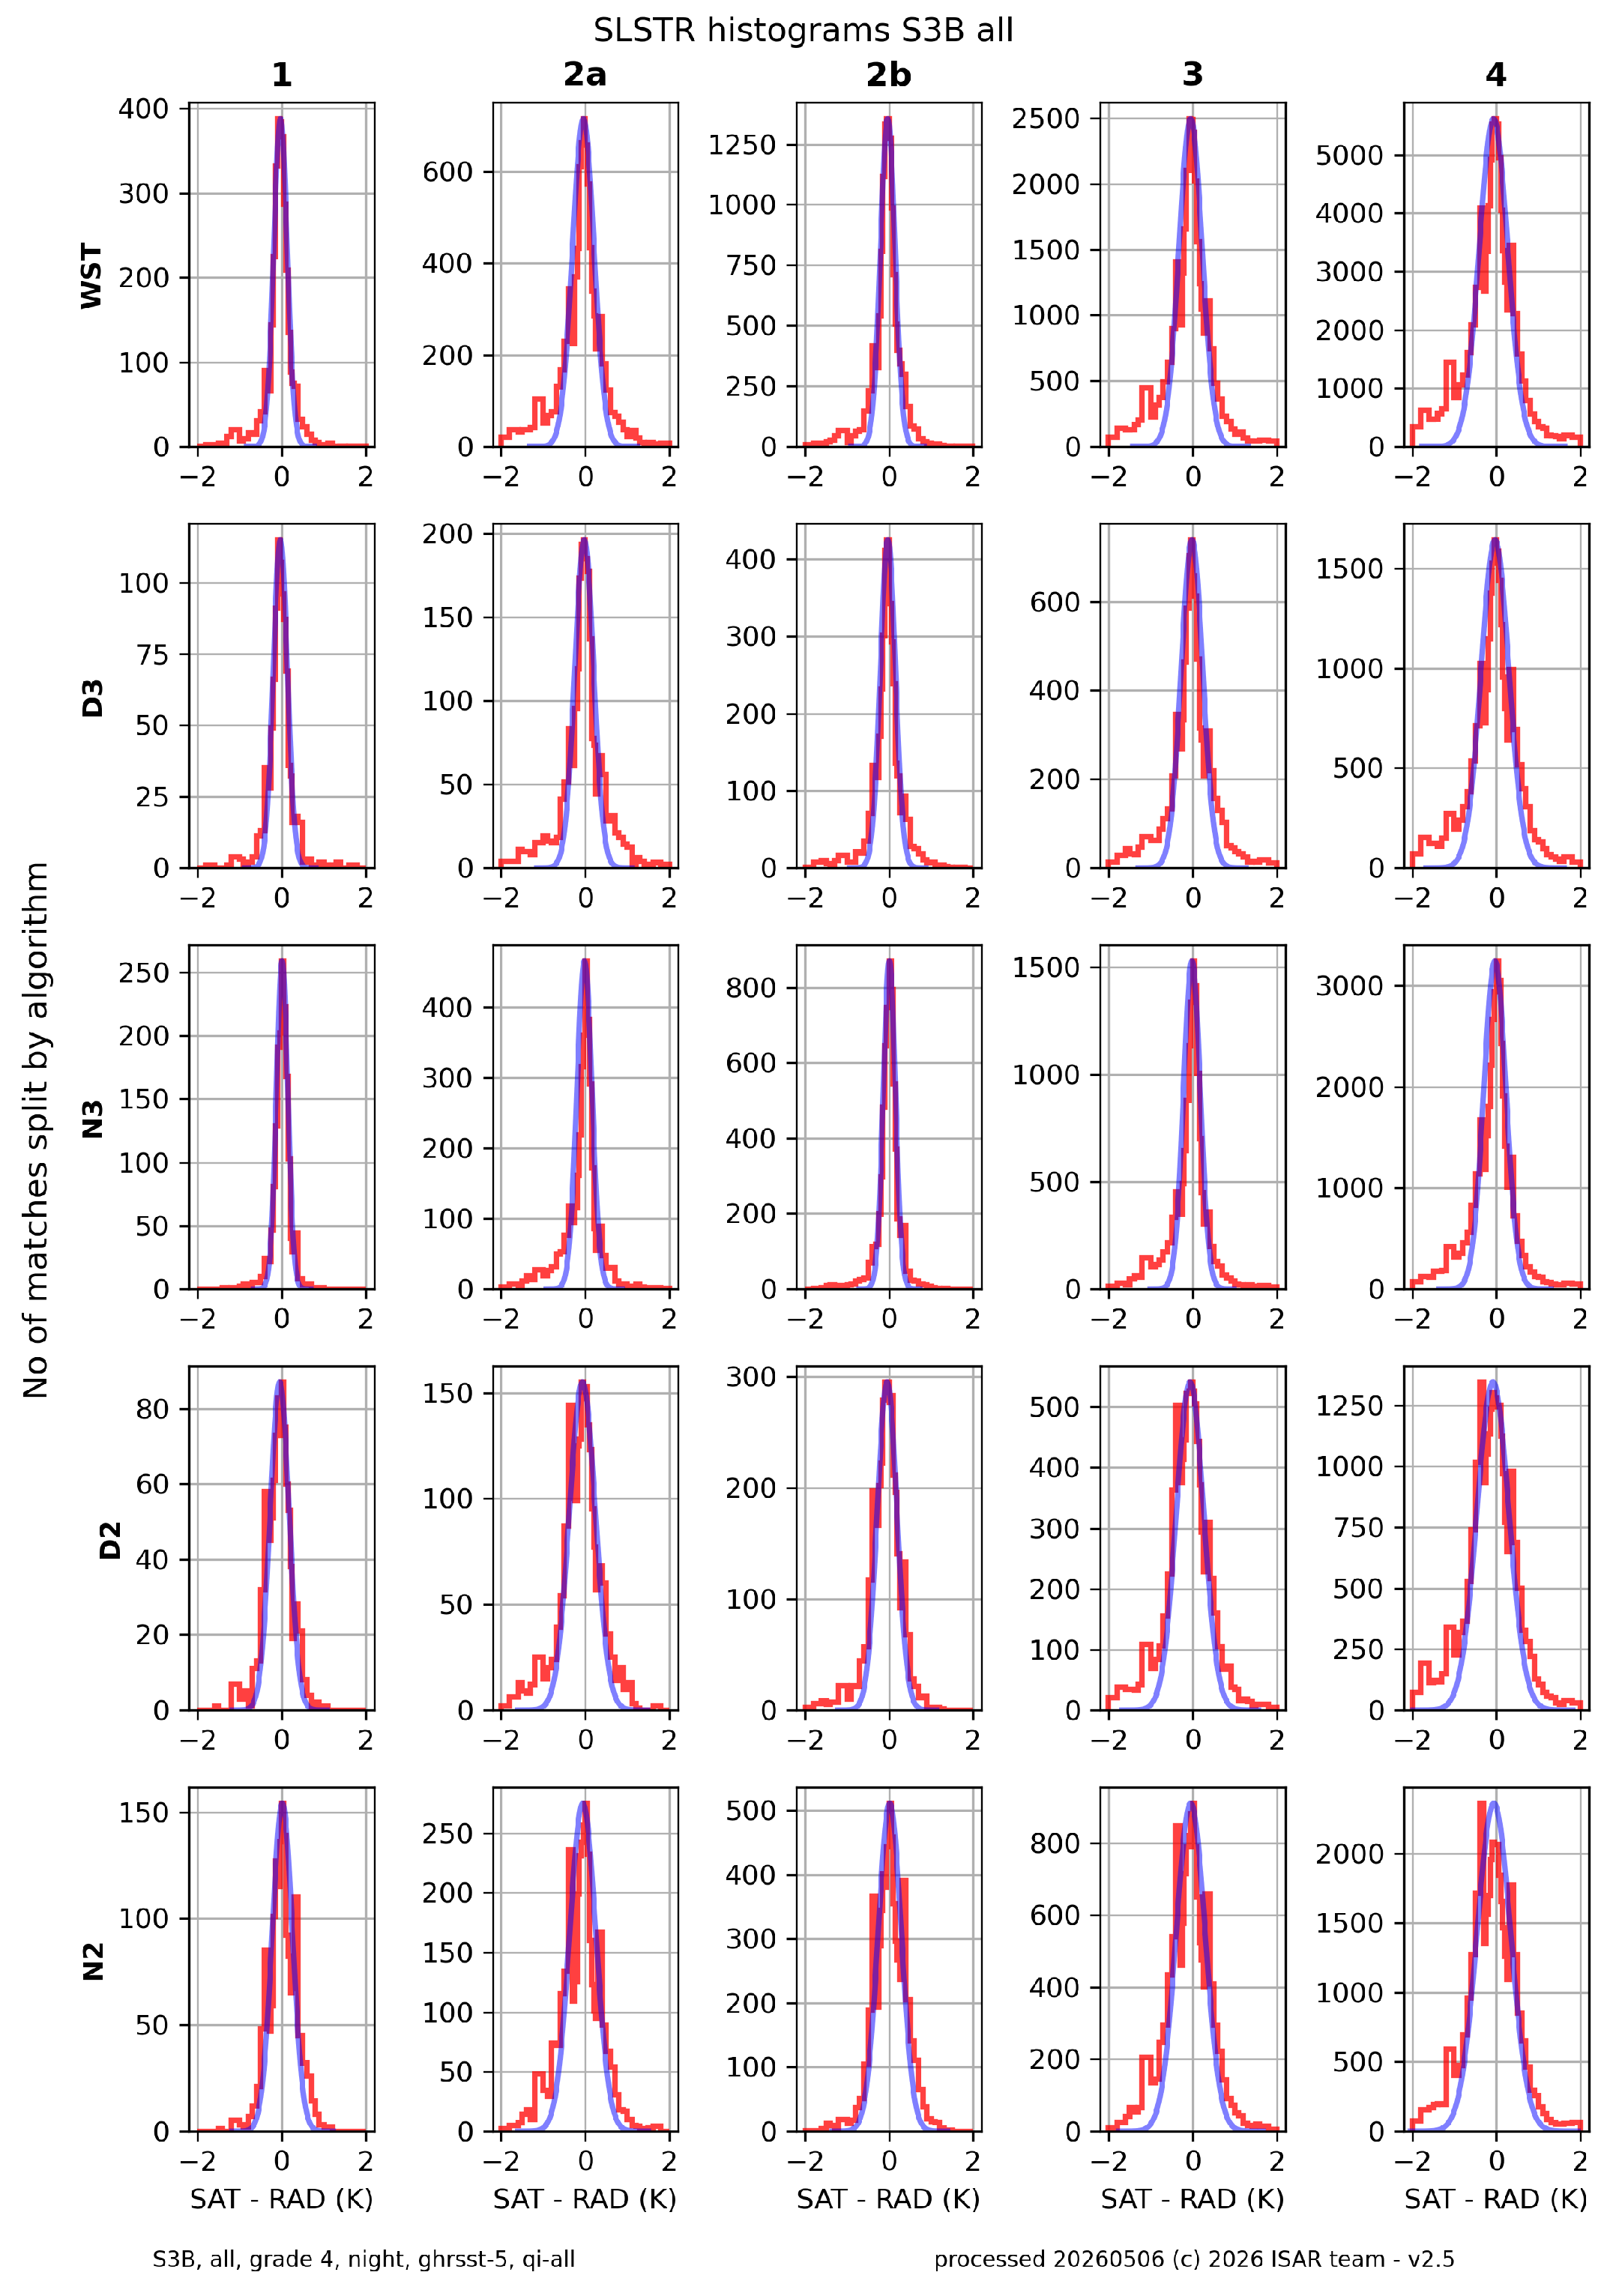
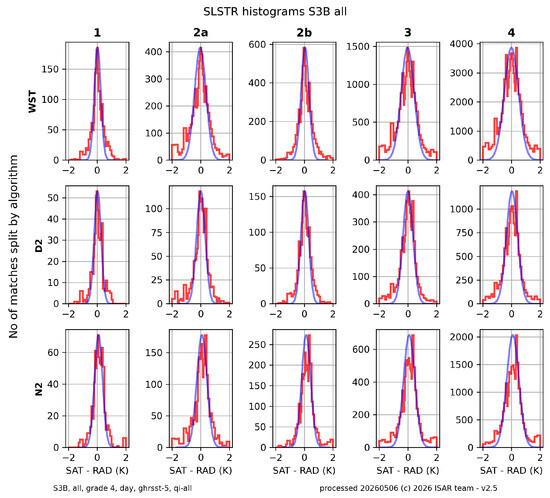
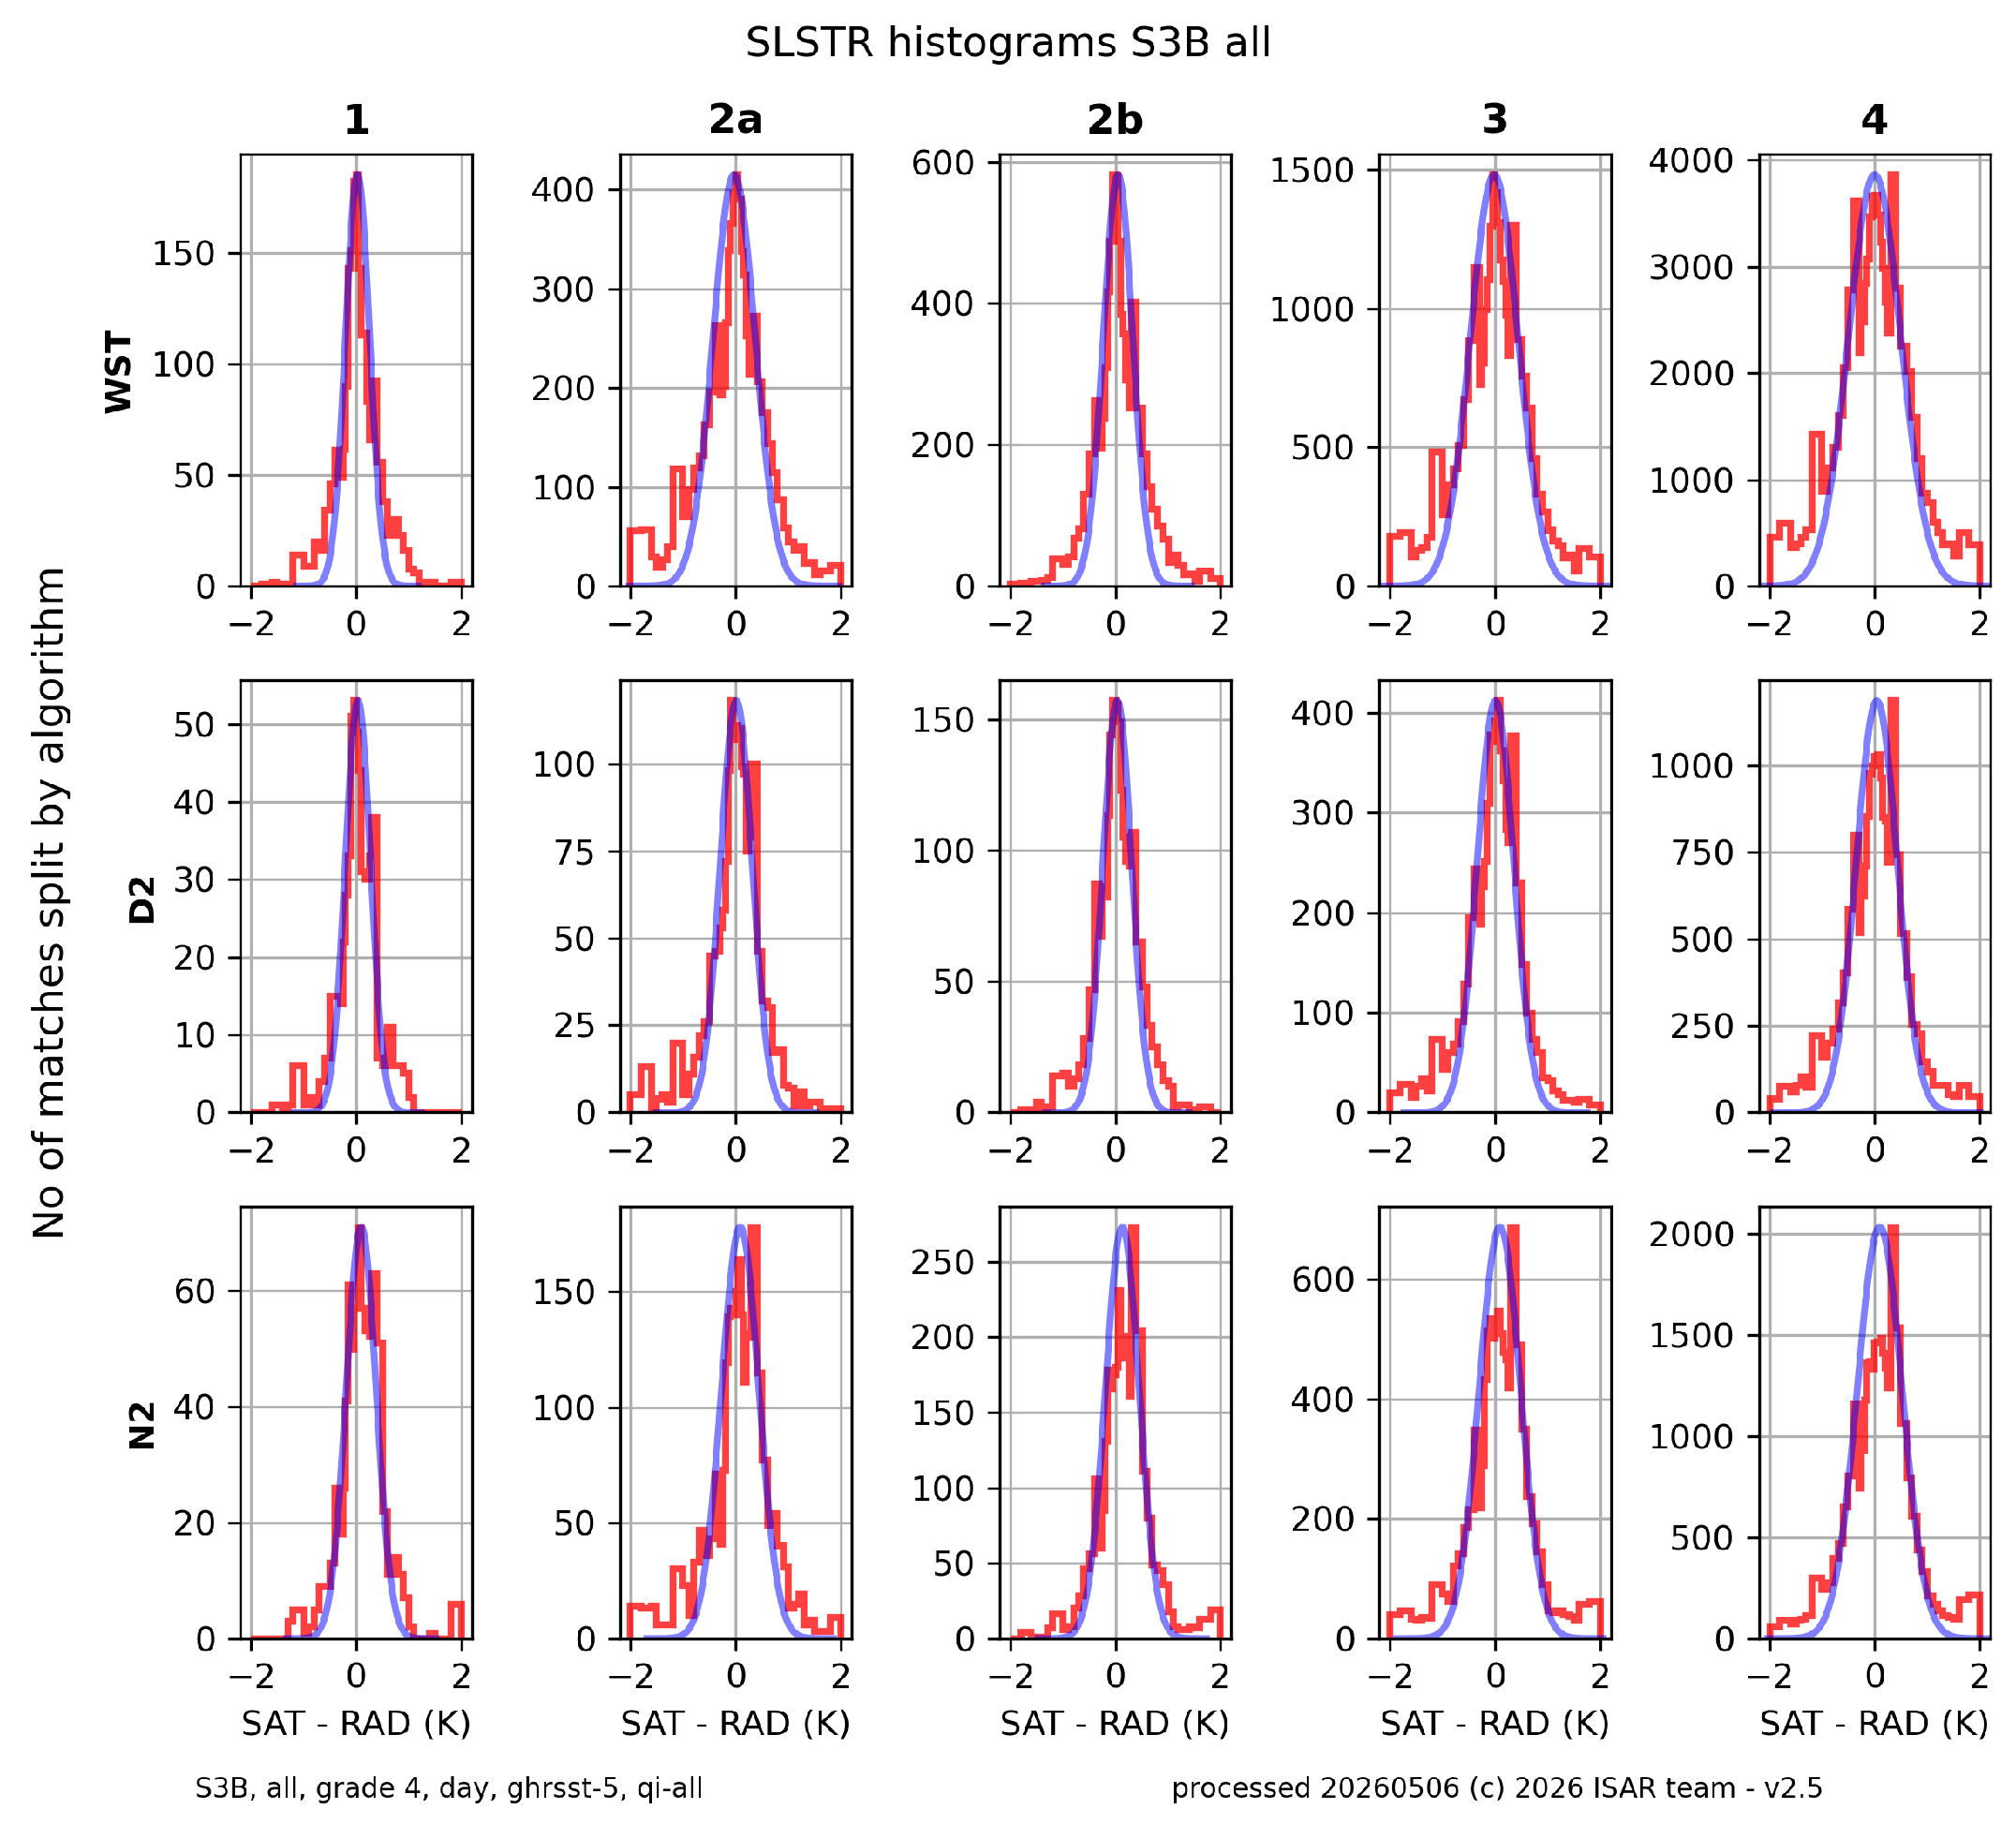
The histograms in Figure 9 and Figure 10 show the validation data for S3A organized by grade (rows) and satellite data product (columns). Figure 9 shows the nighttime histograms and Figure 10 shows the daytime histograms. For S3B, the nighttime histograms are shown in Figure 11 and the daytime histograms are shown in Figure 12. In all histograms, the red data points are the difference between SLSTR and ships4sst data, and the blue data points are a Gaussian profile corresponding to the median difference and RSD of the data distribution. The histograms are limited to ±2 and consequently outliers larger than 2 are shown in the last data bin at 2 .
Figure 9.
Histograms for the S3A nighttime match-ups, between 2018 and 2025, for all match-up grades (rows), and SLSTR products (columns). The red line represents the data in each plot, and the blue line represents a Gaussian fit to the mean and RSD.
Figure 10.
Histograms for the S3A daytime match-ups, between 2018 and 2025, for all match-up grades (rows), and SLSTR products (columns). The red line represents the data in each plot, and the blue line represents a Gaussian fit to the mean and RSD.
Figure 11.
Histograms for the S3B nighttime match-ups, between 2018 and 2025, for all match-up grades (rows), and SLSTR products (columns). The red line represents the data in each plot, and the blue line represents a Gaussian fit to the mean and RSD.
Figure 12.
Histograms for the S3B daytime match-ups, between 2018 and 2025, for all match-up grades (rows), and SLSTR products (columns). The red line represents the data in each plot, and the blue line represents a Gaussian fit to the mean and RSD.
The histograms show close resemblance to the Gaussian shapes. The main differences are in the wings, where the histograms have higher shoulders than the Gaussian fits. These are due to a small amount of undetected sub-pixel cloud in the SLSTR data and due to match-up process uncertainties. The histograms show a positive median difference of the D2 data for S3A and a negative median difference for the D2 data for S3B. They also show the lower number of matches for D2 data on both S3A and S3B. Furthermore, the histograms show that match-up Grade 1 significantly reduces the number of match-up pairs available for analysis by its strict 30 min and 1 km criteria, although in our case, it does not always improve the shape of the histogram. The histograms also show that the spatial match-up limit is more important for good quality match-ups than the temporal match-up limit. Grade 1 and Grade 2b generally have a histogram that follows the Gaussian fit better than Grades 2a, 3 and 4.
6. Discussion
The primary objective of this work is to provide FRM data and to validate the Copernicus Sentinel-3A and Sentinel-3B SLSTR SSTskin measurements using an independent, objective and traceable assessment of the quality and accuracy of the satellite SST data. Both the S3A and S3B SLSTR instruments show excellent results, comparable to that of AATSR [29], which derived values of () for Grade 2b D3 matches and values of () for D2 products. The ships4sst data thus provide an important bridge between the ENVISAT AATSR to Sentinel-3 SLSTR in the 2012–2016 time period.
These results extend those reported in the SLSTR Validation Report (SVR) [30] where ships4sst data from 2016 to 2018 were used, stating a median difference of and a RSD of for nighttime WST and a median difference of and an RSD of for daytime WST on S3A. These numbers are quite comparable to the results from this study with a median difference of and a RSD of for nighttime WST and a median difference of and a RSD of for daytime WST on S3A.
For S3B, the SVR report does not contain any ships4sst data results but the drifting buoy data show a median difference of and a RSD of for nighttime WST and a median difference of and a RSD of for daytime WST. This compares well with the result from this study, with a median difference of and a RSD of for nighttime WST and a median difference of and a RSD of for daytime WST on S3B. The SVR converts the drifting buoy SST at depth (SSTdepth) to SSTskin with a cool skin model [31] and a modified Kantha and Clayson [32] model as described in [33]. The data presented in this paper together with that reported previously in the SVR show that the largest median difference between SLSTR and the ships4sst data is for the S3A N2 daytime retrieval data.
Ref. [25] compared SLSTR on S3A with M-AERI data from 2017 to 2019 and reported that the SLSTR N3 retrievals had the largest median difference with and N2 the lowest with . Both D2 and D3 showed small median differences of and , respectively. The Standard Deviations (SDs) that they report are lowest for N2 with and highest for N3 with . The D3 and D2 results are in the middle of these two results with for D2 and for D3. Within this study, the N2 median difference is , which is higher than [25] found. However, the result for N3 at is much more consistent with the SVR and what we expect from SLSTR. The differences between our study and [25] are partly due to a different match-up window of 1 h and 10 km and the robust statistics for our study compared to that of [25], which uses a classic standard deviation. This gives outliers a more prominent role in the data than robust statistics. Ref. [25] also use a smaller data set of three years compared to our seven years, and a more regional data set with a focus on the Caribbean.
Some of the differences derive from geophysical variability, but some are due to the reduced ships4sst data volume, especially in 2021 and 2022, when data collection was limited by the Coronavirus disease 2019 (COVID-19) restrictions in the shipping industry and the resulting slow return to normality on some routes. In 2021 and 2022, ships4sst validation data were collected almost exclusively around Europe and were reduced not only in volume but also in spatial coverage. This reduction in match-up data can be seen in Table 14 and Table 15, which show the match-up statistics for Grade 2b on an annual basis. The WST data from S3A and S3B (Figure 3 and Figure 4) show the impact of the reduced data on all match-up grades.
Table 14.
Match-up statistics for SLSTR S3A WST date, with a Grade 2b match-up window and GHRSST Quality Level 5 between 2018 and 2025, split into years.
Table 15.
Match-up statistics for SLSTR S3B WST date, with a Grade 2b match-up window and GHRSST Quality Level 5 between 2019 and 2025, split into years. SLSTR S3B was launched in 2018 and operational data became avaible in 2019.
Looking at the RSD of the SLSTR and FRM match-up pairs at nighttime, the RSDs have a low value of in 2025 and a high value of in 2020 for S3A and a low value of in 2025 and a high value of in 2020 for S3B. For daytime match-up pairs, the RSDs are larger than at nighttime, ranging from in 2020 to in 2021 for S3A and ranging from in 2023 to in 2021 for S3B. These values are lower than was reported in [25] and are consistent over the reported timeline. The median difference shows gain in good consistency for the match-up pairs, with a small outlier in 2021 for both S3A and S3B of . The daytime median difference is more variable than the nighttime median difference with no clear patterns emerging on either S3A of S3B. A linear regression was fitted to the data to see whether there are any trends, and the value of this regression is shown in Table 14 for S3A and Table 15 for S3B. The value shows very strong correlation, and no trends were found in the linear regression analysis, showing that while the data volume was low in 2021 and 2021, the main impact is on reduced geographical coverage, not on the match-up statistics. This shows that the SLSTRs on S3A and S3B are very stable over the observed time period.
7. Conclusions
The ships4sst validation project provided a quasi-operational in situ FRM quality SSTskin measurement program with a common data format and traceable measurements and demonstrated its importance in the quality control of SLSTR SST products from S3A and S3B. Validation of these products confirmed the excellent performance of SLSTR and the SST data retrieved using the WST algorithm. The median differences between the S3A SLSTR and the ships4sst data are with a RSD of for nighttime WST and with an RSD of for daytime WST. For the S3B SLSTR, the median differences are with a RSD of for nighttime WST and with a RSD of for daytime WST. These results are well within the traceable uncertainties of the ships4sst data and show the excellent performance of the Copernicus Sentinel-3A and Sentinel-3B SLSTR instruments. This inspires confidence in the use of SLSTR not only as a reference sensor but also as a basis for producing climate quality SST records.
However, the accuracy and stability of SLSTR data reported here are mainly applicable to the European, North Atlantic, Caribbean and Australian waters and show the need for further ships4sst FRM data for a global validation of SLSTR. It also highlights the essential need to sustain validation programmes throughout a satellite’s lifetime, and that SST data products must be validated against an independent, traceable data record of FRM.
Author Contributions
Conceptualization, W.W., T.N., C.J.D. and J.H.; methodology, W.W., T.N. and C.J.D.; software, W.W.; formal analysis, W.W. and T.N.; data collection, W.W., T.N., A.L., J.H. and G.G.; writing—original draft preparation, W.W.; writing—review and editing, W.W., T.N., A.L., G.G., R.W., S.N. and C.J.D.; visualization, W.W.; project administration, R.W. and S.N.; funding acquisition, R.W., S.N. and C.J.D. All authors have read and agreed to the published version of the manuscript.
Funding
This work was funded by the ESA Contract 4000127348, managed by Space ConneXions Ltd.
Data Availability Statement
The ships4sst data can be obtained from www.ships4sst.org (accessed on 4 March 2026) The Felyx MDB files are available to Sentinel-3 Validation Team (S3VT) participants from EUMETSAT.
Acknowledgments
We acknowledge the generosity of Brittany Ferries, Cunard Line, Royal Caribbean Cruises, Smyril Line, National Oceanic and Atmospheric Administration (NOAA) an National Environmental Research Council (NERC), in allowing ISAR, SISTeR and M-AERI instruments to be deployed on their ships, and wish to record our thanks to the Masters and crew of those vessels since 2004 for their ongoing assistance. EUMETSAT provided ready access to all the SLSTR data and the processing of the Felyx MDB.
Conflicts of Interest
Authors Ruth Wilson and Sorrel Nelson were employed by the company Space ConneXions Ltd. The remaining authors declare that the research was conducted in the absence of any commercial or financial relationships that could be construed as a potential conflict of interest. The authors declare that this study received funding from the European Space Agency. The funder was not involved in the study design, collection, analysis, interpretation of data, the writing of this article or the decision to submit it for publication.
Abbreviations
The following abbreviations are used in this manuscript:
| AATSR | Advanced Along Track Scanning Radiometer |
| AERI | Atmospheric Emitted Radiance Interferometer |
| BB | Black Body |
| BT | Brightness Temperature |
| CASOTS | Combined Action for the Study of the Ocean Thermal Skin |
| CDR | Climate Data Record |
| COVID-19 | Coronavirus disease 2019 |
| CSIRO | Commonwealth Scientific and Industrial Research Organization |
| D2 | SLSTR dual view two-channel product |
| D3 | SLSTR dual view three-channel product |
| DMI | Danish Meteorological Institute |
| ECV | Essential Climate Variable |
| ESA | European Space Agency |
| EUMETSAT | European Organization for the Exploitation of Meteorological Satellites |
| FRM | Fiducial Reference Measurement |
| FRM4STS | FRM for validation of Surface Temperature from Satellites |
| FRM4SST | FRM for validation of Sea Surface Temperature |
| FTIR | Fourier Transform Infrared |
| GHRSST | Group for High-Resolution Sea Surface Temperature |
| HRDDS | High-Resolution Diagnostic Data Set |
| IR | Infrared |
| ISAR | Infrared Sea Surface Temperature Autonomous Radiometer |
| ISFRN | International Shipborne FRM Radiometer Network |
| ISR | Infrared Shipborne Radiometer |
| M-AERI | Marine Atmospheric Emitted Radiance Interferometer |
| MDB | Match-up Database |
| MDiff | Median Difference |
| N2 | SLSTR nadir view two-channel product |
| N3 | SLSTR nadir view three-channel product |
| NIST | National Institute of Standards and Technology, USA |
| NPL | National Physical Laboratory, Teddington, UK |
| NMI | National Metrology Institute |
| NOAA | National Oceanic and Atmospheric Administration |
| NERC | National Environmental Research Council |
| NEDT | Noise Equivalent Differential Temperature |
| OZA | Observation Zenith Angle |
| RAL | Rutherford Appleton Laboratory |
| RSD | Robust Standard Deviation |
| RSMAS | Rosenstiel School of Marine and Atmospheric Science, University of Miami |
| RRS | Royal Research Ship |
| SI | International System of Units |
| SISTeR | Scanning Infrared Sea Surface Temperature Radiometer |
| SLSTR | Sea and Land Surface Temperature Radiometer |
| SST | Sea Surface Temperature |
| SSTdepth | SST at depth |
| SSTskin | SST at the skin interface |
| SD | Standard Deviation |
| SWIR | Sortwave Infrared |
| SZA | Sun Zenith Angle |
| S3A | Sentinel-3A |
| S3B | Sentinel-3B |
| SVR | SLSTR Validation Report |
| S3VT | Sentinel-3 Validation Team |
| TIR | Thermal Infrared |
| UoS | University of Southampton |
| VIS | Visible |
| WST | Water Surface Temperature |
| WCT | Water Composed Temperature |
References
- Bojinski, S.; Verstraete, M.; Peterson, T.C.; Richter, C.; Simmons, A.; Zemp, M. The concept of Essential Climate Variables in support of climate research, applications and policy. Bull. Am. Meteorol. Soc. 2014, 95, 1431–1443. [Google Scholar] [CrossRef] [Scilit]
- O’Carroll, A.G.; Armstrong, E.M.; Beggs, H.M.; Bouali, M.; Casey, K.S.; Corlett, G.K.; Dash, P.; Donlon, C.J.; Gentemann, C.L.; Høyer, J.L.; et al. Observational needs of sea surface temperature. Front. Mar. Sci. 2019, 6, 420. [Google Scholar] [CrossRef] [Scilit]
- Minnett, P.J.; Corlett, G.K. A pathway to generating Climate Data Records of sea-surface temperature from satellite measurements. Deep Sea Res. Part II Top. Stud. Oceanogr. 2012, 77–80, 44–51. [Google Scholar] [CrossRef] [Scilit]
- Smith, D.; Barillot, M.; Bianchi, S.; Brandani, F.; Coppo, P.; Etxaluze, M.; Frerick, J.; Kirschstein, S.; Lee, A.; Maddison, B.; et al. Sentinel-3A/B SLSTR Pre-Launch Calibration of the Thermal InfraRed Channels. Remote Sens. 2020, 12, 2510. [Google Scholar] [CrossRef] [Scilit]
- Goryl, P.; Fox, N.; Donlon, C.; Castracane, P. Fiducial Reference Measurements (FRMs): What Are They? Remote Sens. 2023, 15, 5017. [Google Scholar] [CrossRef] [Scilit]
- Embury, O.; Merchant, C.J.; Good, S.A.; Rayner, N.A.; Høyer, J.L.; Atkinson, C.; Block, T.; Alerskans, E.; Pearson, K.J.; Worsfold, M.; et al. Satellite-based time-series of sea-surface temperature since 1980 for climate applications. Sci. Data 2024, 11, 326. [Google Scholar] [CrossRef] [Scilit]
- Donlon, C.J.; Minnett, P.J.; Fox, N.; Wimmer, W. Chapter 5.2—Strategies for the Laboratory and Field Deployment of Ship-Borne Fiducial Reference Thermal Infrared Radiometers in Support of Satellite-Derived Sea Surface Temperature Climate Data Records. In Experimental Methods in the Physical Sciences; Zibordi, G., Donlon, C.J., Parr, A.C., Eds.; Academic Press: Cambridge, MA, USA, 2014; Volume 47, pp. 557–603. ISBN 9780124170117. [Google Scholar] [CrossRef] [Scilit]
- Coppo, P.; Ricciarelli, B.; Brandani, F.; Delderfield, J.; Ferlet, M.; Mutlow, C.; Munro, G.; Nightingale, T.; Smith, D.; Bianchi, S. SLSTR: A high accuracy dual scan temperature radiometer for sea and land surface monitoring from space. J. Mod. Opt. 2010, 57, 1815–1830. [Google Scholar] [CrossRef] [Scilit]
- Hawkins, G.; Sherwood, R.; Djotni, K.; Coppo, P.; Höhnemann, H.; Belli, F. Cooled Infrared Filters and Dichroics for the Sea and Land Surface Temperature Radiometer (SLSTR). Appl. Opt. 2013, 52, 2125–2135. [Google Scholar] [CrossRef] [Scilit]
- Donlon, C.; Berruti, B.; Buongiorno, A.; Ferreira, M.H.; Féménias, P.; Frerick, J.; Goryl, P.; Klein, U.; Laur, H.; Mavrocordatos, C.; et al. The global monitoring for environment and security (GMES) sentinel-3 mission. Remote Sens. Environ. 2012, 120, 37–57. [Google Scholar] [CrossRef] [Scilit]
- GCOS. The Global Observing System for Climate: Climate Monitoring Principles. 2003. Available online: https://gcos.wmo.int/en/essential-climate-variables/about/gcos-monitoring-principles (accessed on 14 November 2025).
- Llewellyn-Jones, D.; Remedios, J. The Advanced Along Track Scanning Radiometer (AATSR) and its predecessors ATSR-1 and ATSR-2: An introduction to the special issue. Remote Sens. Environ. 2012, 116, 1–3. [Google Scholar] [CrossRef] [Scilit]
- Donlon, C.J. Sentinel-3 Mission Requirements Traceability Document (MRTD) S3 MRTD, Version 1. 2011. Available online: https://earth.esa.int/eogateway/documents/20142/1564943/Sentinel-3-Mission-Requirements-Traceability-Document-MRTD.pdf (accessed on 14 November 2025).
- Edwards, T.; Browning, R.; Delderfield, J.; Lee, D.J.; Lidiard, K.A. The along track scanning radiometer-Measurement of sea-surface temperature from ERS-1. J. Br. Interplanet. Soc. 1990, 43, 160–180. [Google Scholar]
- Gao, B.; Goetz, A.F.H.; Wiscombe, W.J. Cirrus cloud detection from Airborne Imaging Spectrometer data using the 1.38 µm water vapor band. Geophys. Res. Lett. 1993, 20, 301–304. [Google Scholar] [CrossRef] [Scilit]
- Theocharous, E.; Fox, N.P.; Barker-Snook, I.; Niclòs, R.; Garcia Santos, V.; Minnett, P.J.; Göttsche, F.M.; Poutier, L.; Morgan, N.; Nightingale, T.; et al. The 2016 CEOS infrared radiometer comparison: Part 2: Laboratory comparison of radiation thermometers. J. Atmos. Ocean. Technol. 2018, 16, 1079–1092. [Google Scholar] [CrossRef] [Scilit]
- Donlon, C.; Robinson, I.S.; Wimmer, W.; Fisher, G.; Reynolds, M.; Edwards, R.; Nightingale, T.J. An infrared sea surface temperature autonomous radiometer (ISAR) for deployment aboard volunteer observing ships (VOS). J. Atmos. Ocean. Technol. 2008, 25, 93–113. [Google Scholar] [CrossRef] [Scilit]
- Donlon, C.J.; Nightingale, T.J. Effect of atmospheric radiance errors in radiometric sea-surface skin temperature measurements. Appl. Opt. 2000, 39, 2387–2392. [Google Scholar] [CrossRef] [Scilit]
- Wimmer, W.; Robinson, I.S. The ISAR Instrument Uncertainty Model. J. Atmos. Ocean. Technol. 2016, 33, 2415–2433. [Google Scholar] [CrossRef] [Scilit]
- Minnett, P.; Knuteson, R.; Best, F.; Osborne, B.; Hanafin, J.; Brown, O. The Marine-Atmospheric Emitted Radiance Interferometer: A High-Accuracy, Seagoing Infrared Spectroradiometer. J. Atmos. Ocean. Technol. 2001, 18, 994–1013. [Google Scholar] [CrossRef] [Scilit]
- Yamada, Y.; Harris, S.; Hayes, M.; Simpson, R.; Wimmer, W.; Holmes, R.; Nightingale, T.; Lee, A.; Jepsen, N.; Morgan, N.; et al. 2022 CEOS International Thermal Infrared Radiometer Comparison. Part I: Laboratory Comparison of Radiometers and Blackbodies. J. Atmos. Ocean. Technol. 2024, 41, 295–307. [Google Scholar] [CrossRef] [Scilit]
- Yamada, Y.; Harris, S.; Wimmer, W.; Holmes, R.; Nightingale, T.; Lee, A.; Jepsen, N.; Morgan, N.; Gottsche, F.M.; Niclos, R.; et al. 2022 CEOS International Thermal Infrared Radiometer Comparison. Part II: Field Comparison of Radiometers. J. Atmos. Ocean. Technol. 2024, 41, 309–318. [Google Scholar] [CrossRef] [Scilit]
- Donlon, C.J.; Nightingale, T.J.; Sheasby, T.; Turner, J.; Robinson, I.S.; Emergy, W.J. Implications of the oceanic thermal skin temperature deviation at high wind speed. Geophys. Res. Lett. 1999, 26, 2505–2508. [Google Scholar] [CrossRef] [Scilit]
- Donlon, C.J.; Wimmer, W.; Robinson, I.; Fisher, G.; Ferlet, M.; Nightingale, T.; Bras, B. A Second-Generation Blackbody System for the Calibration and Verification of Sea-Going Infrared Radiometers. J. Atmos. Ocean. Technol. 2014, 31, 1104–1127. [Google Scholar] [CrossRef] [Scilit]
- Luo, B.; Minnett, P.J.; Szczodrak, M.; Kilpatrick, K.; Izaguirre, M. Validation of Sentinel-3A SLSTR derived Sea-Surface Skin Temperatures with those of the shipborne M-AERI. Remote Sens. Environ. 2020, 244, 111826. [Google Scholar] [CrossRef] [Scilit]
- Taberner, M.; Shutler, J.; Walker, P.; Poulter, D.; Piolle, J.-F.; Donlon, C.; Guidetti, V. The ESA FELYX High Resolution Diagnostic Data Set System Design and Implementation. ISPRS—International Archives of the Photogrammetry. Int. Arch. Photogramm. Remote Sens. Spat. Inf. Sci. 2013, XL-7/W2, 243–249. [Google Scholar] [CrossRef] [Scilit]
- Wannop, S.; Corlett, G.; Loveday, B. Sentinel-3 SLSTR Marine User Handbook; EUM/OPS-SEN3/MAN/17/92192; EUMETSAT: Darmstadt, Germany, 2018. [Google Scholar]
- Product Data Format Specification—SLSTR Level 2 Marine Products; S3IPF.PDS.005.3; ACRI: Sophia-Antipolis, France; EUMETSAT: Darmstadt, Germany, 2019; Issue 2.8.
- Wimmer, W.; Robinson, I.; Donlon, C. Long-term validation of AATSR SST data products using shipborne radiometry in the Bay of Biscay and English Channel. Remote Sens. Environ. 2012, 116, 17–31. [Google Scholar] [CrossRef] [Scilit]
- EUMETSAT. Copernicus SLSTR Sea Surface Temperature Validation Report; EUMETSAT: Darmstadt, Germany, 2022. [Google Scholar]
- Fairall, C.W.; Bradley, E.F.; Godfrey, J.S.; Wick, G.A.; Edson, J.B.; Young, G.S. Cool-skin and warm-layer effects on sea surface temperature. J. Geophys. Res. 1996, 101, 1295–1308. [Google Scholar] [CrossRef] [Scilit]
- Kantha, L.H.; Clayson, C.A. An improved mixed layer model for geophysical applications. J. Geophys. Res. 1994, 99, 25235–25266. [Google Scholar] [CrossRef] [Scilit]
- Embury, O.; Christopher, J.M.; Corlett, G.K. A reprocessing for climate of sea surface temperature from the along-track scanning radiometers: Initial validation, accounting for skin and diurnal variability effects. Remote Sens. Environ. 2012, 116, 62–78. [Google Scholar] [CrossRef] [Scilit]

Disclaimer/Publisher’s Note: The statements, opinions and data contained in all publications are solely those of the individual author(s) and contributor(s) and not of MDPI and/or the editor(s). MDPI and/or the editor(s) disclaim responsibility for any injury to people or property resulting from any ideas, methods, instructions or products referred to in the content. |
© 2026 by the authors. Licensee MDPI, Basel, Switzerland. This article is an open access article distributed under the terms and conditions of the Creative Commons Attribution (CC BY) license.