
Monitoring of Radial Deformations of a Gravity Dam Using Sentinel-1 Persistent Scatterer Interferometry

 ,
,
Abstract
:1. Introduction
2. Materials and Methods
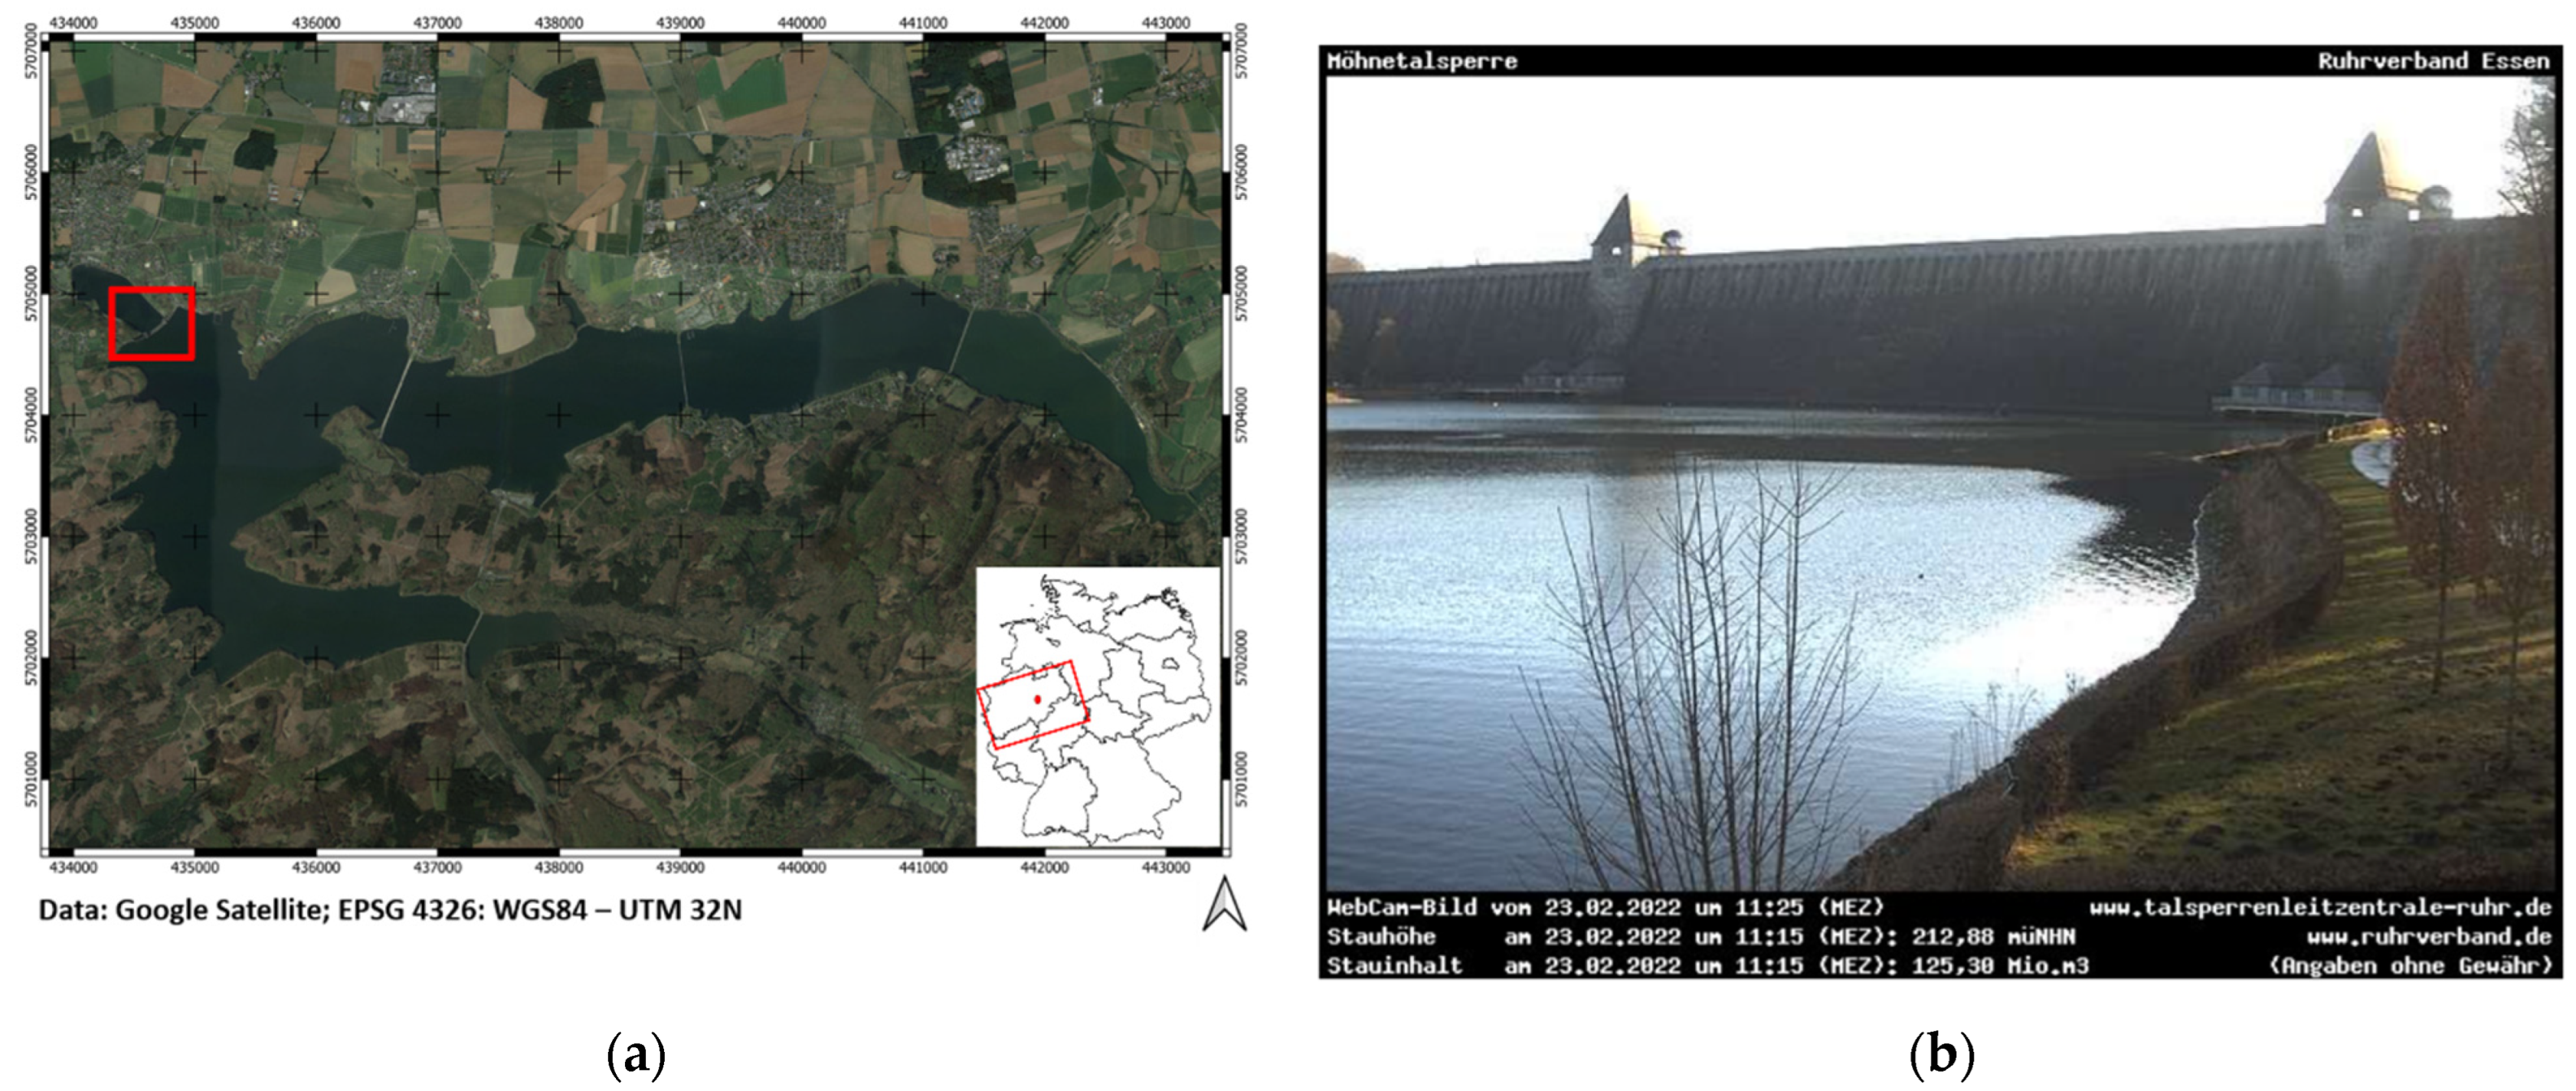
2.1. Study Area
2.2. Data
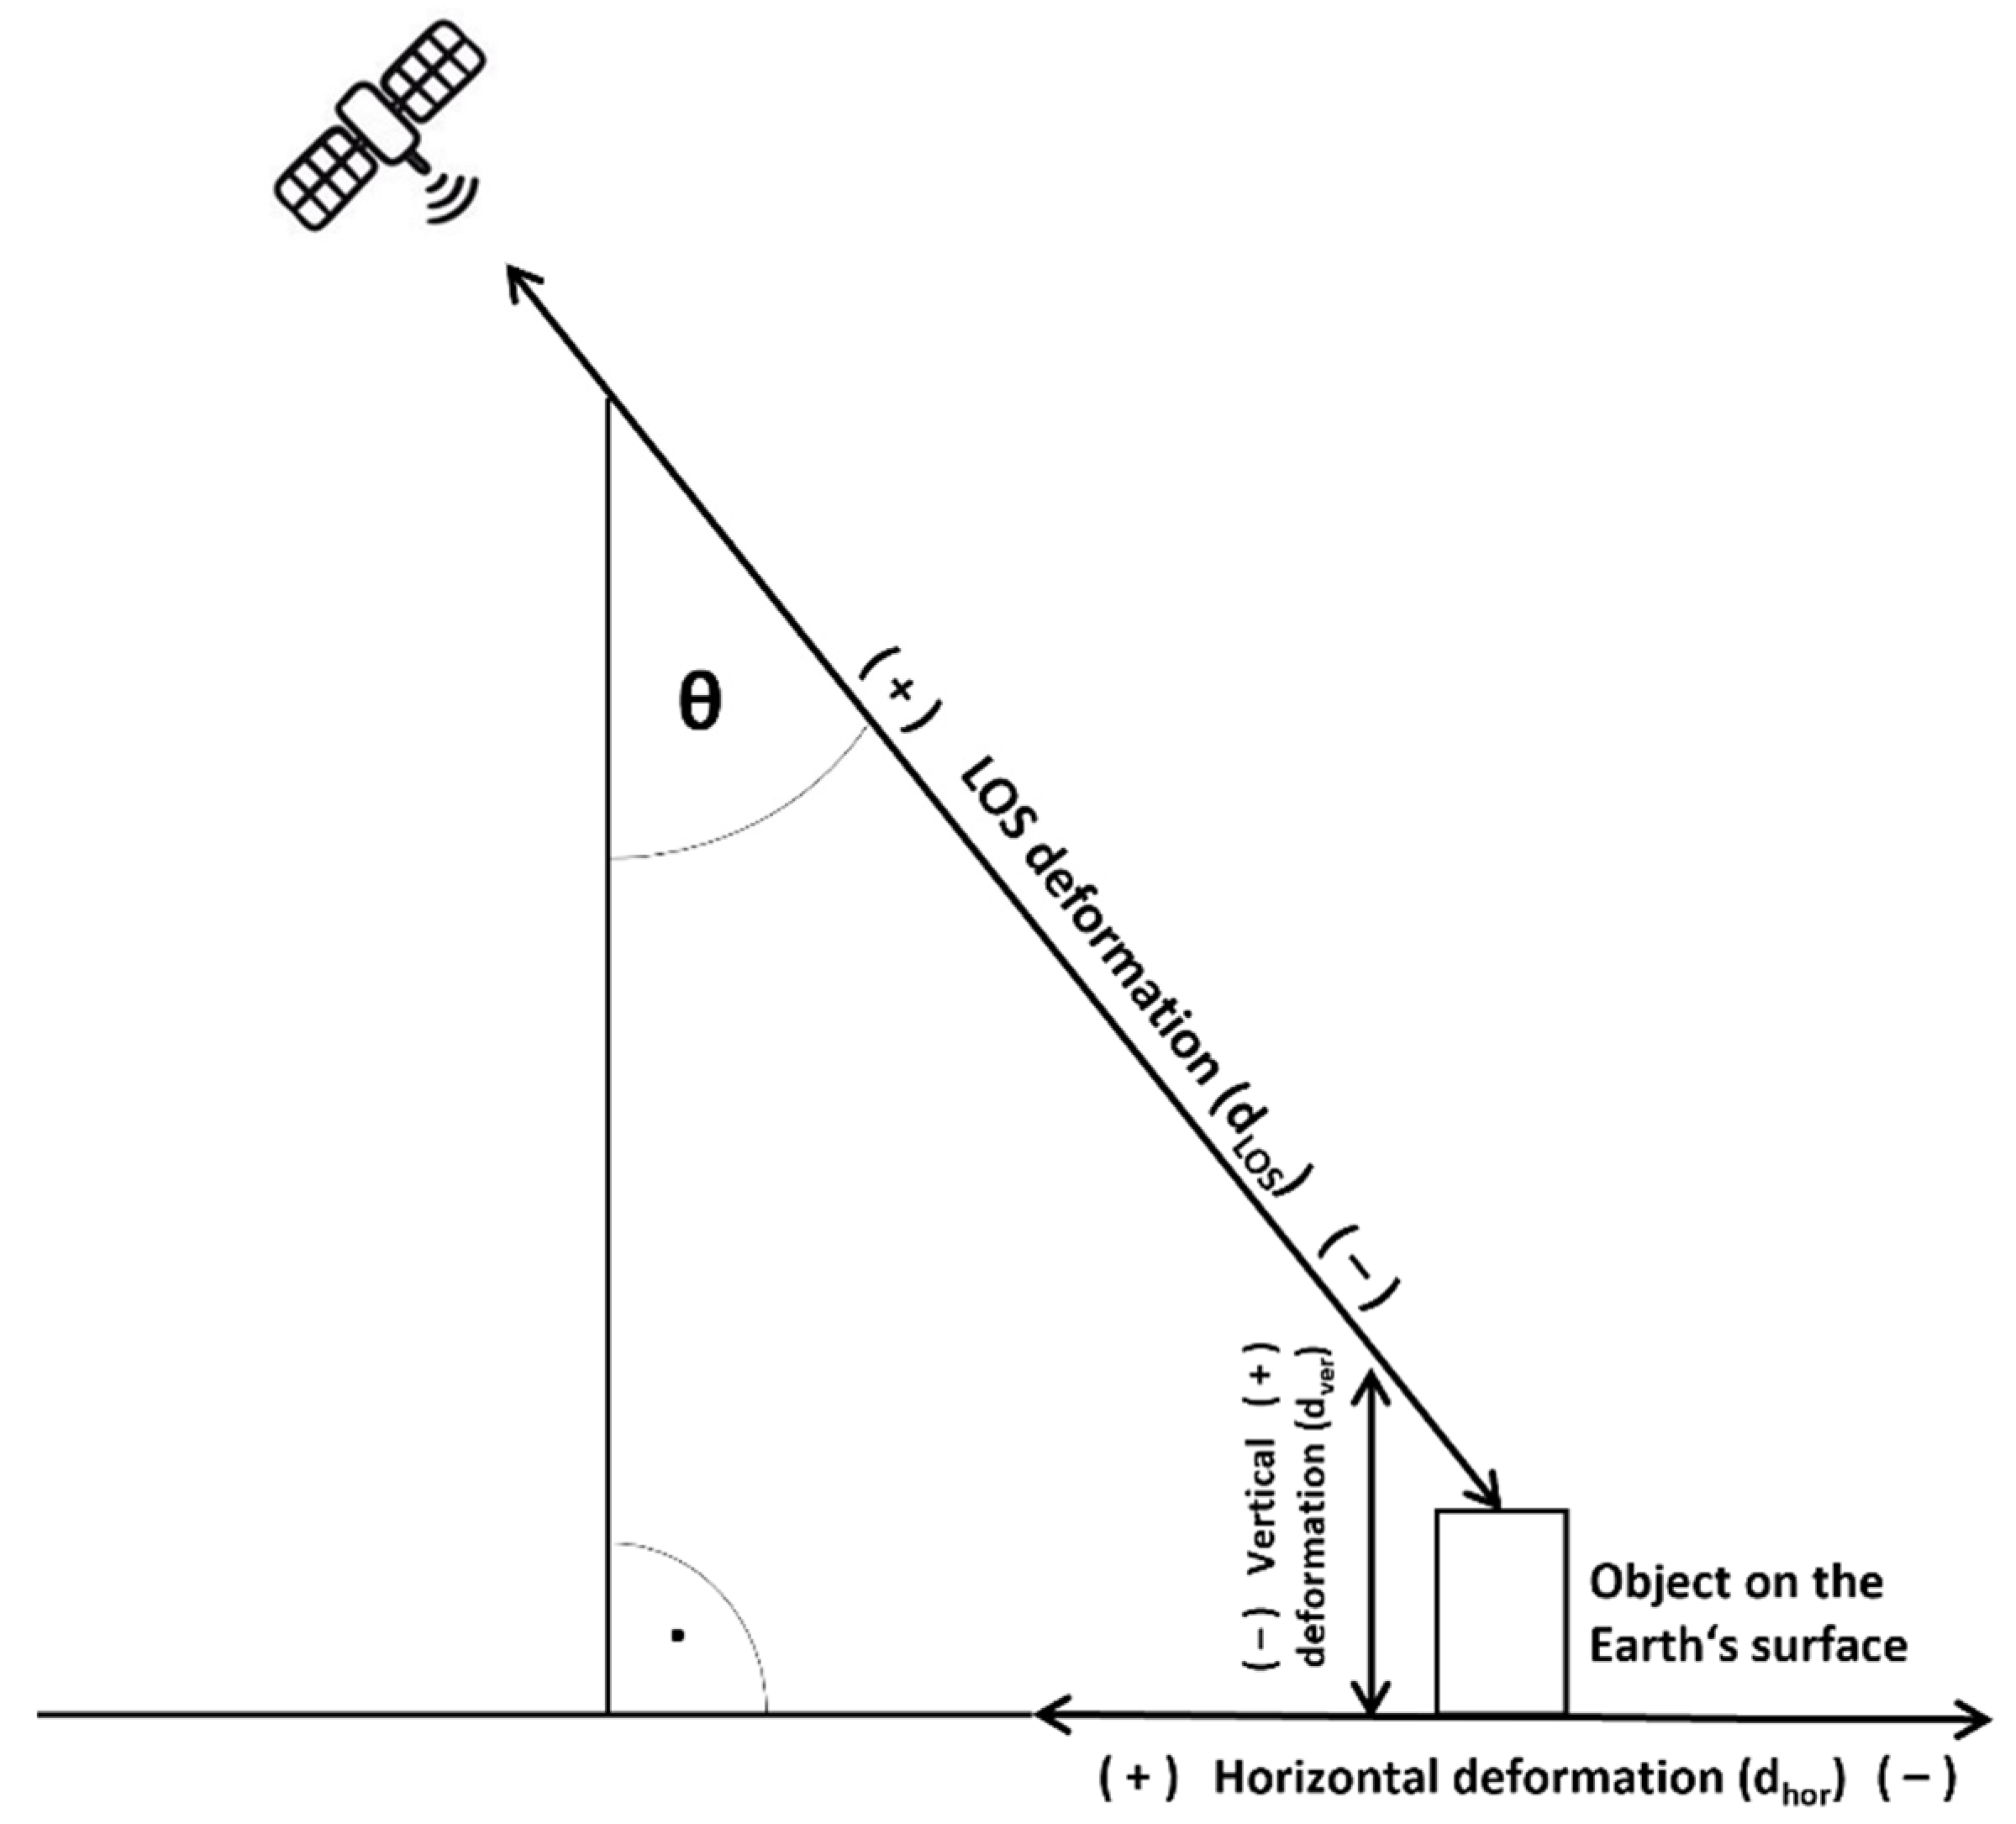
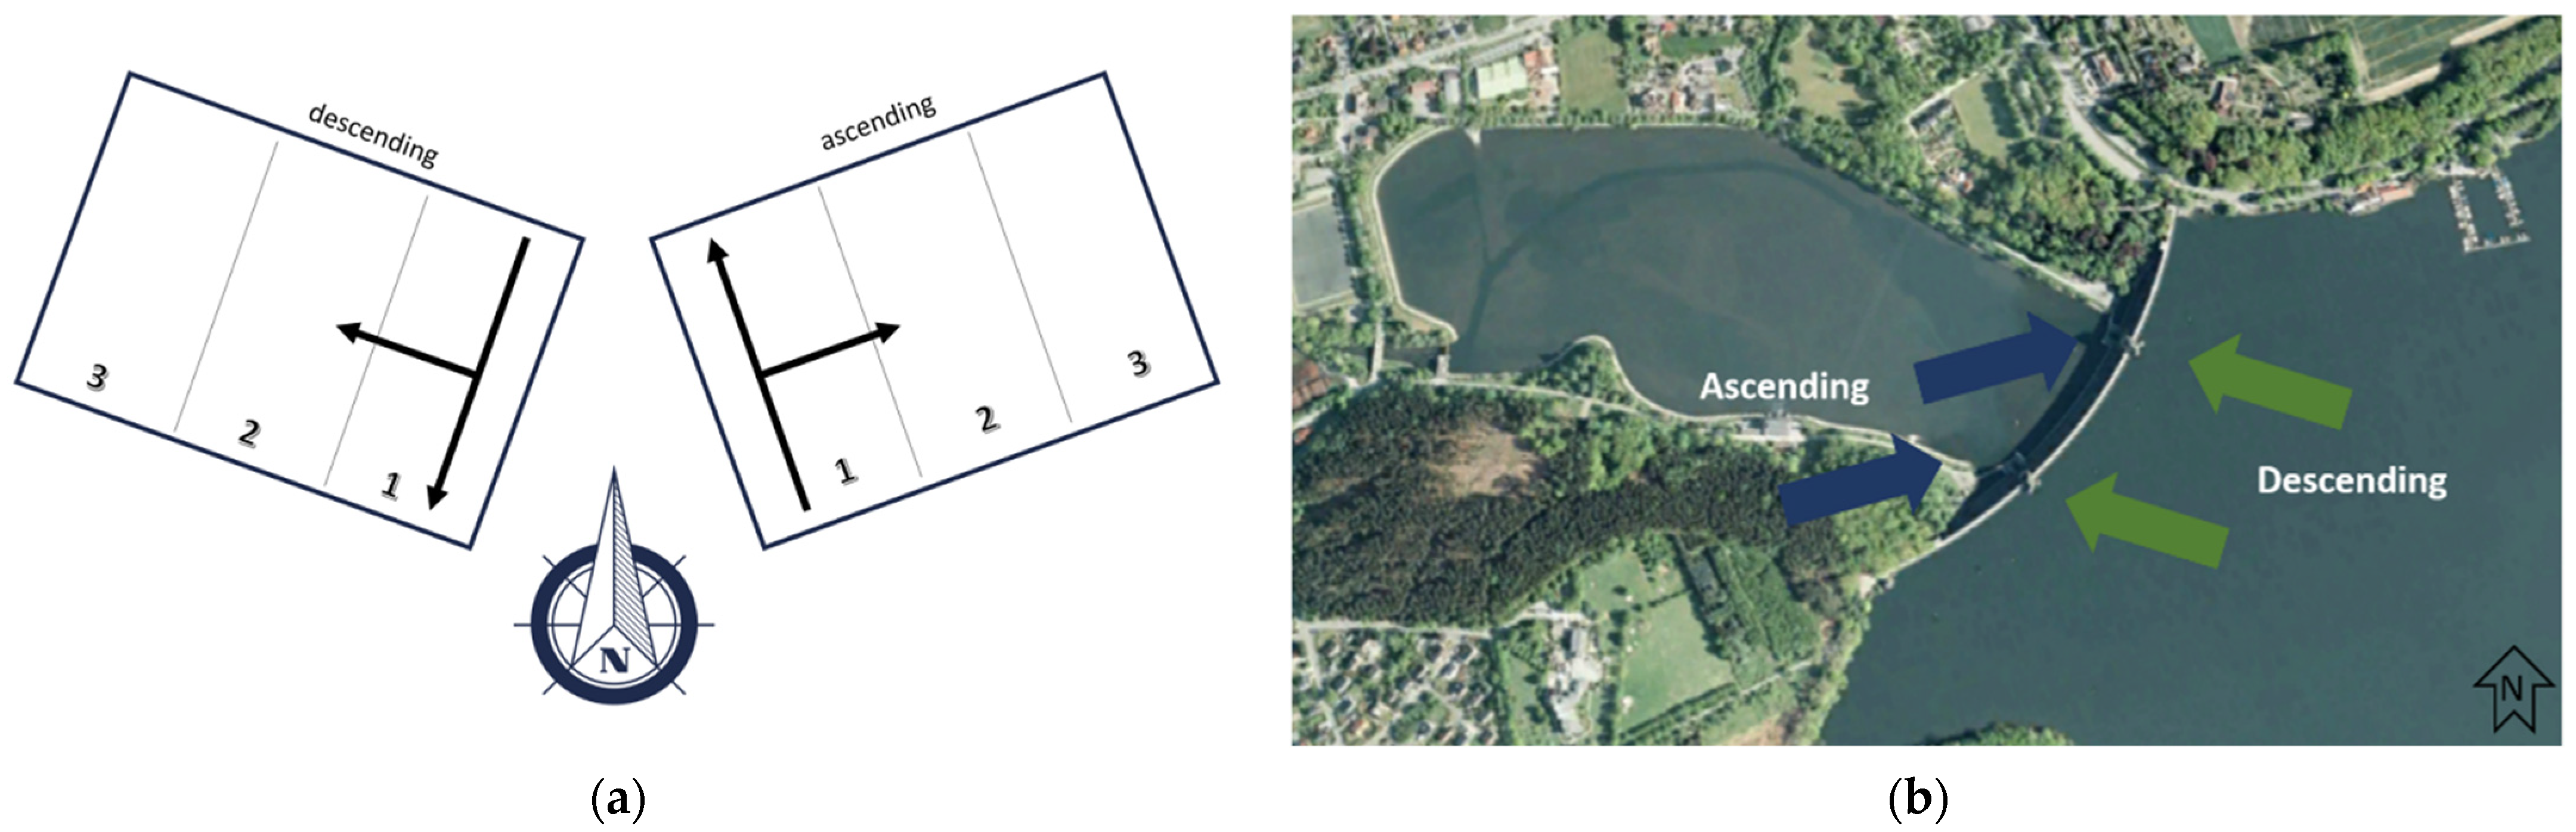
2.3. Methods
3. Results
3.1. Frequency of Observation
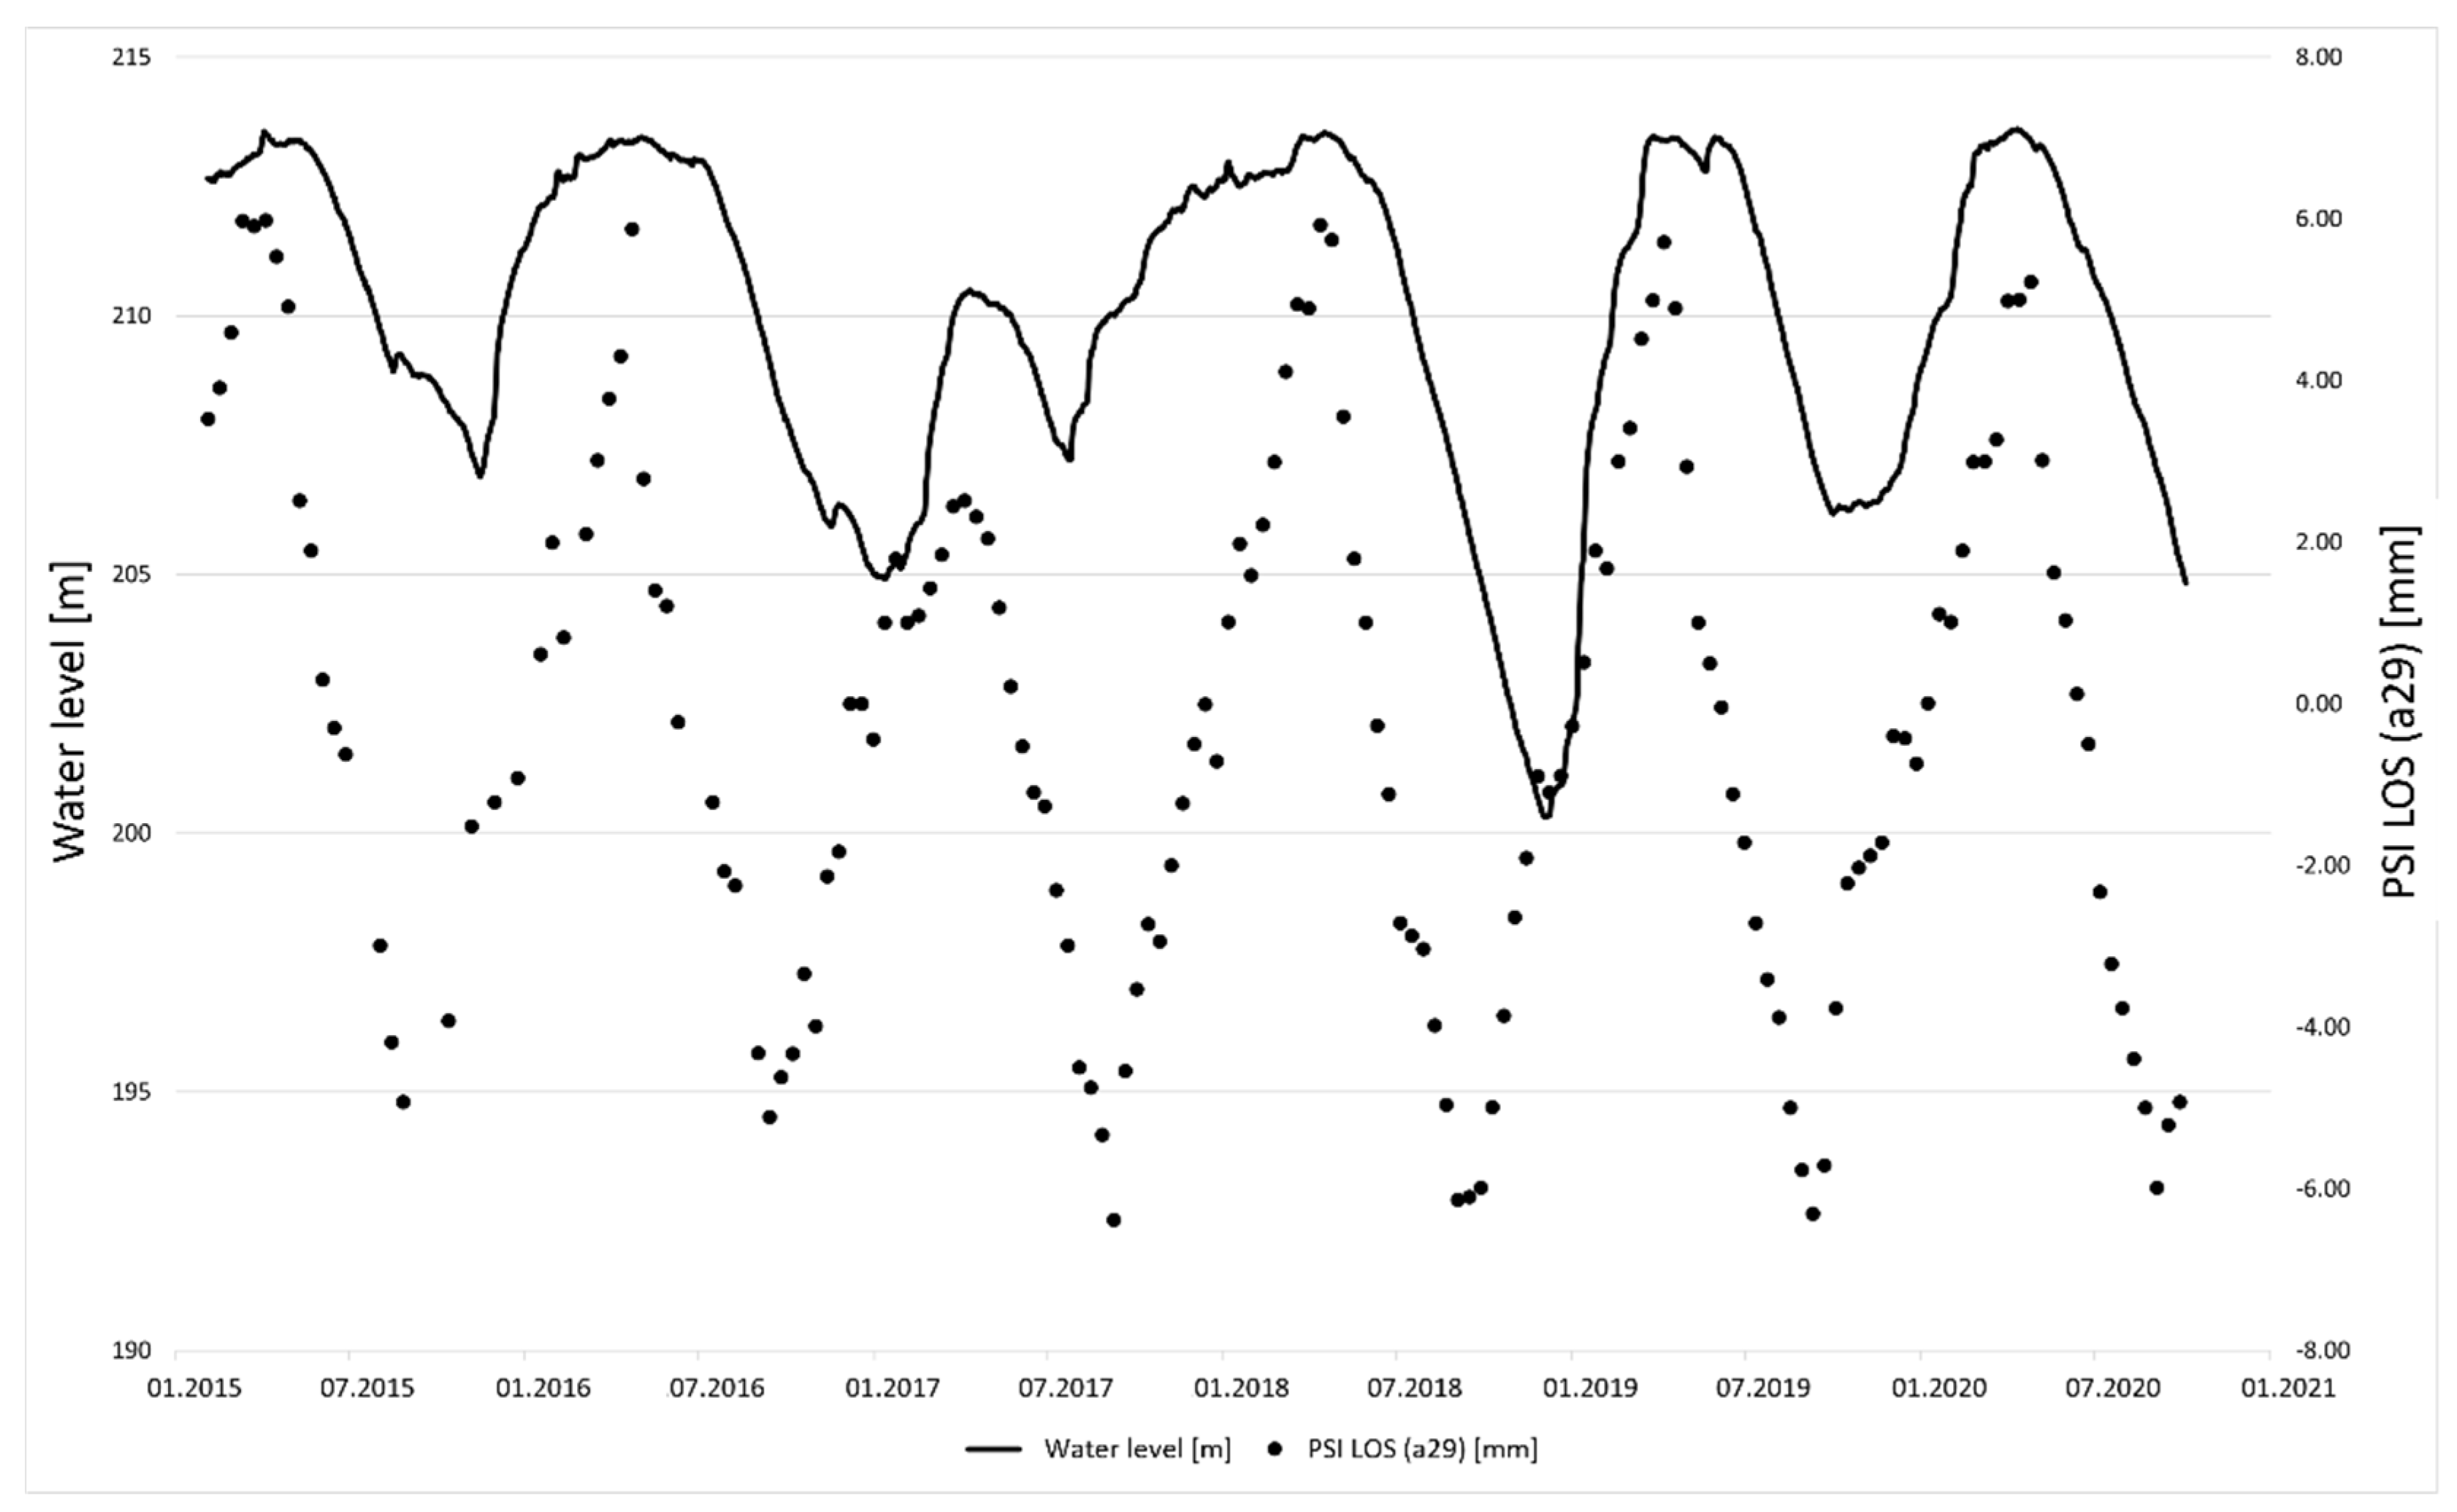
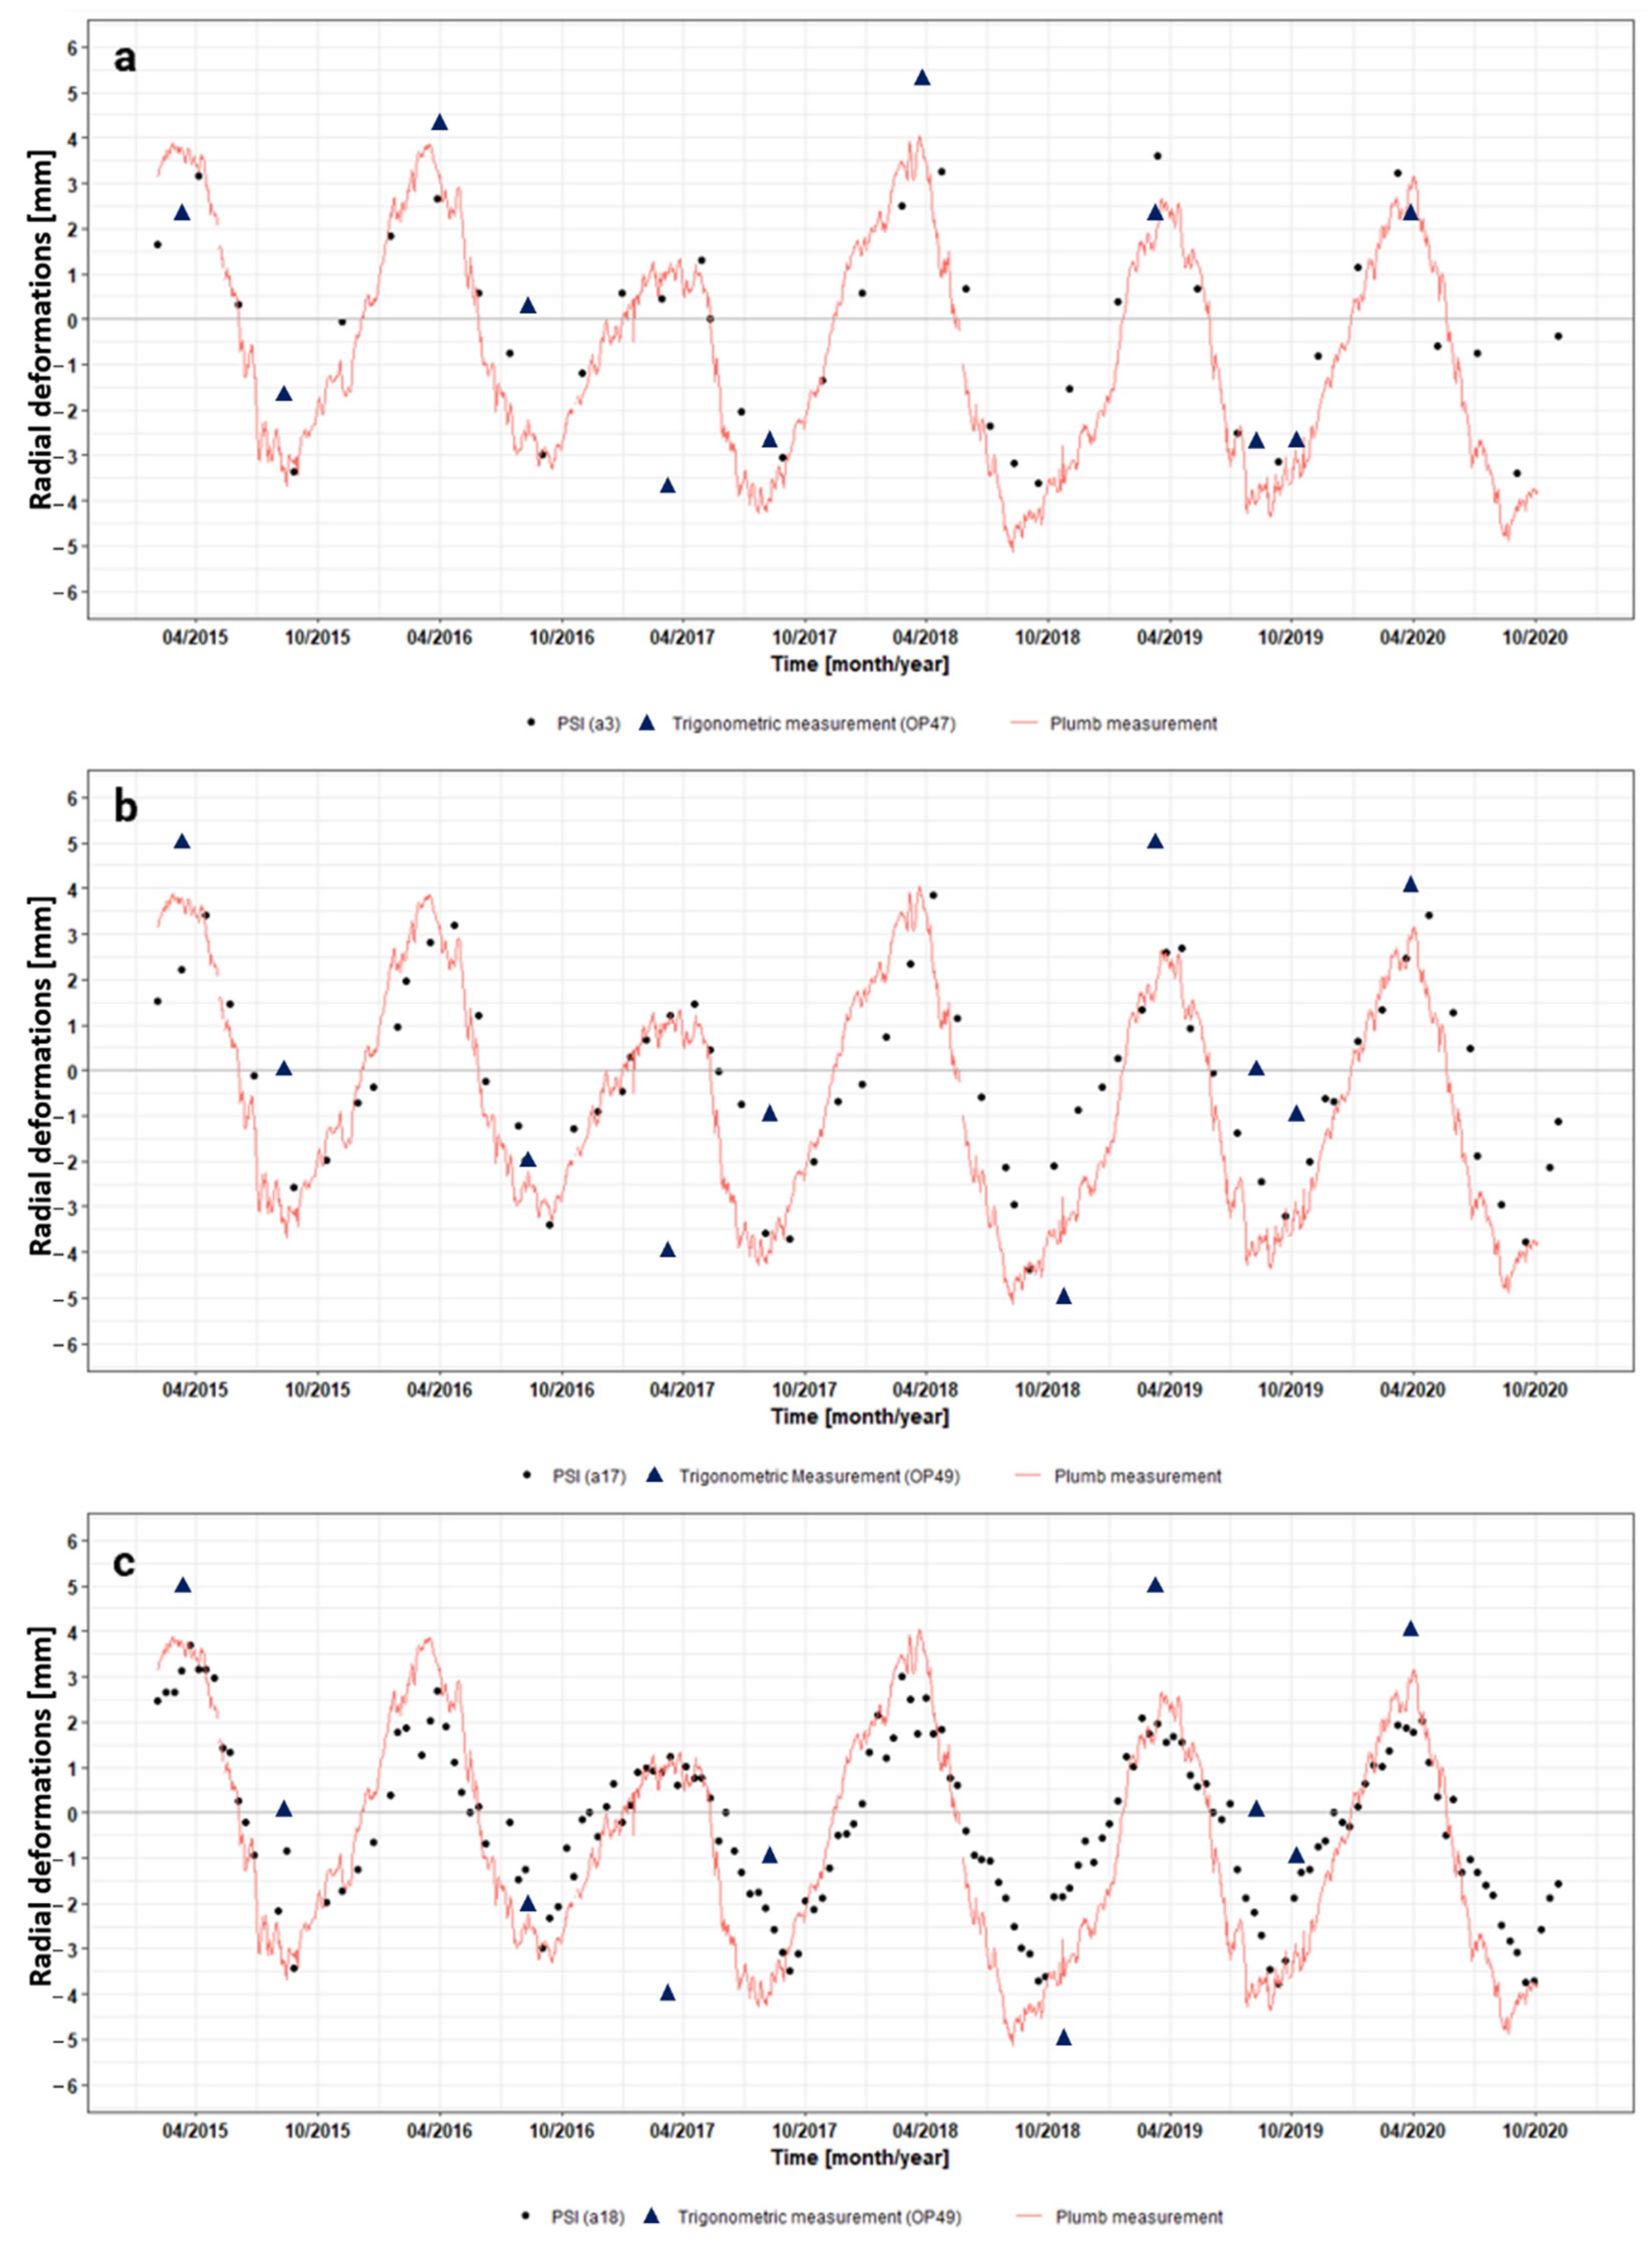
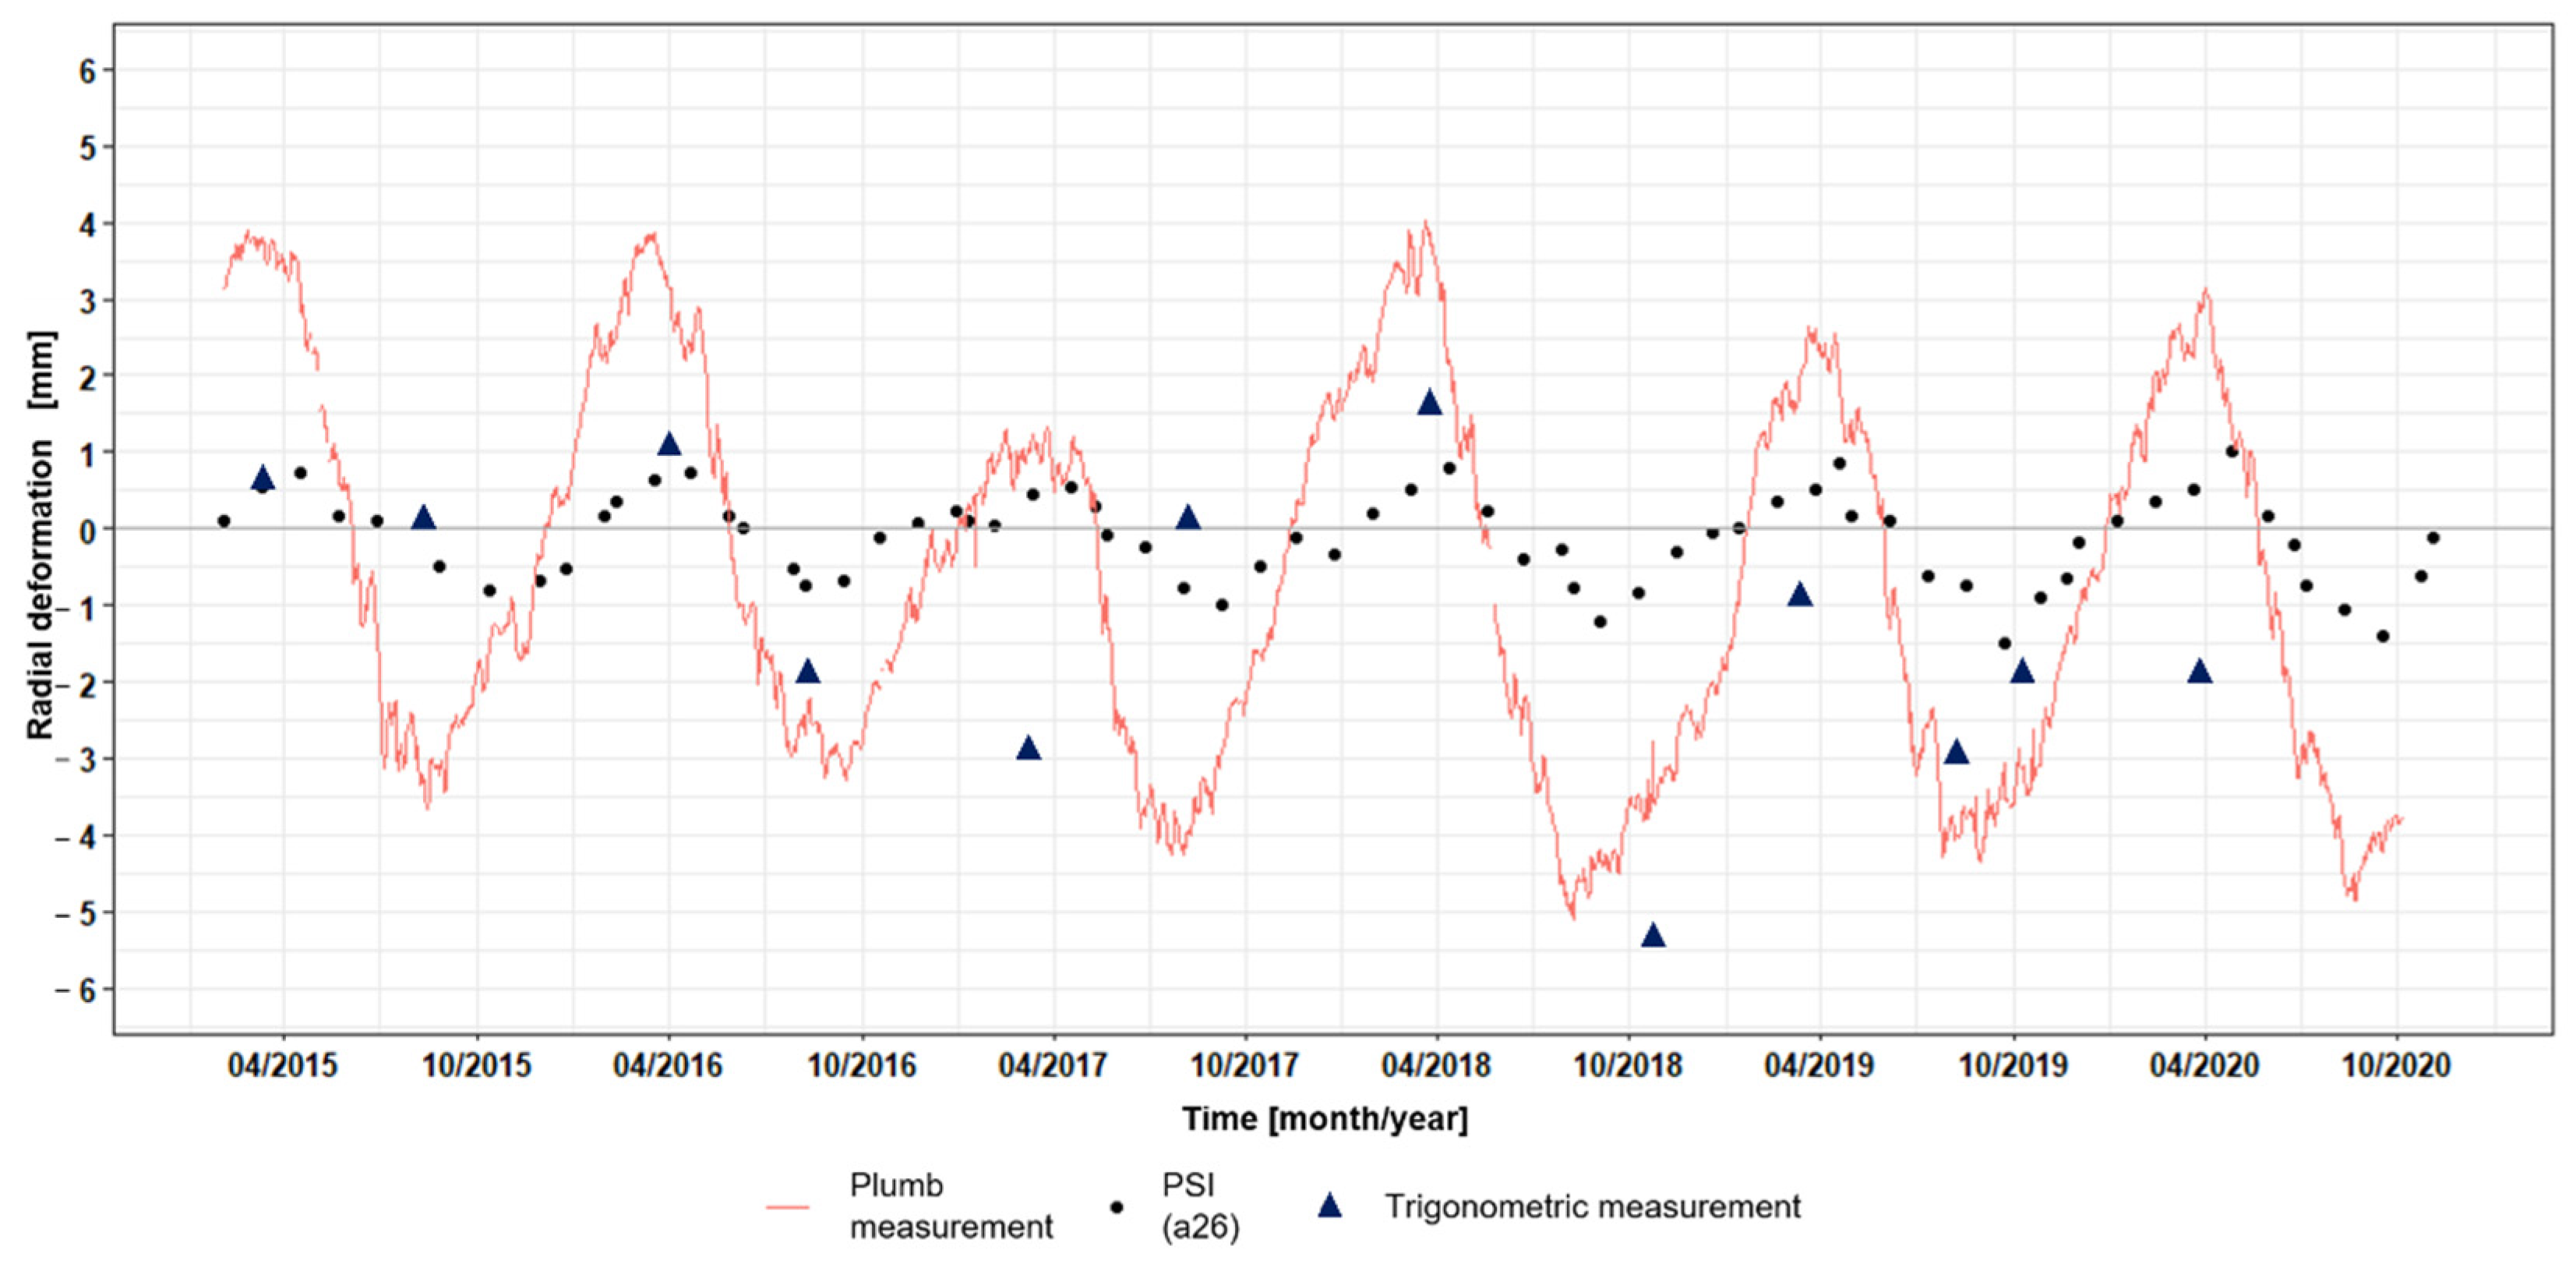
3.2. Deformation Patterns and Estimation of Radial Deformations
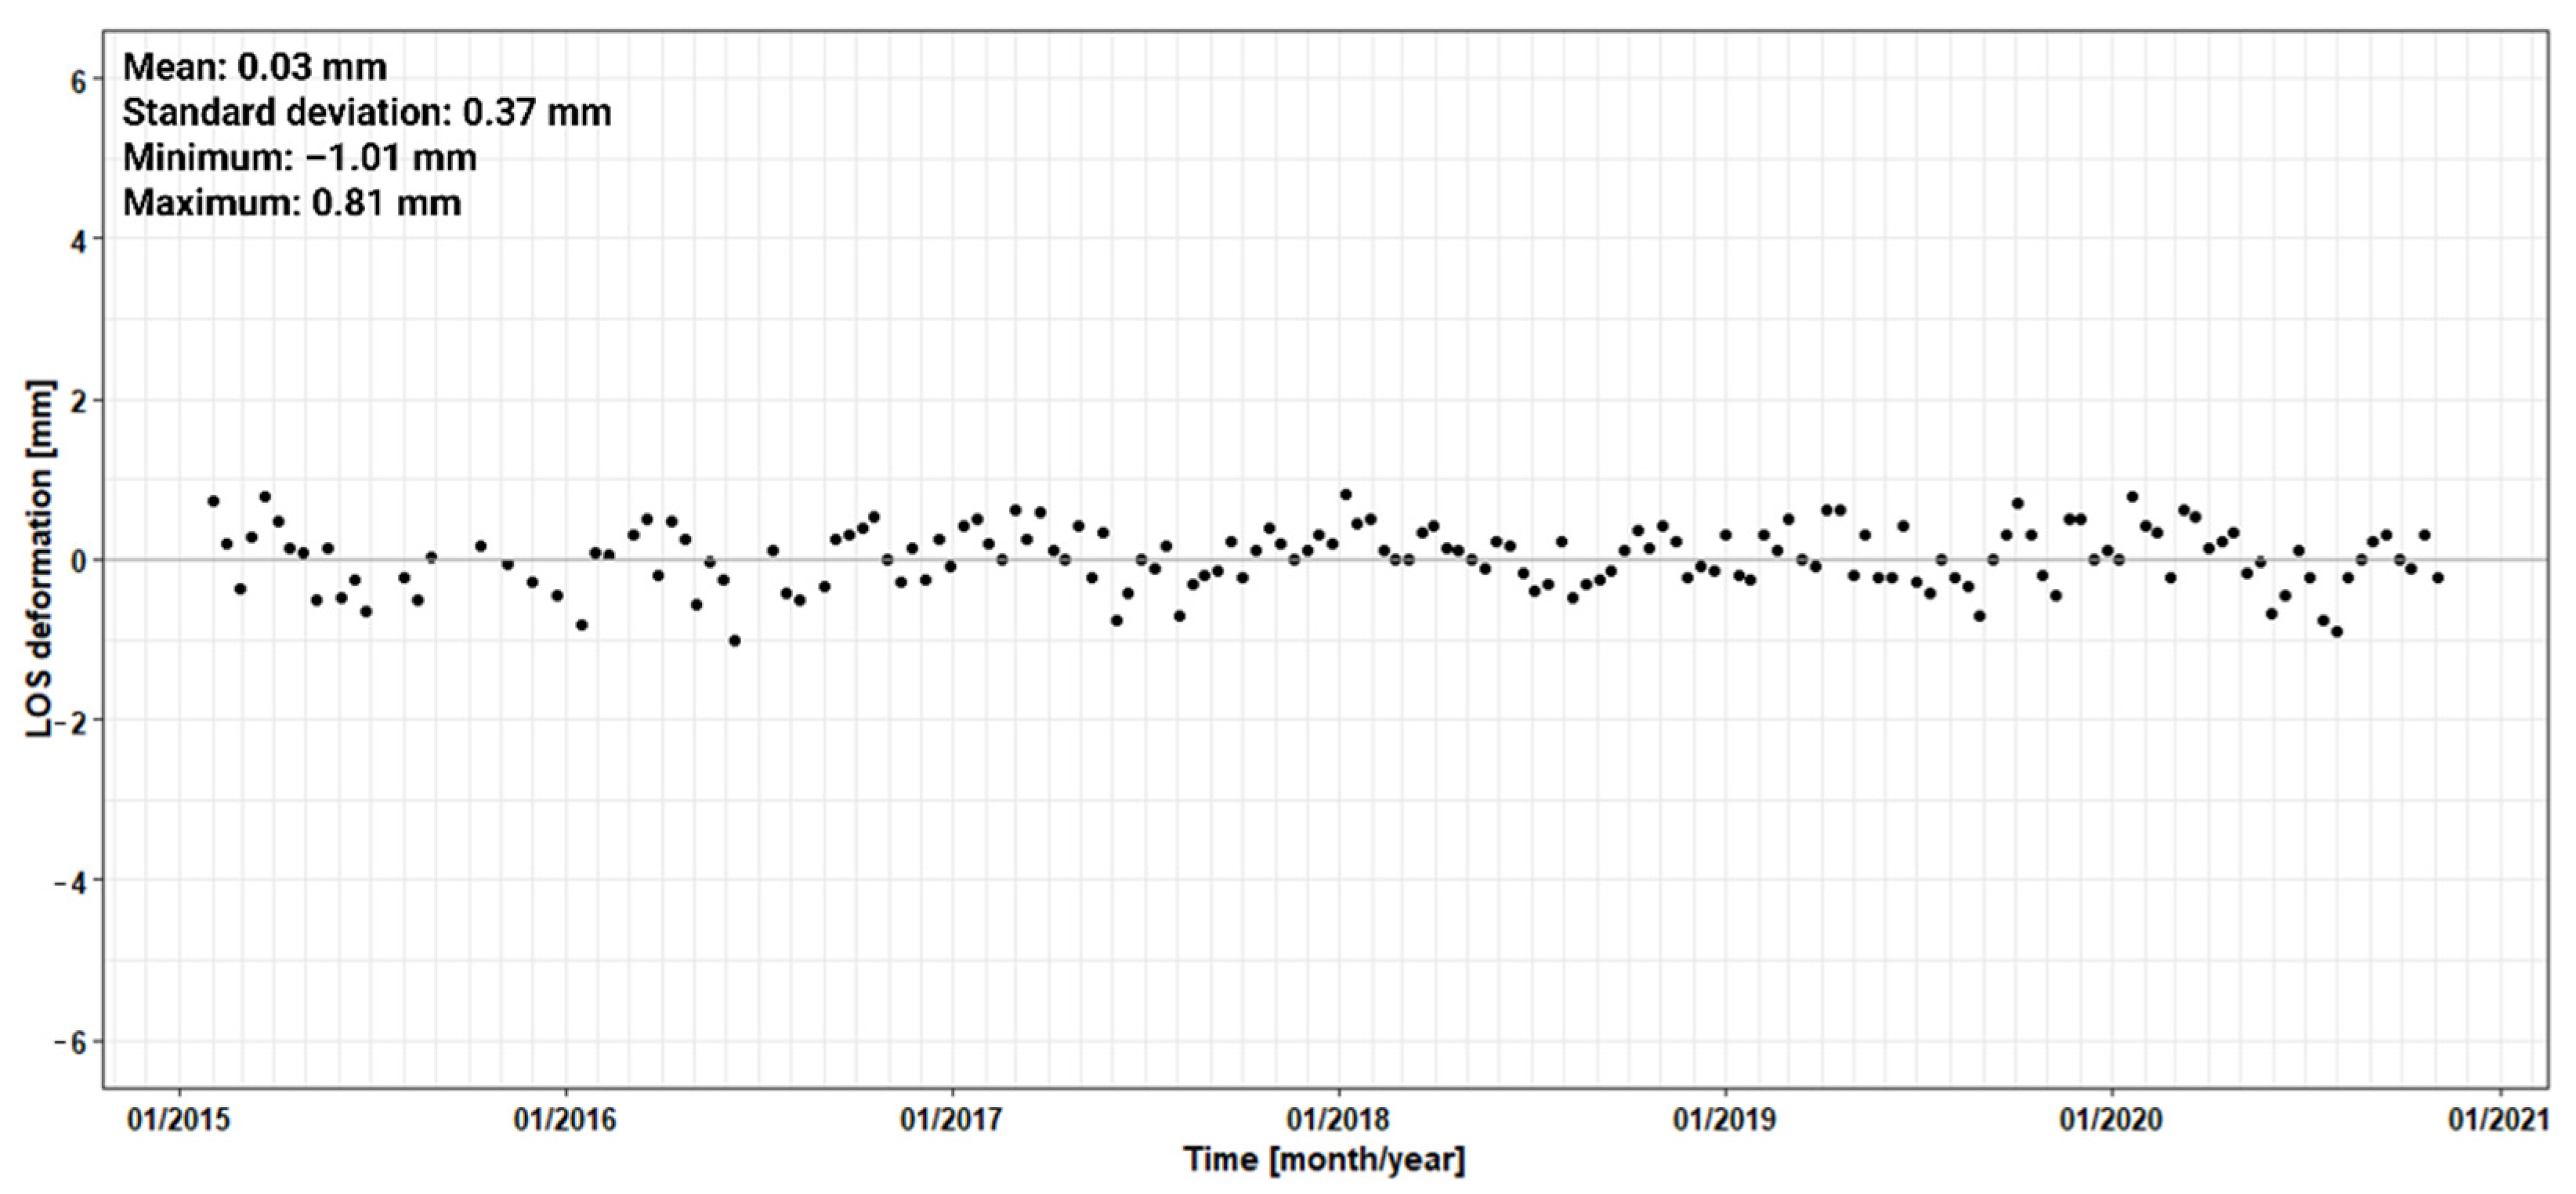
3.3. Accuracy Analysis
4. Discussion
5. Conclusions
Author Contributions
Funding
Data Availability Statement
Conflicts of Interest
References
- Ruhrverband. Bauweise & Funktionsweise von Talsperren. Available online: https://www.ruhrverband.de/fluesse-seen/talsperren/bau-funktionsweise/ (accessed on 10 January 2022).
- Ruhrverband. Technische Angaben: Möhnetalsperre. Available online: https://www.ruhrverband.de/fluesse-seen/talsperren/moehnetalsperre/technische-angaben/ (accessed on 10 January 2022).
- Gebler, T. Statistische Auswertung von Simulierten Talsperrenüberwachungsdaten zur Identifikation von Schadensprozessen an Gewichtsstaumauern. Ph.D. Thesis, University of Stuttgart, Stuttgart, Germany, October 2018. Available online: https://henry.baw.de/bitstream/handle/20.500.11970/106486/262_Gebler_Tobias_Statistische%20Auswertung.pdf?sequence=1&isAllowed=y (accessed on 10 January 2022).
- Otto, H.P. Überwachungsmessungen an Talsperren. Hochschule für Technik, Wirtschaft und Kultur Leipzig (FH), Fachbereich Bauwesen, Lehrgebiet Vermessungskunde. Available online: http://webarchiv.ethz.ch/geometh-data/student/eg1/2006/06/Otto%20Leipzig-Staumauern.pdf (accessed on 10 January 2022).
- German Institute of Standardization. DIN 19700-10: 2004-07, Stauanlagen—Teil 10: Gemeinsame Festlegungen; Beuth Verlag GmbH: Berlin, Germany, 2004. [Google Scholar]
- Bettzieche, V. Mathematisch-Statistische Analyse von Messwerten der Talsperrenüberwachung. Wasserwirtschaft 2004, 94, 30–34. [Google Scholar] [CrossRef]
- Ferretti, A.; Prati, C.; Rocca, F. Permanent scatterers in SAR interferometry. IEEE Trans. Geosci. Remote Sens. 2001, 39, 8–20. [Google Scholar] [CrossRef]
- Ferretti, A.; Prati, C.; Rocca, F. Nonlinear subsidence rate estimation using permanent scatterers in differential SAR interferometry. IEEE Trans. Geosci. Remote Sens. 2000, 38, 2202–2212. [Google Scholar] [CrossRef] [Green Version]
- Emadali, L.; Motagh, M. Long-term deformation analysis of Masjed-Soleyman rockfill dam (Iran): Results based on terrestrial geodect data. Earth Obs. Geomat. Eng. 2020, 4, 26–43. [Google Scholar] [CrossRef]
- Mura, J.; Gama, F.; Paradella, W.; Negrao, P.; Carneiro, S.; de Oliveira, C.; Brandao, W. Monitoring the Vulnerability of the Dam and Dikes in Germano Iron Mining Area after the Collapse of the Tailings Dam of Fundao (Mariana-MG, Brazil) Using DInSAR Techniques with TerraSAR-X Data. Remote Sens. 2018, 10, 1507. [Google Scholar] [CrossRef] [Green Version]
- Othman, A.A.; Al-Maamar, A.F.; Al-Manmi, D.A.M.; Liesenberg, V.; Hasan, S.E.; Al-Saady, Y.I.; Shihab, A.T.; Khwedim, K. Application of DInSAR-PSI Technology for Deformation Monitoring of the Mosul Dam, Iraq. Remote Sens. 2019, 11, 2632. [Google Scholar] [CrossRef] [Green Version]
- Mazzanti, P.; Perissin, D.; Rocca, A. Structural health monitoring of dams by advanced satellite SAR interferometry: Investigation of past processes and future monitoring perspectives. In Proceedings of the 7th International Conference on Structural Health Monitoring of Intelligent Infrastructure, Torino, Italy, 1–3 July 2015. [Google Scholar]
- Lazecký, M.; Perissin, D.; Zhiying, W.; Ling, L.; Yuxiao, Q. Observing Dam’s Movements with Spaceborne SAR Interferometry. In Engineering Geology for Society and Territory; Lollino, G., Manconi, A., Guzzetti, F., Culshaw, M., Bobrowsky, P., Luino, F., Eds.; Springer: Cham, Switzerland; Heidelberg, Germany; New York, NY, USA; Dordrecht, The Netherlands; London, UK; Basel, Switzerland, 2015; Volume 5, pp. 131–136. [Google Scholar] [CrossRef]
- Lazecký, M.; Perissin, D.; Wang, Z.; Lei, L.; Qin, Y. Observing Dam’s Movements with Spaceborne SAR Interferometry: Conference Paper. Proc. Eng. Geol. Soc. Territ. 2015, 5, 131–136. [Google Scholar]
- Wang, T.; Perissin, D.; Rocca, F.; Liao, M.-S. Three Gorges Dam stability monitoring with time-series InSAR image analysis. Sci. China Earth Sci. 2011, 54, 720–732. [Google Scholar] [CrossRef]
- Ruiz-Armenteros, A.M.; Lazecky, M.; Hlaváčová, I.; Bakoň, M.; Delgado, J.M.; Sousa, J.J.; Lamas-Fernandez, F.; Marchamalo, M.; Caro-Cuenca, M.; Papco, J.; et al. Deformation monitoring of dam infrastructures via spaceborne MT-InSAR. The case of La Vinuela (Malaga, southern Spain). Procedia Comput. Sci. 2018, 138, 346–353. [Google Scholar] [CrossRef]
- Milillo, P.; Bürgmann, R.; Lundgren, P.; Salzer, J.; Perissin, D.; Fielding, E.; Biondi, F.; Milillo, G. Space Geodetic monitoring of engineered structures: The ongoing destabilization of the Mosul dam, Iraq. Sci. Rep. 2016, 6, 37408. [Google Scholar] [CrossRef] [Green Version]
- Milillo, P.; Porcu, M.C.; Lundgren, P.; Soccodato, F.; Salzer, J.; Fielding, E.; Bürgmann, R.; Milillo, G.; Perissin, D.; Biondi, F. The Ongoing Destabilization of the Mosul Dam as observed by Synthetic Aperture Radar Interferometry. In Proceedings of the IEEE International Geoscience and Remote Sensing Symposium (IGARSS), Fort Worth, TX, USA, 23–28 July 2017; pp. 6279–6282. [Google Scholar] [CrossRef] [Green Version]
- Evers, M.; Kyriou, A.; Thiele, A.; Hammer, H.; Nikolakopoulus, K.; Schulz, K. How to set up a dam monitoring system with PSInSAR and GPS. SPIE Remote Sens. 2020, 11534, 115340L. [Google Scholar] [CrossRef]
- Schneider, P.; Soergel, U. Monitoring Einer Schleuse Mittels Persistent-Scatterer-Interferometrie. 40. Wissenschaftlich-Technische Jahrestagung der DGPF in Stuttgart—Publikationen der DGPF, Band 29, 448–456. Available online: https://www.dgpf.de/src/tagung/jt2020/proceedings/proceedings/papers/64_DGPF2020_Schneider_Soergel.pdf (accessed on 10 January 2022).
- Antonielle, B.; Caporossi, P.; Mazzanti, P.; Moretto, S.; Rocca, A. InSAR & PhotomonitoringTM for Dams and Reservoir Slopes Health & Safety Monitoring. In Proceedings of the Twenty-Sixth Congress on Large Dams 2018, Commission Internationale des Grands Barrages, Vienna, Austria, 1–7 July 2018; pp. 4–6. [Google Scholar]
- Mazzanti, P.; Antonielli, B.; Sciortino, A.; Scancella, S.; Bozzano, F. Tracking Deformation Processes at the Legnica Glogow Copper District (Poland) by Satellite InSAR--II: Zelazny Most Tailings Dam. Land 2021, 10, 654. [Google Scholar] [CrossRef]
- Scaioni, M.; Marsella, M.; Crosetto, M.; Tornatore, V.; Wang, J. Geodetic and Remote-Sensing Sensors for Dam Deformation Monitoring. Sensors 2018, 18, 3682. [Google Scholar] [CrossRef] [PubMed] [Green Version]
- Bettzieche, V. Satellitenüberwachung der Verformungen von Staumauern und Staudämmen. Wasserwirtschaft 2020, 9, 48–51. [Google Scholar] [CrossRef]
- Ruhrverband. Talsperrenleitzentrale des Ruhrverbands. Möhnetalsperre. Available online: https://www.talsperrenleitzentrale-ruhr.de/online-daten/webcams/webcam_moehne/ (accessed on 23 February 2022).
- Ruhrverband. Möhnetalsperre. Sicherheitsbericht. Teil A, 2013; Unpublished security report. [Google Scholar]
- Ruhrverband. Möhnetalsperre. Vertiefte Überprüfung. Anal. Messdaten, 2018; Unpublished security report. [Google Scholar]
- Ruhrverband. Die Möhnetalsperre. Available online: https://www.ruhrverband.de/fluesse-seen/talsperren/moehnetalsperre/ (accessed on 10 January 2022).
- Cigna, F.; Bateson, L.B.; Jordan, C.J.; Dashwood, C. Simulating SAR geometric distortions and predicting Persistent Scatterer densities for ERS-1/2 and ENVISAT C-band SAR and InSAR applications: Nationwide feasibility assessment to monitor the landmass of Great Britain with SAR imagery. Remote Sens. Environ. 2014, 152, 441–446. [Google Scholar] [CrossRef] [Green Version]
- Notti, D.; Meisina, C.; Zucca, F.; Colombo, A. Models to Predict Persistent Scatterers Data Distribution and Their Capacity to Register Movement Along the Slope. Fringe 2011 Workshop, 19–23. Available online: https://earth.esa.int/eogateway/documents/20142/37627/Models_predict_persistent_scatterers_data_distribution.pdf (accessed on 10 January 2022).
- Ruhrverband. Aerial Photo and drafts of the Moehne Gravity Dam. 2020; Unpublished material. [Google Scholar]
- GDI-NW. Geodateninfrastruktur Nordrhein-Westfalen. Available online: https://www.geoportal.nrw/gdi-nw (accessed on 10 January 2022).
- Ruhrverband. Measuring Data. 2020; Unpublished dataset. [Google Scholar]
- Alba, M.; Bernardini, G.; Giussani, A.; Ricc, P.P.; Roncoroni, F.; Scaioni, M.; Valgoi, P.; Zhang, K. Measurement of Dam Deformations by Terrestrial Interferometric Techniques. Int. Arch. Photogramm. Remote Sens. Spat. Inf. Sci. 2008, 37, 133–139. [Google Scholar]
- Wegmuller, U.; Werner, C.; Wiesmann, A.; Strozzi, T.; Santoro, M.; Frei, O.; Schwank, M.; Caduff, R.; Cartus, O.; Magnard, C.; et al. Gamma; Gamma Remote Sensing: Gümlingen, Switzerland, 2021. [Google Scholar]
- Fuhrmann, T.; Garthwaite, M.C. Resolving Three-Dimensional Surface Motion with InSAR: Constraints from Multi-Geometry Data Fusion. Remote Sens. 2019, 11, 241. [Google Scholar] [CrossRef] [Green Version]
- Ansari, H.; de Zan, F.; Bamler, R. Sequential estimator: A novel approach for efficient high-precision analysis of interferometric time series. In Proceedings of the IEEE International Geoscience and Remote Sensing Symposium (IGARSS), Fort Worth, TX, USA, 23–28 July 2017; pp. 980–983. [Google Scholar] [CrossRef]
- Ansari, H.; de Zan, F.; Parizzi, A. Study of Systematic Bias in Measuring Surface Deformation With SAR Interferometry. IEEE Trans. Geosci. Remote Sens. 2021, 59, 1285–1301. [Google Scholar] [CrossRef]
- Herzog, M.A.M. Elementare Talsperrenstatik: Mit 26 Zahlenbeispielen von Ausgeführten Talpserren im Vergleich zum Gemessenen Verhalten; Werner Verlag: Düsseldorf, Germany, 1998; ISBN 3804120709. [Google Scholar]
- Adam, N.; Gonzalez, F.R.; Parizzi, A.; Brcic, R. Wide area Persistent Scatterer Interferometry: Current developments, algorithms and examples. In Proceedings of the IEEE International Geoscience and Remote Sensing Symposium (IGARSS), Melbourne, VIC, Australia, 27 January 2014; pp. 1857–1860. [Google Scholar] [CrossRef]
- Yu, L.; Yang, T.; Zhao, Q.; Liu, M.; Pepe, A. The 2015–2016 Ground Displacements of the Shanghai coastal Area Inferred from a Combined COSMO-SkyMed/Sentinel-1 DInSAR Analysis. Remote Sens. 2017, 9, 1194. [Google Scholar] [CrossRef] [Green Version]
- Crosetto, M.; Monserrat, O.; Cuevas-González, M.; Devanthéry, N.; Crippa, B. Persistent Scatterer Interferometry: A review. ISPRS J. Photogramm. Remote Sens. 2016, 115, 78–89. [Google Scholar] [CrossRef] [Green Version]
- Salepci, N. Multi-Sensor Synergy for Persistent Scatterer Interferometry Based Ground Subsidence Monitoring. Ph.D. Thesis, Friedrich Schiller University Jena, Jena, Germany, 2014. [Google Scholar]
- Vassileva, M.; Giulio Tonolo, F.; Riccardi, P.; Lecci, D.; Boccardo, P.; Chiesa, G. Satellite SAR interferometric techniques in support to emergency mapping. Eur. J. Remote Sens. 2017, 50, 464–477. [Google Scholar] [CrossRef] [Green Version]
- Ferretti, A.; Monti-Guarnieri, A.; Prait, C.; Rocca, F. InSAR Principles: Guidelines for SAR Interferometry Processing and Interpretation; ESA Publications: Noordwijk, The Netherlands, 2007. [Google Scholar]
- Bechor, N.B.D.; Zebker, H.A. Measuring two-dimensional movements using a single InSAR pair. Geophys. Res. Lett. 2006, 33, 1355. [Google Scholar] [CrossRef] [Green Version]
- Aslan, G.; Foumelis, M.; Raucoules, D.; de Michele, M.; Bernardie, S.; Cakir, Z. Landslide Mapping and Monitoring Using Persistent Scatterer Interferometry (PSI) Technique in the French Alps. Remote Sens. 2020, 12, 1305. [Google Scholar] [CrossRef] [Green Version]
- Mora, O.; Ordoqui, P.; Iglesias, R.; Blanco, P. Earthquake Rapid Mapping Using Ascending and Descending Sentinel-1 TOPSAR Interferograms. Procedia Comput. Sci. 2016, 100, 1135–1140. [Google Scholar] [CrossRef] [Green Version]
- Hu, J.; Li, Z.W.; Ding, X.L.; Zhu, J.J.; Zhang, L.; Sun, Q. Resolving three-dimensional surface displacements from InSAR measurements: A review. Earth-Sci. Rev. 2014, 133, 1–17. [Google Scholar] [CrossRef]


| Observation Period | Track/Frame | Data Stack | Scenes | θ (°) |
|---|---|---|---|---|
| February 2015–November 2020 | 15/164 | t1 | 38 | 39.4 |
| February 2015–November 2020 | 15/164 | t2 | 67 | 39.4 |
| February 2015–November 2020 | 15/164 | t3 | 164 | 39.4 |
| Measurement | Measuring Points | Measuring Interval | Accuracy |
|---|---|---|---|
| Plumb | 1 | daily | +/−0.5 mm |
| Trigonometry | 27 | every 6 months | +/−3 mm |
| Measurement | Measuring Points | Measuring Interval | Measuring Unit |
|---|---|---|---|
| Precipitation | 1 | daily | mm |
| Air temperature | 1 | daily | °C |
| Water level | 1 | daily | m |
| PS Point | Data Stack | RMSE [mm] | r2 |
|---|---|---|---|
| a2 | t1 | 1.16 | 0.89 |
| a3 | t1 | 1.09 | 0.91 |
| a4 | t1 | 1.20 | 0.88 |
| a5 | t1 | 1.14 | 0.91 |
| a6 | t1 | 1.32 | 0.89 |
| a8 | t1 | 1.38 | 0.92 |
| a15 | t2 | 1.25 | 0.88 |
| a21 | t3 | 1.44 | 0.86 |
| a24 | t2 | 1.32 | 0.88 |
| a25 | t2 | 1.38 | 0.87 |
| a27 | t2 | 1.25 | 0.88 |
| a29 | t3 | 1.19 | 0.90 |
| Point | RMSE (PSI–Plumb) | RMSE (PSI–Trig.) | r2 (PSI–Plumb) | r2 (PSI–Trig.) |
|---|---|---|---|---|
| a3 (t1) | 1.21 mm | 2.70 mm | 0.88 | 0.58 |
| a17 (t2) | 1.20 mm | 2.93 mm | 0.91 | 0.77 |
| a18 (t3) | 1.09 mm | 2.76 mm | 0.91 | 0.62 |
Publisher’s Note: MDPI stays neutral with regard to jurisdictional claims in published maps and institutional affiliations. |
© 2022 by the authors. Licensee MDPI, Basel, Switzerland. This article is an open access article distributed under the terms and conditions of the Creative Commons Attribution (CC BY) license (https://creativecommons.org/licenses/by/4.0/).
Share and Cite
Jänichen, J.; Schmullius, C.; Baade, J.; Last, K.; Bettzieche, V.; Dubois, C. Monitoring of Radial Deformations of a Gravity Dam Using Sentinel-1 Persistent Scatterer Interferometry. Remote Sens. 2022, 14, 1112. https://doi.org/10.3390/rs14051112
Jänichen J, Schmullius C, Baade J, Last K, Bettzieche V, Dubois C. Monitoring of Radial Deformations of a Gravity Dam Using Sentinel-1 Persistent Scatterer Interferometry. Remote Sensing. 2022; 14(5):1112. https://doi.org/10.3390/rs14051112
Chicago/Turabian StyleJänichen, Jannik, Christiane Schmullius, Jussi Baade, Katja Last, Volker Bettzieche, and Clémence Dubois. 2022. "Monitoring of Radial Deformations of a Gravity Dam Using Sentinel-1 Persistent Scatterer Interferometry" Remote Sensing 14, no. 5: 1112. https://doi.org/10.3390/rs14051112
APA StyleJänichen, J., Schmullius, C., Baade, J., Last, K., Bettzieche, V., & Dubois, C. (2022). Monitoring of Radial Deformations of a Gravity Dam Using Sentinel-1 Persistent Scatterer Interferometry. Remote Sensing, 14(5), 1112. https://doi.org/10.3390/rs14051112