


Abstract
Global land-cover products play an important role in assisting the understanding of climate-related changes and the assessment of progress in the implementation of international initiatives for the mitigation of, and adaption to, climate change. However, concerns over the accuracies of land-cover products remain, due to the issue of validation data uncertainty. The volunteer-based Degree Confluence Project (DCP) was created in 1996, and it has been used to provide useful ground-reference information. This study aims to investigate the impact of DCP-based validation data uncertainty and the thematic issues on map accuracies. We built a reference dataset based on the DCP-interpreted dataset and applied a comparison for three existing global land-cover maps and DCP dataset-based probability maps under different classification schemes. The results of the obtained confusion matrices indicate that the uncertainty, including the number of classes and the confusion in mosaic classes, leads to a decrease in map accuracy. This paper proposes an informative classification scheme that uses a matrix structure of unaggregated land-cover and land-use classes, and has the potential to assist in the land-cover interpretation and validation processes. The findings of this study can potentially serve as a guide to select reference data and choose/define appropriate classification schemes.
1. Introduction
The increased occurrence of natural disasters and extreme weather patterns in recent decades has directed global attention toward climate-related changes. Climate change has caused damages to various aspects of both natural ecosystems and human society in terms of ecological, economic, and social systems at multiple spatiotemporal scales [1]. To mitigate the current damage caused by climate change and adapt to its consequences in the future, it is increasingly important to maintain a precise understanding of climate change and disseminate proper and efficient climate change information [1,2]. Observing global land cover plays an important role in assessing the impacts of changes on the environment, as well as the progress of the implementation of international actions (such as UNFCCC and Kyoto Protocol) related to the mitigation of, and adaption to, climate change [3,4]. Only a few decades ago, global land-cover observation and mapping used to be constrained by the coarse spatiotemporal resolution of remote sensing images. However, the rapid development of remote sensing technologies, computer hardware and software, and networks has upgraded land-cover observation and mapping into a new era of Land Cover 2.0 [5]. This has enabled “free and open access data, analysis-ready data, high-performance computing, and rapidly developing data processing and analysis capabilities that will result in a proliferation of land cover products supporting extensive use in scientific research” [5]. Nevertheless, when it comes to global land-cover maps, the main concern is map accuracy, which reveals the extent to which the map can truly reflect the actual land cover/land-use changes that have occurred. Map accuracy is often measured by conducting a map accuracy assessment, which is an important part of a rigorous land cover map-based analysis [6]. The accuracy assessment result is significantly affected by the quality of the reference ground as the process of assessment is to compare reference data with the mapping results [7,8,9,10]. Field surveys are needed to collect ground reference samples, but the traditional geographical method of collection lacks corroborating evidence, and it is highly labor-intensive, expensive, and time-consuming to conduct a statistically meaningful survey of ground conditions [6,11,12]. Therefore, for global/continental-scale maps or for remote and inaccessible locations where the ground reference data are difficult to be collected via field surveys, visual interpretation of remotely sensed images is often conducted [12,13,14,15,16]. However, due to the restrictions of remote sensing technology, most global land-cover maps present extensive coverage at the cost of resolution and tend to poorly represent small landscape features and minor land-cover classes [17,18]. The poor representation of, or failure to represent, the actual ground condition affects the accuracy of validation data. Therefore, a quantitatively and qualitatively adequate, compatible, and up-to-date validation database is crucial for assuring validation data-quality and facilitating the accuracy assessment and comparison [4,8,19,20].
With the significant innovations made in geospatial technologies and web 2.0 applications [21], the generation of global reference databases has become possible. Such a database is not only generated by scientific institutions or governmental agencies, but also comes from citizens and communities or non-specialist users [22,23,24]. Volunteered Geographical Information (hereafter VGI [25] is an example of a user-generated database. The geospatial information within VGI is collected and shared voluntarily online by citizens [26]. VGI has been perceived as highly valuable as it increases the exchange of geographic information and offers an option for ground reference data collection to support map validation [19,24,27,28]. The Degrees of Confluence Project (DCP) is an example of a free, open-access, web-based citizen science project (http://www.confluence.org/). The project platform provides geo-tagged photographs and geospatial information at intersections of integer degrees of latitude and longitude globally [29]. For each of the visited confluences, photographs taken in four directions of the confluences, together with a description of the view observed, as well as the geospatial information, are shared online. The volunteered data (in the forms of geo-coordinates, images, and plain text of sample unit description) can serve as land-cover reference data, which allows users to obtain the required knowledge of study areas on a global scale or that are location-specific to support their mapping or validating work [29,30,31].
Despite the fast-paced worldwide development of VGI data, there are still concerns regarding the potential uncertainties of its quality [8,25,32]. Studies on the obstacles and challenges triggered using VGI-based reference data have received growing attention recently. However, most of these studies have focused on map-based types (featuring objects constructed with polygons, lines, and points) of VGI platforms (such as OpenStreetMap, Wikimapia, and Google Map Maker®) and discussed the issues surrounding their quality assessment, such as positional accuracy, thematic accuracy, completeness, temporal quality, logical consistency, and usability [6,33,34,35,36]. In addition, there are limited studies on geo-tagged photographs (images) and verbal description (text)-based platform types, such as DCP for land-cover validation. Iwao et al. [30] used DCP-derived information to validate a newly developed land-cover map, and proved that DCP-derived information is one of the best available land-cover validation datasets that provide quantitative geospatial field information. Kinoshita et al. [31] proposed a method of using DCP-based ground truth data to integrate the existing global land cover maps into a new map, and found improved accuracy with this new integrated map. However, the study revealed disagreement between the cropland and grassland classes. The land cover classes tend to be confused with land use classes in many existing classification schemes. It is essential to distinguish land cover and land use types. Thus, the information that can be derived from each and the accurate land transforming information can be captured. Moreover, the existing classification schemes differ, due to the unique purpose of specific applications and the satellite data resolution, which hindered the comparison of different land cover datasets [7]. The conversion of classification schemes can cause classification accuracies reduction as translating the classes from one legend to another is usually inevitable. Therefore, a classification scheme could void interpretation confusion between land-cover and land-use categories and be compatible with general and specific mapping/validating requirements.
Based on the flow-work proposed by Iwao et al. [30] and Kinoshita et al. [31], we built a validation dataset using 1701 samples interpreted from the DCP dataset, and further extended our purposes to (1) evaluate the uncertainty of using DCP as validation data and its impact on map accuracy assessment and (2) detect the uncertainty of thematic issues of using DCP-based validation data. For this purpose, we created an unaggregated land-cover and land-use classification scheme that has a hierarchy and matrix structure, to facilitate the interpretation work. The potential of using such a classification scheme for improving the interpretation and validation work will also be detected. New probability maps were integrated using both DCP reference data and the three existing major global land-cover maps, and then, a map-to-map comparison was performed to find agreements and disagreements among the classes. Accuracy assessment was also conducted, and changes were analyzed under different classification schemes.
2. Materials and Methods
2.1. Global Land-Cover Datasets
Three datasets that have been widely utilized in long-term Land Use and Land Cover (LULC) change analysis were selected for this study. The datasets used in this study (Table 1) were coarse-resolution (250 m to 1 km) satellite images, including the MODIS Land Cover Map Collection 5 [37], Global Land Cover 2005 by National Mapping Organizations [38], and GlobCover 2009 [39]. Their corresponding classification schemes are shown in Table 2.
Table 1.
Features of three land cover maps used in this study.
Table 2.
The classification schemes of three existing global land cover maps.
2.2. Matrix Legend Definition/Creation
Before deriving the validation database, a classification scheme needs to be established first. Considering the complex relationship between land use and land cover, which cannot be directly implicated via remotely sensed data [40,41,42,43,44], and the fact that most of the land-use types can be described by physical appearances, to avoid interpretation confusion between land-cover and land-use categories, a legend (Table 3) designed in a matrix structure that separately presents the land-cover and land-use categories was created. To prevent the loss of detailed information on land features, we also organized the hierarchical classification scheme in both general and sub-legends that cover most of the land types.
Table 3.
Matrix legend defined for this study.
The land-cover and land-use information on DCP-sites were recorded based on the three sub-legends separately. Google Earth® images were used to facilitate the interpretation of photographs and descriptions on the DCP platform. The classes that include mixtures of plants (woods, grassland, barren, and water body) are labeled as “mosaic area” class, which avoids most of the confusion between land use and land cover. Meanwhile, some classes of wetland are omitted/excluded because their pixels might present reflections similar to those of wet-ish woody lands/grasslands or irrigated croplands.
Following are the three sub-legends that were derived from this matrix legend to assess accuracy:
- Land Cover-I (hereafter LC-I) legend (nine land-cover types):
(A11) Grasslands, (A12) Shrubland, (A13) Tree, (A21) Grasses, shrubs and trees, (A22) Water bodies and vegetation, (A23) Barren and vegetation, (A31) Water bodies, (A32) Snow and ice, (A33) Bare area.
- Land Cover-II (hereafter LC-II) legend (23 land-cover types):
(A111) Grasses, (A112) Sparse grasses, (A121) Shrubs, (A122) Sparse shrubs, (A131) Forests, (A132) Sparse trees, (A211) Grasses and shrubs, (A212) Grasses and trees, (A213) Shrubs and trees, (A214) Grasses, shrubs and trees, (A221) Water bodies and grasses, (A222)Water bodies and shrubs, (A223) Water bodies and trees, (A231) Bare area and grasses, (A232) Bare area and shrubs, (A233) Bare area and trees, (A311) Water bodies, (A312) Water bodies and bare area, (A321) Snow and ice, (A322) Snow and ice and bare area, (A331) Exposed soils, (A332) Deserts and Sands, (A333) Bare rock a/o Coarse fragments.
- Land Use (hereafter LU) legend (six land-cover types):
(B11) Herbaceous planted/cultivated, (B21) Agricultural areas and artificial surface, (B22) Agricultural areas and no use, (B31) Urban or built-up, (B32) Non built-up, (B4) No use.
2.3. Validation Data Preparation
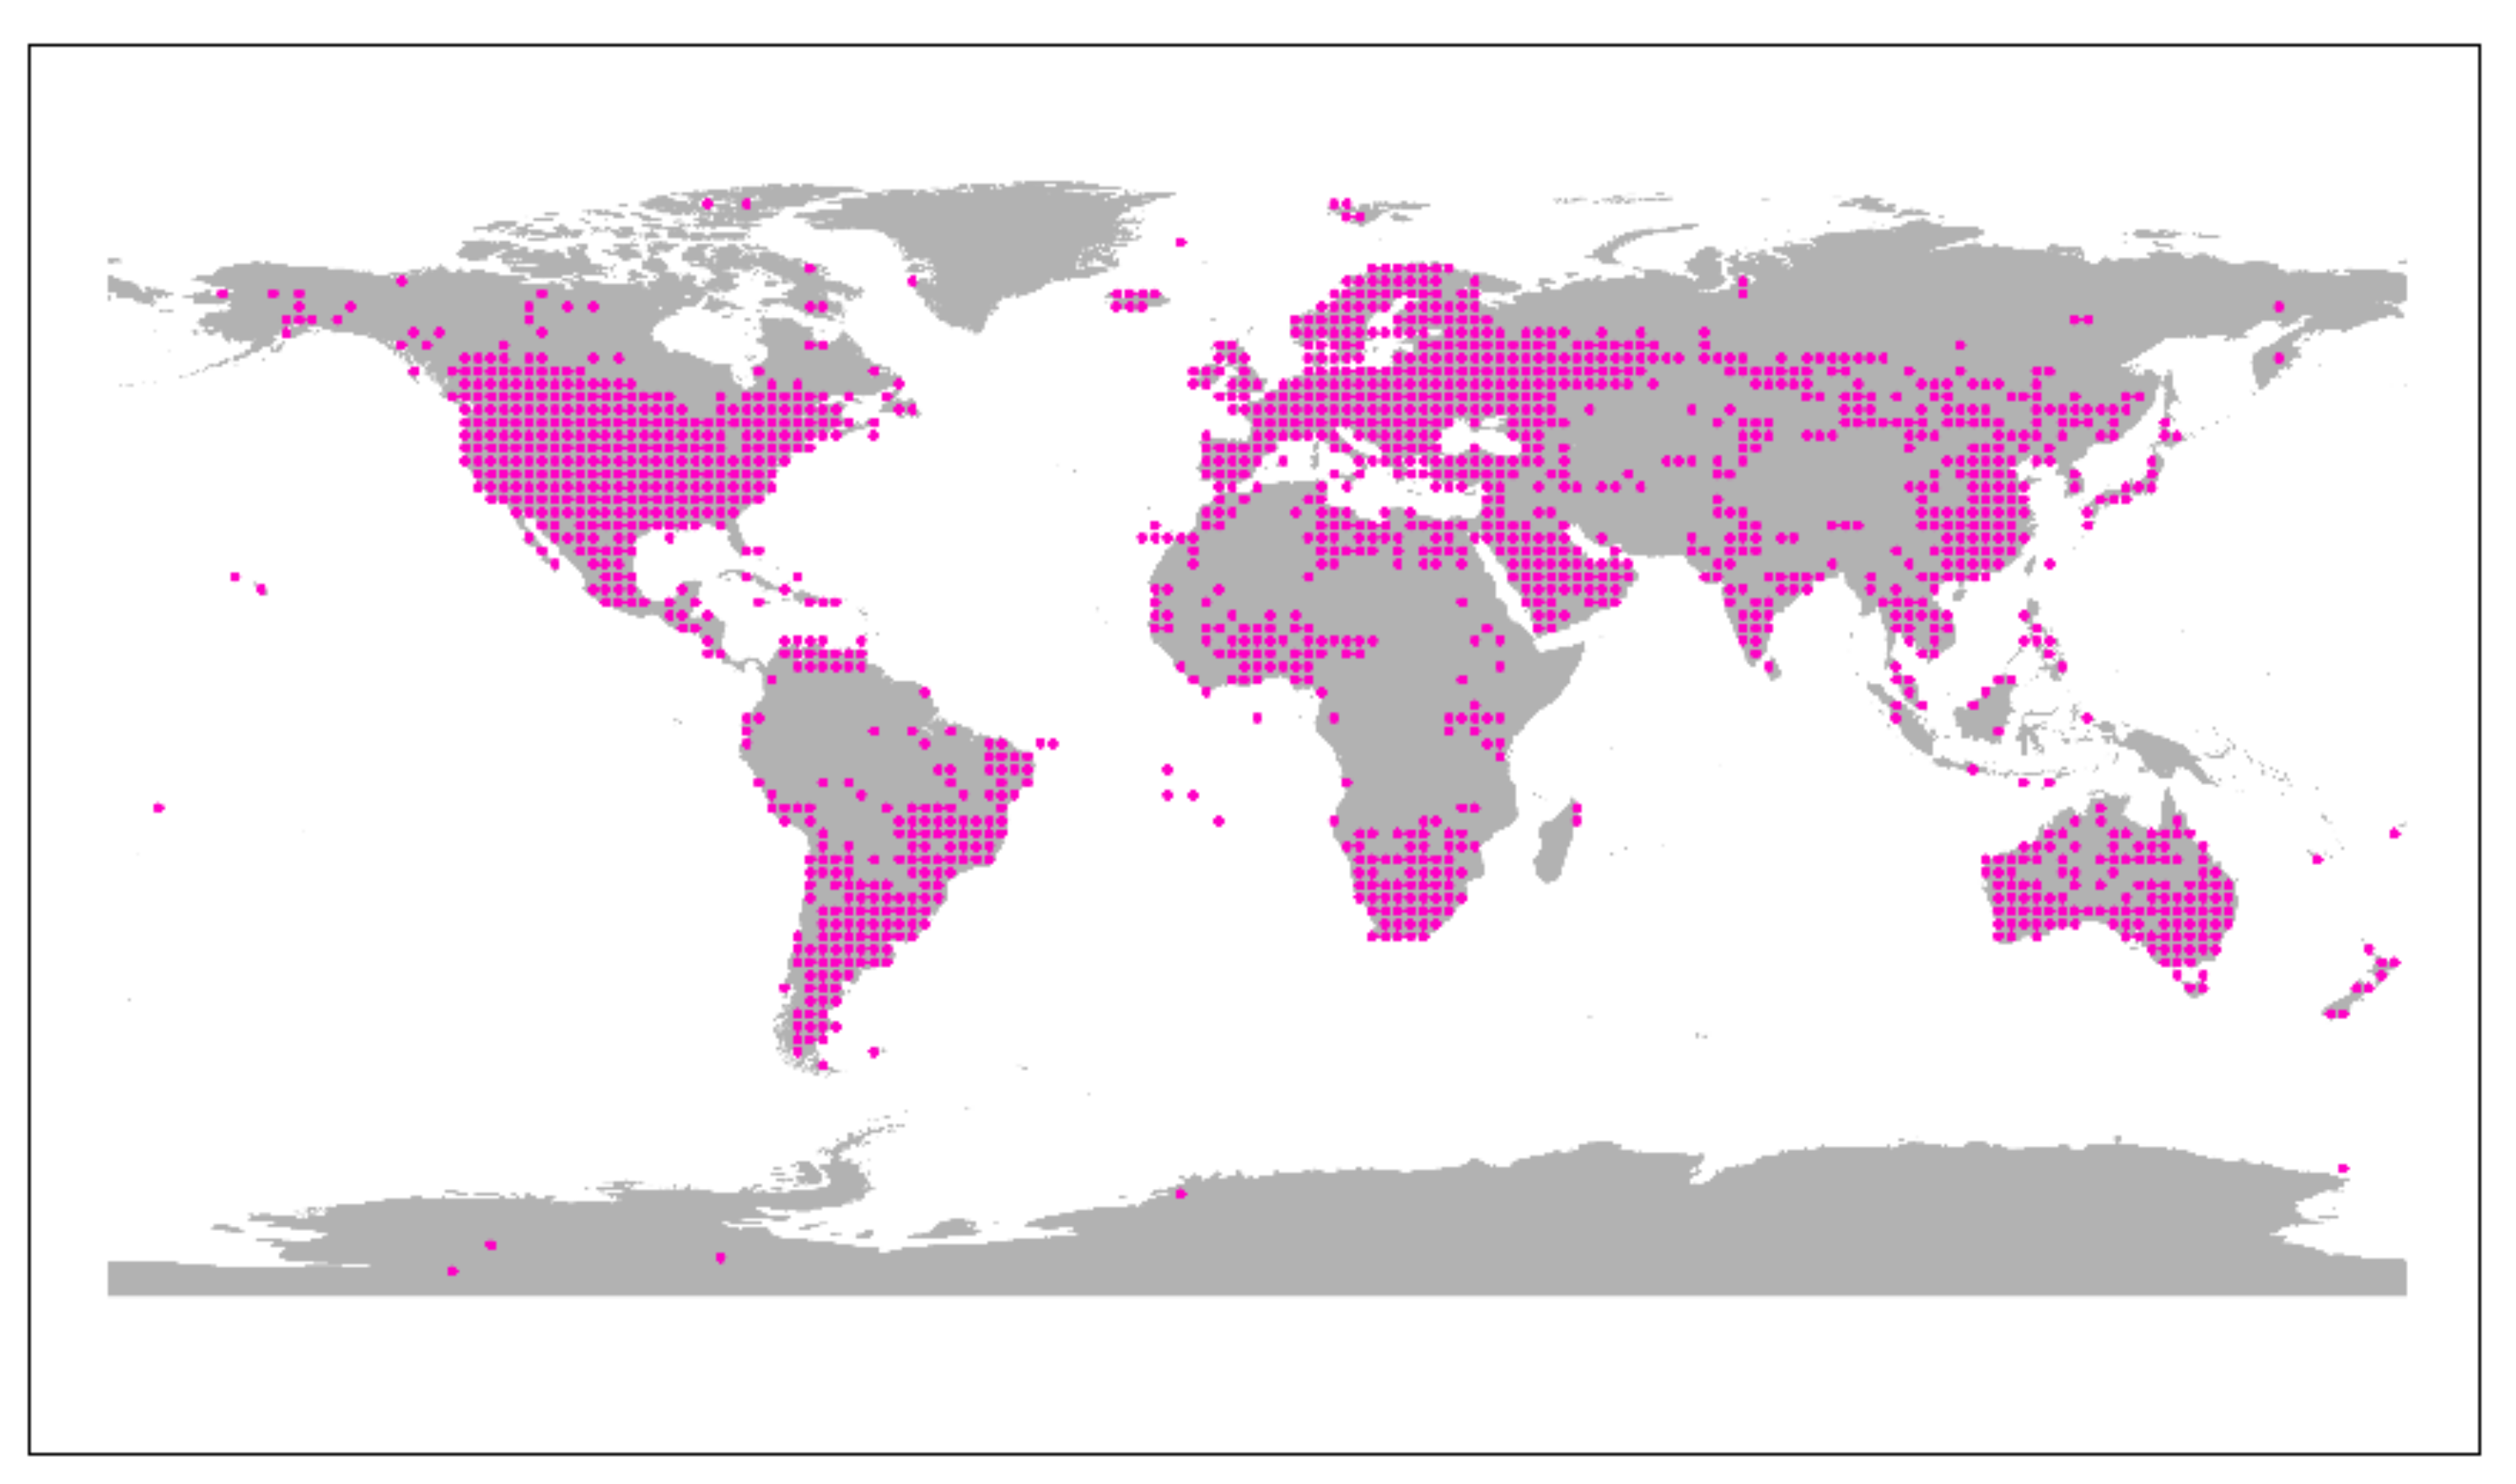
As of October 2013, when the three existing global land-cover maps were produced, for all the even integer intersection degree points, there were 3484 visits, and each site had been photographed with four directions by DCP volunteers. By excluding the second and additional records from visitors, as well as incomplete records, a remaining 1701 successful worldwide DCP points with an even number of integer degrees of latitude and longitude that reflected the characteristic land cover over the surrounding square kilometer were selected for the analysis (Figure 1).
Figure 1.
Distribution of the 1701 Degree Confluence Project (DCP)-derived reference points used in this study.
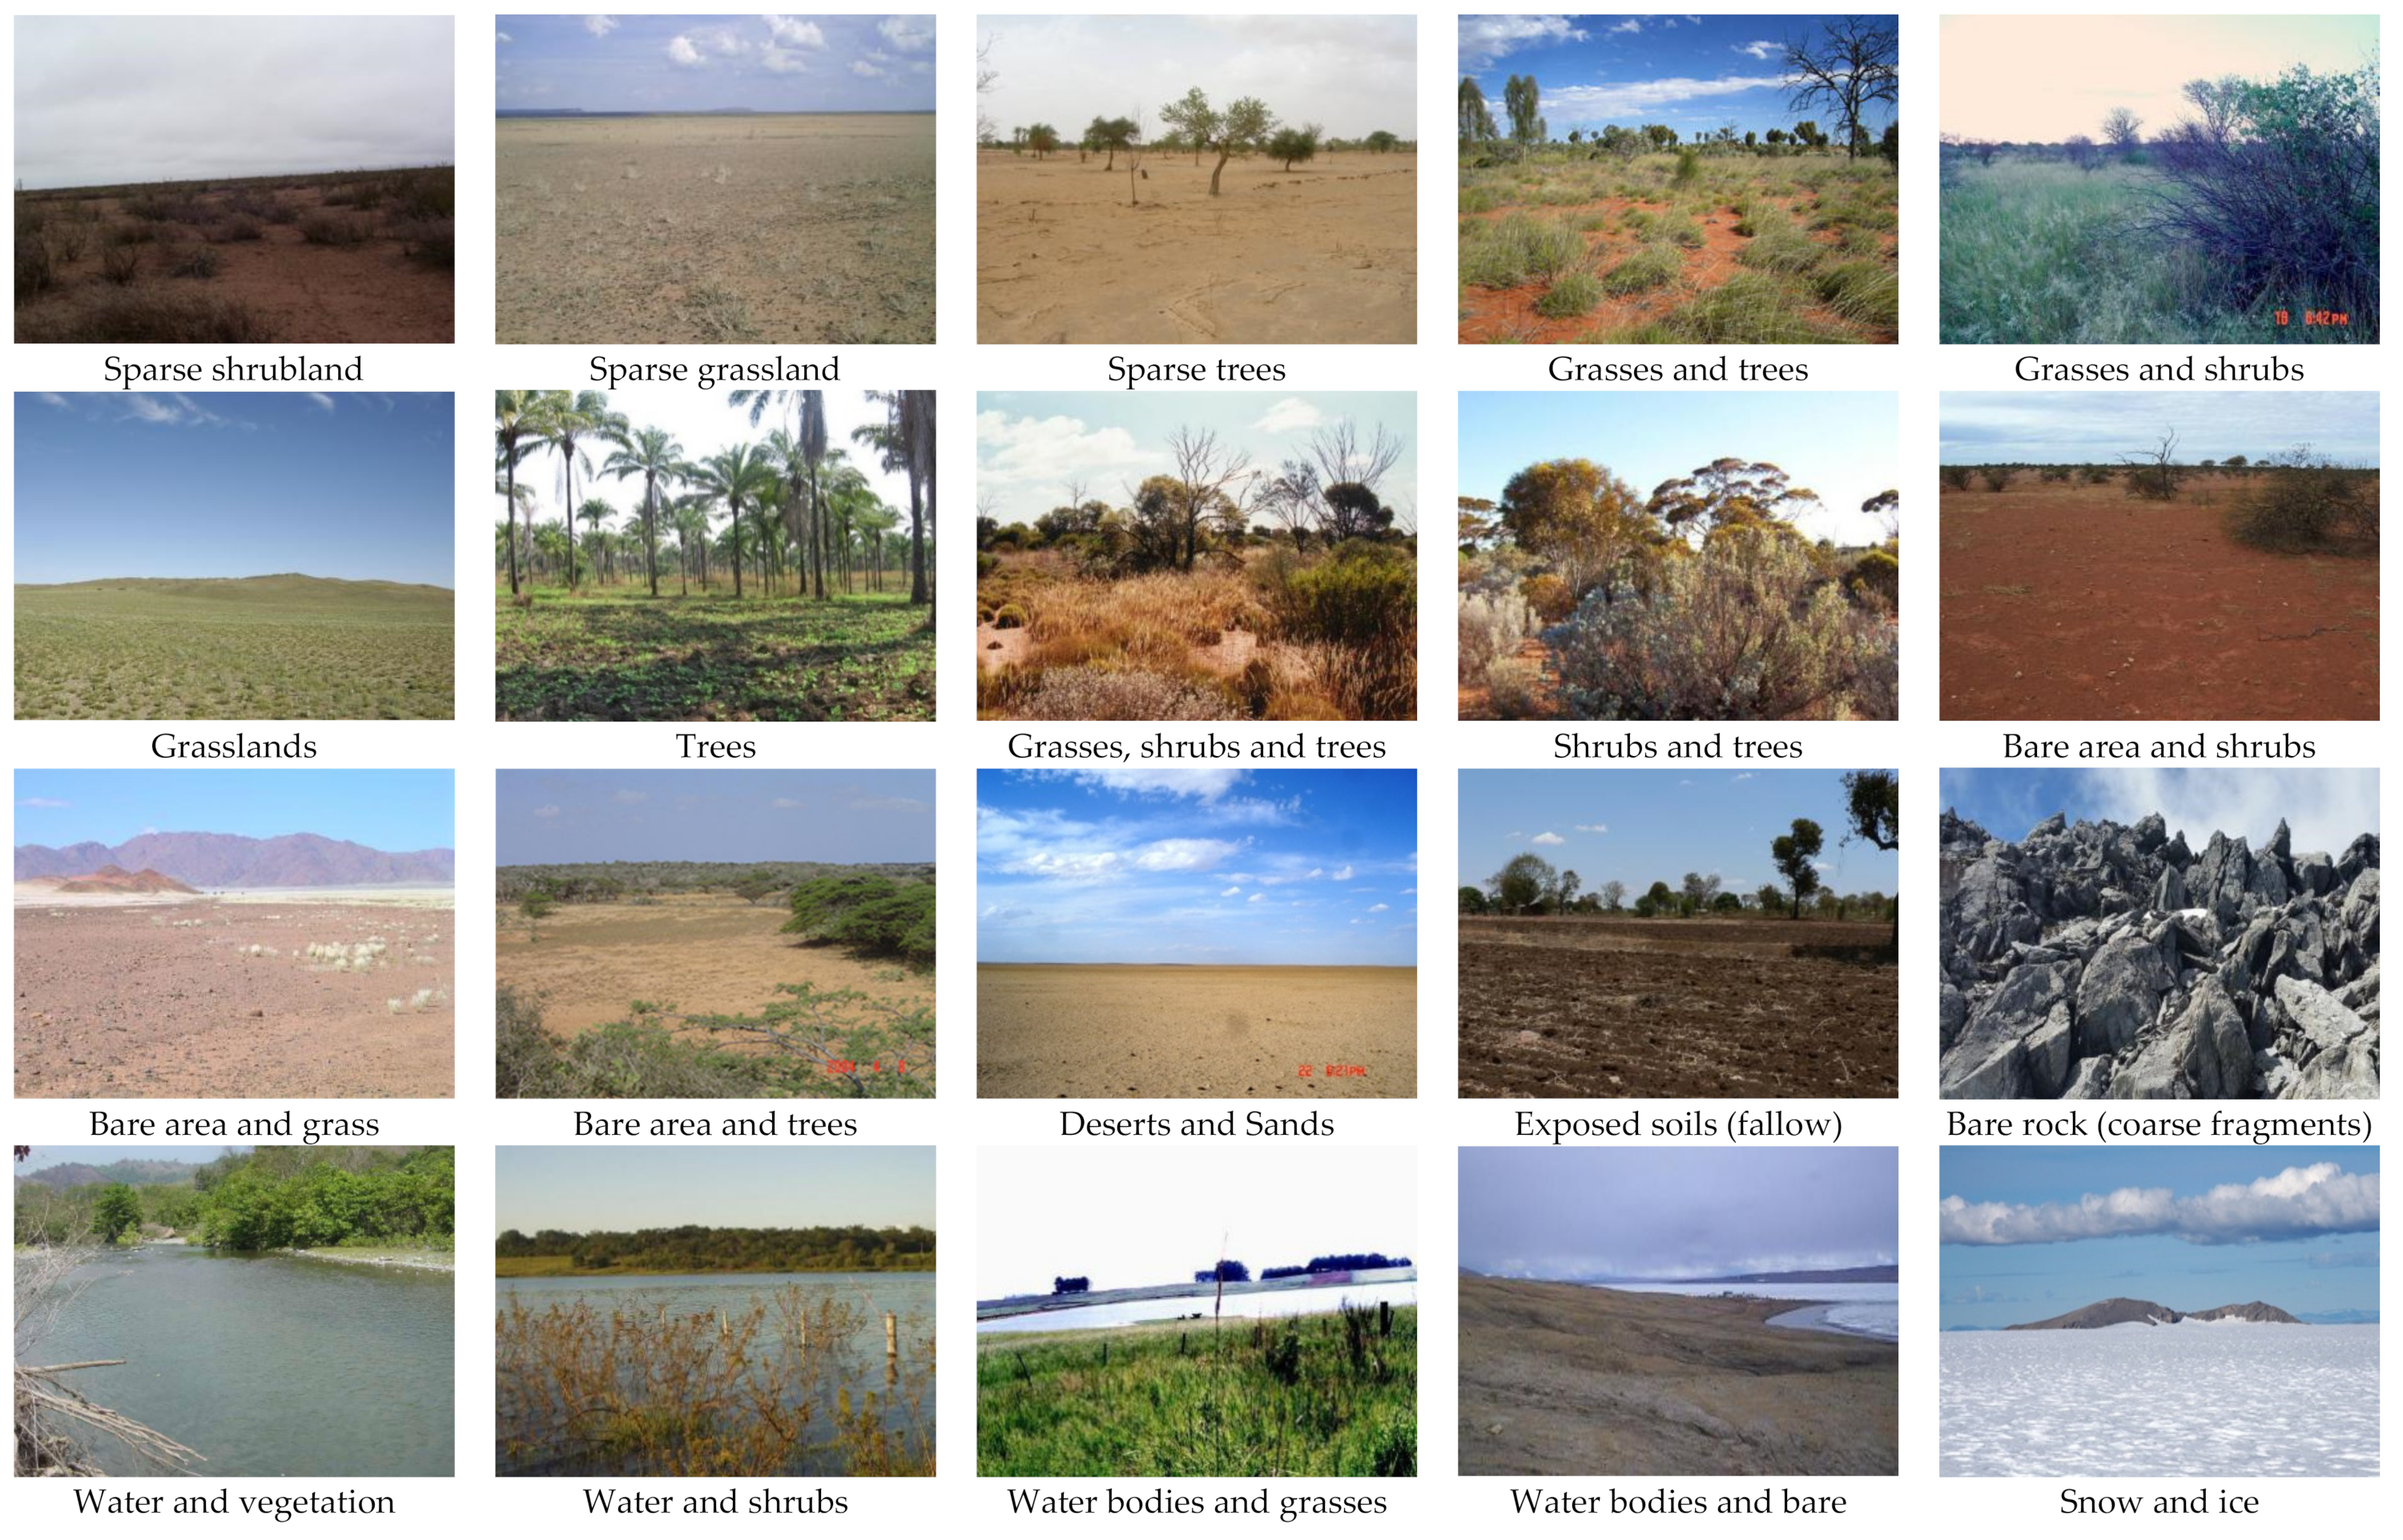
Information for each site was recorded into Microsoft Excel® according to their locations. Based on the matrix legend, all 1701 DCP points were categorized into land-cover or land-use classes based on sub-legends (LC-I legend, LC-II legend, and LU legend); that is, each point could be categorized into three different classes in Microsoft Excel®. Google Earth® images were used to assist in the classification of each sub-legend. Figure 2 shows some typical land-cover and land-use classes used in the DCP classification scheme.
Figure 2.
Some typical land-cover and land-use classes used in the DCP classification scheme (photographs are referenced from the DCP website).
Additionally, to determine the impact of uncertainty of validation data and the different classification schemes on the accuracy of land-cover maps, four additional classification schemes were created based on the LC-II classification scheme by reducing the number of classes in which some of the mosaic classes (A211, A231, A213 and A212) with uncertainty were omitted. Details of the seven classification schemes are shown in Table 4.
Table 4.
Classification schemes for accuracy assessment.
2.4. Comparison between DCP-Based Ground Truth Data and Existing Maps
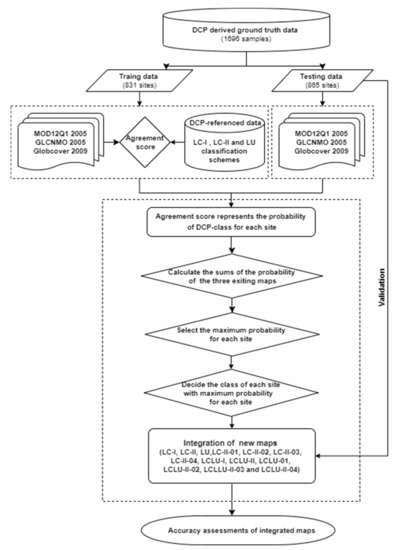
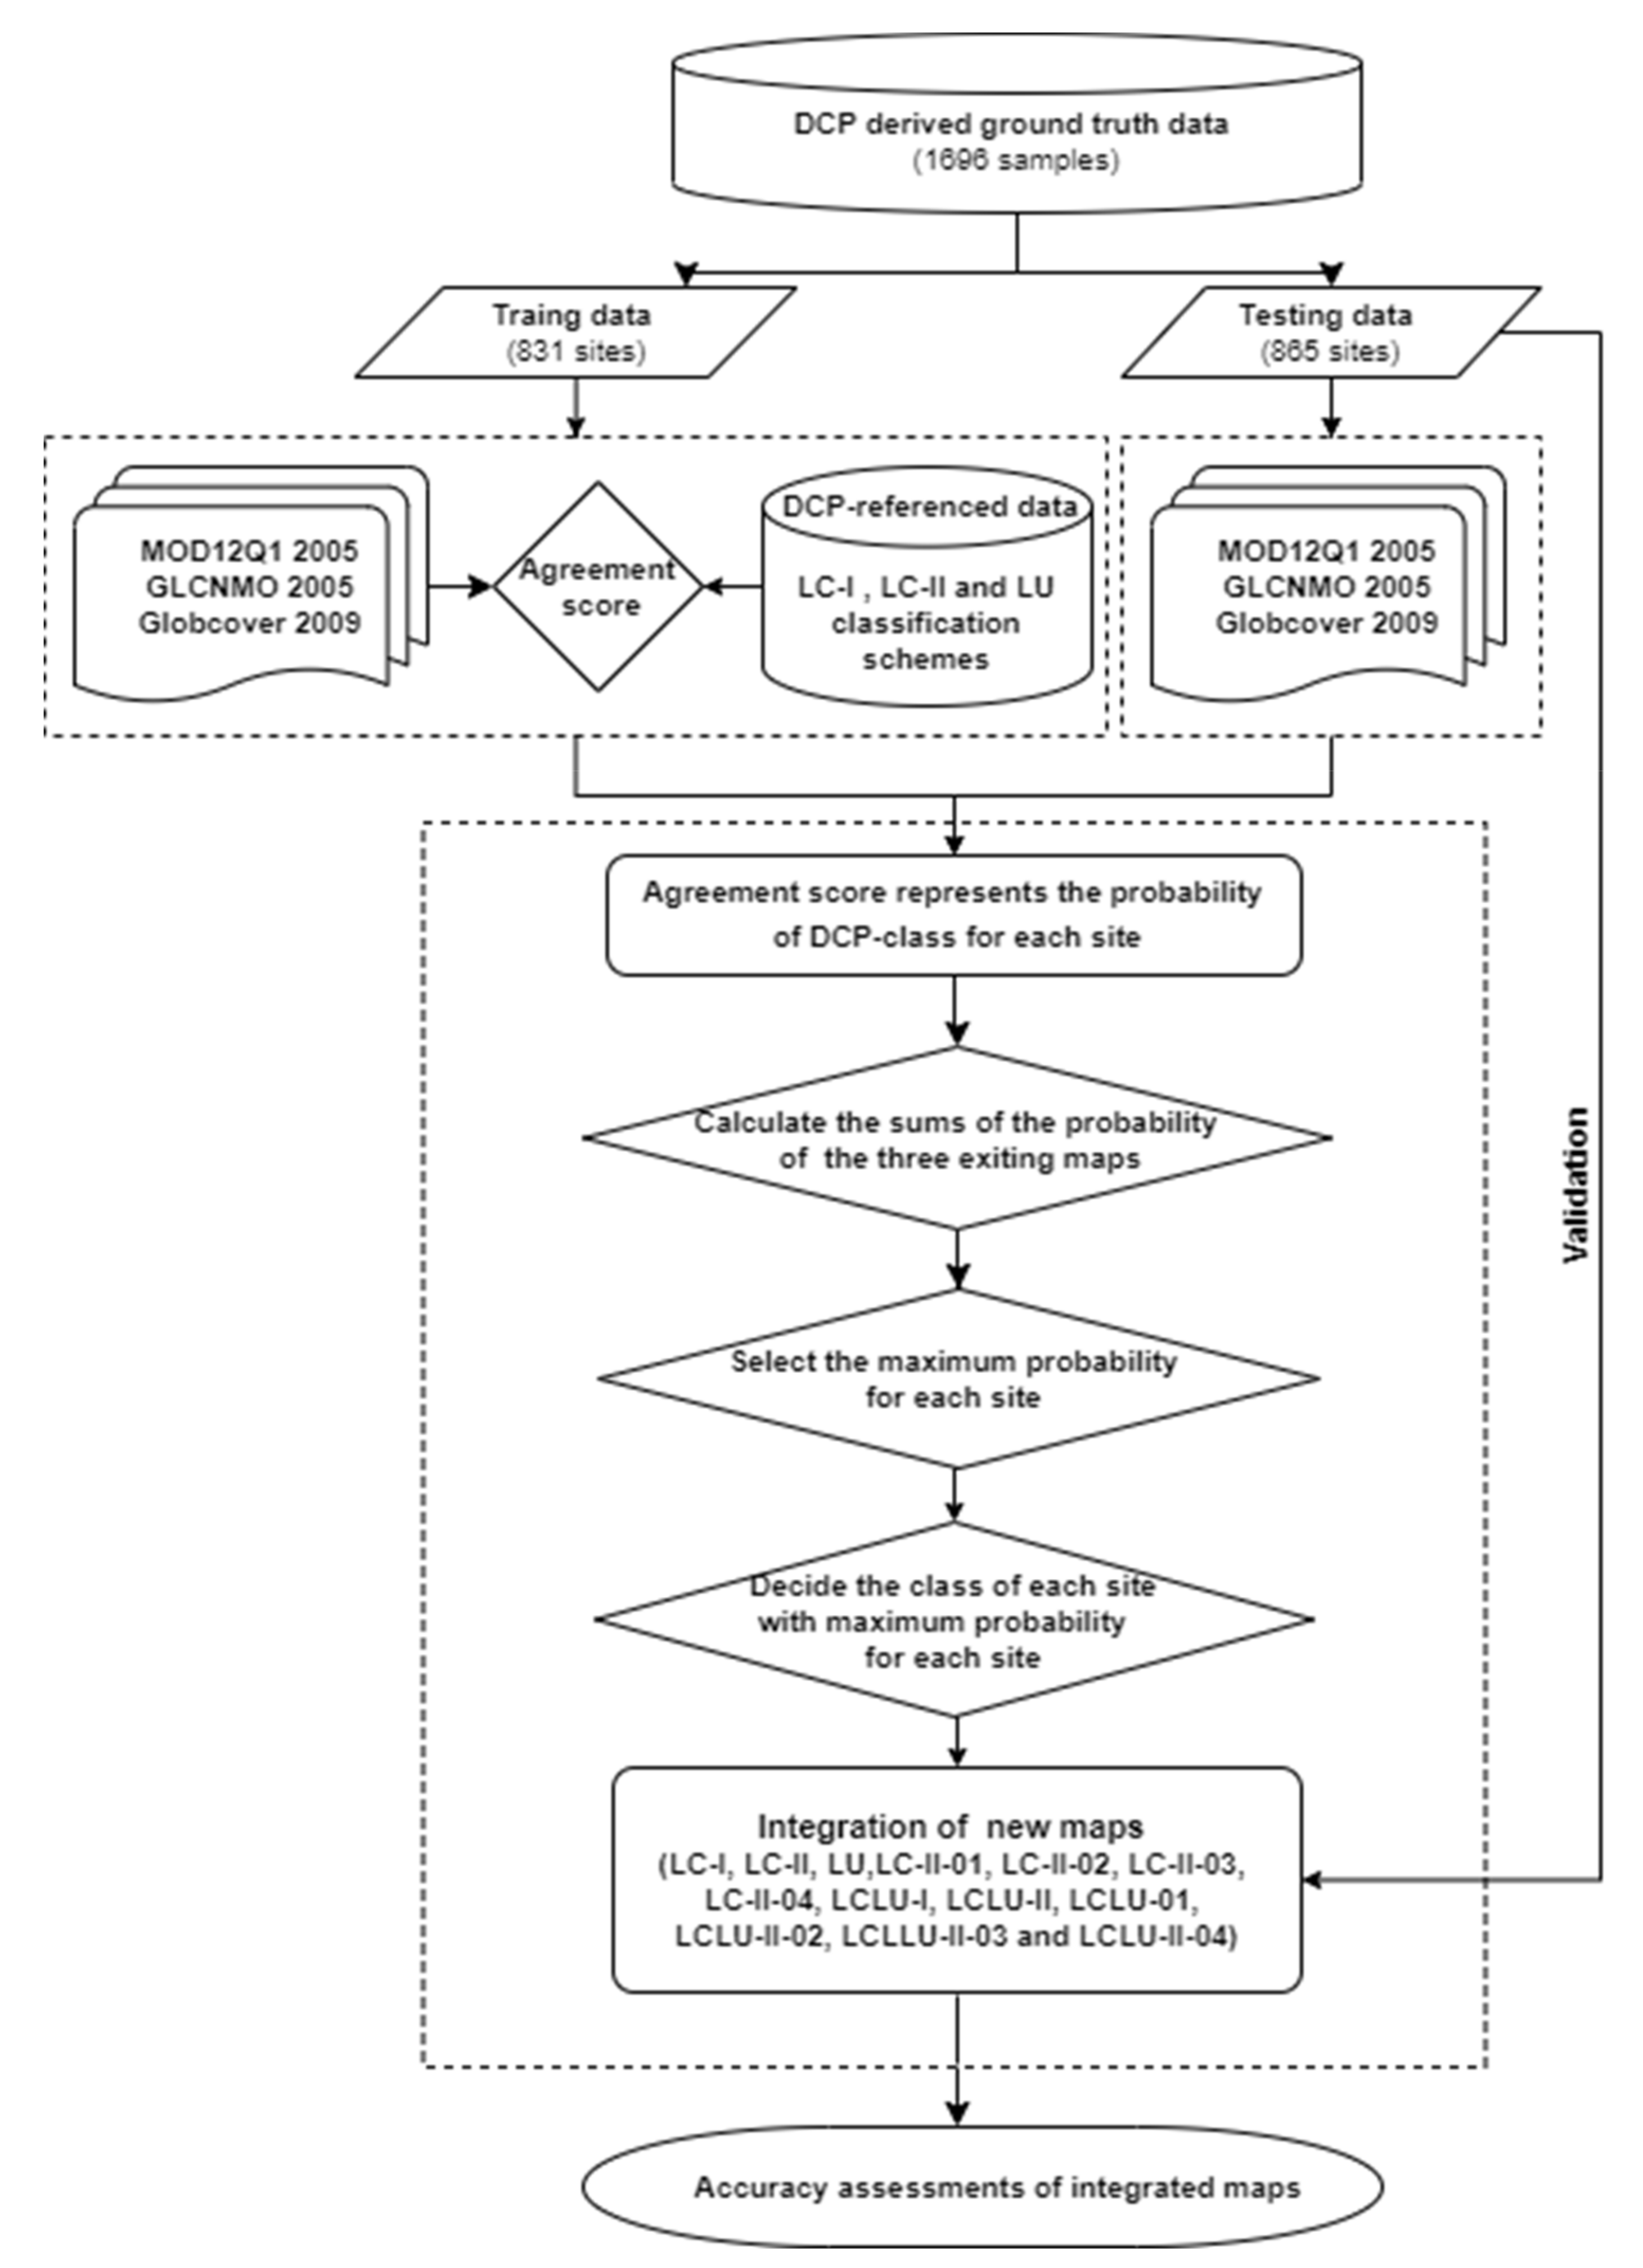
To test the levels of agreement and disagreement between the land-cover maps and DCP-based ground truth data, a DCP point-based comparison was performed. The number of DCP ground truth points that matched the three existing maps were 1701 for MOD12C5 and GlobCover 2009, and 1696 for GLNMO 2005. Among the 1696 mutual points, 831 were randomly selected as part of the training dataset, while the remaining were used for the testing dataset. First, we assessed agreement between each of the three maps and the DCP-based training data based on the classification schemes derived from the matrix legend.
The agreement numbers between classes of the existing map and the DCP-based ground truth data were counted (for example, in Appendix A Table A1, Table A2 and Table A3, the agreement numbers were 122 between Water Body class A31 of DCP-based ground truth data and Water Body class 0 of MOD12C5, 131 between A31 and GlobCover2009, and 128 between A31 and GLNMO 2005). Then, agreement rate scores were calculated using Equation (1) which dividing the counted agreement number by the total agreement number in the class of an existing land cover map. The agreement rate scores represent the probability of the occurrence of a DCP-class for a class in an existing land-cover map. The formula is defined as:
where a represents the number of agreements between the land-cover map and DCP data, M refers to the existing land-cover map, n stands for the n-th land-cover type in map M, and m stands for the m-th land-cover type in the DCP training data [31].
2.5. Integration of New Maps
We calculated the sums of agreement rate scores obtained from the three existing maps for each site (point). Thus, each site (point) will obtain several values (the number of values is corresponding to the categories of classification scheme) representing the probability of occurrence of each DCP-class. Then, a look-up table was created in Microsoft Excel® to search for the maximum sums of probabilities of occurrence for each site. Then, the land-cover type of the site was decided according to the DCP-class with the maximum value. Thus, the new land-cover maps (based on LC-I, LC-II and LU legend) will be created based on the decision of which classes are at each site. The 865 testing samples were used to validate the accuracy of the newly generated maps. A flowchart of this process is shown in Figure 3. Moreover, to assess the impact of DCP-based mosaic classes and combined form of LCLU (hereafter LCLU) classification schemes on map accuracy, ten additional maps (based on LC-II-01, LC-II-02, LC-II-03, LC-II-04, LCLU-I, LCLU-II, LCLU-01, LCLU-II-02, LCLLU-II-03 and LCLU-II-04 legend) were created and validated similarly.
Figure 3.
Flowchart of the procedure performed in this study.
3. Results
3.1. Agreement Analysis between DCP Data and Three Global Land-Cover Products
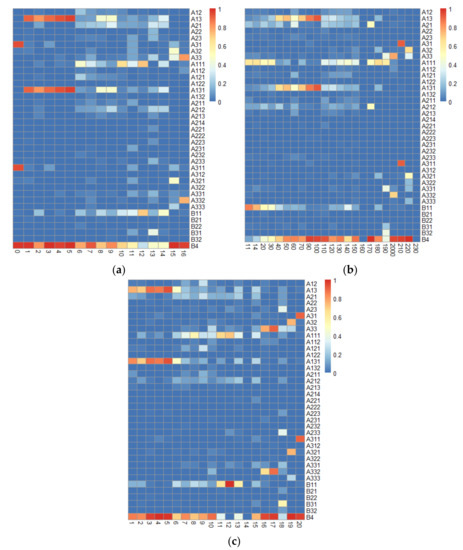
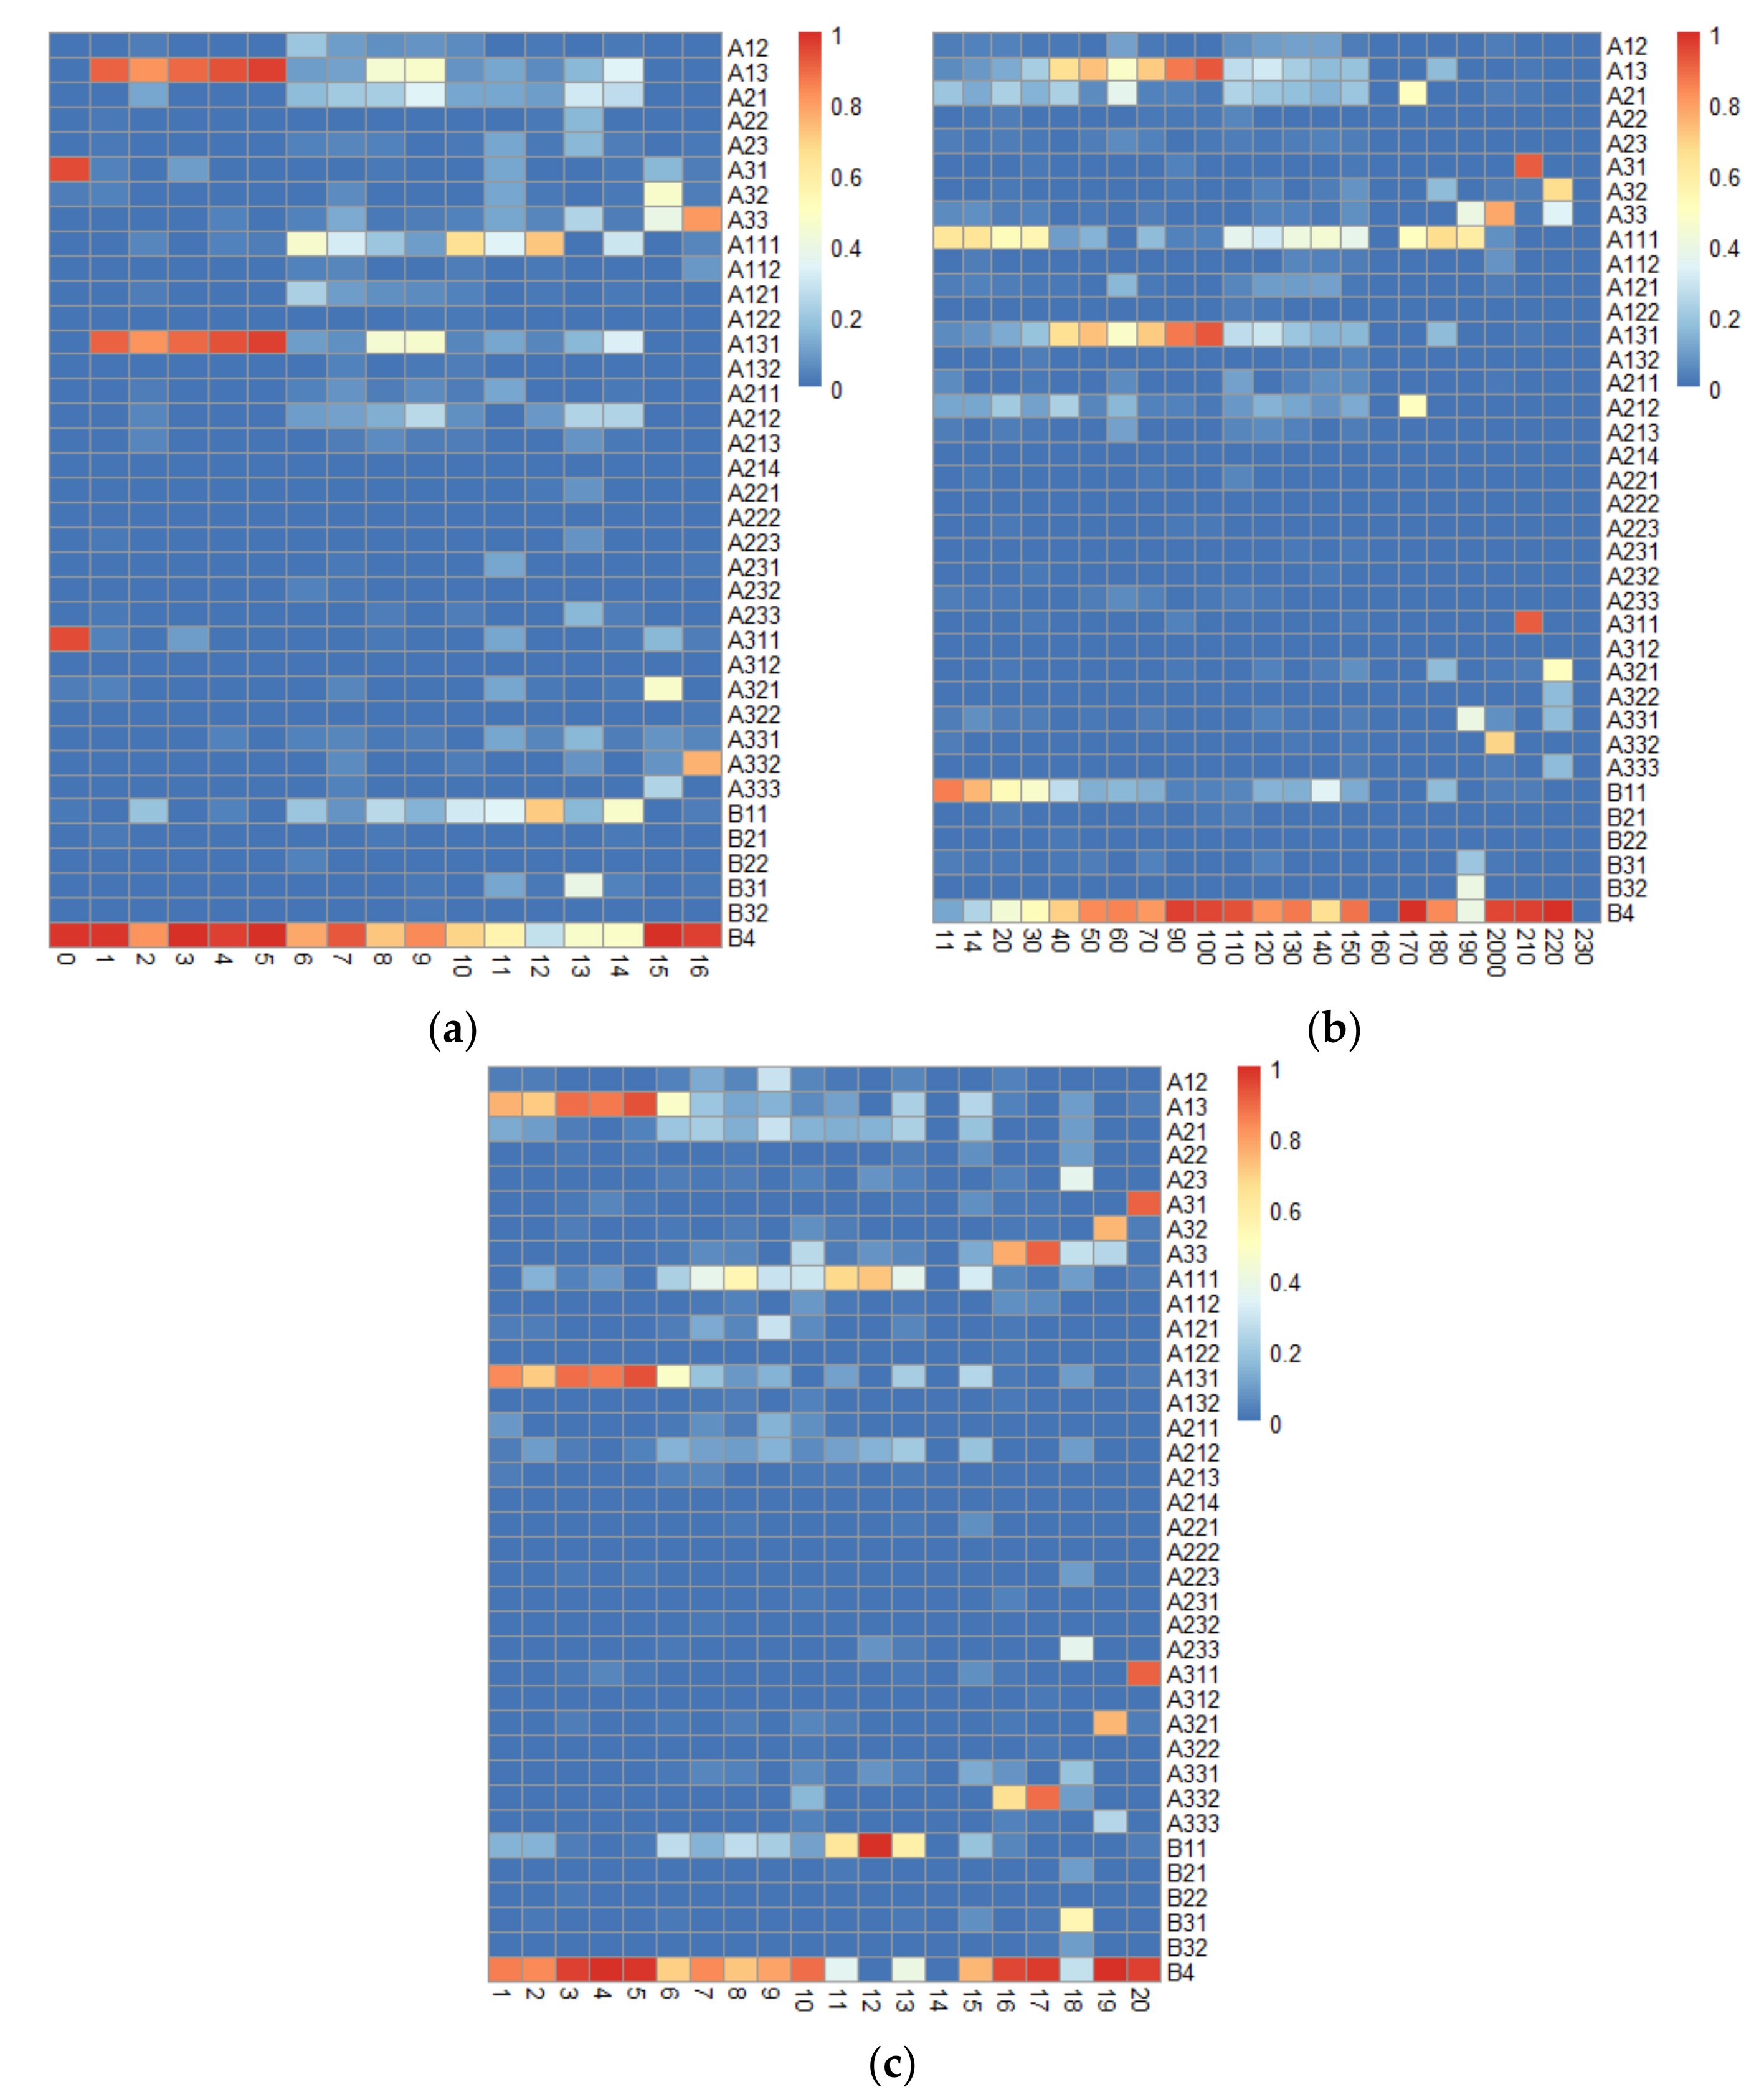
The number of samples in agreement between each of the three maps and the training data applied with different classification schemes derived from the matrix legend is listed in Appendix A. The agreement scores among classes between DCP-based ground truth data and the three existing maps were then calculated. Figure 4 presents the results regarding the agreement rates calculation. Furthermore, the probability of occurrence of a category class of DCP ground truth data obtained under a land-cover classification scheme for a class in a land-cover map was measured.
Figure 4.
The agreement rates between DCP-derived reference data and three existing maps: (a) MCD12Q1 2005, (b) GlobCover 2009, (c) GLNMO 2005. The numbers in the columns and rows represent classification schemes of the maps (row) and classification schemes of DCP-derived validation data (column).3.1.1. Forest Classes.
The tree-related classes (A13 and A131) in DCP have high agreement rates with the forest classes of the three global land-cover products. The forest-related classes having the highest agreement of the three global land-cover datasets are NOs. 1–5 of MCD12Q1 2005 (agreement rates greater than 81.8% and less than 96.7%); NOs. 40, 50, 60, 70, 90 and 100 of GlobCover 2009 (agreement rates greater than 66% and less than 92.1%); and NOs. 1–6 of GLNMO 2005 (agreement rates greater than 70.7% and less than 93.7%).
Moreover, according to the classification scheme of land use in the matrix legend, the no-use class (B4) in DCP has great agreement rates with the three forest classes of the three global land-cover products, which indicates that most of the forest sites are natural forests without utilization.
However, 44.1% and 47% of woody savanna (NO. 8) and savanna (NO. 9) sites in MCD12Q1 2005 are labeled as trees in DCP data. Additionally, 22.1% and 25% of the cropland/other vegetation mosaic (NO. 13) and wetland (NO. 15) in GLNMO 2005, as well as 26.1% and 30.9% of mosaic forest or shrubland/grassland (NO. 110) and the mosaic grassland/forest or shrubland classes (NO. 120) in GlobCover 2009, were labeled as tree classes. This is probably because these classes contain the tree cover, and it is difficult to determine the percentage of tree coverage for larger areas only using visual interpretation of DCP-recorded photographs. Moreover, ~10% of the forest-related classes in GlobCover 2009 were labeled as the herbaceous planted/cultivated class in DCP data, which indicates that these forest areas are artificial plantation farms or used as grazing land.
3.1.1. Grassland Classes
Based on the land-cover classification scheme of the matrix legend, the grassland classes of DCP data (A11 and A111) have high agreement with the grassland classes of MCD12Q1 2005 and GlobCover 2009. The agreement rates are 48.1% with closed to open grassland (NO. 140) and 40.2% with sparse vegetation (NO. 150) from GlobCover 2009. Moreover, the agreement rates with NO. 180 (closed to open (>15%) vegetation (grassland, shrubland, woody vegetation) on regularly flooded or waterlogged soil—fresh, brackish, or saline water) and NO. 190 (artificial surfaces and associated areas (urban areas > 50%)) are greater than 60%. The grassland class A11 has agreement rates of 37.9% with sparse vegetation (NO. 10) and 31.3% with wetland (NO. 15) of GLNMO 2005.
The grassland classes of both DCP data (A11 and A111) and the three global land-cover datasets presented agreement rates greater than 65% with cropland classes. The cropland-related classes for three global land-cover datasets are NO. 12 of MCD12Q1 2005; NOs. 11, 14, 20, and 30 of GlobCover 2009; and NOs. 8, 11, 12, and 13 of GLNMO 2005.
The grassland classes (A11 and A111) also show agreement with shrub-related classes (48% with closed shrubland and 36% with open shrubland in MCD12Q1 2005; 44.7% with closed to open shrubland (NO. 130) in GlobCover 2009; and 38.7% with shrub (NO. 7) and 21.4% of herbaceous with sparse tree/shrub (NO. 9)).
3.1.2. Mosaic Classes
There were common low agreement rates among the classes related to mosaic areas for both DCP and global land-cover datasets. In the map of MCD12Q1 2005, the class of cropland/natural vegetation mosaics (NO. 14) was in agreement with grasses (A111), trees (A13 and A131), grasses and trees (A212), and shrubs and trees (A21) with rates of ~23.8%–33.3%. Grass and trees (A212) of the DCP data were in agreement with woody savannas (NO. 8), savannas (NO. 9), and urban and built-up (NO. 13) of MCD12Q1 2005 with rates of more than 23%. Based on the classification scheme of land use, 47.6% of the cropland/natural vegetation mosaics in MCD12Q1 2005 were labeled as no-use land without human activities, while 47% were labeled as herbaceous planted/cultivated (B11). In the map of GlobCover 2009, the class of closed broad-leaved forest or shrubland permanently flooded saline or brackish water (NO. 170) was in relatively high agreement with a rate of 50% with grassland (A11) and grasses, shrubs, and trees (A21) for the LC-I scheme, while 50% with (A111) and (A211) for the LC-II scheme. The agreement rates between the mosaic classes (NOs. 110 and 120) of GlobCover 2009 and grassland classes (A11 and A111) were ~30%. They were also in low agreement with most of the mosaic classes (A211, A212, A213, A214, A221, A222, A223, A231, A232 and A233) of the DCP data. Based on the classification scheme of land use, more than 81% of mosaic classes (NOs. 110 and 120) in GlobCover 2009 were labeled as no-use classes. In the map of GLNMO 2005, the class of cropland/other vegetation mosaic (NO. 13) was in agreement with grassland (A11), trees (A13), grasses, shrubs, and trees (A21), and grasses and trees (A212). The wetland (NO. 15) was in agreement with grasses and trees (A212) with rates of 8.8%, 57.5%, and 39.8%, which were labeled as herbaceous planted/cultivated (B11) and no-use class (B4).
3.1.3. Urban and Built-Up Classes
Based on the classification scheme of land use, there is a high total agreement rate between the urban and artificial area and associated areas (B3) and the DCP data in MCD12Q1 2005. The results showed that 38.5% of urban and built-up (NO. 13) was in agreement with the urban or built-up class (B31) and 46.2% of urban and built-up (NO. 13) was labeled as no use (B4). For the map of GLNMO 2005, its urban class (NO. 18) and urban or built-up class (B31) have an agreement rate of 54.5%. There was little confusion between urban classes (NO. 13 in MODIS Collection 5 2005 and NO. 190 in GlobCover 2009) with the barren and vegetation-related classes (A23, A231, A232 and A233) except for the urban class (NO. 18) in GLNMO 2005, with an agreement rate of 36.4%. This is mainly because there is vegetation (grasses/shrubs/trees) growing inside the urban area, which is labeled as bare area, and that in the LC-II legend of the DCP data. For the map of GlobCover 2009, the agreement rate between artificial area and associated areas (NO. 190) and bare area (A33) was 80%, of which 40% was labeled as non-built-up (B32), and another 40% was labeled as no use (B4). This is probably due to the non-built-up class containing open mines, quarries, waste disposal, and reservoirs. This can also be attributed to the fact that vegetated urban areas are included in the urban class in GLNMO 2005.
3.1.4. Bare Area Classes
Bare area (A33) and its relative specific classes (A331, A332 and A333) in the land-cover legend correspond to barren class (NO. 16) in MCD12Q1 2005, NO. 200 in GlobCover 2009, and NOs. 16 and 17 in GLNMO 2005. The agreement rates of bare area for both DCP data (A33) and global land-cover maps were greater than 76% and reached 90.4% for NO. 17 in GLNMO 2005. The relatively high agreement rate of 80.6% also occurred between DCP data and GlobCover 2009. Based on the classification scheme of land use, 96.5% of barren in MCD12Q1 2005 and 95.5% of barren in GlobCover 2009 were under no human activities. Based on the classification scheme of LC-II, the agreement rates between the DCP data and the bare classes of the three maps were high, and most of them were deserts and sandy areas (A332), which indicates that most bare lands were deserts and sandy areas.
3.1.5. Water-Related Classes
The water-related classes (A31 and A311) presented high agreement rates of greater than 90% for both the DCP data and global land-cover maps. The class of snow and ice (A32) also showed relatively high agreement rates (66.7% to 75%) for both DCP data and global land-cover maps. Possible explanations for this result could be that their presence in a large homogeneous pattern is easy for visual interpretation, and the reflectance signals of water bodies are easy to be distinguished via visual interpretation and satellite sensors, compared to vegetated land surface.
3.2. Assessing the Accuracy of Classification Datasets
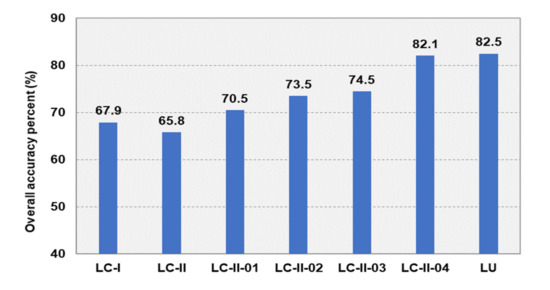
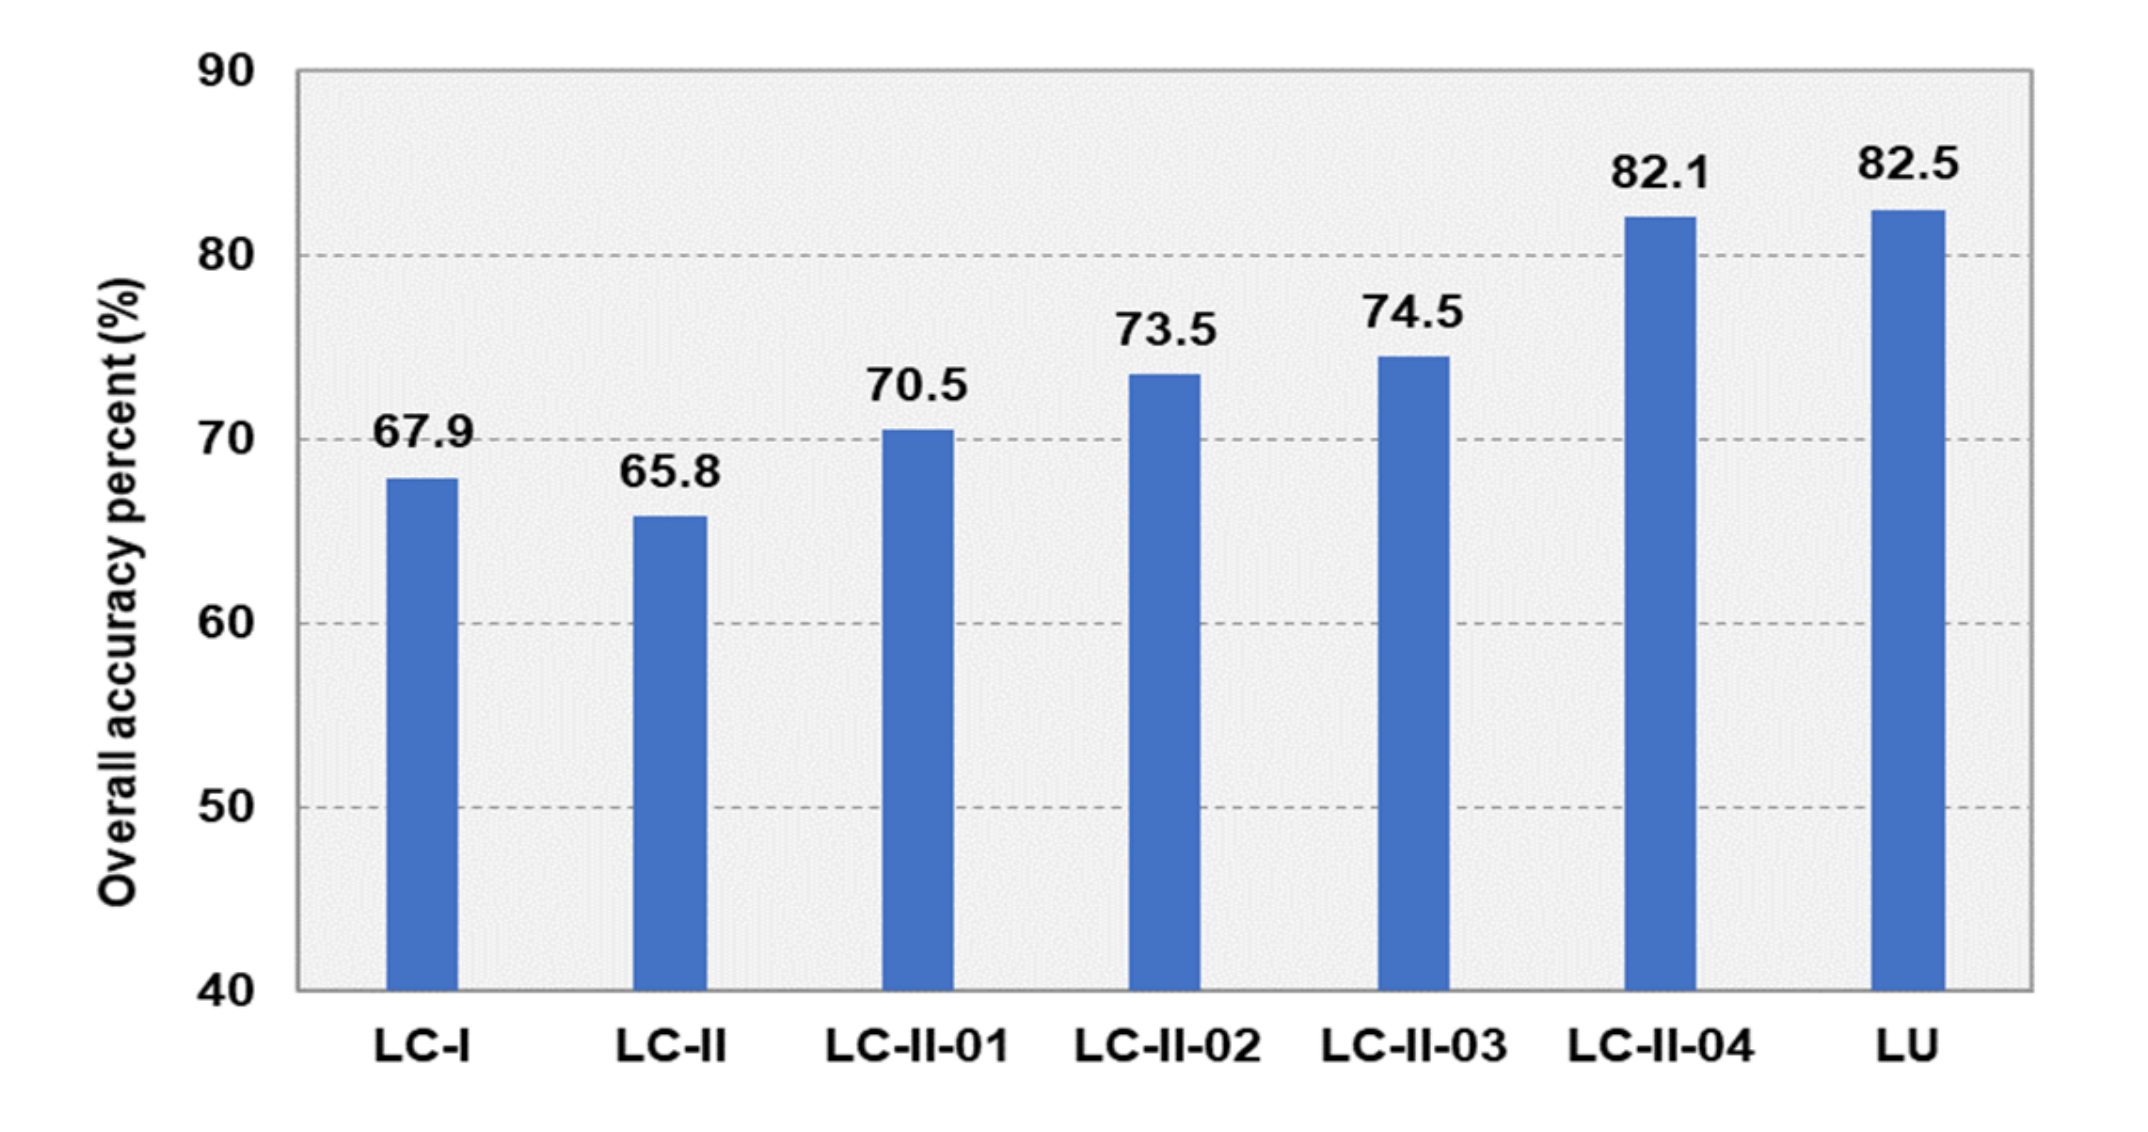
Figure 5 shows the overall accuracy for seven newly generated global land-cover maps, in which the LU scheme-based new map obtained the highest overall accuracy of ~82.5%, while the LC-II-based new map showed the lowest overall accuracy of ~65.8%. The overall accuracy of four LC-II-derived scheme-based maps improved by reducing the number of mosaic classes (10 classes were reduced from LC-II to LC-II-01; 4 more classes were reduced from LC-II-01 to LC-II-02; 1 more class was reduced from LC-II-02 to LC-II-03; 1 more class was reduced from LC-II-03 to LC-II-04).
Figure 5.
Overall accuracies of seven new integrated global land cover maps.
Table 5, Table 6, Table 7, Table 8, Table 9, Table 10 and Table 11 shows the confusion matrix of the newly generated land-cover maps based on three different classification schemes (LC-I, LC-II, LU, LC-II-01, LC-II-02, LC-II-03 and LC-II-04).
Table 5.
Confusion matrix of LC-I scheme-based new land cover map.
Table 6.
Confusion matrix of LU scheme-based new land cover map.
Table 7.
Confusion matrix of LC-II scheme-based new land cover map.
Table 8.
Confusion matrix of LC-II-01 scheme-based new land cover map.
Table 9.
Confusion matrix of LC-II-02 scheme-based new land cover map.
Table 10.
Confusion matrix of LC-II-03 scheme-based new land cover map.
Table 11.
Confusion matrix of LC-II-04 scheme-based new land cover map.
The classes of water bodies (A31 and A311) and bare area (A33 and A332) showed high producer accuracy (PA) and user accuracy (UA) in all global datasets, and thus, are considered quite accurately mapped in all datasets. Land cover, like water bodies and bare area, are classes with consistent components of the landscape over large areas, which make the interpretation work easier. DCP validation data were proved to have the potential for providing useful information for such classes. However, some classes with consistent landscape components but high PA and low UA indicated overlapping. An example is the class of grasslands (A11 and A111). Its PA of 89.9% indicated that accurate mapping of all areas that represent this class on the ground have been mapped as it is. However, its low UA of 58.8% indicated that ~42.2% of samples that are not grasslands are committed to this class. The error matrix (Table 12) emphasizes that most of this commission error resulted from confusion with the mosaic classes and tree class.
Table 12.
Comparison of the producer’s accuracy and user’s accuracy of unaggregated and combined LCLU classes.
The class of shrublands (A12 and A121) shows the lowest overall accuracy and was proved to be rather uncertain and tended to be confused with grasslands and trees in all datasets. The definition of the shrublands class varies differently in various land-cover products. In MODIS Collection 5 2005, shrublands are defined as woody vegetation less than 2 m tall and with shrub canopy cover between 10% and 60%, while GLNMO 2005 uses height range of 0.3–5 m as the threshold value and 100–150% as the canopy-cover threshold value.
The class of exposed soils (A331) shows poor overall accuracy, showing major confusion with grasslands (A111), which is mainly caused by the difference in interpretation and classification of fallow cropland in different land-cover products. In the existing global land-cover maps, fallow cropland (exposed soils without vegetation cover) has been classified as cropland, while in the DCP data, it was classified as exposed soils based on the photographs and description of the sites.
The mosaic area classes (A21, A22, A23, A211, A212, A213, A214, A221, A222, A223, A231, A232 and A233) show the lowest PAs and UAs. The error matrix (Table 5, Table 6, Table 7, Table 8, Table 9, Table 10 and Table 11) indicates that most of the commission errors result from confusion with the grassland classes. This is mainly due to the ambiguities in the definition of mosaic classes between the DCP validation data and the existing maps. For example, both MODIS Collection 5 2005 and GLNMO 2005 contains the class of wetland, while in the DCP validation scheme, wetlands were labeled as the water and vegetation class. Furthermore, the DCP classification scheme contains both sparse vegetation classes (sparse grassland, sparse shrubland and sparse tree) and the mixed barren and vegetation classes (barren and grassland, barren and shrubland, barren and tree), while there is a single class of sparse vegetation in the three existing classification schemes.
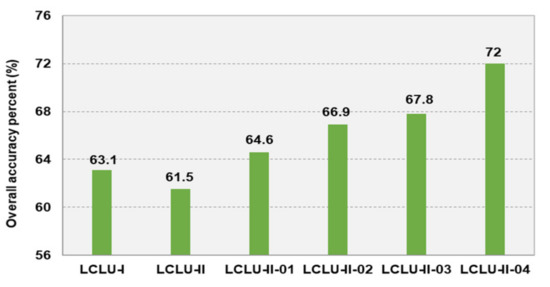
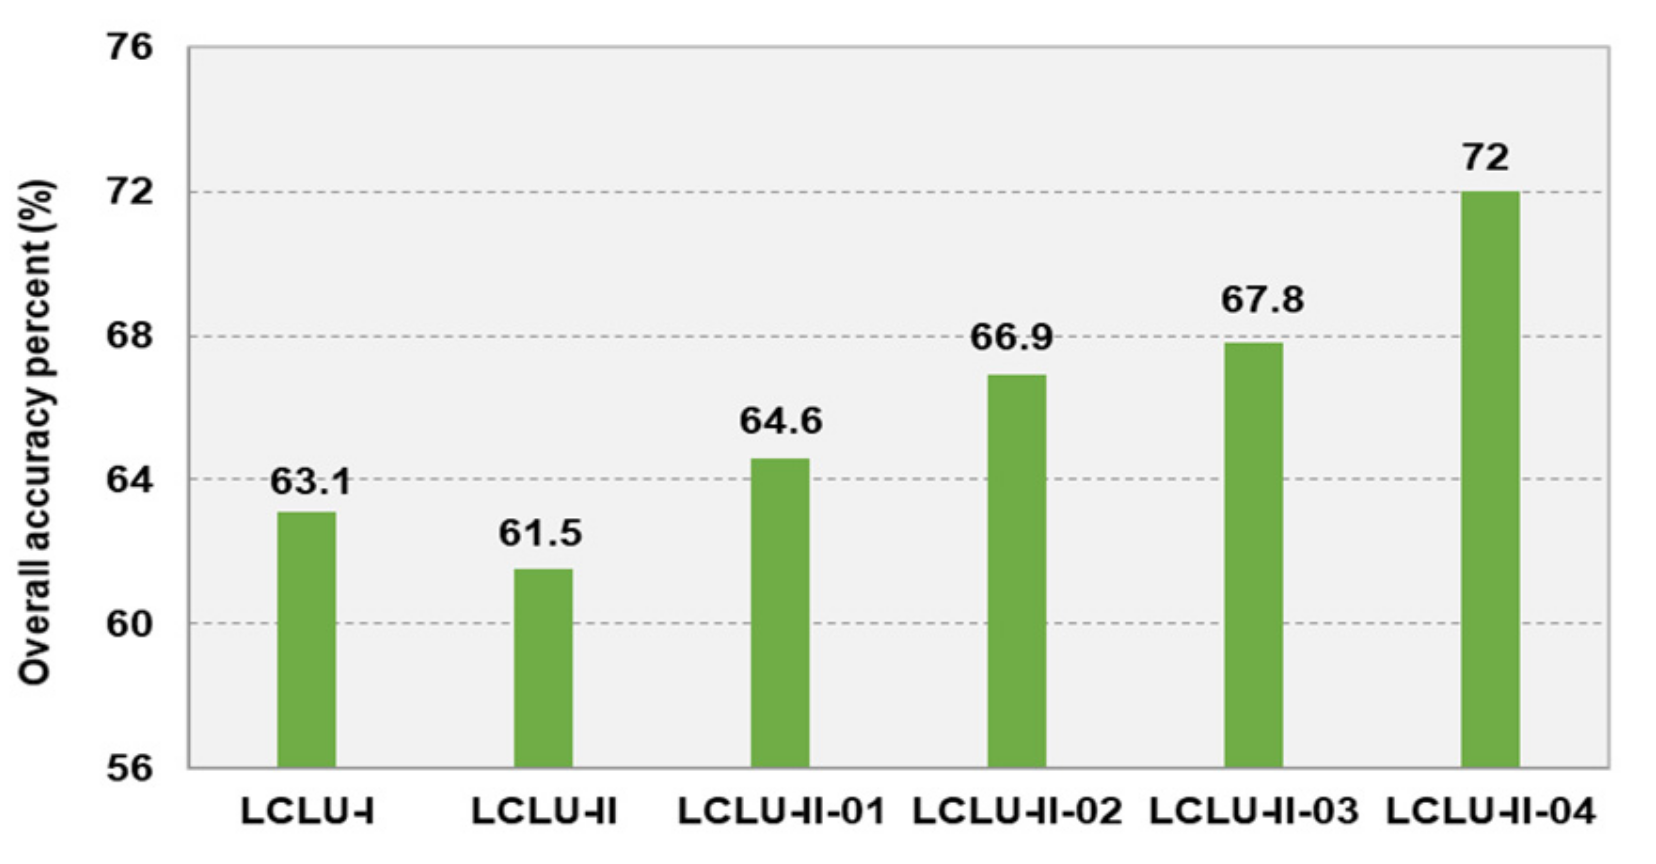
Similarly, an accuracy assessment was performed for the combined LC and LU classification schemes. The six classification schemes created were LCLU-I, LCLU-II, LCLU-01, LCLU-02, LCLU-03 and LCLU-04. Figure 5 shows the overall accuracy of the combined LCLU classification scheme-based integrated global land cover maps. The overall accuracy of all maps decreased compared to the unaggregated land-cover and land-use classification scheme-based maps (Figure 6). However, Table 12 indicates that as the LCLU classes were combined, the PA and UA of grassland classes (A11 and A111) decreased. The confusion matrix analysis of the combined LCLU classification maps indicated the high degree of confusion between the grassland classes (A11 and A111) and the herbaceous planted/cultivated class (B11).
Figure 6.
The overall accuracy of six new integrated global land-cover maps with combined LCLU classification schemes.
4. Discussion
4.1. Analysis of Validation Data Uncertainty
One of the concerns with the use of DCP-derived validation information is the quality and quantity of the referenceable information provided by volunteers. First, this limitation can be explained by the frequency and intervals of the visits at some sites where the vegetation phenology parameters vary with seasonal changes (generally, multitemporal visits would improve the accuracy of referenced information). Second, the temporal gap between the land-cover maps and referenced field photographs can reduce the amount of useful reference data. Third, volunteers’ backgrounds, such as culture, field experience, and local environment knowledge, will be reflected in their term preference for site description, thus affecting the interpretation. Another source of concern is that the restriction of visual availability (the range, extent, and clearness) in the DCP-referenced photographs made it difficult to determine the most populous class categories at field sites with mixed land-surface features and can cause an error of the estimated cover percentage of a component. Moreover, the anthropogenic component and the spatial distribution pattern cannot be directly captured. Identification of the managed land through photographs, such as grazing land, was challenging. These outcomes are consistent with the findings of Xiong et al. [42], who reported that in many map products, croplands contained within mosaicked land classes lead to substantial uncertainties in cropland assessment. Ideally, UAV (Unmanned Aerial Vehicles) can be an efficient tool in capturing the spatial distribution pattern of such anthropogenic land types. However, the cost and laws/regulations of UAV limited its spread use by volunteers. High resolution and full coverage images, such as Google Earth® images, are essential for facilitating visual interpretation. The final concern is that the positional accuracy of the DCP sites limited the quantity of useful referenced data. During the preparation of the DCP dataset, we found that the number of visited sites tended to be randomly distributed in locations that are close to, but not exactly on, the confluence points. One reason could be the poor accessibility of the terrain of the target confluence points. For example, some confluence points need permission to access are in private farms or protected areas, such as nature reserves.. Similarly, confluence points located at water bodies, such as the ocean, which raises challenges due to its accessibility. Therefore, manually inspecting these photos and their description for the accurate location and the target location is essential. This is in line with the findings of Bai et al. [43], who reported that the sites do not always yield interpretable or proper scenes right at the confluence points. This issue restricts the utilization of DCP data for smaller- or regional-scale land-cover mapping or validation.
4.2. Analysis of Classification Schemes
Unification of classification schemes between validation data and mapping could result in reduced accuracy of the thematic information content. However, this study introduced a classification scheme containing hierarchically matrix-structured groups of classes with unaggregated land-cover and land-use classes, through which the possible accuracy loss stemming from such a unification process might be avoided. Additional sub-legends were provided to meet detailed validation requirements. Because most of the existing classification schemes can be explained by the land-cover or land-use types within our matrix legend, by adopting it, the comparison of maps could be directly performed without class conversion or the resampling process. Moreover, the unaggregated land-cover and land-use schemes could facilitate the identification of detailed land-use types, such as whether the land-cover types are natural or under human management. For example, in Table A1, 200 points were classified as the trees class based on the LC-I legend. Meanwhile, according to the LU legend, 120 out of 200 points were cultivated areas, which indicates a 60% possibility of artificial trees. Common low agreement rates existed in several classes among the datasets, which were mainly caused by the ambiguity between the classification schemes of the DCP data and the existing maps. For example, there was confusion between the grassland and cropland-related classes. One reason for this could be the classification scheme or the definition differences between cropland and grassland classes. The matrix legend used the unaggregated land-cover and land-use classification scheme in which the cropland was classified as grassland (A11) and herbaceous planted/cultivated class (B11), while the land surface was covered by grass-like vegetation. Another example is that even though there was less confusion between the urban classes and the barren-and-vegetation-related classes among the maps, unlike the other two maps, vegetated urban areas were included in the urban class in GLNMO 2005, which led to a 36.4% overlap of confusion between these two classes. To reduce the uncertainty and disagreement in land-cover class definitions, further effort is necessary. [44]. Special attention should be paid to the definition of mosaic classes.
4.3. Suggestions and Future Research Directions
Regarding the suggestion for possible improvement in DCP, one approach is to provide standardized rules and instructions in a consistent framework that guides the volunteers on how to properly record and describe the site scenes. However, this approach should be used carefully as the increase in difficulties of recording tasks will attract fewer volunteers. DCP-data users should adopt a consistent protocol and a case-specific classification scheme for interpretation. The unaggregated land-cover and land-use classification scheme proposed in this study would be a good option as (1) the unaggregated land-cover and land-use could avoid the confusion between ambiguous classes (such as grassland and cropland) and (2) the hierarchical structure (LC, LC-I and LU) is efficient to describe and to label the sites for both volunteers (avoid the need to decide the labels of sites) and users and (3) it meets various needs for application ranging from general (LC and LU) to specific (LC-I and LU) mapping/validating. DCP users should flexibly integrate information (including site information and the available volunteers’ background information) provided by volunteers with various sources, such as Google Earth® and other citizen sensing platforms, to assist in interpretation. Moreover, given that increasing numbers of reference datasets are being created and shared freely by various institutions and communities, building a connected global network platform to share the available data will facilitate the extension of the reference database quantitatively and qualitatively [45,46].
Future research directions will focus on (1) further assessing the impact of uncertainty in DCP-based validation data by dividing the validation data into a primary and a secondary labeled group, (2) assessing the impact of consistency of interpretation on map accuracy by including the interpreter’s confidence level of labeling for each sample, and (3) assessing the map accuracy using the method proposed by Stehman and Foody [47] by estimating area of each class using the reference classification.
5. Conclusions
In this paper, we assessed the impact of reference data uncertainty on map accuracy by comparing the created reference classification under a matrix-structured classification scheme with the existing global land-cover maps. We proposed a workflow to create a reference classification based on volunteer-reported reference data to facilitate accuracy assessment and impact analysis. A matrix-structured classification scheme with unaggregated land-cover and land-use legends was created for interpretation and classification, which makes the comparison of land cover maps easier; moreover, it requires no processing of class conversion and resampling, and can be applied to specified accuracy objectives.
This study confirmed the potential of volunteer-reported reference data, such as the DCP, to serve as validation data for map accuracy assessment. However, special care should be taken when using uncertain reference data and choosing/defining an appropriate classification scheme. The results confirmed that the number of classes affects the accuracy of land-cover maps negatively by comparing the overall accuracies of seven newly integrated maps. The more detailed the classes are given by the classification scheme, the probability of misclassification tends to be higher. Through the analysis of producer and user accuracies of seven newly integrated global land-cover maps, ambiguity was found to mainly exist in the classification of mosaic areas (grasses, shrubs and trees; water bodies and vegetation; barren and vegetation). Clear rules should be made to solve the ambiguous labeling issue. The uncertainty analysis results, as well as their suggestion, will also serve as reference protocol for choosing reliable reference data, and the proposed analysis workflow will assist in land-cover map validation and yield rigorous accuracy estimates.
Author Contributions
Conceived and designed the experiments, T.Q. and T.K.; performed the experiment and analyzed the data, T.Q.; jointly revised the paper, T.Q., T.K., M.F. and Y.B. All authors have read and agreed to the published version of the manuscript.
Funding
This research received no external funding.
Acknowledgments
I would like to give special thanks to Vishwanathan Saritha at Center for Social and Environmental Systems Research at NIES, for her valuable advices and feedbacks; Gou Xiaowei at Arid Land Research Center of Tottori University, for his help in figures.
Conflicts of Interest
The authors declare no conflict of interest.
Appendix A
Table A1.
Agreement number between MCD12Q1 2005 and DCP-based ground truth dada.
Table A2.
Agreement number between GlobCover 2009 and DCP-based ground truth dada.
Table A3.
Agreement number between GLNMO 2005 and DCP-based ground truth dada.
References
- Barnett, J. Security and climate change. Global Environ. Chang. 2003, 13, 7–17. [Google Scholar] [CrossRef] [Scilit]
- Huadong, G.; Stefano, N.; Dong, L.; Max, C.; Lizhe, W.; Sven, S.; Christina, C.; Guojin, H.; Martino, P.; Jianhui, L.; et al. Big Earth Data science: an information framework for a sustainable planet. Int. J. Digit. Earth 2020, 13, 743–767. [Google Scholar]
- Onoda, M.; Young, O.R. Satellite Earth Observations and Their Impact on Society and Policy; Springer Open: Singapore, 2017. [Google Scholar]
- Mora, B.; Tsendbazar, N.E.; Herold, M.; Arino, O. Global Land Cover Mapping: Current Status and Future Trends; Springer: Dordrecht, The Netherlands, 2014. [Google Scholar]
- Michael, A.W.; Nicholas, C.C.; David, P.R.; Joanne, C.W.T.H. Land cover 2.0. Int. J. Remote Sens. 2018, 39, 4254–4284. [Google Scholar]
- Stehman, S.V.; Fonte, C.C.; Foody, G.M.; See, L. Using volunteered geographic information (VGI) in design-based statistical inference for area estimation and accuracy assessment of land cover. Remote Sens. Environ. 2018, 212, 47–59. [Google Scholar] [CrossRef] [Scilit]
- Strahler, A.H.; Boschetti, L.; Foody, G.M.; Friedl, M.A.; Hansen, M.C.; Herold, M.; Mayaux, P.; Morisette, J.T.; Stehman, S.V.; Woodcock, C.E. Global Land Cover Validation: Recommendations for Evaluation and Accuracy Assessment of Global Land Cover Maps. In Technical Report EUR 22156 EN-DG 2006; Office for Official Publications of the European Community: Luxembourg, 2006. [Google Scholar]
- Olofsson, P.; Foody, G.M.; Herold, M.; Stehman, S.V.; Woodcock, C.E.; Wulder, M.A. Good practices for estimating area and assessing accuracy of land change. Remote Sens. Environ. 2014, 148, 42–57. [Google Scholar] [CrossRef] [Scilit]
- McRoberts, R.E.; Stehman, S.V.; Liknes, G.C.; Næsset, E.; Sannier, C.; Walters, B.F. The effects of imperfect reference data on remote sensing-assisted estimators of land cover class proportions. ISPRS J. Photogramm. Remote Sens. 2018, 142, 292–300. [Google Scholar] [CrossRef] [Scilit]
- Muchoney, D.M.; Borak, J.; Strahler, A. Global landcover classification validation issues and requirements. In Proceedings of the International Geoscience and Remote Sensing Symposium, Lincoln, NE, USA, 27–31 May 1996; pp. 233–235. [Google Scholar]
- Stehman, S.V.; Czaplewski, R.L. Design and analysis for thematic map accuracy assessment: Fundamental principles. Remote Sens. Environ. 1998, 64, 331–344. [Google Scholar] [CrossRef] [Scilit]
- Klein, G.K.; Ramankutty, N. Land cover change over the last three centuries due to human activities: The availability of new global data sets. GeoJournal 2004, 61, 335–344. [Google Scholar] [CrossRef] [Scilit]
- Morisette, J.T.; Nickeson, J.E.; Davis, P.; Wang, Y.; Tian, Y.; Woodcock, C.E.; Shabanov, N.; Hansen, M.; Cohen, W.B.; Oetter, D.R.; et al. High spatial resolution satellite observations for validation of MODIS land products: IKONOS observations acquired under the NASA Scientific Data Purchase. Remote Sens. Environ. 2003, 88, 100–110. [Google Scholar] [CrossRef] [Scilit]
- Wulder, M.A.; Boots, B.; Seemann, D.; White, J.C. Map comparison using spatial autocorrelation: An example using AVHRR derived land cover of Canada. Can. J. Remote Sens. 2004, 30, 573–592. [Google Scholar] [CrossRef] [Scilit]
- Pengra, B.; Long, J.; Dahal, D.; Stehman, S.V.; Loveland, T.R. A global reference database from very high resolution commercial satellite data and methodology for application to Landsat derived 30 m continuous field tree cover data. Remote Sens. Environ. 2015, 165, 234–248. [Google Scholar] [CrossRef] [Scilit]
- Midekisa, A.; Holl, F.; Savory, D.J.; Andrade-Pacheco, R.; Gething, P.W.; Bennett, A.; Sturrock, H.J.W. Mapping land cover change over continental Africa using Landsat and Google Earth Engine cloud computing. PLoS ONE 2017, 12, 1–15. [Google Scholar] [CrossRef] [Scilit] [PubMed]
- Sun, B.; Chen, X.; Zhou, Q. Uncertainty assessment of GlobeLand30 Land cover data set over central Asia. ISPRS - Int. Arch. Photogramm. Remote Sens. Spat. Inf. Sci. 2016, 41, 1313–1317. [Google Scholar] [CrossRef] [Scilit]
- Ozdogan, M.; Woodcock, C.E. Resolution dependent errors in remote sensing of cultivated areas. Remote Sens. Environ. 2006, 103, 203–217. [Google Scholar] [CrossRef] [Scilit]
- Foody, G.M. Ground reference data error and the mis-estimation of the area of land cover change as a function of its abundance. Remote Sens. Lett. 2013, 4, 783–792. [Google Scholar] [CrossRef] [Scilit]
- Zhao, Y.; Gong, P.; Yu, L.; Hu, L.; Li, X.; Li, C.; Zhang, H.; Zheng, Y.; Wang, J.; Zhao, Y.; et al. Towards a common validation sample set for global land-cover mapping. Int. J. Remote Sens. 2014, 35, 4795–4814. [Google Scholar] [CrossRef] [Scilit]
- O’Reilly, T. What is Web 2.0: Design Patterns and Business Models for the Next Generation of Software. 2005. Available online: https://www.oreilly.com/pub/a/web2/archive/what-is-web-20.html (accessed on 1 May 2020).
- Goodchild, M.F.; Fu, P.; Rich, P. Sharing geographic information: An assessment of the geospatial one-stop. Ann. Assoc. Am. Geogr. 2007, 97, 250–266. [Google Scholar] [CrossRef] [Scilit]
- Flanagin, A.J.; Metzger, M.J. The credibility of volunteered geographic information. GeoJournal 2008, 72, 137–148. [Google Scholar] [CrossRef] [Scilit]
- May, A.; Parker, C.J.; Taylor, N.; Ross, T. Evaluating a concept design of a crowd-sourced “mashup” providing ease-of-access information for people with limited mobility. Transp. Res. Part C Emerg. Technol. 2004, 49, 103–113. [Google Scholar] [CrossRef] [Scilit]
- Goodchild, M.F. Citizens as sensors: The world of volunteered geography. GeoJournal 2007, 69, 211–221. [Google Scholar] [CrossRef] [Scilit]
- Parker, C.J.; May, A.; Mitchell, V. User-centred design of neogeography: The impact of volunteered geographic information on users’ perceptions of online map “mashups”. Ergonomics 2014, 57, 987–997. [Google Scholar] [CrossRef] [Scilit] [PubMed]
- Parker, C.J.; May, A.; Mitchell, V. Understanding Design with VGI using an Information Relevance Framework. Trans. GIS. 2012, 16, 545–560. [Google Scholar] [CrossRef] [Scilit]
- Hara, K.; Le, V.; Froehlich, J.E. Combining Crowdsourcing and Google Street View to Identify Street-Level Accessibility Problems. In Proceedings of the SIGCHI Conference on Human Factors in Computing Systems, Paris, France, 27 Apri–2 May 2013; Association for Computing Machinery: New York, NY, USA, 2013; pp. 631–640. [Google Scholar]
- Iwao, K.; Nishida, K.; Kinoshita, T.; Yamagata, Y. Validating land cover maps with Degree Confluence Project information. Geophys. Res. Lett. 2006, 33, 1–5. [Google Scholar] [CrossRef] [Scilit]
- Iwao, K.; Nasahara, K.N.; Kinoshita, T.; Yamagata, Y.; Patton, D.; Tsuchida, S. Creation of New Global Land Cover Map with Map Integration. J. Geogr. Inf. Syst. 2011, 3, 160–165. [Google Scholar] [CrossRef]
- Kinoshita, T.; Iwao, K.; Yamagata, Y. Creation of a global land cover and a probability map through a new map integration method. Int. J. Appl. Earth Obs. Geoinf. 2014, 28, 70–77. [Google Scholar] [CrossRef] [Scilit]
- Zielstra, D.; Zipf, A. A comparative study of proprietary geodata and volunteered geographic information for germany. In Proceedings of the 13th Association of Geographic Information Laboratories for Europe International Conference on Geographic Information Science, Guimarães, Portugal, 10–14 May 2010. [Google Scholar]
- Fonte, C.C.; Bastin, L.; See, L.; Foody, G.M.; Lupia, F. Usability of VGI for validation of land cover maps. Int. J. Geogr. Inf. Sci. 2015, 29, 1269–1291. [Google Scholar] [CrossRef] [Scilit]
- Senaratne, H.; Mobasheri, A.; Ali, A.L.; Capineri, C.; Haklay, M. A review of volunteered geographic information quality assessment methods. Int. J. Geogr. Inf. Sci. 2017, 31, 139–167. [Google Scholar] [CrossRef] [Scilit]
- Viana, C.M.; Encalada, L.; Rocha, J. The value of OpenStreetMap historical contributions as a source of sampling data for multi-temporal land use/cover maps. ISPRS Int. J. Geo-Information 2019, 8, 1–18. [Google Scholar] [CrossRef] [Scilit]
- Fonte, C.S.; Antoniou, V.; Bastin, L.; Estima, J.; Arsanjani, J.J.; Laso Bayas, J.-C.; See, L.; Vatseva, R. Assessing VGI Data Quality. In Mapping and the Citizen Sensor; Foody, G., See, L., Fritz, S., Mooney, P., Olteanu-Raimond, A., Fonte, C.C., Antoniou, V., Eds.; Ubiquity Press: London, UK, 2017; pp. 137–164. [Google Scholar]
- Friedl, M.A.; Sulla-Menashe, D.; Tan, B.; Schneider, A.; Ramankutty, N.; Sibley, A.; Huang, X. MODIS Collection 5 global land cover: Algorithm refinements and characterization of new datasets. Remote Sens. Environ. 2010, 114, 168–182. [Google Scholar] [CrossRef] [Scilit]
- Tateishi, R.; Hoan, N.T.; Kobayashi, T.; Alsaaideh, B.; Tana, G.; Phong, D.X. Production of global land cover data—GLCNMO2008. J. Geogr. Geol. 2014, 6, 99–122. [Google Scholar] [CrossRef] [Scilit]
- Arino, O.; Ramos, P.; Jose, J.; Kalogirou, V.; Bontemps, S.; Defourny, P.; van Bogaert, E. Global Land Cover Map for 2009 (GlobCover 2009); European Space Agency (ESA) & Université catholique de Louvain (UCL): Frascati, Italy, 2012. [Google Scholar]
- Lambin, E.F.; Baulies, X.; Bockstael, N.; Fischer, G.; Krug, T.; Leemans, R.; Moran, E.F.; Rindfuss, R.R.; Skole, D.; Turner ll, B.L.; et al. Land-Use and Land-Cover Change (LUCC)-Implementation Strategy; IGBP Report No.48/IHDP Report No. 10; IGBP Secretariat: Stockholm, Sweden, 1999; pp. 125–126. [Google Scholar]
- Comber, A.J.; Wadsworth, R.A.; Fisher, P.F. Using semantics to clarify the conceptual confusion between land cover and land use: The example of “forest”. J. Land Use Sci. 2008, 3, 185–198. [Google Scholar] [CrossRef] [Scilit]
- Xiong, J.; Thenkabail, P.S.; Gumma, M.K.; Teluguntla, P.; Poehnelt, J.; Congalton, R.G.; Yadav, K.; Thau, D. Automated cropland mapping of continental Africa using Google Earth Engine cloud computing. ISPRS J. Photogramm. Remote Sens. 2017, 126, 225–244. [Google Scholar] [CrossRef] [Scilit]
- Bai, L. Comparison and Validation of Five Land Cover Products over the African Continent. Master’s Thesis, Lund University, Lund, Sweden, 2010. [Google Scholar]
- Giri, C.; Zhu, Z.; Reed, B. A comparative analysis of the Global Land Cover 2000 and MODIS land cover data sets. Remote Sens. Environ. 2005, 94, 123–132. [Google Scholar] [CrossRef] [Scilit]
- Tsendbazar, N.E.; de Bruin, S.; Herold, M. Integrating global land cover datasets for deriving user-specific maps. Int. J. Digit. Earth. 2017, 10, 219–237. [Google Scholar] [CrossRef] [Scilit]
- Olofsson, P.; Stehman, S.V.; Woodcock, C.E.; Sulla-Menashe, D.; Sibley, A.M.; Newell, J.D.; Friedl, M.A.; Herold, M. A global land-cover validation data set, part I: Fundamental design principles. Int. J. Remote Sens. 2012, 33, 5768–5788. [Google Scholar] [CrossRef] [Scilit]
- Stehman, S.V.; Foody, G.M. Key issues in rigorous accuracy assessment of land cover products. Remote Sens. Environ. 2019, 231, 1–23. [Google Scholar] [CrossRef] [Scilit]

© 2020 by the authors. Licensee MDPI, Basel, Switzerland. This article is an open access article distributed under the terms and conditions of the Creative Commons Attribution (CC BY) license (http://creativecommons.org/licenses/by/4.0/).