


Abstract
Wheat (Triticum aestivum L.) productivity in saline soils is often constrained by nutrient imbalance, water scarcity, and ionic stress, particularly in arid regions such as the Nile Delta of Egypt. This study evaluated the combined effects of biochar (2.4 t ha−1) and 1% foliar seaweed extract under varying nitrogen application levels on soil chemical properties, wheat growth, yield, nutrient uptake, and N-use efficiency indices over two consecutive winter seasons (2023/2024 and 2024/2025). A factorial field experiment with three replicates was conducted using four nitrogen rates: 0%, 50%, 75%, and 100% of the recommended application (168 kg N ha−1), combined with four treatments: control, seaweed extract, biochar, and their integration. Combined analysis showed that the highest grain yield was obtained under full nitrogen with biochar and seaweed extract (7085.75 kg ha−1), although this was not significantly different from several integrated treatments, particularly those involving 75% nitrogen with amendments. The 75% N + biochar + seaweed extract treatment achieved comparable yield while significantly improving nitrogen-use efficiency indices, including recovery efficiency, agronomic efficiency, and partial factor productivity. Biochar and seaweed extract improved soil organic carbon, cation exchange capacity, and nutrient availability, while electrical conductivity was not significantly affected. These results indicate that nitrogen input can be reduced by up to 25% without yield loss when combined with these amendments, while enhancing nutrient-use efficiency. However, conclusions regarding salinity stress mitigation remain indirect due to the absence of physiological measurements. Overall, this integrated approach supports more sustainable wheat production in saline soils.
1. Introduction
Wheat (Triticum aestivum L.) is a fundamental component of global food security and one of the most widely cultivated cereal crops due to its adaptability [1]. However, soil salinity a major constraint in arid and semi-arid regions such as Egypt [2]. In the Nile Delta, salinity has increased due to poor drainage, intensive irrigation, and seawater intrusion [3,4], reducing crop productivity by disrupting water uptake, ionic balance, and nutrient availability [5]. Although wheat is moderately tolerant to salinity, prolonged exposure reduces photosynthesis and nitrogen metabolism, leading to yield losses [6].
Nitrogen (N) is essential for wheat growth and yield formation, and its application is often increased in saline soils to compensate for reduced productivity [7]. However, excessive nitrogen application results in low nitrogen-use efficiency, environmental pollution, and higher production costs [8]. Improving nitrogen-use efficiency rather than increasing fertilizer input is therefore a key requirement for sustainable production in saline soils.
Biochar, a carbon-rich material produced from biomass pyrolysis, has attracted attention for improving soil quality under stress conditions [9]. Its porous structure and high surface reactivity improves water retention, nutrient availability, and cation exchange capacity [10,11,12]. It may also reduce salinity effects by limiting Na+ and Cl− accumulation and improving K+ uptake, and enhancing physiological functions such as photosynthesis and antioxidant defense systems [13,14]. Biochar further enhances soil fertility and carbon sequestration [15]. Previous studies have demonstrated that biochar can enhance antioxidant activity, catalase, glutathione-S transporter enzyme activity, photosynthetic efficiency, and stomatal function, thereby reducing oxidative damage under saline conditions [16,17]. Combining biochar with nitrogen fertilization can improve wheat performance, increase yield, and enhance nitrogen-use efficiency [18,19], while potentially reducing the need for chemical fertilizers [20].
Despite these benefits, biochar application has certain limitations. In some cases, it may increase soil electrical conductivity, pH, and exchangeable sodium levels, particularly in surface soil layers [21]. Its effects are strongly influenced by feedstock type, pyrolysis conditions, and application rate [22]. Excessive or inappropriate application may lead to nutrient imbalances and negatively affect soil microbial activity and crop performance [23,24,25]. Therefore, careful selection of biochar type and moderate application rates are essential to maximize benefits while minimizing potential risks [9,22].
In parallel, seaweed extracts have emerged as effective biostimulants due to their richness in bioactive compounds, essential nutrients, and plant growth regulators [26,27]. Their application has been shown to enhance plant growth, photosynthetic efficiency, antioxidant activity, and tolerance to salinity stress [28]. In wheat, seaweed extracts have been reported to improve root development, chlorophyll content, grain yield, and nitrogen-use efficiency, allowing for reduced nitrogen inputs without compromising productivity [29]. Furthermore, their integration with nitrogen fertilization has demonstrated positive effects on crop performance under stress conditions [30].
Therefore, soil salinity and inefficient nitrogen management remain major constraints for sustainable wheat production in arid and semi-arid regions, particularly in the Nile Delta of Egypt, where crop productivity is strongly limited by nutrient imbalance, poor soil structure, and salinity-induced stress [2,3,4,5,6,8]. Recent studies have demonstrated that soil amendments such as biochar and seaweed extract can improve soil fertility and plant stress tolerance under saline conditions [9,10,11,12,13,14,26,27,28,29,30]. Despite these benefits, the combined effects of biochar and seaweed extract under different nitrogen levels in saline soils remain insufficiently studied under field conditions. It is hypothesized that integrating biochar and seaweed extract with reduced nitrogen rates can maintain wheat yield while improving nitrogen-use efficiency under saline conditions.
Therefore, this study aimed to: (i) evaluate the effects of biochar and seaweed extract on soil chemical properties and wheat productivity under saline conditions; (ii) investigate their interaction with varying nitrogen application rates; and (iii) determine whether reduced nitrogen input combined with these amendments can maintain yield while improving nitrogen-use efficiency.
2. Materials and Methods
2.1. Field Experimental Description
Field experiments were conducted during two consecutive winter seasons (2023/2024 and 2024/2025) at the experimental farm of the Sakha Agricultural Research Station, Kafr El Sheikh Governorate, Egypt (31°05′35.27″ N, 30°56′57.44″ E). The soil is fine-textured clay soil according to USDA Soil Taxonomy classification and is affected by salinity [31].
The region is characterized by a semi-arid climate with low and irregular rainfall, high evapotranspiration, and moderate winter temperatures, consistent with previous reports [3]. Average minimum air temperatures ranged from 8.98 to 15.74 °C, while maximum temperatures varied between 19.38 and 30.92 °C. Relative humidity values ranged from 54.85 to 73.86%. Rainfall was low and irregular, with monthly totals between 2.28 and 45.16 mm. Wind speed averaged between 2.23 and 3.41 m/s.
Soil samples (0–30 cm depth) were collected sowing. Soil pH was determined in a 1:2.5 soil-to-water suspension, and electrical conductivity (ECe) was measured in saturated soil paste extracts. Available nitrogen, phosphorus, and potassium were determined using standard procedures [32]. Particle size distribution and bulk density were measured using hydrometer and core methods [33]. The initial physical and chemical properties of the soil are presented in Table 1.
Table 1.
Some physical and chemical characteristics of the soil before wheat cultivation in both seasons.
2.2. Materials Used
Biochar was produced from maize shoot via pyrolysis at approximately 350 °C for 30 min under limited oxygen conditions [34]. The resulting biochar had the following properties: pH of 8.84 (1:10), carbon 51.39%, nitrogen 1.27%, total phosphorus 2.20 mg/kg, total potassium 26.15 mg/kg, and C/N ratio of 40.47:1. The biochar was obtained from the Technology Incubator at Sakha Agricultural Research Station, Kafr El Sheikh, Egypt.
Seaweed extract was prepared from Sarconema filiforme Rayss (red algae, Rhodophyta). One kilogram of dried material was mixed with 2 L distilled water, boiled for one hour, cooled, and filtered. The filtrate was stored as a stock solution for later foliar application [35]. The seaweed material was provided by the Microbiology Research Department, Sakha Agricultural Research Station, Kafr El Sheikh, Egypt.
The extract contained 7.5% N, 6.0% P, 19.5% K, 2.4% S, 2.2% Ca, 2.7% Na, and natural growth promoters: cytokinins (0.011%), indole acetic acid (0.0023%), and pepsin (0.04%). Its biochemical composition included protein (45.12%), saccharides (5.87%), lipids (7.32%), alginic acid (6.35%), and hydrates (52.33%), as well as amino acids such as methionine (1.05%), cysteine (1.71%), glutamic acid (3.82%), glycine (1.82%), and proline (1.17%).
Wheat variety: The approved variety “Sakha 95” was used in both seasons from Sakha Agricultural Research Station and used in two growing seasons.
2.3. Design and Treatments
The experiment was arranged as a factorial design with three replicates. Two factors were investigated:
Nitrogen fertilization at four levels:
- ➢
- N0: 0% of recommended rate.
- ➢
- N1: 50% of recommended rate.
- ➢
- N2: 75% of recommended rate.
- ➢
- N3: 100% of recommended rate (168 kg N ha−1 under Egyptian conditions).
Soil and foliar amendments:
- ➢
- Control (no amendment, C).
- ➢
- Seaweed extract (S).
- ➢
- Biochar (B).
- ➢
- Seaweed extract + Biochar + seaweed extract S+B.
Each experimental plot measured 6 m2 (3 m × 2 m) with 50 cm buffer zones between plots to minimize border effects. The combination of four nitrogen levels and four amendment treatments resulted in sixteen treatment combinations.
2.4. Agronomic Practices
Wheat was sown on 15 November in both seasons (2023 and 2024) at a rate of 140 kg ha−1 and harvesting in April at full physiological maturity.
Calcium superphosphate (15.5% P2O5) was applied before plowing at 240 kg ha−1 and potassium sulfate (50% K2O) was applied at 120 kg ha−1 before sowing. Nitrogen fertilizer was applied as urea (46% N) in equal split doses at 30 and 60 days after sowing at rates equivalent to 0, 84, 126, and 168 kg N ha−1 (corresponding to approximately 0, 183, 274, and 365 kg urea ha−1, respectively). All other standard agronomic practices, including irrigation and pest management, were uniformly applied across all experimental plots.
Biochar was crushed and applied at 2.4 t ha−1 (~0.09% w/w in the top 20 cm, assuming 1.3 g cm−3 bulk density) during soil preparation. This rate lies at the lower end of effective doses reported for salinity mitigation [36]. Biochar was applied only in the first growing season to evaluate its residual effects in the second season.
Seaweed extract (1%) was applied as a foliar spray at 2.4 L/250 L water ha−1 at 30, 60, and 90 days after sowing in both seasons. Control plots received an equal volume of distilled water at the same growth stages.
2.5. Measurements
2.5.1. Soil Analysis
Soil samples were collected after harvest from the 0–30 cm depth in each season and analyzed for the same chemical properties measured pre-sowing.
2.5.2. Plant Sampling and Analysis
Agronomic traits recorded included the Flag leaf area (cm2), chlorophyll content (mg g−1 fw), Plant height (cm), Thousand-grain weight (g), grain yield, and straw yield (kg ha−1). Three representative plants per replicate were collected for physiological and chemical analyses.
Straw and grain samples were oven-dried, finely ground, and analyzed for nitrogen (N), phosphorus (P), and potassium (K) concentrations using standard analytical procedures. Nitrogen was determined using the modified Micro-Kjeldahl method, phosphorus by the colorimetric method, and potassium by flame photometry following wet acid digestion [37]. Nutrient uptake was calculated by multiplying nutrient concentration (%) by the corresponding dry matter yield.
2.5.3. Nitrogen Use Efficiencies
Nitrogen use efficiency indices were calculated according to Dobermann [38] as follows:
- Apparent crop recovery efficiency of applied nutrients (RE, kg kg−1)
- 2.
- Physiological efficiency of applied N (PE, kg kg−1)
- 3.
- Internal utilization efficiency of a nutrient (IE, kg kg−1)
- 4.
- Agronomic efficiency of applied nutrient (AE, kg kg−1)
- 5.
- Partial factor productivity of applied nutrients (PFP, kg kg−1)
- 6.
- N Surplus (kg ha−1)
2.6. Statistical Analysis
Data were analyzed using IBM SPSS Statistics (version 27.0.1). A General Linear Model was applied to evaluate the effects of nitrogen fertilization, amendments, and their interactions across seasons. Prior to the combined analysis, the normality of residuals was assessed using the Shapiro–Wilk test, and homogeneity of variances was evaluated using Levene’s test. Although most variables deviated from a normal distribution, the assumption of homogeneity of variances was satisfied for all traits. Given the robustness of ANOVA to moderate deviations from normality in balanced designs, the dataset was considered suitable for further analysis. A combined analysis was then conducted. When significant effects were detected, treatment means were separated using Tukey’s honestly significant difference (HSD) test at a probability level of p ≤ 0.05. Results are presented as mean ± standard deviation (SD). Graphical visualization and principal component analysis (PCA) were performed using Python (3.14.1) and R (v 4.5.1) software packages.
3. Results
3.1. Soil Chemical Properties
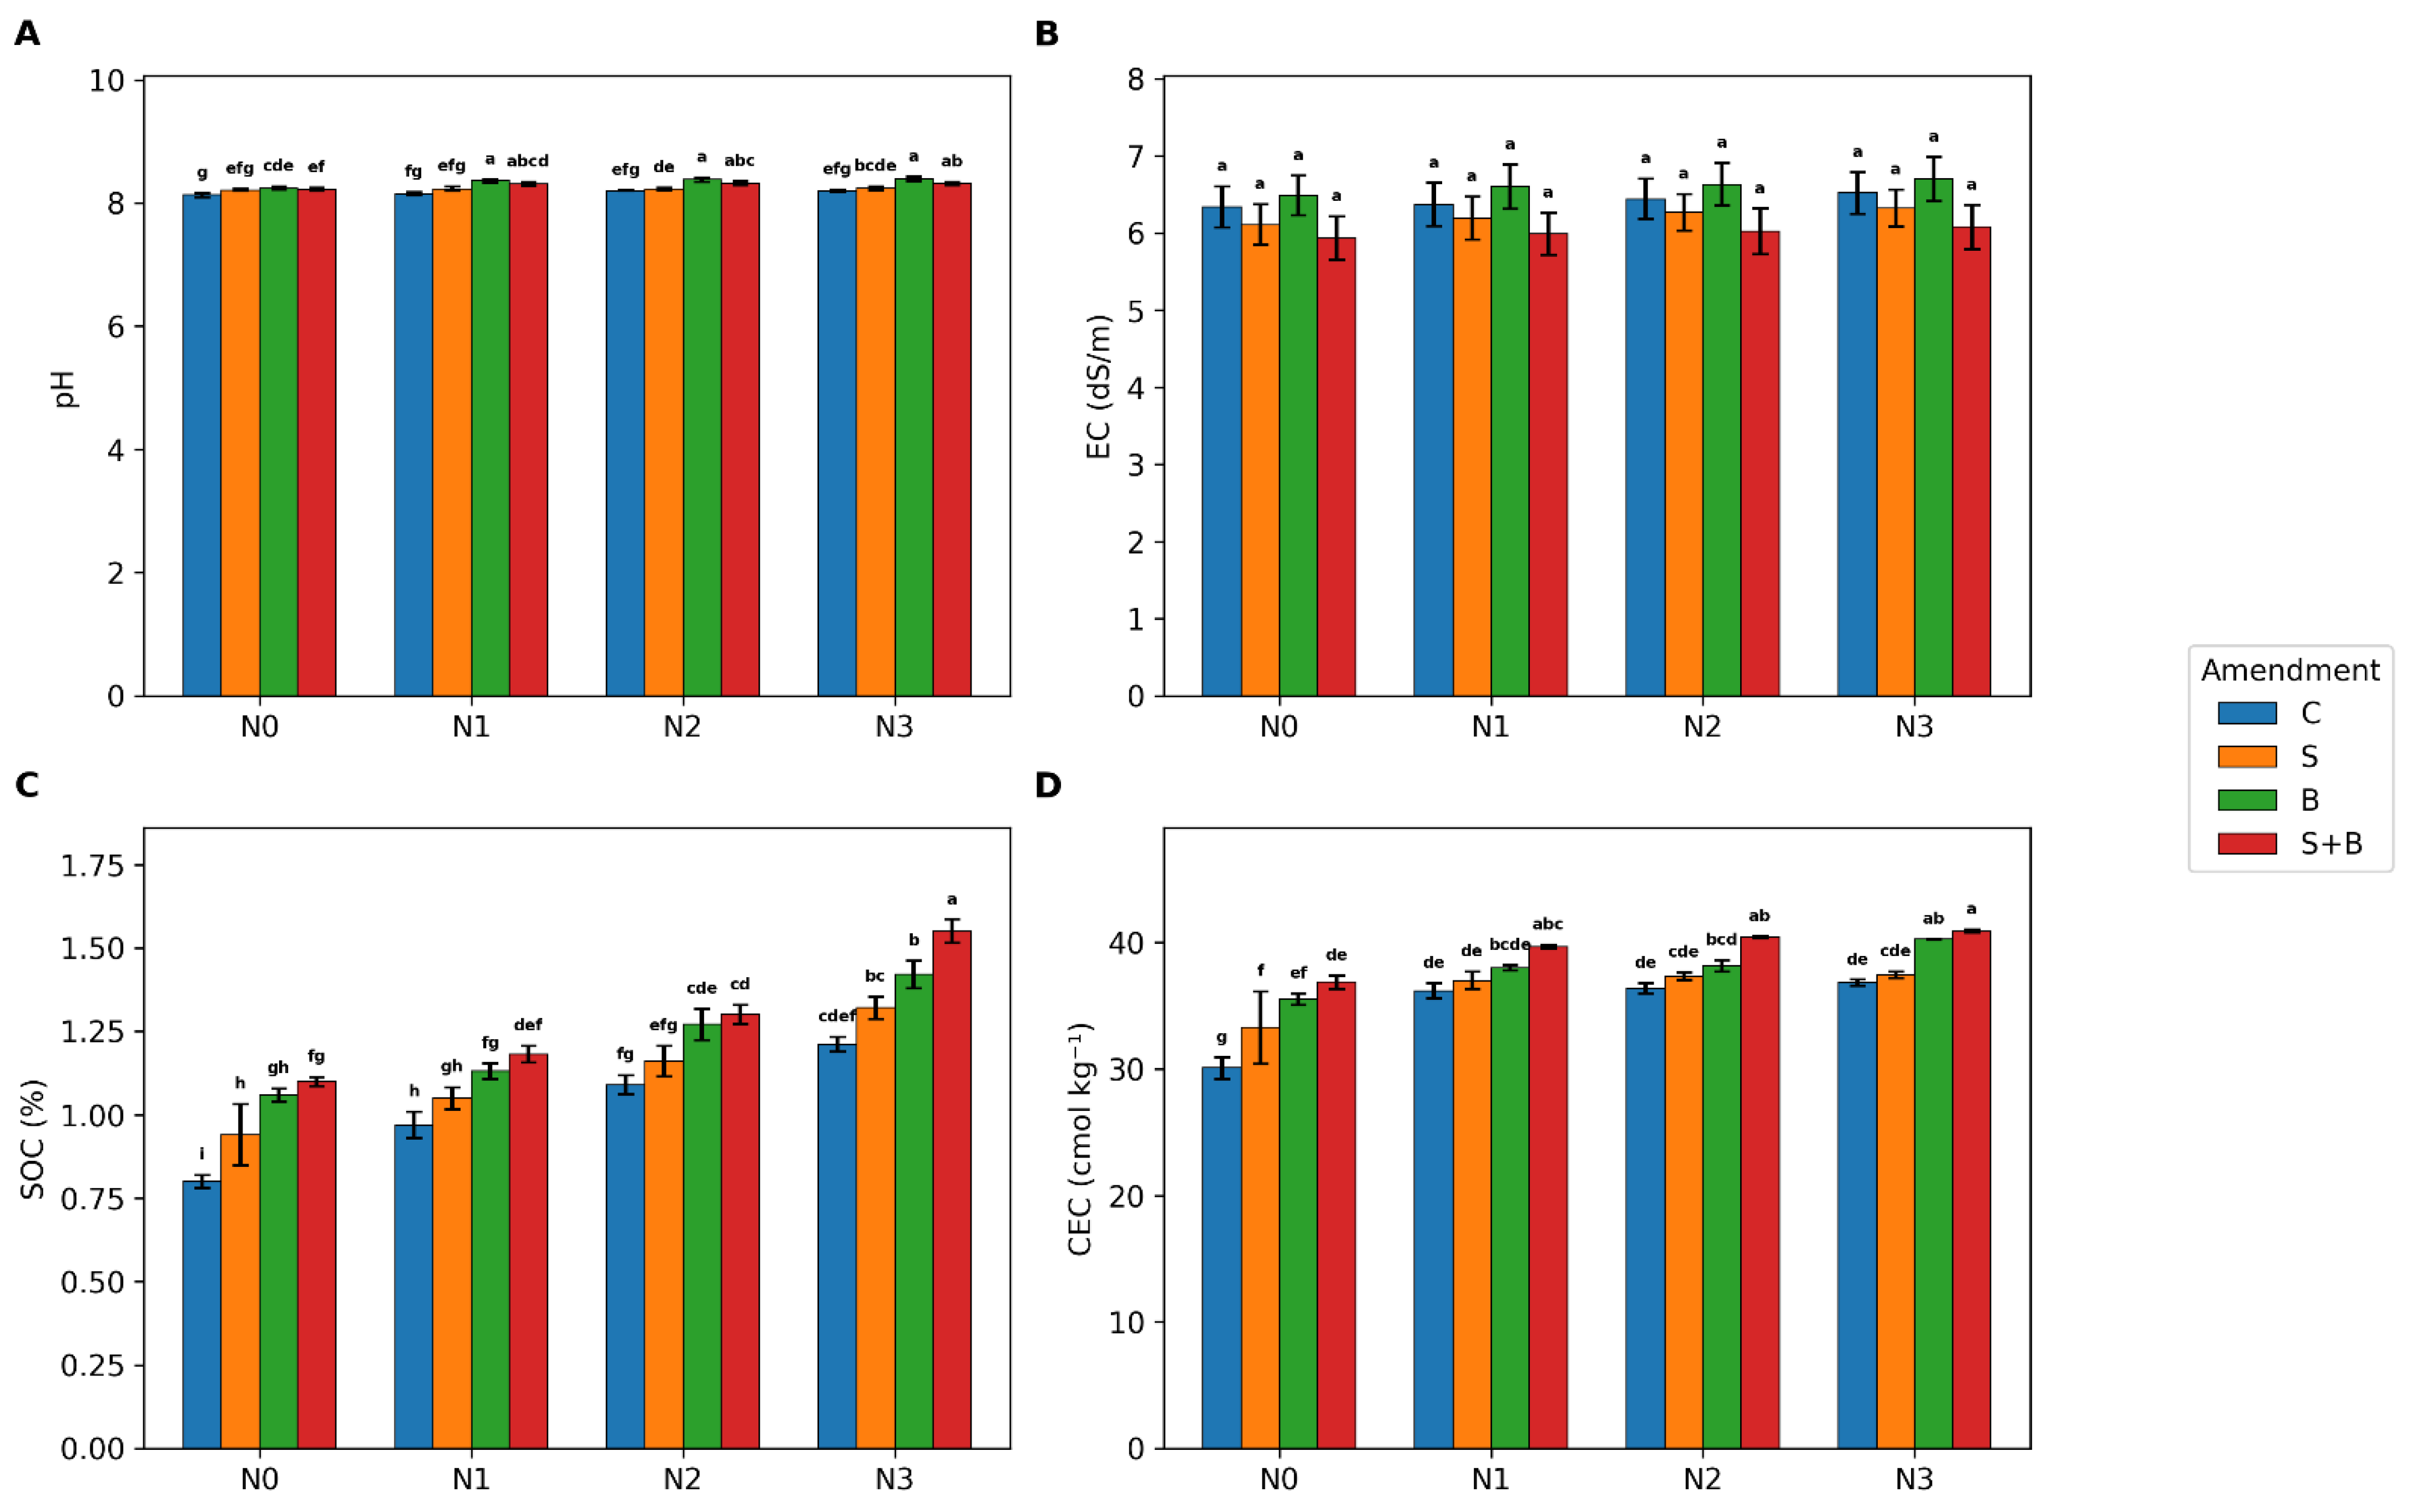
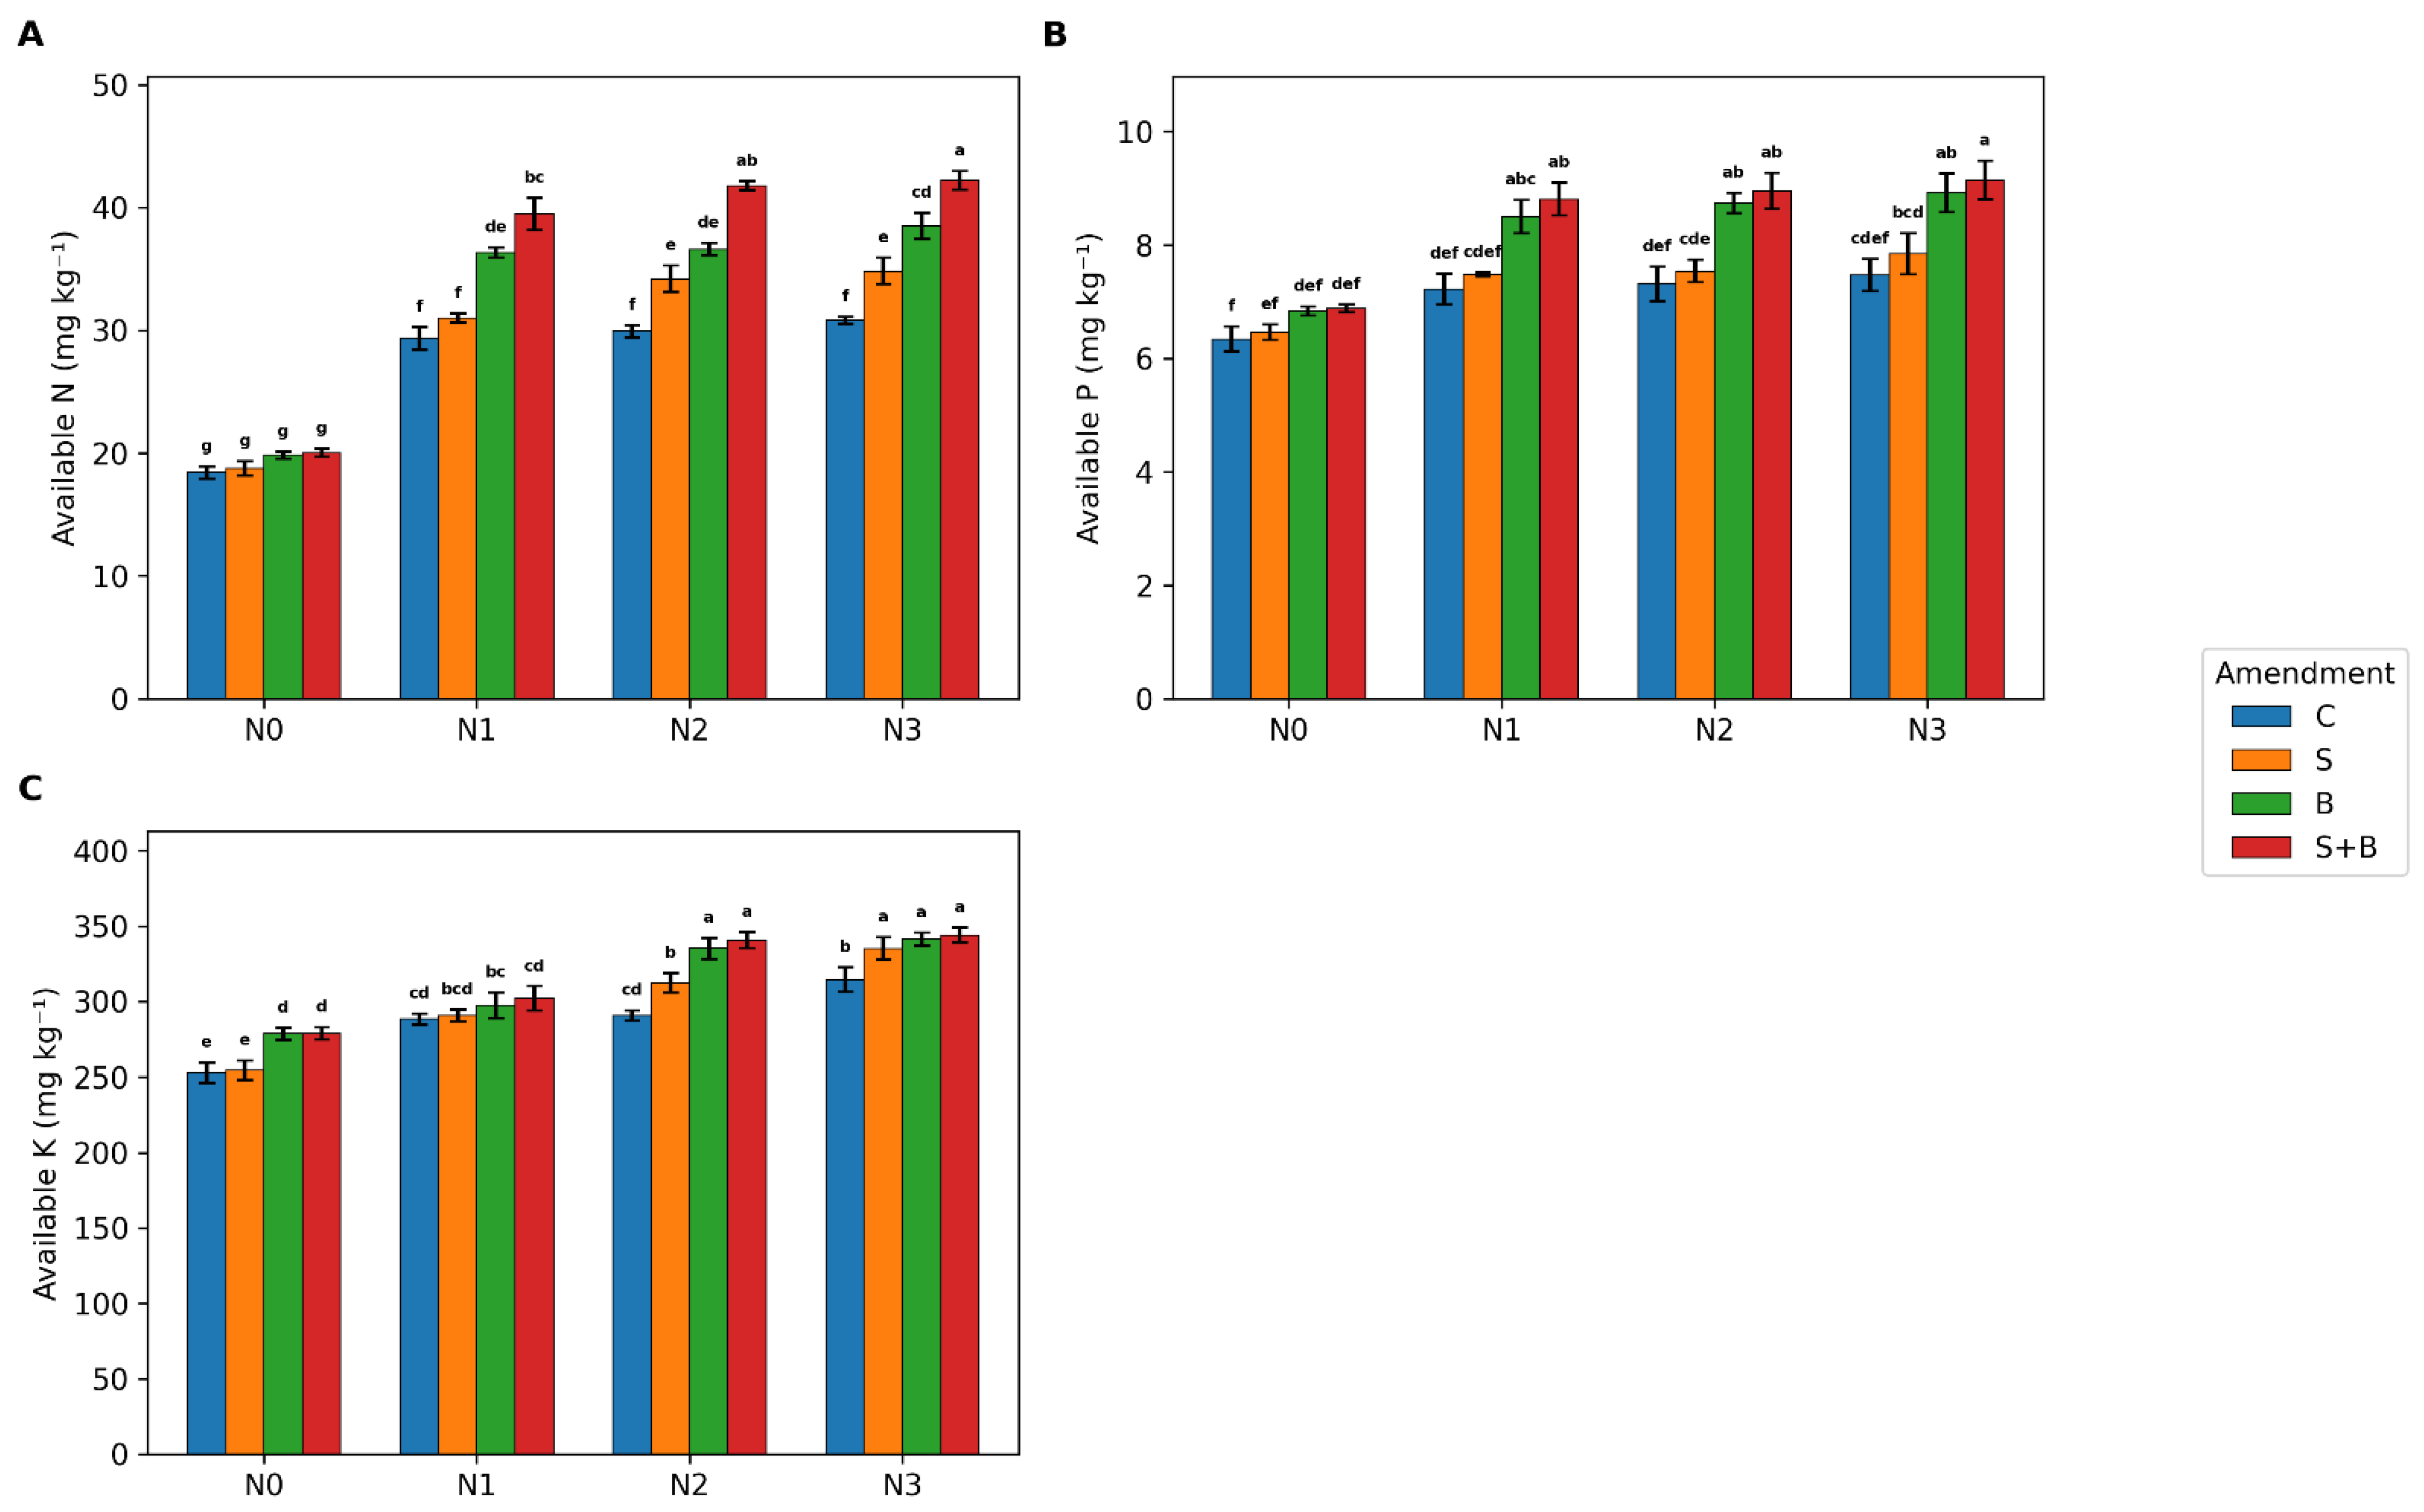
Nitrogen fertilization rates and amendment application (Table S1 and Figure 1 and Figure 2) had significant effects on soil chemical properties, including pH, electrical conductivity (EC), soil organic carbon (SOC), cation exchange capacity (CEC), and available N, P, and K across both seasons and in the combined analysis.
Figure 1.
Combined analysis for soil chemical properties, including (A) pH, (B) EC, (C) SOC, and (D) CEC under different treatments. N0%: 0; N1: 50%; N2: 75%; N3: 100% of the recommended rate of 168 kg N ha−1. C: no amendment; S: seaweed extract; B: biochar; S+B: biochar combined with seaweed extract. Bars represent mean ± standard deviation. Different letters indicate significant differences according to Tukey’s test at p ≤ 0.05.
Figure 2.
Combined analysis for the soil nutrients availability, including (A) N, (B) P, and (C) K under different treatments. N0%: 0; N1: 50%; N2: 75%; N3: 100% of the recommended rate of 168 kg N ha−1. C: no amendment; S: seaweed extract; B: biochar; S+B: biochar combined with seaweed extract. Bars represent mean ± standard deviation. Different letters indicate significant differences according to Tukey’s test at p ≤ 0.05.
Soil pH remained alkaline under all treatments, ranging from 8.14 to 8.43 in 2024 and from 8.12 to 8.34 in 2025 (Table S1). Reduced nitrogen levels (N0, N1, and N2) resulted in a slight decrease in pH (ΔpH = −0.01 to −0.07). The highest pH values (p ≤ 0.05) were consistently observed under the N3+B treatment in both seasons (8.43 and 8.34).
Combined analysis (Figure 1) showed that the biochar application significantly increased pH compared with mineral nitrogen alone. This effect was further enhanced by the combined application of biochar and seaweed extract (N0+S+B, N1+S+B, N2+S+B, and N3+S+B).
ECe showed no significant differences among treatments (p > 0.05) over both seasons and in the combined analysis, indicating that salinity levels were not strongly affected by amendments (Table S1 and Figure 1).
SOC increased markedly with nitrogen application and was further enhanced by biochar and seaweed extract (Table S1). Combined analysis showed that the N3+S+B treatment resulted in greater SOC (Figure 1), representing a 93.14% increase relative to the control (N0).
CEC followed a similar pattern to SOC. In both seasons, CEC values ranged from 32.31 to 40.64 cmol kg−1 in 2024 and 27.83 to 41.16 cmol kg−1 in 2025 (Table S1). In the combined analysis, the highest CEC was recorded under N3+S+B (40.90 cmol kg−1), followed by N2+S+B and N3+B (Figure 1). The lowest value was observed in N0 (30.07 cmol kg−1), whereas amendment application increased CEC by up to 4.2%.
Available nutrients were significantly influenced by treatments in both seasons (Table S2). In the combined analysis, available N was highest under N3+S+B (42.22 mg kg−1), with no significant difference compared with N2+S+B (Figure 2). Available P and K showed similar trends, with the highest values under N3+S+B and N2+S+B. Although some treatments showed numerically higher K values, differences were not statistically significant (p ≤ 0.05).
3.2. Wheat Traits and Yield
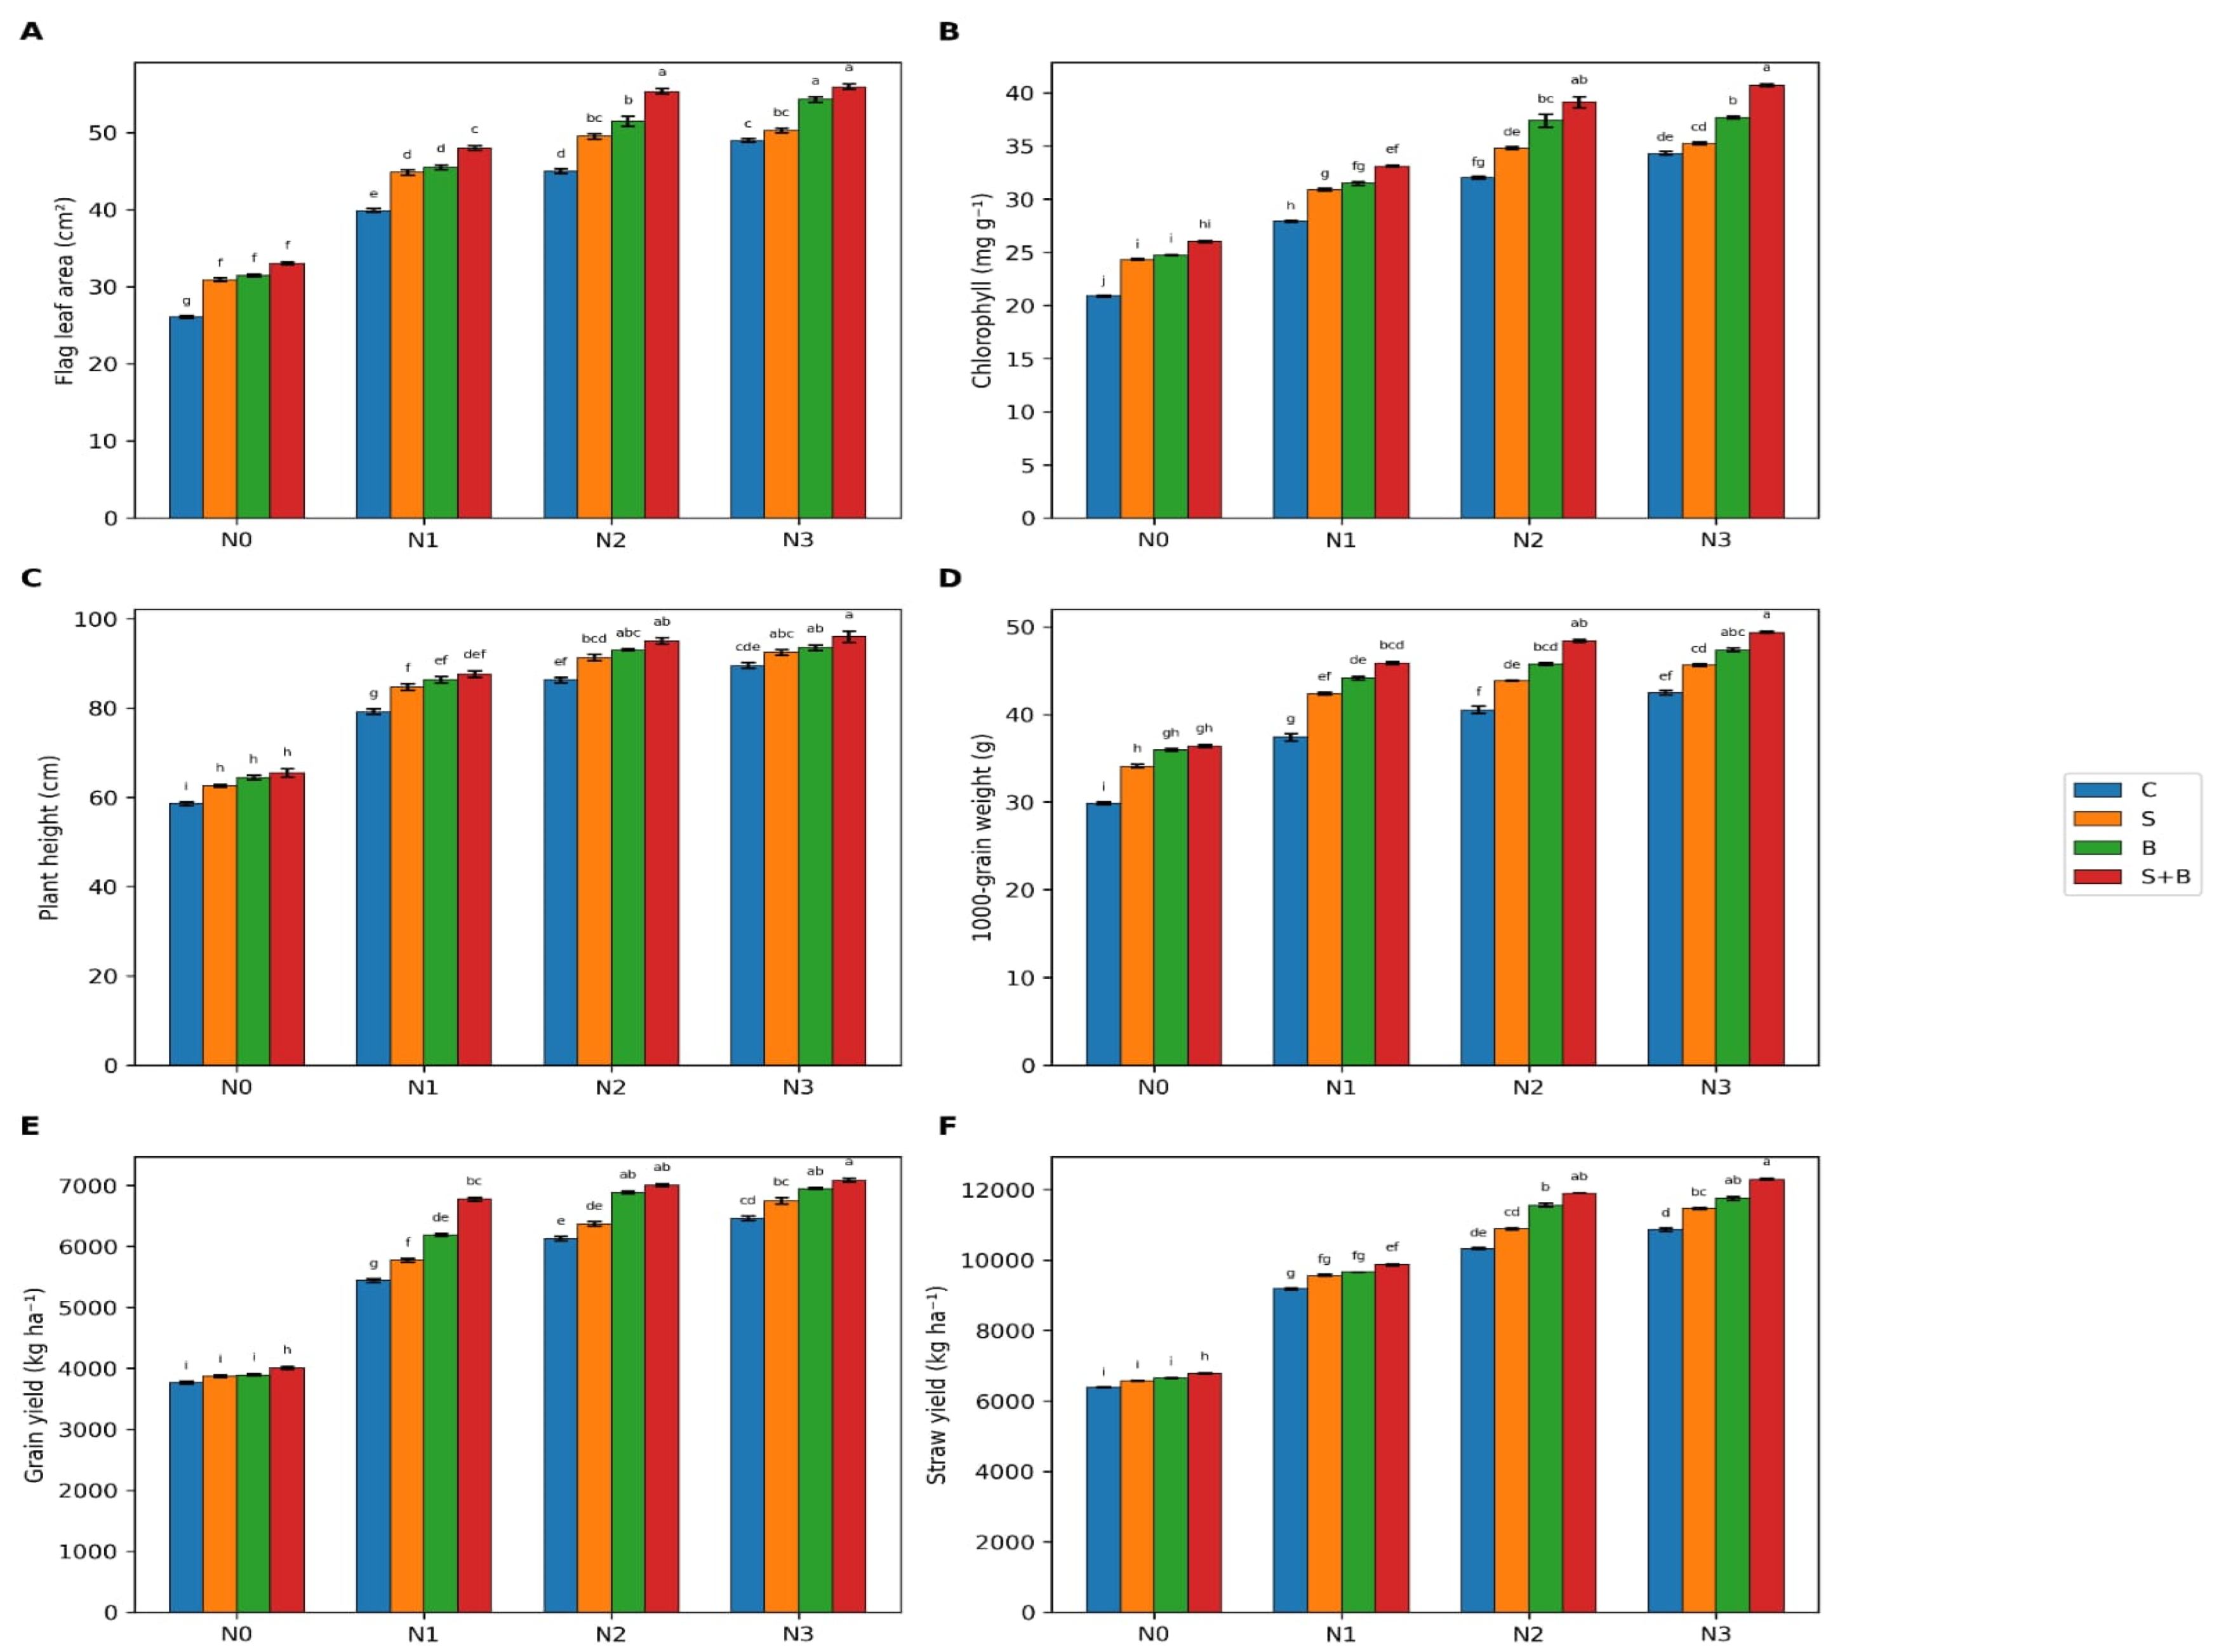
All growth and yield parameters were significantly affected (p ≤ 0.01) by treatments (Table S3 and Figure 3). A reduction in nitrogen application (N0–N2) resulted in proportional declines in growth and yield in both seasons. In contrast, combined treatments, particularly N3+S+B and N2+S+B, consistently improved plant performance (Table S3).
Figure 3.
Combined analysis for the wheat traits and yield under different treatments (A) flag leaf area, (B) chlorophyll content, (C) plant height, (D) 1000-grain weight, (E) grain yield, and (F) straw yield. N0%: 0; N1: 50%; N2: 75%; N3: 100% of the recommended rate of 168 kg N ha−1. C: no amendment; S: seaweed extract; B: biochar; S+B: biochar combined with seaweed extract. Bars represent mean ± standard deviation. Different letters indicate significant differences according to Tukey’s test at p ≤ 0.05.
In the combined analysis, flag leaf area increased with nitrogen level and amendment application (Figure 3). The lowest values were observed in N0 (26.11 cm2), while the highest values were recorded under N3+S+B (55.93 cm2). Treatments N2+S+B and N3+B produced comparable values and were significantly higher than N3 alone.
Chlorophyll content followed a similar trend, with the highest values under N3+S+B (40.70 mg g−1 FW) and N2+S+B (39.13 mg g−1 FW). The lowest value was recorded in N0 (20.87 mg g−1 FW).
Plant height ranged from 57.53 cm in N0 to 95.95 cm in N3+S+B (Figure 3). N2+S+B and N3+B showed statistically comparable values to N3+S+B.
Thousand-grain weight was significantly improved by biochar and seaweed application. The highest values were observed under N3+S+B and N2+S+B (49.38 g and 48.40 g, respectively), while the lowest was recorded in N0 (29.87 g).
Grain yield ranged from 3846 to 7057 kg ha−1 in 2024 and from 3685 to 7115 kg ha−1 in 2025 (Table S3). In the combined analysis, the highest yield was recorded under N3+S+B (7085.75 kg ha−1). Treatments N2+S+B, N3+B, and N2+B were statistically comparable to N3+S+B (Figure 3).
Straw yield followed a similar pattern, with the highest value under N3+S+B and the lowest under N0. Overall, combined treatments significantly enhanced total biomass compared with nitrogen-only treatments (Figure 3).
3.3. Total Nutrients Uptake
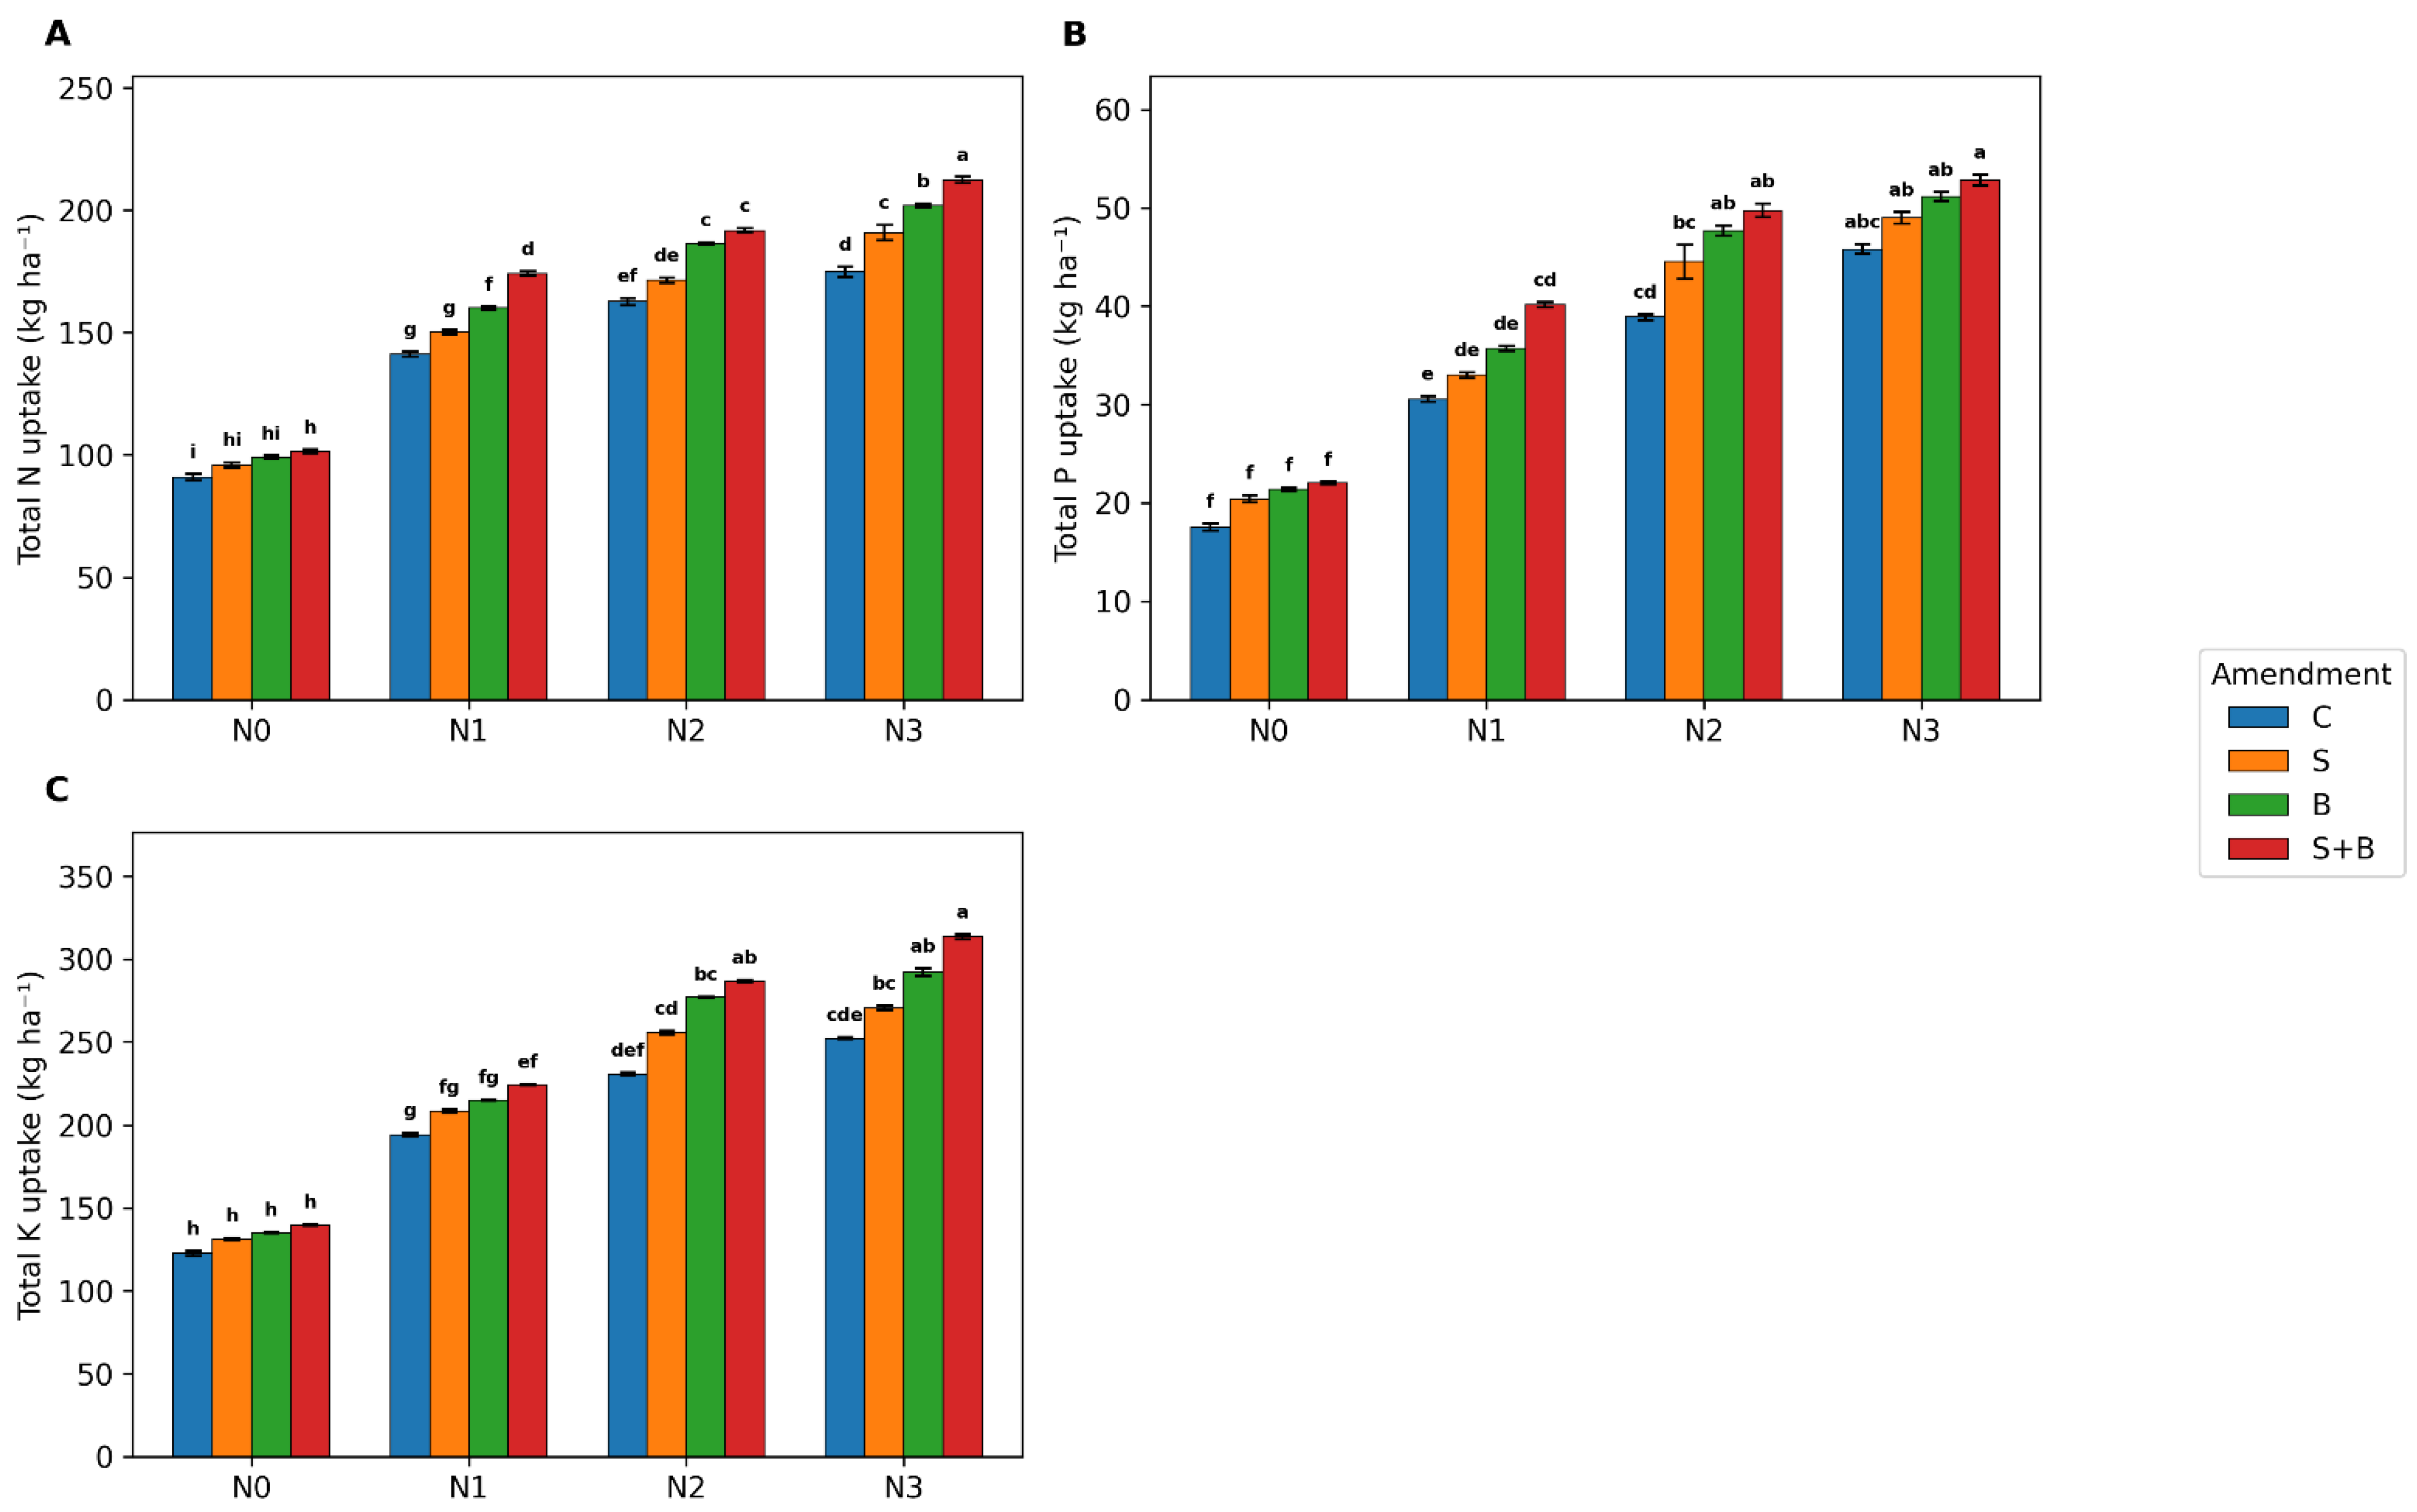
Total uptake of N, P, and K differed significantly among treatments (p ≤ 0.01) (Table S4; Figure 4).
Figure 4.
Combined analysis for the total nutrient uptake under different treatments. (A), total N uptake, (B) total P uptake, and (C) total K uptake. N0%: 0; N1: 50%; N2: 75%; N3: 100% of the recommended rate of 168 kg N ha−1. C: no amendment; S: seaweed extract; B: biochar; S+B: biochar combined with seaweed extract. Bars represent mean ± standard deviation. Different letters indicate significant differences according to Tukey’s test at p ≤ 0.05.
In both seasons, nutrient uptake increased with nitrogen application and was further enhanced by biochar and seaweed extract (Table S4). The highest N, P, and K uptake values were consistently observed under N3+S+B, followed by N3+B and N2+S+B. In contrast, reduced nitrogen treatments without amendments showed pronounced declines in nutrient uptake.
In the combined analysis, total N uptake ranged from 90.96 kg ha−1 in N0 to 212.36 kg ha−1 in N3+S+B with an increase of 133.5% (Figure 4). Total P and K uptake showed similar patterns, increasing by 201.2% and 155.6%, respectively. Differences among some high-performing treatments were not statistically significant (p ≤ 0.05).
3.4. Nutrient Use Efficiency Indices
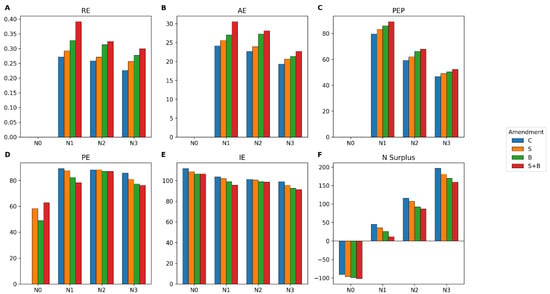
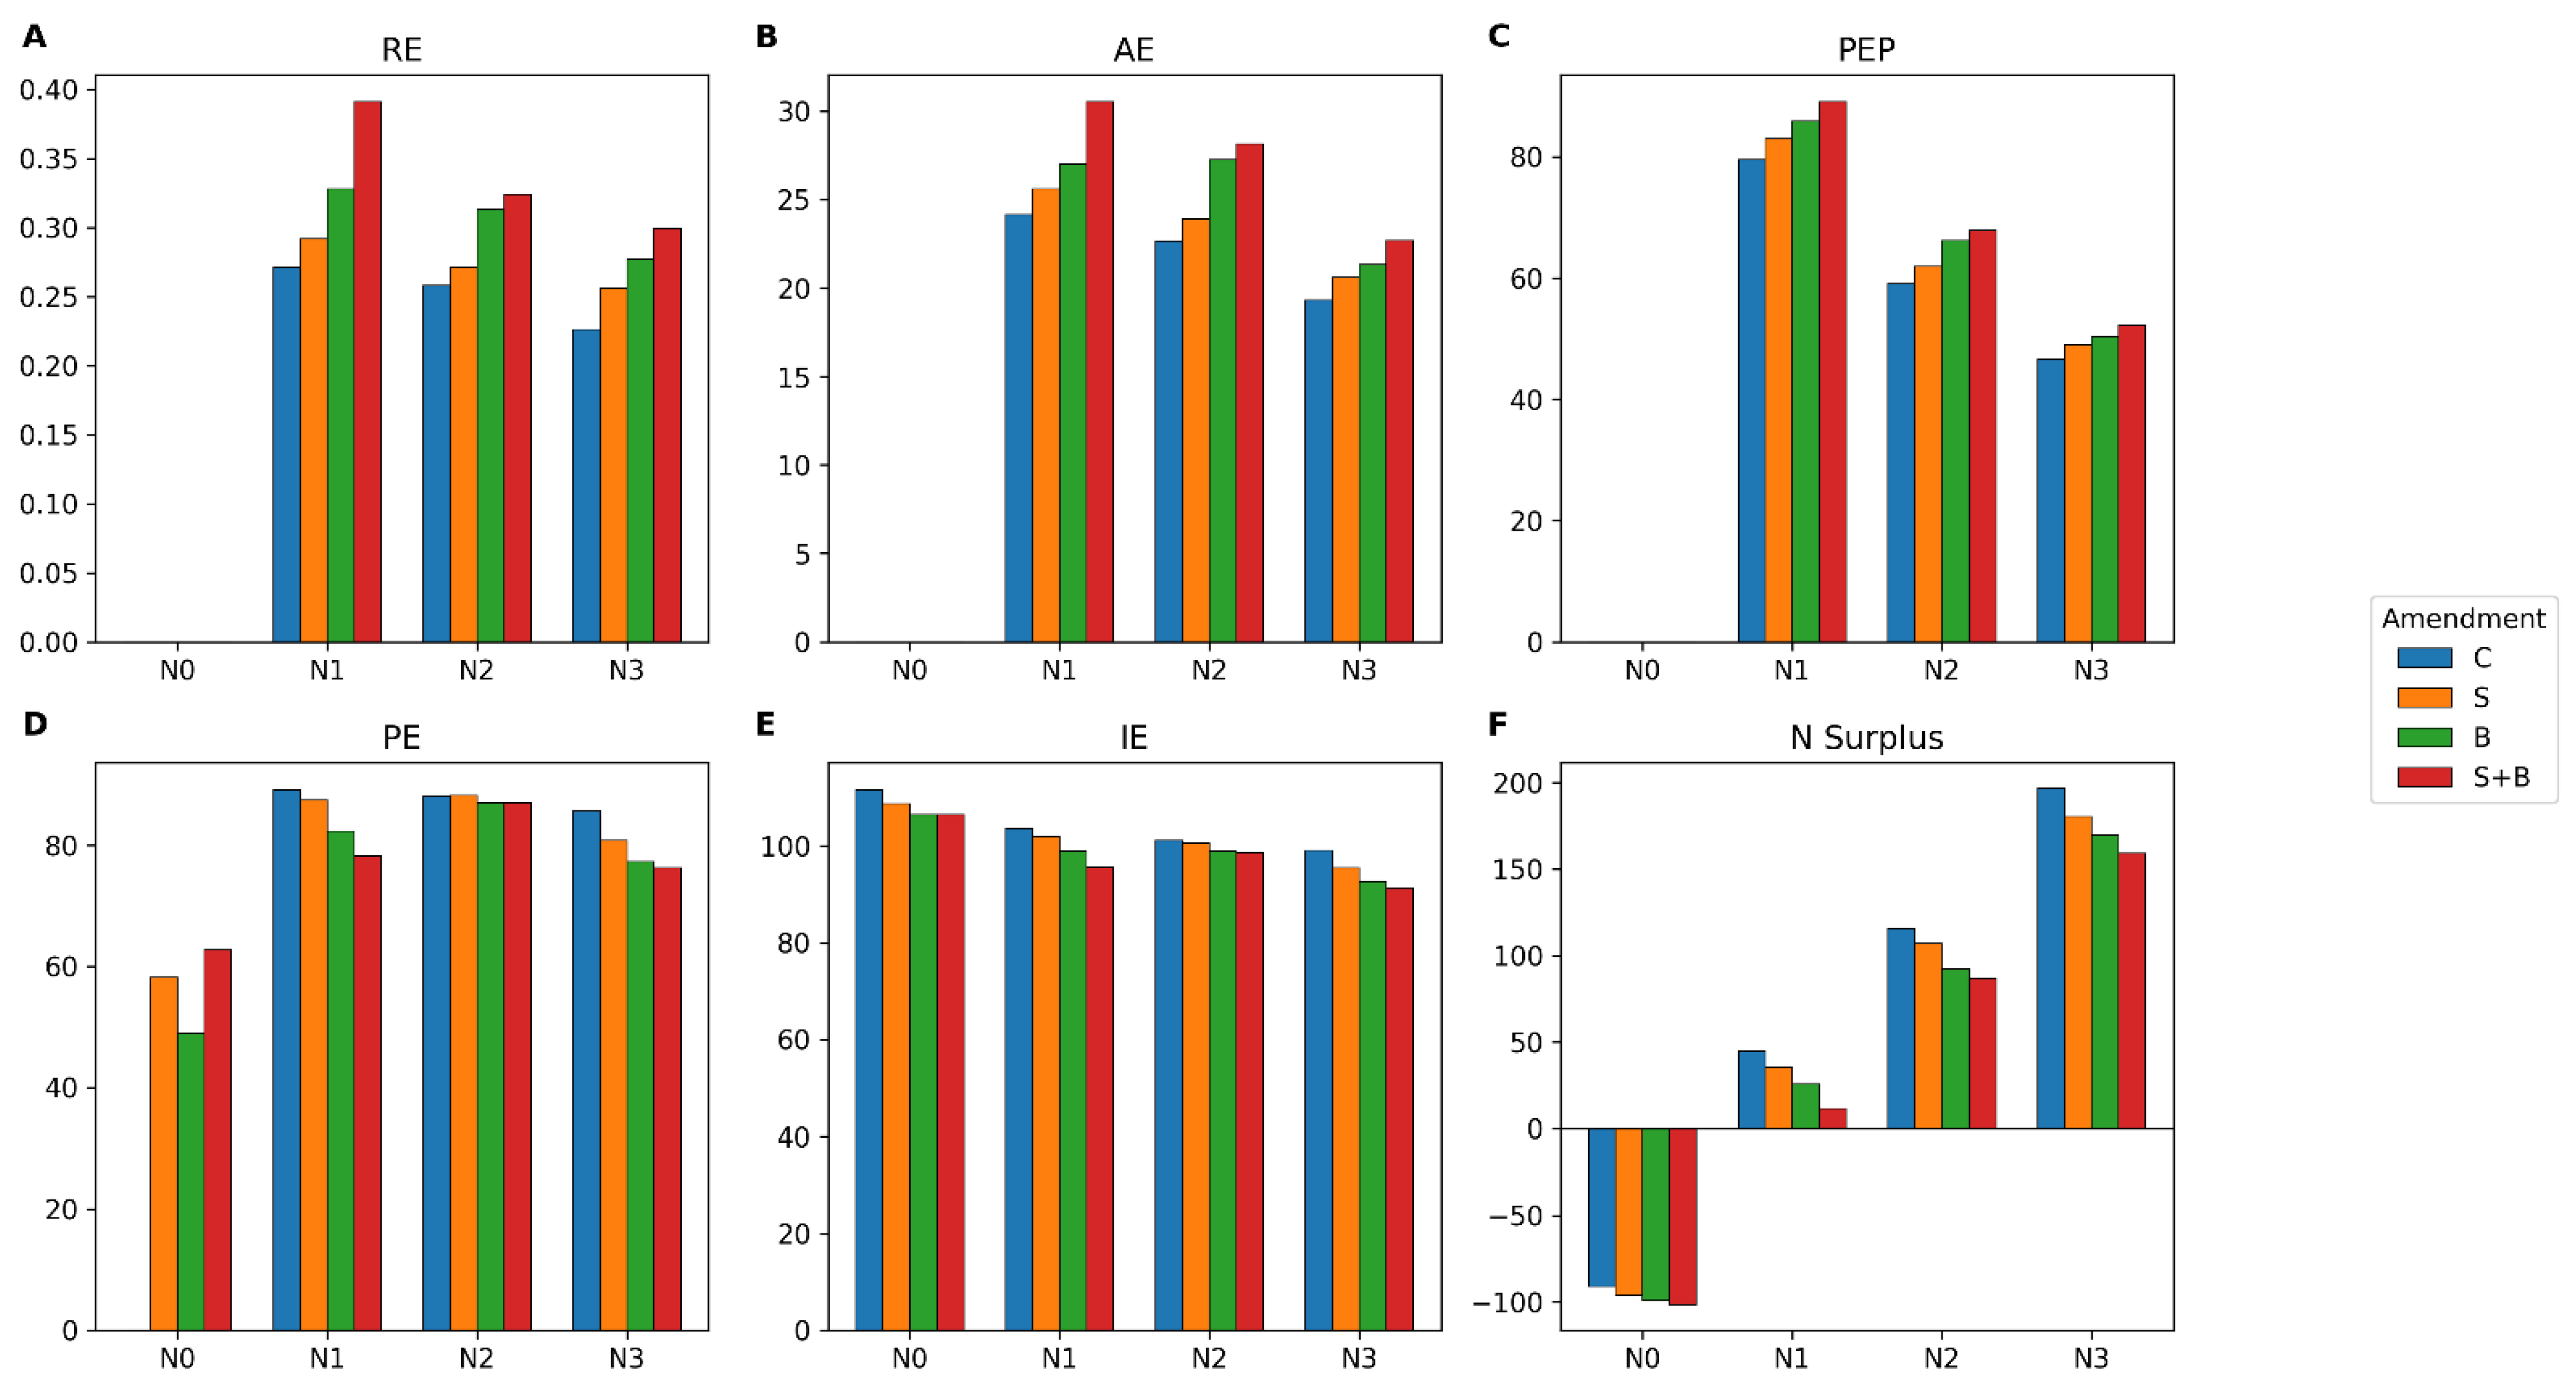
Nitrogen use efficiency (NUE) indices were significantly affected by nitrogen rate and amendment application (Table S5; Figure 5).
Figure 5.
Combined analysis for the nutrient use efficiency indices, including (A) recovery efficiency (RE), (B) agronomic efficiency (AE), (C) partial factor productivity (PEP), (D) physiological efficiency (PE), (E) internal efficiency (IE), and (F) nitrogen surplus under different treatments. N0%: 0; N1: 50%; N2: 75%; N3: 100% of the recommended rate of 168 kg N ha−1. C: no amendment; S: seaweed extract; B: biochar; S+B: biochar combined with seaweed extract. Bars represent mean ± standard deviation.
Overall, NUE indices were highest under moderate nitrogen levels combined with biochar and seaweed extract, indicating a trade-off between yield maximization and nutrient-use efficiency. Reduced nitrogen treatments generally showed higher efficiency (Table S5).
In the combined analysis, recovery efficiency (RE) was highest under N1+S+B (0.391 kg kg−1) and N2+S+B (0.324 kg kg−1). Agronomic efficiency (AE) showed a similar trend, with maximum values under N1+S+B (30.52 kg kg−1) and N2+S+B (28.15 kg kg−1). Partial factor productivity (PFP) was also highest under reduced nitrogen treatments with amendments (Figure 5). In contrast, RE, AE, and PFP declined under full nitrogen application (N3).
Physiological efficiency (PE) decreased with increasing nitrogen application. Although N3+S+B improved yield, its PE (76.20 kg kg−1) remained lower than that of N1+S+B and N2+S+B (Figure 5).
Nitrogen surplus increased with nitrogen rate but was reduced by biochar and seaweed extract (Figure 5). The highest surplus was recorded in N3 (196.57 kg ha−1), while the lowest values were observed in N1+S+B (11.57 kg ha−1) and N2+S+B (86.81 kg ha−1), indicating improved nitrogen utilization.
Internal efficiency (IE) was highest under N0 (111.58 kg kg−1) and decreased with increasing nitrogen application, reaching 91.29 kg kg−1 under N3+S+B (Figure 5).
3.5. Principal Component Analysis
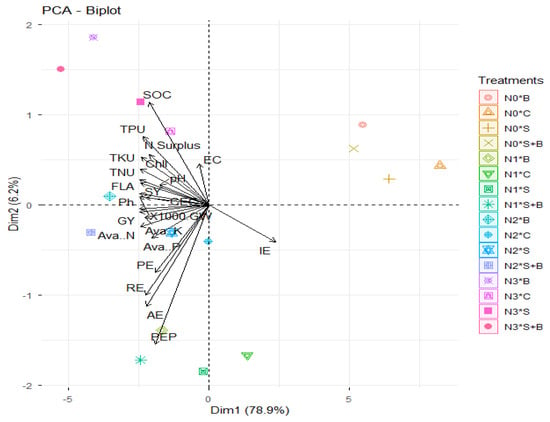
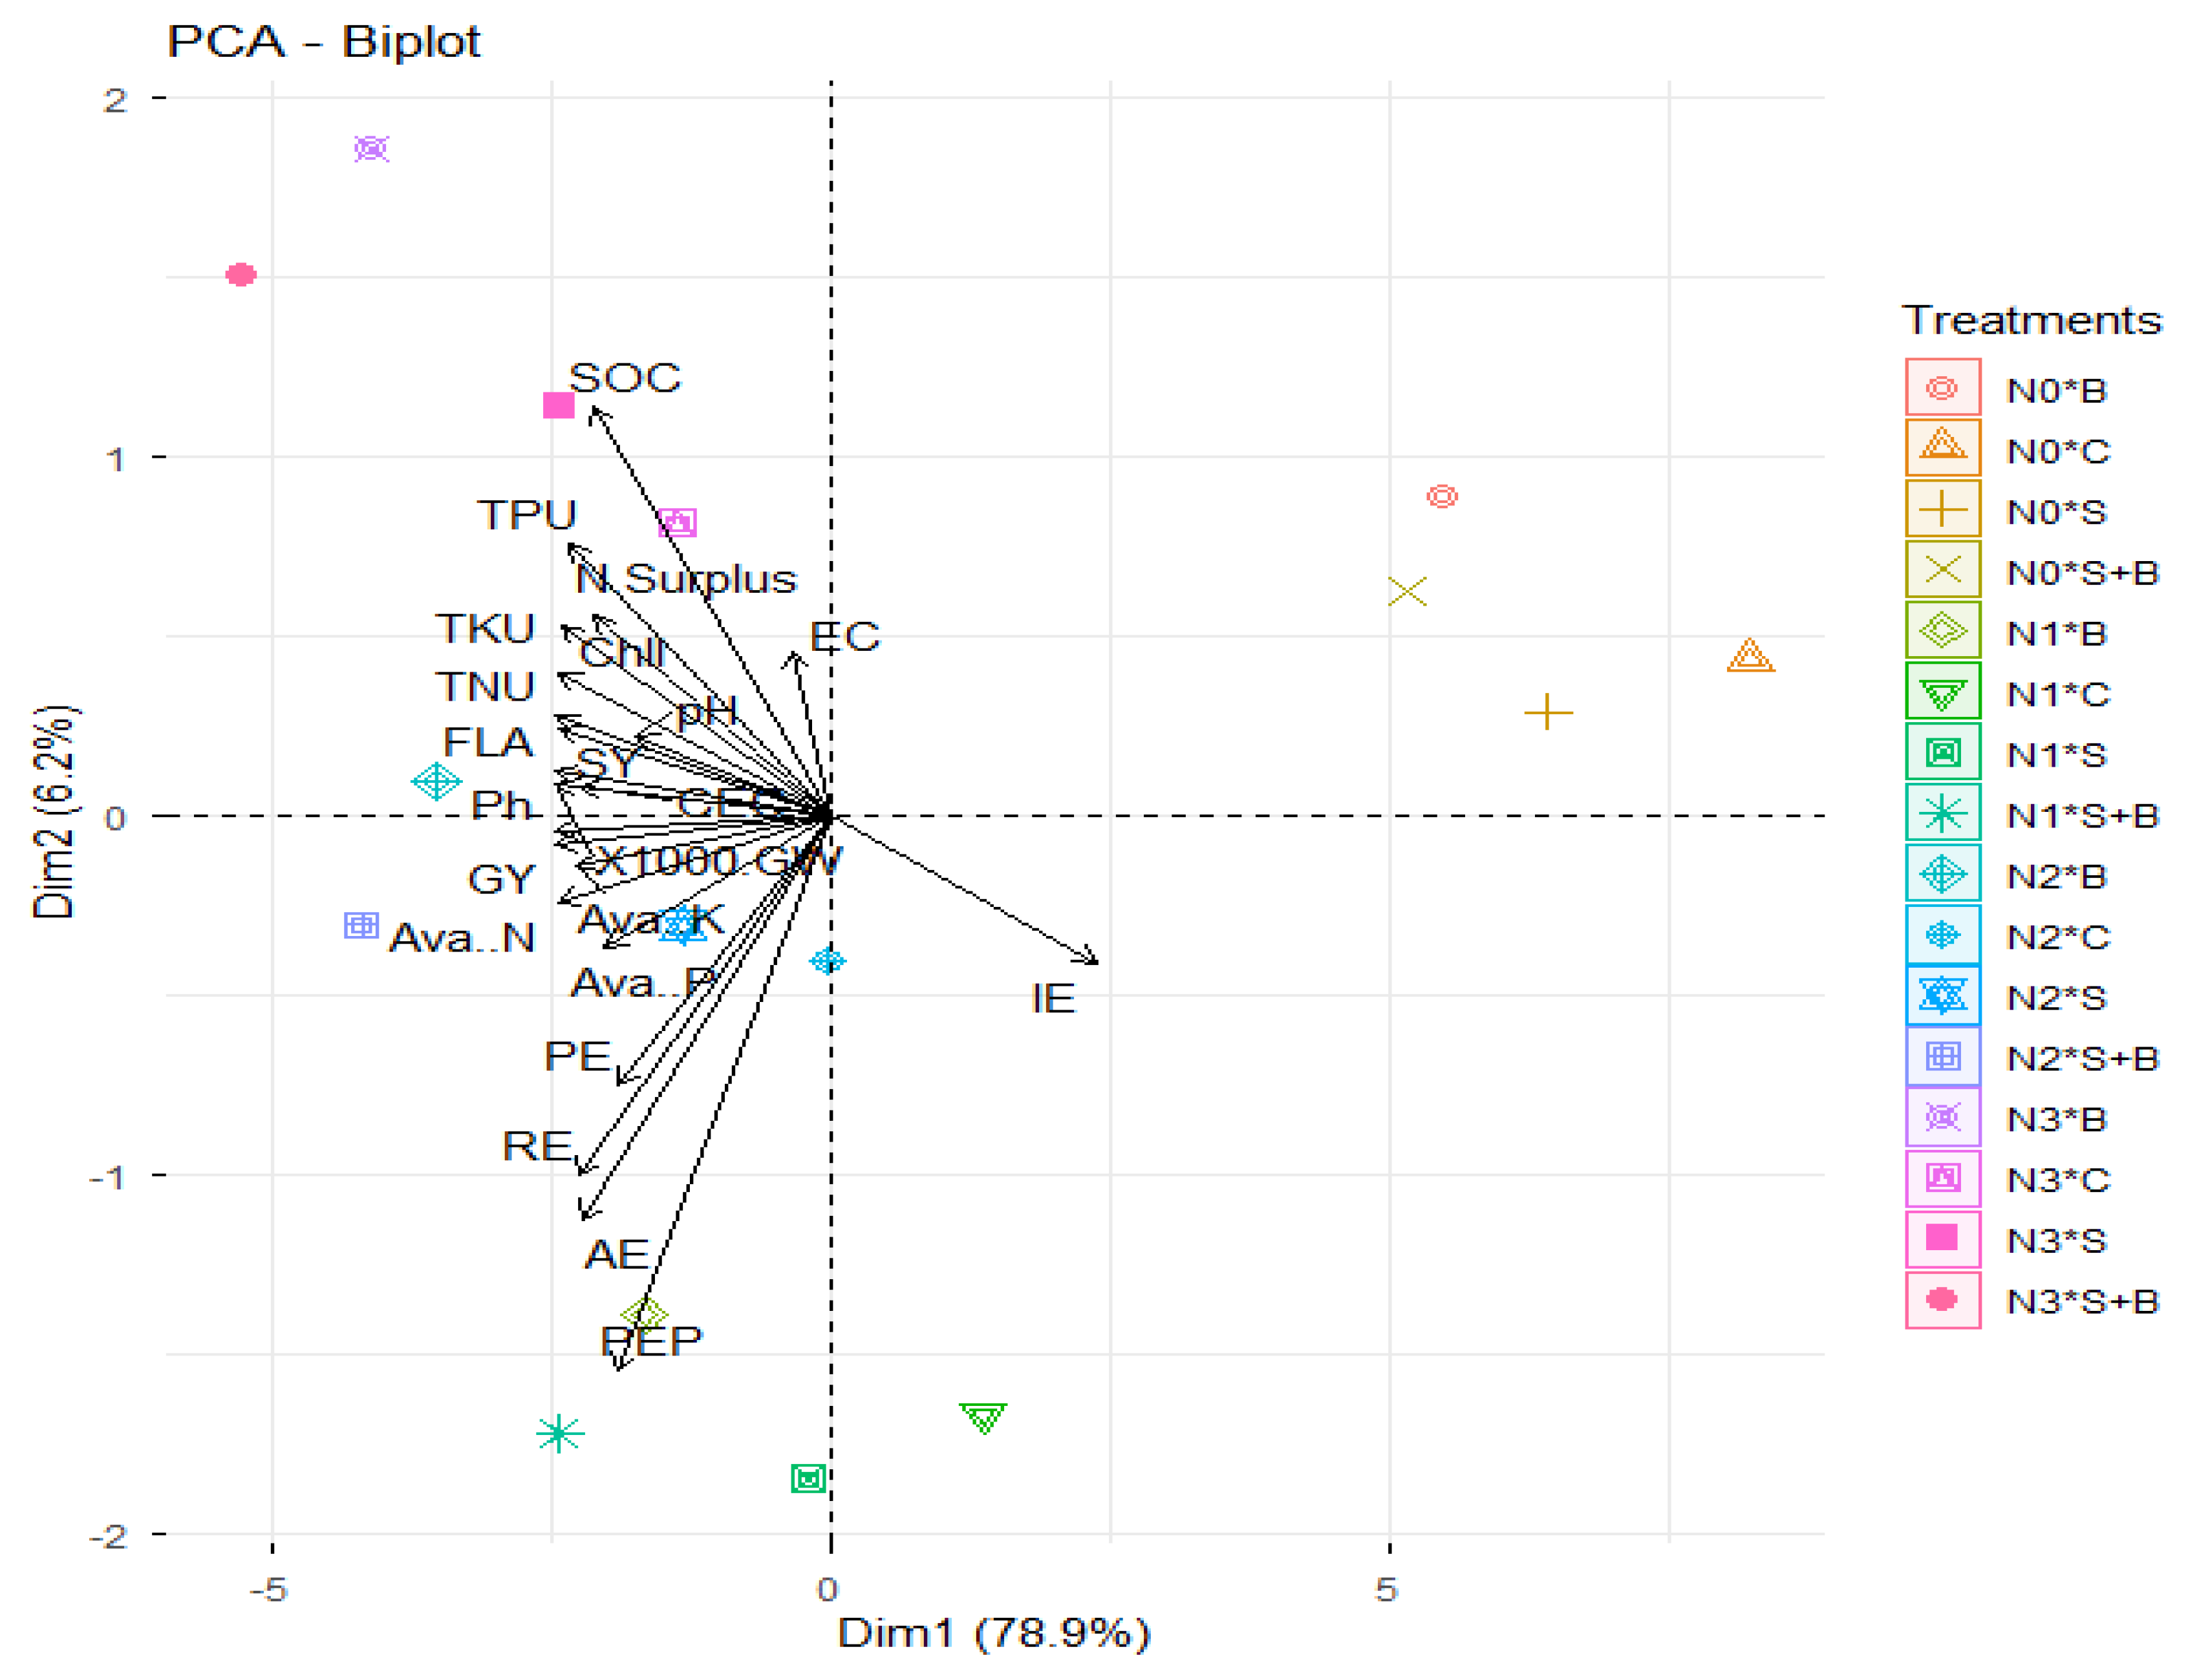
Principal component analysis (PCA) explained 85.1% of total variation, with PC1 and PC2 accounting for 78.9% and 6.2%, respectively (Figure 6).
Figure 6.
Multivariate analysis of soil properties, crop yield, and nitrogen use efficiency under different treatments.
The biplot clearly separated the measured variables into two contrasting groups along Dim1. Soil chemical properties, including soil organic carbon (SOC), cation exchange capacity (CEC), and available N, P, and K, together with total nutrient uptake (TNU, TPU, TKU) and yield-related traits (e.g., grain yield and growth parameters), were clustered on the negative side of Dim1. This clustering indicates strong positive associations among soil fertility indicators, nutrient uptake, and crop productivity.
In contrast, internal efficiency (IE) was positioned on the positive side of Dim1, indicating an inverse relationship with soil fertility and productivity-related traits. This suggests a trade-off between nutrient-use efficiency and yield-driven performance.
Treatment distribution followed a similar pattern. High-input and amendment-integrated treatments were located on the negative side of Dim1, closely associated with improved soil properties, nutrient uptake, and yield performance. N3+S+B showed a strong association with nutrient uptake and yield variables, indicating superior agronomic performance. The N2+S+B treatment was positioned near this cluster, suggesting comparable effectiveness despite reduced nitrogen input. Conversely, low-input treatments (e.g., N0 and N1 without amendments) were located on the positive side of Dim1, closely associated with higher internal efficiency, reflecting a shift toward nutrient-use efficiency rather than productivity.
Dim2 contributed relatively little to the overall variation but provided additional separation among variables. Soil organic carbon and electrical conductivity were oriented toward the positive side of Dim2, whereas efficiency indices such as agronomic efficiency (AE) and recovery efficiency (RE) were oriented negatively, indicating minor secondary differences in soil condition and nutrient efficiency responses among treatments.
4. Discussion
The combined application of biochar and seaweed extract substantially enhanced wheat growth, yield, nutrient uptake, and nitrogen use efficiency under saline soil conditions, even with reduced nitrogen inputs. Soil salinity is a major constraint in the Nile Delta and similar arid regions, where it restricts water availability, disrupts ionic balance, limits nutrient acquisition, ultimately reducing crop productivity [2,3,4,5]. Wheat responses under such conditions typically reflect reduced photosynthetic capacity and impaired nitrogen metabolism [6]. In this context, the observed improvements under integrated treatments are primarily attributed to enhanced soil fertility and improved plant nutrient acquisition rather than direct physiological confirmation of salinity stress alleviation.
The application of these amendments significantly influenced soil chemical properties under saline conditions. However, since this study did not directly measure Na+, Cl−, or physiological stress markers, any interpretation related to salinity mitigation should be considered indirect, based on improvements in soil fertility indicators and plant performance.
Soil pH remained alkaline across all treatments, consistent with typical clay soils of the Nile Delta [4]. Treatments combining biochar with nitrogen and seaweed extract (particularly N3+B and N3+S+B) exhibited slightly higher pH values compared with the control and reduced nitrogen treatments (N0–N2), reflecting the liming effect of biochar [39].
Although minor increases in electrical conductivity (EC) were observed in S+B treatments, these differences were not statistically significant (p > 0.05), indicating that salinity levels remained relatively stable and were unlikely to be the primary driver of treatment responses.
Soil organic carbon (SOC) and cation exchange capacity (CEC) increased with nitrogen application and were further enhanced by biochar and seaweed amendments. This is consistent with previous findings showing that biochar improves soil structure, nutrient retention, and carbon stabilization [15,38,40]. The combine effects of biochar and seaweed on SOC and CEC are likely mediated through enhanced microbial activity and improved organic matter dynamics [26,27,28,29,30], which are particularly important in saline soils where nutrient availability is often restricted [6].
Available N, P, and K were significantly affected by treatment, particularly N3+S+B, N3+B and N2+S+B consistently recording the highest values and Importantly, combined biochar and seaweed treatments maintained relatively high nutrient availability even under reduced nitrogen rates, demonstrating their capacity to enhance nutrient retention and mitigate nutrient limitations associated with salinity [7,11,19].
Wheat growth parameters, including flag leaf area, chlorophyll content, and plant height, responded positively to biochar and seaweed amendments. Treatments N3+S+B and N2+S+B produced significantly larger flag leaf areas and higher chlorophyll content than other treatments. These results align with previous reports that biochar and seaweed extracts stimulate chlorophyll synthesis, biomass accumulation, and stress tolerance under saline conditions [41,42,43,44].
Grain and straw yields were significantly improved by integrated treatments. Although the highest yield was recorded under N3+S+B, this treatment was not significantly different from several other integrated treatments, particularly those involving reduced nitrogen (N2+S+B). This indicates that a 25% reduction in nitrogen input can be achieved without statistically significant yield loss when combined with biochar and seaweed extract. However, this does not imply full substitution of nitrogen fertilizer, but rather improved nitrogen use efficiency under integrated management. This demonstrates that integrated treatments can partially substitute for nitrogen fertilizer, consistent with reports that seaweed and biochar can sustain yields while reducing N input by up to 25–33% [29,42]. Reduced nitrogen inputs without treatments (N0–N2) resulted in significant yield declines, confirming that sufficient nutrient supply remains essential under saline conditions.
Total nutrient uptake (N, P, K) was significantly enhanced by the combined application of biochar and seaweed extracts. Notably, N2+S+B achieved nitrogen uptake comparable to or exceeding those of full nitrogen treatments (N3), suggesting improved root activity, nutrient retention, and soil–plant interactions [20,26,27,28,29,30].
Nitrogen use efficiency indices (RE, AE, PFP, and PE) further confirmed that moderate nitrogen levels combined with amendments optimize efficiency. While N3+S+B produced the highest yield, its nitrogen use efficiency was lower than reduced-N treatments, reflecting the well-established trade-off between yield maximization and nitrogen efficiency [38,42]. Internal efficiency (IE) declined with increasing N rates, further supporting this pattern.
The reduction in nitrogen surplus under integrated treatments indicates improved nitrogen utilization efficiency and potentially reduced environmental losses, including leaching and volatilization [18,19,20]. These improvements are likely due to enhanced nutrient retention in soil (via increased CEC from biochar) and improved plant nutrient acquisition efficiency promoted by seaweed-derived bioactive compounds [26,27,28,29,30,42,43,44,45,46].
PCA results confirmed strong associations between soil fertility indicators, nutrient uptake, and yield-related traits. High-input integrated treatments clustered with improved soil and productivity variables, with N3+S+B showing the strongest overall performance. However, the close proximity of N2+S+B to this cluster suggests that similar agronomic performance can be achieved with reduced nitrogen input, supporting improved efficiency rather than yield maximization alone.
Overall, the combined application of biochar and seaweed extract under reduced nitrogen input represents a promising strategy to improve wheat productivity and nitrogen use efficiency under saline conditions. This approach enhances soil fertility, improves nutrient availability, and supports more efficient nutrient use, thereby reducing dependence on chemical fertilizers and improving sustainability in arid environments.
However, this study has limitations. Direct measurements of salinity-related ions (Na+, Cl−) and physiological stress indicators were not conducted; therefore, conclusions regarding salinity stress mitigation remain indirect. In addition, biochar was applied only during the first season, and although residual effects were observed, long-term multi-season and multi-location studies are required to confirm the persistence and stability of these benefits.
5. Conclusions
The combined application of biochar and seaweed extract improved wheat growth, yield, nutrient uptake, and soil fertility under saline conditions by increasing soil organic carbon, cation exchange capacity, and NPK availability. Although the highest grain yield was recorded under 100% N with amendments, it was not significantly different from several integrated treatments, especially 75% N + biochar + seaweed extract. Importantly, this reduced-N treatment improved nitrogen use efficiency while maintaining yield, indicating a trade-off between yield maximization and nutrient efficiency. Overall, reducing nitrogen input by up to 25% is feasible when these amendments are applied, without significant yield loss under the studied conditions. However, stronger claims about salinity stress mitigation cannot be made due to the lack of direct physiological measurements. These findings support biochar and seaweed extract as promising tools for improving nutrient management and sustainability in saline soils, though long-term studies are still needed.
Supplementary Materials
The following supporting information can be downloaded at: https://www.mdpi.com/article/10.3390/su18094612/s1. Table S1: Effect of different treatments on soil pH, EC, SOC and CEC after wheat harvesting in 2024 and 2025; Table S2: Effect of different treatments on Soil N, P, and K availability after wheat harvesting in 2024 and 2025; Table S3: Effect of different treatments on wheat traits and yield after harvesting in 2024 and 2025; Table S4: Effect of different treatments on total nutrient uptake by wheat plants after harvesting in 2024 and 2025; Table S5: Effect of different treatments on nutrient use efficiency indices after harvesting in 2024 and 2025.
Author Contributions
Conceptualization, M.S.E., E.-S.H.E.-S., A.-M.S., A.E.-D.O., E.M.S. and T.H.K.; methodology, M.S.E., E.-S.H.E.-S., A.-M.S., A.E.-D.O., E.M.S. and T.H.K.; software, T.H.K.; validation, M.S.E. and T.H.K.; formal analysis, M.S.E., E.-S.H.E.-S., A.-M.S., A.E.-D.O., E.M.S. and T.H.K.; investigation, M.S.E., E.-S.H.E.-S., A.-M.S., A.E.-D.O., E.M.S. and T.H.K.; resources, M.S.E., E.-S.H.E.-S., A.-M.S., A.E.-D.O., E.M.S. and T.H.K.; writing—review and editing, E.-S.H.E.-S., A.-M.S. and A.E.-D.O.; visualization, M.S.E. and T.H.K.; supervision, A.E.-D.O. and T.H.K.; project administration, M.S.E., and T.H.K.; funding acquisition, A.E.-D.O. All authors have read and agreed to the published version of the manuscript.
Funding
This research received no external funding.
Institutional Review Board Statement
Not applicable.
Informed Consent Statement
Not applicable.
Data Availability Statement
The authors confirm that the data supports the findings of this study are available within the article and Supplementary Materials.
Acknowledgments
The authors wish to extend their sincere appreciation to the Soils, Water, and Environment Research Institute (SWERI), Agriculture Research Center (ARC), Giza, Egypt; the Faculty of Agriculture, Tanta University, Tanta, Egypt; and the Faculty of Agriculture, Kafrelsheikh University, Kafr El-Sheikh, Egypt, for their valuable support and collaboration in this research. We also express our gratitude to the Laboratories of Soil Improvement and Conservation Research Department, Soil and Plant Analysis Laboratory, and the Soil Microbiology Research Department, Sakha Agricultural Research Station, Kafr El-Sheikh, Egypt, for providing the necessary resources, including soil and plant analysis services, as well as the Seaweed Extract materials and their subsequent analysis.
Conflicts of Interest
The authors declare no conflicts of interest.
References
- Filip, E.; Woronko, K.; Stępień, E.; Czarniecka, N. An Overview of Factors Affecting the Functional Quality of Common Wheat (Triticum aestivum L.). Int. J. Mol. Sci. 2023, 24, 7524. [Google Scholar] [CrossRef] [Scilit]
- Khalifa, S.H.; EL-Seidy, E.-S.H.; Mohamed, E.N.M.; Khalifa, T.H. Effect of antioxidant foliar applications on two Egyptian wheat varieties cultivated under saline conditions. Span. J. Agric. Res. 2025, 23, 21421. [Google Scholar] [CrossRef] [Scilit]
- Hagage, M.; Abdulaziz, A.M.; Elbeih, S.F.; Hewaidy, A.G.A. Monitoring soil salinization and waterlogging in the northeastern Nile Delta linked to shallow saline groundwater and irrigation water quality. Sci. Rep. 2024, 14, 27838. [Google Scholar] [CrossRef] [Scilit] [PubMed]
- Aboelsoud, H.M.; AbdelRahman, M.A.; Kheir, A.M.; Eid, M.S.; Ammar, K.A.; Khalifa, T.H.; Scopa, A. Quantitative Estimation of Saline-Soil Amelioration Using Remote-Sensing Indices in Arid Land for Better Management. Land 2022, 11, 1041. [Google Scholar] [CrossRef] [Scilit]
- De Santis, M.A.; Soccio, M.; Laus, M.N.; Flagella, Z. Influence of Drought and Salt Stress on Durum Wheat Grain Quality and Composition: A Review. Plants 2021, 10, 2599. [Google Scholar] [CrossRef] [Scilit]
- Traye, I.D.; Oli, N.M.; Weng, X.; Li, K.; Suliman, M.S.E.; Guo, X.; Zhou, G.; Zhu, G.; Xu, Y. Salinity Tolerance in Wheat: Mechanisms and Breeding Approaches. Plants 2025, 14, 1641. [Google Scholar] [CrossRef] [Scilit]
- Zhu, P.; Li, Y.; Yuan, X.; Shi, Y. Slow-release nitrogen fertilizer enhances wheat yield in saline-alkali soil by improving soil properties and plant stress tolerance. Soil Ecol. Lett. 2025, 7, 250292. [Google Scholar] [CrossRef] [Scilit]
- Sun, Y.; Chen, X.; Shan, J.; Xian, J.; Cao, D.; Luo, Y.; Yao, R.; Zhang, X. Nitrogen Mitigates Salt Stress and Promotes Wheat Growth in the Yellow River Delta, China. Water 2022, 14, 3819. [Google Scholar] [CrossRef] [Scilit]
- Lastiri-Hernández, M.A.; Pérez-Inocencio, J.; Conde-Barajas, E.; de la Luz Xochilt Negrete-Rodríguez, M.; Álvarez-Bernal, D. Ameliorating Saline Clay Soils with Corncob Biochar for Improving Chickpea (Cicer arietinum L.) Growth and Yield. Soil Syst. 2025, 9, 71. [Google Scholar] [CrossRef] [Scilit]
- Jia, A.; Song, X.; Li, S.; Liu, Z.; Liu, X.; Han, Z.; Gao, H.; Gao, Q.; Zha, Y.; Liu, Y.; et al. Biochar enhances soil hydrological function by improving the pore structure of saline soil. Agric. Water Manag. 2024, 306, 109170. [Google Scholar] [CrossRef] [Scilit]
- Elbagory, M.; Shaker, E.M.; El-Nahrawy, S.; Omara, A.E.-D.; Khalifa, T.H. The Concurrent Application of Phosphogypsum and Modified Biochar as Soil Amendments Influence Sandy Soil Quality and Wheat Productivity. Plants 2024, 13, 1492. [Google Scholar] [CrossRef] [Scilit] [PubMed]
- Bayoumy, M.A.; Khalifa, T.H.H.; Aboelsoud, H.M. Impact of some organic and inorganic amendments on some soil properties and wheat production under saline-sodic soil. J. Soil Sci. Agric. Eng. 2019, 10, 307–313. [Google Scholar] [CrossRef] [Scilit]
- Bekele, A.; Swaren, L. Improving Salt-Affected Soil Using Biochar and Humic Substances: Insights from incubation, Column Leaching, and Growth Chamber Experiments. Commun. Soil Sci. Plant Anal. 2025, 56, 2660–2678. [Google Scholar] [CrossRef] [Scilit]
- Zubairu, A.M.; Ocansey, C.M.; Gangwar, R.K.; Szegi, T.A.; Boros, N.; Sebők, A.; Dálnoki, B.A.; Takács, A.; Gulyás, M. Overview of biochar role in remediating soil salinity stress in crops. Discov. Sustain. 2025, 6, 1185. [Google Scholar] [CrossRef] [Scilit]
- Yang, W.; Wang, Z.; Zhang, L.; Zhang, J.; Zhao, L.; Yang, M.; Li, P. Impact of Biochar Application and Nitrogen Fertilization on Soil Aggregates and Aggregate Organic Carbon in Irrigated Areas of Northern Xinjiang. Agronomy 2025, 15, 2626. [Google Scholar] [CrossRef] [Scilit]
- Murtaza, G.; Deng, G.; Usman, M.; Jamil, A.; Qasim, M.; Iqbal, J.; Ercisli, S.; Akram, M.I.; Rizwan, M.; Elshikh, M.S.; et al. Impact of Acacia-derived biochar to mitigate salinity stress in Zea mays L. by morpho-physiological and biochemical indices. Sci. Rep. 2024, 14, 31883. [Google Scholar] [CrossRef] [Scilit]
- Huang, K.; Li, M.; Li, R.; Rasul, F.; Shahzad, S.; Wu, C.; Shao, J.; Huang, G.; Li, R.; Almari, S.; et al. Soil acidification and salinity: The importance of biochar application to agricultural soils. Front. Plant Sci. 2026, 14, 1206820. [Google Scholar] [CrossRef] [Scilit]
- Abbas, A.; Yaseen, M.; Khalid, M.; Naveed, M.; Aziz, M.Z.; Hamid, Y.; Saleem, M. Effect of biochar-amended urea on nitrogen economy of soil for improving the growth and yield of wheat (Triticum aestivum L.) under field condition. J. Plant Nutr. 2017, 40, 2303–2311. [Google Scholar] [CrossRef] [Scilit]
- El-Kalawy, S.M.S.; Abu El-Fotoh, H.M. Managing Biochar Application and Nitrogen Fertilization to Improve Wheat Production and Soil Nutrients Status under Clay Soil Conditions. Middle East J. Agric. Res. 2024, 13, 846–864. [Google Scholar] [CrossRef] [Scilit]
- Abd El-Rady, A.G.; Elmasry, H.M.M.; El-sayed, M.E.A. Independent and combined effects of biochar and mineral fertilizers on wheat productivity and soil properties. Egypt. J. Agric. Res. 2023, 101, 304–321. [Google Scholar] [CrossRef] [Scilit]
- Fernandes, J.D.; Chaves, L.H.; Mendes, J.S.; Chaves, I.B.; Tito, G.A. Alterations in soil salinity with the use of different biochar doses. Rev. Ciências Agrárias 2019, 42, 89–98. [Google Scholar] [CrossRef]
- Liu, J.; Chen, Z.; Wu, S.; Sun, H.; Xing, J.; Zhang, Z. Interaction of Biochar Addition and Nitrogen Fertilizers on Wheat Production and Nutrient Status in Soil Profiles. Plants 2024, 13, 614. [Google Scholar] [CrossRef] [Scilit]
- Kabir, E.; Kim, K.H.; Kwon, E.E. Biochar as a tool for the improvement of soil and environment. Front. Environ. Sci. 2023, 11, 1324533. [Google Scholar] [CrossRef] [Scilit]
- Sun, H.; Zhang, H.; Shi, W.; Zhou, M.; Ma, X. Effect of biochar on nitrogen use efficiency, grain yield and amino acid content of wheat cultivated on saline soil. Plant Soil Environ. 2019, 65, 83–89. [Google Scholar] [CrossRef] [Scilit]
- Yu, H.; Feng, B.; Dong, Y.; Song, X.; Sun, X.; Song, X.; Li, X.; Guo, G.; Bai, D.; Kong, C. How to Minimize the Impact of Biochar on Soil Salinity in Drylands? Lessons from a Data Synthesis. Agronomy 2025, 15, 2609. [Google Scholar] [CrossRef] [Scilit]
- Yasmeen, A.R.; Maharajan, T.; Rameshkumar, R.; Sindhamani, S.; Banumathi, B.; Prabakaran, M.; Atchaya, S.; Rathinapriya, P. Role of Seaweeds for Improving Soil Fertility and Crop Development to Address Global Food Insecurity. Crops 2025, 5, 29. [Google Scholar] [CrossRef] [Scilit]
- Basavaraja, P.K.; Yogendra, N.D.; Zodape, S.T.; Prakash, R.; Ghosh, A. Effect of seaweed sap as foliar spray on growth and yield of hybrid maize. J. Plant Nutr. 2018, 41, 1851–1861. [Google Scholar] [CrossRef] [Scilit]
- Latique, S.; Mrid, R.B.; Kabach, I.; Kchikich, A.; Sammama, H.; Yasri, A.; Nhiri, M.; El Kaoua, M.; Douira, A.; Selmaoui, K. Foliar Application of Ulva rigida Water Extracts Improves Salinity Tolerance in Wheat (Triticum durum L.). Agronomy 2021, 11, 265. [Google Scholar] [CrossRef] [Scilit]
- Rossini, A.; Ruggeri, R.; Rossini, F. Combining nitrogen fertilization and biostimulant application in durum wheat: Effects on morphophysiological traits, grain production, and quality. Ital. J. Agron. 2025, 20, 100027. [Google Scholar] [CrossRef] [Scilit]
- Nasiroleslami, E.; Mozafari, H.; Sadeghi-Shoae, M.; Habibi, D.; Sani, B. Changes in yield, protein, minerals, and fatty acid profile of wheat (Triticum aestivum L.) under fertilizer management involving application of nitrogen, humic acid, and seaweed extract. J. Soil Sci. Plant Nutr. 2021, 21, 2642–2651. [Google Scholar] [CrossRef] [Scilit]
- Baillie, I.C. Soil Survey Staff 1999, Soil Taxonomy: A Basic System of Soil Classification for Making and Interpreting Soil Surveys, Agricultural Handbook 436; Natural Resources Conservation Service, USDA: Washington, DC, USA, 2001; p. 869. [Google Scholar] [CrossRef] [Scilit]
- Carter, M.R.; Gregorich, E.G. Soil sampling and methods of analysis. In Canadian Society of Soil Science, 2nd ed.; CRC press: Boca Raton, FL, USA, 2007; p. 1264. [Google Scholar] [CrossRef] [Scilit]
- Gee, G.W.; Or, D. Particle-size analysis. In Methods of Soil Analysis, Part 4-Physical Methods; Dane, J.H., Topp, G.C., Eds.; Soil Science Society of America: Madison, WI, USA, 2002; pp. 255–293. [Google Scholar] [CrossRef] [Scilit]
- Maneechot, P.; Thanarak, P.; El Sharkawi, H.M. Carbonization of Wasted Biomass and Carbon Sequestration. In Recycle Based Organic Agriculture in a City; Tojo, S., Ed.; Springer: Singapore, 2019; pp. 33–68. [Google Scholar] [CrossRef] [Scilit]
- Anisimov, M.M.; Chaikina, E.L.; Klykov, A.G.; Rasskazov, V.A. Effect of seaweeds extracts on the growth of seedling roots of buckwheat (Fagopyrum esculentum Moench) is depended on the season of algae collection. Agric. Sci. Dev. 2013, 2, 67–75. [Google Scholar]
- Yuan, Y.; Liu, Q.; Zheng, H.; Li, M.; Liu, Y.; Wang, X.; Peng, Y.; Luo, X.; Li, F.; Li, X.; et al. Biochar as a sustainable tool for improving the health of salt-affected soils. Soil Environ. Health 2023, 1, 100033. [Google Scholar] [CrossRef] [Scilit]
- Motsara, M.R.; Roy, R.N. Guide to Laboratory Establishment for Plant Nutrient Analysis; Food and Agriculture Organization of the United Nations: Rome, Italy, 2008; p. 81. Available online: https://www.fao.org/4/i0131e/i0131e.pdf (accessed on 3 June 2024).
- Dobermann, A. Nutrient use efficiency–measurement and management. In Fertilizer Best Management Practices: General Principles, Strategy for Their Adoption and Voluntary Initiatives Versus Regulations; Krauss, A., Isherwood, K., Heffer, P., Eds.; International Fertilizer Industry Association: Paris, France, 2007; pp. 1–28. Available online: https://mhchem.org/221/wq/Fertilize/FBMP.pdf (accessed on 25 May 2024).
- Dong, L.; Yang, X.; Shi, L.; Shen, Y.; Wang, L.; Wang, J.; Li, C.; Zhang, H. Biochar and nitrogen fertilizer co-application changed SOC content and fraction composition in Huang-Huai-Hai plain, China. Chemosphere 2022, 291, 132925. [Google Scholar] [CrossRef] [Scilit] [PubMed]
- Tang, C.; Yang, J.; Xie, W.; Yao, R.; Wang, X. Effect of Biochar Application on Soil Fertility, Nitrogen Use Efficiency and Balance in Coastal Salt-Affected Soil under Barley–Maize Rotation. Sustainability 2023, 15, 2893. [Google Scholar] [CrossRef] [Scilit]
- Yang, W.; Zhang, L.; Chen, Y.; Su, L.; Zhao, L.; Li, P.; Zhao, H.; Jia, H. Effects of nitrogen fertilizer and biochar levels on soil CO2 emission and wheat yield in irrigation region. Front. Agron. 2024, 6, 1487500. [Google Scholar] [CrossRef] [Scilit]
- Shi, W.; Bian, R.; Li, L.; Lian, W.; Liu, X.; Zheng, J.; Cheng, K.; Zhang, X.; Drosos, M.; Joseph, S.; et al. Assessing the impacts of biochar-blended urea on nitrogen use efficiency and soil retention in wheat production. GCB Bioenergy 2022, 14, 65–83. [Google Scholar] [CrossRef] [Scilit]
- Hamouda, M.M.; Saad-Allah, K.M.; Gad, D. Potential of Seaweed Extract on Growth, Physiological, Cytological and Biochemical Parameters of Wheat (Triticum aestivum L.) Seedlings. J. Soil Sci. Plant Nutr. 2022, 22, 1818–1831. [Google Scholar] [CrossRef] [Scilit]
- Raja, B.; Vidya, R. Application of seaweed extracts to mitigate biotic and abiotic stresses in plants. Physiol. Mol. Biol. Plants 2023, 29, 641–661. [Google Scholar] [CrossRef] [Scilit]
- Su, Z.; Liu, X.; Wang, Z.; Wang, J. Biochar effects on salt-affected soil properties and plant productivity: A global meta-analysis. J. Environ. Manag. 2024, 366, 121653. [Google Scholar] [CrossRef] [Scilit]
- Kumar, G.; Nanda, S.; Singh, S.K.; Kumar, S.; Singh, D.; Singh, B.N.; Mukherjee, A. Seaweed extracts: Enhancing plant resilience to biotic and abiotic stresses. Front. Mar. Sci. 2024, 11, 1457500. [Google Scholar] [CrossRef] [Scilit]

Disclaimer/Publisher’s Note: The statements, opinions and data contained in all publications are solely those of the individual author(s) and contributor(s) and not of MDPI and/or the editor(s). MDPI and/or the editor(s) disclaim responsibility for any injury to people or property resulting from any ideas, methods, instructions or products referred to in the content. |
© 2026 by the authors. Licensee MDPI, Basel, Switzerland. This article is an open access article distributed under the terms and conditions of the Creative Commons Attribution (CC BY) license.