


Abstract
Valorization of agricultural residues into biochar for soil applications offers dual benefits of waste management and sustainable agriculture. However, the mechanisms governing sandy soil and lettuce response to biochar under deficit irrigation are not well understood. This study evaluated the effects of biochar types on sandy soil physiochemical properties and lettuce (Lactuca sativa L.) yield at different irrigation levels. A field experiment was performed using a randomized complete block design with four treatments (soil only, cotton stalk biochar, cashew nutshells biochar, and a mix of cotton stalks+ cashew nutshells biochar) and three irrigation regimes (100%, 80, and 60% of crop water requirements ETc) in Ouagadougou, Burkina Faso. The results showed that biochar-amended soils had consistently higher water retention and macronutrients, resulting in higher fresh, marketable lettuce yields under deficit irrigation compared to untreated soils. Compared to other treatments, a mix of cotton-stalk and cashew-nutshell biochar produced the highest yield (18.1 tons/ha) under moderate irrigation (80% ETc). Achieving optimal yields with 20% less irrigation water indicates biochar’s water-saving potential in climate-resilient vegetable farming. These findings underscore the potential of combining deficit irrigation and biochar for sustainable vegetable production to mitigate food security in water-scarce regions.
1. Introduction
Water scarcity is a major global challenge threatening food production and security, particularly in semi-arid and arid regions. Agriculture accounts for 70% of global freshwater withdrawals [1], and increasing demand for food production continues to put pressure on limited freshwater resources [2]. Climate change issues such as rising temperatures, increased rainfall variability, and frequent droughts have further intensified water scarcity. In Burkina Faso, erratic rainfall patterns and prolonged droughts are increasing water scarcity, reducing crop productivity [3]. These challenges necessitate development of water-saving strategies to optimize water use in agriculture. Deficit irrigation (DI) is a deliberate application of water below crop evapotranspiration (ETc) to improve crop water productivity while sustaining yields [4]. However, water stress negatively affects crop physiology, growth, and yield [1,4,5]. Leafy vegetables are particularly sensitive to water stress due to their shallow root systems (<60 m deep) and high water requirements [4]. As a result, yield losses are common in leafy vegetables exposed to deficit irrigation. Integrating DI with soil amendments such as biochar has been proposed as a strategy to mitigate water stress and sustain crop productivity [5,6,7].
Lettuce is a widely cultivated leafy vegetable with global production of approximately 30 million tons per year [8]. In Burkina Faso, lettuce is commonly grown in vegetable gardens within urban and peri-urban areas [9]. Lettuce is a high-value vegetable with a short growth cycle, which provides essential micronutrients, fiber, bioactive compound, and vitamins [10,11]. However its high water content (90–95%) and shallow root system (less than 30 cm) make it highly sensitive to changes in soil water availability [8,12]. Therefore, lettuce is an ideal crop for evaluating the effect of combining biochar and DI. Biochar, produced via pyrolysis of biomass at high temperatures (350–900 °C) under inert conditions, has been reported to improve crop tolerance to water stress [1,5]. It can enhance soil structure, organic carbon, and water retention and availability [13,14]. Its large surface area, porous structure, and diverse surface functional groups contribute to increased soil water-holding capacity and plant available-water content [15]. In coarse-textured soils, biochar can reduce bulk density, increase porosity, and improve aggregation, thereby enhancing soil water retention. Biochar fine particles can fill large interpore spaces in sandy soils, reducing bulk density and creating additional water storage pores (0.5–50 μm) [15]. These benefits of biochar are particularly important in Sahelian sandy soils, characterized by low organic matter, low cation exchange capacity, high hydraulic conductivity, and poor water retention [16].
The effectiveness of biochar to improve soil and crop drought resilience is influenced by soil type, feedstock, production conditions, degree of water stress, and climatic conditions [17]. For example, in Senegal, biochar-amended sandy loam soils under 50% deficit irrigation produced higher tomato yields than unamended soils under full irrigation [7]. In Egypt [16], biochar improved cucumber yield and quality at moderate deficit irrigation (80% ETc), but not under severe deficit (60% ETc). Similarly, wheat-straw biochar improved tomato growth and yield under deficit irrigation conditions in a greenhouse study. [18]. In lettuce under deficit irrigation, biochar has been shown to increase biomass yield (by 33.2%), plant height (by 29.8%), and leaf moisture content (by 5.63%) through improved soil water retention [5]. Previous studies in Ouagadougou, Burkina Faso, have also reported positive effects of biochar on soil properties and vegetable yields [19,20].
Despite these advances, the buffering effect of biochar on vegetables under deficit irrigation remains insufficiently explored under field conditions in Burkina Faso. Most studies have been conducted in controlled greenhouse pot experiments which present true fields conditions. Field-based experiments are essential for enhancing farmers’ adoption of biochar technologies [21]. In addition, most studies have used a single biochar type, thereby limiting understanding of how different feedstocks influence soil–plant responses under varying irrigation regimes. The interactions between biochar type, soil properties, and crop performance under deficit irrigation regimes in sandy Sahelian soils remain unclear. This present study aims to identify biochar–irrigation combinations that optimize lettuce yields under reduced irrigation in sandy soils. This study evaluated the effects of contrasting biochar types on soil physicochemical properties and lettuce yield under deficit irrigation. We hypothesized that (i) biochar effects on soil properties and lettuce yield vary across irrigation regimes, and (ii) the ability of biochar to sustain yields under deficit irrigation is associated with improvement in soil available water content. A field experiment was conducted to compare cotton stalks (CSs), cashew nutshells (CNSs), and their mixture (CS+CNS) applied at 10 t ha−1 under three irrigation regimes: full (100% ETc), moderate deficit (80% ETc), and severe deficit (60% ETc). CSs and CNSs are abundant but underutilized agricultural residues in Burkina Faso [22]. They were selected because of their contrasting physicochemical characteristics. Straw-derived (CS) and nut-derived (CNS) feedstocks differ in structural composition and mineral content [23,24,25]. Preliminary characterization (unpublished study) indicated differences in lignin, silica, and phosphorus content. These differences are expected to influence biochar properties and their agronomic performance.
2. Methodology
2.1. Experimentation Site
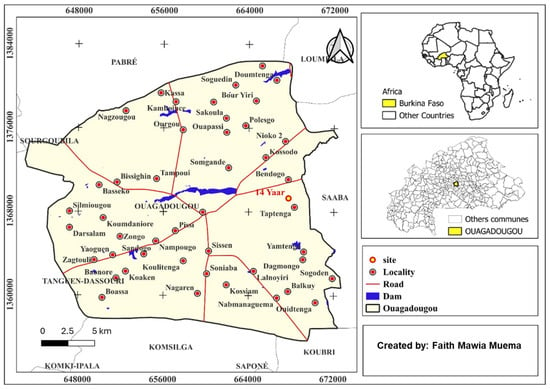
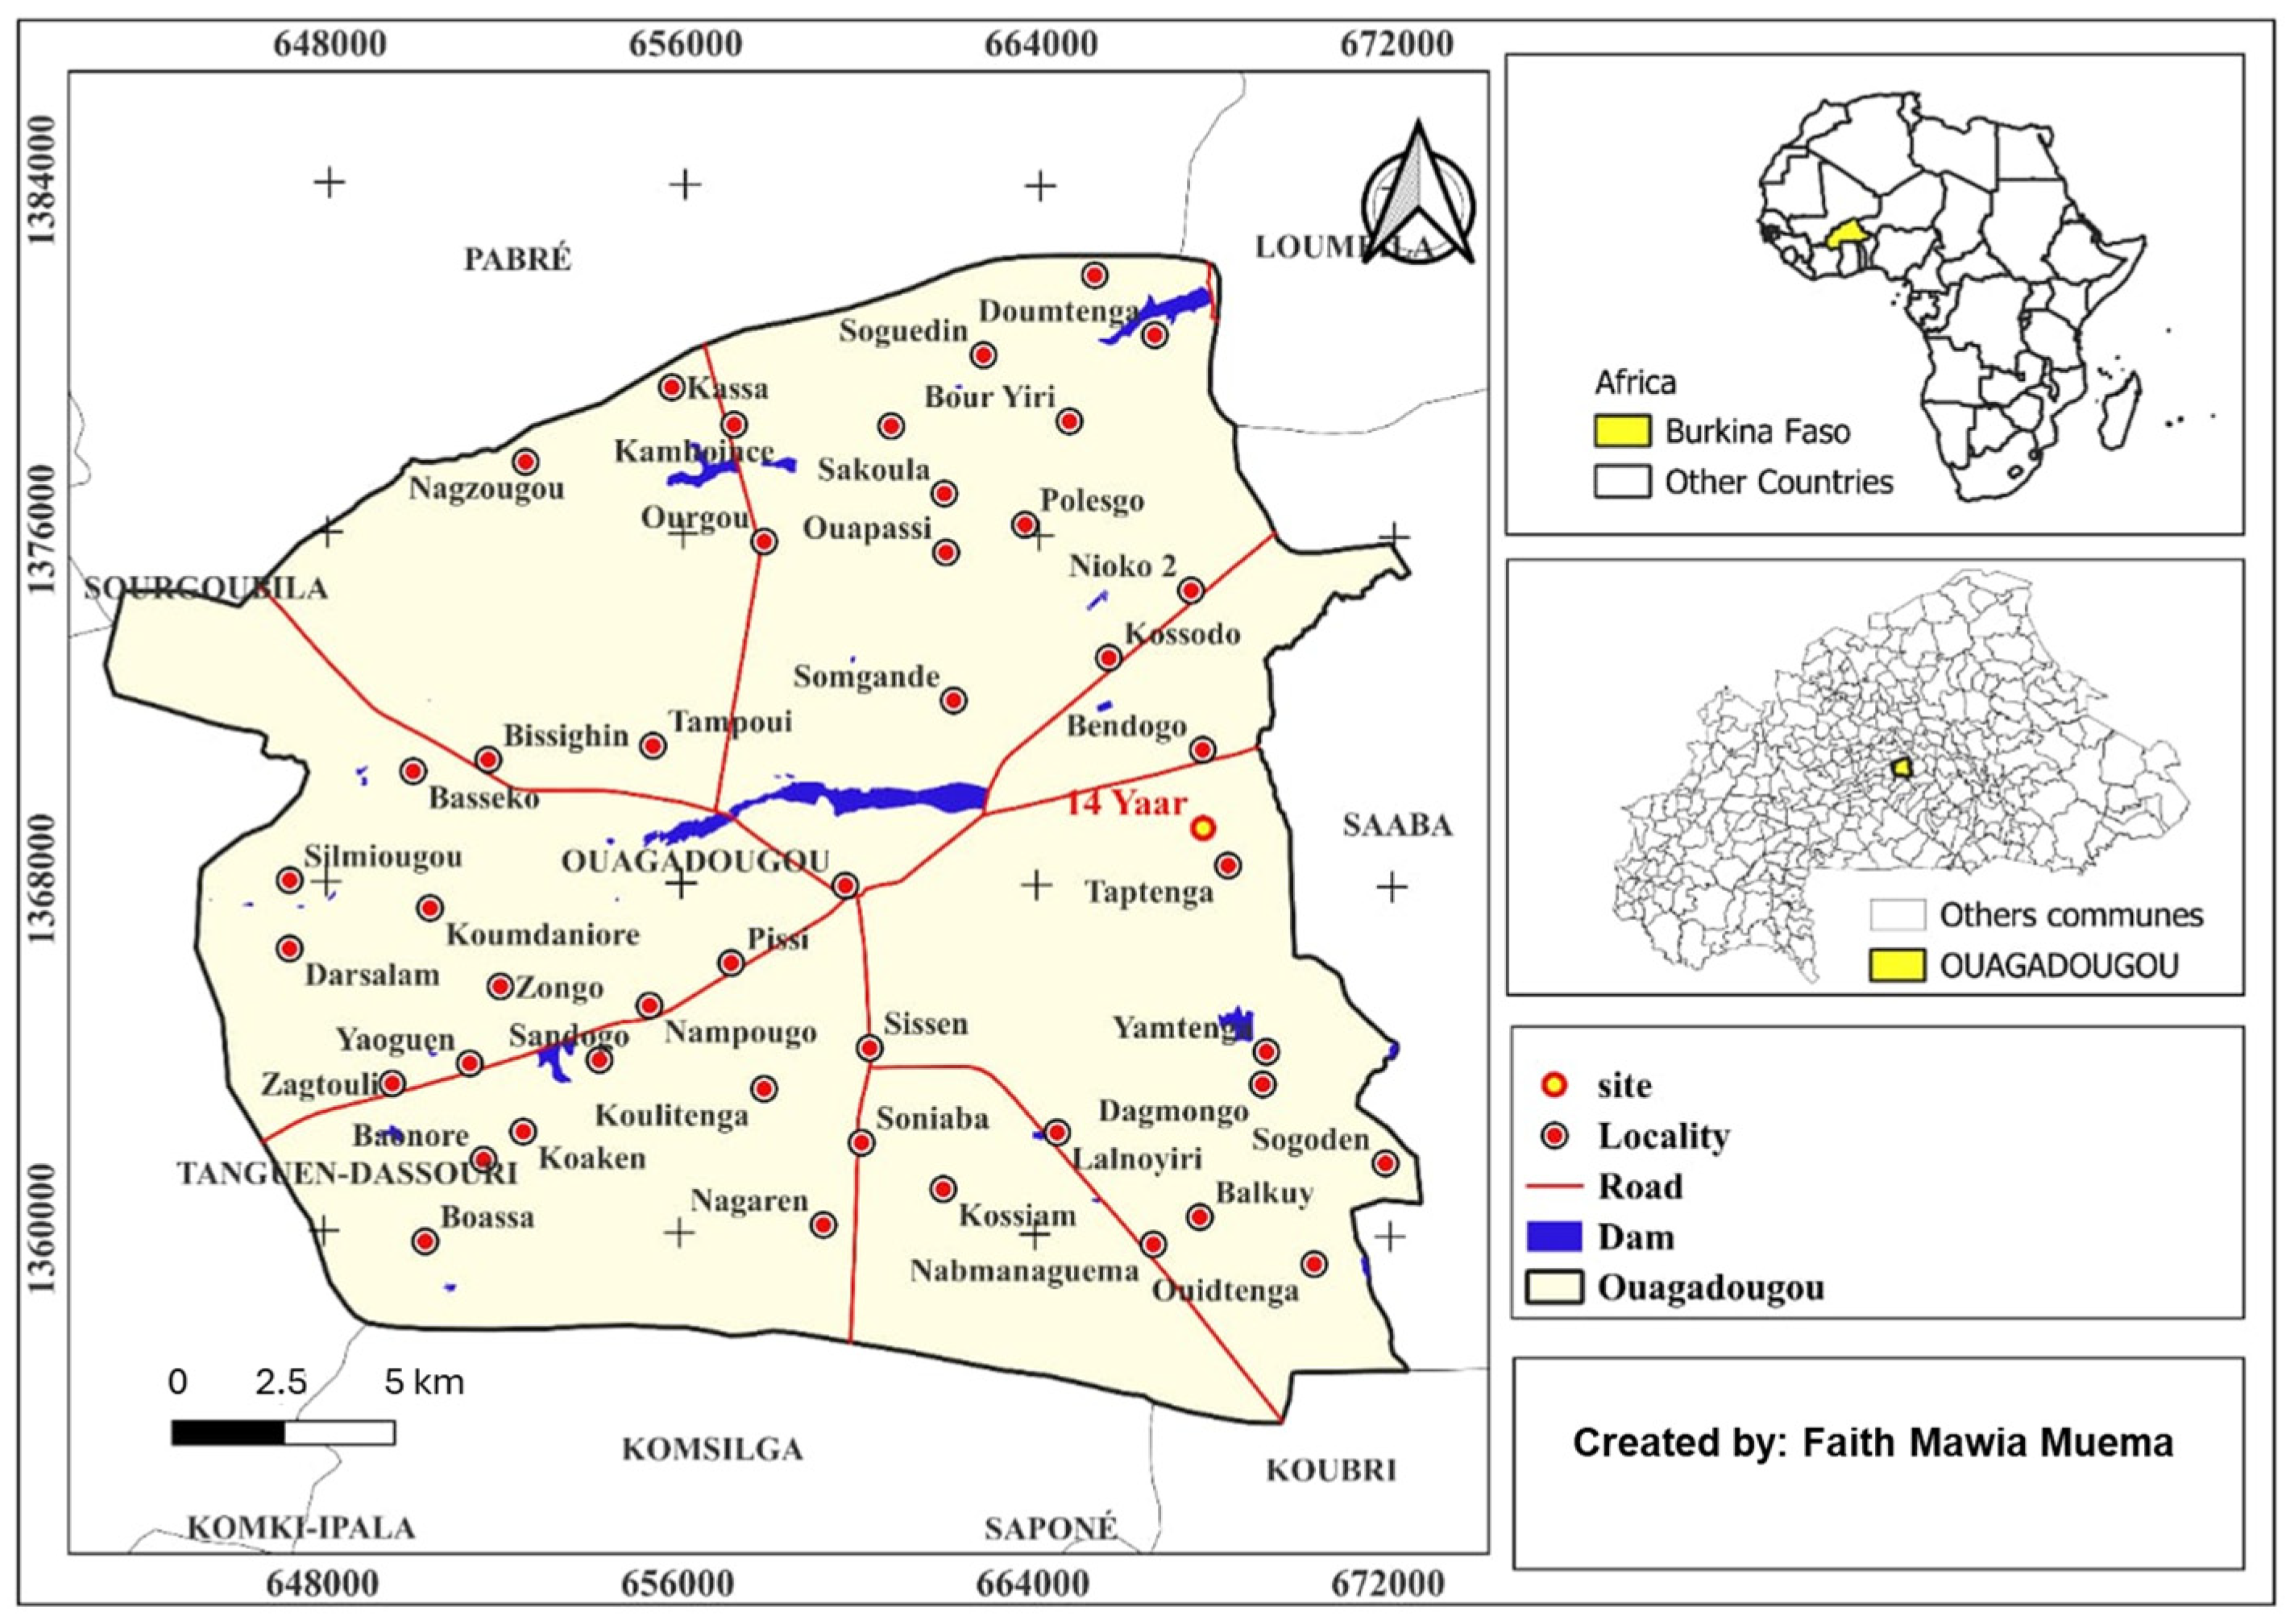
The experiment was conducted at 14 Yaar in Ouagadougou, Burkina Faso (12°22′55.9″ N, 1°27′27″ W; 300 m a.s.l.). The study site is located within the Sudano-Sahelian ecological zone of West Africa. The region experiences a semi-arid climate with a unimodal rainfall pattern, receiving between 600 and 900 mm annually [3], mainly from June to September. A prolonged dry season occurs between November and May. The mean annual daily temperature is about 28.7 °C. The hottest months are between March and May, when daily maximum temperatures can reach 42 °C [26]. The soils in this area are predominantly leached ferruginous with a loose structure [9]. The soil texture of the study area was classified as sandy soil (96.7 ± 0.4% sand, 2.9 ± 0.3% clay, and 0.4 ± 0.1% silt) based on the USDA soil classification system, using the hydrometer analysis method. The soil properties prior to experimentation were as follows: bulk density of 1.23 ± 0.01 g/cm3, EC of 0.29 ± 0.07 dS/m, pH (in water) of 7.1 ± 0.6, SOC of 19.1 ± 0.5 g/kg, N of 18.3 ± 3.3 mg/kg, P of 28.5 ± 6.0 mg/kg, and K of 57.5 ± 14.8 mg/kg. The experimental site is part of a community-managed vegetable garden covering 1 ha, with access to solar-pumped borehole irrigation water. The experiment was conducted with permission from the community garden leadership committee. Figure 1 represents the experimentation site.
Figure 1.
Map of the study area. Source: Drafted by authors.
2.2. Biochar Production and Properties
Cotton stalks were collected from farms, and cashew nutshells were obtained from cashew processing plants in Bobo-Dioulasso, located in Houet province, within the Hauts-Bassins region of Burkina Faso. The cotton stalks were first cut into small pieces about 15 cm prior to carbonization, while the cashew nutshells were not pretreated. Biochar was produced using a locally fabricated pilot-scale fixed-bed semi-auto reactor. The reactor consists of an internal pyrolysis reactor, where biomass is fed; an outer chamber; a combustion chamber; and a pyro-gas circulation tube connecting the internal reactor with combustion chamber. Pyrolysis temperature was monitored with three K-type thermocouples able to attain 1000 °C; they were attached at the bottom-, center-, and top-part sections of the internal reactor. A mixture of cotton stalks and waste wood is fed to the combustion chamber to heat the feedstocks. When pyrolysis temperature rises above 400 °C, the pyrolysis vapors produced are transported to the combustion chamber to support heating, thereby reducing the amount of biomass fuel needed. An average maximum temperature of 675 ± 82 °C was recorded in the internal pyrolysis reactor. An average pyrolysis time of 2 h (CS) and 3.5 h (CNS) was recorded. An average batch load of 10.21 ± 1.5 kg was used for cotton stalks, and 38 ± 4.5 kg for cashew nutshells. A total of 14 cotton stalk batches and 6 batches of cashew nutshells were used. The cashew nutshells pack closely, enabling higher batch loads. Several batches for each feedstock were produced, and the average yield is reported as mean value ± standard deviation in Table 1. At the end of each experiment, biochar was allowed to cool to room temperature and then stored in airtight plastic storage bags. The biochar was crushed using a laboratory electrical milling machine (RETSCH-SM100, Retsch GmbH, Haan, Germany) and sieved to a particle size of 0.5–4 mm before field applications.
Table 1.
Physicochemical properties of biochar.
For laboratory analysis, biochar was crushed using a porcelain mortar and pestle, and then it was sieved to have a maximum particle size of 1 mm. It was analyzed for moisture content (EN ISO 18134-3), ash content (EN ISO 18122), fixed carbon (by difference), and volatile matter (EN ISO 18123). The pH and electrical conductivity (EC) were measured at 1:10 (biochar-to-distilled-water ratio) using a calibrated pH meter (NANBEI PH300F, NANBEI, Zhengzhou, China) and Mettler Toledo S230 conductivity meter (Mettler Toledo, Schwerzenbach, Switzerland), respectively. The bulk density was determined on 105 °C oven-dried biochar samples using a 1 L calibrated cylindrical cylinder based on ISO 17828. The FTIR spectra of the biochar samples were determined using a BRUKER VERTEX 70 spectrometer (Bruker, Billerica, MA, USA) in attenuated total reflectance (ATR) mode within a wavelength of 400–4000 cm−1. The biochar properties are presented in Table 1, expressed as mean values ± standard deviation.
2.3. Experimental Design and Biochar Treatments
A randomized complete block design with three blocks each receiving different irrigation levels (100%, 80%, and 60% of ETc) was applied. Each block had four different treatment plots consisting of cotton-stalk biochar (CS), cashew-nutshell biochar (CNS), cotton-stalk and cashew-nutshell biochar (CS+CNS), and soil only (control). The plots were randomly distributed within each block to minimize random block effect. In total 2 kg of biochar was applied in each biochar-treated plot (2 m2). This biochar application rate is equivalent to 10 tons/ha application rate. The experiment was carried out within a community vegetable garden where farmers have subdivided the land into small irrigation plots with sizes ranging between 1 and 3 m2. Each treatment was replicated three times in each block, resulting in a total of 36 experimental plots for the three blocks. The blocks were separated with a 50 cm strip and a polythene film buried at 50 depths to minimize lateral water movement between them. The 50 cm depth was chosen because it is deeper than the lettuce vegetable rooting depth of 20–30 cm [27]. The plots in each block were separated by a 30 cm strip to allow easy access for field operations and data collection. The plots in each block were irrigated with the same water quantity, but the amount differed across blocks. Biochar was evenly spread on the surface of each plot and then manually mixed with soil to a depth of 0–20 cm using shovels. Soil was then taken from five locations within each plot and examined by hand to visually confirm uniform mixing.
2.4. Soil and Lettuce Crop Management
Lettuce (Lactuca sativa L.) seedlings were transplanted after 21 days. They were planted with a spacing of 25 mm between rows and 30 mm within rows. Throughout the growing period, tillage and weeding was done manually and periodically following procedures done by the farmers within the vegetable garden. Pesticides were applied periodically, and the quantities used were similar to what the farmers normally use. The vegetables were irrigated manually using cans, as commonly done by the local farmers. The vegetables were grown from 30 April to 11 June. The vegetables were watered 3 times a day based on calculated irrigation water requirements described in Section 2.4. During rainy days, the vegetables were not watered, and the irrigation regime was resumed the following day. The vegetables were harvested at maturity after 45 days. The fresh mass of aboveground consumable lettuce part was weighed and recorded for each plot. Yield was expressed as unit mass per unit area (Equation (1)) to allow for comparison with other similar studies.
2.5. Crop Irrigation Water Requirements
The crop irrigation water requirement was computed based on crop evapotranspiration using the CROPWAT 8.0 model developed by FAO. The daily evapotranspiration of the reference crop (ETo) was calculated using the Penman–Monteith Equation (2).
where Δ is the slope of the vapor pressure curve (kPa/°C); Rn is the net radiation (MJ/m2/day); G is the heat flux of the ground (MJ/m2/day); T is the average daily air temperature at 2 m height (2 °C); u2 is the wind speed at 2 m aboveground (m/s); es is the saturated vapor pressure (kPa); ea is the actual vapor pressure (kPa); and γ is the psychometric constant (66 Pa/°C). Historical climate data for the 1994–2024 period were obtained from NASA POWER. The estimated average ETo value was 6.7 mm/day. The effective rainfall amount was determined using the USDA S.C. method in CROPWAT 8.0. Crop coefficients of 0.7, 1.05, and 0.95 were applied for the initial, development, and late stages, respectively. A rooting depth of 0.3 m and a 45-day growing period were considered. The net irrigation water demand was calculated based on Equation (3).
where VETc is the total net irrigation water demand (L) within the growing period, ETc is the total crop evapotranspiration within the growing period (mm), the Reff is the total effective precipitation within the growing period (mm), and A is the irrigated area (m2). An irrigation efficiency of 40% was used to calculate gross water demand because flood irrigation was done by local farmers using irrigation cans. The gross irrigation of 35 L at 100% of ETc, 28 L at 80% of ETc, and 21 L at 60% of ETc per day was obtained. Three irrigation amounts calculated were applied in three equal portions in the morning, at noon, and in the evening. A total irrigation depth of 490 mm (100%), 392 mm (80% ETc), and 294 mm (60% ETc) was applied throughout the growing season. Total rainfall depth recorded in the nearby weather station during the cultivation period was 61.5 mm.
2.6. Soil Analysis
Soil samples were collected with a spade from 9 different points in the field at a depth of 0–30 cm before experimentation. The samples were mixed thoroughly, air-dried for 48 h, and then sieved to maximum 2 mm before laboratory analysis. For post-harvest soil analysis, samples were collected and analyzed separately in each treatment plot. The soil texture was determined by dry-sieve analysis based on the NFP 18-540 standard and hydrometer analysis method [28]. The in situ key soil parameters (pH, EC, N, P, K, and temperature) were measured using a handheld soil parameter Speed Meter (7 in 1 Integrated Portable Soil Analyzer) within treatment plot. The average values were recorded per plot. The soil organic matter was determined by the loss-of-weight-on-ignition method described by [28]. The soil organic carbon (SOC) was estimated as a fraction of the soil organic matter as follows [28]:
Soil organic carbon (g/kg) = 0.58 × organic matter (%) × 10
The soil bulk density was estimated using a calibrated 1 L volumetric cylinder. The soil porosity was computed from bulk density and average particle density using Equation (4) [29].
where BD is bulk density, and ds is the average soil particle density of 2.65 gcm−3.
Soil Water Retention Characteristics
Soil field capacity (FC), permanent wilting point (PWP), and available water content (AWC) were determined using Richards’ pressure plates. The soil samples were saturated in water for 24 h and then subjected to suction pressure of 1 bar (FC) and then 15 bar (PWP) until equilibrium was reached. The gravimetric water content of samples at each suction pressure level was determined by oven drying the samples at 105 °C for 24 h. The gravimetric available water content was determined as the difference between FC and PWP. The pre-experiment soil moisture characteristics are as follows: FC of 9.57 ± 0.70%, PWP of 4.9 ± 0.29%, and AWC of 4.65 ± 0.76%.
2.7. Statistical Analysis
All statistical analysis were done using R studio version 4.5.2 [30]. The data were analyzed using analysis of variance (ANOVA). Prior to analysis, the residuals assumptions of normality and homogeneity of variance were evaluated using the Shapiro–Wilk test and Levene’s test, respectively. Since FC and AWC failed the Shapiro–Wilk normality test (p < 0.05), the normality of the residuals was further evaluated using Q-Q plots (Figure S1), and it was found to be satisfactory for two-way ANOVA analysis. Significant differences among means within each irrigation level were evaluated using Tukey’s Honest Significant Difference (HSD) test at the 5% significance level. Differences observed across irrigation levels are presented descriptively. Pearson correlation analysis was performed between soil properties and yield, as well as between other soil properties and available water capacity (AWC), using Fisher’s z-test at p < 0.05.
3. Results and Discussion
3.1. Biochar Physiochemical Properties
The physiochemical properties of the biochar are presented in Table 1. CS and CNS biochar are alkaline, with a high pH of 9.9 and 10.2, respectively. The biochars have EC values of 1.6 ± 0.2 dS/m (CS) and 1.2 ± 0.5 dS/m (CNS) and are therefore considered non-saline (EC < 2 dS/m) [31]. CNS biochar has a higher ash content (14.1 ± 1.4%) compared to CS biochar (10.1 ± 0.2%), reflecting its higher mineral concentration, which can favor plant growth. The higher volatile matter content in CNS biochar shows a higher decomposable organic fraction that can favor plant growth. The biochars have high fixed carbon (above 70%), indicating a high proportion of recalcitrant carbon. CS biochar has a lower bulk density of 215 kg/m3 compared to CNS biochar, suggesting higher porosity.
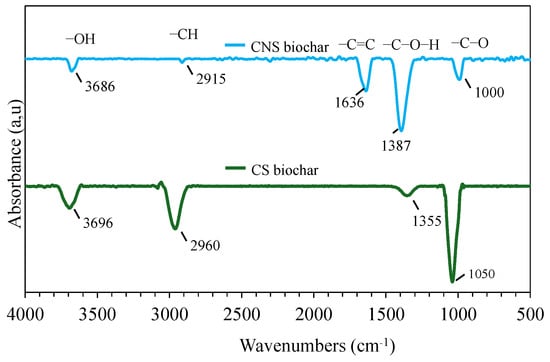
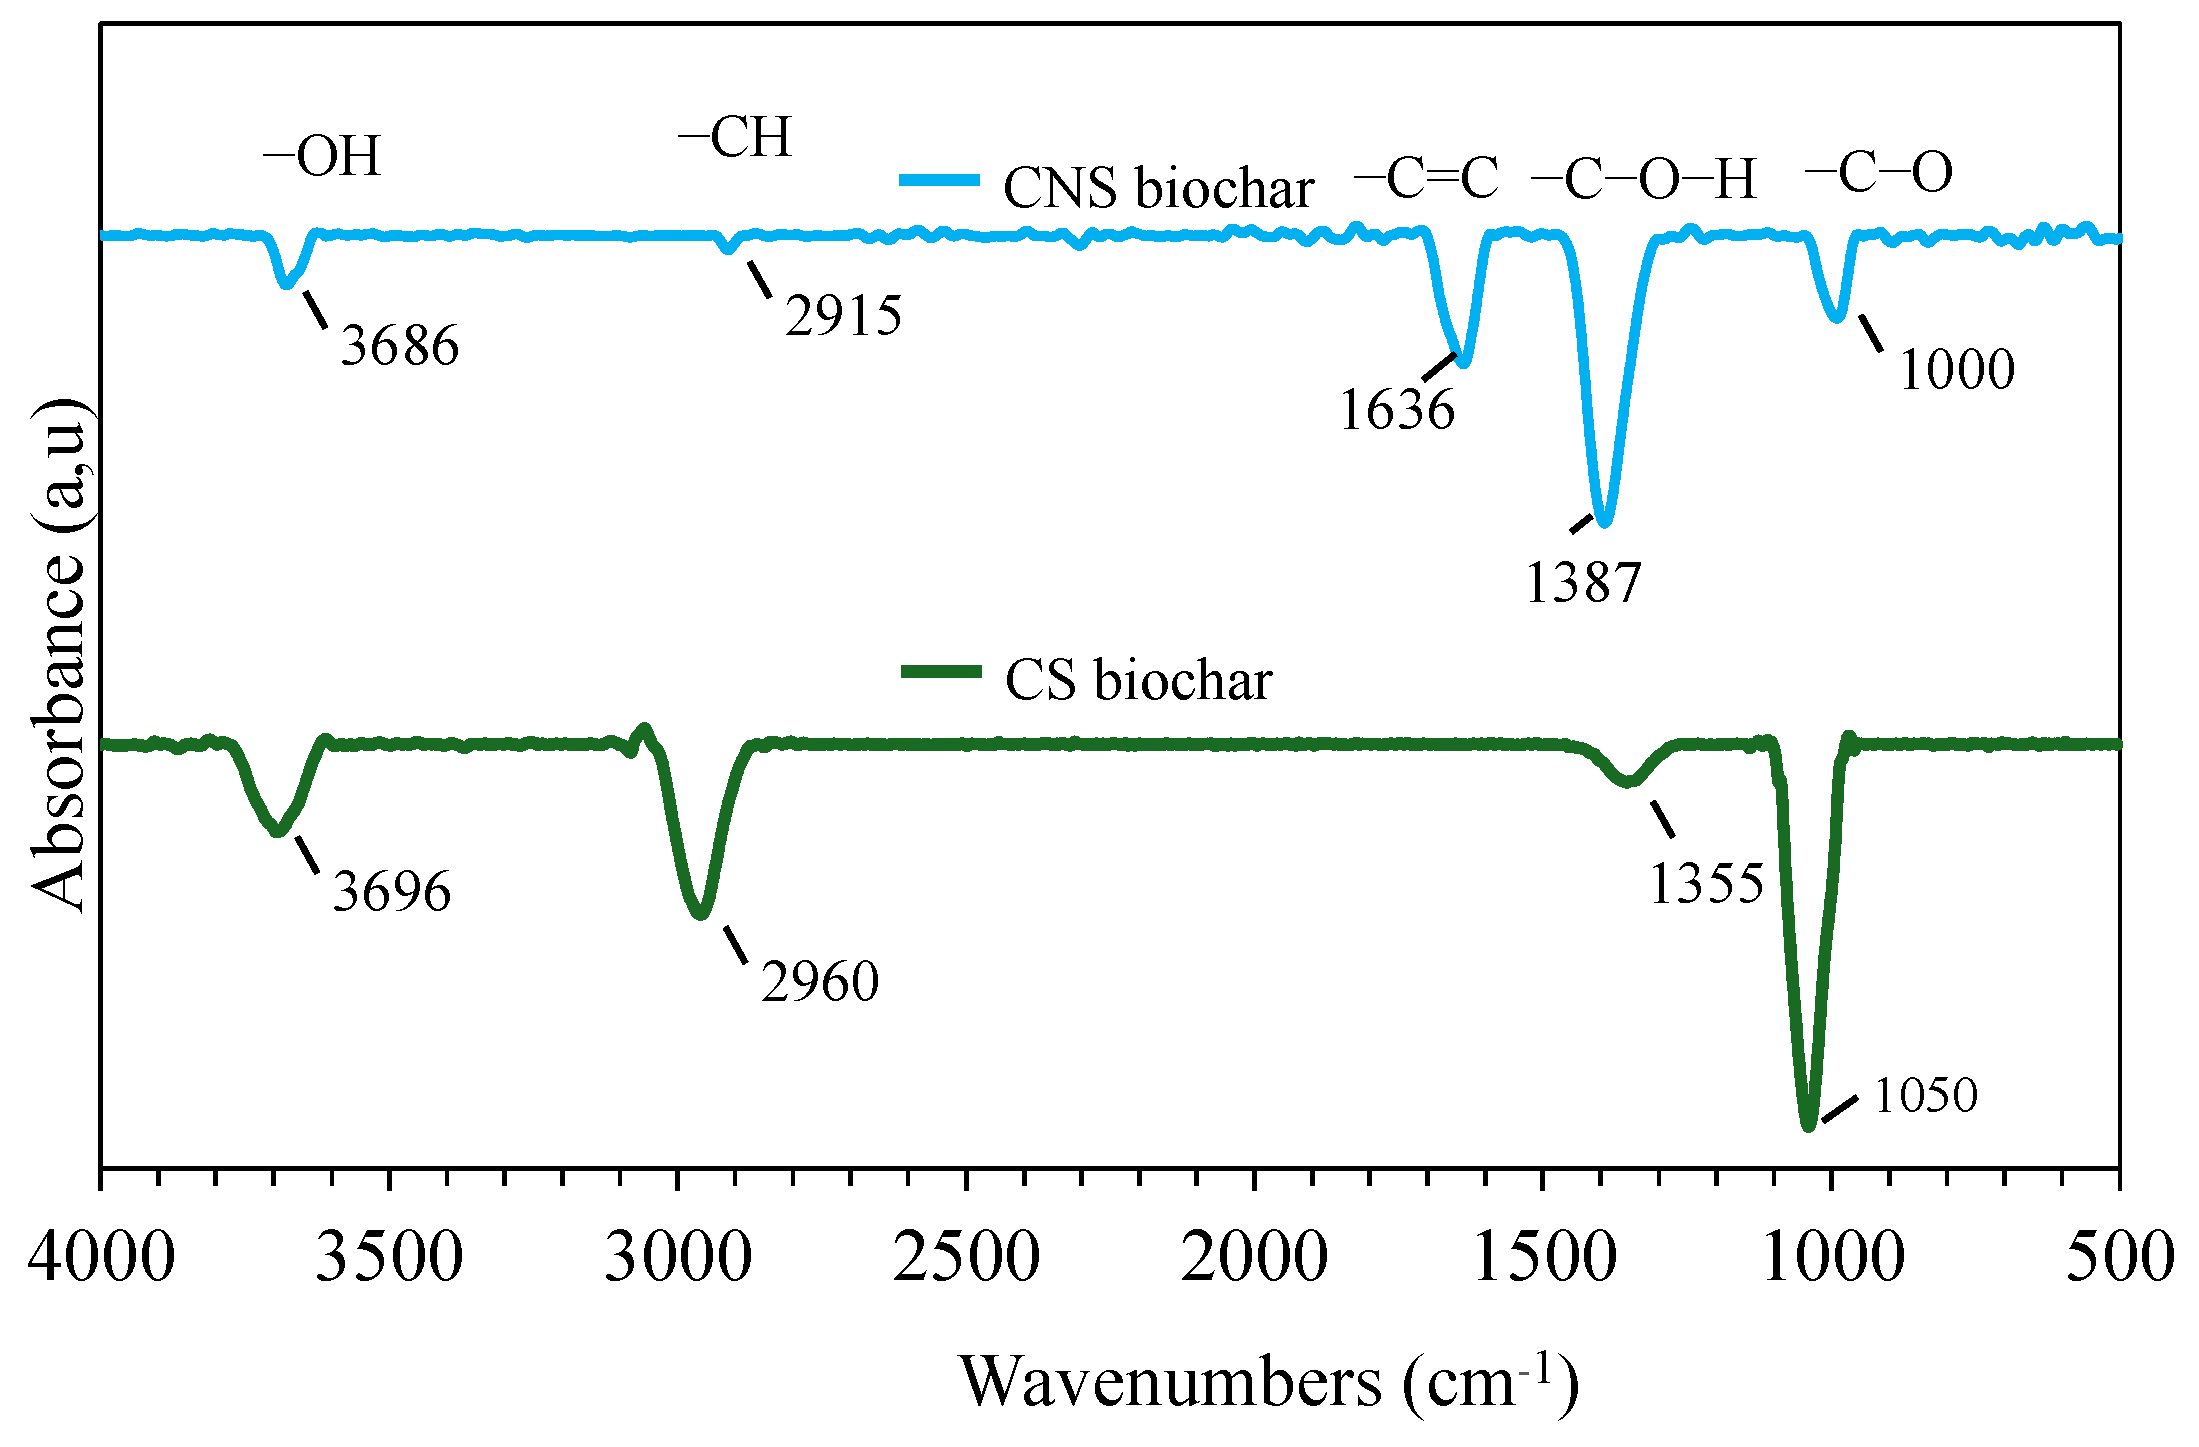
The FTIR analysis of biochar samples is presented in Figure 2 and interpreted based on the literature [32,33,34]. The OH stretch at ~3696 cm−1 corresponding to residual hydroxyl groups from phenols, alcohols, or adsorbed water is more pronounced in CS biochar. The peak bands at ~2900–2960 cm−1 correspond to aliphatic C–H groups like methylene (CH2) and methyl (CH3). Peaks at ~1355 and 1387 in CS and CNS biochar, respectively, exhibit C–O–H stretching, indicating the presence of phenolic hydroxyl or alcohol groups. The peak ~1636 only present in CNS biochar is attributed to C=C stretching, indicating the presence of aromatic structures. The peaks at ~1040 cm−1 in CS biochar and ~1000 cm−1 in CNS biochar correspond to C–O stretching, showing the presence of alcohols and phenols polar-functional groups. The presence of alcohol and phenol groups suggests the existence of oxygenated surface sites, which may enhance surface polarity and interactions with water or ions in the soil.
Figure 2.
FTIR spectra analysis.
3.2. Effect of Biochar on Soil Physical Properties
Soil physical properties, particularly bulk density, porosity, and available water capacity, govern moisture retention, root penetration, and water infiltration and movement. Improvement in these properties enhances arid sandy soil’s water storage and supply capacity, buffering soils and crops from episodic droughts [35]. The ANOVA results (Table 2) showed that biochar had a significant effect (p < 0.001) on soil bulk density and porosity across all irrigation levels. Soil porosity was not measured but calculated from bulk density, leading to similar F values. The high ANOVA F values (F = 281.33) indicate that biochar has a strong impact on soil physical structure (bulk density and porosity).
Table 2.
Two-way ANOVA showing effect of treatment (biochar), irrigation, and their interaction on soil properties. Shapiro–Wilk test and Levene’s test statistics for normality and homogeneity of variance are also presented.
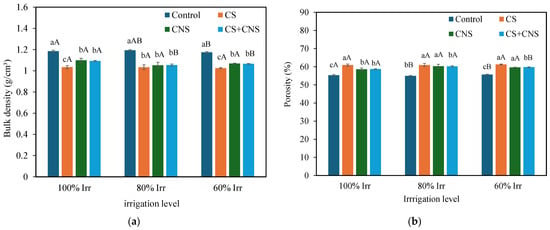
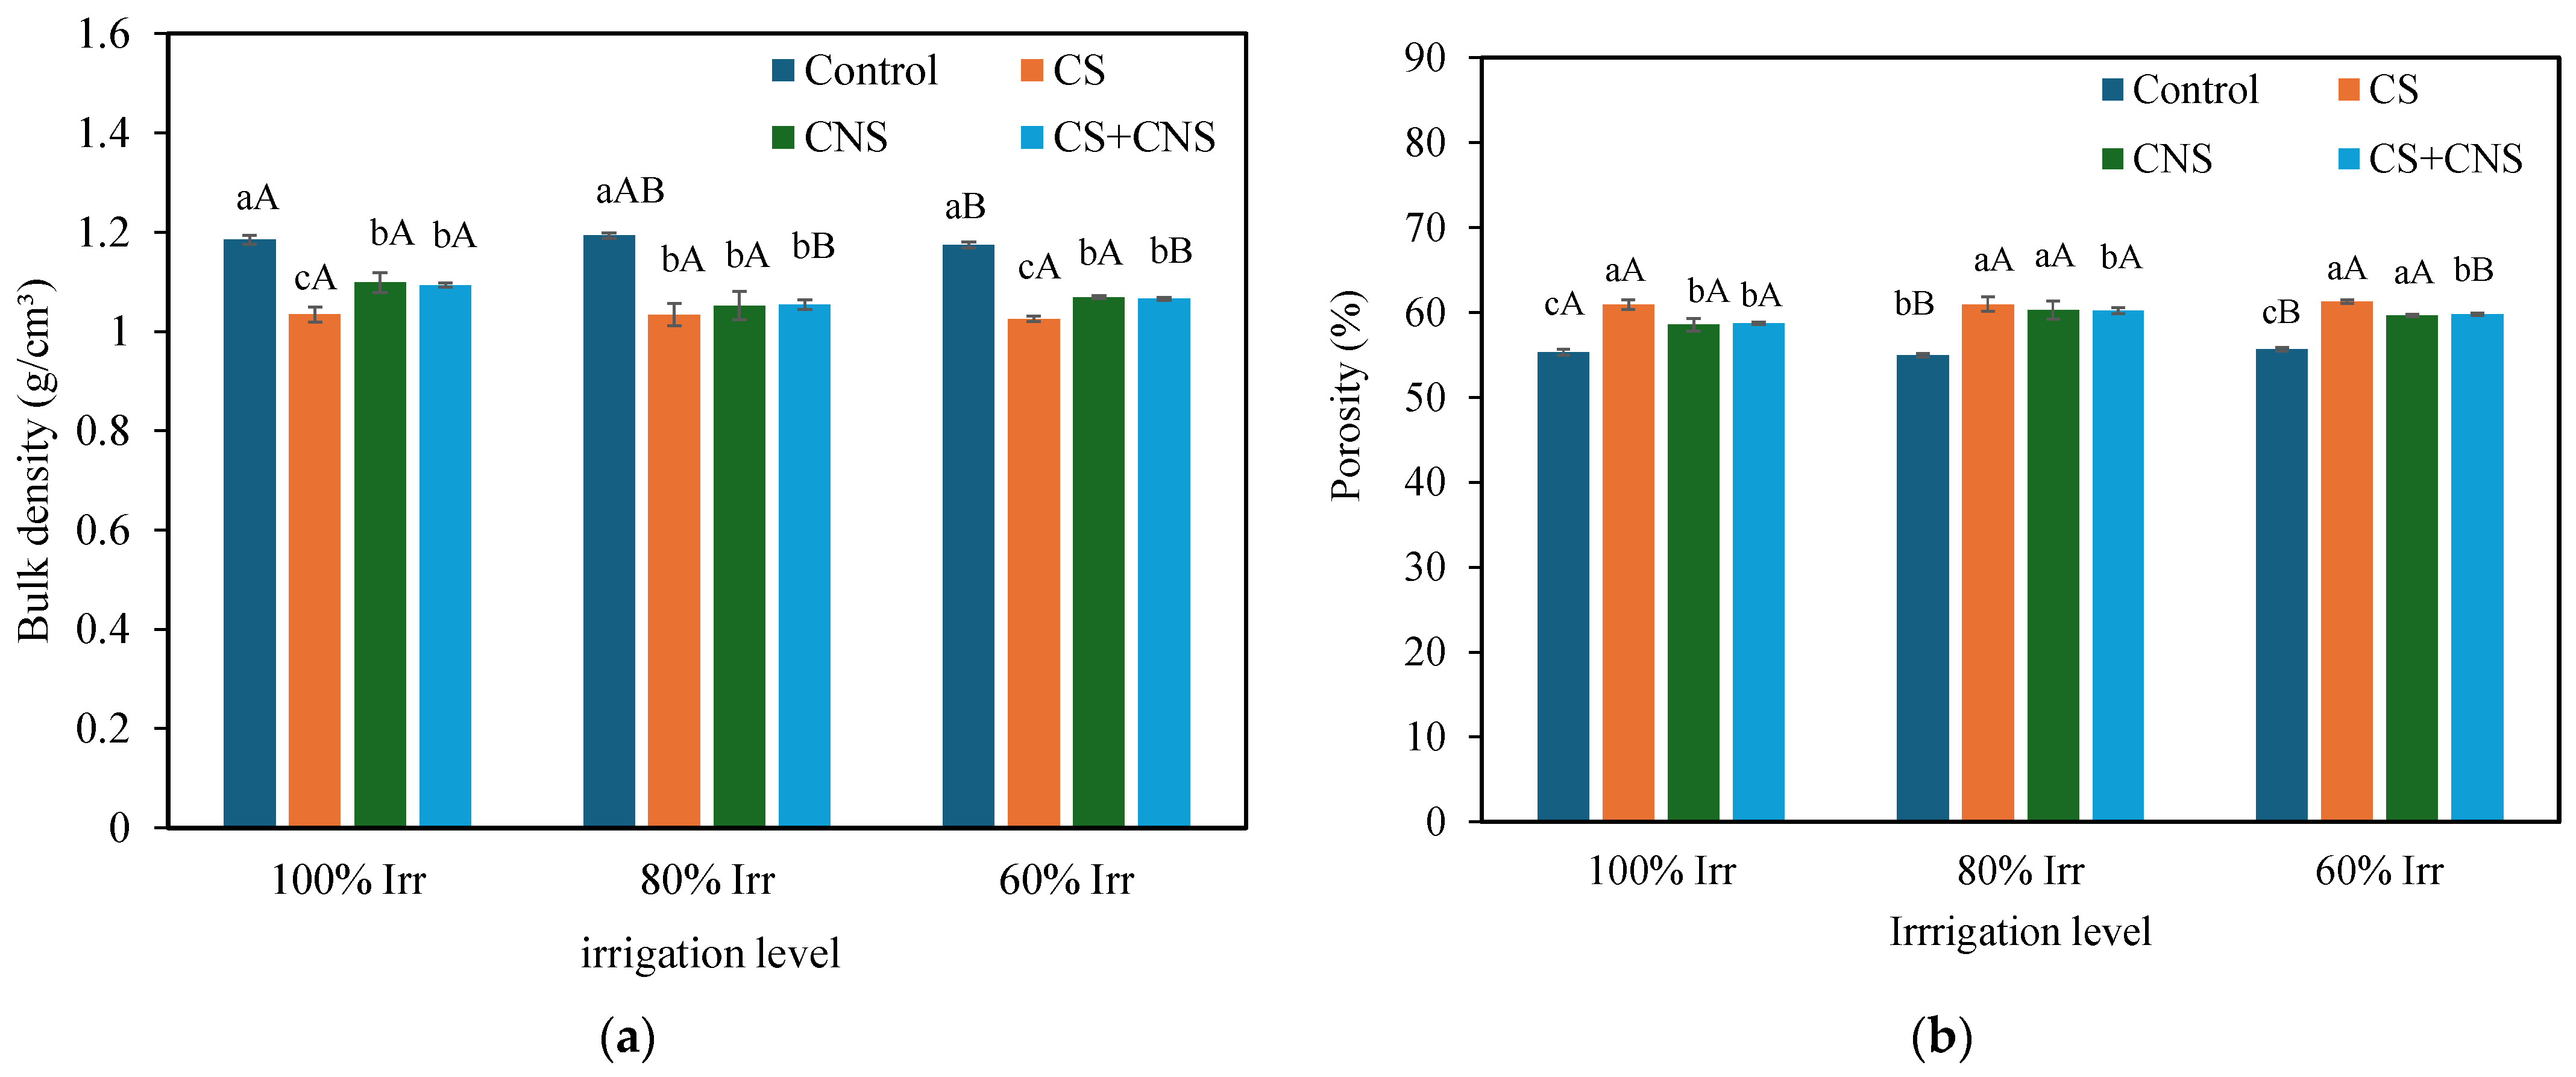
Tukey’s HSD pairwise (α < 0.05) showed that the biochar-amended soils had significantly lower bulk density (5.8–10.9%) compared to unamended soils within each irrigation level (Figure 3). The reduction in soil bulk density resulted to significantly higher porosity in biochar-amended (by 7.2–13.3%, p < 0.05) compared to unamended soils across all irrigation levels (Figure 3). The highest bulk density (1.19 g cm−3) was observed in unamended soil under full irrigation (100% ETc) while the least value was exhibited in CS treating plots (1.02 g cm−3) under 60% of full irrigation. Similar to our results, Ref. [7] reported that biochar (15–30 t ha−1) reduced bulk density of sandy loam soil by up to 8.3% during the first tomato season under deficit irrigation (75% of full ETc). The same study observed that biochar-treated soils consistently had lower bulk density than soil only at full and deficit irrigation (50 and 75% of ETc). Also Ref. [36] reported biochar significantly reduced bulk density of sandy loam soil in Nigeria. Elsewhere, Ref. [37] reported biochar reduced sandy soil bulk density by ~11% reduction similar to changes observed in this present study. Table 2 show that the effect of interaction between treatment and irrigation level is weak (F-3.14, p = 0.02), suggesting biochar effects were consisted across irrigation regimes. Biochar mediated reduction of coarse textured soil bulk density is attributed to biochar pore structure and particle density [29,38] which is independent of irrigation level. Biochar internal pores likely increase soil porosity. The biochars had lower bulk densities (0.22 and 0.53 g cm−3 for CS and CNS, respectively; Table 1) compared to sandy soil (1.23 g cm−3), possibly leading to the decrease in soil bulk density. CS biochar-amended plots had the least bulk density, while plots with CNS and CS+CNS biochar had similar values (Figure 3). This is attributed to the low bulk density of CS biochar compared to CNS biochar (Table 1). These results suggest that changes in soil bulk density and porosity were related to biochar type.
Figure 3.
Biochar effect on (a) soil bulk density and (b) porosity at different irrigation levels. The columns represent mean values ± standard error. Uppercase letters show Tukey’s HSD pairwise comparison of means of each treatment across the three irrigation levels at α < 0.05. Lowercase letters show Tukey’s HSD pairwise comparison of means among treatments within the same irrigation level at α < 0.05. If the letters are different, there is a statistically significant difference among the means of the groups compared. In the graph, 100% irr, 80% irr, and 60% irr represent 100%, 80%, and 60% irrigation regimes, respectively.
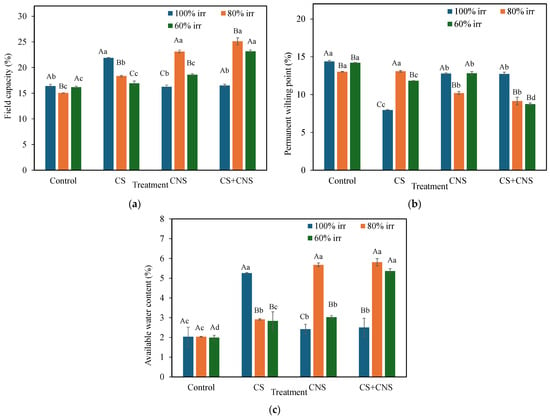
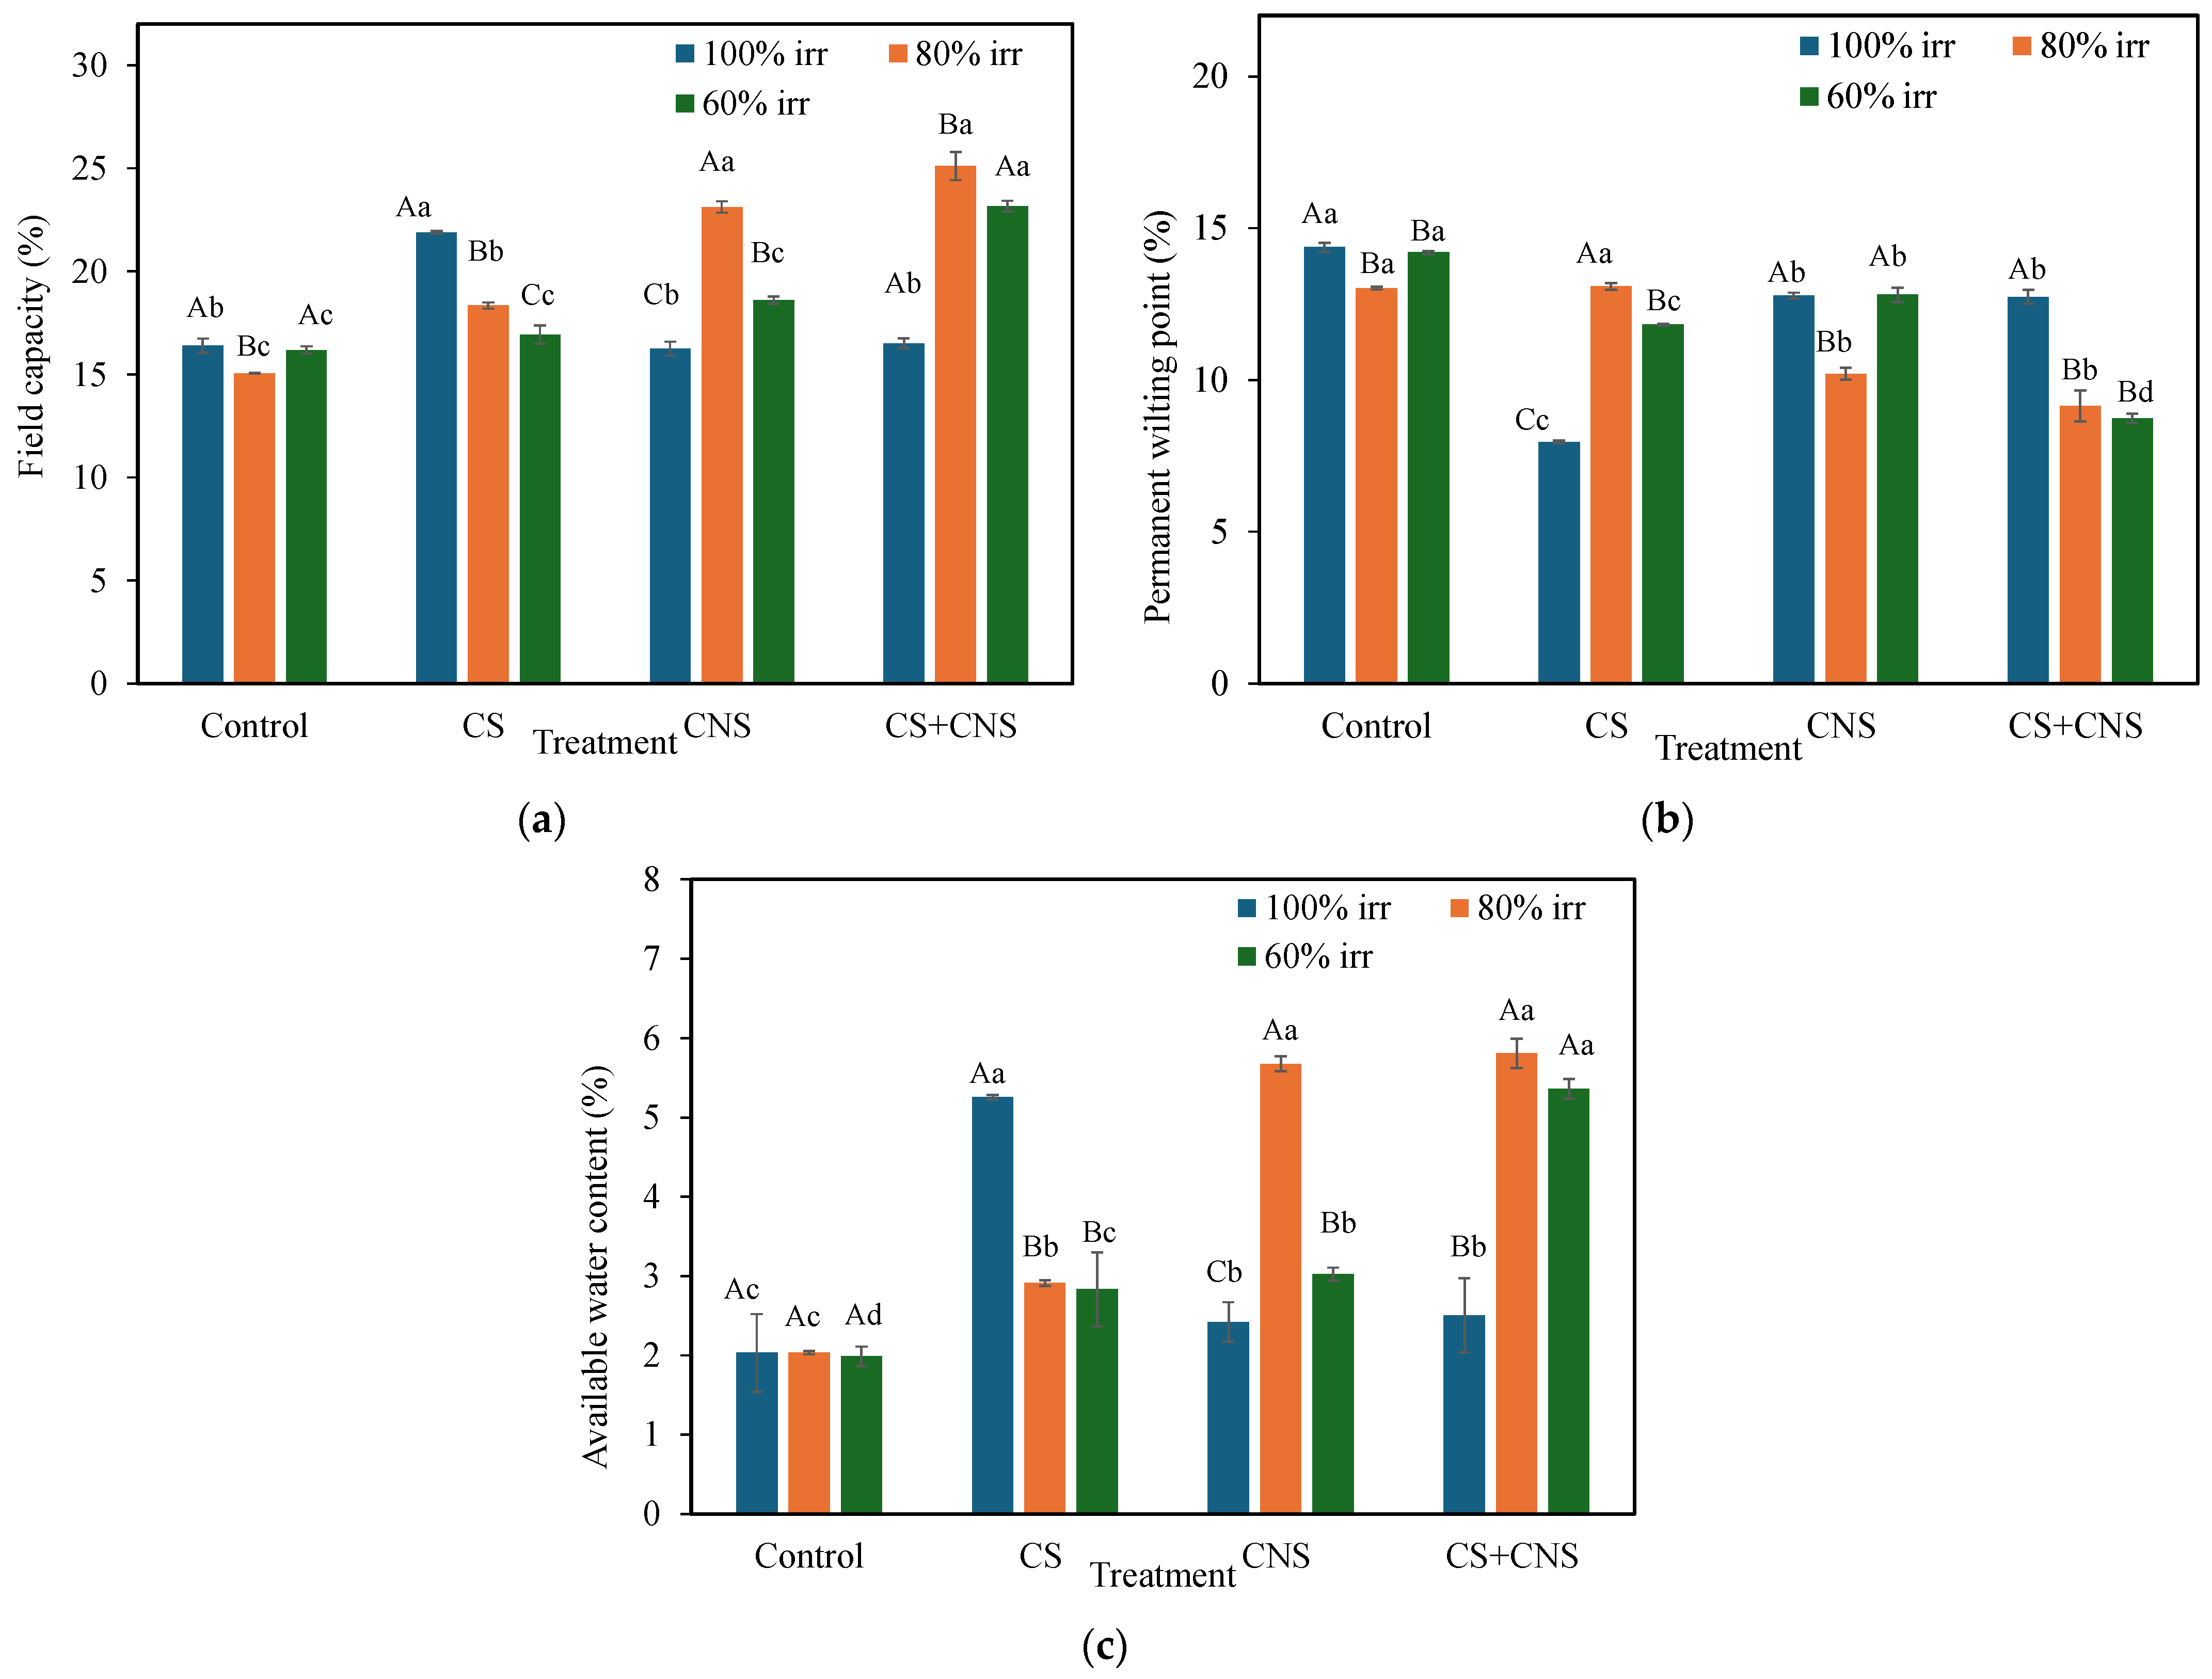
Levene’s test (Table 2) confirms that the assumption of homogeneity of variance of soil FC (p = 0.7524), PWP (p = 0.1892), and AWC (p = 0.1801) was met. The Shapiro–Wilk results show that FC (p = 0.2007; Table 2) was normally distributed, while PWP and AWC were confirmed to be normality distributed via Q-Q plots (Figure S1). The ANOVA model (Table 2) showed that there were significant differences (p < 0.001) in average FC, PWP, and AWC among the different biochar treatments at all irrigation levels. The biochar treatments had a strong effect on soil FC (F = 548, p < 0.001), PWP (F = F518, p < 0.001), and AWC (757, p < 0.001). These large F values reflect low variability within treatments and suggest the strong influence of biochar on soil water retention properties. The experimentation site had sandy soil (96% sand) with very low initial FC (9.57 ± 0.70%), PWP (4.9 ± 0.29%), and AWC (4.65 ± 0.76%). Under such textural and moisture conditions, any slight improvement in soil structure may have led to relatively large changes in soil water retention parameters. Compared to the unamended soil, the CS-, CNS-, and CS+CNS biochar-amended soils had 20.2%, 16.6%, and 26.5% lower PWP, respectively, and higher FC by 19.9%, 26.0%, and 36.8% (Figure 4). Consequently, biochar-treated plots had higher soil available water content, ranging between 19 and 185% more than plots without biochar. Similarly, in South Africa, Ref. [39] reported that application of acacia and eucalyptus biochar increased sandy soil AWC by 69–122%. The authors of [40] reported that biochar combined with deficit irrigation increased soil moisture content (by 141.6%) in a semi-arid region. Also, Ref. [16] observed that biochar increased soil moisture retention in sandy soils under cucumber cultivation in Egypt. The decrease in PWP and increase in FC in this study are close to average meta-analysis changes in sandy soils of 22.2% and 23.9%, respectively [41]. According to [42], biochar significantly improves AWC in sandy soils with <2% organic carbon, with the greatest effects being in soil with high sand fractions, such as those in this study. In each treatment, the average PWP did not differ significantly across irrigation levels, indicating the consistent effect of biochar across irrigation levels. Tukey’s pairwise comparison (p < 0.05) showed that in both biochar-treated soils and unamended soils, the mean FC was different among the irrigation levels (Figure 4). However, no trend was observed for changes in FC with changes in irrigation amounts. The highest and the lowest FC values were observed in plots amended with CS+CNS (25.1%) at 80% of total irrigation and unamended soil (15.1%) at 100% full irrigation. Only CNS biochar-treated plots had significantly different mean AWC values (Tukey, p < 0.05) across the three irrigation levels (Figure 4). These results suggest that biochar’s effect on soil water retention varies with the level of irrigation water. In coarse-textured soils, biochar-mediated increase in soil AWC is primarily attributed to biochar’s high internal porosity, large surface, and high adsorption capacity [43]. Application of mesoporous biochar in sandy soil can increase the soil mesopores, which may result in improved available water content for plants [38]. In the present study, biochar fine particles (<4 mm) likely filled the large pores, enhancing sandy soil microporosity and resulting in increased FC [7]. Despite CS-amended soil having the least bulk density, the highest AWC of 5.8% (about 185% more than unamended soil) occurred in CS+CNS-amended soil under 80% irrigation. The differences in impact of biochar suggests that post-harvest changes in soil AWC may also be strongly influenced by other factors, apart from bulk density and porosity.
Figure 4.
Biochar effect on (a) permanent wilting point (PWP), (b) field capacity (FC), and (c) available water content (AWC) of biochar-treated soils compared to unamended soil. Uppercase letters show Tukey’s HSD pairwise comparison of means of each treatment across the three irrigation levels at α < 0.05. Lowercase letters show Tukey’s HSD pairwise comparison of means among treatments within the same irrigation level at α < 0.05. If the letters are different, there is a statistically significant difference between the means of the groups compared. In the graph, 100% irr, 80% irr, and 60% irr represent 100%, 80%, and 60% irrigation regimes, respectively.
3.3. Biochar Effect on Soil Chemical Properties
The Shapiro–Wilk test (p = 0.6167, Table 2) and Levene’s test (p = 0.690, Table 2) show that the assumptions of normality and homogeneity of variance of soil pH were met.
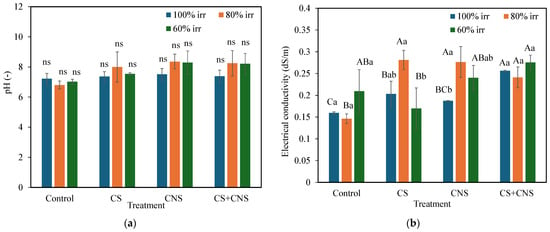
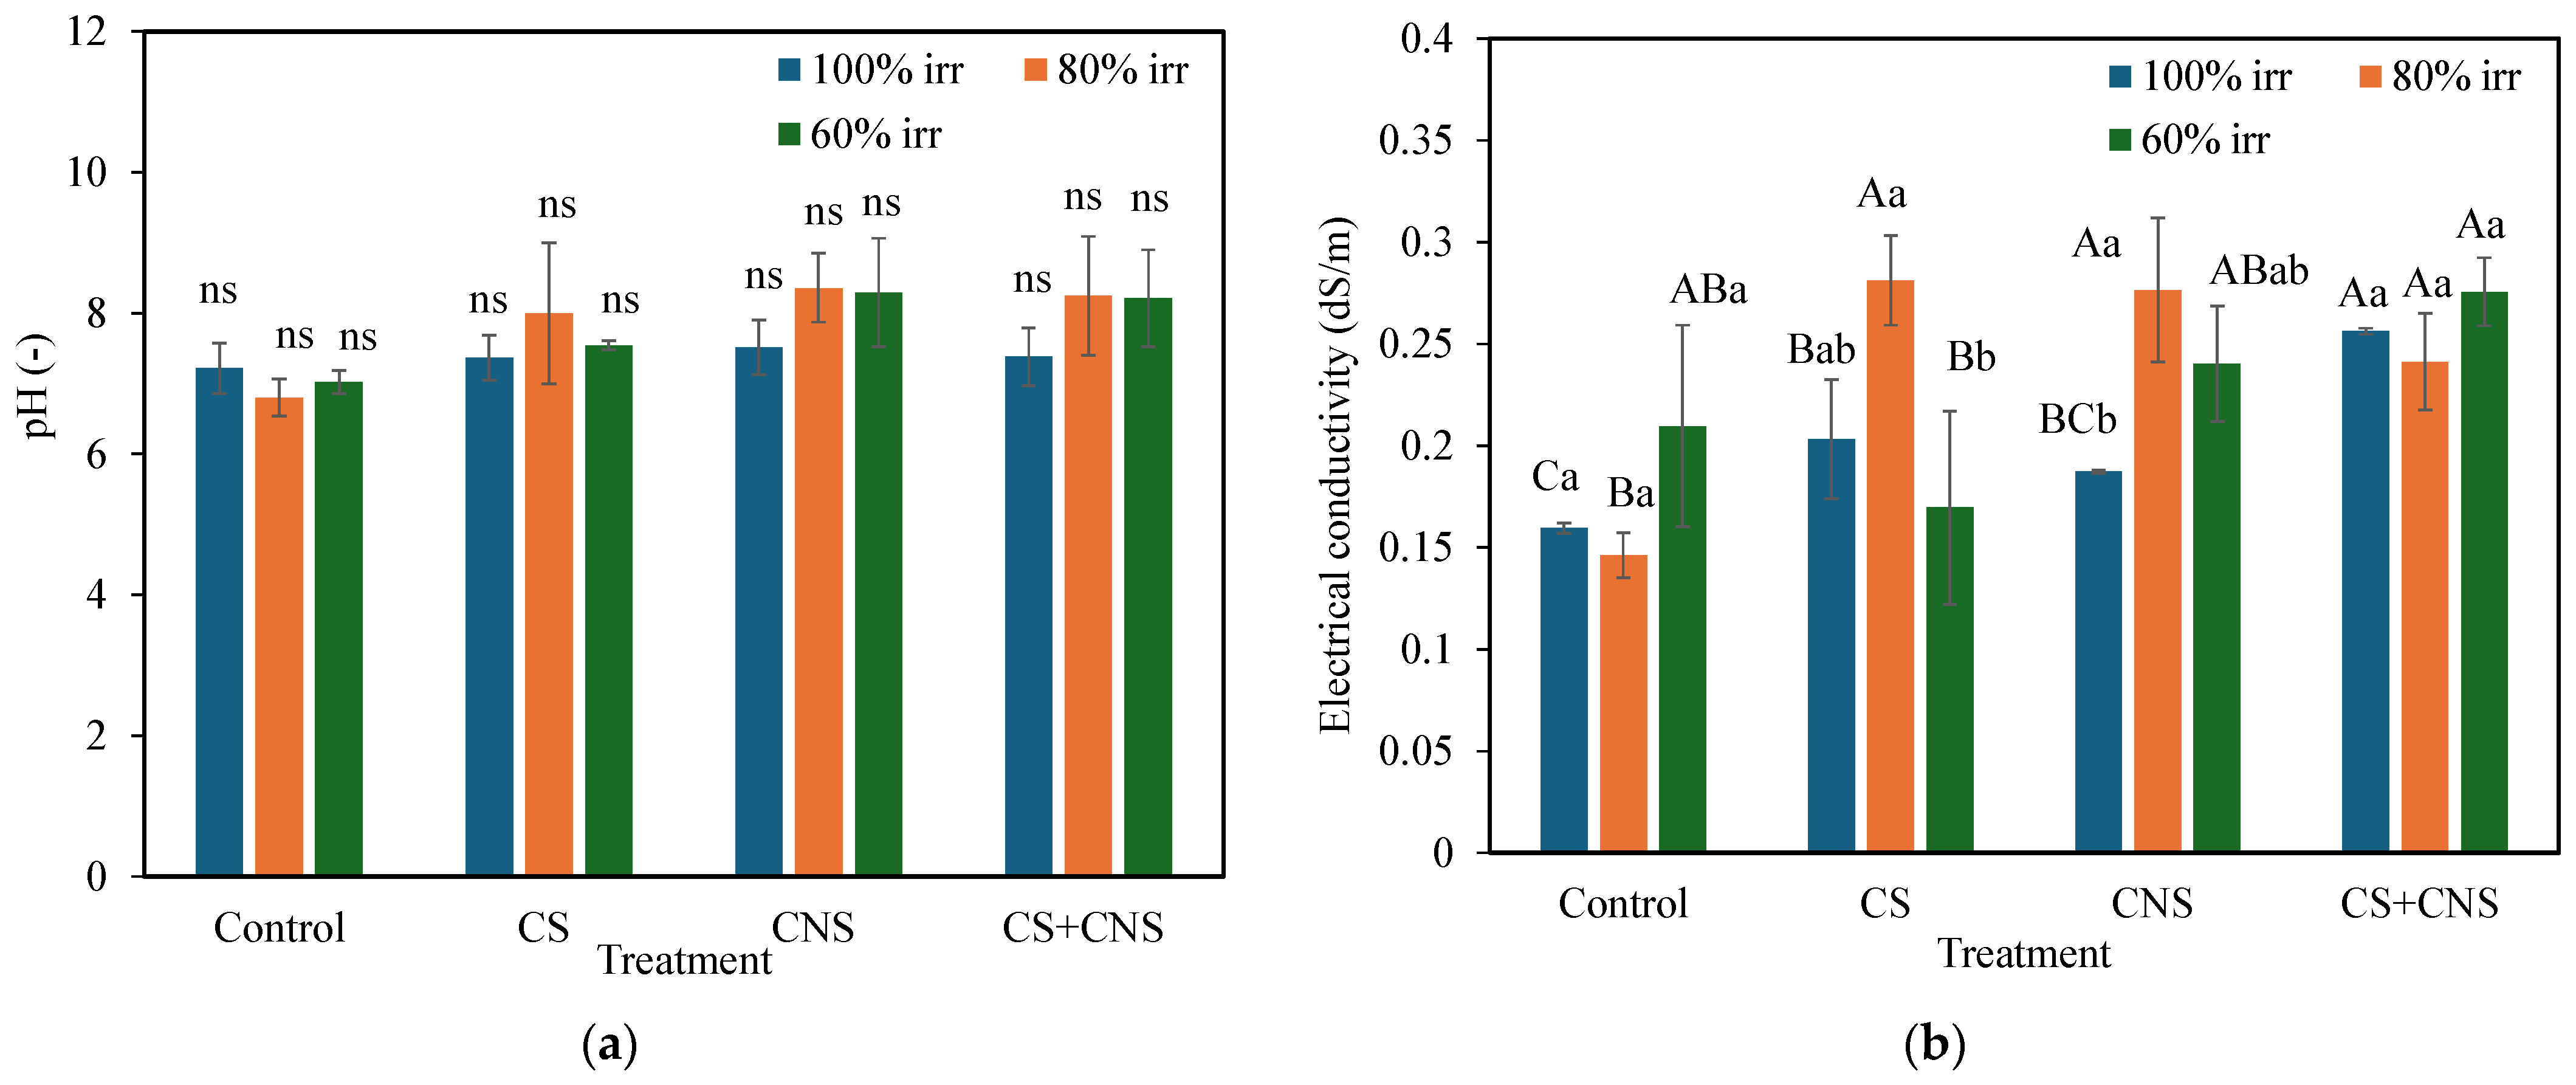
The ANOVA analysis (Table 2) indicates that the mean soil pH of at least one treatment type is significantly different (F = 6.34, p = 0.003) from the others. However, the low F value (6.34) in the ANOVA model suggests that biochar may have a weak effect on soil pH. Tukey’s HSD pairwise comparison (α < 0.05) revealed that the mean soil pH of biochar-treated plots was not significantly different from that of unamended plots for each irrigation level. Further, Tukey’s HSD pairwise comparison (α < 0.05) revealed that the mean soil pH for each treatment did not differ significantly across irrigation levels. Studies have reported similar findings where biochar did not significantly alter soil pH in short-term field studies [44,45]. Contrary to such studies, Ref. [46] reported that biochar increased the pH of acidic sandy soil in Nigeria. In that study [47], alkaline biochar (pH of 7.62) was applied to acidic soil (pH of 5.6), causing an increase in soil pH. The authors of [13] reported that application of water hyacinth biochar raised the pH of acidic sandy soil under maize cultivation by 0.37–0.72. In their meta-analysis, the authors of [48] found that biochar has a negligible effect on the pH of alkaline soils compared to acidic soils. The non-significant effect of alkaline biochar (pH of 9.9–10.2) on initially slightly alkaline soil (7.1 ± 0.6) suggests limited responsiveness of slightly alkaline soil to biochar applications. This may be attributed to the strong buffering capacity of alkaline soil and the likely slow mineralization of carbonates in biochar, which may have suppressed short-term rapid changes in pH. The highest pH (8.36) was observed in CNS biochar-amended plots, while the lowest pH (6.8) was found in unamended soils under the 80% irrigation level (Figure 5). CNS biochar is slightly more alkaline (pH of 10.2) than CS biochar (pH of 9.9), which may have led to slightly the higher effect on soil pH. Soil EC increased significantly under CNS and CS+CNS biochar treatments (p < 0.001), reaching 0.23–0.26 dS m−1 and 0.26 ± 0.02 dS/m, respectively. There was a significant difference in mean EC. All EC values remained well below salinity thresholds (<4 dS/m) [47], indicating no salinity risk with these biochars.
Figure 5.
Effect of biochar on soil (a) pH and (b) electrical conductivity (EC) at different irrigation levels. The data in parenthesis are the mean values for each treatment. Uppercase letters show Tukey’s HSD pairwise comparison of means of each treatment across the three irrigation levels at α < 0.05. Lowercase letters show Tukey’s HSD pairwise comparison of means among treatments within the same irrigation level at α < 0.05. If the letters are different, there is a statistically significant difference between the means of the groups compared. In the graph, 100% irr, 80% irr, and 60% irr represent 100%, 80%, and 60% irrigation regimes, respectively; ns indicates no significant differences among the means tested using Tukey’s HSD pairwise at p < 0.05.
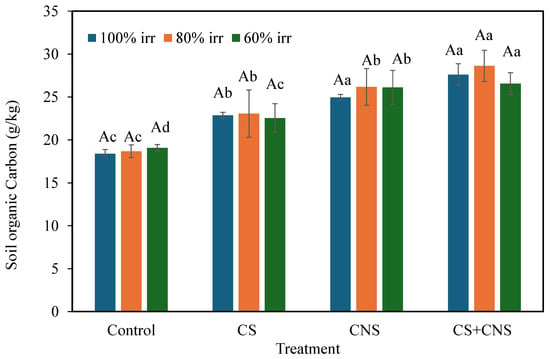
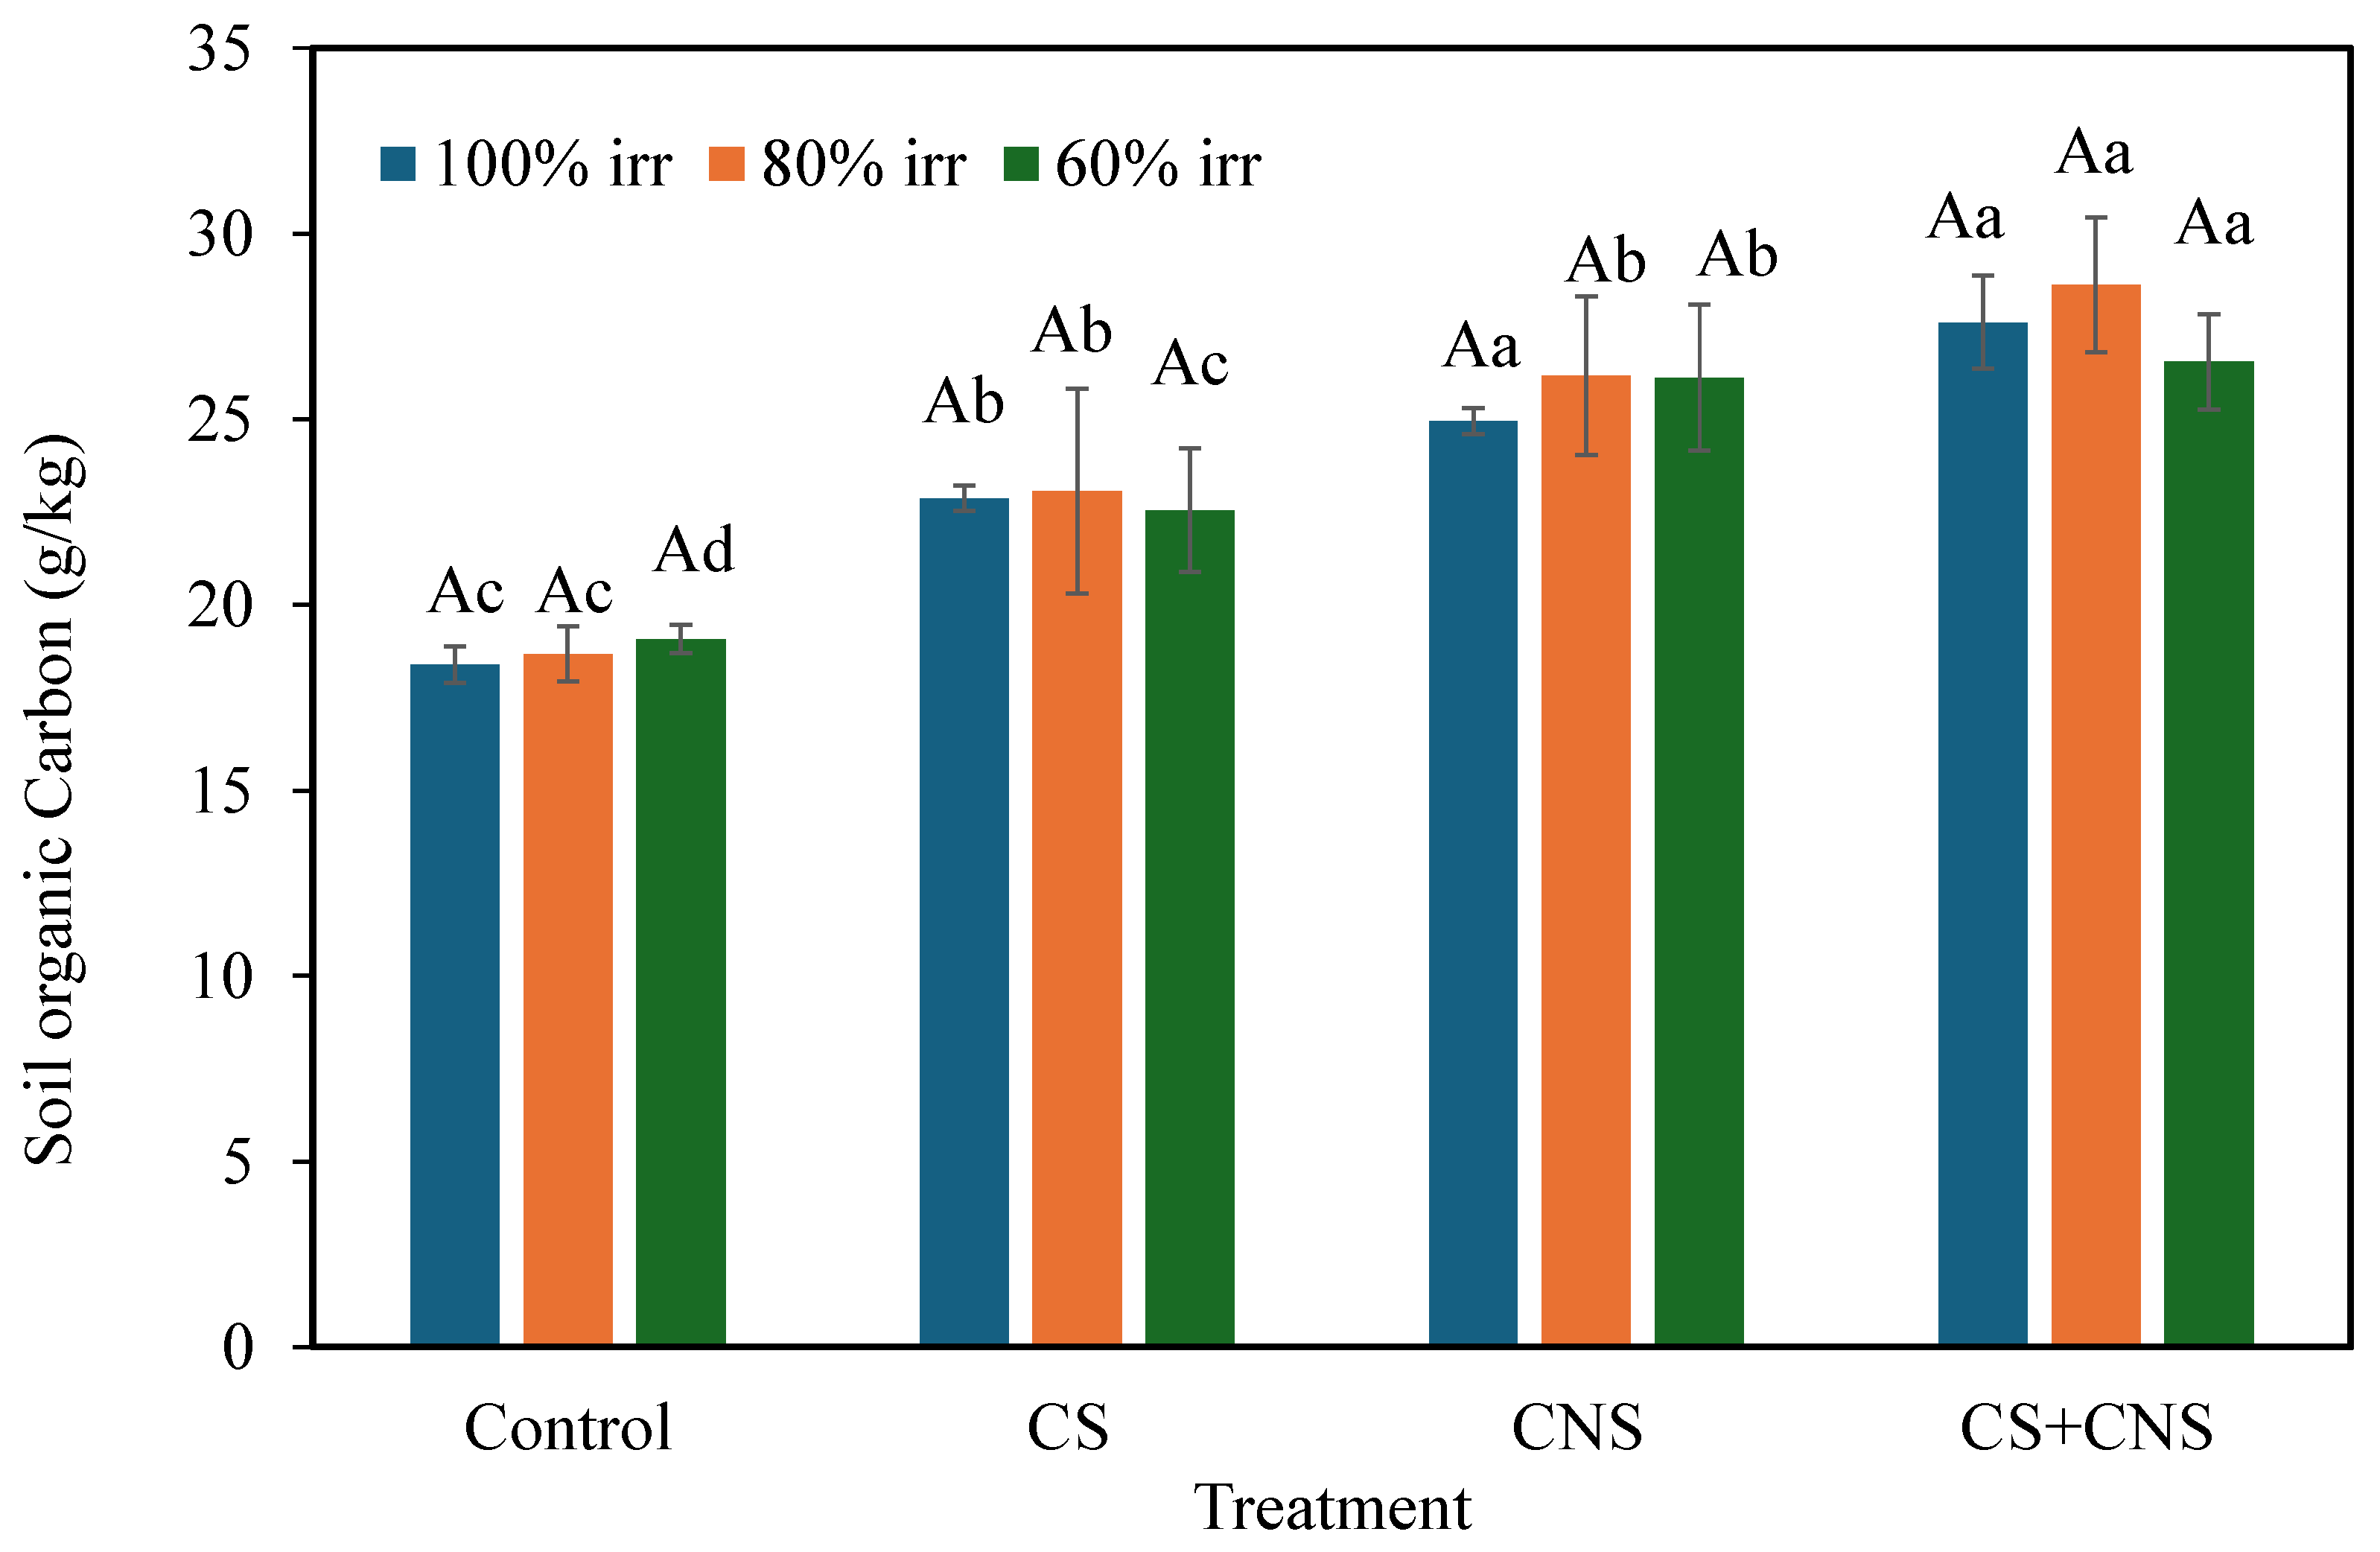
Soil organic carbon (SOC) plays a vital role in maintaining soil health by improving nutrient cycling, aggregation, and water-holding capacity. SOC improvement has a significant and linear positive correlation with crop-yield changes [48]. ANOVA analysis (Table 2) showed that at least one treatment group had significantly (F = 62.15, p < 0.001) different average SOC from others treatment groups. Biochar-amended soils had significantly higher SOC of 18.1–24.4% for CS, 35.7–40.1% for CNS and 39.1–53.2% for CS+CNS relative to unamended soils Figure 6. These findings are consisted with [13] who reported biochar raised soil organic carbon by 38.5–56.3% in Ethiopia and 29% increase in SOC observed in Burkina Faso [20]. The increase in SOC is attributed to direct contribution from biochar’s stable carbon which is immediately added to soil carbon pool.
Figure 6.
Soil organic carbon soil at different irrigation levels. The data in parenthesis present the mean values for each treatment. Uppercase letters show Tukey’s HSD pairwise comparison of means of each treatment across the three irrigation levels at α < 0.05. Lowercase letters show Tukey’s HSD pairwise comparison of means among treatments within the same irrigation level at α < 0.05. If the letters are different, there is a statistically significant difference between the means of the groups compared. In the graph, 100% irr, 80% irr, and 60% irr represent 100%, 80%, and 60% irrigation regimes, respectively.
Tukey’s HSD (p < 0.05) revealed that the difference between mean SOC among biochar types was only significant under full irrigation. The highest and least SOC was recorded in CS+CNS biochar-amended soils (28.61 ± 1.82 g/kg) and unamended soils (18.68 ± 0.75 g/kg) respectively all under 80% irrigation regime. SOC of all treatments was stable and did not differ across irrigation levels. The experiment period was too short (45 days) for effective differential decomposition of organic matter to occur related to differences in soil water content. All biochar treatments raised SOC above the critical threshold of 20 g kg−1 for healthy croplands [49]. Improving soil organic carbon may improve soil water stress resilience.
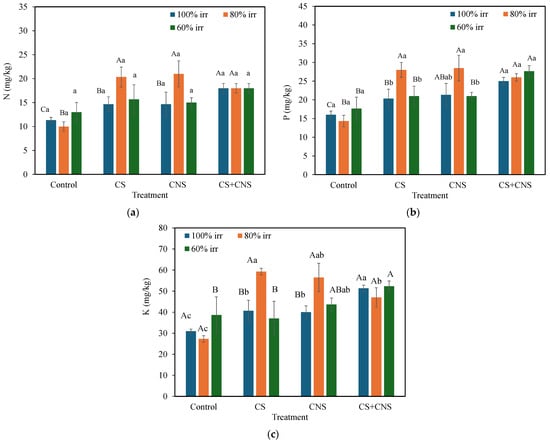
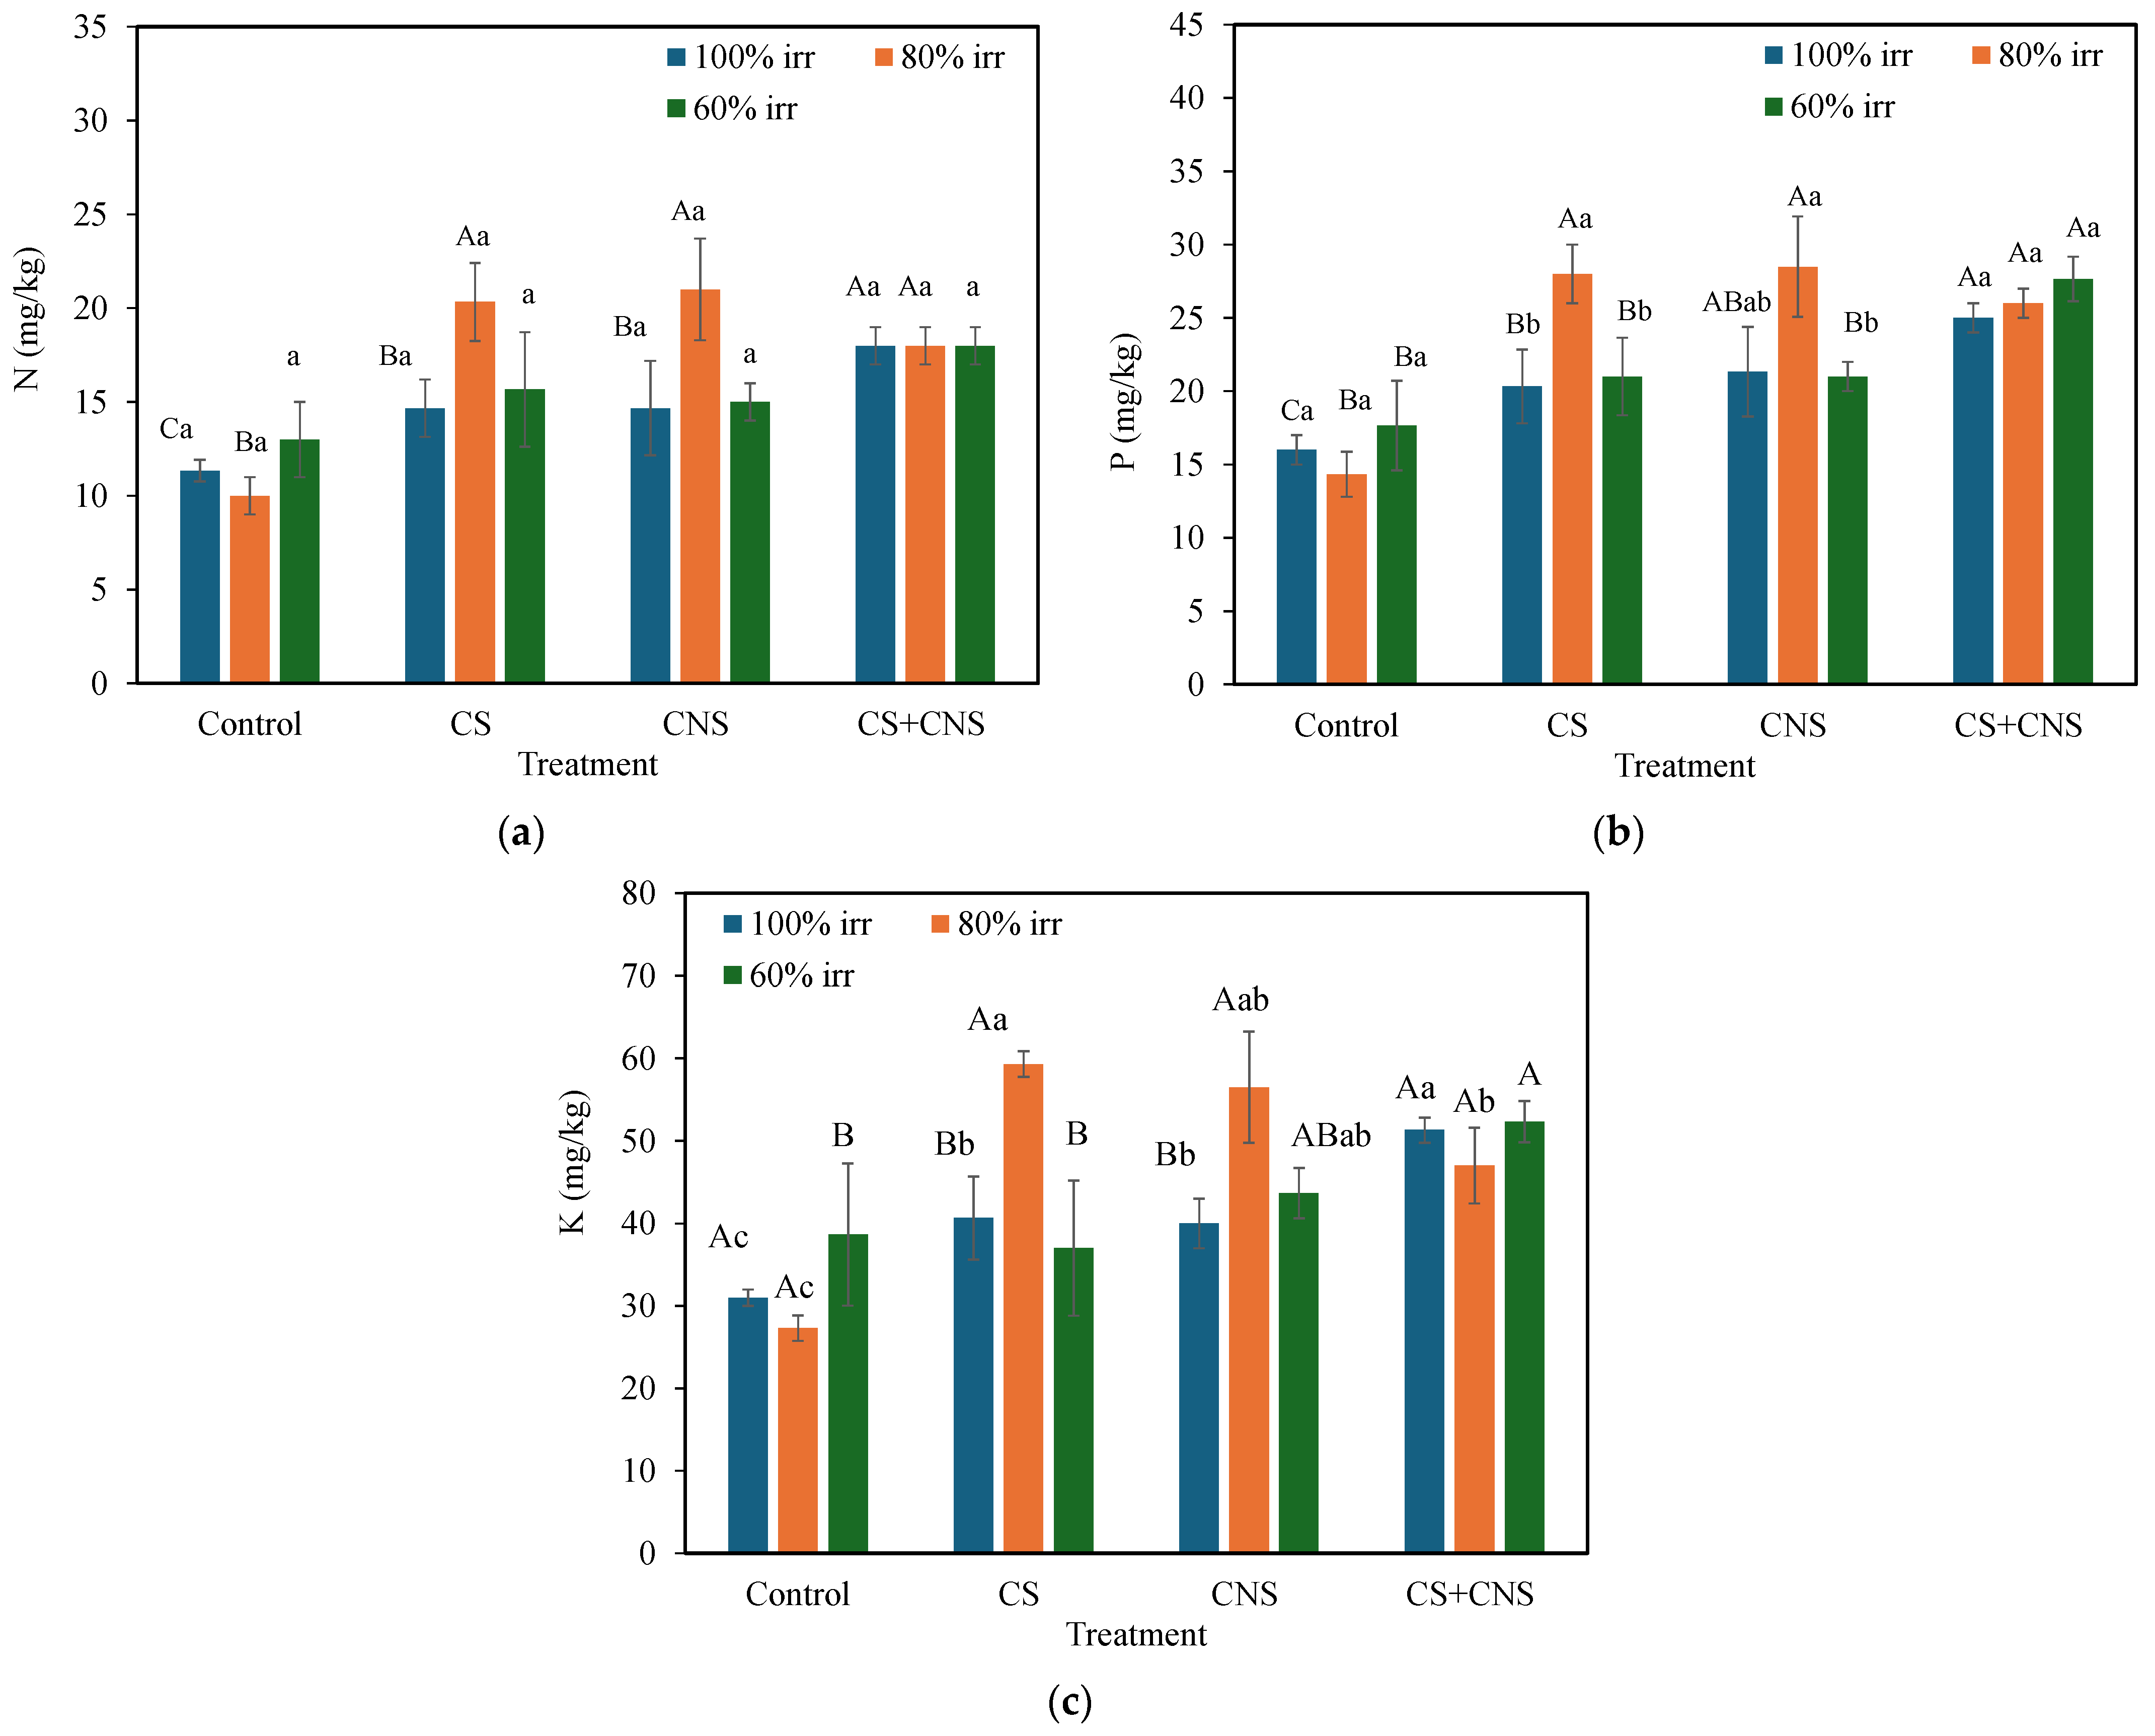
Figure 7 shows the effect of biochar on soil macronutrients (N, P, and K). Biochar significantly increased soil N (by 5.4–6.6 mg/kg, p < 0.001), P (by 7.1–10.2 mg/kg, p < 0.001), and K (by 13.4–17.9 mg/kg, p < 0.001) compared to unamended soil. The N, P, and K values reported here are the available nutrient content. The ANOVA model indicates that the treatment has a stronger effect on soil N (F = 22.24, p < 0.001), P (F = 33.44, p < 0.001), and K (F = 23.16, p < 0.001). The low F values ranging between 4.9 and 8. suggest a weak (biochar x irrigation) interactive effect on soil macronutrient availability. Also, Ref. [50] reported that biochar applied at 10–30 tons/ha significantly increased soil N, P, and K of tropical sandy soils in Nigeria under sweet potato cultivation. Also, Ref. [51] observed that application of bone-derived biochar increased soil N, P, and K within a short tomato cultivation period, with a 33.3% increase in N. A recent meta-analysis reported that, on average, biochar increased sandy-textured soil N, P, and K by about 36%, 34%, and 15%, respectively [52]. Short-term increases in soil macronutrients following biochar application are associated with improved nutrient retention and reduced leaching. Tukey’s HSD test (p < 0.05) revealed no significant differences in mean N, P, and K among different biochar types. Under the 100% irrigation regime, biochar-treated soils had significantly (p < 0.05) higher K values compared to control, but there was no significant difference between CS and CNS biochar-treated soils. Only CS+CNS biochar-treated soils had significantly higher N and P values compared to control under 100% irrigation level. Generally, biochar impact on soil macronutrient availability was highest under moderate irrigation (80% of crop available water). Under deficit irrigation (60% of crop water demand), biochar had no significant effect on soil N, P, and K. These results suggest that the effect of biochar on soil macronutrients under extreme reduced irrigation levels (60%) is limited. Therefore, reducing crop irrigation water by 40% may have detrimental effects on soil macronutrient availability. The coarse soils’ porous nature may allow effective integration of biochar into soil structure, enhancing nutrient retention and reducing mineral leaching [52]. In coarse-textured soils, the porous structure of biochar may also physically trap fine soil particles, binding them together. The p-values (23.1–26.2 mg/kg) were below the average agronomic p threshold for leafy vegetables, i.e., 46.0 mg·/kg, needed for optimum yields [53].
Figure 7.
Effect of biochar on soil (a) N, (b) P, and (c) K content at different irrigation levels. Uppercase letters show Tukey’s HSD pairwise comparison of means of each treatment across the three irrigation levels at α < 0.05. Lowercase letters show Tukey’s HSD pairwise comparison of means among treatments within the same irrigation level at α < 0.05. If the letters are different, there is a statistically significant difference among the means of the groups compared. In the graph, 100% irr, 80% irr, and 60% irr represent 100%, 80%, and 60% irrigation regimes, respectively.
3.4. Effect of Biochar on Lettuce Yield
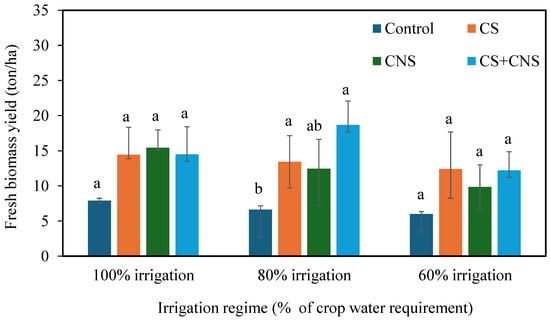
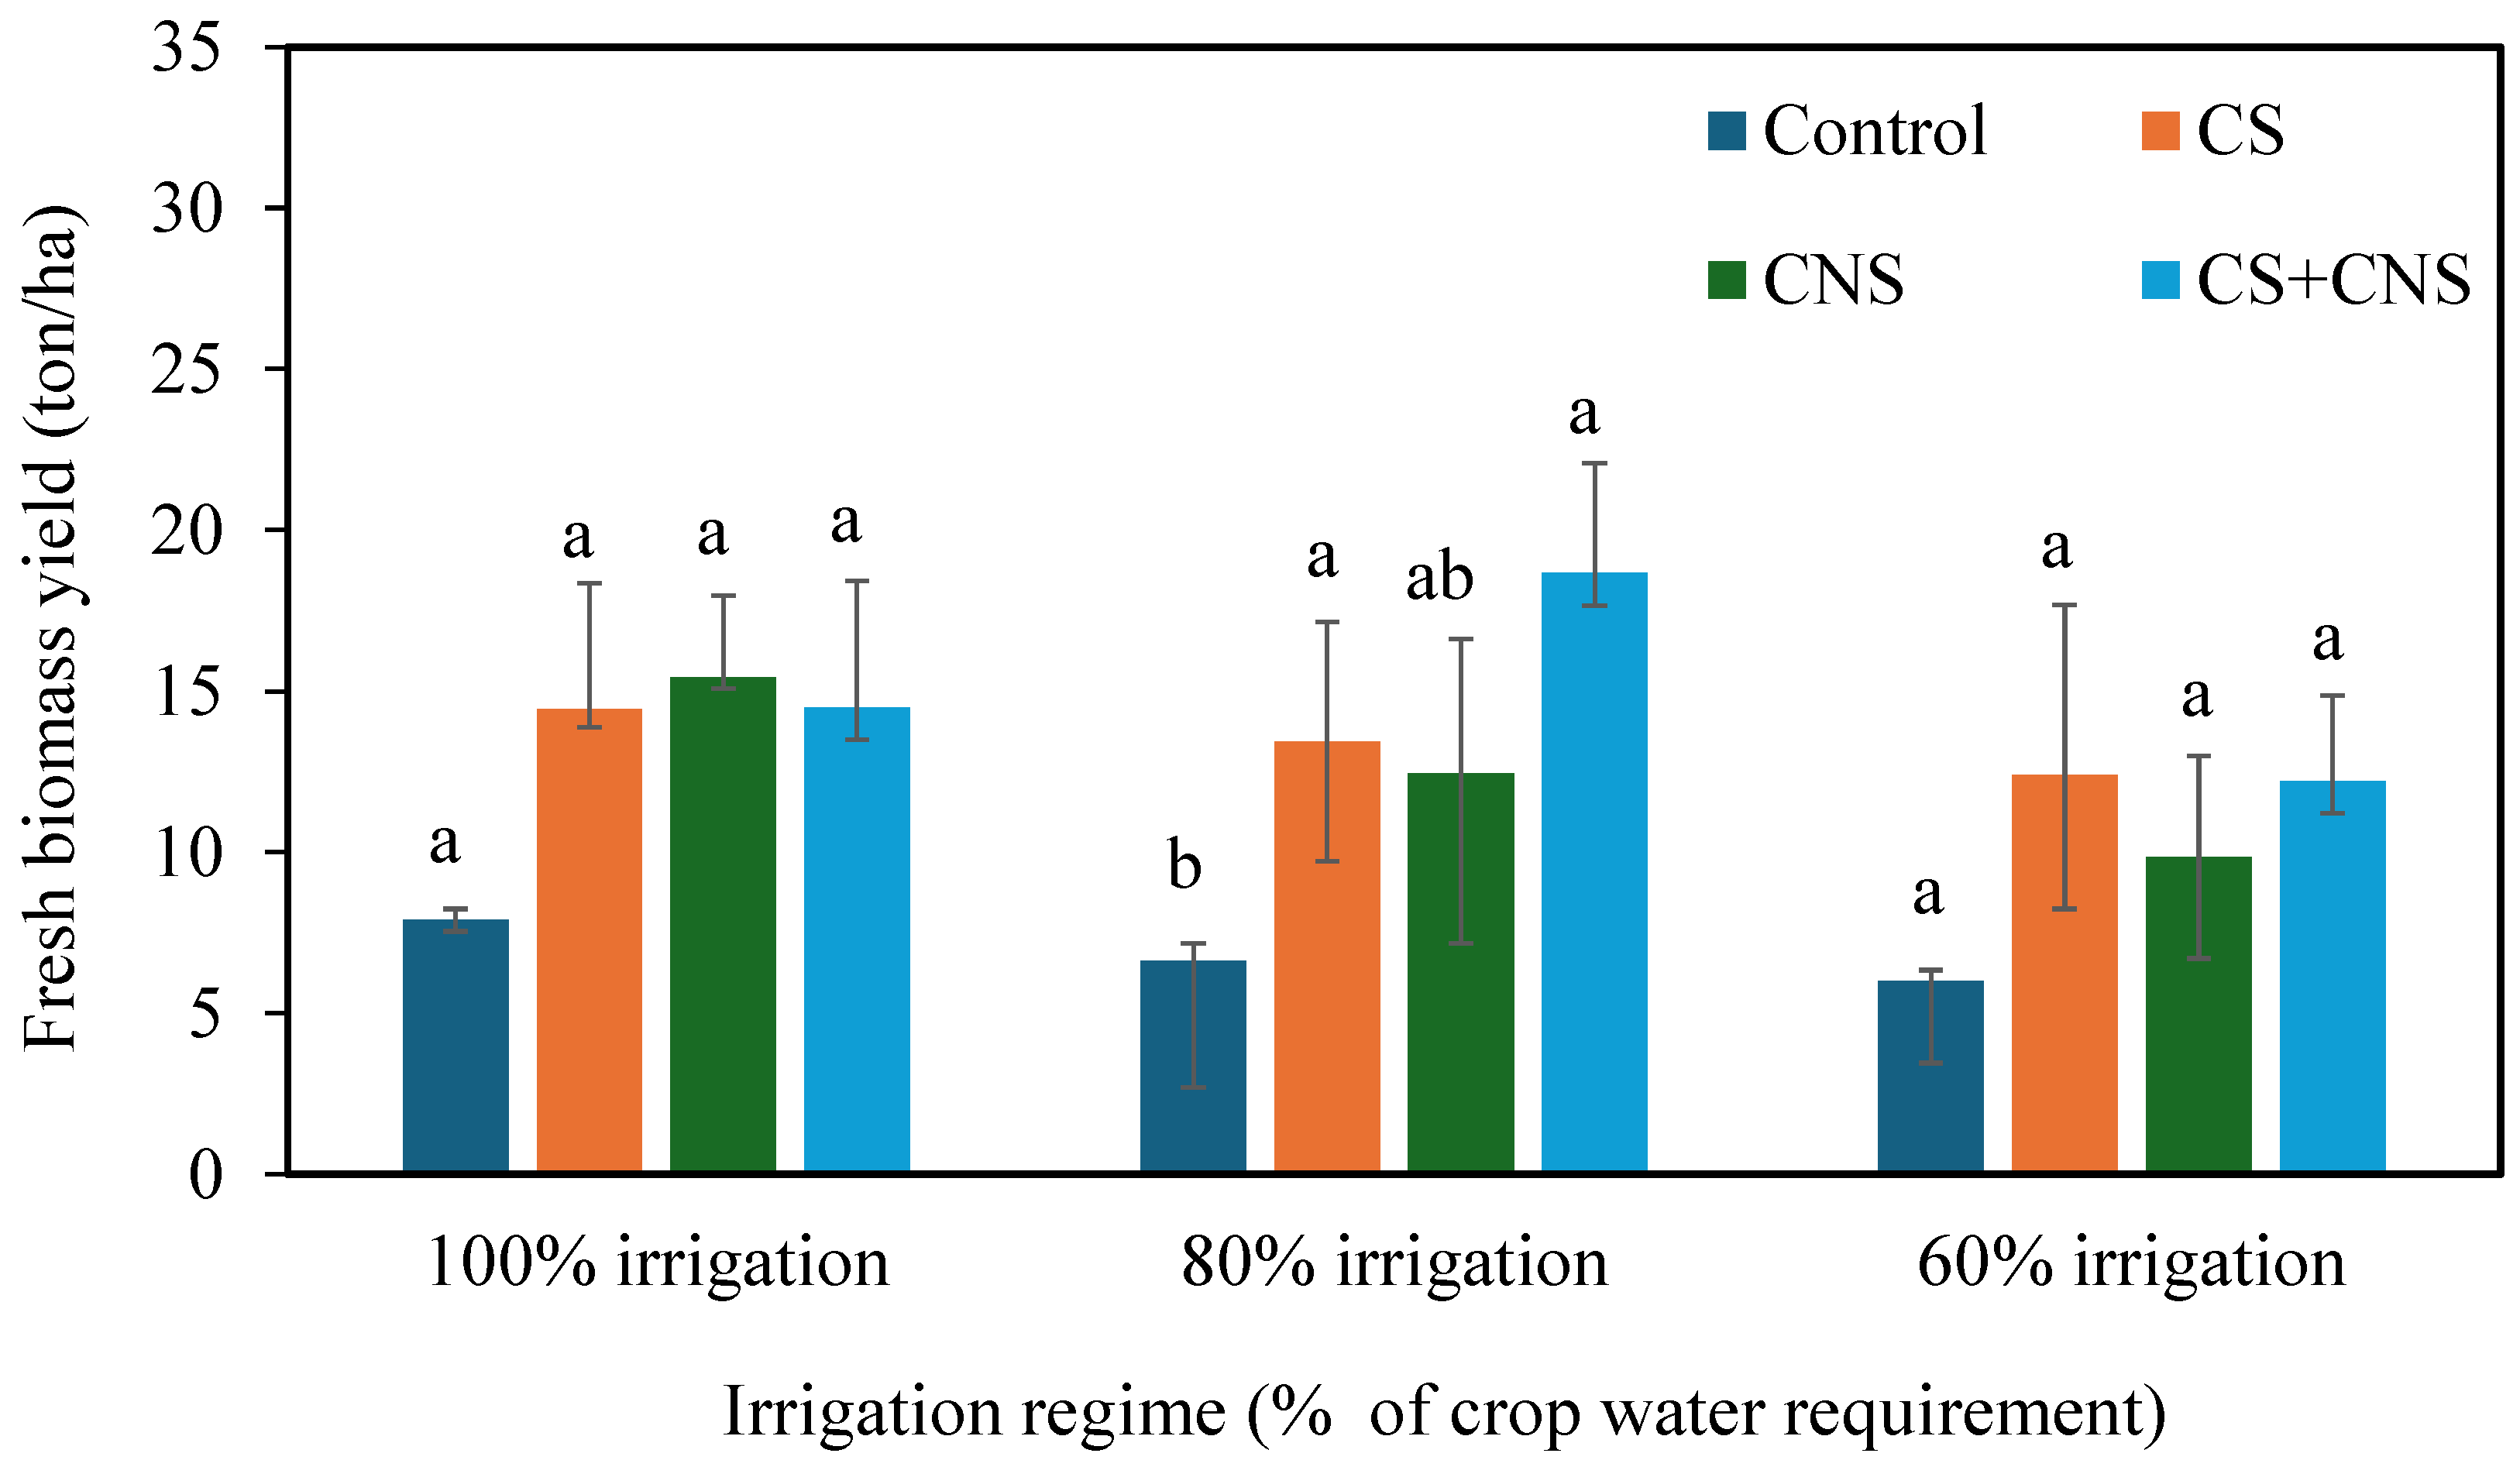
The ANOVA test (Table 3) showed that the mean fresh biomass lettuce yield of the biochar treatments was significantly different (F = 13.64, p < 0.001). Tukey’s HSD (p < 0.05; Figure 8) showed that biochar-amended plots had significantly higher fresh, marketable yields than unamended soils only under moderate irrigation (80% ETc). Nevertheless, biochar-amended plots consistently produced higher lettuce biomass yields (9.8–18.7 tons/ha) than plots without biochar (6–7.9 tons/ha). This corresponds to an average of 100.2% more yields in biochar-treated plots than unamended soil. In sandy loam soil, Ref. [51] reported that biochar (10–40 t ha−1) increased the number of tomato fruits by 50–57.1 and boosted yields by up to 289–300%. In another study, biochar increased aboveground sunflower biomass by 1.3–28.3% under deficit irrigation (60% ETc) [54], consistent with the present study. According to meta-analysis by [14], biochar can increase crop yield by 10–42%. The lettuce yields in biochar-treated soils in this study are still below the optimum 20 t/ha fresh lettuce yields in tropical climates [11] because the biochar did not meet the lettuce’s nutrient demands.
Table 3.
Statistical analysis data performed on lettuce biomass yield.
Figure 8.
Effect of biochar on fresh, marketable lettuce biomass yield. The values in paratheses show mean yields per treatment. The small letters indicate statistically significant differences (p < 0.05, Tukey’s HSD) within each irrigation regime. The error bars show standard errors of the mean values.
As expected, lettuce yields declined with reduction in irrigation water quantity, except for CS+CNS, which had the optimum yield of 18.6 tons/ha at 80% ETc. CS+CNS plots had the highest macronutrient content, SOC, and AWC under 80% ETc irrigation levels, which could have contributed to higher yields. Biochar did not have a significant effect on soil macronutrients under 100% ETc (N and P) and 60%ETc (N, P, and K), and this may have contributed to the lack of significant yield response. Remarkably, CS (12.4 ± 5.2 t ha−1), CNS (9.8 ± 3.1 t ha−1), and CS+CNS (12.2 ± 2.7 t ha−1) under deficit irrigation (60% ETc) produced higher fresh biomass lettuce yield than unamended soils (7.9 ± 0.3 t ha−1) at full irrigation (100% ETc). These results agree with the findings of [7], who reported that biochar-amended soils irrigated with 50% of full irrigation water produced higher tomatoes yields that untreated soils at full irrigation. Our results suggest that application of 10 t ha−1 of CS+CNS biochar in sandy soils could help save 20% irrigation water (~35 m3 ha−1 per day) without compromising fresh, marketable lettuce yields.
3.5. Linkages Between Soil Properties, Water Availability, and Lettuce Yield Under Varying Irrigation Levels
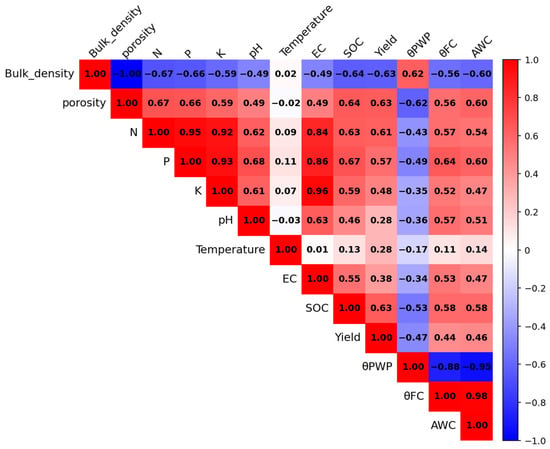
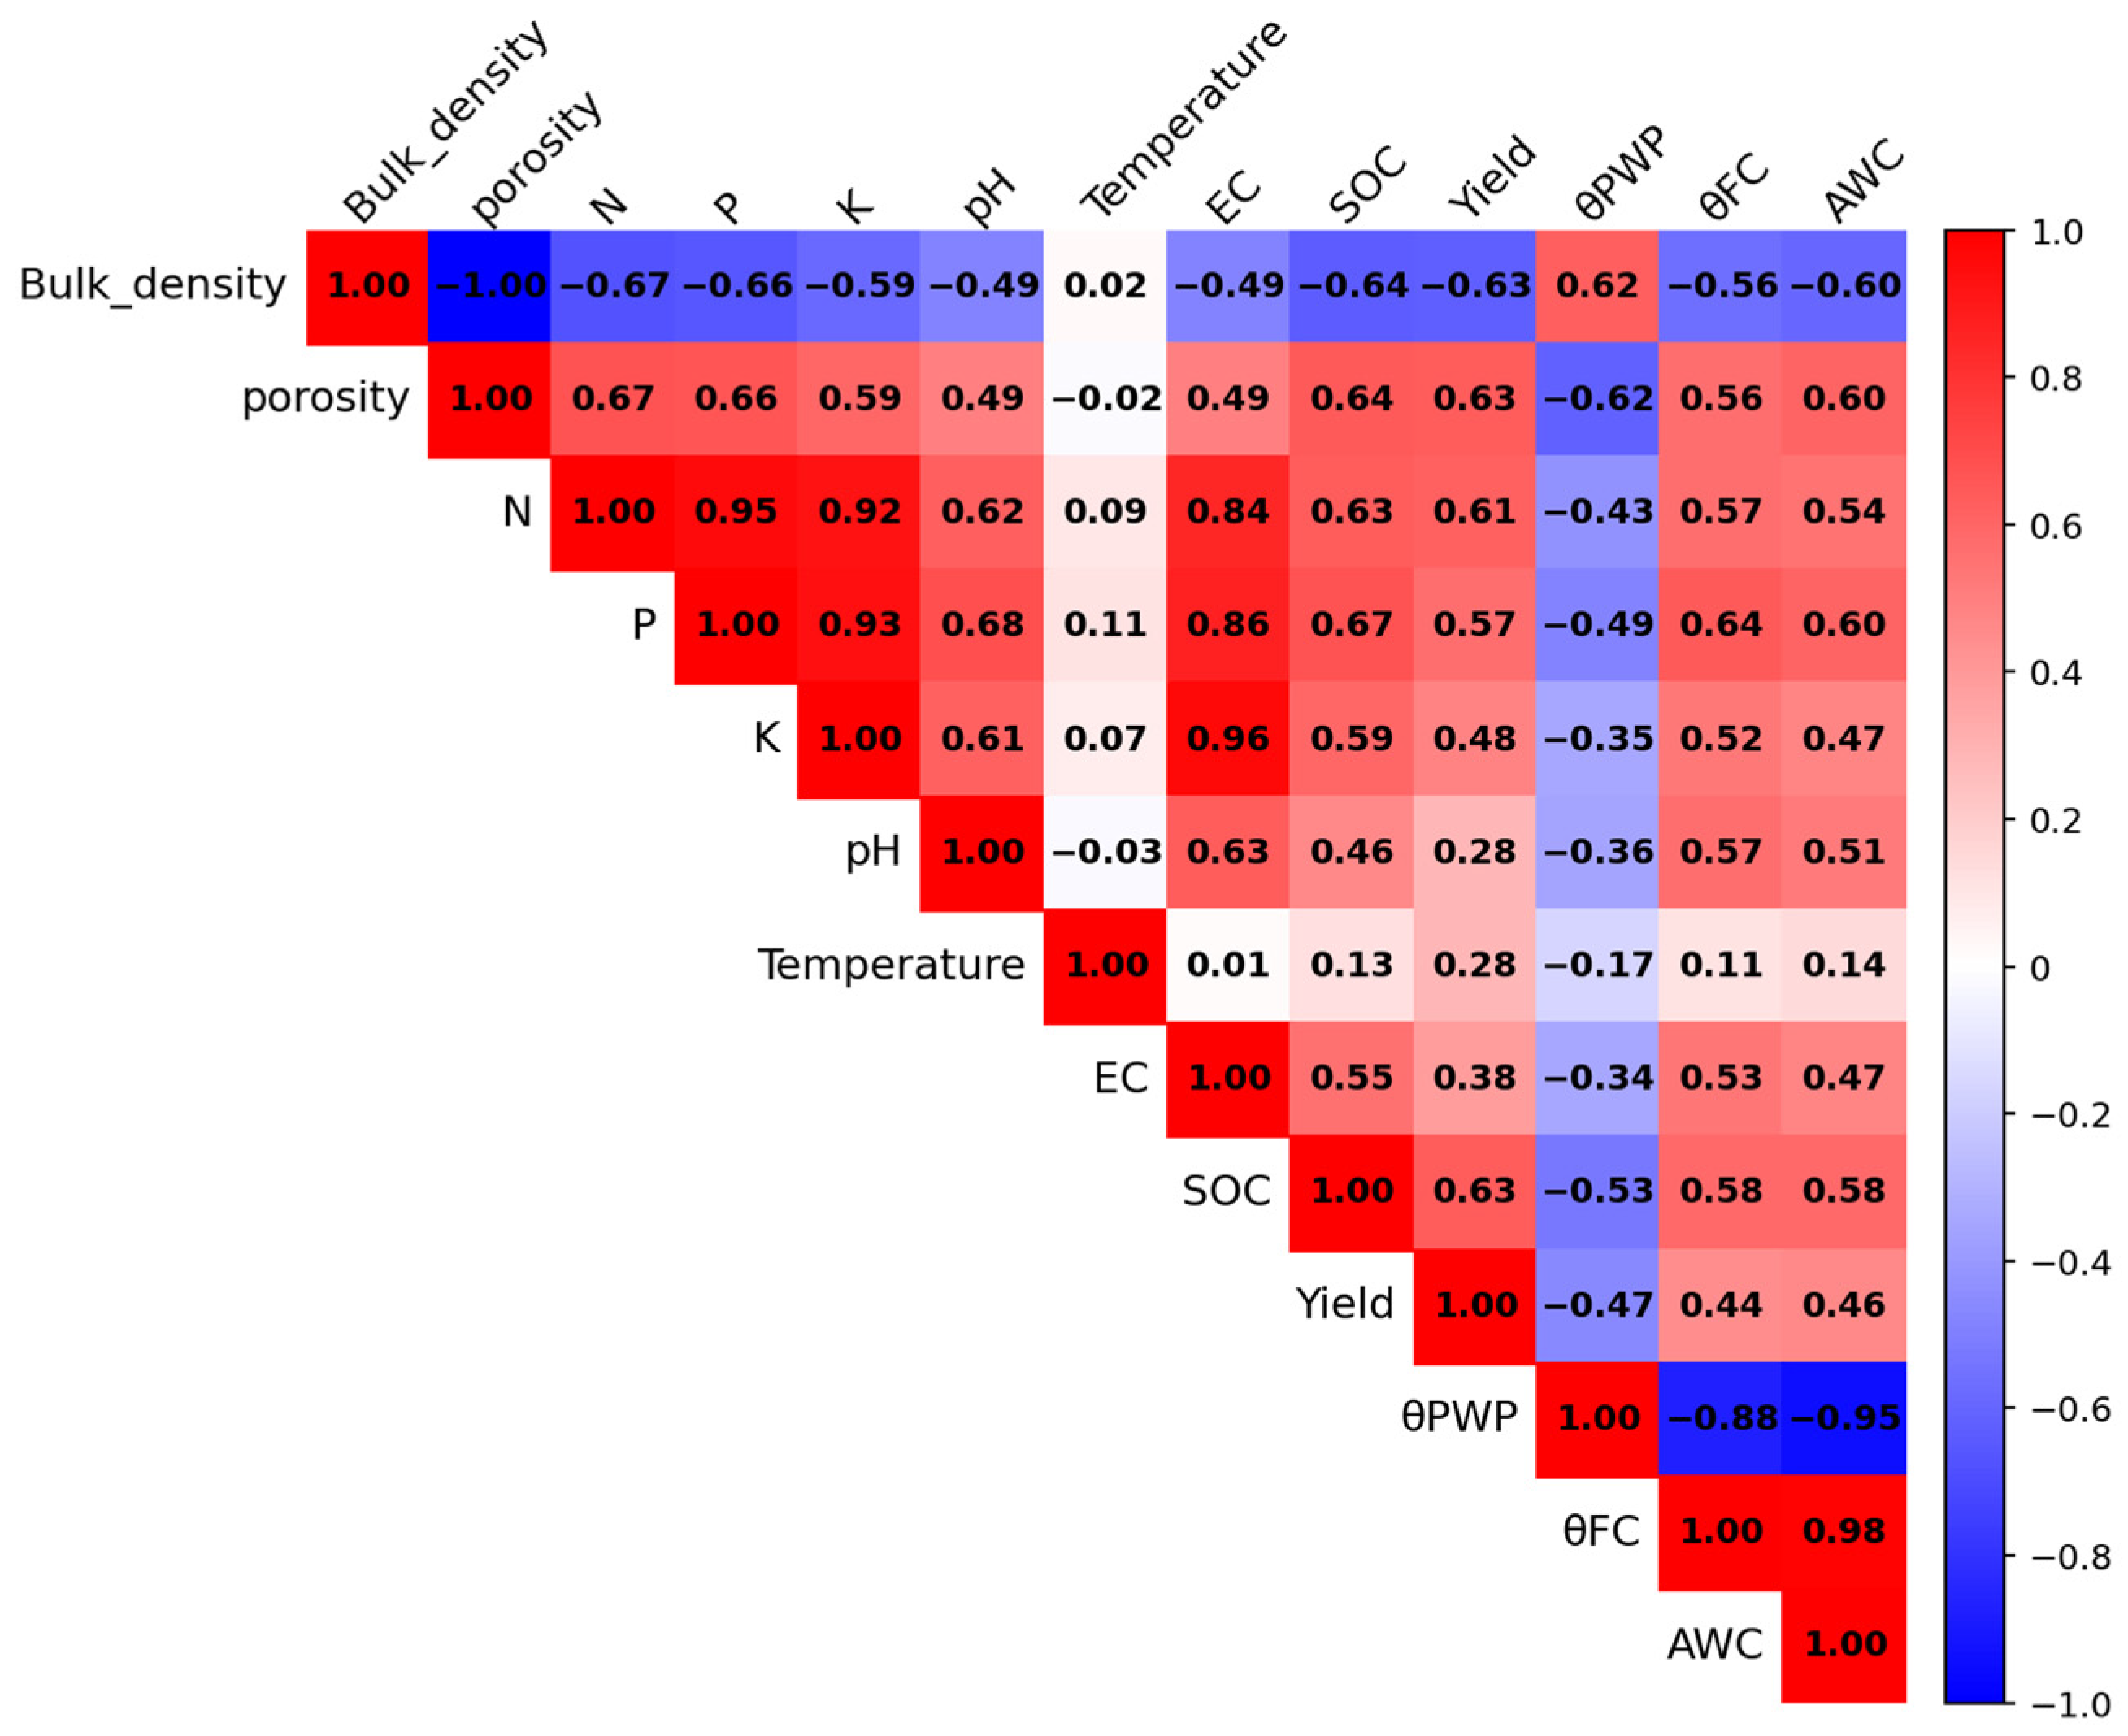
Figure 9 shows the correlation matrix between different soil parameters and lettuce yields. Under deficit irrigation (Table 3), only the correlation of SOC and soil P with AWC was significantly different (p < 0.05) between full (100%) and reduced irrigation regimes (80% and 60% ETc). Under deficit irrigation regimes, soil AWC is strongly positively correlated with soil FC (r = 0.99), SOC (r = 0.80), and P (r = 0.73), and it is strong negatively correlated with soil PWP (r = 0.96). This suggests that organic carbon accumulation and nutrient retention may have a strong influence on water storage mechanisms under water stress conditions. In the full irrigation regime, FC (r = 0.99) and total porosity (r = 0.8015) had a strong positive correlation with PWP (r = 0.80) and bulk density (r = 0.99), and a strong negative correlation with soil AWC. We speculate that soil porosity and bulk density may have a greater effect on AWC under a full irrigation regime. The higher SOC observed in biochar-treated soils likely improved soil structure, which may have contributed to enhanced water retention. These findings suggest that biochar-mediated improvement in SOC and available P could enhance soil and lettuce-plant drought resilience.
Figure 9.
Interaction between soil properties and yields under all treatments. The values present correlation (r) values between different parameters.
The correlation between all the soil parameters and lettuce biomass yield was not statistically different between full irrigation and deficit irrigation (Table 4). A strong positive relationship between fresh lettuce biomass yield and soil porosity (r = 0.63), N (r = 0.61), and SOC (r = 0.63), and a strong negative correlation between soil bulk density (r = −0.63) and yield were observed. Lettuce yield had a weak positive correlation with soil AWC (r = 0.46). However, we noted that under deficit irrigation, AWC and N had a stronger positive correlation with lettuce yield compared with the full irrigation regime. It seems that under full irrigation, when crop irrigation water demand is satisfied and crops are not exposed to water stress, the changes in soil water retention may not have a significant impact on yield. The authors of [13] also reported a strong positive relationship between maize shoot biomass and post-harvest soil total N and total carbon, and a weak relationship with soil P. Lettuce is a high-N-demanding vegetable, and inadequate soil N limits lettuce yield [11]. SOC is one of the key variables influencing crop yields [48]. These results suggest biochar mediated improvement in soil bulk density, porosity, N, P, SOC, and AWC may enhance soil drought resilience.
Table 4.
Lettuce-yield comparison between full and deficit irrigation.
4. Practical Implications, Limitations, and Future Directions
Our findings demonstrate that locally produced cotton-stalk and cashew-shell biochar can improve soil physical properties and support lettuce production with a lower amount of water (vol/day). Converting agricultural residues to biochar offers practical soil amendment and helps reduce open-field burning. Also, reducing the amount of irrigation water applied can conserve water and reduce the frequency of manual irrigation.
This study evaluated short-term responses during a single growing season, and the results may vary under long-term field conditions. In addition, soil water changes were not properly monitored using sensor-based monitoring. Irrigation water was also applied using low-efficiency water cans, limiting proper interpretation of biochar effect on soil water retention. Available N, P, and K were measured using a seven-in-one portable soil analyzer, which is less precise in mineral quantification. The measured nutrient values indicate consistent treatment-level comparisons for relative assessment of biochar rather than absolute concentration. Future studies should use laboratory extraction methods (e.g., Mehlich-3, Olsen-P, and KCl-extractable N) for more precise nutrient quantification. SOC estimation using the loss-on-ignition method may also have reduced quantification precision. Future studies should consider using a more accurate SOC estimation method CNH analyzer and total organic carbon (TOC) analyzer for a more accurate SOC estimation in biochar-treated soils. Moreover, the experimental design had limited replications to allow proper analysis on biochar irrigation interactions. This study provides trends observed and possible mechanisms that could have contributed to differences in soil responses. We recommend the following for future directions.
- Performing biochar-deficit irrigations within multiple seasons to fully understand biochar stability and magnitude effects.
- Comparison of a wider range of biochar feedstocks in the same agro-climatic region to explore the link between specific biochar physicochemical properties (surface area, functional groups, pore structure), soil water retention and nutrient dynamics under different deficit irrigation regimes. Studies should also include biochar blends of different types of feedstocks to optimize biochar performance under deficit irrigation.
- Integration of real-time soil moisture monitoring and stable isotope techniques to enhance mechanistic understanding of the biochar mediated effects on soil moisture retention and availability to plants.
- Modelling economic viability and scalability of biochar systems in vegetable production using various available agricultural residues. Analysis should include carbon sequestration potential of the biochars under deficit irrigation regimes under long-term field conditions.
- Microbial analysis to understand biochar effect on soil microbial activities and its contribution to enhancing sandy soil and vegetable drought resilience.
5. Conclusions
Application of biochar (10 t ha−1) derived from cotton stalks, cashew nutshells, and their mix had a significant positive effect on sandy soil organic carbon content, water retention, and nutrient availability under lettuce cultivation during the hot dry season. Biochar-treated soil consistently produced higher marketable lettuce biomass yields (12.3–18.7 tons/ha) more than unamended soils (6.6–14.4 tons/ha) for all irrigation levels. Plots amended with a mix of cotton-stalk and cashew-nutshell biochar produced the highest fresh average lettuce yield of 18.1 tons/under moderate irrigation (80% of ETc). These results indicate that combining biochar (10 t ha−1) with moderate deficit irrigation can maintain lettuce productivity while saving 20% irrigation water (about 35 m3 ha−1 per day). Under the same conditions. Our findings suggest that integrating biochar with deficit irrigation can support sustainable vegetable production in water-limited Sahelian environments.
Supplementary Materials
The following supporting information can be downloaded at https://www.mdpi.com/article/10.3390/su18094592/s1, Figure S1: Quantile–quantile (Q–Q) plot of residuals from the two-way ANOVA model for (a) PWP and (b) AWC.
Author Contributions
Conceptualization, F.M.M., M.S., A.K., and Y.R.; investigation, F.M.M. and F.S.; methodology, F.M.M., M.S., A.K., Y.R., and F.S.; validation, F.M.M., M.S., A.K., Y.R., F.S., and Y.S.; formal analysis, F.M.M. and F.S.; data curation, F.M.M. and F.S.; writing—original draft, F.M.M.; writing—review and editing, F.M.M., M.S., A.K., Y.R., F.S., and Y.S.; visualization, F.M.M., A.K., and F.S.; supervision, M.S., A.K., Y.R., and Y.S.; project administration, M.S., A.K., and Y.R.; resources, M.S., A.K., and Y.R. All authors have read and agreed to the published version of the manuscript.
Funding
This work was financially supported by Regional Scholarship for Innovation Funds (RSIF), which is a Partnership for Skill in Applied Sciences, Engineering, and Technology (PASET) flagship program. The field work was also financially supported by OSWAP-COSOL project.
Institutional Review Board Statement
Not applicable.
Informed Consent Statement
Not applicable.
Data Availability Statement
The original contributions presented in this study are included in the article/Supplementary Materials. Further inquiries can be directed to the corresponding author.
Acknowledgments
We appreciate Emmanuel Zongo for his assistance during field data collection. We also thank the 14-Yaar vegetable farmers group for their assistance in undertaking field experiments within their vegetable garden.
Conflicts of Interest
The authors declare no conflicts of interest.
References
- Murtaza, G.; Usman, M.; Iqbal, J.; Tahir, M.N.; Elshikh, M.S.; Alkahtani, J.; Toleikienė, M.; Iqbal, R.; Akram, M.I.; Gruda, N.S. The Impact of Biochar Addition on Morpho-Physiological Characteristics, Yield and Water Use Efficiency of Tomato Plants under Drought and Salinity Stress. BMC Plant Biol. 2024, 24, 356. [Google Scholar] [CrossRef] [Scilit] [PubMed]
- Thakur, N.; Kaur, J.; Kurbah, I.; Aakriti. Unlocking the Potential of Biochar: A Comprehensive Review of Enhancing Vegetable Production in Challenging Soils. J. Plant Nutr. 2024, 47, 2897–2912. [Google Scholar] [CrossRef] [Scilit]
- Ayoumbissi Keugmeni, G.A.; Keita, A.; Yonaba, R.; Sawadogo, B.; Kengni, L. Towards Sustainable Food Security in the Sahel: Integrating Traditional Conservation Practices and Controlled Irrigation to Overcome Water Scarcity During the Dry Season for Onion and Jute Production. Sustainability 2025, 17, 2345. [Google Scholar] [CrossRef] [Scilit]
- Singh, M.; Saini, R.K.; Singh, S.; Sharma, S.P. Potential of Integrating Biochar and Deficit Irrigation Strategies for Sustaining Vegetable Production in Water-Limited Regions: A Review. HortScience 2019, 54, 1872–1878. [Google Scholar] [CrossRef] [Scilit]
- Tang, R.; Mulaka, A.R.; Rong, W.; Yuan, X.; Bao, Y.; Tan, J. Biochar-Amended Soils Enhance Drought Resilience in Lettuce: Integrating Hyperspectral Imaging (HSI) and CNN-Based Moisture Prediction. J. Agric. Food Res. 2026, 26, 102711. [Google Scholar] [CrossRef] [Scilit]
- Murtaza, G.; Ahmed, Z.; Iqbal, R.; Deng, G. Biochar from Agricultural Waste as a Strategic Resource for Promotion of Crop Growth and Nutrient Cycling of Soil under Drought and Salinity Stress Conditions: A Comprehensive Review with Context of Climate Change. J. Plant Nutr. 2025, 48, 1832–1883. [Google Scholar] [CrossRef] [Scilit]
- Diedhiou, S.; Maiga, A.; Himbane, P.B.; Iboko, M.P.; Ndiaye, L.G.; Diedhiou, I. The Biochar Amendment Improves Tomato Growth and Yield under Deficit Irrigation in Sandy Loam Soil in Senegal. Sci. World J. 2024, 2024, 9945354. [Google Scholar] [CrossRef] [Scilit]
- Atero-Calvo, S.; Magro, F.; Masetti, G.; Navarro-León, E.; Blasco, B.; Ruiz, J.M. Potential for Drought Stress Alleviation in Lettuce (Lactuca sativa L.) with Humic Substance-Based Biostimulant Applications. Plants 2025, 14, 2386. [Google Scholar] [CrossRef] [Scilit]
- Zerbo, I.; Dabiré, K.; Kaboré, S.A.; Sawadogo, C.M.; Thiombiano, A. Plant Agrobiodiversity, Agricultural and Phytosanitary Practices of Market Garden Crops in the Centre-East Region of Burkina Faso. J. Sustain. Agric. Environ. 2024, 3, 1–15. [Google Scholar] [CrossRef] [Scilit]
- Rodríguez-Vila, A.; Atuah, L.; Abubakari, A.H.; Atorqui, D.W.; Abdul-Karim, A.; Coole, S.; Hammond, J.; Robinson, S.; Sizmur, T. Effect of Biochar on Micronutrient Availability and Uptake into Leafy Greens in Two Urban Tropical Soils with Contrasting Soil PH. Front. Sustain. Food Syst. 2022, 6, 821397. [Google Scholar] [CrossRef] [Scilit]
- Saah, K.J.A.; Kaba, J.S.; Abunyewa, A.A. Inorganic Nitrogen Fertilizer, Biochar Particle Size and Rate of Application on Lettuce (Lactuca sativa L.) Nitrogen Use and Yield. Life 2022, 15, 624–635. [Google Scholar] [CrossRef] [Scilit]
- Hou, M.; Zhang, H.; Shaghaleh, H.; Chen, J.; Zhong, F.; Alhaj Hamoud, Y.; Zhu, L. Optimization of a Lower Irrigation Limit for Lettuce Based on Comprehensive Evaluation: A Field Experiment. Plants 2024, 13, 853. [Google Scholar] [CrossRef] [Scilit] [PubMed]
- Gezahegn, A.; Selassie, Y.G.; Agegnehu, G.; Addisu, S.; Mihretie, F.A.; Kohira, Y.; Lewoyehu, M.; Sato, S. The Impact of Water Hyacinth Biochar on Maize Growth and Soil Properties: The Influence of Pyrolysis Temperature. J. Sustain. Agric. Environ. 2024, 3, e12117. [Google Scholar] [CrossRef] [Scilit]
- Joseph, S.; Cowie, A.L.; Van Zwieten, L.; Bolan, N.; Budai, A.; Buss, W.; Cayuela, M.L.; Graber, E.R.; Ippolito, J.A.; Kuzyakov, Y.; et al. How Biochar Works, and When It Doesn’t: A Review of Mechanisms Controlling Soil and Plant Responses to Biochar. GCB Bioenergy 2021, 13, 1731–1764. [Google Scholar] [CrossRef] [Scilit]
- Muema, F.M.; Richardson, Y.; Keita, A.; Sawadogo, M. An Interdisciplinary Overview on Biochar Production Engineering and Its Agronomic Applications. Biomass Bioenergy 2024, 190, 107416. [Google Scholar] [CrossRef] [Scilit]
- Abdou, M.A.A.; Alashram, M.G.; Hamza, A.E.; Rashad, Y.M.; Abd-ElGawad, A.M.; Bourouah, M.; Hafez, M.; Abdelraouf, R.E. Using Deficit Irrigation Strategies and Adding Sugarcane Waste Biochar as a Sustainable Material to Sandy Soils for Improving Yield and Water Productivity of Cucumber. Sustainability 2024, 16, 4856. [Google Scholar] [CrossRef] [Scilit]
- Zhang, W.; Niu, W.; Luo, H. Effect of Biochar Amendment on the Growth and Photosynthetic Traits of Plants Under Drought Stress: A Meta-Analysis. Agronomy 2024, 14, 2952. [Google Scholar] [CrossRef] [Scilit]
- Agbna, G.H.D.; Dongli, S.; Zhipeng, L.; Elshaikh, N.A.; Guangcheng, S.; Timm, L.C. Effects of Deficit Irrigation and Biochar Addition on the Growth, Yield, and Quality of Tomato. Sci. Hortic. 2017, 222, 90–101. [Google Scholar] [CrossRef] [Scilit]
- Manka’abusi, D.; Steiner, C.; Akoto-Danso, E.K.; Lompo, D.J.P.; Haering, V.; Werner, S.; Marschner, B.; Buerkert, A. Biochar Application and Wastewater Irrigation in Urban Vegetable Production of Ouagadougou, Burkina Faso. Nutr. Cycl. Agroecosyst. 2019, 115, 263–279. [Google Scholar] [CrossRef] [Scilit]
- Manka’abusi, D.; Zongo, N.; Lompo, D.J.P.; Steiner, C.; Marschner, B.; Buerkert, A. Soil Properties and Agronomic Effects of Repeated Biochar Amendment and Fertilization in an Urban Horticultural System of Burkina Faso. Eur. J. Agron. 2024, 159, 127234. [Google Scholar] [CrossRef] [Scilit]
- Apanovich, N. Biochar Production and Use among Smallholder Farmers in Rural Uganda: Challenges and Opportunities for Circular Economy. In Biochar Ecotechnology for Sustainable Agriculture and Environment; Elsevier: Amsterdam, The Netherlands, 2025; pp. 107–128. ISBN 978-0-443-29855-4. [Google Scholar]
- Zoma, F.; Sawadogo, M. A Multicriteria Approach for Biomass Availability Assessment and Selection for Energy Production in Burkina Faso: A Hybrid AHP-TOPSIS Approach. Heliyon 2023, 9, e20999. [Google Scholar] [CrossRef] [Scilit]
- Giudicianni, P.; Gargiulo, V.; Grottola, C.M.; Alfè, M.; Ferreiro, A.I.; Mendes, M.A.A.; Fagnano, M.; Ragucci, R. Inherent Metal Elements in Biomass Pyrolysis: A Review. Energy Fuels 2021, 35, 5407–5478. [Google Scholar] [CrossRef] [Scilit]
- De Paiva, E.M.; Mattos, A.L.A.; Da Silva, J.C.G.; Mumbach, G.D.; Arias, S.; Pacheco, J.G.A.; Di Domenico, M.; Alves, J.L.F.; De Brito, E.S. Pyrolysis of Cashew Nutshell Residues for Bioenergy and Renewable Chemicals: Kinetics, Thermodynamics, and Volatile Products. J. Anal. Appl. Pyrolysis 2024, 177, 106303. [Google Scholar] [CrossRef] [Scilit]
- Gupta, A.; Thengane, S.K.; Mahajani, S. Kinetics of Pyrolysis and Gasification of Cotton Stalk in the Central Parts of India. Fuel 2020, 263, 116752. [Google Scholar] [CrossRef] [Scilit]
- Sawadogo, W.; Neya, T.; Semde, I.; Korahiré, J.A.; Combasséré, A.; Traoré, D.E.; Ouedraogo, P.; Diasso, U.J.; Abiodun, B.J.; Bliefernicht, J.; et al. Potential Impacts of Climate Change on the Sudan-Sahel Region in West Africa–Insights from Burkina Faso. Environ. Chall. 2024, 15, 100860. [Google Scholar] [CrossRef] [Scilit]
- Escarabajal-Henarejos, D.; Molina-Martínez, J.M.; Fernández-Pacheco, D.G.; García-Mateos, G. Methodology for Obtaining Prediction Models of the Root Depth of Lettuce for Its Application in Irrigation Automation. Agric. Water Manag. 2015, 151, 167–173. [Google Scholar] [CrossRef] [Scilit]
- Motsara, M.R.; Roy, R.N. Guide to Laboratory Establishment for Plant Nutrient Analysis; FAO fertilizer and plant nutrition bulletin; FAO: Rome, Italy, 2008; ISBN 978-92-5-105981-4. [Google Scholar]
- Wang, K.; Zhang, X.; Sun, C.; Yang, K.; Zheng, J.; Zhou, J. Biochar Application Alters Soil Structure but Not Soil Hydraulic Conductivity of an Expansive Clayey Soil under Field Conditions. J. Soils Sediments 2021, 21, 73–82. [Google Scholar] [CrossRef] [Scilit]
- R Core Team. R: A Language and Environment for Statistical Computing 2025; R Foundation for Statistical Computing: Vienna, Austria, 2025. [Google Scholar]
- Oginni, O.; Singh, K. Influence of High Carbonization Temperatures on Microstructural and Physicochemical Characteristics of Herbaceous Biomass Derived Biochars. J. Environ. Chem. Eng. 2020, 8, 104169. [Google Scholar] [CrossRef] [Scilit]
- Bera, T.; Purakayastha, T.J.; Patra, A.K.; Datta, S.C. Comparative Analysis of Physicochemical, Nutrient, and Spectral Properties of Agricultural Residue Biochars as Influenced by Pyrolysis Temperatures. J. Mater. Cycles Waste Manag. 2018, 20, 1115–1127. [Google Scholar] [CrossRef] [Scilit]
- Hao, M.; Wu, W.; Habibul, N.; Chai, G.; Ma, X.; Ma, X. Fe-Modified Fly Ash/Cotton Stalk Biochar Composites for Efficient Removal of Phosphate in Water: Mechanisms and Green-Reuse Potential. Environ. Sci. Pollut. Res. 2023, 30, 70827–70841. [Google Scholar] [CrossRef] [Scilit]
- Wang, Z.; Chen, B.; Cao, Y.; Xing, S.; Zhang, B.; Wang, S.; Tian, H. Insights into the Interfacial Dynamics and Interaction Mechanisms between Phosphate-Solubilizing Bacteria and Straw-Derived Biochar. Biochar 2025, 7, 55. [Google Scholar] [CrossRef] [Scilit]
- Waheed, A.; Xu, Q.; Cui, D.; Muhammad, M.; Xu, H.; Aili, A.; Kuerban, A.; Ali, S. Biochar as a Climate-Smart Strategy for Restoring Dryland Soils and Mitigating Desertification. Biochar 2026, 8, 59. [Google Scholar] [CrossRef] [Scilit]
- Agbede, T.M.; Oyewumi, A.; Adekiya, A.O.; Adebiyi, O.T.V.; Abisuwa, T.A.; Ijigbade, J.O.; Ogundipe, C.T.; Oladele, S.O.; Olaogun, O.; Eifediyi, E.K. Assessing the Synergistic Impacts of Poultry Manure and Biochar on Nutrient-Depleted Sand and Sandy Loam Soil Properties and Sweet Potato Growth and Yield. Exp. Agric. 2022, 58, e54. [Google Scholar] [CrossRef] [Scilit]
- Razzaghi, F.; Bilson, P.B.; Arthur, E. Does Biochar Improve Soil Water Retention? A Systematic Review and Meta-Analysis. Geoderma 2020, 361, 114055. [Google Scholar] [CrossRef] [Scilit]
- Zhang, J.; Amonette, J.E.; Flury, M. Effect of Biochar and Biochar Particle Size on Plant-Available Water of Sand, Silt Loam, and Clay Soil. Soil Tillage Res. 2021, 212, 104992. [Google Scholar] [CrossRef] [Scilit]
- van Schalkwyk, R.; Görgens, J.F.; Hardie, A.G. Effects of Biochar Feedstock and Pyrolysis Temperature, and Wetting-Partial Drying on Physical Properties of Sandy Soil. Discov. Soil 2025, 2, 40. [Google Scholar] [CrossRef] [Scilit]
- Yaebiyo, G.; Birhane, E.; Tadesse, T.; Kiros, S.; Hadgu, K.M.; Egziabher, Y.G.; Habtu, S. Using Biochar and Deficit Irrigation Enhanced the Growth of Commercial Agroforestry Woody Species Seedlings in Drylands (a Case Study in Saz, Northern Ethiopia). Agrofor. Syst. 2024, 98, 61–79. [Google Scholar] [CrossRef] [Scilit]
- Edeh, I.G.; Mašek, O.; Buss, W. A Meta-Analysis on Biochar’s Effects on Soil Water Properties–New Insights and Future Research Challenges. Sci. Total Environ. 2020, 714, 136857. [Google Scholar] [CrossRef] [Scilit]
- Ibrahimi, K.; Alghamdi, A.G. Available Water Capacity of Sandy Soils as Affected by Biochar Application: A Meta-Analysis. CATENA 2022, 214, 106281. [Google Scholar] [CrossRef] [Scilit]
- Acharya, B.S.; Dodla, S.; Wang, J.J.; Pavuluri, K.; Darapuneni, M.; Dattamudi, S.; Maharjan, B.; Kharel, G. Biochar Impacts on Soil Water Dynamics: Knowns, Unknowns, and Research Directions. Biochar 2024, 6, 34. [Google Scholar] [CrossRef] [Scilit]
- Keller, L.; Idowu, O.J.; Ulery, A.; Omer, M.; Brewer, C.E. Short-Term Biochar Impacts on Crop Performance and Soil Quality in Arid Sandy Loam Soil. Agriculture 2023, 13, 782. [Google Scholar] [CrossRef] [Scilit]
- Zonayet, M.; Paul, A.K.; Faisal-E-Alam, M.; Syfullah, K.; Castanho, R.A.; Meyer, D. Impact of Biochar as a Soil Conditioner to Improve the Soil Properties of Saline Soil and Productivity of Tomato. Sustainability 2023, 15, 4832. [Google Scholar] [CrossRef] [Scilit]
- Agbede, T.M.; Adekiya, A.O. Influence of Biochar on Soil Physicochemical Properties, Erosion Potential, and Maize (Zea mays L.) Grain Yield under Sandy Soil Condition. Commun. Soil Sci. Plant Anal. 2020, 51, 2559–2568. [Google Scholar] [CrossRef] [Scilit]
- Das, S.K.; Ghosh, G.K.; Avasthe, R. Valorizing Biomass to Engineered Biochar and Its Impact on Soil, Plant, Water, and Microbial Dynamics: A Review. Biomass Convers. Biorefinery 2022, 12, 4183–4199. [Google Scholar] [CrossRef] [Scilit]
- Xu, H.; Cai, A.; Wu, D.; Liang, G.; Xiao, J.; Xu, M.; Colinet, G.; Zhang, W. Effects of Biochar Application on Crop Productivity, Soil Carbon Sequestration, and Global Warming Potential Controlled by Biochar C:N Ratio and Soil pH: A Global Meta-Analysis. Soil Tillage Res. 2021, 213, 105125. [Google Scholar] [CrossRef] [Scilit]
- McLeod, M.K.; Sufardi, S.; Harden, S. Soil Fertility Constraints and Management to Increase Crop Yields in the Dryland Farming Systems of Aceh, Indonesia. Soil Res. 2020, 59, 68–82. [Google Scholar] [CrossRef] [Scilit]
- Agbede, T.M.; Oyewumi, A. Benefits of Biochar, Poultry Manure and Biochar–Poultry Manure for Improvement of Soil Properties and Sweet Potato Productivity in Degraded Tropical Agricultural Soils. Resour. Environ. Sustain. 2022, 7, 100051. [Google Scholar] [CrossRef] [Scilit]
- Adekiya, A.O.; Ogunbode, T.O.; Esan, V.I.; Adedokun, O.; Olatubi, I.V.; Ayegboyin, M.H. Short Term Effects of Biochar on Soil Chemical Properties, Growth, Yield, Quality, and Shelf Life of Tomato. Sci. Rep. 2025, 15, 24965. [Google Scholar] [CrossRef] [Scilit]
- Bekchanova, M.; Campion, L.; Bruns, S.; Kuppens, T.; Lehmann, J.; Jozefczak, M.; Cuypers, A.; Malina, R. Biochar Improves the Nutrient Cycle in Sandy-Textured Soils and Increases Crop Yield: A Systematic Review. Environ. Evid. 2024, 13, 3. [Google Scholar] [CrossRef] [Scilit]
- Wang, Y.; Cui, Y.; Wang, K.; He, X.; Dong, Y.; Li, S.; Wang, Y.; Yang, H.; Chen, X.; Zhang, W. The Agronomic and Environmental Assessment of Soil Phosphorus Levels for Crop Production: A Meta-Analysis. Agron. Sustain. Dev. 2023, 43, 35. [Google Scholar] [CrossRef] [Scilit]
- Zhang, R.; Qu, Z.; Wang, L.; Yang, W.; Zhang, D.; Zhao, Y.; Li, J. Enhancing Soil Microbial Diversity, Quality, and Crop Growth through Deficit Irrigation Combined with Biochar Application. Front. Sustain. Food Syst. 2025, 9, 1528044. [Google Scholar] [CrossRef] [Scilit]

Disclaimer/Publisher’s Note: The statements, opinions and data contained in all publications are solely those of the individual author(s) and contributor(s) and not of MDPI and/or the editor(s). MDPI and/or the editor(s) disclaim responsibility for any injury to people or property resulting from any ideas, methods, instructions or products referred to in the content. |
© 2026 by the authors. Licensee MDPI, Basel, Switzerland. This article is an open access article distributed under the terms and conditions of the Creative Commons Attribution (CC BY) license.