


Abstract
Volatile organic compounds (VOCs) emitted by cranberries from three locations were studied using a proton transfer reaction mass spectrometer (PTR-MS). Cranberries were collected from natural wetlands in a protected landscape (Łętowskie Lake and the Kępice area, northern Poland), from an allotment garden near Słupsk (northern Poland), and from a cranberry plantation (Poland). The collected samples showed statistically significant differences between the three studied cranberry sources, with samples from the garden differing significantly from those from plantations and wetlands. The results of multivariate analyses, such as cluster analysis, also indicated differences in the composition of VOCs responsible for cranberry aroma from different sources. Multivariate PCA revealed similarities between the volatile organic compound (VOC) emissions of cranberries from natural wetlands and plantations. Additionally, machine learning was used to classify cranberries collected from different sites. The classification accuracy of the MLP model for a limited number of variables was approximately 97% at the testing and validation level. This paper presents the potential application of PTR-MS to VOC emission studies, along with statistical analysis and machine learning, as an example of a potential tool for sustainable development in the study of edible fruit aromas.
1. Introduction
Volatile organic compounds are emitted from natural sources such as plants, animals, fungi, and bacteria. Studies have been conducted on VOCs from fruits such as wild strawberries [1], strawberries [2], and apple varieties [3]. In some cases, VOCs may be considered pollutants, e.g., from animal husbandry [4] or from crops [5,6]. Analysis of VOC emission profiles obtained using various methods has been used in species identification, e.g., of bacteria [7], fungi [8], or for plant phenotyping [9]. VOC studies can also be helpful in detecting plant diseases [10], and real-time VOC monitoring can be helpful in the development of sustainable agriculture [11] or food quality control [12,13,14,15]. The obtained VOC emission profiles can also be used as markers for detecting the origin of various food products, such as wine, cheese, or fruit, especially in the case of products where the place of origin is important [16,17,18]. Finally, VOCs can be used to assess the environment state, e.g., in studies of bottom sediments in lakes [19,20].
VOC analyses can be performed using both invasive and non-invasive techniques. Gas chromatography, particularly in combination with mass spectrometry, is the most common method used in VOC studies [21,22,23]. However, these techniques require specific sample preparation (e.g., concentration) and the use of various chemical reagents, including organic solvents [24].
A significant advance in VOC research is the PTR-MS technique, which utilizes so-called soft ionization [25]. PTR-MS involves the transfer of a single proton, most often from H3O+, to the molecule being studied [26,27]. In the PTR-MS apparatus, the reaction of H3O+ with gaseous molecules (R) results in proton transfer according to the following reaction: H3O+ + R → RH+ + H2O, resulting in the formation of a positively ionized molecule with a mass increased by 1u [26]. This ionization method reduces, and in most cases eliminates, the fragmentation processes of VOC molecules that can occur during traditional ionization methods, such as Electron Ionization (EI) [28], Fast Atom Bombardment (FAB) [29], and Inductively Coupled Plasma (ICP) [30]. Furthermore, most inorganic components of atmospheric air (e.g., N2, O2, CO2) have a lower affinity for protons than water, so they are not ionized, and the technique remains “transparent” to the main atmospheric components, focusing only on trace organic compounds. At the same time, this technique does not require the use of additional reagents or special sample preparation [31]. An additional advantage is the short recording time of mass spectra in a wide m/z range, of the order of several or a dozen or so seconds for quadrupole spectrometers and fractions of a second for time-of-flight spectrometers [32].
A disadvantage of PTR-MS techniques is that they do not allow for the unambiguous identification of volatile organic compounds emitted from samples [1,26]. Hence, such identification is merely probable. Despite this, this technique seems ideal for comparative studies that do not require precise VOC identification [26], determining so-called “fingerprints,” and performing screening tests based on VOCs emitted from samples [3,33]. The practical use of the PTR-MS method for sustainable development undoubtedly has its main advantages. Firstly, measurements are performed on a chemically untreated sample; only uniform physical sample parameters (mass, uniform storage) are required [1]. Secondly, this method is characterized by high sensitivity of VOC detection. Thirdly, this method allows for the simultaneous determination of a large number of VOCs in a wide spectrum of m/z. The analysis takes a very short time, on the order of a few to several minutes. The lack of chemical sample treatment eliminates the risk of sample contamination and the risk of VOC chemical reactions with any solvents used during sample preparation for analysis [32].
The VOC composition in cranberries and other plants likely depends on the growing medium. The growing medium is the primary source of mineral nutrients for the plant. The authors of the present study assume that the composition of VOCs emitted from cranberries determines their origin depending on the growing conditions: plantation, garden, or wetland. Similar studies were conducted on strawberry fruits, obtaining good results, confirming that VOCs measured using PTR-MS allow for the differentiation of plant growth environments based on the observed VOC composition [1]. This composition can vary both quantitatively and qualitatively. The PTR-MS method can be used as a non-invasive, rapid and highly accurate method for assessing odors [26] of cranberries (and other fruits) to identify their origin and cultivation method.
Cranberries have recently been studied for their peculiar duality of having numerous potential benefits in areas as wide apart as dental science [34], urinary tract health and its infection prevention [35], and the general use VOCs for anti-inflammatory purposes [36], whilst also not having a thoroughly documented scent and VOC database [37]. This fruit seems to be the next plant packed with healthy substances attracting attention throughout the sciences, just as its cousin the lingonberry from the Nordic parts of the world, mostly due to its more punchy and sour taste than other Vaccinium members. However, there is a slow and steady rise even for the humble cranberry and lingonberry [38].
Various statistical methods complement the PTR-MS method, which provides significant amounts of data. Recent years have shown a growing interest in applying neural networks to problems of classification in many fields [39], including biology [40]. Combining PTR-MS data with statistical analysis, including neural networks, can be a useful tool for identifying patterns of VOCs obtained from food products such as fruits, including cranberries, to identify their most beneficial properties, closest to their natural habitats. This can be an important tool in potential sustainable development for comparing the aromas of fruits with specific VOC characteristics, such as cranberries, depending on their cultivation method and their natural habitats.
The aim of the study was to investigate the similarities and differences in the emission of VOC from cranberries originating from gardens, wetlands and plantations.
2. Materials and Methods
2.1. Plant Material
Cranberry samples were obtained from three sources between September and October 2023. Harvested cranberries are characterized by high resistance to storing.
The first group of 14 cranberry samples were collected from natural wetlands (Figures S1 and S2) (Vaccinium oxycoccus) in a protected landscape area (part of the “Łętowskie Lake and the vicinity of Kępice” protected landscape area, northern Poland). The second group consisted of cranberries (Vaccinium macrocarpon) collected from gardens in the western part of Słupsk (northern Poland). The sediment pH in the wetland area was 4.5 and in the garden area it was 6. The distance between these locations is less than 30 km in a straight line, and it can be assumed that the climatic conditions are similar. The third group consisted of a fresh batch of cranberries (Vaccinium macrocarpon) purchased from farms (from north Poland, Pomerania) available at retail sales point, coming from a single plantation. During purchase, containers of fruit visually in good condition were organoleptically examined to confirm their freshness. An additional inspection was performed prior to the measurements. In all three areas, weather conditions were similar due to the short distance between plant growth sites. According to IMGM-PIB [41], in 2023, rainfall was 900–1100 mm, average annual temperatures were 8–9 °C, and in summer, they averaged 17–18 °C. To preserve their freshness, the samples were analyzed immediately after collection using PTR-MS. Samples from the plantation were stored in a refrigerator in the store and were analyzed immediately after purchase. All studies were conducted in an air-conditioned laboratory at 22 °C. Upon arrival at the laboratory, visually ripe cranberry samples were dried to remove moisture and thermalized for approximately 2 h. The cranberry fruit samples were then ground, weighed on a laboratory scale to a constant mass of 20 g, and placed in chemically clean PTFE containers.
2.2. PTR-MS Analysis
Measurements of VOCs emitted from cranberry samples were performed using a high-sensitivity PTR-MS spectrometer from Ionicon, Austria. The measurement procedure was described in [8,19,20]. Briefly, 20 g of cranberry samples were placed in closed 50 mL PTFE vessels. A PTFE tube heated to 60 °C was inserted through the holes in the vessel covers, through which the air from above the samples was introduced into the mass spectrometer at a gas flow rate of about 20 sccm, similarly to the work [42]. The parameters in the drift chamber were pressure 2.2 mbar, temperature 60 °C, and voltage 600 V. This corresponds to a reduced electric field (E/N) value of approximately 135 Td (1 Td = 10–17 V · cm2). Four scans were performed for each sample in the m/z range from 21 to 200. The m/z values of 45, 47, 55, 57, 61, 63, 65, 75, 81, 83, 89, 93, 95, 101, 103, 107, 109, 115, 117, 121, 131, 135, 137, 143, and 153 were selected for further analysis. These 25 m/z ratio values were selected based on relatively high ion signal intensity levels. The ion concentration values in the drift chamber of the mass spectrometer were calculated using PTR-MS Viewer 3.2.12 software, which allows the results to be independent of the physical conditions (pressure, temperature, and voltage) in the drift chamber [26]. The calculated concentrations do not correspond to the absolute concentrations of VOCs in the samples. They were calculated based on the value (k = 2 × 10⁻⁹ cm3/s), and assuming a constant value for k introduces a systematic error. However, in studies conducted with the same instrument parameters and conditions, this error can be neglected in the data analysis, according to Biasoli et al. [26].
2.3. Statistical Analysis
Statistical analyses were performed using Statistica software (ver. 13.3) [43] and Past version 4.16c [44,45]. Basic statistical analyses included: mean, max (maximum value) and min (minimum value), SD (standard deviation), and CV (coefficient of variation). The K-S test was used to determine the type of distribution of variables. In the absence of a normal distribution, the nonparametric equivalent of ANOVA, the Kruskal–Wallis test, was used, combined with Dunn’s post hoc test. In Statistica, multivariate cluster analysis (CA) was performed for each sample group (Ward method, Euclidean distance). In Past statistical software, multivariate PCA (principal component analysis) was performed. In cluster analysis, clusters were compared according to the adopted concept: 20 dist/dist max constitute subclusters; 50 dist/dist max are clusters. While grouping into subclusters A1 with A2 and B1 with B2, and clusters A with B, the occurrence of individual m/z were compared.
To classify cranberries from different locations, multilayer perceptron (MPL) [46] and radial basis function (RBF) [47] neural networks were used in Statistica (ver. 13.3) [43]. Linear, logistic, tangentoidal, exponential, softmax, and Gaussian functions were used to activate neurons in the hidden and output layers. The Broyden–Fletcher–Goldfarb–Shanno (BFGS) algorithm [48] was chosen as the learning algorithm. Twenty-five m/z values obtained from PTR-MS were used for the previously performed statistical analysis. Due to the limited number of mass spectra (304 in total, all partial mass spectra were used), such a large number of variables may cause overfitting. For this reason, the number of variables was reduced to 10. Their selection was guided by the results of statistical analyses (results of H value of the Kruskal–Wallis test, presented below in table)those for which the largest statistically significant differences were included. The selected m/z were 47, 57, 61, 65, 75, 103, 107, 115, 117, and 143. All cases were divided into three groups: training (70%), testing (15%), and validation (15%). The dataset for training, testing, and validation was divided so that the dataset within a single sample was assigned to that single category (30 samples for training, 6 samples for testing, 6 samples for validation). Statistica used an additional variable containing the identifiers of individual samples.
3. Results
Average concentrations of VOCs emitted from cranberries are arranged as follows in order of increasing ion concentration [ppb] for m/z: 153 < 135 < 143 < 95 < 109 < 121 < 115 < 131 < 93 < 137 < 107 < 103 < 101 < 117 < 63 < 75 < 65 < 57 < 89 < 55 < 83 < 61 < 81 < 47 < 45 (Table 1).
Table 1.
Basic statistical parameters of concentrations of studied VOC ionized particles (all samples) (n = 42).
Table 2 presents the basic statistical parameters, i.e., mean, min. and max. values, SD, CV for the individual m/z tested.
Table 2.
The results of the Kruskal–Wallis test (nonparametric ANOVA) with the Dunn post hoc test for variables that did not show a normal distribution (n = 42).
The highest mean concentration values were recorded for compounds with the lowest masses, i.e., m/z = 45 and 47, 5354.4 ppb and 2994.1 ppb, respectively. On the other hand, the lowest concentrations were recorded for compounds with the highest masses, i.e., m/z: 93, 95, 109, 115, 121, 131, 135, 143, 153, and they were (9.7, 4.0, 4.1, 7.0, 4.6, 8.9, 8.8, 2.0, 1.2 ppb), respectively. In the case of compounds with the remaining tested masses, the concentration values ranged from 13.7 to 576.5 ppb.
Table 2 presents the results of the Kruskal–Wallis test, along with the Dunn post hoc test, for variables that did not demonstrate a normal distribution. Significantly statistical differences between the content of compounds in aromas of cranberries from different harvest sources were noted for all tested compound masses except m/z = 55 and m/z = 81. For all tested m/z, significantly statistical differences were found between the concentrations of VOC in cranberries collected from allotment gardens and wetlands, as well as between allotment gardens and cranberries collected from wetlands and plantations.
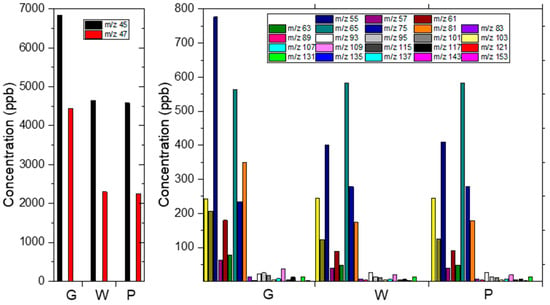
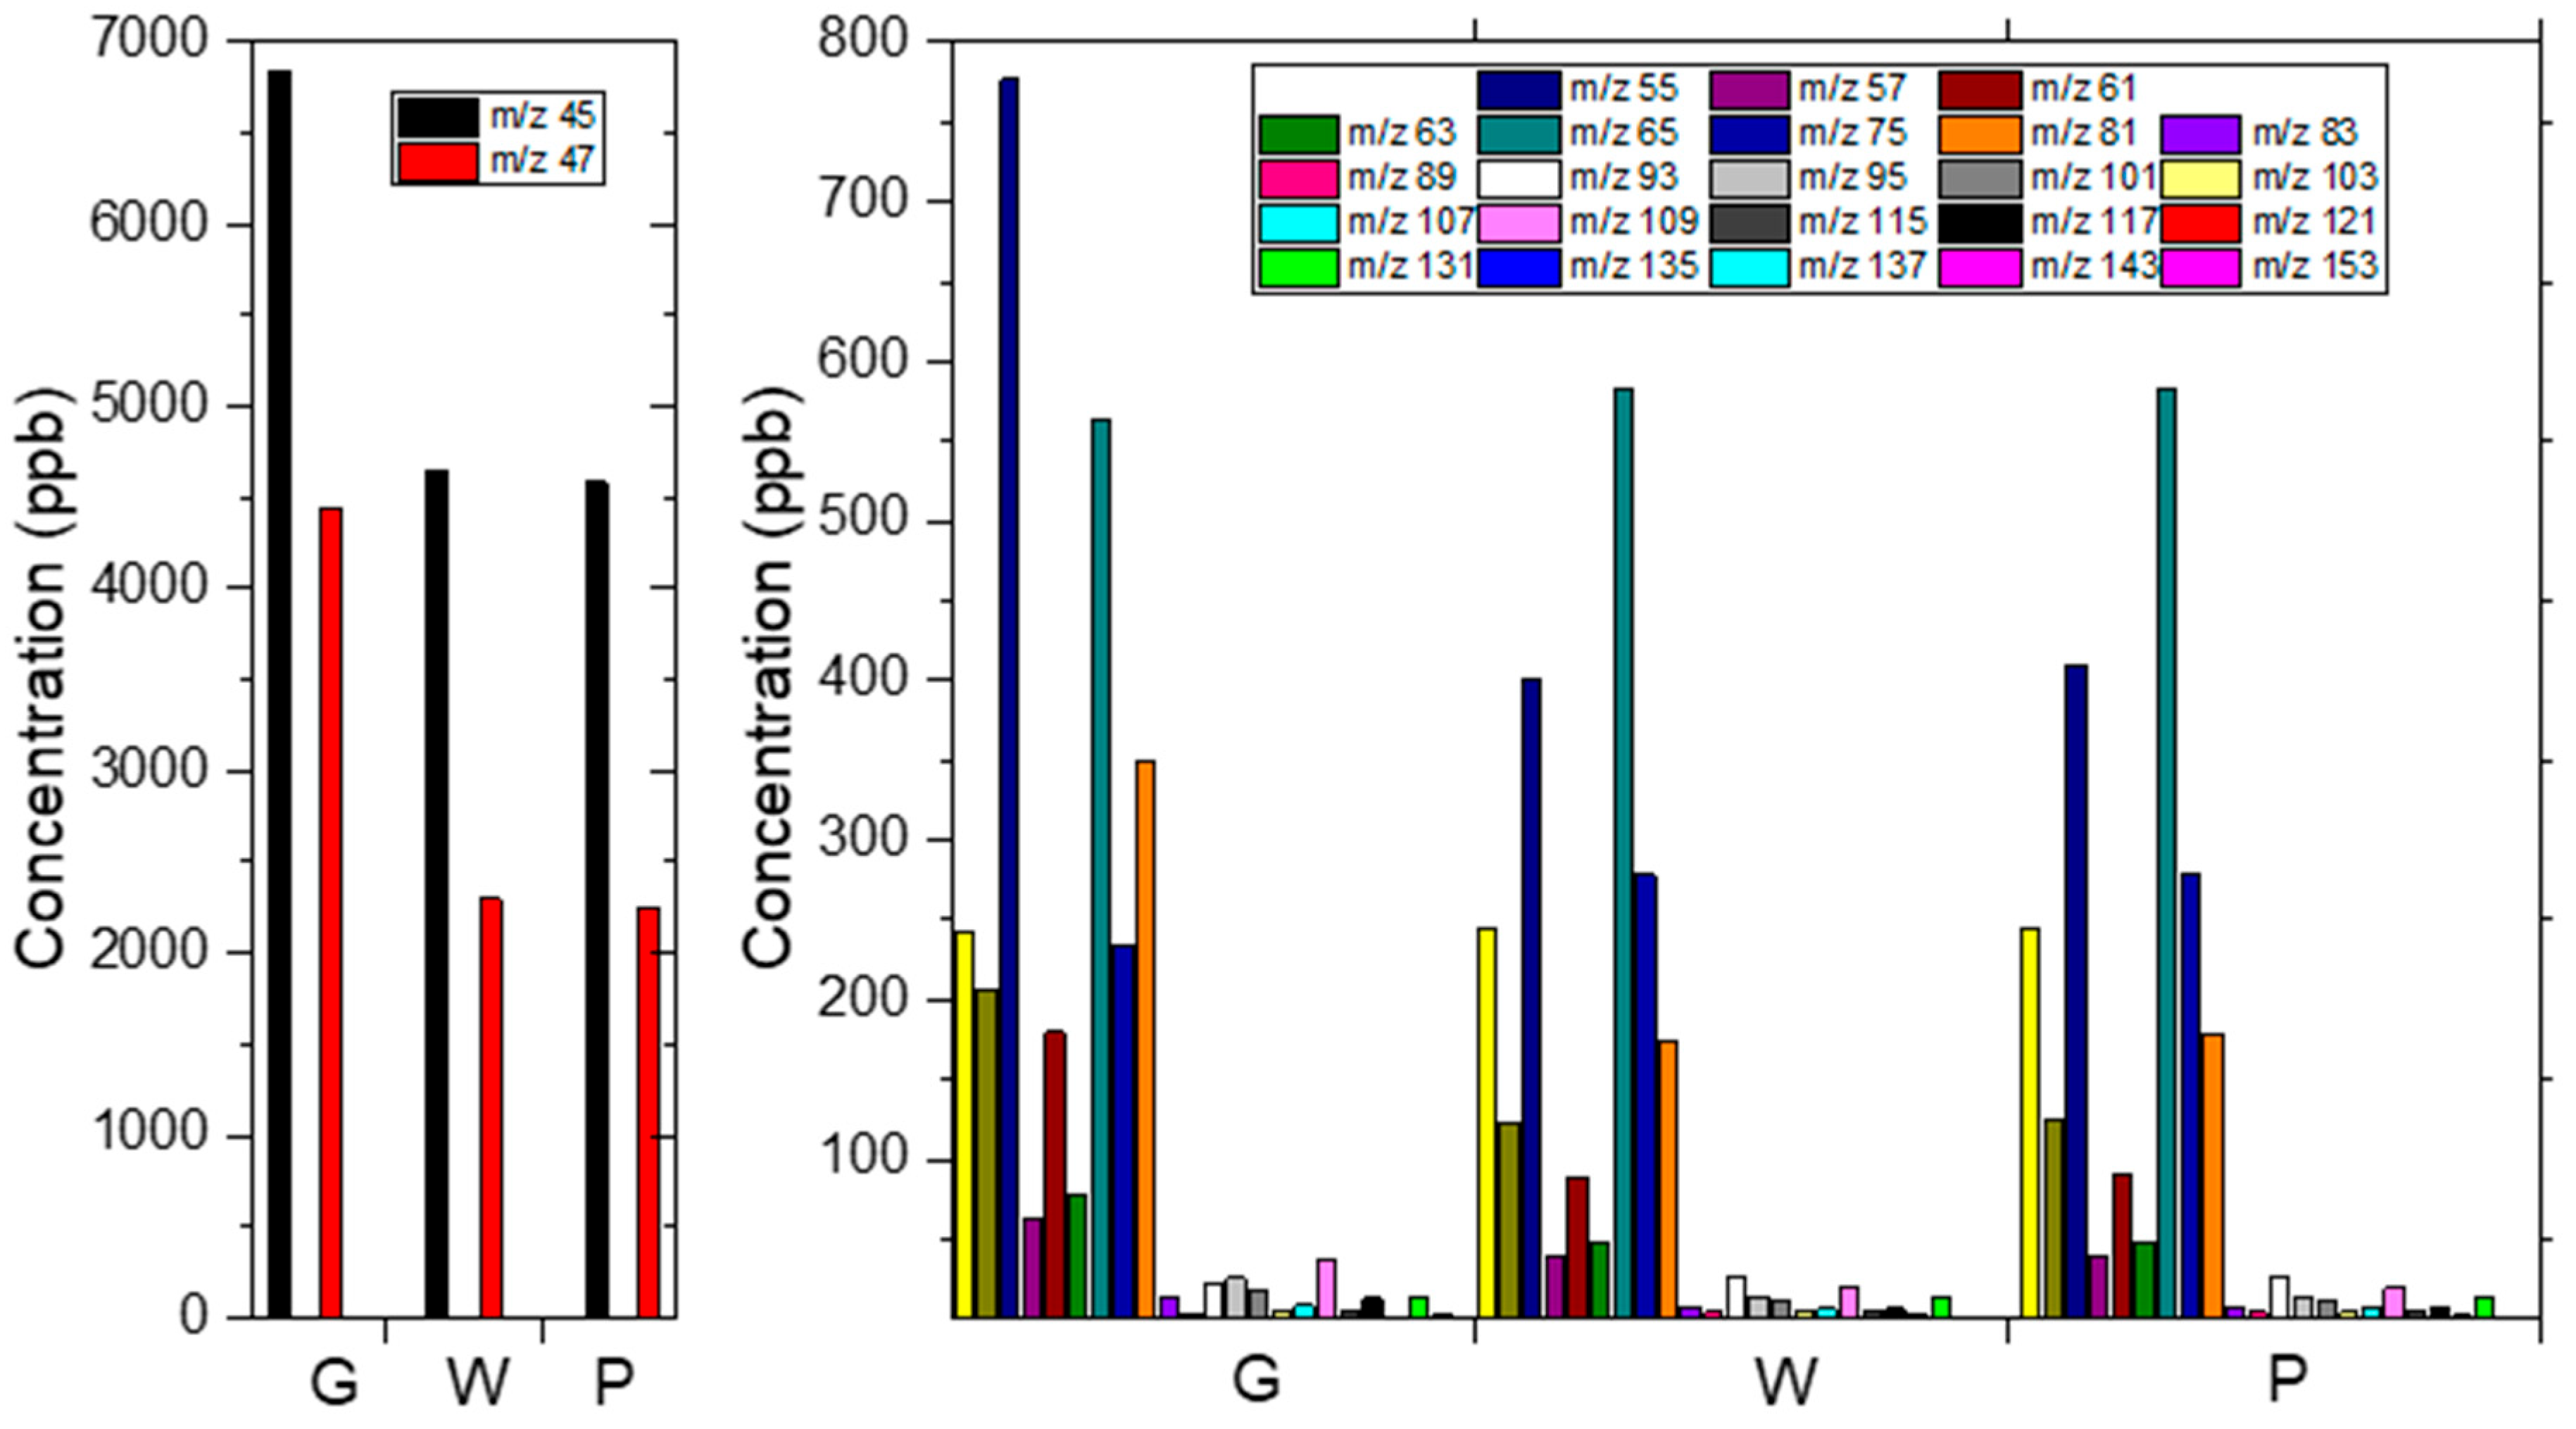
Figure 1 presents the average concentrations of compounds in individual areas in relation to the place of cranberry sampling (garden, wetland, plantation).
Figure 1.
Mean m/z concentrations for cranberry samples collected from gardens (G), wetlands (W), and plantations (P).
The highest concentration values were recorded for cranberries harvested in allotment gardens for compounds with a mass of m/z = 103 and amounting to approximately 25.9 ppb. In the case of both wetland areas and plantations, the highest concentrations were recorded for compounds with a mass of m/z = 107 and amounted to 19.5 ppb and 20.0 ppb, respectively.
Among all the studied areas, the lowest concentration values were observed for three compounds with masses m/z = 135, m/z = 143, m/z = 153 in all three cranberry sampling areas.
They were approximately 13 times lower than the highest values recorded for cranberries from the allotment area, 9 times lower in the wetland area, and 10 times lower for cranberries harvested from plantations.
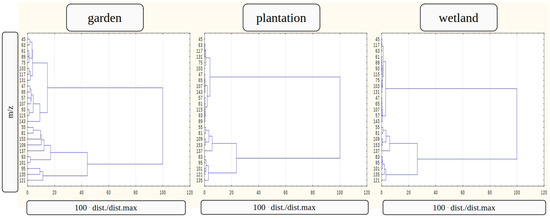
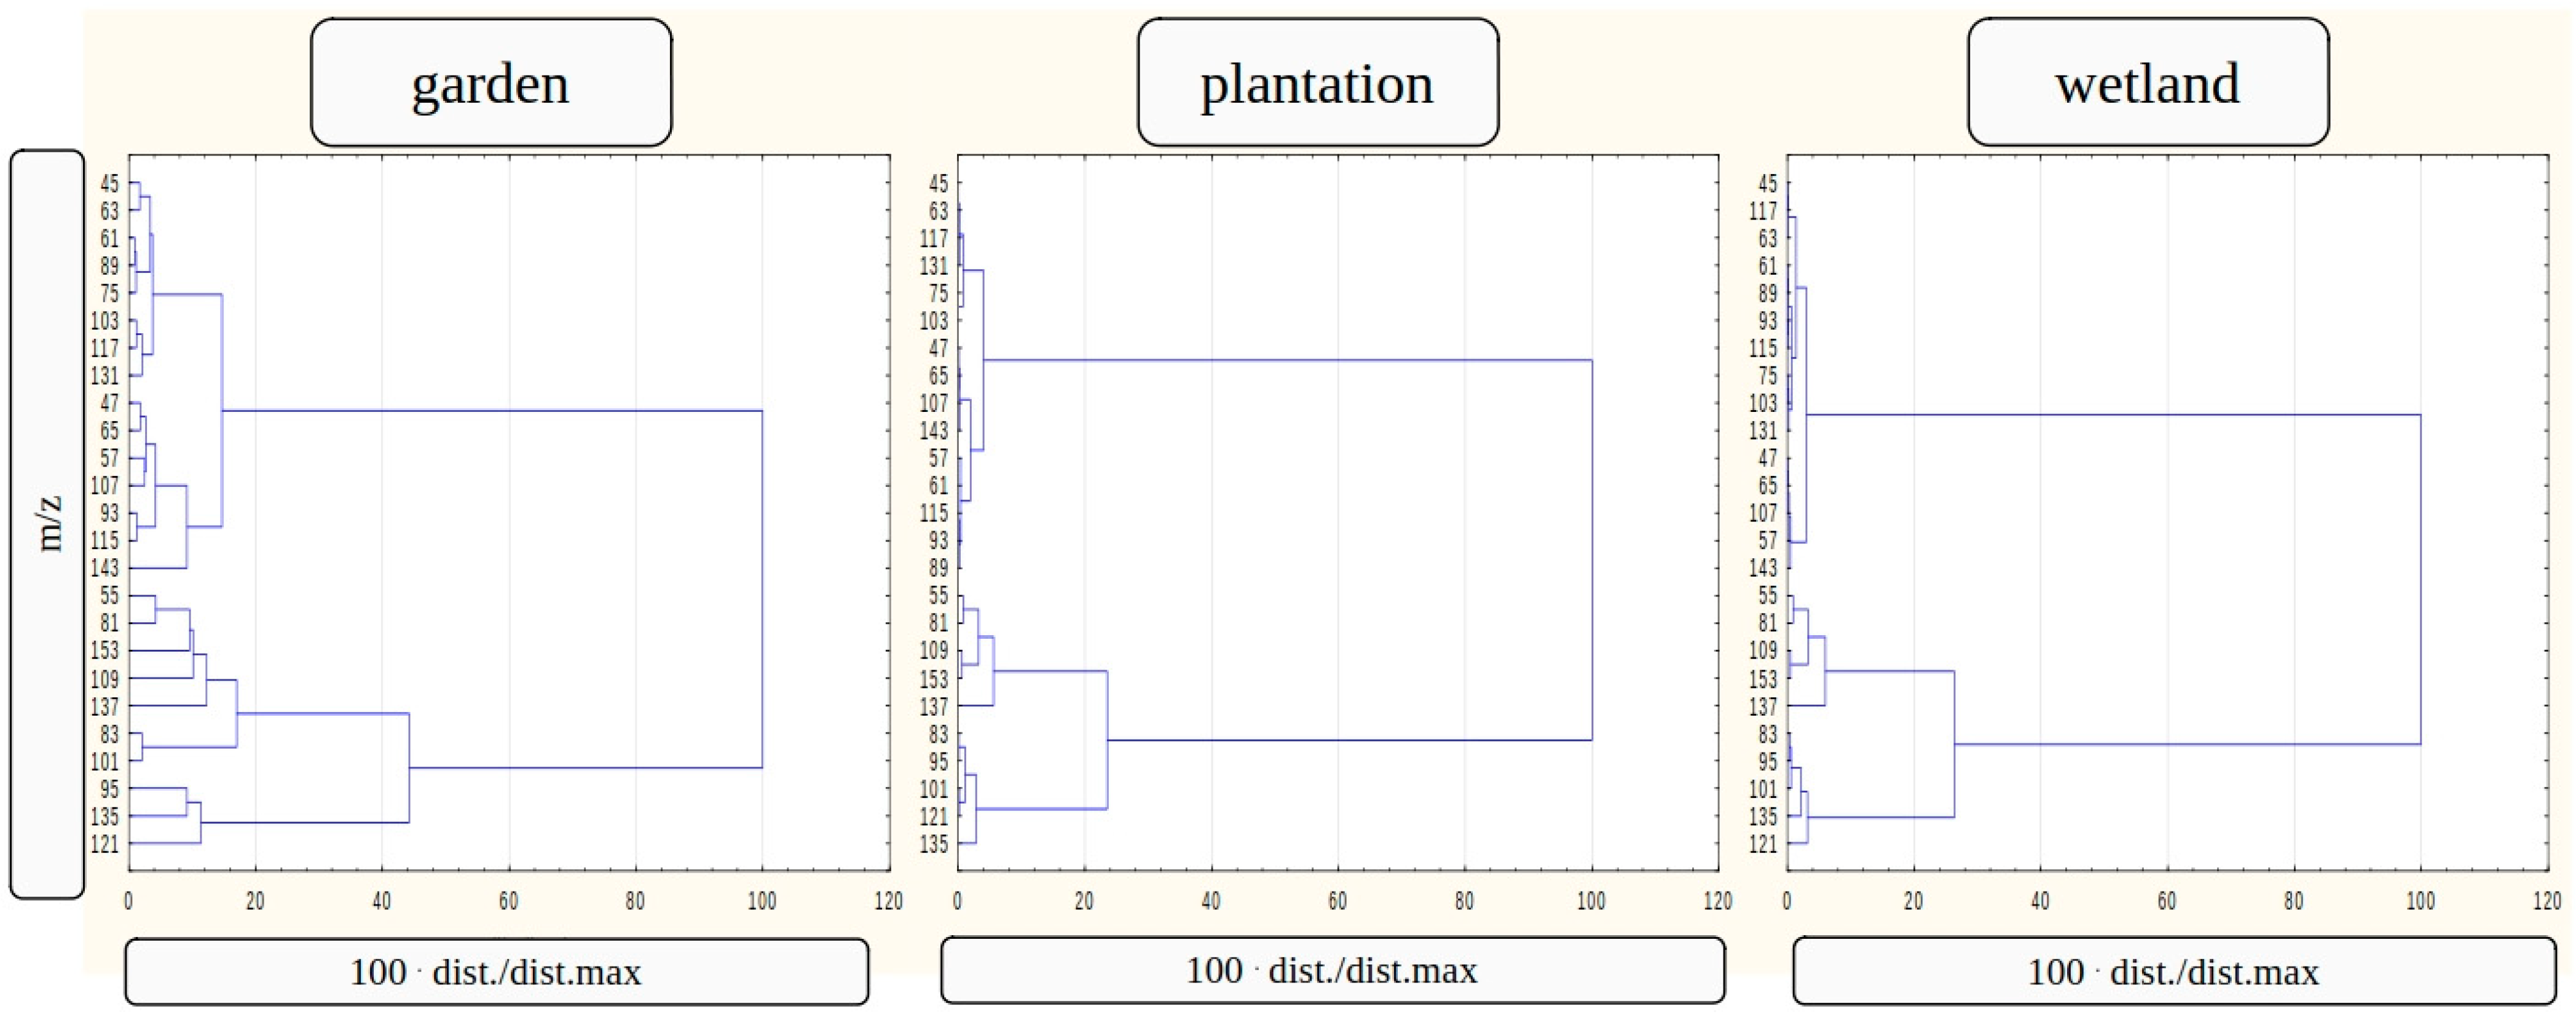
The multivariate cluster analysis is presented in Figure 2. It shows the grouping of individual compounds depending on m/z and cranberry sampling location. In each case, two main clusters (A and B) were observed.
Figure 2.
Multivariate cluster analysis in three variants: for cranberry samples collected from gardens, wetlands, and plantations.
Figure Garden: cluster A1 in m/z: 45, 63, 61, 89, 75, 103, 117, 131, cluster A2 in m/z: 47, 65, 57, 107, 93, 115, 143, cluster B1 in m/z: 55, 81, 153, 109, 137, 83, 101, cluster B2 in m/z: 95, 135, 121.
Figure Plantation: cluster A1 in m/z: 45, 63, 117, 131, 75, 103, cluster A2 in m/z: 47, 65, 107, 143, 57, 115, 93, 89, cluster B1 in m/z: 55, 81, 109, 153, 137, cluster B2 in m/z: 83, 95, 101, 121, 135.
Figure Wetland: cluster A1 in m/z: 45, 117, 63, 61, 89, 93, 115, 75, 103, 131, cluster A2 in m/z: 47, 65, 107, 57, 143, cluster B1 in m/z: 55, 81, 109, 153, 137, cluster B2: 83, 95, 101, 135, 121.
Artificial Neural Networks
Initial classification analyses of cranberries of various origins were conducted for 100 MPL and RBF neural networks using various neural activation functions. Because the training and testing quality of the best RBF networks was several percent lower than that of the MPL network, further studies were conducted only for the MPL network. For this type of network, 200 networks were tested for 10 variables corresponding to the m/z ratio values. The range of neuron numbers in the hidden layer was set to 4 to 13. The results for the selected top 10 networks are presented in Table S1. The primary criterion for network selection was its accuracy at the testing level, followed by training and validation accuracy and the lowest possible number of neurons in the hidden layer. The MLP 10-9-3 network, found in the 56rd training cycle, was deemed the best. The results for the top 10 networks are presented in Table S1.
Table S2 presents the number of samples used in the MPL 10-9-3 network model in three categories: Garden, Wetland, and Plantation, as well as the number of correct and incorrect classification results combined for training, testing, and validation. A thorough analysis of the prediction spreadsheet showed that the classification results for cranberries from plantations were 99% correct; for cranberries from the garden, the classification was incorrect in 2 out of 98 cases (all during training); and for cranberries from wetlands, the number of incorrect results was the highest, at 8 out of 99 (6 for training and 2 for testing; all cases were misclassified as cranberries from plantations). This indicates that the neural network had the greatest difficulty distinguishing cranberries from wetlands and plantations. This result is consistent with the previous statistical analysis (see Table 2), but the number of misclassified cases is relatively low (less than 10%).
After analyzing the network’s sensitivity to predictors (see Tables S3 and S4), the number of predictors was reduced to 9, eliminating the variable m/z = 143. The most favorable network for 9 variables was the MLP 9-10-3 network for the tanh and linear activation functions, respectively, for the output and hidden layers. This network was found in the 93nd cycle of training. Table 3 presents the error matrix for this MLP 9-10-3 network. Compared to the MLP 10-9-3 network (Table S2), the number of all incorrect results decreased from 14 to 11. For garden cranberries, the number of errors decreased from 5 to 2; for wetland cranberries it decreased from 9 to 8; and for plantation cranberries the accuracy increased from 0 to 1.
Table 3.
Error matrix for the MPL 9-12-3 network.
Because reducing the number of variables slightly improved the results of this modeling, the number of predictors was further reduced to 8. A further 100 networks were tested, similarly to the previous two cases. However, the accuracy results were significantly worse, i.e., for the best network with 8 variables, the accuracy was approximately 90% at the test and training levels.
4. Discussion
Recently, there has been a growing consumer interest in high-quality food [49,50]. Cranberries belong to the Vaccinium genus of the Ericaceae family. All berries from this family have many easily searchable and scientifically proven beneficial properties [51,52]. Features that characterize high-quality food include taste and aroma, freshness, nutritional value, naturalness, health-promoting qualities, and environmental friendliness. This is particularly true for regional products [53], which include cranberries.
Also, the demand for products in the genus Vaccinium, including cranberries, has increased for both food and health-promoting purposes. There is also a noticeable interest in volatile organic compounds, especially those of potential toxicity such as phenols [38] in appropriate concentrations. Some studies focus more on the aromatic part of the fruit, examining volatile organic compounds [54] or the aroma profile [55], while others focus more on the nutritional value of the berries [56].
The results of research on volatile organic compounds emitted from cranberries presented in this article, together with statistical analyses (Table 1 and Table 2, Figure 2 and Figure 3), show that in the case of aroma, which is caused by the VOCs contained in it and which, next to taste, is the main advantage of the fruit [57], there is a possibility of comparative studies of products grown, e.g., through sustainable agriculture, with natural products. Statistical analyses allow for grouping samples and identifying similarities and differences between them. PTR-MS is an important tool for very sensitive and rapid VOC analysis [26]. For the growth of the concept of sustainable development, the use of innovative, fast and easy to use tools is required. Therefore, as evidenced by the presented research, combining PTR-MS analyses with appropriate statistical techniques can provide a complementary set of methods.
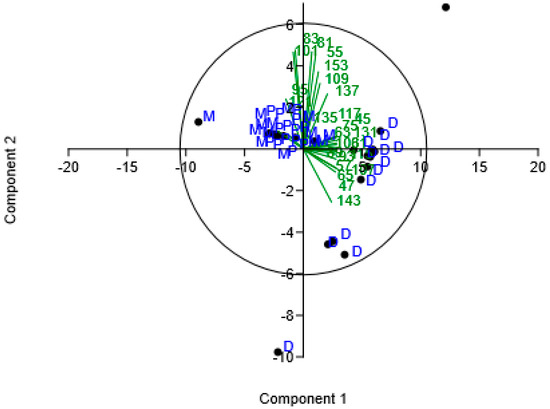
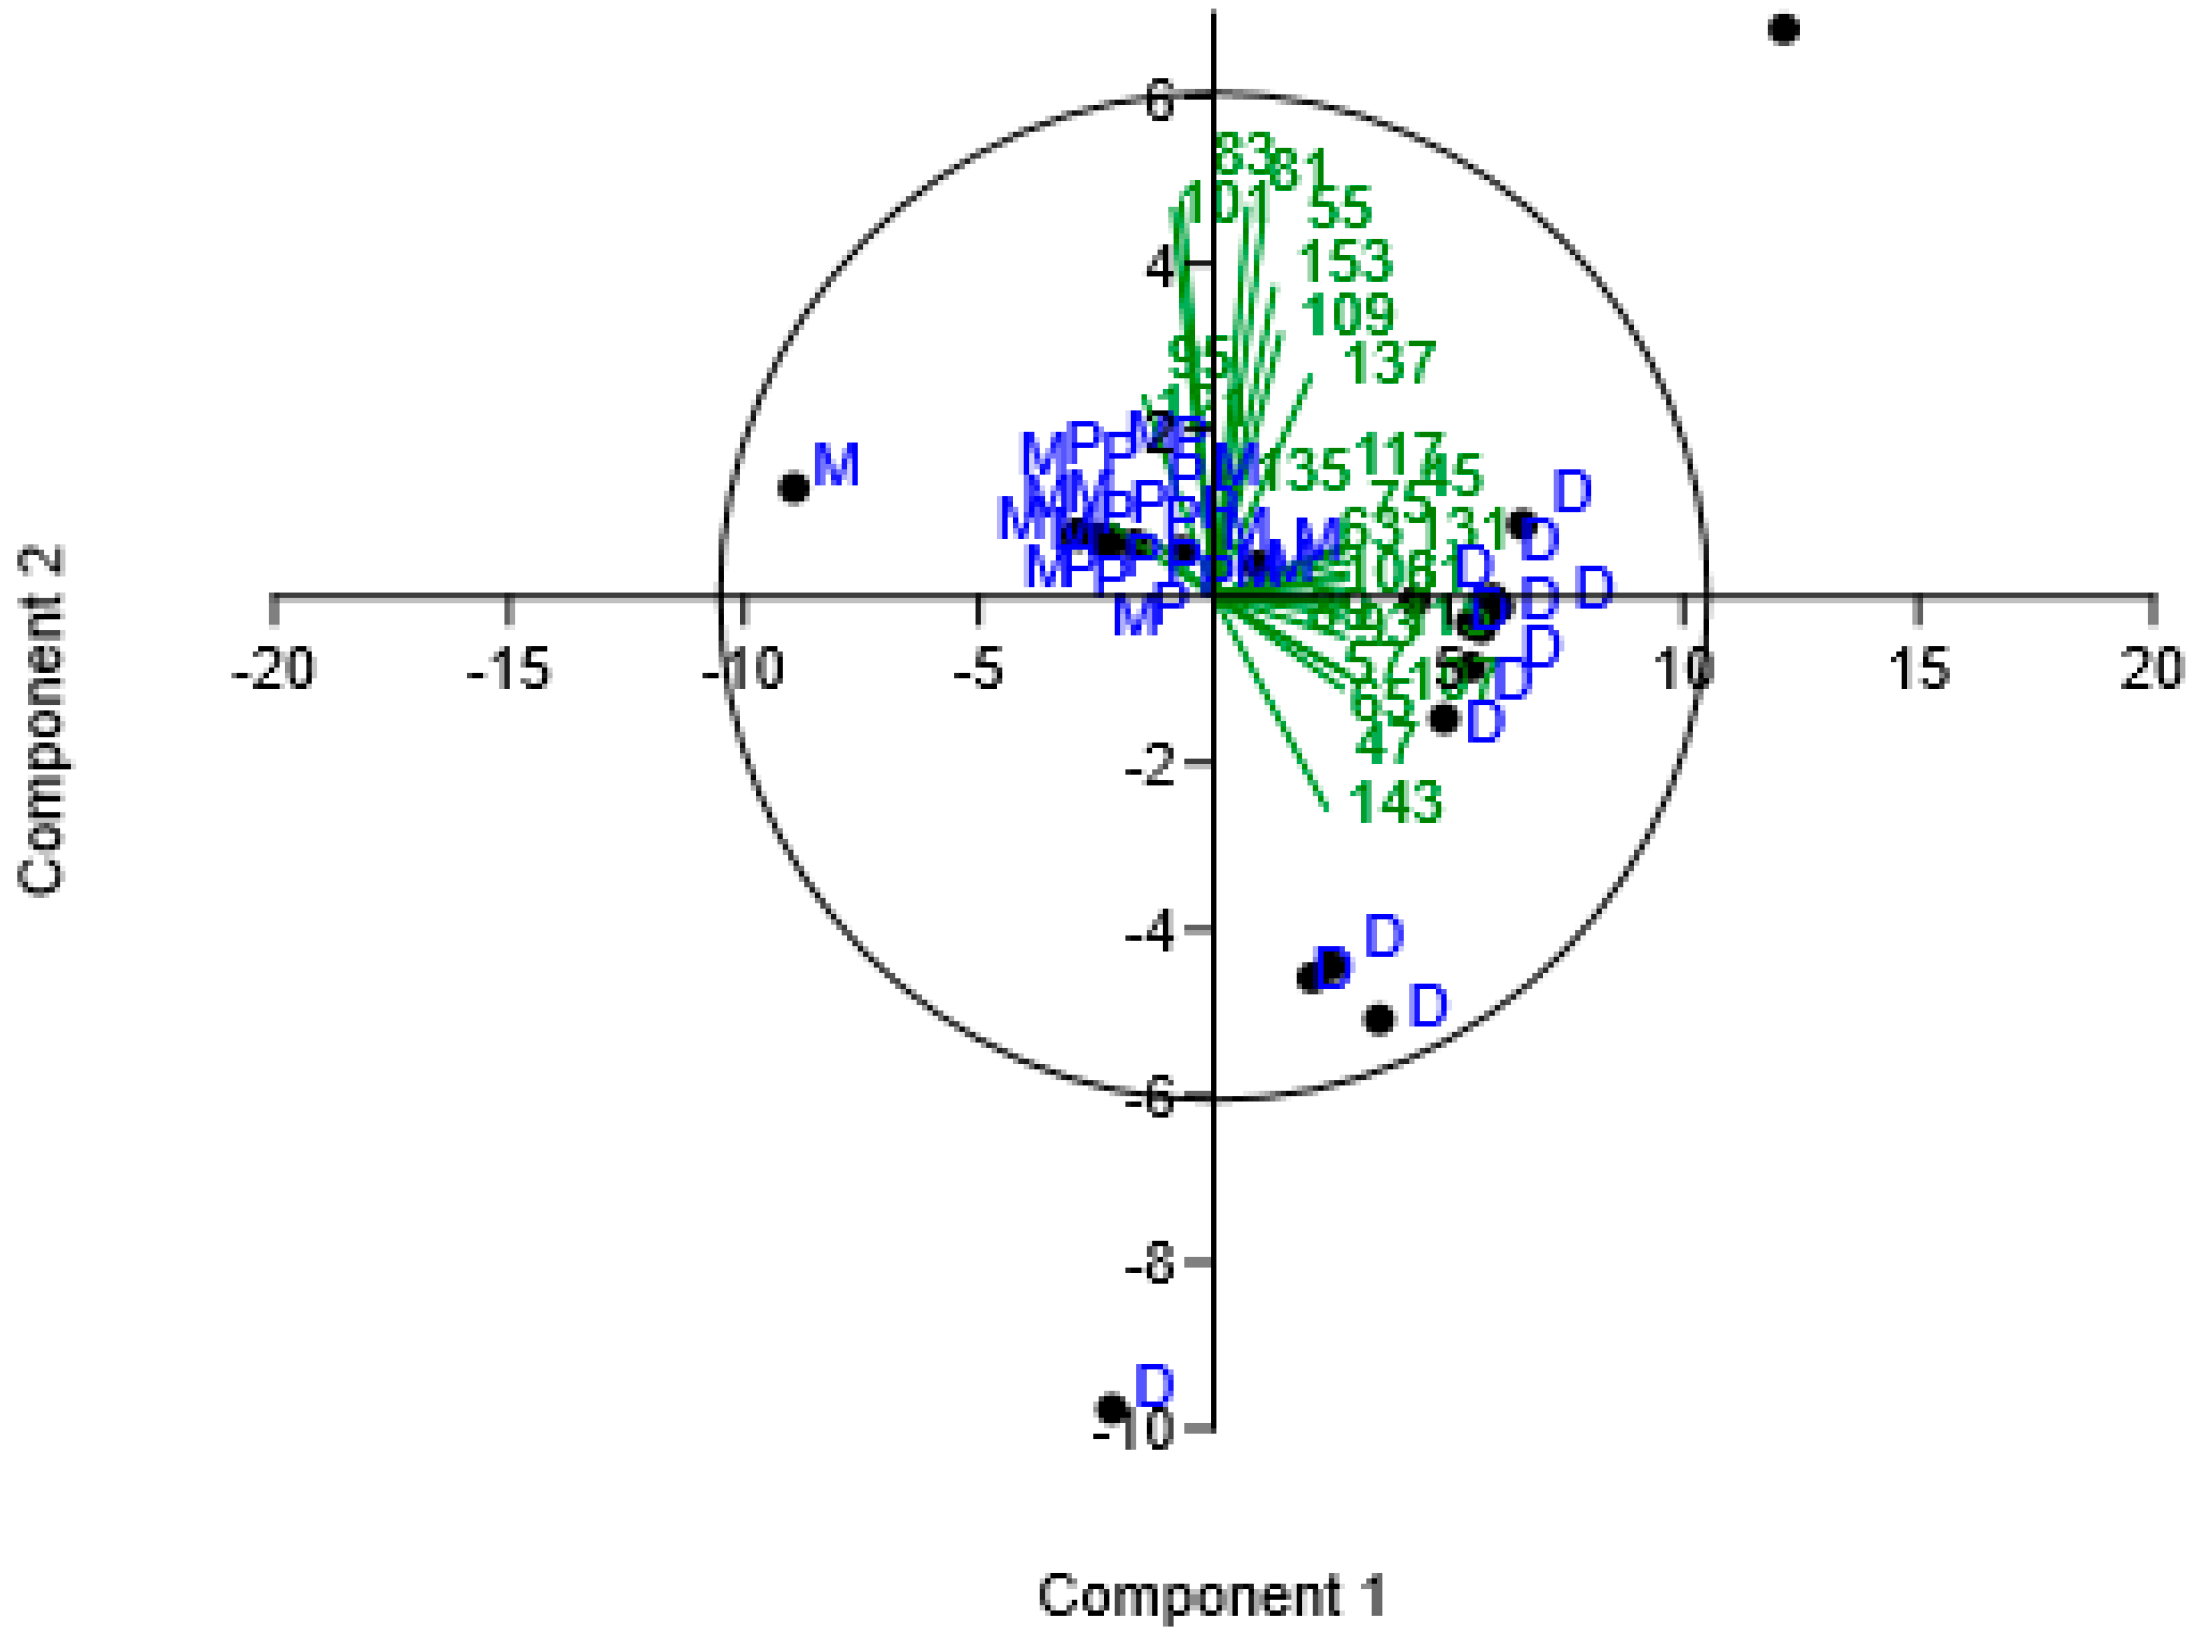
Figure 3.
Multivariate PCA, calculated for all collected data. Green numbers indicate the corresponding m/z VOC. Explanations: D—Garden, M—Wetland, P—Plantations.
Providing crops with growing conditions as close as possible to those found in the natural environment can lead to aromas of fruit similar to those observed in nature. PTR-MS studies are a tool for studying VOCs emitted from plant fruits and other products [58,59,60]. VOC concentration results obtained by PTR-MS can be used to obtain fingerprints, which can be helpful in classifying fruits by their environment, by searching for similarities and differences. They can also be used to search for peaks in mass spectra that may indicate undesirable characteristics in the final product [61]. Building a database of standard odors obtained by PTR-MS methods can be an important element in the development of a sustainable economy, allowing the study of agricultural plant products that are as close as possible to their natural chemical composition. Hence, in the presented research results, VOC emissions from cranberries grown on plantations in wetlands were closer to natural conditions (from wetland) than garden cultivation, which was not carried out in a wetland but on moist soil. The above considerations are confirmed by data from statistical tests enhanced by neural networks (Table 3 and Tables S1–S3) and also by cluster analysis (Figure 2).
In the cluster analysis presented in Figure 2, clusters B1 and B2 for cranberries from plantations are most similar to the wetland samples. In cluster A, there are some differences between the graphs for cranberries from wetland and plantations; although 100% of the constituents are found in cluster A, the arrangement in subclusters A1 and A2 is changed. The clustering graph obtained for VOCs from cranberries from the garden differs significantly from the others. This site is partially protected as the “Łętowskie Lake and the vicinity of Kępice” protected landscape area, northern Poland [62]. Due to the fact that the authors did not have full information on what had happened to the fruit from harvest to delivery to the store, it should be taken into account that this could have had some impact on the VOC measurement results. However, the marketed product is precisely the one purchased by the end consumer; hence, the study of the final product ready for sale in this form is also valuable from the point of view of the presented comparative research.
PCA is a frequently used and proven method for comparative studies. The PCA data obtained (Figure 3) indicate significant similarities across a wide range of samples from natural wetlands and plantations. The results are mostly concentrated around the fourth quadrant of the graph and the central part of the graph. It is worth noting that although the M and P values are closely clustered, they do show some differences, as also confirmed by neural network analysis (Table 2 and Supplement Tables S1–S4). Unlike the M and P data, the VOC results obtained from the garden (G) are significantly different from the first group and are concentrated primarily in quadrants 1 and 2 of the graph, constituting a separate group.
In summary, based on PCA, it can be observed that cranberry fruit samples collected from the garden areas constitute a distinct group from those collected from the Wetland and Plantation areas. PCA identifies principal components by combining parameter groups [44]. Fruit samples from the wetland and plantation areas overlap significantly (visible in the central and left-hand sections of the PCA plot), while the garden area samples are located on the right side of the plot, which might suggest their distinct nature.
When neural networks were used to classify cranberries of different origins based on VOC mass spectra obtained in a PTR-MS spectrometer, it can be inferred that this procedure allows for better identification than traditional statistical methods. The MLP 10-9-3 network had the lowest accuracy in distinguishing between wetland and plantation cranberries (8 cases in which the wetland cranberry was classified by the model as plantation cranberry, see Table S2). This result is consistent with the previous statistical analysis (see Table 2), but the number of incorrectly classified cases is relatively low (less than 10%). After reducing the number of predictors to 9, the overall accuracy of the MLP 9-10-3 network at the training and testing levels remained at the same level as the MLP 10-9-3 network, while at the validation level it reached an accuracy of 96.8%. In this case, the number of incorrectly classified cranberry samples for the wetland decreased from nine to eight (Table S3).
This situation can likely be explained by the way nutrients are absorbed from the soil and through the leaves. These methods differ significantly for plants collected from gardens, where the plants grow like traditional horticultural crops in moist soil. Cranberry cultivation requires more acidic soils, such as peat, and significant amounts of irrigation [63]. According to Werzel [64] and Xing et al. [65], submerged macrophytes have significant bioaccumulation potential due to the large surface area of the plant in contact with water. The chemical composition of the soils in which cranberries grow is also an important characteristic, and it would be advisable to consider this element in future studies.
In the case of cranberries grown in plantations and wetlands, we observe transport of substances both from bottom sediments to the plant and from water to the plant across the entire surface of the submerged plant. The studied cranberries are unfortunately not uniform in species, which may affect VOC emissions. However, the results of the statistical analysis (Table 2) suggest that the place of cultivation was the dominant factor in the presented study. Furthermore, dissolved chemicals are much more readily available for uptake by plants. In the case of cranberries grown as in horticultural cultivation (moist soil), transport occurs from the soil through the root system to the plant. Furthermore, substances deposited on leaves can be washed away by rain or dispersed by wind relatively easily [66,67]. Deposition from the atmosphere directly through leaves is very limited due to mechanisms on leaves that regulate leaf–atmosphere material exchange, such as stomata, as well as cuticle covering the leaves. However, a plant submerged in water has a much greater capacity to exchange substances, especially since many of the substances are in dissolved form [64,65].
5. Conclusions
The conducted research provides information on the similarities and differences between the volatile organic compounds (VOCs) emitted from cranberries collected from three different areas, differing in their cultivation methods and degree of anthropogenicity and species. Using statistical techniques such as neural networks and multivariate statistical analyses, it was possible to trace significant similarities between the VOCs of cranberries from plantations and those from the natural site “Łętowskie Lake and the vicinity of Kępice.” It was observed that cranberries grown traditionally in gardens (Vaccinium macrocarpon) in moist soil emitted a VOC composition significantly different from those from plantations (Vaccinium macrocarpon) and from the natural site in a wetland (Vaccinium oxiccocus). The cultivation method, and therefore the uptake of chemical components from the soil, likely played a significant role in the VOC emissions from cranberries: in the case of plants from plantations and the natural site, the plants were largely immersed in water, whereas in the gardens, they were grown in moist soil—without immersion in water. The use of PTR-MS analyses for similar fruit comparisons can be useful for finding potential sustainable development paths while preserving natural characteristics. Although the research conducted represents a significant contribution to the development of a method for analyzing VOCs in cranberry aromas, it should be considered exploratory in nature and enabling the development of a more accurate method for analyzing cranberry samples and comparing their VOC composition.
Supplementary Materials
The following supporting information can be downloaded at: https://www.mdpi.com/article/10.3390/su18094580/s1.
Author Contributions
Conceptualization, T.W. and J.A.; methodology, T.W.; software, J.A. and T.W.; validation, T.W.; analysis PTR-MS T.W., investigation, T.W., J.A. and P.M.; resources, T.W., J.A. and P.M.; writing—original draft preparation, T.W., J.A. and P.M.; writing—review and editing, T.W., J.A. and P.M.; visualization, J.A. and T.W.; project administration, T.W. and J.A.; English translation P.M., funding acquisition, J.A. and T.W. All authors have read and agreed to the published version of the manuscript.
Funding
This research was funded by internal Pomeranian University in Słupsk grant, no. 23.5.3 and 21.4.14.
Institutional Review Board Statement
Not applicable.
Informed Consent Statement
Not applicable.
Data Availability Statement
The original contributions presented in the study are included in the article, further inquiries can be directed to the authors.
Conflicts of Interest
The authors declare no conflicts of interest.
Abbreviations
The following abbreviations are used in this manuscript:
| PTR-MS | proton transfer reaction mass spectrometry |
| VOC | volatile organic compounds |
References
- Wróblewski, T.; Kamińska, A.; Włodarkiewicz, A.; Ushakou, D. Studies of volatile organic compounds emission from fragaria vesca and fragaria ananassa using proton transfer reaction mass spectrometry. Acta Phys. Pol. B Proc. Suppl. 2020, 12, 899–906. [Google Scholar] [CrossRef] [Scilit]
- Granitto, P.M.; Biasioli, F.; Aprea, E.; Mott, D.; Furlanello, C.; Märk, T.D.; Gasperi, F. Rapid and non-destructive identification of strawberry cultivars by direct PTR-MS headspace analysis and data mining techniques. Sens. Actuators B Chem. 2007, 121, 379–385. [Google Scholar] [CrossRef] [Scilit]
- Ciesa, F.; Höller, I.; Guerra, W.; Berger, J.; Dalla Via, J.; Oberhuber, M. Chemodiversity in the Fingerprint Analysis of Volatile Organic Compounds (VOCs) of 35 Old and 7 Modern Apple Cultivars Determined by Proton-Transfer-Reaction Mass Spectrometry (PTR-MS) in Two Different Seasons. Chem. Biodivers. 2015, 12, 800–812. [Google Scholar] [CrossRef] [Scilit] [PubMed]
- Hobbs, P.J.; Webb, J.; Mottram, T.T.; Grant, B.; Misselbrook, T.M. Emissions of volatile organic compounds originating from UK livestock agriculture. J. Food Sci. 2004, 84, 1414–1420. [Google Scholar] [CrossRef] [Scilit]
- Ashworth, K.; Wild, O.; Hewitt, C. Impacts of biofuel cultivation on mortality and crop yields. Nat. Clim. Change 2013, 3, 492–496. [Google Scholar] [CrossRef] [Scilit]
- de Ferreyro Monticelli, D.; Bhandari, S.; Eykelbosh, A.; Henderson, S.B.; Giang, A.; Zimmerman, N. Cannabis Cultivation Facilities: A Review of Their Air Quality Impacts from the Occupational to Community Scale. Environ. Sci. Technol. 2022, 56, 2880–2896. [Google Scholar] [CrossRef] [Scilit]
- Yan, B.; Zeng, L.; Lu, Y.; Li, M.; Lu, W.; Zhou, B.; He, Q. Rapid bacterial identification through volatile organic compound analysis and deep learning. BMC Bioinform. 2024, 6, 347. [Google Scholar] [CrossRef] [Scilit]
- Wróblewski, T.; Kamińska, A.; Włodarkiewicz, A. Studies on the Emission of Volatile Organic Compounds from Selected Forest Mushrooms of the Genus Lactarius Using Proton-Transfer Reaction Mass Spectrometry. Molecules 2025, 30, 3000. [Google Scholar] [CrossRef] [Scilit]
- Russo, A.; Monti, M.M.; Ruocco, M.; Loreto, F. Phenotyping volatile organic compounds (VOCs) emitted by plants. In Proceedings of the 2023 IEEE International Workshop on Metrology for Agriculture and Forestry (MetroAgriFor), Pisa, Italy, 6–8 November 2023; pp. 41–44. [Google Scholar]
- Jansen, R.M.C.; Wildt, J.; Kappers, I.F.; Bouwmeester, H.J.; Hofstee, J.W.; van Henten, E.J. Detection of Diseased Plants by Analysis of Volatile Organic Compound Emission. Annu. Rev. Phytopathol. 2011, 49, 157–174. [Google Scholar] [CrossRef] [Scilit]
- Gbiliy, A.; Senosy, I.; Saadan, M.A.A.; Di, X.; Sayed, M.; Gao, Y.-Y.; Liao, P.; Kandegama, W.M.W.W.; Wang, M.-Q.; Hao, G.-F. Nanoarchitectures-powered volatile organic compound sensors enable real-time monitoring and early warning in sustainable agriculture. Coord. Chem. Rev. 2026, 548, 217169. [Google Scholar]
- Makhlouf, L.; El Fakhouri, K.; Kemal, S.A.; Maafa, I.; Meftah Kadmiri, I.; El Bouhssini, M. Potential of volatile organic compounds in the management of insect pests and diseases of food legumes: A comprehensive review. Front. Plant Sci. 2024, 15, 1430863. [Google Scholar] [CrossRef] [Scilit]
- Lv, B.; Mo, W.; Jian, C.; Li, S.; Guo, Y. Recent progress in food quality control through flavor analysis using gas chromatography–ion mobility spectrometry. Food Meas. 2024, 18, 8002–8015. [Google Scholar]
- Feng, Y.; Wang, Y.; Beykal, B.; Qiao, M.; Xiao, Z.; Luo, Y. A mechanistic review on machine learning-supported detection and analysis of volatile organic compounds for food quality and safety. Trends Food Sci. Technol. 2024, 143, 104297. [Google Scholar] [CrossRef] [Scilit]
- Hao, X.; Zou, J.; Zeng, J.; He, J.; Li, B.; Lin, K.; Yi, H.; Zhang, L.; Gong, P. Machine learning-driven GC–MS analysis for assessing the contribution of amino acids in the flavor of cheese maturing at high temperature. Int. J. Food Microbiol. 2026, 448, 111581. [Google Scholar] [PubMed]
- Gatzias, I.S.; Karabagias, I.K.; Kontominas, M.G.; Badeka, A.V. Geographical differentiation of feta cheese from northern Greece based on physicochemical parameters, volatile compounds and fatty acids. LWT 2020, 131, 109615. [Google Scholar] [CrossRef] [Scilit]
- Marinaki, M.; Sampsonidis, I.; Lioupi, A.; Arapitsas, P.; Thomaidis, N.; Zinoviadou, K.; Theodoridis, G. Development of two-level Design of Experiments for the optimization of a HS-SPME-GC-MS method to study Greek monovarietal PDO and PGI wines. Talanta 2023, 253, 123987. [Google Scholar] [CrossRef] [Scilit]
- Szymczak, K.; Nawrocka, J.; Bonikowski, R. Fingerprinting of Volatile Organic Compounds in Old and Commercial Apple Cultivars by HS-SPME GC/GC-ToF-MS. Int. J. Mol. Sci. 2024, 25, 13478. [Google Scholar] [CrossRef] [Scilit] [PubMed]
- Antonowicz, J.; Wróblewski, T. Study of Volatile Organic Compounds in Emission from Bottom Sediments of Three Lakes with Impact of Anthropopression Using the Proton Transfer Reaction Mass Spectrometry. Limnol. Rev. 2024, 24, 205–216. [Google Scholar] [CrossRef] [Scilit]
- Antonowicz, J.; Wróblewski, T. Studies of Volatile Organic Compounds Emission from Bottom Sediments of Mid–Forest Eutrophic Lake with the Use of Proton Transfer Reaction Mass Spectrometry. Limnol. Rev. 2025, 25, 49. [Google Scholar] [CrossRef] [Scilit]
- de Lacy Costello, B.; Amann, A.; Al-Kateb, H.; Flynn, C.; Filipiak, W.; Khalid, T.; Osborne, D.; Ratcliffe, N.M. A review of the volatiles from the healthy human body. J. Breath Res. 2014, 8, 014001. [Google Scholar]
- Panighel, A.; Flamini, R. Applications of Solid-Phase Microextraction and Gas Chromatography/Mass Spectrometry (SPME-GC/MS) in the Study of Grape and Wine Volatile Compounds. Molecules 2014, 19, 21291–21309. [Google Scholar] [CrossRef] [Scilit] [PubMed]
- Bajo-Fernández, M.; Souza-Silva, É.A.; Barbas, C.; Rey-Stolle, M.F.; García, A. GC-MS-based metabolomics of volatile organic compounds in exhaled breath: Applications in health and disease. A review. Front. Mol. Biosci. 2024, 10, 1295955. [Google Scholar] [CrossRef] [Scilit]
- Amaral, O.C.; Olivella, L.; Grimalt, J.O.; Albaiges, J. Combined solvent extraction-purge and trap method for the determination of volatile organic compounds in sediments. J. Chromatogr. A 1994, 675, 177–187. [Google Scholar] [CrossRef] [Scilit]
- Acquaticci, L.; Alessandroni, L.; Borsetta, G.; Caprioli, G.; Mannozzi, C.; Marconi, R.; Piatti, D.; Santanatoglia, A.; Sagratini, G.; Vittori, S.; et al. Volatile Profile of Strawberry Fruits and Influence of Different Drying Methods on Their Aroma and Flavor: A Review. Molecules 2023, 28, 5810. [Google Scholar] [CrossRef] [Scilit]
- Biasioli, F.; Gasperi, F.; Aprea, E.; Mott, D.; Boscaini, E.; Mayr, D.; Märk, R.D. Coupling proton transfer reaction—Mass spectrometry with linear discriminant analysis: A case study. J. Agric. Food Chem. 2003, 51, 7227–7233. [Google Scholar] [CrossRef] [Scilit]
- Romano, A.; Capozzi, V.; Spano, G.; Biasioli, F. Proton transfer reaction–mass spectrometry: Online and rapid determination of volatile organic compounds of microbial origin. Appl. Microbiol. Biotechnol. 2015, 99, 3787–3795. [Google Scholar] [CrossRef] [Scilit] [PubMed]
- Märk, T.D.; Dunn, G.H. (Eds.) Electron Impact Ionization; Springer: Vienna, Austria, 1985. [Google Scholar]
- Devienne, F.M.; Roustan, J.-C. ‘Fast atom bombardment’—A rediscovered method for mass spectrometry. Org. Mass Spectrom. 1982, 17, 173–181. [Google Scholar] [CrossRef] [Scilit]
- Ammann, A.A. Inductively coupled plasma mass spectrometry (ICP MS): A versatile tool. J. Mass Spectrom. 2007, 42, 419. [Google Scholar] [CrossRef] [Scilit]
- Lindinger, W.; Hansel, A.; Jordan, A. On-line monitoring of volatile organic compounds at pptv levels by means of Proton-Transfer-Reaction Mass-Spectrometry (PTR-MS): Medical applications, food control and environmental research. Int. J. Mass Spectrom. Ion Proc. 1998, 173, 191–241. [Google Scholar] [CrossRef] [Scilit]
- Blake, R.S.; Monks, P.S.; Ellis, A.M. Proton-Transfer Reaction Mass Spectrometry. Chem. Rev. 2009, 109, 861–896. [Google Scholar] [CrossRef] [Scilit]
- Roslund, K.; Lehto, M.; Pussinen, P.; Hartonen, K.; Groop, P.H.; Halonen, L.; Metsälä, M. Identifying volatile in vitro biomarkers for oral bacteria with proton-transfer-reaction mass spectrometry and gas chromatography-mass spectrometry. Sci. Rep. 2021, 11, 16897. [Google Scholar] [CrossRef] [Scilit]
- Bodet, C.; Grenier, D.; Chandad, F.; Ofek, I.; Steinberg, D.; Weiss, E.I. Potential oral health benefits of cranberry. Crit. Rev. Food Sci. Nutr. 2008, 48, 672–680. [Google Scholar] [CrossRef] [Scilit] [PubMed]
- Howell, A.B. Bioactive compounds in cranberries and their role in prevention of urinary tract infections. Mol. Nutr. Food Res. 2007, 51, 732–737. [Google Scholar] [CrossRef] [Scilit] [PubMed]
- Moore, K. Anti-inflammatory Activity of Phenolic and Volatile Compounds in Cranberries (Vaccinium macrocarpon L.). Master’s Thesis, University of Arkansas, Fayetteville, NC, USA, 2018. Available online: https://scholarworks.uark.edu/etd/2862 (accessed on 22 February 2026).
- Sater, H.M.; Bizzio, L.N.; Tieman, D.M.; Muñoz, P.D. A review of the fruit volatiles found in blueberry and other Vaccinium species. J. Agric. Food Chem. 2020, 68, 5777–5786. [Google Scholar] [CrossRef] [Scilit]
- Amundsen, M.; Hykkerud, A.L.; Kelanne, N.; Tuominen, S.; Schmidt, G.; Laaksonen, O.; Yang, B.; Martinussen, I.; Jaakola, L.; Aaby, K. Composition of Sugars, Organic Acids, Phenolic Compounds, and Volatile Organic Compounds in Lingonberries (Vaccinium vitis-idaea L.) at Five Ripening Stages. Foods 2023, 12, 2154. [Google Scholar] [CrossRef] [Scilit] [PubMed]
- Deng, L. Deep learning: Methods and applications. Found. Trends Signal Process. 2014, 7, 197–387. [Google Scholar] [CrossRef] [Scilit]
- Christmann, J.; Weber, M.; Rohn, S.; Weller, P. Nontargeted volatile metabolite screening and microbial contamination detection in fermentation processes by headspace GC-IMS. Anal. Chem. 2024, 96, 3794–3801. [Google Scholar] [CrossRef] [Scilit]
- IMGW-BIP. Available online: https://klimat.imgw.pl/pl/climate-maps/ (accessed on 11 April 2026).
- Hansen, M.J.; Adamsen, A.P.S.; Feilberg, A. Recovery of Odorants from an Olfactometer Measured by Proton-Transfer-Reaction Mass Spectrometry. Sensors 2013, 13, 7860–7871. [Google Scholar] [CrossRef] [Scilit]
- TIBCO, Statistica (Data Analysis Software System), version 13.3; TIBCO Software Inc.: Palo Alto, CA, USA, 2017.
- Hammer, Ø. PAST. In Paleontological Statistics. Reference Manual; Natural History Museum, University of Oslo: Oslo, Norway, 2023. [Google Scholar]
- Hammer, Ø.; Harper, D.A.T.; Ryan, P.D. PAST: Paleontological Statistics software package for education and data analysis. Palaeontol. Electron. 2001, 4, 1–9. [Google Scholar]
- Vaughn, M.L. Interpretation and knowledge discovery from the multilayer perceptron network: Opening the black box. Neural Comput. Appl. 1996, 4, 72–82. [Google Scholar] [CrossRef] [Scilit]
- Freeman, J.A.; Saad, D. Learning and generalization in radial basis function networks. Neural Comput. 1995, 7, 1000–1020. [Google Scholar] [CrossRef] [Scilit]
- Fletcher, R. Practical Methods of Optimization, 2nd ed.; John Wiley & Sons: New York, NY, USA, 1987. [Google Scholar]
- Barska, A.; Wojciechowska-Solis, J. Traditional and regional food as seen by consumers—Research results: The case of Poland. Br. Food J. 2018, 1209, 1994–2004. [Google Scholar]
- Kazimierczak, R.; Obidzińska, J.; Szumigaj, B.; Dobrowolski, H.; Rembiałkowska, E. Sustainable Foods: Consumer Opinions and Behaviour towards Organic Fruits in Poland. Sustainability 2024, 16, 3740. [Google Scholar] [CrossRef] [Scilit]
- Żurek, N.; Kapusta, I.T. Characteristics of Functional Cookies with Added Cranberries (Vaccinium oxycoccos) in the Form of a Polyphenol Preparation and a Microencapsulated Preparation. Appl. Sci. 2025, 15, 13060. [Google Scholar] [CrossRef] [Scilit]
- Zhao, S.; Liu, H.; Gu, L. American cranberries and health benefits—An evolving story of 25 years. J. Sci. Food Agric. 2018, 100, 5111–5116. [Google Scholar] [CrossRef] [Scilit]
- Kovács, I.; Balázsné Lendvai, M.; Beke, J. The Importance of Food Attributes and Motivational Factors for Purchasing Local Food Products: Segmentation of Young Local Food Consumers in Hungary. Sustainability 2022, 14, 3224. [Google Scholar] [CrossRef] [Scilit]
- Zhu, J.C.; Chen, F.; Wang, L.Y.; Niu, J.W.; Chen, H.X.; Wang, H.L.; Xiao, Z.B. Characterization of the Key Aroma Volatile Compounds in Cranberry (Vaccinium macrocarpon Ait.) Using Gas Chromatography–Olfactometry (GC-O) and Odor Activity Value (OAV). J. Agric. Food Chem. 2016, 64, 4990–4999. [Google Scholar] [CrossRef] [Scilit]
- Hirvi, T.; Honkanen, E.; Pyysalo, T. The aroma of cranberries. Z. Lebensm.-Unters. Forsch. 1981, 172, 365–367. [Google Scholar] [CrossRef] [Scilit]
- Fellers, C.R. Nutritive Value of Cranberries. Am. J. Public Health Nations Health 1933, 23, 13–18. [Google Scholar] [CrossRef] [Scilit] [PubMed]
- Kader, A. Flavor quality of fruits and vegetables. J. Sci. Food Agric. 2008, 88, 1863–1868. [Google Scholar] [CrossRef] [Scilit]
- Pozo-Bayón, M.-Á.; Martín-Álvarez, P.J.; Reineccius, G.A. Monitoring changes in the volatile profile of cheese crackers during storage using GC-MS and PTR-MS. Flavour Fragr. J. 2009, 24, 133–139. [Google Scholar] [CrossRef] [Scilit]
- Özdestan, Ö.; van Ruth, S.M.; Alewijn, M.; Koot, A.; Romano, A.; Cappellin, L.; Biasioli, F. Differentiation of specialty coffees by proton transfer reaction-mass spectrometry. Food Res. Int. 2013, 53, 433–439. [Google Scholar] [CrossRef] [Scilit]
- Kuś, P.M.; van Ruth, S. Discrimination of Polish unifloral honeys using overall PTR-MS and HPLC fingerprints combined with chemometrics. LWT-Food Sci. Technol. 2015, 62, 69–75. [Google Scholar] [CrossRef] [Scilit]
- Holm, E.S.; Adamsen, A.P.S.; Feilberg, A.; Schäfer, A.; Løkke, M.M.; Petersen, M.A. Quality changes during storage of cooked and sliced meat products measured with PTR-MS and HS-GC–MS. Meat Sci. 2013, 95, 302–310. [Google Scholar] [CrossRef] [Scilit]
- Warcino Forest District State Forest Holding: State Forests, Poland. 2024. Available online: https://warcino.szczecinek.lasy.gov.pl/obszary-chronionego-krajobrazu (accessed on 5 August 2024).
- Gupton, G.L. Establishment of Native Vaccinium Species on a Mineral Soil. HortScience 1985, 20, 673–674. [Google Scholar] [CrossRef] [Scilit]
- Wetzel, R.G. Limnology: Lake and River Ecosystems; Academic Press: San Diego, CA, USA; San Francisco, CA, USA; New York, NY, USA; Boston, MA, USA; London, UK; Sydney, Australia; Tokyo, Japan, 2011. [Google Scholar]
- Xing, W.; Wu, H.; Hao, B.; Liu, G. Metal accumulation by submerged macrophytes in eutrophic lakes at the watershed scale. Environ. Sci. Pollut. Res. 2013, 20, 6999–7008. [Google Scholar] [CrossRef] [Scilit] [PubMed]
- Cekstere, G.; Laivins, M.; Osvalde, A. Chemical composition of Scots pine bark as a bioindicator of environmental quality in Riga, Latvia. Proc. Latv. Acad. Sci. Sect. B Nat. Exact Appl. Sci. 2015, 69, 87–97. [Google Scholar]
- Kosiorek, M.; Modrzewska, B.; Wyszkowski, M. Levels of selected trace elements in Scots pine (Pinus sylvestris L.), silver birch (Betula pendula L.), and Norway maple (Acer platanoides L.) in an urbanized environment. Environ. Monit. Assess. 2016, 188, 598–610. [Google Scholar] [CrossRef] [Scilit] [PubMed]

Disclaimer/Publisher’s Note: The statements, opinions and data contained in all publications are solely those of the individual author(s) and contributor(s) and not of MDPI and/or the editor(s). MDPI and/or the editor(s) disclaim responsibility for any injury to people or property resulting from any ideas, methods, instructions or products referred to in the content. |
© 2026 by the authors. Licensee MDPI, Basel, Switzerland. This article is an open access article distributed under the terms and conditions of the Creative Commons Attribution (CC BY) license.