


Abstract
Promoting equitable and sustainable urban mobility requires accessibility assessment approaches that extend beyond purely geometric proximity measures toward service-sensitive and behavior-informed evaluation. This study develops an open-source GIS workflow that integrates General Transit Feed Specification (GTFS) datasets, demographic grid data, and spatial proximity modelling to construct three complementary accessibility-related indicators. Transit operational data are processed to derive service-strength indicators representing temporal service intensity at the stop level. Spatial proximity is evaluated through distance-based measurements between population grid centroids and the nearest public transport stops, subsequently transformed into a normalized proximity score reflecting perceived spatial effort. Demographic attributes, specifically age and gender structure, are also translated into a behavior potential index representing relative travel sensitivity across the urban grid. Then, rather than aggregating these components into a single composite accessibility indicator, the study analyses the spatial distribution of service strength (Sg), behavior potential (Bg), and proximity score (Pg) independently. Its empirical application to the metropolitan area of Valencia, Spain, reveals notable spatial disparities across these dimensions and highlights zones where demographic demand potential diverges from operational service provision. By relying exclusively on standardized open datasets and non-proprietary GIS tools, the proposed framework enhances methodological transparency, reproducibility, and transferability. The workflow provides a diagnostic foundation for future integrated accessibility modelling while preserving interpretative clarity at the indicator level.
1. Introduction
Urban mobility planning is increasingly shaped by the need to balance efficiency, environmental sustainability, and spatial equity. Traditional transport evaluation approaches, often focusing on infrastructure provision or geometric proximity measures, have been criticized widely for their limited ability to reflect real-world accessibility conditions and behavioral complexity [1,2,3]. Contemporary research emphasizes that accessibility cannot be adequately represented by distance alone, particularly within heterogeneous metropolitan environments characterized by socio-spatial disparities.
Recent studies highlight the importance of incorporating temporal service indicators such as trip frequency, mean headway, and expected waiting time into accessibility modelling frameworks [4,5,6,7,8,9]. The increasing availability of standardized operational datasets, particularly the General Transit Feed Specification (GTFS), has significantly expanded opportunities for service-sensitive and reproducible accessibility analysis [6,7,8,9,10].
At the same time, recent advances in accessibility research have increasingly emphasized the integration of service-based indicators, behavior sensitivity, and spatial equity considerations within unified analytical frameworks. Combining GTFS-derived service measures with sociodemographic characteristics has been shown to improve the assessment of accessibility inequalities and transport-related disadvantage in urban systems [3,4,5,11].
However, despite these developments, two key limitations remain. First, many existing approaches rely on composite indices that obscure the relative contribution of different accessibility components, reducing interpretability [12,13]. Second, other approaches are fragmented across independent modelling steps, without a transparent and transferable workflow structure [14,15,16,17,18]. As a result, diagnostic clarity between spatial proximity, service intensity, and demographic sensitivity remains limited.
These limitations highlight the need for reproducible and disaggregated analytical frameworks capable of explicitly identifying structural mismatches between service provision and potential demand.
At the same time as service-based advancements are implemented, accessibility research has increasingly acknowledged the importance of incorporating sociodemographic sensitivity into modelling frameworks [3,19,20,21,22]. Accessibility outcomes are not determined solely by infrastructure presence or network configuration and are also shaped by demographic composition, perceived spatial effort, and travel behavior variability. Here, demographic structure can serve as a proxy for differentiated travel sensitivity and mobility dependency among population subgroups, particularly the elderly and gender-specific groups whose responses to public transport availability and service quality may vary substantially.
Despite these conceptual advances, practical implementations that systematically derive, differentiate, and spatially compare service intensity, demographic behavior potential, and distance-based proximity within a unified and openly documented GIS workflow remain limited. Many studies either isolate these components or aggregate them prematurely into composite indicators, thereby reducing interpretative transparency and limiting the identification of structural mismatches between transport supply and demographic demand.
In response to these methodological and conceptual gaps, this study develops a reproducible GIS-based analytical framework for examining multiple structural dimensions of public transport accessibility in the metropolitan area of Valencia. The study pursues three objectives:
- (1)
- To derive operational public transport service indicators from GTFS datasets, including trip frequency and headway to measure transit service strength;
- (2)
- To evaluate spatial proximity between population locations and public transport stops using grid-based distance analysis;
- (3)
- To construct a demographic-based behavior potential index reflecting population sensitivity to public transport availability.
Rather than aggregating these components into a single composite accessibility index, this study analyses the spatial distribution and interaction of service strength (Sg), proximity score (Pg), and behavior potential (Bg) separately. By maintaining the analytical independence of these indicators, the framework improves interpretative clarity and can identify spatial mismatches between transit service provision, demographic sensitivity, and physical proximity to public transport infrastructure.
This study contributes to the existing literature by integrating service-based, demographic, and proximity indicators within a unified yet non-aggregated analytical framework. Unlike previous studies that rely on composite indices or fragmented approaches, the proposed method preserves the analytical independence of each component while enabling their spatial comparison. This approach enhances interpretability and allows for the identification of structural mismatches between service provision and demographic demand in a transparent and reproducible manner.
2. Study Area
The empirical analysis was conducted in the city of Valencia, Spain, characterized by a diversified multimodal public transport system and a heterogeneous intra-urban spatial structure. The city comprises a compact historic core surrounded by expanding outer districts, resulting in pronounced contrasts in population density, land-use distribution, and service intensity. This internal morphological gradient influences public transport stop density, service concentration, and walking distance to transit stops across the city, creating a suitable context for analyzing accessibility disparities within a spatially heterogeneous urban structure. These internal variations create a suitable analytical environment for examining accessibility disparities within a single yet spatially diverse urban system.
Valencia was selected for three principal reasons. First, the presence of multiple public transport modes, including bus, metro, and tram, means network performance and intermodal accessibility conditions can be compared. Second, the coexistence of well-served central districts and comparatively underserved peripheral areas allows for the identification of spatial inequalities and latent mobility demand. Third, the availability of standardized open datasets related to transit operations, street networks, and demographic distribution supports the implementation of a transparent and reproducible open-source GIS workflow.
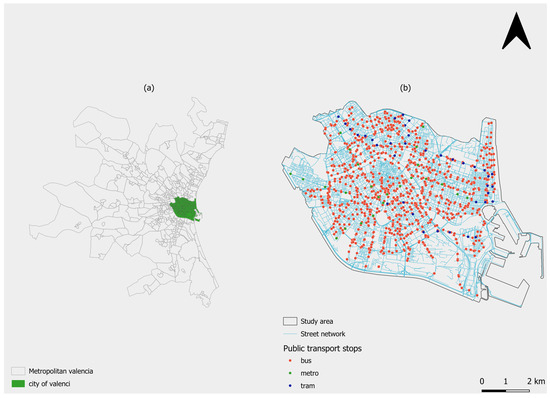
Owing to its balanced city scale, modal diversity, and data accessibility, Valencia is a transferable reference context for behavior-informed multimodal accessibility analysis applicable to comparable mid-sized European cities. The spatial variability of transit service intensity and stop distribution further strengthens its suitability for investigating the interaction between behavior potential, network configuration, and proximity-based accessibility. Figure 1a illustrates the study area and the underlying multimodal transport infrastructure, including the street network and public transport stops. The spatial configuration of the metropolitan area and the distribution of the public transport network are illustrated in Figure 1b.
Figure 1.
Study area and transport network structure: (a) Valencia metropolitan area and the study area (City of Valencia); (b) Street network and public transport stops (bus, metro, and tram) within the study area.
3. Materials and Methods
3.1. Data Description and Sources
The analytical framework includes complementary spatial and operational datasets of transport supply and demographic demand within the City of Valencia. All datasets were chosen based on spatial resolution, temporal relevance, data completeness, and compatibility with open-source GIS processing.
All spatial analyses were conducted in the projected coordinate reference system ETRS89/UTM Zone 30N (EPSG:25830) to ensure metric consistency, topological accuracy, and precision in distance-based calculations. Prior to analysis, all layers were re-projected and harmonized within this unified CRS environment.
To enhance transparency and reproducibility, Table 1 summarizes the primary datasets, their analytical objectives, spatial resolution, temporal reference, and official data sources.
Table 1.
Metadata summary of datasets used in the study.
3.1.1. Administrative Boundaries
Official municipal boundary data were obtained from the regional cartographic authority and used exclusively to define the spatial extent of analysis and limit all network and demographic datasets to the City of Valencia. These boundaries serve a contextual delimitation function and were not incorporated into indicator construction. All data preprocessing and spatial operations were performed using QGIS (version 3.34 LTR), ensuring full reproducibility within an open-source environment.
3.1.2. Population Grid and Demographic Attributes
Demand-side characteristics were derived from the official 2021 census-based population grid provided by the Spanish National Statistics Institute (INE). The dataset consists of uniform 1 km × 1 km grid cells covering the study area and provides standardized demographic information at a consistent spatial resolution.
The following demographic variables were extracted for each grid cell:
- Total population;
- Population aged under 16;
- Population aged 16–64;
- Population aged 65 and above;
- Gender-disaggregated population counts.
Because the analytical boundary corresponds strictly to the administrative limits of the City of Valencia, several census grid cells were only partially intersected by the study area. To avoid overestimating demographic values in these edge cells, population counts were proportionally adjusted using area-weighted interpolation. Demographic values were scaled according to the ratio between the intersected grid area within the municipal boundary and the total original grid cell area. This procedure ensured spatial consistency between demographic and analytical units while preserving proportional population structure.
The resulting adjusted demographic variables enabled the construction of a consistent demographic structure profile for each analytical grid cell and served as the basis for the behavior potential component described in Section 3.2.3.
3.1.3. Street and Active Mobility Network
Street network data were extracted from OpenStreetMap (OSM) and filtered to retain walkable and cyclable segments. Motorway-classified, private, and restricted-access links were excluded. Topological validation and geometry cleaning procedures were applied to remove disconnected segments and invalid geometries.
3.1.4. Public Transport Operational Data (GTFS)
Public transport service characteristics were derived from General Transit Feed Specification (GTFS) datasets obtained from EMT (bus services) and FGV (metro and tram services). The application of GTFS data in accessibility modelling has been widely documented in recent studies [6,7,8,9].
The GTFS feeds consist of structured relational tables (stops.txt, routes.txt, trips.txt, stop_times.txt, and calendar.txt) containing schedule-based operational information.
Three primary service indicators were computed at the stop level for a representative weekday during the main operating period (6:00 a.m.–10:00 p.m.):
- Trip count: Total number of scheduled vehicle arrivals per stop within the selected time window, calculated by aggregating stop_times records grouped by stop_id.
- Mean headway: Average temporal interval (in minutes) between consecutive vehicle arrivals at each stop, computed from chronologically sorted arrival times.
- Expected wait: Approximated as half the mean headway, representing average passenger waiting conditions under random arrival assumptions.
3.2. Indicator Construction Framework
The analytical framework is based on a regular population grid covering the study area derived from the official census dataset provided by the Spanish National Statistics Institute (INE). The grid consists of uniform 1 km × 1 km cells, which serve as the primary spatial units for accessibility analysis.
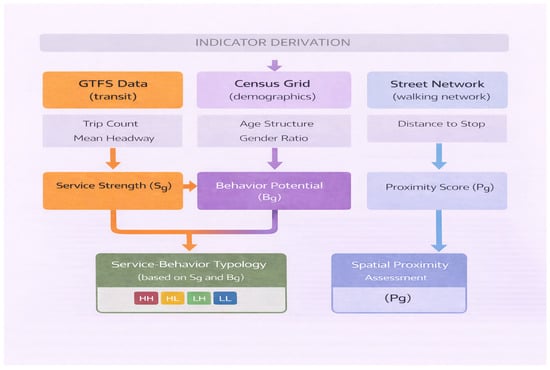
Using a grid-based structure enables consistent spatial comparison between service provision, spatial proximity, and demographic characteristics across the study area. The overall analytical workflow and relationships between the indicators are illustrated in Figure 2.
Figure 2.
Analytical framework for the derivation of accessibility indicators. Service strength (Sg), behavior potential (Bg), and proximity score (Pg) are computed independently from GTFS, demographic, and spatial network data. The service–behavior typology is derived from the interaction between Sg and Bg, while Pg is analyzed separately as a spatial proximity indicator.
To capture complementary dimensions of public transport accessibility, three analytically distinct indicators were constructed: transit service strength (Sg), proximity score (Pg), and behavioral potential (Bg). Each indicator was independently computed at the grid-cell level to preserve interpretability and avoid premature aggregation into a composite index.
This separation enables transparent comparison between service intensity, spatial effort, and demographic demand sensitivity. No composite multiplication or integrated accessibility index was computed in this study to preserve interpretative clarity between indicators.
3.2.1. Transit Service Strength (Sg)
Transit service strength is defined at two levels: stop (Si) and grid (Sg). At the stop level, service strength (Si) represents the temporal intensity and regularity of public transport provision during the defined analysis period (6:00 a.m.–10:00 p.m.), as described in Section 3.1. This time window was chosen to capture the main daily operational period while excluding late-night services, which are typically characterized by low frequency and irregular scheduling patterns.
Service strength was derived from General Transit Feed Specification (GTFS) data through a structured multi-step processing workflow. GTFS tables (including stop_times.txt, trips.txt, and calendar.txt) were first filtered to retain only weekday services operating within the defined temporal window. All arrival times were converted into a consistent temporal format and sorted chronologically for each stop.
For each stop, a sequence of scheduled arrival events was constructed based on the stop_times table. From this sequence, two operational indicators were computed:
- Trip Count (TCi): Total number of scheduled vehicle arrivals at stop i within the analysis period (6:00 a.m.–10:00 p.m.), obtained by counting all valid arrival records associated with each stop.
- Mean Headway (Hi): Average time interval (in minutes) between consecutive arrivals at stop i, calculated as the mean of time differences between successive scheduled arrivals.
Headway values were only computed for stops with at least two valid arrival records. Records containing invalid or placeholder values (e.g., 999), duplicate entries, or incomplete temporal information were removed prior to computation to ensure the consistency and reliability of the derived indicators.
Because trip count and headway are expressed in different units and scales, both variables were normalized using min–max transformation to enable comparability across stops:
TCinorm = (TCi − TCmin)/(TCmax − TCmin)
Hinorm = (Hi − Hmin)/(Hmax − Hmin)
Since greater headway values indicate lower service regularity, the normalized headway was inverted to represent service strength:
Hiinv = 1 − Hinorm
The stop-level service strength indicator was then defined as:
Si = (TCinorm + Hiinv)/2
The stop-level service strength values (Si) were subsequently assigned to the population grid using a nearest-stop approach, resulting in the grid-level service strength indicator (Sg).
This formulation integrates both service availability (trip frequency) and temporal regularity (headway), providing a balanced and comprehensive representation of operational service conditions. It ensures that both service quantity and service regularity are captured within a unified and comparable performance metric.
Trip count reflects the intensity of service provision, indicating how frequently vehicles arrive at a stop, while headway is the temporal spacing between services and is directly related to passenger waiting time and perceived reliability.
Equal weighting was applied to these two components to reflect their complementary roles in defining overall service performance. Since both frequency and regularity jointly determine the usability and attractiveness of public transport from a user perspective, assigning equal importance ensures a balanced and interpretable indicator without introducing additional assumptions or calibration bias [4,5,12,16,17]. This approach also avoids introducing subjective bias in the absence of empirically calibrated parameters, ensuring a neutral and transparent representation of service performance.
Following computation at the stop level, service strength values were assigned to the population grid to enable spatial comparison with other indicators. Each grid cell (g) was represented by its geometric centroid, and the service strength value of the nearest public transport stop was assigned to that cell:
Sg = Si(neareststop)
This nearest-based assignment ensures methodological consistency with the proximity indicator and reflects the service conditions most directly accessible to residents within each grid cell. Unlike mean-based aggregation, this approach avoids smoothing effects that may obscure localized variations in service intensity.
Grid cells without accessible stops within the dataset were recorded as null values. These null values represent the absence of operational service rather than computational omission. In addition, the expected waiting time was calculated as:
WTi = Hi/2
Although waiting time was not included in the service strength index to avoid redundancy with headway, it was used as a complementary descriptive indicator to support the interpretation of service intensity patterns presented in Section 4.
3.2.2. Behavior Potential (Bg)
Behavior potential (Bg) represents the relative sensitivity of the population to public transport usage. Rather than measuring actual travel flows, the indicator captures the structural propensity of different population groups to rely on public transport based on their sociodemographic characteristics.
The index was constructed using census-based population grid data (1 km × 1 km resolution) from the Spanish National Statistics Institute (INE). The dataset provides standardized demographic information disaggregated into three age groups: population aged under 16, population aged 16–64, and population aged 65 and above, as well as gender-specific population counts.
The use of standardized census categories ensures methodological consistency, comparability, and reproducibility across spatial units and supports transferability of the approach to other urban contexts.
From these variables, two primary demographic indicators were derived:
Elderly ratio
ERg = Population65+/Totalpopulation
Female ratio
FRg = Femalepopulation/Totalpopulation
Age–gender difference
To capture the interaction between age structure and gender composition, an age–gender difference indicator was defined based on the elderly population:
AGDg = (Female65+ − Male65+)/Totalpopulation
The age–gender difference indicator captures the relative imbalance between elderly female and elderly male populations within each grid cell. Positive values indicate a higher proportion of elderly females, while negative values indicate a higher proportion of elderly males. This distinction is behaviorally relevant, as gender differences in later life stages are associated with variations in mobility patterns, transport dependency, and sensitivity to public transport conditions.
The selection of these demographic indicators is grounded in established transport accessibility and equity literature. Older population groups are consistently associated with higher levels of public transport dependency due to reduced access to private vehicles, lower driving rates, and increased reliance on accessible mobility services [19,20]. In parallel, gender-based differences in travel behavior have been widely documented, with women often exhibiting greater sensitivity to service availability, safety, and reliability conditions [3,13,14].
The behavioral index was constructed as a weighted linear combination:
Bg = 0.6 × ERg + 0.4 × FRg
A higher weight was assigned to the elderly ratio (0.6) to reflect the greater dependence of older population groups on public transport, as widely documented in accessibility and mobility literature [13,14]. The female population ratio (0.4) captures gender-related differences in travel behavior [3].
The weighting scheme is conceptually derived rather than empirically calibrated and is intended to represent relative influence rather than precise behavioral coefficients. This approach is supported by previous studies emphasizing the stronger role of age-related mobility constraints in shaping public transport dependency [12,17,19,20].
The behavior potential index (Bg) provides a decision-support tool for identifying socially sensitive areas, enabling planners to prioritize locations where demographic characteristics indicate a higher potential dependency on public transport and integrate equity considerations into service allocation strategies.
Although the age–gender difference (AGDg) is not directly included in the composite behavioral index, it is used as a complementary descriptive indicator to support the interpretation of demographic structure and gender-related variation in the Results section (Section 4.2).
Normalization
To ensure comparability across grid cells, the behavioral index was normalized using min–max transformation:
Bgnorm = (Bg − Bmin)/(Bmax − Bmin)
Eight grid cells (approximately 9.6% of the study area) contained incomplete demographic records or zero population values and were therefore excluded from behavioral index computation. These null values reflect data insufficiency rather than low behavior potential.
Higher normalized behavioral potential values indicate greater potential dependency on public transport and highlight areas where population composition suggests increased reliance on transit services.
3.2.3. Proximity Score (Pg)
Proximity (Pg) reflects the spatial effort required to access the nearest public transport stop. For each population grid cell, a geometric centroid was computed and used as the origin point for spatial measurement.
Euclidean distance (in meters) between each centroid and the nearest public transport stop was calculated using nearest-hub analysis within the projected coordinate reference system (CRS) described in Section 3.1. The use of a projected CRS ensures metric precision and avoids distortion in distance-based calculations.
While Euclidean distance provides a consistent and computationally efficient measure of spatial proximity, it does not account for the actual configuration of pedestrian networks, physical barriers, or street connectivity. In practice, accessibility to public transport is influenced by factors such as road layout, intersection density, and obstacles that may increase effective walking distance.
Despite this limitation, Euclidean distance was adopted to ensure methodological simplicity and comparability across the study area, particularly given the scale of analysis and data availability. Previous studies suggest that Euclidean distance can provide a reasonable approximation of accessibility patterns at aggregated spatial scales [23,24,25,26]. Nevertheless, incorporating network-based pedestrian distances represents an important direction for future research and could provide a more realistic representation of accessibility conditions. This choice reflects a trade-off between analytical simplicity and spatial realism, which is appropriate for city scale analysis using aggregated grid data.
The resulting distance variable was transformed into a proximity score using a stepwise distance-decay function, implemented through threshold-based pedestrian accessibility bands:
where d represents the Euclidean distance (in meters) between the population grid cell centroid and the nearest public transport stop.
Pg =
\begin{cases}
1.0 & \text{if } d \leq 300 \\
0.7 & 300 < d \leq 600 \\
0.4 & 600 < d \leq 900 \\
0.1 & d > 900
\ end{cases}
\begin{cases}
1.0 & \text{if } d \leq 300 \\
0.7 & 300 < d \leq 600 \\
0.4 & 600 < d \leq 900 \\
0.1 & d > 900
\ end{cases}
This formulation represents a discrete approximation of distance decay, where accessibility decreases stepwise as walking distance increases. The stepwise approach was selected to provide a transparent and interpretable representation of accessibility gradients, while avoiding the additional assumptions and calibration requirements associated with continuous decay functions [16].
The selection of distance thresholds is informed by established public transport accessibility literature, which generally identifies walking distances of approximately 300–400 m as comfortable access to transit stops, and distances approaching 800–1000 m as the upper limit of acceptable walking distance in urban contexts [19,20,21].
Within this empirically supported range, the thresholds adopted in this study (300 m, 600 m, and 900 m) define four accessibility regimes: high accessibility (≤300 m), representing a comfortable walking distance with minimal perceived effort; moderate accessibility (300–600 m), representing acceptable but increasing walking effort; low accessibility (600–900 m), representing reduced accessibility where walking becomes less appealing; and very low accessibility (>900 m), representing distances beyond typical walking tolerance.
This segmentation provides a structured discretization of the continuous distance spectrum, enabling consistent classification across grid cells while preserving behavioral interpretability. The intermediate threshold at 600 m was introduced to distinguish between moderate and declining accessibility conditions within the broader empirically observed range.
By explicitly structuring the decay into interpretable bands, the approach supports comparative spatial analysis without relying on parameter-sensitive continuous decay models, which may introduce additional uncertainty in the absence of calibration data.
The resulting categorical scoring scheme provides an interpretable representation of spatial accessibility, where higher values indicate increased proximity to transit infrastructure and lower values represent greater spatial separation and increased access effort.
3.3. Spatial Comparison and Analytical Strategy
Following independent computation of Sg, Pg, and Bg, the indicators were analyzed separately through thematic mapping and descriptive statistics (minimum, maximum, mean, and standard deviation). Spatial comparison was conducted at the grid-cell level to identify areas of convergence and divergence between service provision, spatial proximity, and demographic sensitivity.
Rather than aggregating the three components into a composite accessibility index, the analysis preserves their analytical separation to reveal spatial mismatches between service intensity, physical proximity, and demographic demand sensitivity. This approach enhances interpretability and avoids masking structural disparities between supply and demand dimensions.
The resulting comparative framework provides an evidence base for identifying spatial imbalances and informing subsequent integrative modelling and planning interventions.
3.4. Construction of Service–Behavior Structural Typology
To explore the structural interaction between service provision and demographic sensitivity, a typological classification was applied based on the relative levels of service strength (Sg) and behavior potential (Bgnorm). Grid cells were categorized using mean-based thresholds for each indicator. Values above the respective mean were classified as “High,” while values below the mean were classified as “Low.” This classification produced four structural categories (Table 2).
Table 2.
Classification of grid cells based on service strength (Sg) and behavior potential (Bgnorm).
The typological framework enables the identification of spatial alignment and mismatch between operational service intensity and demographic sensitivity across the metropolitan grid.
Structural Interpretation of Typological Categories
The four typological categories represent different structural relationships between operational service provision and demographic sensitivity.
LH (Low Service–High Behavioral Potential) represents structural mismatch zones where demographic sensitivity to public transport is relatively high while operational service intensity remains weak. These areas may indicate potential underserved mobility demand.
HL (High Service–Low Behavioral Potential) corresponds to locations where service provision exceeds local demographic sensitivity, potentially indicating areas of relative oversupply.
HH (High Service–High Behavioral Potential) identifies zones where operational service intensity aligns with demographic sensitivity, suggesting a balanced relationship between supply and potential demand.
LL (Low Service–Low Behavioral Potential) reflects areas where both service provision and demographic sensitivity remain comparatively low.
3.5. Sensitivity Analysis
To evaluate the robustness of the proposed analytical framework, a targeted sensitivity analysis was conducted focusing on key behavioral and operational assumptions embedded in the model. The analysis examines the influence of (i) walking distance thresholds used in the proximity indicator (Pg) and (ii) temporal aggregation of service data underlying the service strength indicator (Sg).
Sensitivity to Walking Distance Assumptions
The proximity indicator (Pg) is defined based on threshold-based walking distances (300 m, 600 m, and 900 m), which implicitly represent assumptions regarding pedestrian accessibility behavior.
To assess the sensitivity of the results to these assumptions, an alternative set of walking distance thresholds (400 m, 800 m, and 1000 m) was introduced, representing a more permissive walking scenario. Proximity scores were recalculated under the alternative configuration and compared with the baseline results to evaluate the stability of spatial accessibility patterns.
Sensitivity to Temporal Aggregation of Service Strength
The service strength indicator (Sg) is derived from GTFS data aggregated over the time window 6:00 a.m.–10:00 p.m. An alternative time window (7:00 a.m.–9:00 p.m.) was also considered to examine the sensitivity of this operational assumption.
A full recomputation of service frequency and headway under the alternative time window was not feasible due to the aggregated structure of the stop-level dataset. Instead, a proportional adjustment approach was applied using stop-level service spans derived from first and last departure times.
For each stop, the effective service duration within the alternative time window was calculated by intersecting the baseline service span with the reduced interval. A temporal ratio was then computed as the proportion of retained service duration relative to the baseline period.
The adjusted service strength values were obtained by scaling the baseline service strength using this temporal ratio. This approach provides a consistent approximation of the impact of temporal aggregation while preserving spatial comparability across the study area.
Consideration of Demographic Weighting
Although demographic weights represent a potential source of sensitivity in the behavior potential indicator, the weighting scheme applied in this study is conceptually defined rather than empirically calibrated. Therefore, variations in weights are expected to influence the magnitude of the index rather than its spatial structure.
Although sensitivity testing of demographic weights was not performed, previous studies suggest that moderate variations in weighting schemes primarily affect the magnitude rather than the spatial distribution of demographic-based indicators. Therefore, the adopted weighting approach is considered sufficient for capturing relative spatial patterns.
3.6. Validation Approach
Due to the absence of detailed passenger flow data, validation was conducted using proxy indicators derived from available datasets. This included comparing behavioral potential with population distribution, and comparing service strength with operational characteristics such as trip frequency and service patterns derived from GTFS data.
In addition, stop-level comparisons were used to assess the consistency of service strength values across different transport modes. This combined approach provides a qualitative validation of the analytical framework and ensures that the identified patterns are consistent with expected real-world conditions.
Although direct passenger flow data were not available, this indirect validation approach ensures that the spatial patterns of service strength and behavior potential are consistent with expected real-world conditions and comparable to findings reported in previous accessibility studies.
3.7. Spatial Identification of Mismatch and Clustering Analysis
To further investigate the spatial structure of mismatches between service provision and demographic sensitivity, a spatial clustering analysis was conducted using Local Moran’s I.
Mismatch conditions were defined based on the typological classification described in Section 3.4. In particular, grid cells classified as low service–high behavior potential (LH) were considered potential underserved areas. A binary variable was constructed, where LH cells were assigned a value of 1 and all other cells were assigned a value of 0.
Local Moran’s I was then applied to this binary variable to identify statistically significant spatial clusters of mismatch conditions. The analysis was implemented using a k-nearest neighbors (KNN) spatial weights matrix (k = 8), reflecting the regular grid structure of the study area. Statistical significance was assessed at the 95% confidence level using permutation-based testing.
This approach can identify whether mismatch conditions are spatially clustered, dispersed, or randomly distributed across the study area.
4. Results
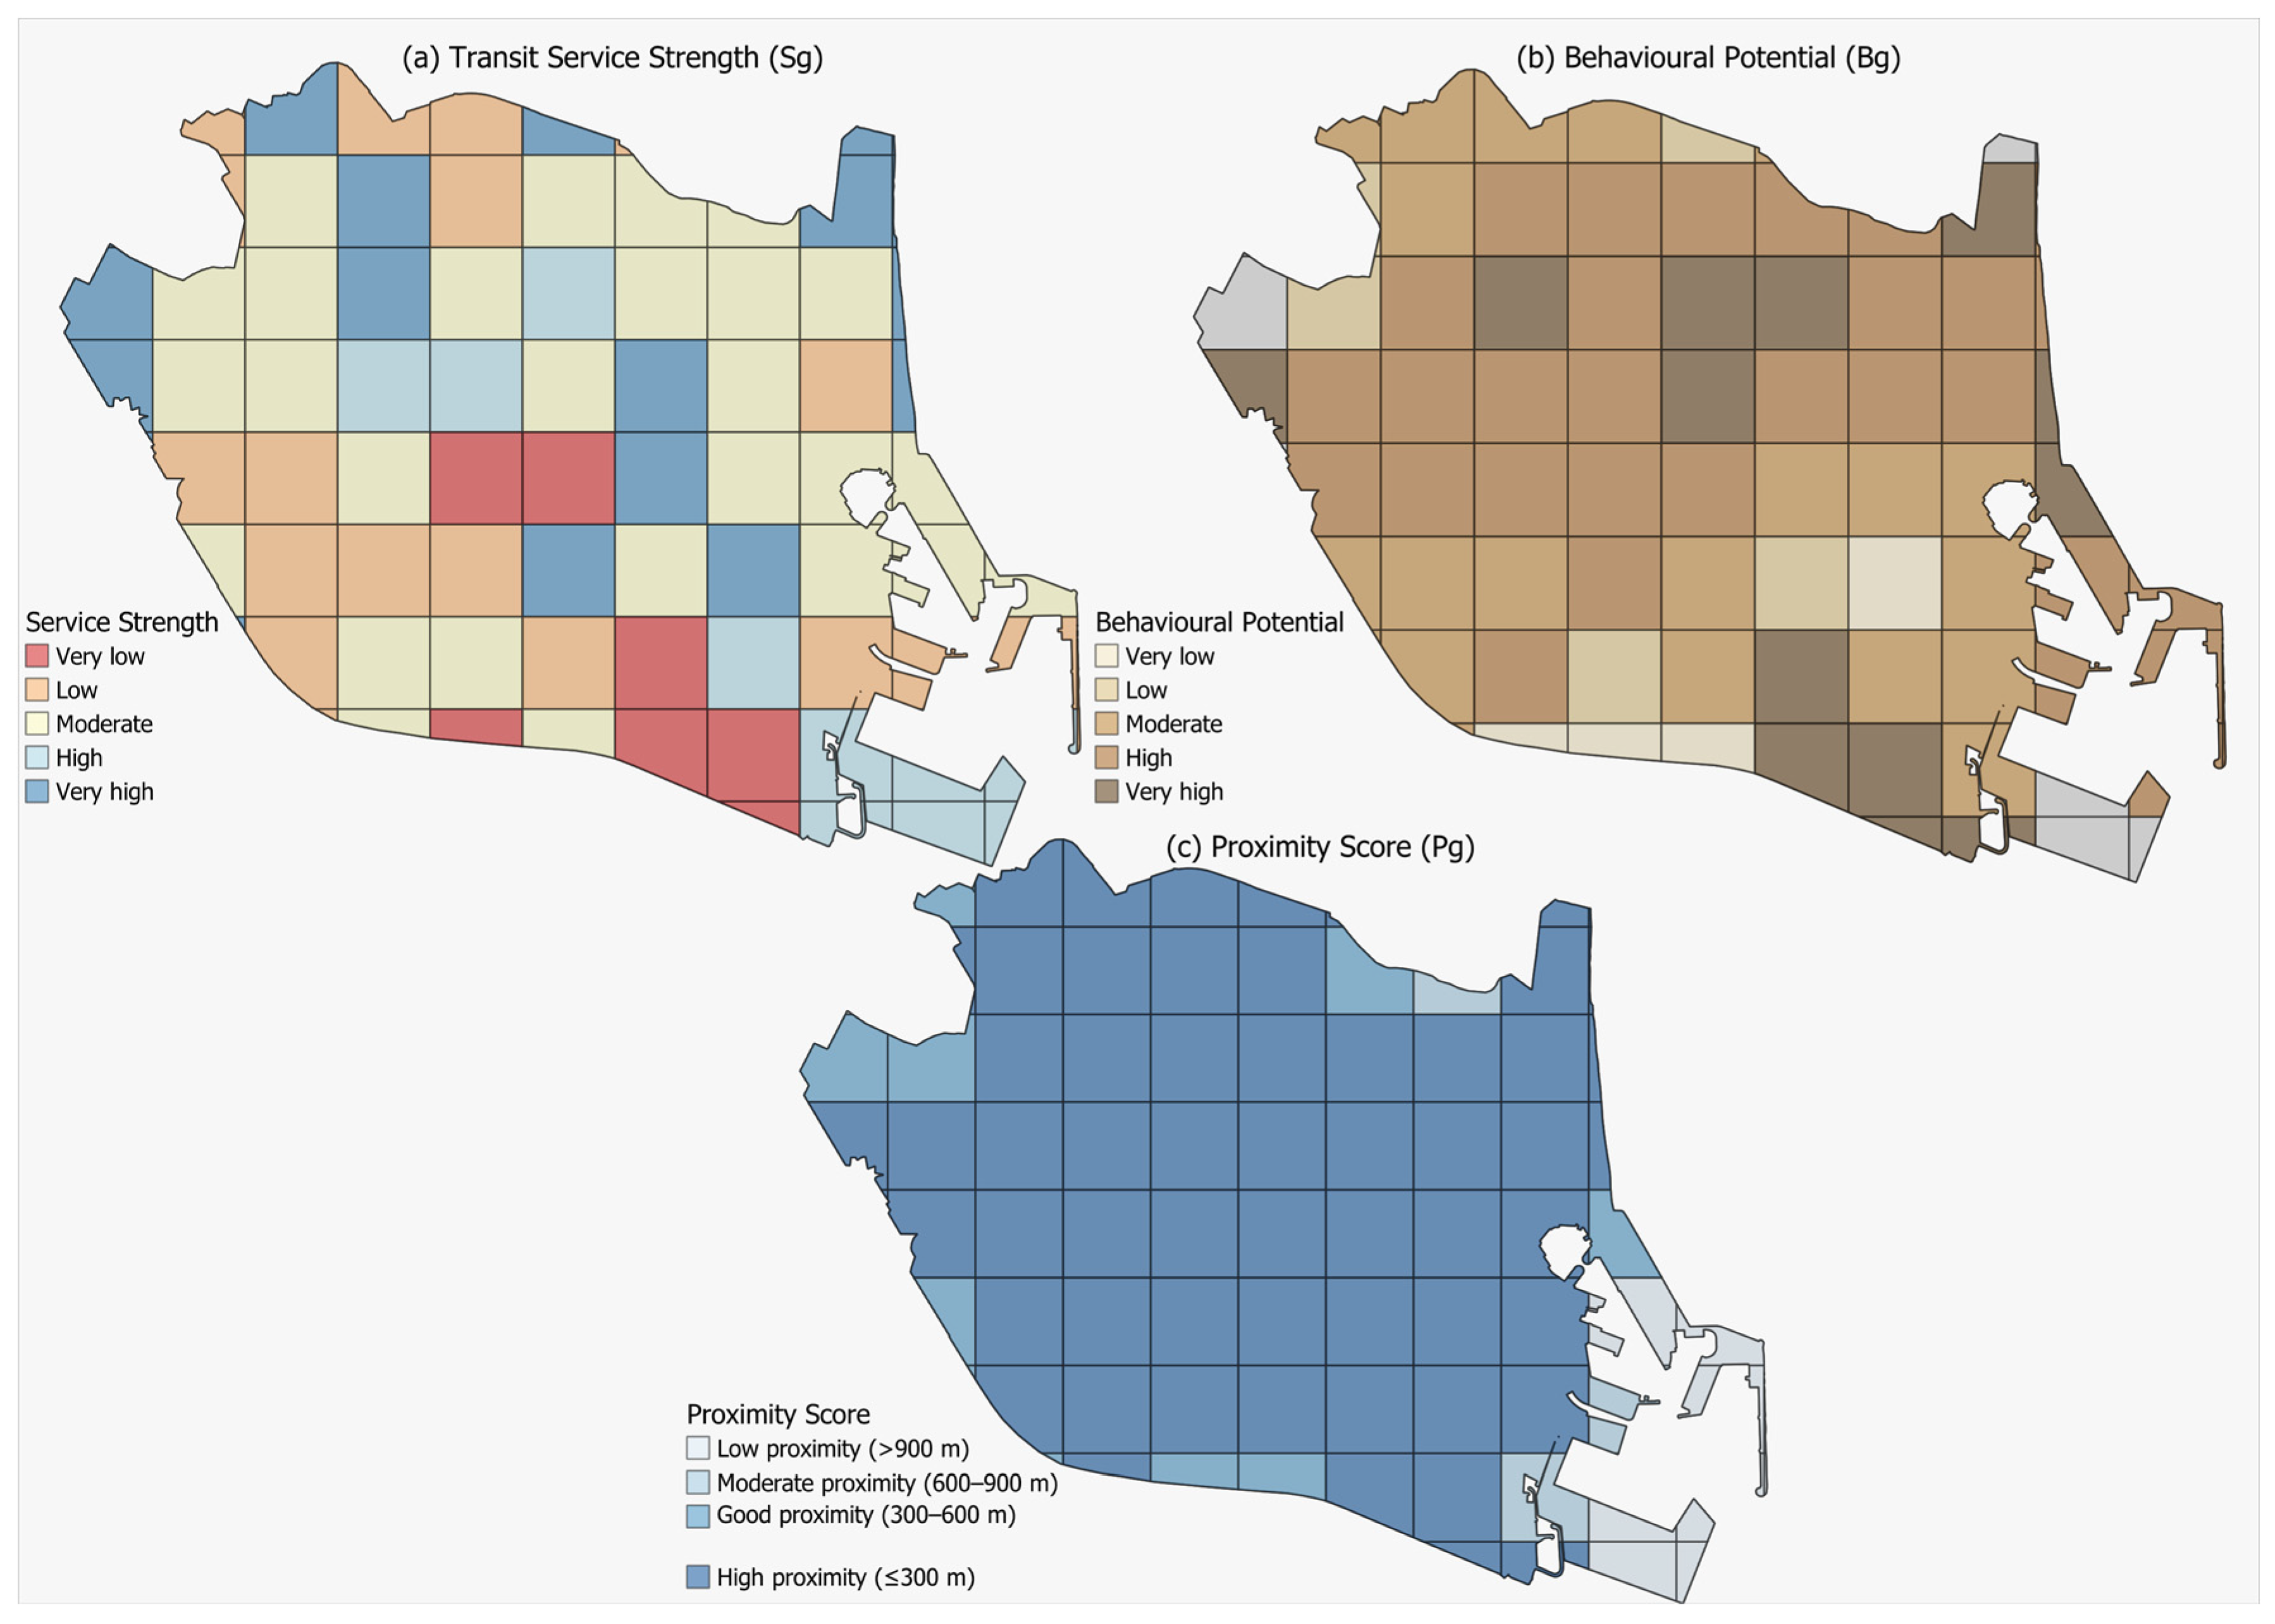
Figure 3 illustrates the spatial distribution of the three accessibility-related indicators across the study area.
Figure 3.
Spatial distribution of the three accessibility-related indicators across Valencia’s metropolitan grid: (a) transit service strength (Sg), (b) behavior potential (Bg), and (c) proximity score (Pg).
4.1. Spatial Distribution of Transit Service Strength (Sg)
Transit service strength was calculated by combining normalized trip frequency and inverted mean headway derived from GTFS operational data within the 6:00 a.m.–10:00 p.m. service window. Stop-level values were assigned to the population grid using nearest-stop association.
Across the 83 grid cells of the study area, 54 cells contain valid service observations, while 29 cells present null values, reflecting areas without operational stops within the aggregation unit.
Descriptive statistics indicate a mean service strength of 0.215, with values ranging from 0.009 to 0.516. This wide range highlights substantial spatial heterogeneity in operational service intensity across the metropolitan grid.
The spatial distribution of Sg, as shown in Figure 3, reveals clear concentration patterns.Higher service intensity values are predominantly located within central urban corridors and areas with dense transit infrastructure, while peripheral zones and southern sections of the metropolitan grid display considerably lower service intensity or the absence of operational stops.
These results indicate that service provision is spatially uneven, with operational intensity concentrated in specific parts of the network rather than uniformly distributed across the metropolitan territory.
Average expected waiting time values further support this pattern, with shorter waiting times observed in central areas characterized by higher service frequency, and longer waiting times in peripheral zones where headways are larger. This confirms the inverse relationship between headway and perceived service availability and provides additional interpretative support for the spatial distribution of service strength.
4.2. Behavioral Potential Distribution (Bg)
The behavior potential index reflects demographic sensitivity to public transport usage derived from age and gender composition within each population grid cell.
The behavior potential index (Bg), prior to normalization, is analysed in this section to examine its spatial distribution across the study area.
For comparison purposes, the index was subsequently normalized to a 0–1 scale, with 75 valid cells and 8 null observations, the latter corresponding to grid cells with incomplete demographic records.
The mean behavior potential value is 0.629, with values ranging between 0 and 1. These results indicate moderate variation in demographic sensitivity across the metropolitan grid.
Spatially, higher behavior potential values tend to cluster in several central and eastern areas of the metropolitan region, where population composition suggests greater reliance on public transport. Conversely, lower values are more commonly observed in peripheral zones where demographic characteristics indicate lower relative sensitivity to transit availability.
Compared with service strength, behavior potential exhibits smoother spatial variation, suggesting that demographic sensitivity is more gradually distributed across space than operational service intensity.
Additional analysis of the age–gender difference (AGDg) indicates minor spatial variations in the distribution of elderly male and female populations, with no strong clustering patterns observed. This suggests that gender imbalance within older age groups does not substantially alter the overall spatial structure of behavior potential across the study area but provides complementary insight into demographic composition.
4.3. Spatial Pattern of Proximity Score (Pg)
The proximity score represents the spatial effort required to reach the nearest public transport stop. Distances between grid cell centroids and the closest transit stops were calculated and transformed into normalized proximity values.
All 83 grid cells contain valid proximity values, with no null observations, indicating that every grid cell lies within measurable distance of at least one public transport stop.
Descriptive statistics show a mean proximity score of 0.834, with values ranging from 0.10 to 1.00. The relatively high mean value indicates that a large portion of the metropolitan grid lies within relatively short distances from transit stops.
Spatially, the distribution of Pg demonstrates relatively continuous coverage across the study area, with most grid cells falling within moderate-to-high proximity ranges. This suggests that physical access to transit infrastructure is broadly available across the metropolitan area.
However, the relatively uniform distribution of proximity contrasts with the spatial variability observed in service strength. While most areas are geographically close to transit stops, the operational intensity of services varies considerably.
This contrast indicates that geometric proximity alone does not guarantee effective accessibility, since areas with nearby stops may still experience relatively weak service frequency or operational coverage.
4.4. Spatial Distribution of Service–Behavior Typology
The typology defined in Section 3.3 was applied to classify grid cells across the study area based on the relative levels of service strength (Sg) and behavior potential (Bgnorm).
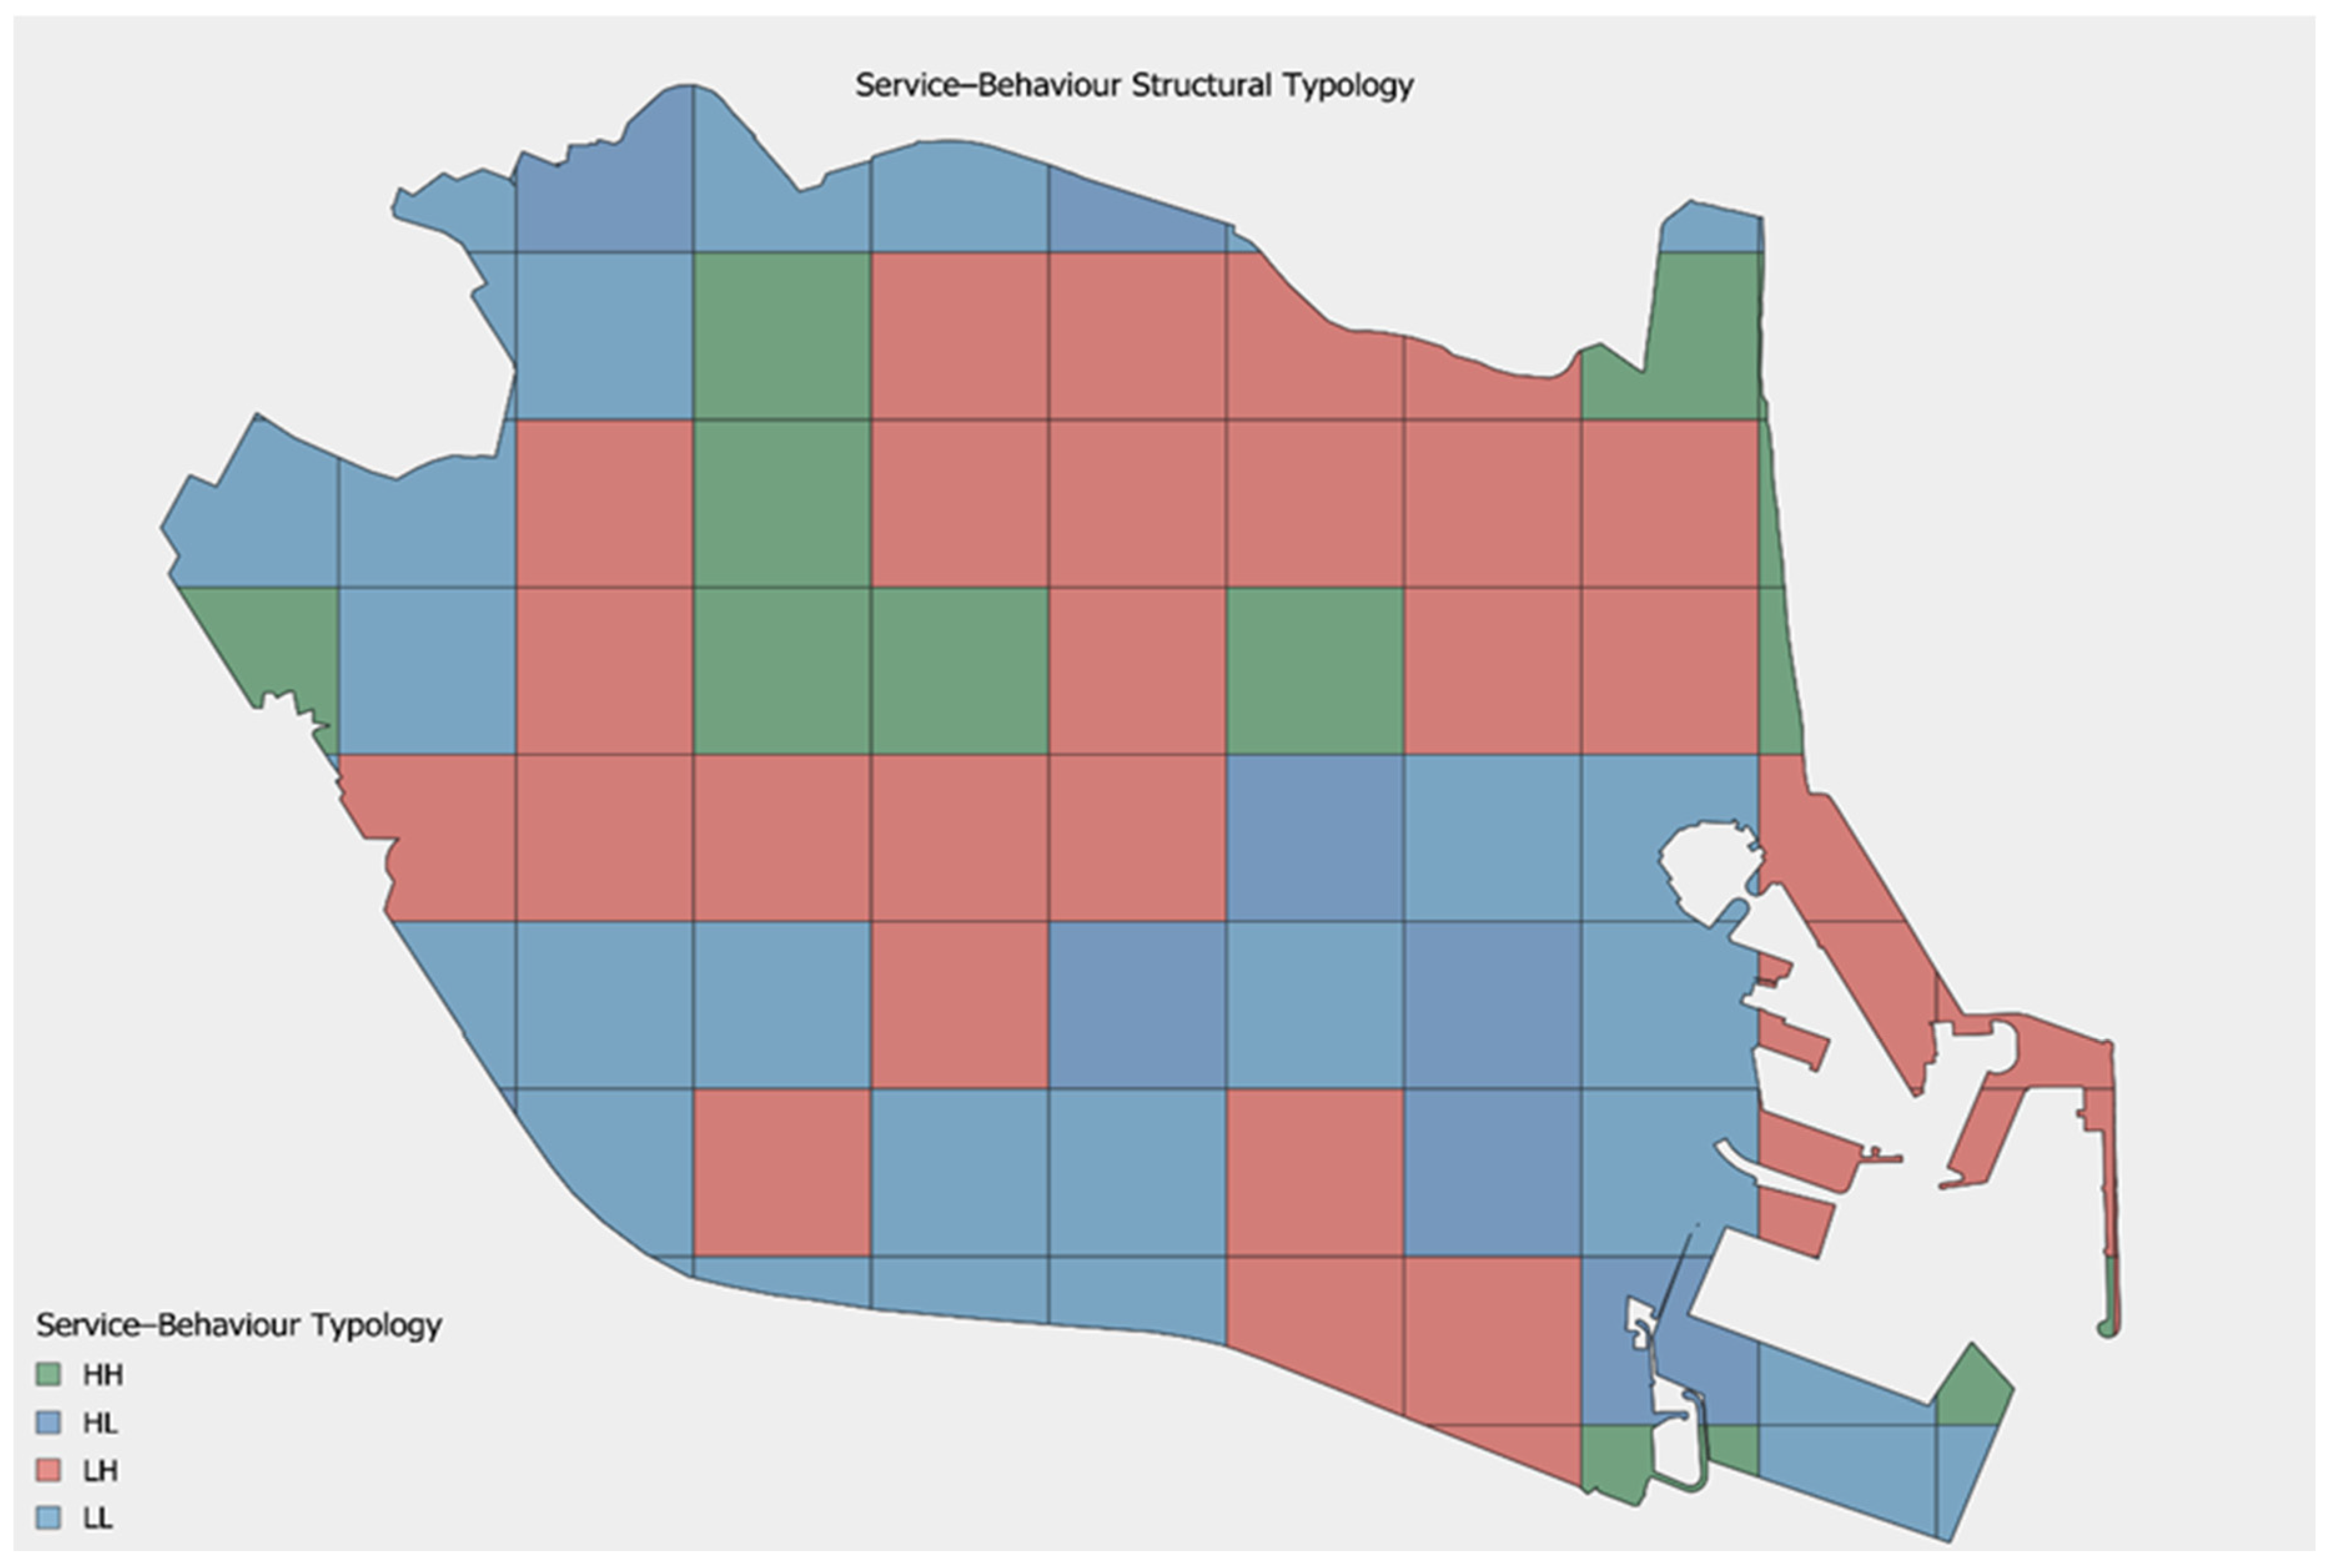
The largest category corresponds to low service–high behavior potential (LH), comprising 32 cells (38.6%) of the study area. These zones indicate areas where demographic sensitivity to public transport is relatively high while operational service intensity remains comparatively weak, suggesting potential underserved mobility demand.
A similar proportion of cells (31 cells, 37.3%) fall into the low service–low behavior potential (LL) category, representing areas where both service provision and demographic sensitivity remain limited.
Meanwhile, 12 cells (14.5%) are classified as high service–high behavior potential (HH), indicating locations where service provision aligns with demographic demand.
Finally, 8 cells (9.6%) fall within the high service–low behavior potential (HL) category, suggesting areas where service intensity may exceed local demographic sensitivity.
Overall, the typological comparison confirms that service intensity and demographic sensitivity are not spatially equivalent across the metropolitan grid. Their interaction reveals zones of alignment and mismatch that would remain hidden if accessibility were assessed using a single indicator. When considered alongside the relatively high proximity coverage observed across the study area, these findings suggest that accessibility disparities arise less from a lack of spatial access to transit stops and more from the uneven distribution of service intensity relative to potential demand. The resulting typological classification is illustrated in Figure 4, which spatially highlights the distribution of alignment and mismatch patterns across the study area.
Figure 4.
Spatial distribution of the service–behavior structural typology based on the interaction between transit service strength (Sg) and normalized behavior potential (Bgnorm).
4.5. Sensitivity Analysis Results
The sensitivity analysis was conducted to evaluate the stability of the proposed indicators under alternative behavioral and operational assumptions. The results demonstrate that the overall spatial patterns remain largely consistent across both tested scenarios.
Proximity Sensitivity
The comparison between baseline and alternative walking distance thresholds indicates that changes in assumed pedestrian behavior lead to only minor local variations in proximity scores. The adoption of extended thresholds (400 m, 800 m, and 1000 m) slightly increases accessibility levels in peripheral areas, where distances to public transport stops are relatively larger.
However, the overall spatial distribution of proximity remains stable, with no substantial shifts observed in the relative accessibility structure across the study area. This suggests that the proximity indicator is not highly sensitive to moderate variations in walking distance assumptions.
Service Strength Sensitivity
The temporal sensitivity analysis shows that reducing the service time window from 6:00 a.m.–10:00 p.m. to 7:00 a.m.–9:00 p.m. results in a moderate and spatially consistent reduction in service strength values. The magnitude of change is generally proportional across the network, reflecting the reduced temporal coverage.
More pronounced variations are observed in locations where services are concentrated in early-morning or late-evening periods. In these areas, the adjusted service strength values show relatively greater reductions compared to the baseline scenario.
Despite these localized differences, the overall spatial structure of service provision remains unchanged. Areas identified as high or low service intensity under the baseline configuration largely retain their relative classification under the alternative scenario.
Overall Robustness
Taken together, the results indicate that the proposed indicators exhibit a high degree of robustness. Moderate variations in both behavioral assumptions (walking distance thresholds) and operational parameters (temporal aggregation of service data) do not significantly alter the spatial patterns of accessibility.
These findings support the reliability of the analytical framework and confirm that the identified spatial relationships are not dependent on specific parameter choices but that they reflect the underlying structural characteristics of the transport system.
4.6. Spatial Clustering of Mismatch Areas
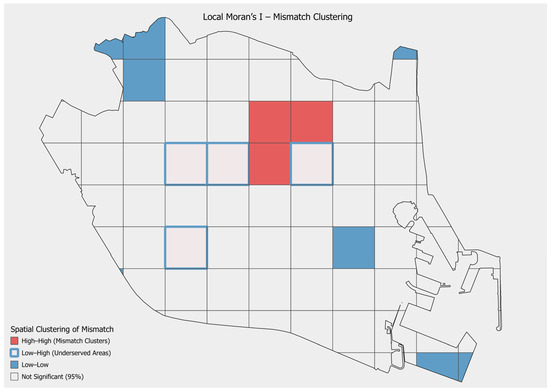
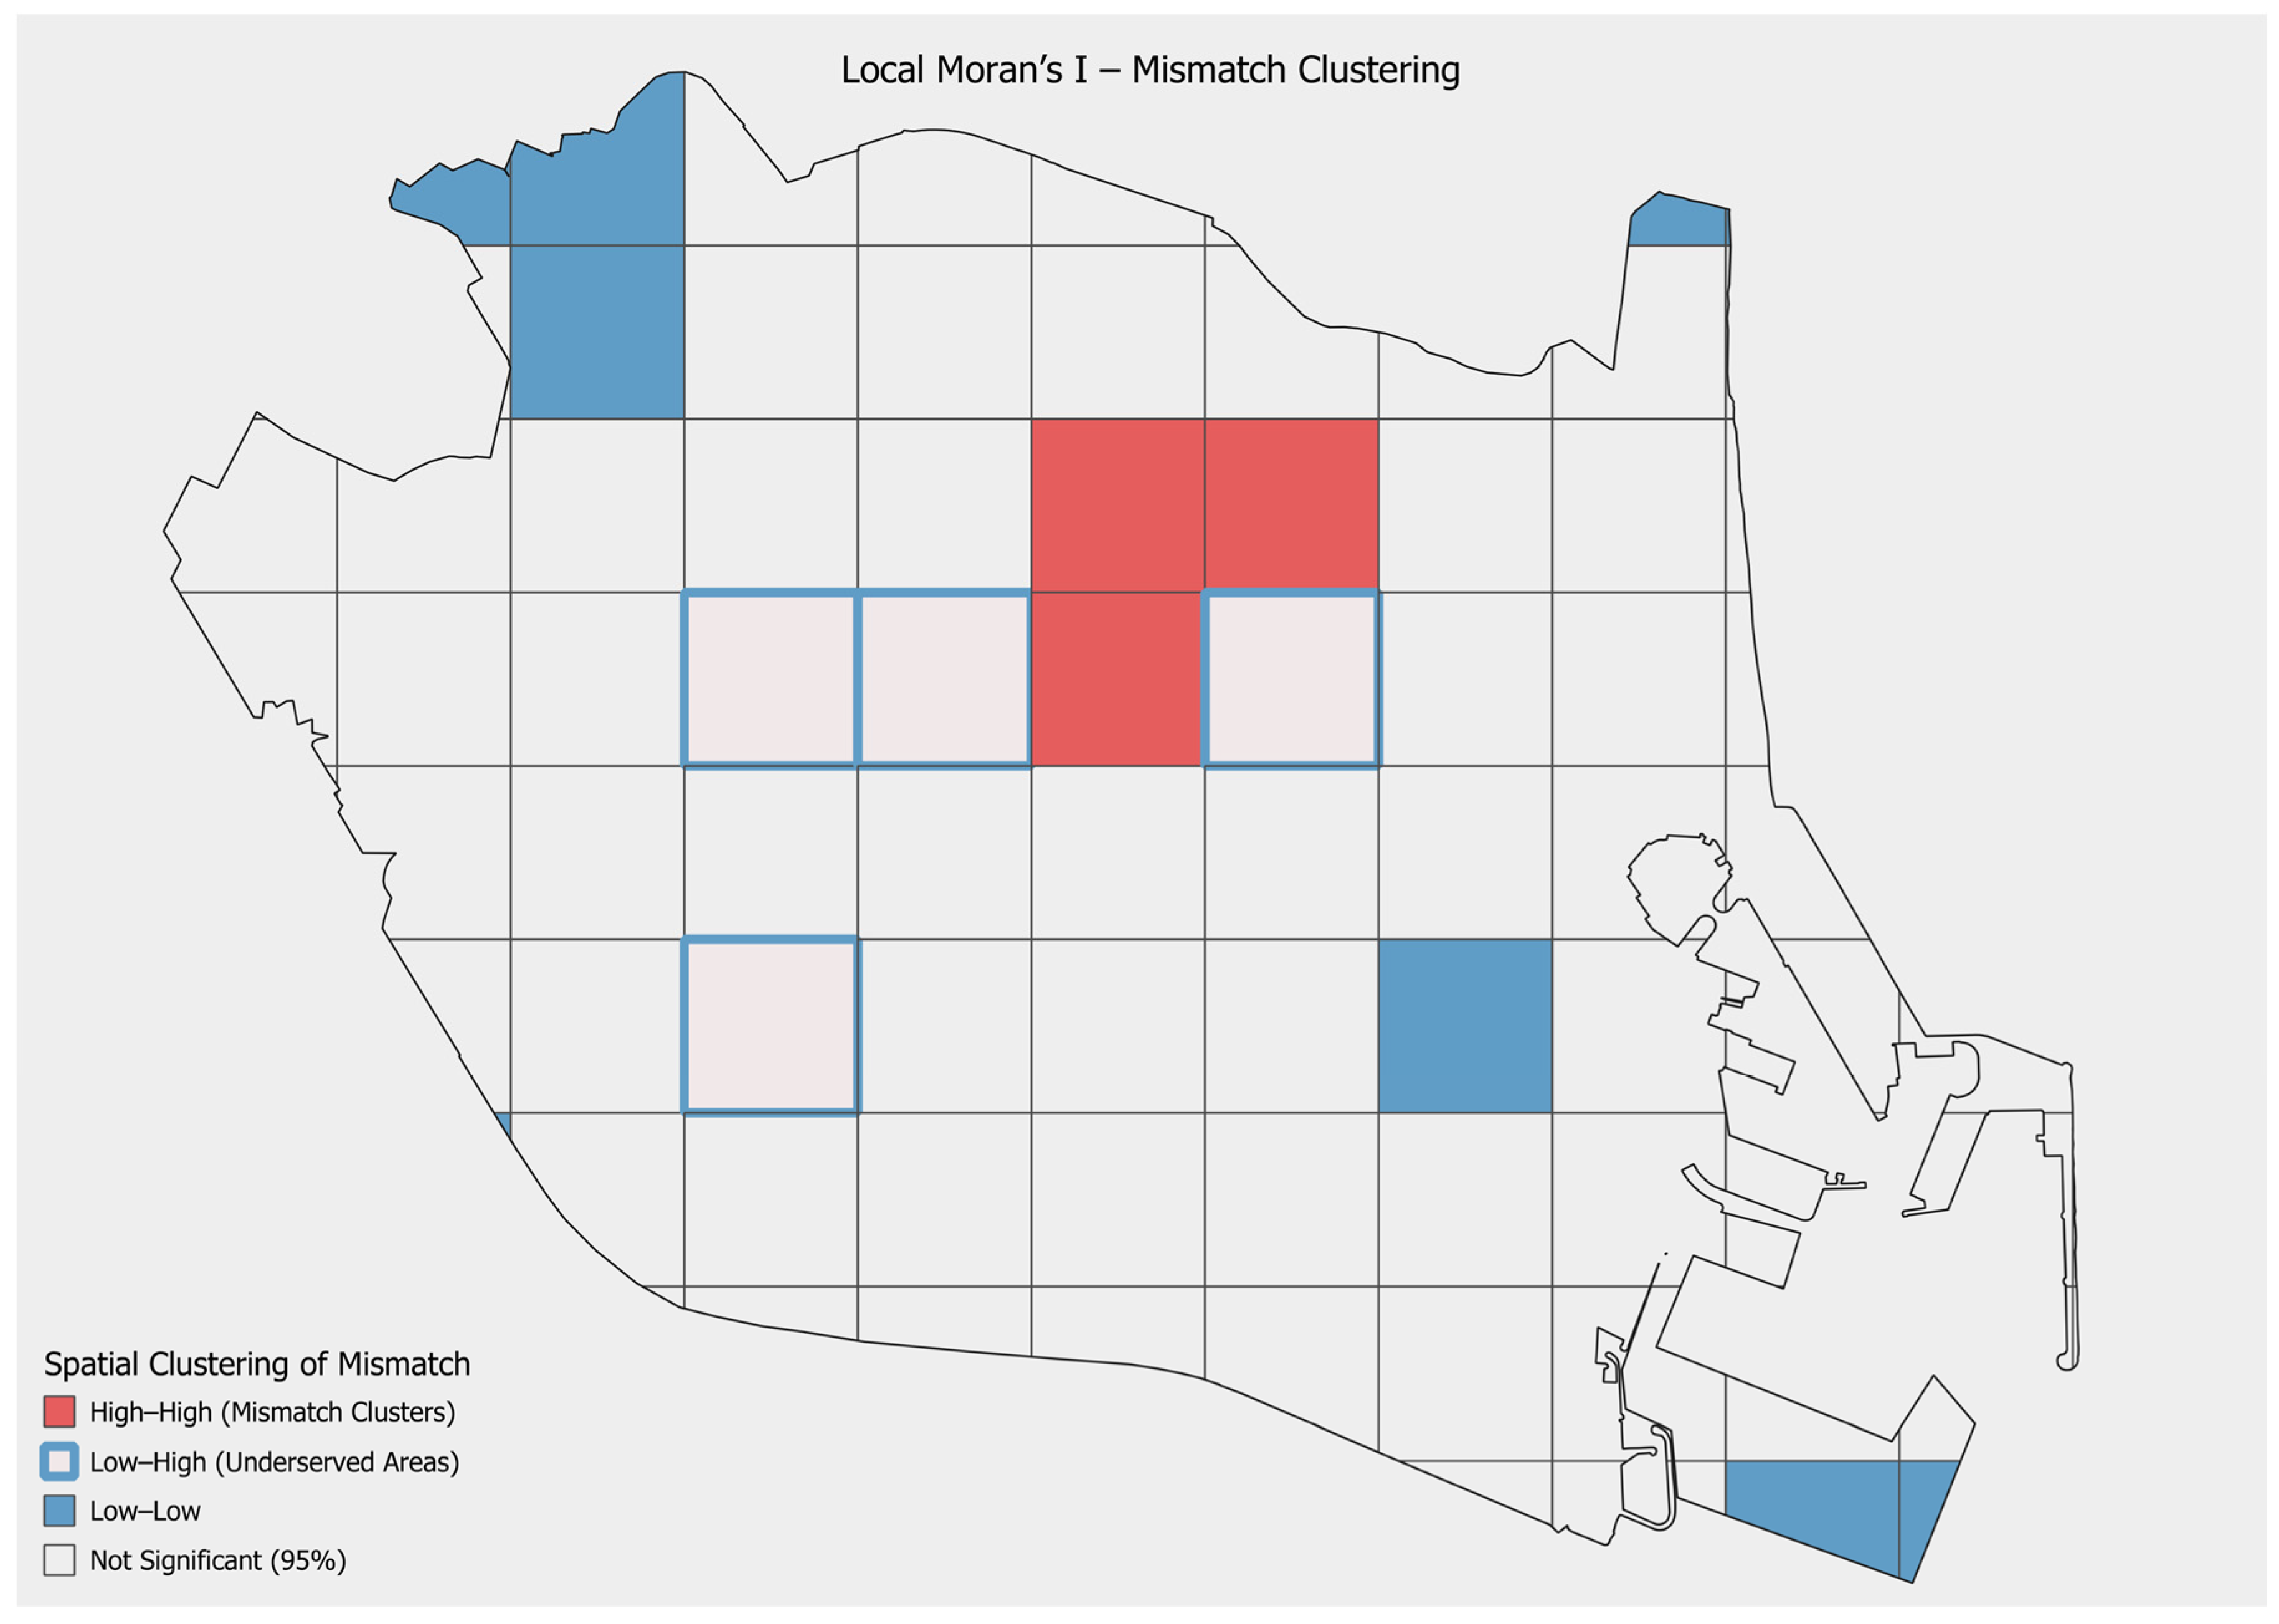
To further examine the spatial structure of mismatch conditions, a Local Moran’s I analysis was conducted on the binary mismatch variable representing low service–high behavior potential (LH) grid cells.
The results reveal the presence of statistically significant clusters, particularly in central parts of the study area, where grid cells form contiguous high–high spatial clusters. These clusters indicate localized concentrations of underserved conditions, where areas with relatively high demographic sensitivity coincide with weak service provision.
A large proportion of grid cells are also classified as not significant at the 95% confidence level, suggesting that mismatch conditions are not uniformly structured across the metropolitan grid. While mismatch conditions are observed in multiple locations, only a subset forms spatially coherent clusters.
These findings indicate that accessibility inequalities are partially spatially concentrated rather than randomly distributed.
The consistency of these results is further examined through validation and sensitivity analyses presented in Section 5.
Figure 5 illustrates the spatial clustering of mismatch areas identified using Local Morans I.
Figure 5.
Local Moran’s I cluster map showing the spatial clustering of mismatch conditions (low service strength–high behavior potential) at the 95% confidence level. High–high spatial clusters indicate statistically significant concentrations of underserved areas, while low–low clusters represent areas with consistently low mismatch intensity. Non-significant areas are shown in white, indicating the absence of spatial autocorrelation.
4.7. Supply–Demand Mismatch Patterns and Planning-Relevant Insights
The comparison between service strength (Sg) and behavior potential (Bg) reveals spatially differentiated patterns of alignment and mismatch across the study area, as illustrated in the typological classification presented in Figure 5.
Underserved areas, defined by high behavior potential and low service strength (LH), represent the dominant category, accounting for a substantial proportion of the study area. These areas are primarily located in peripheral and certain central zones, indicating locations where population groups with higher dependency on public transport are not adequately served by current service provision. The presence of spatial clustering in some of these areas, as identified through the Local Moran’s I analysis, suggests that these mismatches are not randomly distributed but form localized zones of structural imbalance.
In contrast, overserved areas (HL) are less frequent and tend to appear in more central and well-served corridors. These areas indicate locations where service provision exceeds the demographic sensitivity captured by the behavioral index, suggesting potential inefficiencies in resource allocation.
Balanced high-value areas (HH) are limited in number and concentrated in central zones, representing locations where service provision aligns well with demographic demand. These areas can be interpreted as well-functioning segments of the transport system.
Balanced low-value areas (LL) are distributed mainly in peripheral zones, reflecting areas with relatively low demographic demand and correspondingly limited service provision. These areas may represent lower priority zones in the current planning context.
Overall, the results indicate that mismatches between service supply and demographic demand are partially spatially structured, with both clustered and dispersed patterns observed across the metropolitan grid.
5. Discussion
5.1. Service Concentration Versus Geometric Coverage
The results reveal a clear structural asymmetry between spatial proximity and operational service intensity. While proximity scores indicate widespread geometric access to transit stops across the metropolitan grid (Mean Pg = 0.833), transit service strength demonstrates pronounced spatial concentration (Mean Sg = 0.215) with several grid cells lacking direct operational coverage.
This divergence suggests that physical infrastructure coverage does not necessarily equate to operational adequacy. Transit stops may be geographically accessible, yet service frequency and temporal regularity remain unevenly distributed across the network. Consequently, accessibility inequality within the study area appears to arise more from variations in service intensity than from purely geometric exclusion.
This finding aligns with recent accessibility research emphasizing that proximity-based measures alone are insufficient for evaluating effective accessibility [4,5,12,13]. From a planning perspective, the distinction is critical: expanding infrastructure coverage without addressing operational service levels may produce limited improvements in effective accessibility.
These patterns are also reflected in the spatial distribution of expected waiting time, where areas with lower service strength correspond to longer passenger waiting times, reinforcing the service inequality observed across the metropolitan grid.
5.2. Behavioral Sensitivity and Structural Mismatch
The behavior potential index (Mean Bg = 0.628) introduces a demand-sensitive dimension into the analysis. When compared spatially with service strength, the results reveal zones of structural mismatch between demographic sensitivity and operational service provision.
LH cells (Low Service–High Behavioral Potential) are particularly notable, where demographic characteristics suggest relatively strong reliance on public transport while operational service intensity remains comparatively weak. These zones may indicate areas of latent or underserved mobility demand.
Conversely, HL cells (High Service–Low Behavioral Potential) represent areas where service intensity exceeds the demographic sensitivity captured by the behavioral index. Although such configurations do not necessarily imply inefficiency, they may signal opportunities for improving equity-oriented allocation of service resources.
The presence of these mismatched spatial configurations confirms that service provision and demographic sensitivity are not spatially synchronized across the metropolitan grid. Accessibility, therefore, emerges as a multi-dimensional phenomenon that cannot be adequately inferred from a single structural component. This is consistent with recent studies linking accessibility assessment with equity-oriented transport planning [22,27].
5.3. The Analytical Value of Indicator Separation
A key methodological decision of this study was to maintain analytical separation between three complementary accessibility-related indicators:
- Service strength (Sg);
- Proximity score (Pg);
- Behavioral potential (Bg).
Rather than aggregating these components into a composite accessibility index, the framework preserves their individual analytical contributions.
The results demonstrate that each indicator reveals a distinct structural layer of accessibility:
- Proximity (Pg) captures the spatial reach of transit infrastructure.
- Service strength (Sg) represents the temporal intensity and reliability of transit operations.
- Behavior potential (Bg) reflects demographic sensitivity and potential reliance on public transport.
Importantly, these dimensions do not spatially coincide. Maintaining their analytical independence, therefore, prevents structural disparities from being obscured within aggregated indices. This component-based approach enhances interpretability and enables a clearer identification of whether accessibility inequalities arise from infrastructural distribution, operational allocation, or demographic structure.
5.4. Planning Implications
The findings suggest that improving accessibility within the metropolitan area may depend less on expanding the spatial distribution of transit stops and more on optimizing operational service intensity in demographically sensitive zones.
Targeted operational adjustments such as increasing service frequency, reducing headways, or refining timetable coordination within LH zones may yield more equitable accessibility outcomes than large-scale infrastructure expansion alone.
The typological framework developed in this study offers a practical diagnostic tool for transport planners. By classifying grid cells according to the interaction between service provision and demographic sensitivity, planners can identify distinct policy priorities:
- Priority reinforcement zones (LH)—areas of potential unmet demand;
- Balanced zones (HH)—areas where service and demand are aligned;
- Monitoring zones (HL)—areas of potentially excessive service intensity;
- Low-pressure zones (LL)—areas with relatively limited demographic demand.
Through this differentiated perspective, mobility planning can shift from uniform infrastructure expansion toward targeted, evidence-based service optimization strategies.
5.5. Robustness and Sensitivity Analysis
The results of the sensitivity analysis provide important insights into the robustness and reliability of the proposed analytical framework. The stability of spatial patterns observed under both alternative walking distance thresholds and modified temporal aggregation confirms that the identified accessibility conditions are not driven by specific parameter choices.
The proximity analysis demonstrates that moderate variations in assumed walking behavior primarily affect peripheral areas, while the overall spatial structure of accessibility remains unchanged. This indicates that the proximity indicator captures structural spatial relationships rather than being overly sensitive to threshold selection.
Similarly, the temporal sensitivity analysis shows that adjusting the service time window leads to proportional changes in service strength values without altering the relative spatial distribution of service provision. Areas identified as high or low service intensity remain consistent across scenarios, suggesting that the service strength indicator reflects persistent operational characteristics of the network.
Importantly, these findings reinforce the interpretation of the service–behavior typology. The identified mismatch zones, particularly areas characterized by high behavior potential and low service provision, remain stable under alternative modelling assumptions. This strengthens the validity of the identified underserved areas and supports their relevance for transport planning interventions.
Overall, the results demonstrate that the proposed framework remains stable under the tested variations in both behavioral and operational assumptions. This robustness enhances the credibility of the findings and supports the applicability of the approach for evidence-based transport planning and policy development.
While the current analysis relies on Euclidean distance and aggregated service indicators, future research could extend this framework by incorporating network-based accessibility measures, real pedestrian routes, and empirically calibrated behavioral parameters.
These findings further support the validity of the proposed indicators.
5.6. Spatial Structure of Accessibility Mismatch
The spatial clustering results provide important additional insight into the structure of accessibility mismatch identified in the study. While the typological classification reveals widespread mismatch conditions across the study area, the Local Moran’s I analysis demonstrates that only certain zones exhibit statistically significant spatial concentration.
This indicates that accessibility inequalities are not uniformly distributed, but instead occur in localized areas where structural imbalances between service provision and demographic sensitivity are reinforced spatially.
The coexistence of clustered and non-significant areas highlights the heterogeneous nature of accessibility patterns. While some underserved zones form coherent spatial clusters, others appear more fragmented or randomly distributed.
From a planning perspective, these findings suggest that targeted, location-specific interventions may be more effective than uniform system-wide improvements. In particular, areas identified as clustered mismatch zones may represent priority locations for service enhancement and operational optimization.
5.7. Targeted Planning Recommendations
The mismatch patterns identified in the analysis provide a clear basis for differentiated and targeted planning strategies across the study area.
In underserved areas (LH), where high behavior potential coincides with low service strength, the results highlight the need for demand-responsive interventions. These may include increasing service frequency, reducing headways, extending route coverage, or improving first/last-mile connectivity. Given the relatively higher dependency on public transport in these areas, such interventions are likely to yield significant improvements in accessibility and social equity.
In overserved areas (HL), where service provision exceeds the level of demographic sensitivity, the findings suggest opportunities for service optimization. Rather than reducing accessibility, planning strategies may focus on reallocating service resources more efficiently, for example by adjusting service frequency or redistributing capacity toward underserved areas, while maintaining overall network performance.
Balanced high-value areas (HH) represent locations where service provision aligns well with demographic demand. These areas can be considered well-functioning components of the transport system and may benefit primarily from maintenance-oriented strategies, such as enhancing service reliability, operational efficiency, and overall service quality.
Balanced low-value areas (LL) correspond to zones with relatively low demographic demand and limited service provision. While these areas may be a lower priority in the short term, they should be monitored in relation to future demographic changes, land-use development, and potential shifts in mobility demand.
Overall, the results suggest that accessibility inequalities are not uniformly distributed but instead occur in spatially differentiated patterns. This highlights the importance of moving beyond uniform planning approaches toward more targeted, evidence-based, and demand-sensitive transport planning strategies.
6. Limitations
Despite this study’s analytical contributions, several methodological and data-related limitations should be acknowledged.
Service indicators were calculated within a defined temporal window (6:00 a.m.–10:00 p.m.). While this period captures the majority of daytime public transport operations, it excludes late-night service variability as well as peak and off-peak temporal differentiation. Future analyses incorporating full-day service patterns or time-segmented GTFS processing could provide a more detailed representation of temporal accessibility dynamics.
Transit service strength was derived from static GTFS schedule data rather than real-time operational performance. Consequently, service variability caused by delays, disruptions, vehicle bunching, or reliability fluctuations is not represented in the analysis. Integrating real-time operational data streams or Automatic Vehicle Location (AVL) datasets would improve the empirical realism of service intensity measurements.
Proximity was estimated using grid cell centroids as representative origin points. Although centroid-based modelling is widely used in grid-based accessibility studies, this approach may slightly overestimate or underestimate actual walking distances in irregularly shaped or larger cells. Network-based accessibility modelling using multiple origin points within each cell could improve spatial precision.
Service strength at the grid level was assigned using the nearest-stop approach, which may simplify local variability in areas with multiple stops. While this approach provides a stable representation of average service intensity, it may simplify internal variability within grid cells that contain multiple stops with different operational characteristics. Alternative aggregation strategies, such as weighted averages or maximum service intensity, could produce different sensitivity patterns.
The behavior potential index relies on demographic proxies, specifically age and gender structure, rather than directly observed travel behavior. Although these variables are conceptually grounded in accessibility literature, they do not capture actual ridership patterns or modal choice behavior. Future research integrating travel survey data, smart-card transactions, or anonymized mobility traces could improve behavioral calibration.
This study deliberately refrained from constructing a composite accessibility index to preserve analytical transparency between service intensity, spatial proximity, and demographic sensitivity. While this decision enhances diagnostic interpretability, it limits the ability to produce a single synthetic indicator for benchmarking or cross-city comparison. Future research may explore integrated accessibility modelling approaches while maintaining structural transparency between component indicators.
Despite these limitations, the analytical framework provides a transparent and reproducible approach for examining multiple structural dimensions of urban transit accessibility within an open-source GIS environment.
In addition, the proximity indicator is based on Euclidean distance and does not account for actual pedestrian network conditions, physical barriers, or street connectivity. As a result, the measured distances may underestimate or overestimate real walking accessibility. Incorporating network-based distances and pedestrian routing would provide a more realistic representation of accessibility conditions.
7. Conclusions
This study developed a reproducible GIS-based framework for examining multiple structural dimensions of public transport accessibility within the metropolitan area of Valencia. Using open-source geospatial tools and standardized transit data, three complementary accessibility-related indicators were derived and analyzed independently: transit service strength (Sg), proximity score (Pg), and demographic-based behavior potential (Bg).
The results reveal that spatial proximity to public transport stops is relatively widespread across the metropolitan grid, whereas operational service intensity displays considerably stronger spatial variability. This spatial pattern is further reflected in expected passenger waiting times, which tend to increase in areas where service intensity is lower.
While most grid cells exhibit moderate to high proximity scores, transit service strength is concentrated within specific corridors and central areas. This divergence indicates that geometric proximity alone does not necessarily translate into effective accessibility when temporal service intensity is unevenly distributed.
By incorporating demographic structure through the behavior potential index, the analysis further identifies spatial mismatches between potential transit reliance and operational service provision. Zones characterized by high behavior potential but relatively weak service intensity suggest areas where mobility demand may not be sufficiently supported by existing service allocation.
Rather than aggregating the indicators into a single composite index, the framework preserves the analytical separation of proximity, service intensity, and demographic sensitivity. This approach enhances interpretability and enables clearer identification of the structural sources of accessibility inequality. The proposed workflow provides a transparent and transferable analytical foundation for future studies that may integrate these indicators into composite accessibility models or cluster-based planning analyses.
From a practical perspective, the proposed framework provides a decision-support tool for transport planners by enabling the identification of priority intervention areas based on the interaction between service provision and demographic sensitivity. The analytical separation of accessibility components allows for more targeted and evidence-based planning strategies, particularly in addressing spatial inequalities and improving equity-oriented service allocation. The approach is transferable to other urban contexts where open data and GIS tools are available.
The robustness of the results under alternative assumptions further strengthens the reliability of the proposed framework and supports its application in evidence-based and equity-oriented transport planning.
Author Contributions
Conceptualization, H.P.; Methodology, H.P., E.G. and J.L.M.-G.; Software, H.P.; Formal analysis, H.P., E.G. and J.L.M.-G.; Investigation, H.P.; Data curation, H.P.; Writing—original draft, H.P.; Writing—review & editing, E.G. and J.L.M.-G.; Visualization, H.P.; Supervision, E.G. and J.L.M.-G. All authors have read and agreed to the published version of the manuscript.
Funding
This research received no external funding.
Institutional Review Board Statement
Not Applicable.
Informed Consent Statement
Not Applicable.
Data Availability Statement
The raw data supporting the conclusions of this article will be made available by the authors on request.
Conflicts of Interest
The authors declare no conflicts of interest.
References
- Banister, D. The sustainable mobility paradigm. Transp. Policy 2008, 15, 73–80. [Google Scholar] [CrossRef] [Scilit]
- Litman, T. Evaluating Accessibility for Transport Planning; Victoria Transport Policy Institute. 2023. Available online: https://www.vtpi.org/access.pdf (accessed on 20 January 2025).
- Sun, X.; Cui, X. Mapping mobility gaps: Geospatial analysis of accessibility and equity. Transp. Res. Part D 2025, 146, 104909. [Google Scholar] [CrossRef] [Scilit]
- Cui, M.; Levinson, D. Full cost accessibility. J. Transp. Land Use 2018, 13, 661–679. [Google Scholar] [CrossRef] [Scilit]
- Farber, S.; Morang, M.Z.; Widener, M.J. Temporal variability in transit-based accessibility to supermarkets. Appl. Geogr. 2014, 53, 149–159. [Google Scholar] [CrossRef] [Scilit]
- El-Geneidy, A.; Levinson, D.; Diab, E.; Boisjoly, G.; Verbich, D.; Loong, C. The cost of equity: Assessing transit accessibility and social disparity using total travel time. Transp. Res. Part A Policy Pract. 2016, 91, 302–316. [Google Scholar] [CrossRef] [Scilit]
- Bast, H.; Storandt, S. Frequency-based search for public transit. In Proceedings of the 21st ACM SIGSPATIAL International Conference on Advances in Geographic Information Systems (SIGSPATIAL GIS 2013), Orlando, FL, USA, 5–8 November 2013. [Google Scholar] [CrossRef] [Scilit]
- Tirachini, A.; Hensher, D.A.; Rose, J.M. Crowding in public transport systems: Effects on users, operation and implications for the estimation of demand. Transp. Res. Part A 2013, 53, 36–52. [Google Scholar] [CrossRef] [Scilit]
- Higgins, C.D.; Sweet, M.N.; Kanaroglou, P.S. All minutes are not equal: Travel time and the effects of congestion on commute satisfaction in Canadian cities. Transportation 2018, 45, 1249–1268. [Google Scholar] [CrossRef] [Scilit]
- Open Mobility Foundation. General Transit Feed Specification (GTFS). 2024. Available online: https://gtfs.org (accessed on 20 January 2025).
- Allen, J.; Farber, S. Sizing up transport poverty: A national scale accounting of low-income households suffering from inaccessibility in Canada, and what to do about it. Transp. Res. Part A 2019, 74, 214–223. [Google Scholar] [CrossRef] [Scilit]
- Currie, G. Quantifying spatial gaps in public transport supply based on social needs. J. Transp. Geogr. 2010, 18, 31–41. [Google Scholar] [CrossRef] [Scilit]
- Fransen, K.; Neutens, T.; Farber, S.; De Maeyer, P.; Deruyter, G.; Witlox, F. Identifying public transport gaps using time-dependent accessibility levels. J. Transp. Geogr. 2015, 48, 176–187. [Google Scholar] [CrossRef] [Scilit]
- Kwan, M.P. The uncertain geographic context problem. Ann. Assoc. Am. Geogr. 2012, 102, 958–968. [Google Scholar] [CrossRef] [Scilit]
- Batty, M. Inventing Future Cities; MIT Press: Cambridge, MA, USA, 2018. [Google Scholar]
- Greco, S.; Ishizaka, A.; Tasiou, M.; Torrisi, G. On the methodological framework of composite indices: A review of the issues of weighting, aggregation, and robustness. Soc. Indic. Res. 2019, 141, 61–94. [Google Scholar] [CrossRef] [Scilit]
- Zhu, L.; Lucas, K. Towards calculated and perceived transport equity: An equity evaluation framework for accessibility. Transp. Res. Part D Transp. Environ. 2025, 146, 104908. [Google Scholar] [CrossRef] [Scilit]
- Pereira, R.H.M.; Banister, D.; Schwanen, T.; Wessel, N. Distributional effects of transport policies on inequalities in access to opportunities in cities. J. Transp. Land Use 2019, 12, 741–764. [Google Scholar] [CrossRef] [Scilit]
- Lucas, K. Transport and social exclusion: Where are we now? Transp. Policy 2012, 20, 105–113. [Google Scholar] [CrossRef] [Scilit]
- Yang, Y.; Gao, Y. Prediction model of bus passenger tolerable waiting time. Transp. Res. Part A Policy Pract. 2025, 197, 104504. [Google Scholar] [CrossRef] [Scilit]
- Transit Cooperative Research Program (TCRP). Transit Capacity and Quality of Service Manual, 3rd ed.; Transportation Research Board, National Academies Press: Washington, DC, USA, 2013. [Google Scholar]
- Boisjoly, G.; El-Geneidy, A. The insider: A planners’ perspective on accessibility. J. Transp. Geogr. 2017, 64, 33–43. [Google Scholar] [CrossRef] [Scilit]
- Cervero, R.; Kockelman, K. Travel demand and the 3Ds: Density, diversity, and design. Transp. Res. Part D 1997, 2, 199–219. [Google Scholar] [CrossRef] [Scilit]
- El-Geneidy, A.; Grimsrud, M.; Wasfi, R.; Tétreault, P.; Surprenant-Legault, J. New evidence on walking distances to transit stops: Identifying redundancies and gaps using variable service areas. Transportation 2014, 41, 193–210. [Google Scholar] [CrossRef] [Scilit]
- Pereira, R.H.M.; Schwanen, T.; Banister, D. Distributive justice and equity in transportation. Transp. Rev. 2017, 37, 170–191. [Google Scholar] [CrossRef] [Scilit]
- Qu, Y.; Currie, G.; Webb, G.I. Accessibility misrepresentation in public transport. J. Transp. Geogr. 2026, 133, 104632. [Google Scholar] [CrossRef] [Scilit]
- Pereira, R.H.M.; Karner, A. Transportation equity. In International Encyclopedia of Transportation; Elsevier: Amsterdam, The Netherlands, 2021; pp. 1–7. [Google Scholar]

Disclaimer/Publisher’s Note: The statements, opinions and data contained in all publications are solely those of the individual author(s) and contributor(s) and not of MDPI and/or the editor(s). MDPI and/or the editor(s) disclaim responsibility for any injury to people or property resulting from any ideas, methods, instructions or products referred to in the content. |
© 2026 by the authors. Licensee MDPI, Basel, Switzerland. This article is an open access article distributed under the terms and conditions of the Creative Commons Attribution (CC BY) license.