


Abstract
Heating, ventilation, and air conditioning (HVAC) systems struggle to maintain optimal thermal comfort because perception is subjective and varies significantly across individuals. Traditional uniform cooling strategies often overlook demographic diversity, leading to inequitable comfort outcomes and inefficient building operations. To address this limitation, this study analyzed a web-based survey of 366 university occupants using a partial proportional odds model with multiple imputation and inverse-frequency weighting. Interaction terms, specifically Age–Activity, Gender–Clothing, and Age–Clothing, were included to assess combined effects that reflect demographic disparities in adaptive capacity. The results show that clothing insulation, activity, age, gender, race/ethnicity, and space type significantly influence thermal responses. Notably, male occupants were more than three times as likely to report feeling too warm (odds ratio [OR] = 3.24), whereas older adults exhibited significantly lower odds of reporting feeling too warm (OR = 0.42). Substantial variation was observed across racial and ethnic groups (ORs ranging from 2.4 to 6.5). These findings highlight the limitations of traditional population-average comfort approaches and provide valuable scientific insights for demand-response-ready HVAC strategies that adjust temperature setpoints dynamically without sacrificing comfort. By offering accurate, real-time estimates across diverse thermal ranges, these occupant-centric models reduce HVAC energy use and associated emissions at the building scale while supporting ancillary services for flexible load shifting and smarter coordination within low-carbon electric grids. Ultimately, incorporating demographic and contextual diversity into building controls reduces unnecessary cooling waste while promoting thermal equity, establishing a human-centric foundation for sustainable built environments.
1. Introduction
Americans spend approximately 90 percent of their time indoors [1], placing significant demand on heating, ventilation, and air conditioning (HVAC) systems to maintain optimal thermal conditions for occupants. This directly affects health, satisfaction, performance, and overall productivity of occupants [2,3,4]. Moreover, this challenge is further intensified by increasingly stringent requirements to reduce building energy consumption, necessitating advanced measures and sophisticated building automation and control strategies [5], as residential and commercial buildings collectively account for approximately 37% of total U.S. energy consumption [6]. As sustainability becomes a central priority in building design, the adoption of green certification programs such as Leadership in Energy and Environmental Design (LEED) supports the integration of energy-efficient HVAC practices [7]. However, delivering comfort under these energy constraints is challenging because thermal perception varies among occupants, and one-size-fits-all setpoints may disadvantage some groups by failing to account for demographic differences or unequal adaptive opportunities.
Thermal comfort is closely linked to occupant satisfaction and well-being in the built environment. Occupants are more dissatisfied with the adverse thermal condition of buildings compared to other indoor environmental quality (IEQ) problems, such as visual and acoustic discomfort [8,9,10]. Thermal comfort dissatisfaction has a negative impact on occupant productivity [11,12,13], cognitive performance [14,15,16], and health and well-being [17,18]. As highlighted by Mansor et al. [19], indoor air temperature, relative humidity, and personal control have a notable positive impact on the psychological health of occupants in Malaysian office buildings. Taken together, these findings emphasize that thermal comfort is strongly shaped by individual differences, as variations in clothing flexibility, access to environmental controls, or physiological factors can produce distinct comfort responses that current building standards and operations do not fully capture.
Ensuring thermal comfort is essential for workplace inclusion, as an individual’s perception of temperature depends on personal factors such as age, gender, ethnicity, metabolic rate, and health condition [20,21,22]. For instance, lab and field studies have reported sex-based differences in comfort temperatures, with reported estimates suggesting a slightly higher average comfortable operative temperature for women (26.3 °C) than for men (25.3 °C) [23]. In addition, Lyu et al. [24] revealed distinguishable differences in comfort ranges between male and female occupants in China, noting that women could better tolerate higher temperatures compared to men. However, females express thermal dissatisfaction more frequently (twice as likely) than males in the same environments, especially in cooler conditions [25,26,27,28]. Notably, thermal preferences during the perimenopausal period may lean toward cooler environments [29]. Thermal sensitivity differs across age groups; older adults are often more sensitive to cooler conditions and report greater dissatisfaction during heating seasons [30,31]. Taken together, these findings indicate that thermal comfort varies systematically across demographic groups and that uniform setpoints may inadvertently disadvantage specific populations—particularly in overcooled buildings—raising energy-efficiency concerns. Based on these findings, Li et al. [32] developed an approach for predicting personal thermal preferences that integrates thermal facial imaging with age and gender detection using convolutional neural networks, demonstrating that demographic attributes can be inferred and incorporated into comfort models.
Naheed and Shooshtarian [33] showed that cultural background adds to the variation in thermal comfort requirements and expectations, clothing choices, and overall thermal preferences, perceptions, and tolerance. Ethnic minority groups in North America show more vulnerability to extreme heat [34,35]. Similar studies in South Australia have reported higher heat sensitivity among people born outside Australia [36,37]. Japanese and Chinese people have higher temperature preferences (on average by 5 °C, resulting in up to a 1.9 °C higher temperature at chest level) compared to White Western Europeans [38,39]. Additionally, Al-Absi et al. [40] found that ethnic origins are linked to residents’ perceptions of thermal comfort in naturally conditioned environments, underscoring the need to consider socio-cultural backgrounds in thermal comfort evaluations. These findings collectively indicate thermal comfort should be treated not only as a physiological outcome but also as a matter of equitable access to supportive indoor environments—particularly where clothing norms, control over setpoints, and exposure conditions differ across groups.
Personal comfort models are data-driven approaches that utilize direct feedback from an individual to learn their specific thermal preferences, as opposed to conventional thermal comfort methods such as the predicted mean vote (PMV) [41,42] and adaptive models [43]. Personal thermal comfort models are able to adapt as new data are collected and incorporated into the model, whereas conventional comfort models (PMV and adaptive models) do not. Utilizing preference-based data in personal comfort models allows a better understanding of the comfort needs of individuals, better fault detection and diagnostics, improved occupant comfort, more responsive HVAC systems, and reduced energy use [44,45,46]. Recent smart HVAC systems use adaptive comfort theory and predictive models to optimize temperature settings, establishing up to only 5.2% energy savings without detailed building or personal data [5]. Utilizing personal comfort models in occupant-centric control could reduce energy use by 22% and enhance thermal comfort by 29.1% [47]. Personal thermal comfort models also perform better in consensus-based solutions needed to find a common temperature setpoint in shared-occupancy spaces to minimize the overall thermal discomfort level [48,49,50]. Crucially, because these models rely on individualized feedback rather than generalized assumptions, they can better capture comfort differences across diverse demographic groups and help prevent practices like summertime overcooling that both waste energy and exacerbate discomfort for vulnerable occupants. Kim et al. [51] evaluated personal comfort models based on their predictive performance, robustness, and model convergence and found that these models perform better; for instance, they have 20–40% better prediction accuracy compared to conventional comfort models. Li et al. [52] suggested an Indoor Temperature Setting Control Method (ITPSCM) that enhances thermal comfort and energy efficiency through reinforcement learning, implementing thermal comfort rewards and energy-saving method rewards, which resulted in a 26.48% daily energy savings. Furthermore, the adoption of Model Predictive Control (MPC) strategies and affordable local sensing, as demonstrated by Zhang et al. [53], can lead to an improvement of 28–35% in energy efficiency over personalized feedback control strategies. These advances highlight how incorporating individualized data can improve not only prediction accuracy but also fairness, as systems become more responsive to occupants whose needs may deviate from population averages.
The data needed for personal comfort models to be integrated into HVAC controls has been collected through various methods. Feedback data are gathered through periodic thermal comfort preference surveys using personal computers or mobile devices [54,55,56]. The format of surveys and scales used varies among studies. Most studies have used a 3-point, 5-point, or 7-point thermal preference (e.g., prefer warmer, cooler, no change) [55,57,58,59,60] or thermal sensation (e.g., cold, cool, neutral, warm, hot) [61,62,63,64]. Environmental condition data (e.g., air temperature, humidity) are commonly collected using sensors. Behavioral data such as occupancy status, movements, and location are collected in some studies using an occupancy sensor, pedometer, GPS tracker, and smart thermostat [51]. Similarly, occupant-based HVAC control strategies that rely on advanced sensors and occupancy estimation have been shown to conserve energy while maintaining occupant satisfaction, thermal comfort, and perceived air quality approximately 80% [65]. Physiological data (e.g., skin or body temperature, heart rate, metabolic rate) are monitored using sensors [66,67], RFID tagging [68,69], wearable devices, or infrared cameras [70]. For example, young and healthy participants were asked to wear eyeglass frames equipped with infrared sensors during activities to collect skin temperature while performing regular office work [71]. Kim et al. [51] used a chair equipped with sensors to record different data such as occupancy level, air temperature, and relative humidity. While these sensing methods provide valuable data, they may not fully capture factors such as differences in adaptive behaviors, clothing constraints, or health conditions, suggesting the need for thermal comfort models that more explicitly consider diverse occupant experiences.
Expanding on physiological monitoring, Chen et al. [72] introduced a Thermosensory Mean Skin Temperature (TMST) based on the skin temperature of the forehead, foot, forearm, and fingers, leveraging their weights to produce a more accurate physiological indicator than mean skin temperature alone, while Fakir and Kim [73] demonstrated a strong positive correlation between skin temperature and exhalation temperature for predicting thermal sensation.
The selection of input variables (i.e., predictors) varies depending on the study objectives. For instance, some studies used only environmental data to minimize data collection costs [48,74,75], whereas others combined physiological and environmental data to improve thermal comfort prediction performance [51,57,71]. Using a combination of environmental, physiological, and behavioral data as input variables has improved the accuracy of predicting thermal preferences [57,76]. Conversely, other studies focus on direct environmental assessment, such as the work by Desta and Asseffa [77], which utilized field measurements of air temperature and relative humidity to determine the thermal performance of public office buildings. Moreover, Wu et al. [78] introduced the Thermal Environmental Collaborative Control System (TECCS), which combines the Personal Comfort System (PCS) and personal comfort models (PCMs) with the current HVAC infrastructure to enhance the personal comfort of individual occupants in shared spaces. Ultimately, incorporating user feedback into predictive models not only enhances comfort and energy performance but also supports more inclusive indoor environments by ensuring that building systems respond to a diverse range of occupants rather than privileging those whose preferences align with traditional comfort assumptions [51,79]. This approach directly addresses recurring operational issues such as chronic overcooling, improving both comfort and efficiency.
Table 1 summarizes the input parameters, output variables, and modeling approaches across the key studies discussed above.
Existing personal thermal preference models have systematically overlooked socio-cultural differences and diversity between building occupants to predict the thermal preference of occupants. This disregard for individual differences is evident in the design of their experiments. For example, Martins et al. [54] argued that participants in the most recent personal comfort studies often share similar demographic attributes and health conditions. The median number of participants in these studies was 11, mostly young healthy occupants in their early 20s, and occupants with lower thermal sensitivity (e.g., the elderly) have not been included [54]. While researchers like Wang et al. [80] and Kim et al. [51] have argued that attributes such as gender, age, culture, and health lead to critical inter-individual differences, the literature has largely treated these factors in isolation. Simply including these demographic attributes as independent variables is insufficient. This is not only a methodological limitation but also a concern for generalizability, as models built on homogeneous samples may not represent the comfort responses of occupants with different physiological or cultural backgrounds. Moreover, when such models inform building operation, they can encourage conservative setpoints (e.g., lower summer temperatures) that increase energy use while systematically underserving certain groups.
Table 1.
Summary of input parameters, output variables, and methods in reviewed thermal comfort studies.
The critical gap that this study addresses is the lack of understanding of the interplay between these personal and behavioral factors. For example, researchers have not adequately explored how underlying differences, such as gender, moderate the influence of behaviors like clothing choice, or how the thermal effect of physical activity might be conditional on an occupant’s age. Without examining these conditional relationships, inequities in thermal experience remain hidden within population averages, masking discomfort burdens that fall disproportionately on specific demographic groups. By explicitly modeling these interactions, this study aims to uncover patterns essential to equitable design and to reduce energy waste associated with one-size-fits-all cooling practices. This study moves beyond main effects to investigate these crucial interaction terms, positing that thermal comfort is a complex, conditional response.
Although prior research has examined thermal comfort and occupant behavior, the influence of personal factors on individual thermal preferences remains insufficiently understood. Much of the existing work has focused on environmental conditions or physiological responses—such as skin temperature, heart rate, skin conductance, metabolic rate, and other thermoregulatory indicators—often enabled by wearable sensing technologies. While these physiological variables have shown promise for improving personalized thermal comfort models, they capture only part of the picture. Behavioral, psychological, and contextual factors remain comparatively underexplored, and the literature offers limited insight into how these personal factors interact with physiological responses to shape thermal preferences in real-world settings. This narrow focus overlooks the reality that different demographic or cultural groups may have distinct adaptive behaviors, constraints, or expectations, which can meaningfully influence thermal experience.
For example, occupants in different regions may respond differently to thermal discomfort based on cultural expectations or lifestyle habits, yet these variations are rarely incorporated into predictive models. Additionally, research often relies on short-term data collection, typically spanning a few weeks or months, which fails to capture seasonal variations or long-term adaptation patterns. This narrow timeframe limits the ability to understand how occupants adjust their behavior over extended periods, particularly in response to changing environmental conditions or evolving building systems. Short-term or homogeneous sampling also risks reinforcing inequities by underrepresenting groups with different schedules, thermal needs, or adaptive capacities—such as older adults, people with disabilities, or individuals with restricted clothing flexibility—and by missing operational patterns that lead to persistent energy waste. As a result, current models lack the comprehensive understanding needed to meaningfully inform the development of fully personalized thermal comfort frameworks. This gap is particularly evident in university environments, where diverse behaviors, schedules, and space-use patterns create comfort dynamics that are not well represented in existing studies. University settings also reflect wide demographic and socio-cultural diversity, making them ideal for examining variations in thermal perception that traditional models fail to address. To address these gaps, this study pursues three objectives: (1) to examine how demographic and behavioral factors—including age, gender, race/ethnicity, clothing, and activity—shape thermal sensation in a diverse university population; (2) to investigate interaction effects between these factors, specifically Age-Activity, Gender-Clothing, and Age-Clothing, which have been largely overlooked in prior work; and (3) to identify subgroup differences in thermal perception that can inform more equitable and energy-efficient HVAC strategies.
2. Methodology
The overall research process, from data collection to final analysis, is illustrated in the flowchart in Figure 1. This methodology represents a statistical inference approach, using data from a sample of 366 to identify and draw conclusions about the key drivers of thermal sensation within a larger population. The reliability and validation of the findings were ensured through systematic data preprocessing, appropriate sampling design, and rigorous statistical modeling procedures. Given the study’s focus on demographic and behavioral variability, particular attention was paid to preserving subgroup representation and minimizing biases that could obscure inequitable patterns in thermal perception. This included inverse frequency weighting, multiple imputation to address missing data, and interaction terms to detect conditional relationships that may reflect differences across demographic groups. These methodological steps support an analysis sensitive to diverse occupant experiences rather than assuming uniformity across the sample.
Figure 1.
Flowchart of the methodology process.
2.1. Survey Design and Data Collection
To examine the interplay between occupant characteristics and thermal perception, a cross-sectional study was conducted using a user-friendly, web-based survey across multiple buildings at the University of Texas at Arlington (UTA). The survey collected subjective thermal sensation votes and key sociodemographic, behavioral patterns (e.g., clothing adjustments), and environmental context variables from a diverse sample of the university community, including faculty, staff, and students across various building and space types. The survey was conducted across mechanically conditioned university buildings operated under institutional facilities management protocols intended to comply with ASHRAE Standard 55 [82], maintaining indoor thermal conditions within institutionally defined comfort ranges for temperature and relative humidity. As all surveyed spaces were served by centralized HVAC systems operating under consistent institutional protocols for comparable space types, indoor environmental conditions within those spaces were managed according to standardized comfort setpoints. This context reduces—though does not eliminate—the likelihood that observed variation in thermal sensation is driven primarily by physical environmental differences, and instead supports interpretation of the findings as reflecting individual, behavioral, and perceptual factors, which are the primary focus of this study.
This broad sampling frame was designed to capture differences in thermal experience across demographic groups and organizational roles, ensuring that perspectives from traditionally underrepresented or marginalized occupants were included in the dataset.
The primary outcome variable, thermal sensation, was measured on a five-point, balanced ordinal scale (“Too cold”, “Cold”, “Comfortable”, “Warm”, “Too warm”). Sociodemographic (identity), behavioral, and environmental variables were selected in accordance with the ASHRAE Global Thermal Comfort Database II to ensure consistency with established research protocols [83]. Building upon these standards, this study intentionally expanded the scope of sociodemographic data to better represent the diversity found in contemporary indoor environments. Race and ethnicity were incorporated as explanatory variables to address critical gaps in thermal comfort research. Existing global datasets, including the ASHRAE Global Thermal Comfort Database II, primarily focus on environmental and physiological factors, often overlooking sociocultural dimensions that influence thermal perception. Cultural norms, clothing practices, and adaptive behaviors vary significantly across racial and ethnic groups, potentially shaping comfort expectations and thermal responses. By including race and ethnicity, this study enhances the inclusivity and representativeness of thermal comfort models, enabling more equitable design recommendations for diverse populations and reducing bias in building performance standards. This approach acknowledges that thermal comfort is shaped not only by physical conditions but also by sociocultural identity, and aims to mitigate the historical exclusion of non-majority groups in comfort research.
Occupation and academic rank were also incorporated as explanatory variables to capture role-based differences (e.g., faculty vs. staff vs. students) in thermal comfort perception within institutional settings. Existing thermal comfort datasets, including ASHRAE Global Thermal Comfort Database II, do not account for organizational hierarchy or job-related activities, which can significantly influence behavioral patterns, clothing choices, and exposure to different space types. Faculty, staff, and students often occupy distinct zones within buildings and engage in varied tasks, leading to differences in metabolic rates and adaptive opportunities. Including these variables enables a more nuanced understanding of thermal comfort across diverse user groups, supporting targeted design strategies that enhance comfort and productivity for all occupants. By disaggregating thermal experiences according to institutional role, this study highlights how structural and organizational differences can create unequal opportunities for maintaining comfort in shared environments.
Participants reported their actual demographic characteristics, space type, activity level, clothing level, and thermal sensations at the time of the survey. To manage survey length given the number of variables examined, the survey instrument was structured using efficiency principles inspired by factorial and orthogonal design, allowing key combinations of reported conditions to be represented across the sample without requiring each participant to answer all possible combinations. This approach optimized coverage while preserving the observational nature of the study.
All research protocols were reviewed and approved by the UTA’s Institutional Review Board (IRB) to ensure compliance with ethical standards and protection of participant confidentiality. The IRB process further ensured that sensitive demographic variables—such as race, ethnicity, and gender—were collected responsibly and safeguarded to protect participants while enabling analyses that illuminate potential inequities in thermal experience.
2.2. Data Preprocessing
The dataset consisted of 366 complete survey responses. The collected variables were prepared prior to modeling to ensure appropriate representation. Nominal predictors–such as Gender, Race, Occupation, and Space Type– were one-hot encoded to avoid imposing a false order, while ordinal predictors (Activity, Level of Clothing, Age Category, and Floor Level) were encoded using an integer scale starting at zero to preserve their inherent rank order. Health status was coded as a binary variable (0 = Healthy, 1 = Unhealthy). To ensure adequate representation, sparse categories with fewer than 15 observations were combined into an “Other” group for Race, Occupation, and Space type. Similarly, the fifth and sixth floors were merged into a single category to address low-frequency occurrences and maintain statistical robustness. These consolidation steps were performed with care to preserve the visibility of meaningful demographic variation while preventing sparsity-related distortions that could disproportionately affect small or underrepresented groups in the analysis. Table 2 provides an overview of all variables included in the analysis and their corresponding values. Throughout preprocessing, care was taken to retain the integrity of demographic and behavioral variables—particularly those related to race, ethnicity, gender, and organizational role—to ensure the analytical model remained sensitive to the diverse experiences that influence thermal perception. This preparation supports downstream modeling that can identify disparities and interaction effects that might otherwise be obscured.
Table 2.
Survey variables and corresponding response categories used in the study.
2.3. Addressing Class Imbalance
The distribution of the outcome variable, thermal sensation, was imbalanced, as shown in Figure 2. The “Comfortable” category constituted the majority of responses, while the “Too cold” and “Too warm” responses were underrepresented. An unweighted model would therefore be biased toward the majority class, leading to reduced predictive performance for the minority classes. Such an imbalance can obscure important subgroup differences, as individuals who are most likely to experience thermal discomfort—and who may already be underrepresented in building performance research—are precisely those whose responses fall into the minority categories. Ensuring appropriate weighting is therefore critical for both statistical validity and for capturing variation in thermal perception.
Figure 2.
Thermal sensation responses distribution.
Since the primary goal of this study is statistical inference, the method chosen to address this imbalance was carefully selected. While oversampling techniques like SMOTE (Synthetic Minority Over-sampling Technique) can improve predictive accuracy [84], they are not well-suited for an inferential framework because they create synthetic observations, thereby violating the assumption of observational independence required for unbiased parameter estimation [85].
Therefore, inverse-frequency class weighting was selected as the most appropriate method for handling class imbalance. This approach preserves the integrity of the original dataset by adjusting the model’s objective function rather than altering the data itself [86]. The weight assigned to each observation is inversely proportional to its class frequency, calculated as shown in Equation (1). This weighting strategy ensures that perspectives from occupants experiencing discomfort—who may include older adults, individuals with health constraints, or those occupying less controllable spaces—are not statistically diluted, thereby supporting an equitable representation of thermal experience across the sample.
where is the weight for class , is the total number of observations, is the total number of outcome classes, and Nc is the number of observations in class .
By incorporating the weights, the model is compelled to treat each class as equally important, ensuring that parameter estimates are robust and valid for making reliable inferences about the population. This weighting procedure is important as it prevents minority response categories—often associated with occupants experiencing thermal discomfort—from being statistically overshadowed. As a result, the model maintains sensitivity to discomfort patterns that may disproportionately affect underrepresented groups, thereby supporting a more inclusive interpretation of thermal experience across the sample.
2.4. Statistical Modeling Approach
The relationship between occupant characteristics, behaviors, and the ordinal outcome of thermal sensation was analyzed using an ordinal logistic regression, also known as a cumulative link model. This framework was selected because it is explicitly designed for ordered categorical outcomes. It also supports examining how predictors influence not just one category but the entire ordered spectrum of thermal sensation, making it well-suited for identifying systematic differences across demographic groups. Three two-way interaction terms were specified a priori based on thermal comfort literature and physiological principles to test whether key associations with thermal sensation differ across occupant groups. Table 3 summarizes the pre-specified interaction terms and the corresponding hypotheses tested. These interaction effects were chosen to illuminate conditional relationships—such as how gender may moderate clothing-related insulation effects or how age may alter the influence of activity—that are often overlooked in models assuming uniform occupant responses.
Table 3.
Pre-specified two-way interaction terms and hypotheses.
2.5. The Partial Proportional Odds Model (PPOM)
A foundational requirement of standard ordinal logistic regression is the Proportional Odds (PO) assumption, which states that each predictor has a single effect that applies uniformly across all cumulative cutpoints of the ordinal outcome [87]. This assumption was evaluated for all predictors using the Brant test [88]. The test revealed statistically significant violations (p < 0.05) for several predictors, including Gender, Activity, Age, and Level of Clothing, indicating that a standard PO model was mis-specified for this dataset. These violations suggest that the influence of key demographic and behavioral predictors on thermal sensation is not constant across levels of discomfort—a pattern consistent with prior evidence that different population groups experience indoor environments unequally.
To address this misspecification, a Partial Proportional Odds Model (PPOM) was developed [89]. This flexible approach maintains the PO assumption for predictors that meet it while relaxing it for those that do not. A pragmatic, mixed-constraints strategy was employed to arrive at a final, stable model. Predictors that violated the PO assumption were provisionally relaxed, allowing their effects to vary across outcome categories. However, if relaxing the assumption for a given predictor resulted in model instability or non-convergent estimates, that predictor was reverted to the more constrained proportional odds form. This iterative process, which balanced correct model specification with stability, led to a final, parsimonious PPOM in which the assumption was ultimately relaxed for Gender and Activity only. Allowing these predictors to vary across thresholds enabled the model to capture group-specific differences in how gender- and activity-related physiological and behavioral factors influence thermal sensation, revealing patterns that would not be visible under a proportional-odds-only specification. By adopting a PPOM rather than forcing a uniform effect, the analysis maintains sensitivity to demographic variation and avoids masking group-specific discomfort patterns that would be critical for equitable design recommendations. The model is specified in Equation (2).
where
logit(P(Y ≤ j)) = τj − (β1 Occupation + β2 Race + β3 Clothing
+ β4 Age + β5 Health + β6 Space Type + β7 Floor Level
+ γ1j Gender + γ2j Activity)
+ β4 Age + β5 Health + β6 Space Type + β7 Floor Level
+ γ1j Gender + γ2j Activity)
- is the threshold (cutpoint) separating adjacent thermal sensation categories;
- are the coefficients for predictors that satisfy the proportional odds assumption. These effects are constant across all thresholds ;
- are the coefficients for predictors that violate the proportional odds assumption. These effects vary across thresholds, allowing their influence to change depending on which part of the thermal scale is being considered.
Due to the model’s nonlinear nature, interaction effects cannot be interpreted directly from the coefficients. Instead, their actual impact must be evaluated on the more intuitive probability scale [90]. To accomplish this, a rigorous two-part inferential procedure was used to quantify and assess the significance of these effects [91].
First, Average Marginal Effects (AMEs) were calculated. The AME measures the average change in the predicted probability of an outcome for a one-unit change in a predictor. For example, an AME could indicate how much the predicted probability of reporting “Too cold” increases, on average, when a respondent’s clothing level shifts from “Light” to “Normal”. Using AMEs provides a clearer understanding of how demographic and behavioral variables influence comfort across groups. Second, the statistical significance of each interaction was formally assessed using a Test of Second Differences [91]. This test offers a robust evaluation by directly comparing the marginal effect of one variable across different levels of another (e.g., comparing the AME of clothing for males versus females). A significant Wald test on this difference provides a straightforward and interpretable assessment of the presence of a meaningful interaction on the probability scale. Testing interactions in this way ensures that conditional differences—such as disparities in adaptive capacity across age or gender—are properly quantified rather than assumed away by uniform effect structures. All statistical analyses were performed using R (version 4.5.0; R Core Team, Vienna, Austria), with the following packages: ordinal for the partial proportional odds model, mice for multiple imputation, caret for stratified cross-validation, and ggplot2 for visualization.
2.6. Model Validation and Diagnostics
The model’s generalizability and predictive performance were rigorously evaluated using a stratified 5-fold cross-validation procedure. Stratification ensures that each fold maintains the same proportional representation of the thermal sensation categories as the original dataset, which is crucial for handling imbalanced data [92]. This is especially important because minority thermal sensation categories—often reflecting groups with higher discomfort—must be adequately represented in each fold to avoid bias toward majority experiences. To avoid information leakage between training and testing and to obtain a fair estimate of performance, the full preprocessing workflow—including missing-data imputation and inverse-frequency class weighting—was run separately for each training split in the validation cycle. Running preprocessing independently within each fold further reduces the risk that patterns tied to specific demographic subgroups unintentionally influence out-of-sample estimates, thereby supporting an unbiased evaluation across diverse occupant profiles.
Model performance was summarized using the Quadratic Weighted Kappa, which is well-suited to ordered outcomes because it quantifies agreement between predicted and observed categories while penalizing larger mismatches more strongly [93,94]. This metric provides a more equitable performance assessment because it recognizes that misclassifying individuals at extreme discomfort levels (“Too cold” or “Too warm”) carries greater consequences than small errors closer to the neutral category. To quantify how well the pooled model aligns with the data overall, McFadden’s pseudo R2 was computed. Lastly, evidence for the main predictors and interaction terms retained in the final specification was assessed using the corresponding Wald tests. Evaluating these terms ensures that disparities or conditional effects—such as differences across gender or age groups—are statistically supported rather than assumed, reinforcing the validity of the inferences drawn from the model.
3. Results
The Partial Proportional Odds Model (PPOM) results demonstrated that thermal sensation is influenced by both significant main effects and several complex, yet meaningful, two-way interactions. The findings are presented in two sections. First, the main effects are discussed, detailing the individual impact of key demographic, behavioral, and situational factors on thermal sensation. Table 4 summarizes these quantitative findings, presenting the odds ratios and standard errors for each significant predictor. Second, the analysis examines the interaction effects, which reveal more nuanced relationships where the impact of one factor depends on the presence of another. The statistical significance of these conditional effects is formally established in Table 5 through a Test of Second Differences. These interactions highlight that certain predictors do not influence all occupants uniformly; instead, their effects vary across groups in ways that reflect underlying demographic or behavioral differences. To enrich understanding, Figure 3, Figure 4 and Figure 5 visualize these complex relationships by plotting the predicted probabilities for key subgroups, illustrating how the model offers a more detailed and equitable understanding of thermal perception compared to an analysis focused solely on main effects. By showing how specific groups—such as older adults or occupants differing in gender or clothing constraints—experience distinct shifts in thermal sensation probabilities, these visualizations make clear that discomfort is not evenly distributed across the population. Such subgroup-specific probability patterns illustrate disparities that would remain hidden without interaction modeling, reinforcing the need for occupant-centric and inclusive thermal comfort frameworks.
Table 4.
Significant Predictors of the Partial Proportional Ordinal Logistic Regression.
Table 5.
Significant second-difference contrasts for interaction effects.
Figure 3.
Predicted Probability of Thermal Comfort by Activity and Age.
Figure 4.
Predicted Probability of Thermal Comfort by Clothing level and gender.
Figure 5.
Predicted Probability of Thermal Comfort by Clothing Level and Age.
3.1. Main Effects
Based on the Partial Proportional Odds Model (PPOM), several factors were identified as significant predictors of thermal comfort. The analysis distinguished between variables with non-proportional effects and those with proportional effects that were consistent across all levels. The model revealed that the effects of Activity and Gender were non-proportional, varying across the thermal comfort scale. An increase in activity level was significantly associated with an increased likelihood of reporting a warmer thermal sensation, an effect that was more pronounced at the warmer end of the scale. Being male, compared to females, was also significantly associated with an increased likelihood of reporting “Too warm” versus all lower comfort categories, indicating the effect of gender was most prominent at the highest end of the thermal sensation scale. These non-uniform effects reflect the reality that demographic and behavioral characteristics do not influence thermal perception equally across all comfort states, underscoring the importance of modeling approaches that are sensitive to subgroup differences.
In addition to these non-proportional effects, several factors consistently influence all comfort levels. Among demographic variables, several race categories were significantly associated with an increased likelihood of reporting a warmer sensation when compared to the African American group, whereas an increase in the Age category was significantly associated with a decreased likelihood of feeling warmer. These findings point to systematic differences in thermal perception across demographic lines—differences that may stem from variations in physiology, cultural norms, clothing expectations, or adaptive constraints—highlighting the need for comfort models that move beyond universal assumptions.
Situational factors also played a significant role. Being a student or Staff member was significantly associated with a decreased likelihood of reporting a warmer sensation relative to the faculty, while being in a Public Space was associated with an increased likelihood of feeling warmer. These role- and space-based differences suggest that organizational position and spatial allocation—both of which can influence access to environmental controls or exposure to different thermal microclimates—may contribute to unequal comfort experiences across institutional groups. Finally, an increase in Floor level was significantly associated with a decreased likelihood of feeling warmer, and similarly, an increase in the Level of clothing was strongly associated with a decreased likelihood of reporting a warmer sensation. The consistency of these effects across the scale reinforces how behavioral and contextual constraints shape the thermal experience, often in ways that intersect with demographic differences.
Table 4 presents the significant predictors of thermal sensation identified through the Partial Proportional Odds Model. The results indicate that both behavioral and demographic factors shape the likelihood of occupants reporting warmer or cooler sensations, with several predictors revealing meaningful subgroup differences.
Higher activity levels were significantly associated with increased odds of reporting warmer sensations, particularly at the warmest threshold. Similarly, male occupants were substantially more likely to report “Too warm” compared to all lower categories, reinforcing gender-based differences in metabolic heat generation and thermal perception. These findings suggest that standard cooling strategies—especially aggressive summer cooling—may disproportionately overcool spaces for certain groups, leading to both inequitable discomfort and unnecessary energy expenditure.
Across race categories, Asian East/Southeast, Hispanic/Latino, Middle Eastern, White, and Other groups had significantly higher odds of reporting warmer sensations relative to the African American group. These differences highlight important cultural, physiological, or adaptive variations that conventional HVAC setpoints often ignore, which can result in both inequitable thermal experiences and inefficient energy use when spaces are cooled more than necessary for some groups’ comfort.
Occupational role also mattered: Staff and students were significantly less likely than faculty to report warmer sensations. Because faculty often occupy private offices with greater environmental control, while staff and students tend to work or study in more thermally variable shared spaces, these differences suggest role-based disparities in exposure to overcooled environments. Likewise, occupants in Public Spaces had significantly higher odds of feeling warm, consistent with the higher internal loads of these areas.
Environmental and behavioral factors also played a substantial role. Greater clothing insulation and higher floor levels were associated with decreased odds of reporting a warmer sensation, while increases in age were associated with a reduced likelihood of feeling warm. These results underscore that comfort is shaped not only by environmental conditions but also by adaptive capacity and physical mobility—factors that intersect with equity as well as energy efficiency. For example, older adults or individuals with clothing constraints may be more susceptible to overcooling, leading to both discomfort and wasted energy when buildings are cooled excessively to meet generalized standards.
Overall, the predictors in Table 4 reveal that thermal comfort is highly heterogeneous across demographic, behavioral, and situational lines. By recognizing these differences, building managers and designers can avoid universal cooling strategies—such as summer overcooling—that simultaneously produce inequitable discomfort and inefficiencies in energy consumption.
3.2. Interaction Effects
To investigate more complex relationships between predictors, the model was tested for two-way interaction effects. An interaction effect indicates that the influence of one variable on thermal comfort depends on the level of another. The statistical significance of these interactions was formally evaluated using the “Test of Second Differences”. This method involves measuring the effect of a predictor in one group (e.g., the effect of clothing for females), then measuring the same effect in a second group (e.g., the effect of clothing for males), and then statistically comparing the two groups. A significant p-value for this “second difference” confirms a meaningful interaction. Table 5 provides formal statistical validation for the interaction effects. This table provides quantitative evidence that these complex relationships are valid; the subsequent figures will visualize the patterns, making them easier to interpret. The table includes only the contrasts that were found to be statistically significant. Each contrast was evaluated using the “Test of Second Differences,” which begins with a null hypothesis. This null hypothesis assumes that there is no interaction between the variables. For instance, it may assume that the effect of changing clothing insulation is the same for two different demographic groups. The test then examines the data to determine whether this “no difference” assumption is valid. Since an interaction is marked as significant in Table 5, it indicates that the null hypothesis has been rejected.
This rejection is a key finding, providing strong statistical evidence that the effect differs between groups. Statistically, this means that the way probabilities are reallocated across the comfort categories is not parallel for the two groups. This indicates that demographic differences—such as gender or age—can condition the impact of behavioral or contextual factors, resulting in distinct patterns of thermal sensation across groups. These findings also intersect with energy-efficiency concerns: if groups differ meaningfully in their thermal responses, standard cooling strategies (such as aggressive overcooling in summer) may unnecessarily overcool some segments of the population while still failing to meet the needs of others. Thus, ignoring interaction effects not only masks inequities but can also lead to inefficient HVAC operation and excessive energy use.
This same reasoning applies to all other significant interactions shown in the table, where inclusion signifies that the null hypothesis was tested and rejected. By capturing these conditional relationships, the interaction analysis uncovers patterns that are critical not only for identifying demographic variability but also for reducing energy waste. When different groups respond differently to the same thermal conditions, uniform HVAC practices—such as aggressive overcooling in summer—can simultaneously create inequitable discomfort and unnecessary energy consumption. These statistically validated interactions, therefore, offer important guidance for developing thermal comfort strategies that more effectively address individual differences while also enhancing overall energy efficiency.
These contrasts demonstrate that thermal responses shift differently across age, gender, and clothing combinations—not in parallel patterns—confirming that comfort needs vary meaningfully across groups. This reinforces the importance of adaptive, occupant-centric HVAC strategies that avoid overcooling and instead calibrate environmental conditions to the diverse needs of building occupants. Figure 3 visualizes the significant and complex interaction between an occupant’s age category and their activity level.
As Figure 3 illustrates, the effect of activity on thermal sensation is strongly dependent on age. The probability distributions begin to diverge at the “Somewhat active” activity level. Here, adults aged 30–39 show a peak likelihood of feeling “Cold”, while the 40–49 group is most likely to feel “Too cold”. This interaction becomes most pronounced at the “Active” activity level, where the lines move in distinctly different directions. Adults aged 30–39 reorient toward a comfortable, warm thermal sensation, with “Comfortable” becoming their most probable sensation. In stark contrast, adults aged 50–59 show a strong shift toward a cold sensation, indicating much greater sensitivity to cold, even while active. The 40–49 age group remains predominantly cold-leaning, with a pattern similar to that of the 50–59 age group, though less extreme. This non-parallel movement across age groups confirms the interaction, demonstrating that activity has a distinct—and in some cases opposite—thermal effect depending on age. These findings indicate that older adults exhibit substantially higher cold sensitivity at comparable activity levels, implying that uniform cooling setpoints may be poorly aligned with their thermal comfort responses. Such age-based disparities also have energy implications—overcooling buildings in the summer not only increases discomfort for older occupants but also leads to unnecessary energy use when spaces are cooled beyond what many groups find comfortable.
Figure 4 illustrates the significant interaction between gender and clothing level, demonstrating how gender’s thermal perception is contingent upon the level of clothing. The probability patterns show that changes in clothing insulation do not influence men and women in parallel, indicating that clothing-related adaptive opportunities differ between genders. This is especially relevant because clothing flexibility is shaped by cultural norms, workplace expectations, and social constraints, which can limit women’s ability to adapt in overcooled environments.
The interaction in Figure 4 is most evident when observing the “crossover effect” as one moves from light to normal clothing. In “Light clothing”, the two groups show different peaks. Males are most likely to feel “Warm” or “Too warm”. Females, by contrast, are most likely to feel “Comfortable” and also report higher probabilities of feeling “Too cold” or “Cold” than males. In “Normal” clothing, these patterns shift in opposite directions. Males transition toward cooler sensations, with “Comfortable” becoming their most probable category—a shift downward from their earlier “Warm” peak. Females, however, shift toward even colder sensations, with “Cold” becoming their single most probable outcome. This divergence shows that the same clothing adjustment can produce opposite thermal effects across genders—a clear example of how one-size-fits-all cooling strategies fail to account for demographic variability. In “Heavy clothing”, the interaction is no longer significant. Both genders exhibit a similar pattern, with “Too cold” being the most probable sensation for both groups, as expected. This interaction has direct energy-efficiency implications. When indoor spaces are aggressively overcooled—especially during summer—women, who already show greater cold sensitivity at lighter clothing levels, are disproportionately uncomfortable. Meanwhile, the building consumes more energy than necessary to maintain temperatures that are unsuitable for many occupants. Recognizing gender-clothing interactions therefore supports HVAC strategies that reduce overcooling, improve thermal comfort, and enhance energy efficiency simultaneously.
Figure 5 focuses on the significant interaction between age and clothing level, specifically comparing the 30–39 and 50–59 age groups, as this pair showed a significant difference in the second difference test.
This figure demonstrates a powerful and complex interaction. The most dramatic interaction is in “Light clothing”. The two groups are in complete opposition: adults aged 30–39 exhibit their highest probability at “Too warm”, while adults aged 50–59 are, in complete contrast, overwhelmingly most likely to report “Too cold”. This polarity highlights substantial age-related differences in thermal sensitivity under minimal insulation, suggesting that older adults may experience significantly greater cold vulnerability in lightly clothed indoor conditions. This extreme difference nearly vanishes in “Normal clothing”. Here, both groups converge on a similar pattern, with both peaking at “Cold”. This narrowing gap indicates that even small increases in clothing insulation moderate age-based differences, effectively reducing the disparity. In “Heavy clothing”, both groups shift further toward cold, with the 30–39 age group now showing an even higher probability of feeling “Too cold” than the 50–59 age group. This reversal underscores that thermal responses vary across age groups in non-parallel ways, reinforcing the significance of the interaction. This pattern, showing a complete reversal of thermal sensation in light clothing that disappears in normal clothing, strongly validates the interaction between age and clothing level. These results reveal that older adults (50–59) face disproportionately higher cold sensitivity in minimally insulated indoor conditions. From an energy-efficiency standpoint, the findings emphasize that overcooling buildings in summer exacerbates age-related discomfort: younger adults may feel warm or comfortable in lightly cooled spaces, while older adults are pushed toward extreme cold sensations. This misalignment results in both inequitable comfort outcomes and unnecessary energy use.
Thus, Figure 5 provides compelling evidence that uniform cooling strategies fail to accommodate age-related differences in thermal physiology—an insight that is critical for designing equitable and energy-efficient HVAC operations.
3.3. Model Validation and Baseline Comparison
Based on the analysis, a Partial Proportional Odds Model was developed to identify significant predictors of thermal comfort. The model demonstrated a fair predictive agreement (Quadratic Kappa = 0.315) and a consistent fit across imputed datasets (McFadden’s R2 = 0.154), identifying significant main effects for age, gender, race, occupation, and clothing. More importantly, the analysis revealed several significant two-way interactions, indicating that the influence of certain variables was conditional upon others. The effect of physical activity was strongly modulated by age, with different age cohorts exhibiting divergent and non-monotonic response patterns. Furthermore, the effect of clothing level was found to be conditional upon both age and gender. These findings underscore the need to account for interaction effects to accurately model the complex determinants of human thermal sensation. By capturing these non-parallel responses across demographic groups, the model provides insight into inequities in thermal experience that are obscured in simpler models.
This has important energy-efficiency implications as well. If HVAC systems are calibrated to meet the thermal needs of only a subset of occupants—often younger, more active individuals or those with greater clothing adaptability—buildings risk being overcooled, particularly in summer. Such overcooling not only increases energy consumption but also disproportionately affects older adults, women, and other groups who exhibit greater cold sensitivity in the model. Thus, the PPOM does more than improve predictive accuracy; it reveals how demographic and behavioral differences shape comfort in ways that matter both for equity and efficient building operation. Table 6 summarizes the model’s performance under 5-fold cross-validation.
Table 6.
Comparison metrics (5-fold cross-validation).
It shows that the model achieves stable predictive agreement and a reasonable level of explained variation, given the complexity of human thermal response data. These validation results confirm that the model generalizes well across occupant subgroups, supporting the reliability of the inferences drawn from the PPOM and strengthening its usefulness for identifying comfort patterns with implications for both occupant needs and energy efficiency.
4. Discussion
The findings of this study demonstrate that thermal comfort is not a monolithic experience but rather a complex outcome shaped by significant interactions between demographic, behavioral, and environmental factors. By employing a partial proportional odds model, the study moves beyond the limitations of main effects to reveal nuanced relationships that are often obscured in population-level assessments. These results underscore the need to develop more inclusive, occupant-centric models to engineer building environments that are both equitable and energy-efficient. Such models are especially critical in addressing the consequences of standardized HVAC strategies that disproportionately serve a narrow demographic profile while driving unnecessary energy consumption.
4.1. Interpretation of Key Findings
A central and statistically significant finding is that the effects of activity and clothing on thermal sensation are strongly modulated by age. The conventional view that older adults generally feel colder is an oversimplification; our results show that this effect is highly contextual. The most notable interaction occurred between age and clothing level: in light clothing, respondents aged 30–39 tended to report “Too warm,” whereas those aged 50–59 tended to report “Too cold”. However, both groups converged toward similar comfort states when wearing normal business attire. This divergence highlights the heightened vulnerability of older adults to cold stress under minimal insulation, consistent with physiological evidence of age-related declines in metabolic rate and changes in peripheral circulation [95]. These findings also reveal an inequitable pattern: under identical thermal conditions, older adults experience systematically greater cold sensitivity, suggesting that standardized cooling practices may unintentionally disadvantage them.
The age-by-activity interaction similarly indicates that the thermal benefits of physical activity are not uniform across age groups. Therefore, building control strategies that assume a single metabolic adjustment for a given activity may fail to ensure comfort for a demographically diverse population. This misalignment can lead to overcooling during summer months, where younger and more active occupants may remain comfortable or warm, while older occupants are pushed further into discomfort—resulting in both inequitable outcomes and inefficient HVAC operation.
Our analysis also provides a more nuanced understanding of gender-related differences in thermal comfort, revealing a statistically significant interaction between gender and clothing level. This challenges the simple idea that women always prefer warmer environments. We found that while men are more likely to feel warm in light clothing, this difference lessens and even reverses as clothing insulation increases to normal levels, at which point women report feeling “Cold” more often. This observed “crossover effect” suggests that clothing insulation plays a key mediating role. Physiological differences, such as lower average metabolic rates in women, may be most influential at low insulation levels [24]. However, as clothing insulation becomes a greater factor in thermal balance, behavioral adaptation appears to balance the comfort outcomes. This aligns with research by Jowkar et al. [96], who also found that gender differences in thermal perception depend heavily on environmental context and clothing. Similarly, Maykot et al. [97] concluded that gender differences observed in field studies are likely attributable to behavioral dissimilarities, such as clothing choice. Our model provides strong empirical evidence in support of this conclusion. The significance of our gender and clothing interaction term demonstrates that it is not gender alone, but rather the interplay between gender and adaptive behaviors, such as clothing choice, that drives thermal perception. From an energy-efficiency perspective, this indicates that summertime overcooling wastes energy while creating discomfort for large segments of the population whose physiological and behavioral needs differ from the assumed “average” occupant.
Furthermore, race or ethnicity’s statistically significant main effect on thermal sensation reinforces the need for comfort models that account for socio-cultural diversity. Our finding that several ethnic groups reported a higher likelihood of feeling warmer compared to African Americans supports a growing body of literature indicating that thermal perception is not universal. These differences may stem from a combination of long-term physiological acclimatization to different native climates and culturally ingrained expectations or behaviors related to the thermal environment [33]. Failing to account for such socio-cultural variation risks embedding systemic thermal inequity into building operations, where standard temperature setpoints consistently fail to satisfy certain demographic groups. These inequities also have energy implications: buildings may be excessively cooled to satisfy only a portion of the population, leading to higher energy consumption while still failing to provide comfort inclusively.
4.2. Implications for Building Design, Operation, and Standards
The collective findings of this study have significant practical implications for the design, operation, and management of indoor environments. The clear evidence of occupant diversity challenges the effectiveness of a single, fixed thermostat setpoint for shared spaces. The results strongly support the adoption of zonal control systems or, ideally, personalized comfort systems (PCS) that enable individuals to adjust their local environment and better accommodate the diverse and dynamic needs revealed in our interaction models [19]. Such systems not only enhance thermal comfort but also reduce reliance on broad, energy-intensive cooling strategies that often overcool entire zones to satisfy only a subset of occupants.
Occupant-centric control is paramount for HVAC control strategies. The results suggest that advanced HVAC control algorithms should move beyond reacting to simple environmental inputs and instead incorporate predictive models that account for occupant diversity. Integrating real-time, non-invasive occupant feedback could further refine these strategies, moving from reactive to proactive comfort management [98]. This shift enables building systems to adapt to diverse needs—including age, gender, and clothing-related differences—thereby minimizing situations where the HVAC system is simultaneously wasting energy and creating comfort inequities.
Critical to this approach is the non-invasive nature of collecting occupant feedback. Recent research, for instance, has demonstrated the effectiveness of combining periodic subjective comfort ratings with real-time environmental sensor data. This method enables an unobtrusive user experience that supports continuous model calibration, allowing control algorithms to remain sensitive to real-world variability and to efficiently manage the trade-off between comfort and energy [99]. This continuous calibration helps prevent static setpoints that can lead to chronic overcooling—one of the most common and energy-wasting building operation issues—while simultaneously improving comfort outcomes for groups who are more vulnerable to cold stress.
Ultimately, our findings suggest that foundational standards, such as ASHRAE 55 [82], could be enhanced by more explicitly addressing documented interaction effects. While the adaptive comfort model was a significant step forward, this research indicates that a further evolution toward group-specific or personalized models is necessary to create truly inclusive standards [100]. Incorporating interaction-aware guidance into standards would help ensure that building design and operation do not systematically disadvantage particular demographic groups—or waste energy by conditioning spaces beyond what most occupants require for comfort.
5. Conclusions
This research addressed the persistent challenge of ensuring equitable thermal comfort in buildings, particularly where conventional, uniform environmental control strategies prove inadequate for diverse occupant populations. In response, this study investigated the inferential relationship between behavior and thermal comfort within a university setting in North Texas, rather than developing a fully generalized model. Utilizing data from a web-based survey of 366 participants, the research aimed to elucidate these relationships within a context where diverse daily routines, clothing patterns, and activity levels generate meaningful variation in thermal experience. By scrutinizing these inferential links, the study endeavored to identify which behavioral factors most strongly predict thermal sensation and determine how these effects diverge across demographic groups. These insights establish a foundation for occupant-centric control strategies that transcend traditional approaches. The analytical framework employed a robust ordinal logistic regression, specifically a partial proportional odds model, methodologically optimized using inverse-frequency weighting to address the significant class imbalance in the outcome variable.
The principal conclusion of this study is that conventional, population-average thermal comfort models are insufficient for capturing the heterogeneity of occupant experience. The statistically significant interaction effects identified provide quantitative evidence that a uniform approach to indoor environmental control is fundamentally inequitable, as it fails to account for the varying responses of different subgroups to thermal conditions. Notably, male occupants were over three times more likely to report feeling too warm (OR = 3.24), older adults showed significantly lower odds of reporting warmth (OR = 0.42), and substantial variation was observed across racial and ethnic groups (ORs ranging from 2.4 to 6.5). This inequity is not only a human comfort issue but also an operational one: HVAC systems calibrated to satisfy a narrow segment of the population often lead to systemic overcooling, wasting energy while still leaving many occupants uncomfortable. These findings make a compelling case for adopting occupant-centric design and control strategies. By integrating advanced models that account for demographic diversity and contextual interactions, engineers and building managers can create more inclusive, comfortable, and energy-efficient indoor environments. Importantly, these insights directly support the development of low-energy buildings by enabling more precise and adaptive control that reduces unnecessary cooling loads. They also strengthen the foundation for grid-responsive building operation, where HVAC flexibility can support load shifting and other smart-energy-system functions integral to low-carbon grid systems. Taken together, this research demonstrates how occupant-centric thermal comfort modeling can enable energy-efficient and sustainable interventions across multiple scales, from individual buildings to the broader power grid.
Despite this study’s contributions, its limitations must be recognized. The data represent a single-time observation per occupant, which prevents examining seasonal variation and adaptation over time. Furthermore, key variables such as clothing and activity were self-reported and thus subject to individual interpretation. Additionally, objective indoor environmental parameters—such as air temperature, relative humidity, and air velocity—were not directly measured at the space level during data collection. While all surveyed buildings operate under centralized HVAC systems with institutionally defined thermal setpoints, unmeasured room-level or temporal variations may still partially influence reported thermal sensations. In the present study, emphasis was placed on achieving broader spatial and occupant coverage, a methodological trade-off that necessarily limits the extent of instrumented environmental monitoring but allows richer insight into occupant-centered comfort variation in real-world institutional settings. Future studies incorporating concurrent environmental monitoring would enable more precise disentanglement of contextual environmental conditions and individual-level drivers of thermal perception. Finally, the investigation was conducted within a single geographic region, which may limit the direct transferability of the findings to other climatic contexts, though the observed relationships between thermal sensation and occupant factors offer insights applicable to similar institutional settings.
Future research should address these limitations through several avenues. Longitudinal studies are necessary to track individuals across different seasons and quantify the effects of acclimatization. Extending this research to diverse building types, such as commercial offices and hospitals, would enhance the generalizability of the findings. Additionally, integrating real-time occupant feedback with building energy monitoring could help quantify how equitable comfort strategies simultaneously reduce energy waste—particularly by preventing chronic overcooling in summer conditions. Such future work will further clarify how occupant-centric comfort models can be embedded into demand-response programs and grid-building energy system integration, enabling buildings to operate as active, flexible participants in low-carbon grid systems. Ultimately, pursuing these avenues will help bridge the gap between building energy performance and the individual, equitable comfort of all occupants.
Author Contributions
Methodology, A.M. and M.S.; Formal analysis, A.M., K.K. and S.A.; Writing—review & editing, A.M., K.K., M.S. and S.A.; Supervision, A.M. and M.S.; Project administration, A.M.; Funding acquisition, A.M. All authors have read and agreed to the published version of the manuscript.
Funding
This research was funded by the University of Texas at Arlington grant number REP 314181.
Institutional Review Board Statement
The study was conducted in accordance with the Declaration of Helsinki, and the protocol was approved by the Ethics Committee of The University of Texas at Arlington (2022-0309.1) on 17 November 2022.
Informed Consent Statement
Informed consent was obtained from all subjects involved in the study.
Data Availability Statement
The data presented in this study are available on request from the corresponding author. The data are not publicly available due to privacy or ethical restrictions.
Acknowledgments
The authors gratefully acknowledge the financial support provided by the University of Texas at Arlington through the Research Enhancement Program (REP) grant. This funding played a central role in enabling the development, execution, and completion of this research. The resources made available through the REP supported data collection, analysis, and dissemination efforts and contributed substantially to the overall advancement of the project.
Conflicts of Interest
The authors declare no conflict of interest.
Nomenclature
| Abbreviations | |
| AME | Average Marginal Effect |
| ASHRAE | American Society of Heating, Refrigerating and Air-Conditioning Engineers |
| CLO | Clothing insulation unit |
| EIA | U.S. Energy Information Administration |
| EPA | U.S. Environmental Protection Agency |
| HVAC | Heating, Ventilation, and Air Conditioning |
| IEQ | Indoor Environmental Quality |
| ITPSCM | Indoor Temperature Preference Setting Control Method |
| LEED | Leadership in Energy and Environmental Design |
| MET | Metabolic Equivalent of Task |
| OR | Odds Ratio |
| PCM | Personal Comfort Model |
| PCS | Personal Comfort System |
| PMV | Predicted Mean Vote |
| PO | Proportional Odds |
| PPD | Predicted Percentage of Dissatisfied |
| PPOM | Partial Proportional Odds Model |
| SMOTE | Synthetic Minority Over-sampling Technique |
| TMST | Thermosensory Mean Skin Temperature |
| TSV | Thermal Sensation Vote |
| UTA | University of Texas at Arlington |
| Symbols | |
| τj | Threshold (cutpoint) separating adjacent thermal sensation categories j |
| βk | Regression coefficient for predictors satisfying the proportional odds assumption (constant across thresholds) |
| γmj | Regression coefficient for predictors violating the proportional odds assumption (varies across thresholds j) |
| j | Index for thermal sensation category threshold |
| Y | Ordinal outcome variable (thermal sensation) |
| P(Y ≤ j) | Cumulative probability of thermal sensation being at or below category j |
| Wc | Inverse-frequency weight assigned to observation in class c |
| Nc | Number of observations in class c |
| Ntotal | Total number of observations in the dataset |
References
- EPA. Indoor Air Quality. 2026. Available online: https://www.epa.gov/report-environment/indoor-air-quality#note1 (accessed on 17 January 2026).
- Kwon, S.-H.; Chun, C.; Kwak, R.-Y. Relationship between quality of building maintenance management services for indoor environmental quality and occupant satisfaction. Build. Environ. 2011, 46, 2179–2185. [Google Scholar] [CrossRef] [Scilit]
- Magzamen, S.; Mayer, A.P.; Barr, S.; Bohren, L.; Dunbar, B.; Manning, D.; Reynolds, S.J.; Schaeffer, J.W.; Suter, J.; Cross, J.E. A Multidisciplinary Research Framework on Green Schools: Infrastructure, Social Environment, Occupant Health, and Performance. J. Sch. Health 2017, 87, 376–387. [Google Scholar] [CrossRef] [Scilit]
- Mujan, I.; Anđelković, A.S.; Munćan, V.; Kljajić, M.; Ružić, D. Influence of indoor environmental quality on human health and productivity—A review. J. Clean. Prod. 2019, 217, 646–657. [Google Scholar] [CrossRef] [Scilit]
- Almeida, R.; Georgieva, P.; Martins, N. Heating setpoint recommendation strategy for thermal comfort and energy consumption. Energy Build. 2023, 296, 113406. [Google Scholar] [CrossRef] [Scilit]
- EIA. Use of Energy in Explained—U.S. Energy Information Administration (EIA). 2024. Available online: https://www.eia.gov/energyexplained/use-of-energy/ (accessed on 3 February 2026).
- Ribeiro, L.M.L.; Scolaro, T.P.; Ghisi, E. LEED Certification in Building Energy Efficiency: A Review of Its Performance Efficacy and Global Applicability. Sustainability 2025, 17, 1876. [Google Scholar] [CrossRef] [Scilit]
- Kocaman, E.; Kuru, M.; Calis, G. Do Thermal Comfort Standards Ensure Occupant Satisfaction? Learning from Occupants’ Thermal Complaints. Proc. Creat. Constr. Conf. 2019, 2019, 682–687. [Google Scholar] [CrossRef] [Scilit]
- Jazizadeh, F.; Kavulya, G.; Klein, L.; Becerik-Gerber, B. Continuous Sensing of Occupant Perception of Indoor Ambient Factors. In Computing in Civil Engineering; ASCE: Reston, VA, USA, 2012; pp. 161–168. [Google Scholar] [CrossRef] [Scilit]
- Frontczak, M.; Wargocki, P. Literature survey on how different factors influence human comfort in indoor environments. Build. Environ. 2011, 46, 922–937. [Google Scholar] [CrossRef] [Scilit]
- Humphreys, M.A.; Nicol, J.F. Self-Assessed Productivity and the Office Environment: Monthly Surveys in Five European Countries. ASHRAE Trans. 2007, 113, 606–616. [Google Scholar]
- Kaushik, A.; Arif, M.; Tumula, P.; Ebohon, O.J. Effect of thermal comfort on occupant productivity in office buildings: Response surface analysis. Build. Environ. 2020, 180, 107021. [Google Scholar] [CrossRef] [Scilit]
- Lan, L.; Lian, Z.; Pan, L. The effects of air temperature on office workers’ well-being, workload and productivity-evaluated with subjective ratings. Appl. Ergon. 2010, 42, 29–36. [Google Scholar] [CrossRef] [Scilit]
- Lan, L.; Tang, J.; Wargocki, P.; Wyon, D.P.; Lian, Z. Cognitive performance was reduced by higher air temperature even when thermal comfort was maintained over the 24–28 °C range. Indoor Air 2022, 32, e12916. [Google Scholar] [CrossRef] [Scilit]
- Wang, C.; Zhang, F.; Wang, J.; Doyle, J.K.; Hancock, P.A.; Mak, C.M.; Liu, S. How indoor environmental quality affects occupants’ cognitive functions: A systematic review. Build. Environ. 2021, 193, 107647. [Google Scholar] [CrossRef] [Scilit]
- Hygge, S.; Knez, I. Effects of noise, heat and indoor lighting on cognitive performance and self-reported affect. J. Environ. Psychol. 2001, 21, 291–299. [Google Scholar] [CrossRef] [Scilit]
- Ormandy, D.; Ezratty, V. Health and thermal comfort: From WHO guidance to housing strategies. Energy Policy 2012, 49, 116–121. [Google Scholar] [CrossRef] [Scilit]
- Xiong, J.; Lian, Z.; Zhou, X.; You, J.; Lin, Y. Effects of temperature steps on human health and thermal comfort. Build. Environ. 2015, 94, 144–154. [Google Scholar] [CrossRef] [Scilit]
- Mansor, R.; Low, S.-T.; Choong, W.-W. The effects of personal control and perceived thermal comfort on occupant psychological health at the workplace. Archit. Sci. Rev. 2024, 68, 94–106. [Google Scholar] [CrossRef] [Scilit]
- Rus, T.; Cruciat, G.; Nemeti, G.; Mare, R.; Muresan, D. Thermal comfort in maternity wards: Summer vs. winter conditions. J. Build. Eng. 2022, 51, 104356. [Google Scholar] [CrossRef] [Scilit]
- Yuan, F.; Yao, R.; Sadrizadeh, S.; Li, B.; Cao, G.; Zhang, S.; Zhou, S.; Liu, H.; Bogdan, A.; Croitoru, C.; et al. Thermal comfort in hospital buildings—A literature review. J. Build. Eng. 2022, 45, 103463. [Google Scholar] [CrossRef] [Scilit]
- Zhao, Q.; Lian, Z.; Lai, D. Thermal comfort models and their developments: A review. Energy Built Environ. 2021, 2, 21–33. [Google Scholar] [CrossRef] [Scilit]
- Lan, L.; Lian, Z.; Liu, W.; Liu, Y. Investigation of gender difference in thermal comfort for Chinese people. Eur. J. Appl. Physiol. 2008, 102, 471–480. [Google Scholar] [CrossRef] [Scilit]
- Lyu, J.; Shi, Y.; Du, H.; Lian, Z. Sex-based thermal comfort zones and energy savings in spaces with joint operation of air conditioner and fan. Build. Environ. 2023, 246, 111002. [Google Scholar] [CrossRef] [Scilit]
- Indraganti, M.; Humphreys, M.A. A comparative study of gender differences in thermal comfort and environmental satisfaction in air-conditioned offices in Qatar, India, and Japan. Build. Environ. 2021, 206, 108297. [Google Scholar] [CrossRef] [Scilit]
- Karjalainen, S. Thermal comfort and gender: A literature review. Indoor Air 2012, 22, 96–109. [Google Scholar] [CrossRef] [Scilit] [PubMed]
- Kim, J.; de Dear, R.; Cândido, C.; Zhang, H.; Arens, E. Gender differences in office occupant perception of indoor environmental quality (IEQ). Build. Environ. 2013, 70, 245–256. [Google Scholar] [CrossRef] [Scilit]
- Schellen, L.; Loomans, M.G.L.C.; de Wit, M.H.; Olesen, B.W.; van Marken Lichtenbelt, W.D. The influence of local effects on thermal sensation under non-uniform environmental conditions—Gender differences in thermophysiology, thermal comfort and productivity during convective and radiant cooling. Physiol. Behav. 2012, 107, 252–261. [Google Scholar] [CrossRef] [Scilit] [PubMed]
- Xiong, J.; Carter, S.; Jay, O.; Arens, E.; Zhang, H.; Deuble, M.; de Dear, R. A sex/age anomaly in thermal comfort observed in an office worker field study: A menopausal effect? Int. J. Indoor Environ. Health 2021, 32, e12926. [Google Scholar] [CrossRef] [Scilit] [PubMed]
- Giamalaki, M.; Kolokotsa, D. Understanding the thermal experience of elderly people in their residences: Study on thermal comfort and adaptive behaviors of senior citizens in Crete, Greece. Energy Build. 2019, 185, 76–87. [Google Scholar] [CrossRef] [Scilit]
- Yang, J.; Nam, I.; Sohn, J.-R. The influence of seasonal characteristics in elderly thermal comfort in Korea. Energy Build. 2016, 128, 583–591. [Google Scholar] [CrossRef] [Scilit]
- Li, P.; Dai, P.; Cao, D.; Liu, B.; Lu, Y. Non-intrusive comfort sensing: Detecting age and gender from infrared images for personal thermal comfort. Build. Environ. 2022, 219, 109256. [Google Scholar] [CrossRef] [Scilit]
- Naheed, S.; Shooshtarian, S. A Review of Cultural Background and Thermal Perceptions in Urban Environments. Sustainability 2021, 13, 9080. [Google Scholar] [CrossRef] [Scilit]
- Hansen, A.; Bi, L.; Saniotis, A.; Nitschke, M. Vulnerability to extreme heat and climate change: Is ethnicity a factor? Glob. Health Action 2013, 6, 21364. [Google Scholar] [CrossRef] [Scilit]
- Yardley, J.; Sigal, R.J.; Kenny, G.P. Heat health planning: The importance of social and community factors. Glob. Environ. Change 2011, 21, 670–679. [Google Scholar] [CrossRef] [Scilit]
- Hansen, A.; Bi, P.; Nitschke, M.; Pisaniello, D.; Newbury, J.; Kitson, A. Perceptions of Heat-Susceptibility in Older Persons: Barriers to Adaptation. Int. J. Environ. Res. Public Health 2011, 8, 4714–4728. [Google Scholar] [CrossRef] [Scilit] [PubMed]
- Zhang, Y.; Nitschke, M.; Bi, P. Risk factors for direct heat-related hospitalization during the 2009 Adelaide heatwave: A case crossover study. Sci. Total Environ. 2013, 442, 1–5. [Google Scholar] [CrossRef] [Scilit] [PubMed]
- Havenith, G.; Griggs, K.; Qiu, Y.; Dorman, L.; Kulasekaran, V.; Hodder, S. Higher comfort temperature preferences for anthropometrically matched Chinese and Japanese versus white-western-middle-European individuals using a personal comfort/cooling system. Build. Environ. 2020, 183, 107162. [Google Scholar] [CrossRef] [Scilit]
- Nakano, J.; Tanabe, S.; Kimura, K. Differences in perception of indoor environment between Japanese and non-Japanese workers. Energy Build. 2002, 34, 615–621. [Google Scholar] [CrossRef] [Scilit]
- Al-Absi, Z.A.; Hafizal, M.I.M.; Abas, N.F.; Baharum, F. A Comparison in Perception of Local and Foreign Residents to Thermal Comfort in Naturally Conditioned Residential Buildings. J. Adv. Res. Fluid Mech. Therm. Sci. 2022, 100, 78–91. [Google Scholar] [CrossRef] [Scilit]
- Fanger, P.O. Thermal Comfort: Analysis and Applications in Environmental Engineering; McGraw-Hill: New York, NY, USA, 1970. [Google Scholar]
- Fanger, P.O. Thermal environment—Human requirements. Environmentalist 1986, 6, 275–278. [Google Scholar] [CrossRef] [Scilit]
- Nicol, J.F.; Humphreys, M.A. Adaptive thermal comfort and sustainable thermal standards for buildings. Energy Build. 2002, 34, 563–572. [Google Scholar] [CrossRef] [Scilit]
- Erickson, V.; Cerpa, A. Thermovote: Participatory sensing for efficient building HVAC conditioning. In Proceedings of the Fourth ACM Workshop on Embedded Sensing Systems for Energy-Efficiency in Buildings; Association for Computing Machinery: New York, NY, USA, 2012; pp. 9–16. [Google Scholar] [CrossRef] [Scilit]
- Feldmeier, M.; Paradiso, J.A. Personalized HVAC control system. In Proceedings of the 2010 Internet of Things (IOT), Tokyo, Japan, 29 November–1 December 2010; pp. 1–8. [Google Scholar] [CrossRef] [Scilit]
- Murakami, Y.; Terano, M.; Mizutani, K.; Harada, M.; Kuno, S. Field experiments on energy consumption and thermal comfort in the office environment controlled by occupants’ requirements from PC terminal. Build. Environ. 2007, 42, 4022–4027. [Google Scholar] [CrossRef] [Scilit]
- Xie, J.; Li, H.; Li, C.; Zhang, J.; Luo, M. Review on occupant-centric thermal comfort sensing, predicting, and controlling. Energy Build. 2020, 226, 110392. [Google Scholar] [CrossRef] [Scilit]
- Jazizadeh, F.; Ghahramani, A.; Becerik-Gerber, B.; Kichkaylo, T.; Orosz, M. Human-Building Interaction Framework for Personalized Thermal Comfort-Driven Systems in Office Buildings. J. Comput. Civ. Eng. 2014, 28, 2–16. [Google Scholar] [CrossRef] [Scilit]
- Gupta, S.K.; Kar, K. Human-in-the-Loop Thermal Management for Smart Buildings. In Intelligent Building Control Systems: A Survey of Modern Building Control and Sensing Strategies; Wen, J.T., Mishra, S., Eds.; Springer International Publishing: Cham, Switzerland, 2018; pp. 191–217. [Google Scholar] [CrossRef] [Scilit]
- Ghahramani, A.; Jazizadeh, F.; Becerik-Gerber, B. A knowledge based approach for selecting energy-aware and comfort-driven HVAC temperature set points. Energy Build. 2014, 85, 536–548. [Google Scholar] [CrossRef] [Scilit]
- Kim, J.; Schiavon, S.; Brager, G. Personal comfort models—A new paradigm in thermal comfort for occupant-centric environmental control. Build. Environ. 2018, 132, 114–124. [Google Scholar] [CrossRef] [Scilit]
- Li, W.; Zhao, Y.; Zhang, J.; Jiang, C.; Chen, S.; Lin, L.; Wang, Y. Indoor temperature preference setting control method for thermal comfort and energy saving based on reinforcement learning. J. Build. Eng. 2023, 73, 106805. [Google Scholar] [CrossRef] [Scilit]
- Zhang, H.; Tzempelikos, A.; Liu, X.; Lee, S.; Cappelletti, F.; Gasparella, A. The impact of personal preference-based thermal control on energy use and thermal comfort: Field implementation. Energy Build. 2023, 284, 112848. [Google Scholar] [CrossRef] [Scilit]
- Martins, L.; Soebarto, V.; Williamson, T. A systematic review of personal thermal comfort models. Build. Environ. 2022, 207, 108502. [Google Scholar] [CrossRef] [Scilit]
- Lee, S.; Karava, P.; Tzempelikos, A.; Bilionis, I. A smart and less intrusive feedback request algorithm towards human-centered HVAC operation. Build. Environ. 2020, 184, 107190. [Google Scholar] [CrossRef] [Scilit]
- Naylor, S.; Gillott, M.; Lau, T. A review of occupant-centric building control strategies to reduce building energy use. Renew. Sustain. Energy Rev. 2018, 96, 1–10. [Google Scholar] [CrossRef] [Scilit]
- Li, D.; Menassa, C.C.; Kamat, V.R. Personalized human comfort in indoor building environments under diverse conditioning modes. Build. Environ. 2017, 126, 304–317. [Google Scholar] [CrossRef] [Scilit]
- Jung, W.; Jazizadeh, F.; Diller, T.E. Heat Flux Sensing for Machine-Learning-Based Personal Thermal Comfort Modeling. Sensors 2019, 19, 3691. [Google Scholar] [CrossRef] [Scilit]
- Liu, S.; Schiavon, S.; Das, H.P.; Jin, M.; Spanos, C.J. Personal thermal comfort models with wearable sensors. Build. Environ. 2019, 162, 106281. [Google Scholar] [CrossRef] [Scilit]
- Pazhoohesh, M.; Zhang, C. A satisfaction-range approach for achieving thermal comfort level in a shared office. Build. Environ. 2018, 142, 312–326. [Google Scholar] [CrossRef] [Scilit]
- Fay, D.; O’Toole, L.; Brown, K.N. Gaussian Process models for ubiquitous user comfort preference sampling; global priors, active sampling and outlier rejection. Pervasive Mob. Comput. 2017, 39, 135–158. [Google Scholar] [CrossRef] [Scilit]
- Lee, J.; Ham, Y. Physiological sensing-driven personal thermal comfort modelling in consideration of human activity variations. Build. Res. Inf. 2021, 49, 512–524. [Google Scholar] [CrossRef] [Scilit]
- Liu, W.; Lian, Z.; Zhao, B. A neural network evaluation model for individual thermal comfort. Energy Build. 2007, 39, 1115–1122. [Google Scholar] [CrossRef] [Scilit]
- Sim, S.Y.; Koh, M.J.; Joo, K.M.; Noh, S.; Park, S.; Kim, Y.H.; Park, K.S. Estimation of Thermal Sensation Based on Wrist Skin Temperatures. Sensors 2016, 16, 420. [Google Scholar] [CrossRef] [Scilit] [PubMed]
- Kong, M.; Dong, B.; Zhang, R.; O’Neill, Z. HVAC energy savings, thermal comfort and air quality for occupant-centric control through a side-by-side experimental study. Appl. Energy 2022, 306, 117987. [Google Scholar] [CrossRef] [Scilit]
- Kolokotsa, D.; Saridakis, G.; Pouliezos, A.; Stavrakakis, G.S. Design and installation of an advanced EIBTM fuzzy indoor comfort controller using Matlab™. Energy Build. 2006, 38, 1084–1092. [Google Scholar] [CrossRef] [Scilit]
- Zhao, J.; Lam, K.P.; Ydstie, B.E.; Loftness, V. Occupant-oriented mixed-mode EnergyPlus predictive control simulation. Energy Build. 2016, 117, 362–371. [Google Scholar] [CrossRef] [Scilit]
- Chen, H.; Chou, P.; Duri, S.; Lei, H.; Reason, J. The Design and Implementation of a Smart Building Control System. In Proceedings of the 2009 IEEE International Conference on E-Business Engineering, Macau, China, 21–23 October 2009; pp. 255–262. [Google Scholar] [CrossRef] [Scilit]
- Yeh, L.-W.; Lu, C.-H.; Kou, W.-C.; Tseng, Y.-C.; Yi, C.-W.; Liu, R.-C.; Tsai, M.-H. iPower: An energy conservation system for intelligent buildings by wireless sensor networks. Int. J. Sens. Netw. 2009, 5, 1–10. [Google Scholar] [CrossRef] [Scilit]
- Vissers, D.; Zeiler, W. The user as sensor to reach for optimal individual comfort and reduced energy consumption. Undefined. 2012. Available online: https://www.semanticscholar.org/paper/The-user-as-sensor-to-reach-for-optimal-individual-Vissers-Zeiler/59674c7229c821d8a07677db762428b763307c80 (accessed on 28 March 2026).
- Ghahramani, A.; Castro, G.; Karvigh, S.A.; Becerik-Gerber, B. Towards unsupervised learning of thermal comfort using infrared thermography. Appl. Energy 2018, 211, 41–49. [Google Scholar] [CrossRef] [Scilit]
- Chen, M.; Younes, J.; Farahani, A.V.; Kilpeläinen, S.; Kosonen, R.; Ghaddar, N.; Ghali, K.; Melikov, A.K. Evaluating thermal response when elderly people using local cooling devices: Correlation among overall and local thermal sensation with skin temperature. Build. Environ. 2024, 251, 111217. [Google Scholar] [CrossRef] [Scilit]
- Fakir, M.H.; Kim, J.K. Prediction of individual thermal sensation from exhaled breath temperature using a smart face mask. Build. Environ. 2022, 207, 108507. [Google Scholar] [CrossRef] [Scilit]
- Chen, X.; Wang, Q.; Srebric, J. Model predictive control for indoor thermal comfort and energy optimization using occupant feedback. Energy Build. 2015, 102, 357–369. [Google Scholar] [CrossRef] [Scilit]
- Daum, D.; Haldi, F.; Morel, N. A personalized measure of thermal comfort for building controls. Build. Environ. 2011, 46, 3–11. [Google Scholar] [CrossRef] [Scilit]
- Katić, K.; Li, R.; Zeiler, W. Machine learning algorithms applied to a prediction of personal overall thermal comfort using skin temperatures and occupants’ heating behavior. Appl. Ergon. 2020, 85, 103078. [Google Scholar] [CrossRef] [Scilit] [PubMed]
- Desta, S.G.; Asseffa, A. Prospect of Level of thermal Comfort Within Public Office Buildings in Addis Ababa (Case of Prototype Government Office Buildings). Int. J. Archit. Arts Appl. 2022, 8, 22–48. [Google Scholar] [CrossRef] [Scilit]
- Wu, Y.; Jiang, H.; Chen, W.; Fan, J.; Cao, B. Overall and local environmental collaborative control based on personal comfort model and personal comfort system. Appl. Energy 2024, 371, 123707. [Google Scholar] [CrossRef] [Scilit]
- Quintana, M.; Schiavon, S.; Tartarini, F.; Kim, J.; Miller, C. Cohort comfort models—Using occupants’ similarity to predict personal thermal preference with less data. Build. Environ. 2023, 227, 109685. [Google Scholar] [CrossRef] [Scilit]
- Wang, Z.; de Dear, R.; Luo, M.; Lin, B.; He, Y.; Ghahramani, A.; Zhu, Y. Individual difference in thermal comfort: A literature review. Build. Environ. 2018, 138, 181–193. [Google Scholar] [CrossRef] [Scilit]
- ISO 7730:2005; Ergonomics of the Thermal Environment—Analytical Determination and Interpretation of Thermal Comfort Using Calculation of the PMV and PPD Indices and Local Thermal Comfort Criteria. ISO: Geneva, Switzerland, 2005.
- ANSI/ASHRAE Standard 55-2023; Thermal Environmental Conditions for Human Occupancy. ASHRAE: Atlanta, GA, USA, 2023.
- Ličina, V.F.; Cheung, T.; Zhang, H.; de Dear, R.; Parkinson, T.; Arens, E.; Chun, C.; Schiavon, S.; Luo, M.; Brager, G.; et al. Development of the ASHRAE Global Thermal Comfort Database II. Build. Environ. 2018, 142, 502–512. [Google Scholar] [CrossRef] [Scilit]
- Chawla, N.V.; Bowyer, K.W.; Hall, L.O.; Kegelmeyer, W.P. SMOTE: Synthetic minority over-sampling technique. J. Artif. Intell. Res. 2002, 16, 321–357. [Google Scholar] [CrossRef] [Scilit]
- Blagus, R.; Lusa, L. SMOTE for high-dimensional class-imbalanced data. BMC Bioinform. 2013, 14, 106. [Google Scholar] [CrossRef] [Scilit] [PubMed]
- Ozturk, T.; Talo, M.; Yildirim, E.A.; Baloglu, U.B.; Yildirim, O.; Acharya, U.R. Deep-learning-based chest X-ray image analysis for COVID-19 and other pneumonia diagnosis. Comput. Biol. Med. 2020, 121, 103792. [Google Scholar] [CrossRef] [Scilit]
- Agresti, A. Categorical Data Analysis, 3rd ed.; John Wiley & Sons: Hoboken, NJ, USA, 2013. [Google Scholar]
- Brant, R. Assessing Proportionality in the Proportional Odds Model for Ordinal Logistic Regression. Biometrics 1990, 46, 1171–1178. [Google Scholar] [CrossRef] [Scilit]
- Williams, R.A. Generalized Ordered Logit/Partial Proportional Odds Models for Ordinal Dependent Variables. Stata J. 2006, 6, 58–82. [Google Scholar] [CrossRef] [Scilit]
- Ai, C.; Norton, E.C. Interaction terms in logit and probit models. Econ. Lett. 2003, 80, 123–129. [Google Scholar] [CrossRef] [Scilit]
- Mize, T.D. Best practices for estimating, interpreting, and presenting nonlinear interaction effects. Sociol. Sci. 2019, 6, 81–117. [Google Scholar] [CrossRef] [Scilit]
- Szeghalmy, S.; Fazekas, A. A Comparative Study of the Use of Stratified Cross-Validation and Distribution-Balanced Stratified Cross-Validation in Imbalanced Learning. Sensors 2023, 23, 2333. [Google Scholar] [CrossRef] [Scilit]
- Cohen, J. Weighted kappa: Nominal scale agreement with provision for scaled disagreement or partial credit. Psychol. Bull. 1968, 70, 213–220. [Google Scholar] [CrossRef] [Scilit]
- Wienholt, P.; Hermans, A.; Khader, F.; Puladi, B.; Leibe, B.; Kuhl, C.; Nebelung, S.; Truhn, D. An Ordinal Regression Framework for a Deep Learning Based Severity Assessment for Chest Radiographs. arXiv 2024, arXiv:2402.05685. [Google Scholar] [CrossRef] [Scilit]
- Wu, Y.; Zhang, Z.; Liu, H.; Li, B.; Chen, B.; Kosonen, R.; Jokisalo, J. Age differences in thermal comfort and physiological responses in thermal environments with temperature ramp. Build. Environ. 2023, 228, 109887. [Google Scholar] [CrossRef] [Scilit]
- Jowkar, M.; Rijal, H.B.; Brusey, J.; Montazami, A.; Temeljotov-Salaj, A. The influence of acclimatization, age and gender-related differences on thermal perception in university buildings: Case studies in Scotland and England. Build. Environ. 2020, 179, 106933. [Google Scholar] [CrossRef] [Scilit]
- Maykot, J.K.; de Oliveira, C.C.; Ghisi, E.; Rupp, R.F. Influence of Gender on Thermal, Air-Movement, Humidity and Air-Quality Perception in Mixed-Mode and Fully Air-Conditioned Offices. Sustainability 2022, 14, 9722. [Google Scholar] [CrossRef] [Scilit]
- Olesen, B.W. Building Control, Personal Comfort and Indoor Climate; International Centre for Indoor Environment and Energy, Technical University of Denmark: Copenhagen, Denmark, 2004. [Google Scholar]
- Sawada, T.; Mizuno, M.; Kono, M.; Hasegawa, T.; Yokoyama, K. Office-in-the-loop: An investigation into agentic AI for advanced building HVAC control systems. Data-Centric Eng. 2025, 6, e31. [Google Scholar] [CrossRef] [Scilit]
- Humphreys, M.; Nicol, F.; Roaf, S. Adaptive Thermal Comfort: Foundations and Analysis; Routledge: Oxfordshire, UK, 2016. [Google Scholar]
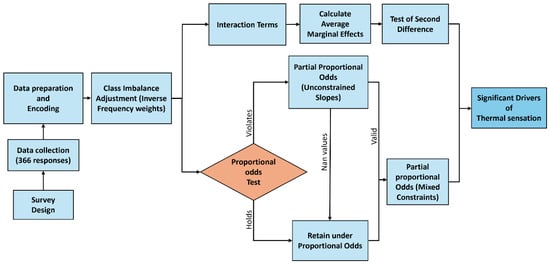
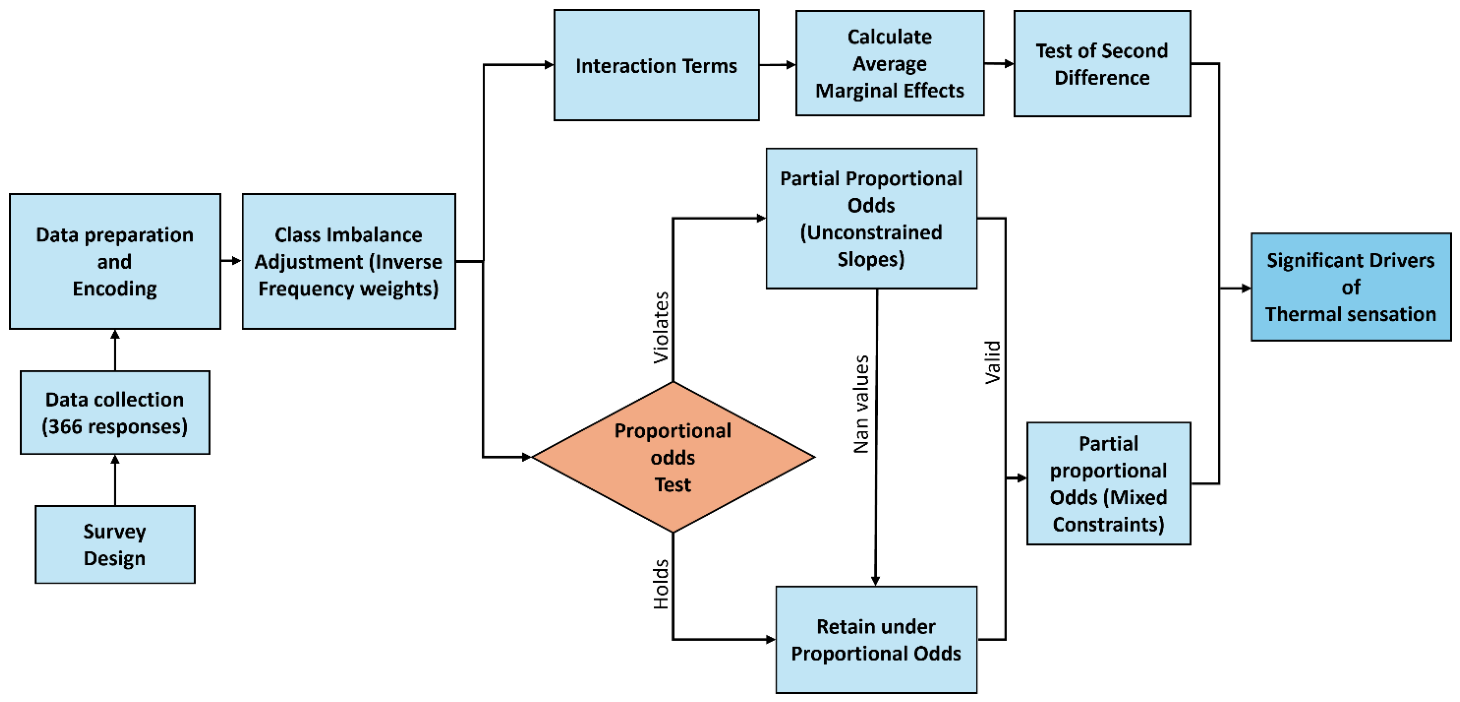
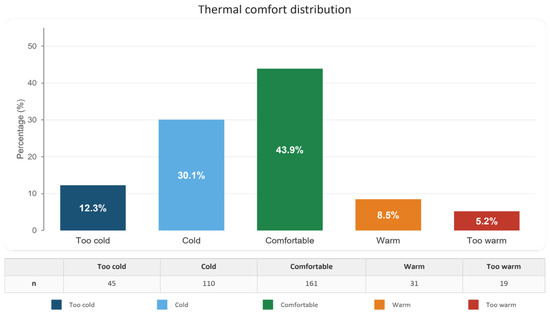
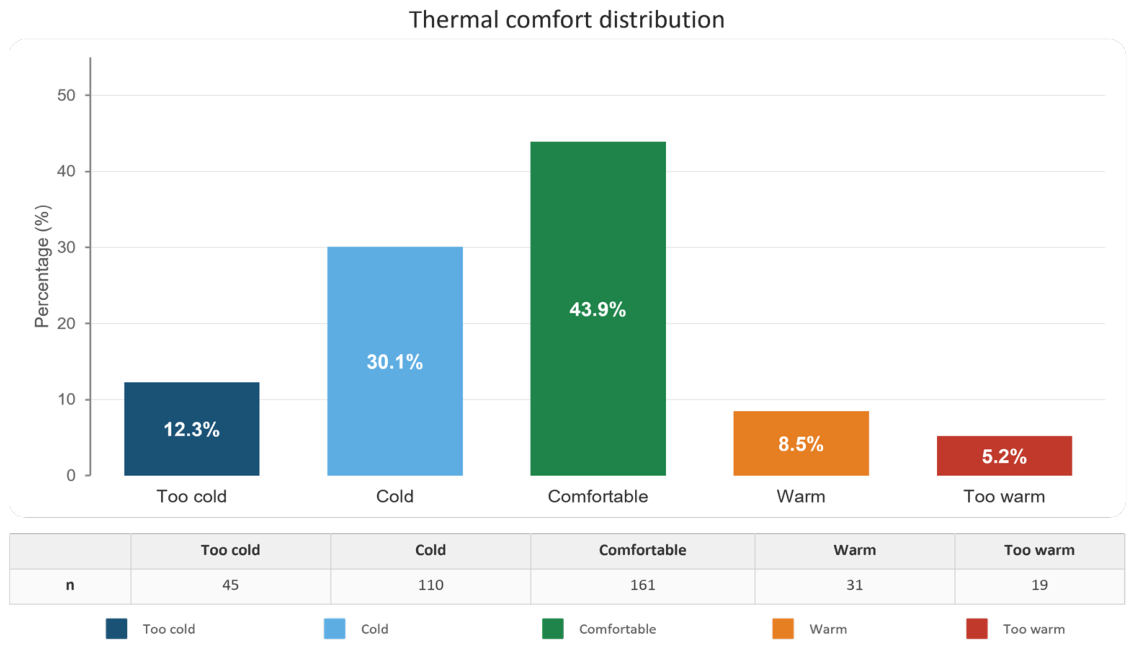
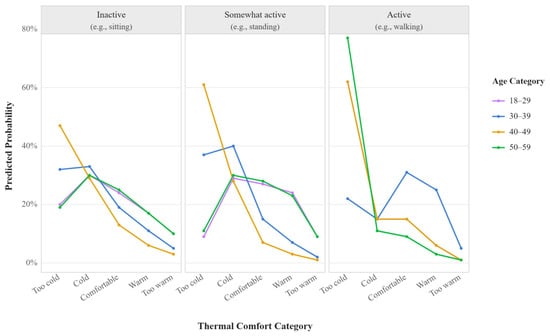
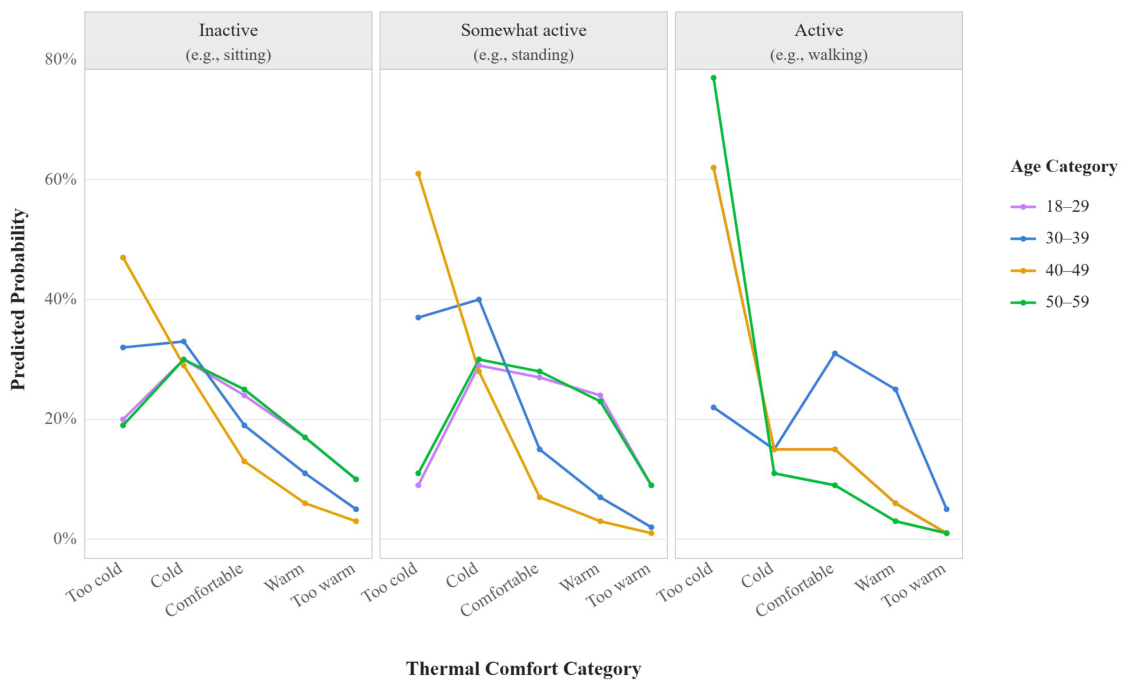
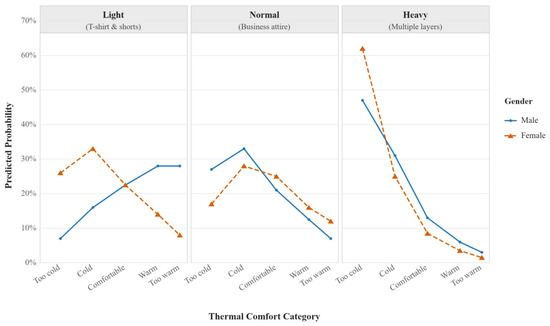
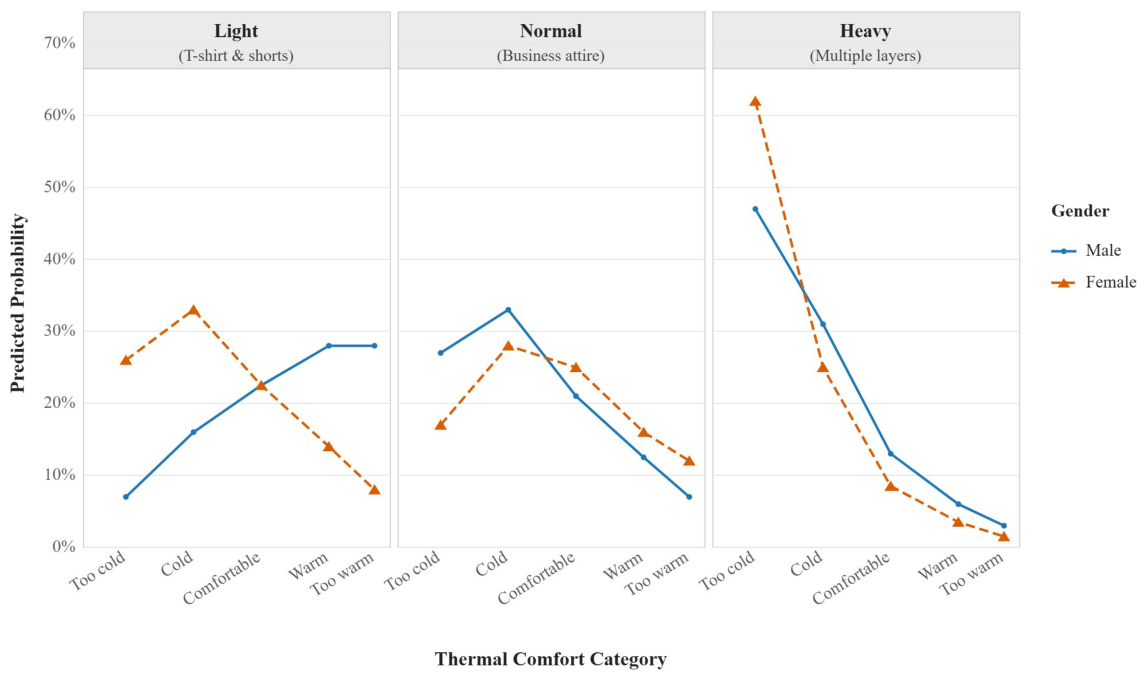
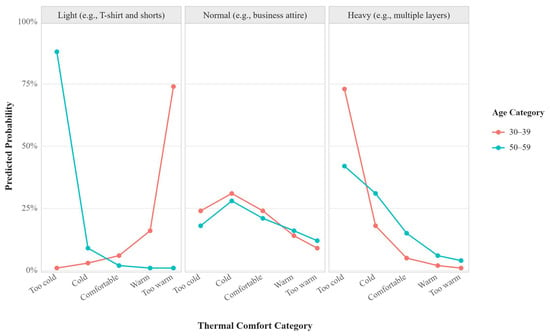
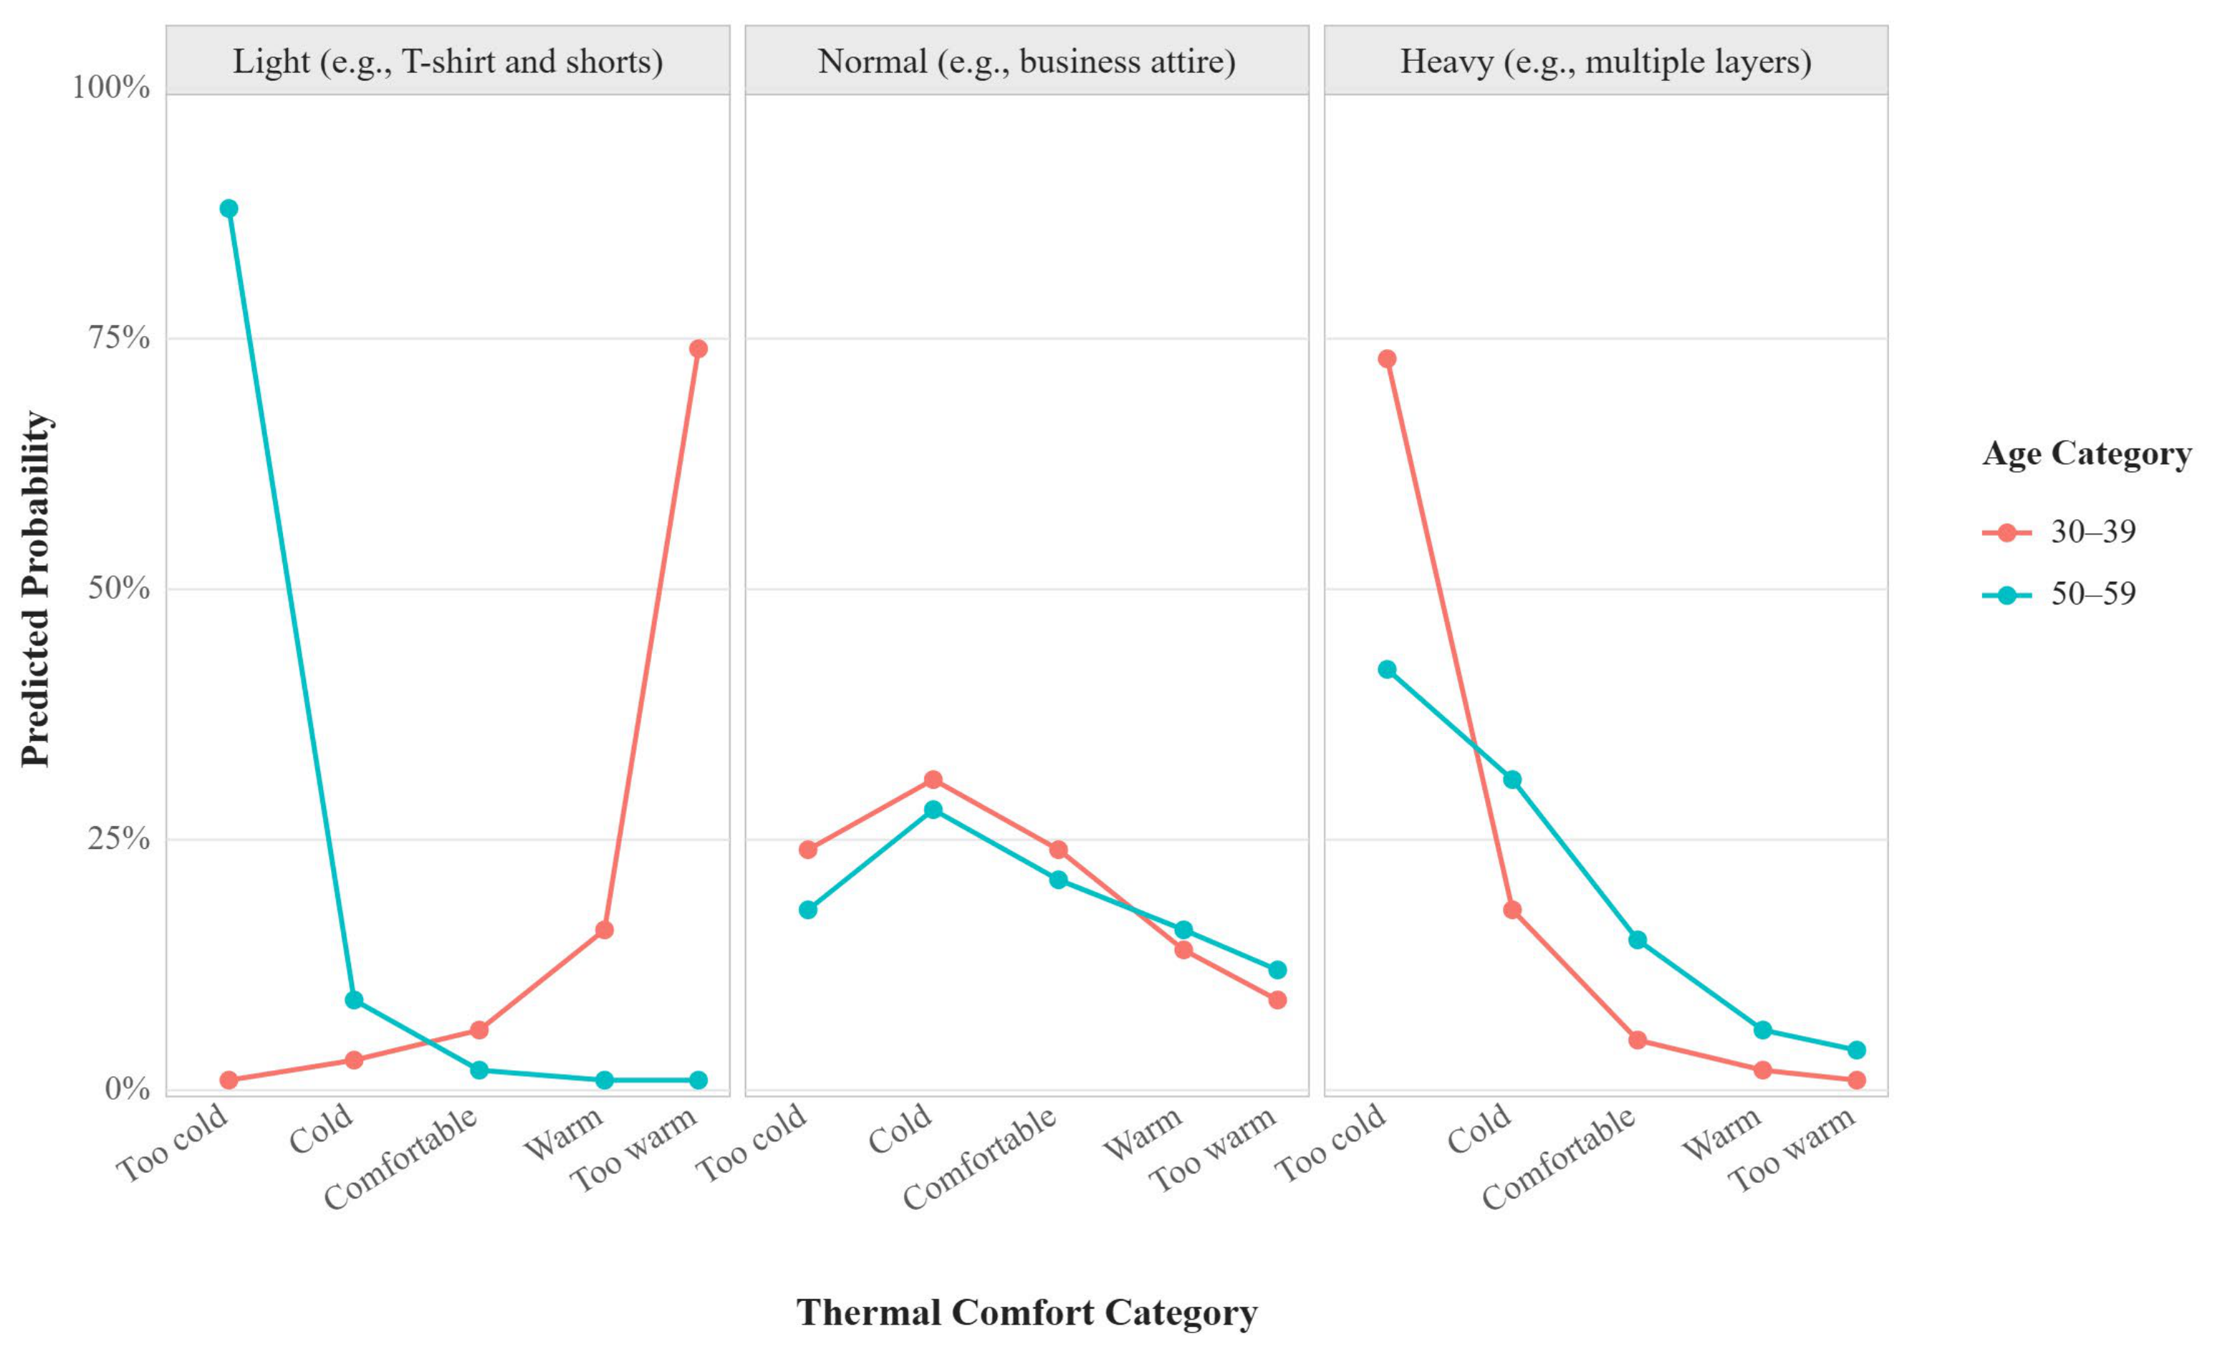

Disclaimer/Publisher’s Note: The statements, opinions and data contained in all publications are solely those of the individual author(s) and contributor(s) and not of MDPI and/or the editor(s). MDPI and/or the editor(s) disclaim responsibility for any injury to people or property resulting from any ideas, methods, instructions or products referred to in the content. |
© 2026 by the authors. Licensee MDPI, Basel, Switzerland. This article is an open access article distributed under the terms and conditions of the Creative Commons Attribution (CC BY) license.