


Abstract
Although the economic importance of optimizing lighting systems and energy use in indoor farming is well known, there is a notable lack of studies focusing on economic trade-off analysis between agrivoltaic and grid-powered solutions integrated into light map analysis and revenue sensitivity assessments. To address this gap, this study investigates an indoor true vertical lettuce agrotunnel. Regional, seasonal, and market type sensitivity analyses were carried out on the prices and experimental yields to calculate the revenue from lettuce production. Technoeconomic analysis indicated that agrivoltaics outperformed the grid-only power supply by net present cost and levelized cost of electricity reductions of 13.2% and 44.2%, respectively. Photosynthetic photon flux density (PPFD) and daily light integral (DLI) were compared for the cases of 41–61 cm distances between the lights and the walls. With the 20 cm distance variations, 16.6–17.8% changes in the average PPFD were achievable without increasing energy consumption. In addition, annual revenue from lettuce green mix packs ranged from $61,735 to $86,164 USD for singles and from $83,603 to $116,685 USD for multiple plants per pot strategies, depending on the variety packs. Luxury and mid-range price categories kept the return on investment above 10% at all capital cost levels. The agrotunnel achieved the maximum specific yield of >70 kg/m2/year.
1. Introduction
Indoor farming as a specific application of controlled environment agriculture (CEA) can effectively address some environmental challenges associated with traditional agriculture through decreased transportation emissions [1,2,3], lowering water consumption [4] and increasing productivity [4]. CEA also eliminates the need for herbicides and pesticides [5], allows for year-round production [6,7], improves spatial efficiency [7], minimizes the waste production [8,9], and preserves biodiversity [10]. CEA, particularly indoor vertical farming system, however, uses much more energy than traditional outdoor farming. The reported energy use efficiency for traditional farming, conventional greenhouses, and indoor vertical farms varies within the ranges of 103–104, 10–102, and 1–10 g/kWh, respectively [11]. A total of 11.34 kWh/kg is the reported specific electricity consumption (SEC) of a vertical farming container for lettuce production [12], which falls in the range of 10–20 kWh/kg for typical facilities [11]. The lowest range of this metric is achievable in factory-scale indoor vertical farms with the value of 7–10 kWh/kg, and the maximum value cross beyond 35 kWh/kg for small-scale distributed and experimental facilities [11]. In small-scale indoor farms in developed countries like Norway, the electricity costs of lighting are so substantial that it is challenging for indoor vertical farming to compete in the current market [13]. The majority of the energy use for CEA is normally from artificial lighting systems [7,14,15,16] at 70–80% and heating, ventilation, and air conditioning (HVAC) systems with 20–30% shares [7,12]. For example, the energy analysis conducted on the agrivoltaic agrotunnel found that light-emitting diode (LED) lights accounted for 87 to 89% of power consumption under various climatic conditions, including in Canada [17]. For a 506 m2 vertical farm with high-pressure sodium (HPS) lights, 1374 kWh/m2/year [18] and for two other 1296 and 50,000 m2 facilities with LEDs, 560 and 1128 kWh/m2/year are reported, respectively [19,20], as the simulated energy consumption levels.
CEA opportunities for leafy greens and herbs under LEDs have been assessed in various studies [21,22,23,24]. The maximum yield and overall product quality were achieved for lettuce under the higher photosynthetic photon flux density (PPFD) and the lower photoperiod values within the ranges of 160–240 μmol/m2/s and 16–20 h, respectively [25]. In another study, under constant temperature and CO2 concentration, optimal biomass production, water use efficiency, and energy and light use efficiency were achieved at a PPFD value of 200–250 μmol/m2/s for basil and lettuce cultivation [26]. For leafy green cultivation, 14 h of exposure to LEDs could improve the width, length, and number of lettuce leaves compared to an 8 h photoperiod [27]. In fact, each plant has an optimal growth value that varies with changes in the photoperiod [16]. For daily light integral (DLI) values in the range of 11–14 mol/m2.day, the specific yield (SY) levels of 52–61 kg/m2canopy/year were achieved for vertical lettuce farming [28,29,30]. For a lower DLI (10.1 mol/m2/day), however, a higher SY value of 69.1 kg/m2canopy/year was reported in the Netherlands [31]. A minimum DLI of 6.5 to 9.7 mol/m2/day (PPFD of 75.23 to 112.27 μmol/m2/s) is recommended for designing indoor systems for red-leaf lettuce [32]. By studying the dynamic actions on lighting systems, in lettuce cultivation, it was observed that circular moving light and mobile culture bed exhibited a higher photon capture percentage (80–85%) and a lower electricity consumption compared to static designs [33]. Shifting photoperiods from on-peak hours to nighttime in basil indoor vertical farm facilities were found to produce savings of 16–26% in operational costs [16], but this was highly dependent on electric rate structures. Further investigations on decreasing the distance between the LED lights and the grow bins in a vertical indoor farm setup from 45 cm to 15 cm, while maintaining the same PPFD for lettuce, resulted in energy savings without compromising the yield. In a similar study, the positive effects of using reflectors in reduced distances have also been observed [34].
Studies on the economic impact of optimal crop selection and yield improvements also confirm the effectiveness of these techniques in enhancing the profitability of indoor vertical farms. According to a study on indoor farming of herbs in Greece, the key factors of annual yield, fixture efficacy, and PPFD were the most important economic factors and thus, crops with low DLI and high plant densities were the most attractive financially [35]. In a study on lettuce, it was concluded that the cost-to-revenue ratio could either increase or decrease when raising the PPFD from 150 to 300 μmol/m2/s, with the effect varying depending on the type of lettuce (green Butterhead or red Oakleaf) [36]. A low-cost, sun-fed urban family vertical farming (UFVF) system in Shanghai demonstrated a return on investment (ROI) of around 30% [37]. Therefore, energy optimizations, such as more uniform distribution of PPFD and tailoring the light quality and quantity to the specific needs of crops, can significantly enhance the economic viability of indoor vertical farms [38].
Indoor farm owners and operators can mitigate financial risks through renewable energy management by utilizing solar photovoltaic (PV) systems [39], which offer the lowest-cost electricity [40] and are among the simplest renewable technologies to implement [41]. Since vertical farms are fully enclosed, solar PV panels can be conveniently installed on their roofs or on nearby land through agrivoltaics [41] with a minimal land footprint [17]. The concept of coupling PV to vertical farms is thus economically favorable without necessarily imposing a substantial land use requirement [12]. For example, a building-integrated PV (BIPV) system dedicated for supplying the vegetable needs of a household of four people could meet 20–23% of annual electricity demand [42]. In another example, the development of grid-connected solar PV systems for vertical farms at two different sites in Malaysia was investigated, and they had LCOE lower than traditional grid electricity [43]. For the typical lettuce vertical farm in Iran [12], by increasing the ratio of PV land footprint to vertical farm land area above 3.2, the profitability of PV-integrated farm could surpass that of the grid-connected one. In a life cycle cost (LCC) optimization study, PV system was among the recommended technologies in reducing the energy costs of CEAs in the U.S., particularly in locations with high utility prices [44]. It was also concluded in the study that the strategic crop selection, particularly leafy greens, further enhances profitability. Even with low-cost agrivoltaics, it is essential to reduce the contribution of lighting systems in the total energy demand of the indoor farm, which results in smaller size of required PV system. The smaller the size of the deployed PV system, the lower the initial or capital costs of the agrivoltaic system would be.
Both industrial experiences and academic studies confirmed that the economic feasibility of indoor farming heavily depends on energy and operational costs, with lighting systems playing a significant role. Effective cultivar selection is also crucial in increasing the cashflow streams. Small changes in growing light conditions (photoperiod, light quality, and light intensity) can affect production costs [45]. A few research papers [9,12,13,16,35,36,37,43] have assessed the production yield and economics of indoor farming facilities, with limited number exploring the integration of PV systems in vertical farms [12,43]. In addition, while the importance of optimizing lighting systems and the profitability of growing leafy greens and herbs have been highlighted [16,25,26,27,32,33,34,46], there is a notable lack of studies focusing on potential energy saving approaches by light map analysis, as well as regional and seasonal revenue sensitivity assessments for indoor cultivation of these crops on true vertical grow walls.
To overcome these limitations, this study first performs an energy and PPFD light map analysis on the vertical grow walls of an agrivoltaic indoor farming facility (named agrotunnel) located at the Western Innovation for Renewable Energy Deployment (WIRED) farm in Ilderton, Ontario [17]. Major energy contributors are identified and the most optimized net-metered on-grid agrivoltaic solution is introduced to cover the whole energy demand of the agrotunnel. A comparison is also conducted between scenarios where the LEDs are positioned closer to and farther away from the walls. For the most optimum PPFD level, the potential cutting downs in photoperiod of lighting system are theoretically investigated for energy conservation purposes. In addition, three experimental scenarios of lettuce farming are analyzed: (1) Black Simpson and Red Salad Bowl lettuce are grown on the walls with the strategy of single plant per pot, and the weekly harvested outputs are monitored and recorded for a cultivation period of these cultivars; (2) commercial crops including Romaine, Red Oak, and Red Outrageous lettuce are grown with the strategy of multiple plants per pot to examine the potential increments in yield numbers by changing the crop type and planting strategy; and (3) strategy 2 is replicated with the addition of Swiss chard to the mix, and the yield values are measured and regional, seasonal, and market type sensitivity analyses are carried out on the prices to calculate the revenue from lettuce production in an agrivoltaic agrotunnel. The main objective is to explore the potential optimization opportunities of the lighting system and evaluate the revenue increment and energy cost minimization opportunities to achieve the highest level of profitability for this building while keeping the initial and energy costs as low as possible.
2. Materials and Methods
This section covers details about the cultivars and cultivation process, the energy analysis on the technologies used in the agrotunnel (e.g., solar PV, watering, HVAC), the light map analysis, and the revenue and economic model. This study benefits from both simulation and experimental approaches, depending on the objectives and existing limitations. The PPFD light distribution maps and average yield values are measured experimentally, while the energy and economic analyses, as well as agrivoltaic system sizing with estimated savings and financial recommendations, are developed through simulations and cost–revenue estimations.
2.1. Agrivoltaic Agrotunnel
The agrotunnel (Food Security Structures Canada (FSSC) [47], London, ON, Canada) offers a scalable, sustainable, and easily assembled indoor vertical farming structure designed to combat food insecurity while getting powered by a net-zero grid-tied PV system. It is built to withstand extreme climate conditions and can be adapted to various locations, enabling year-round cultivation of hybrid hydroponic-aeroponic fruits and vegetables in harsh environments.
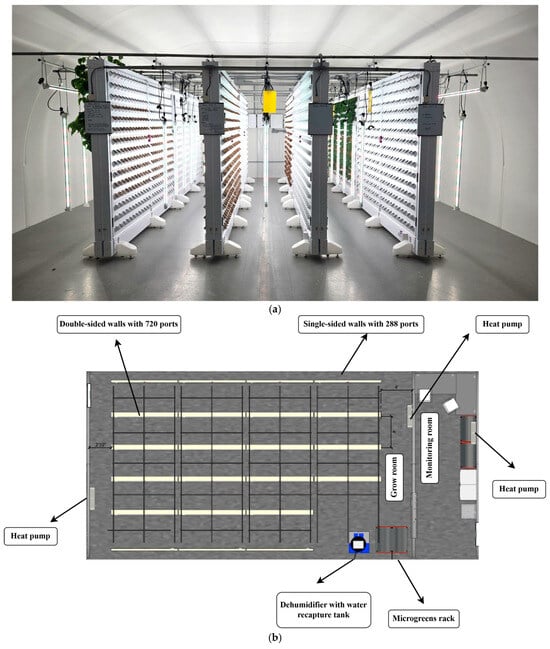
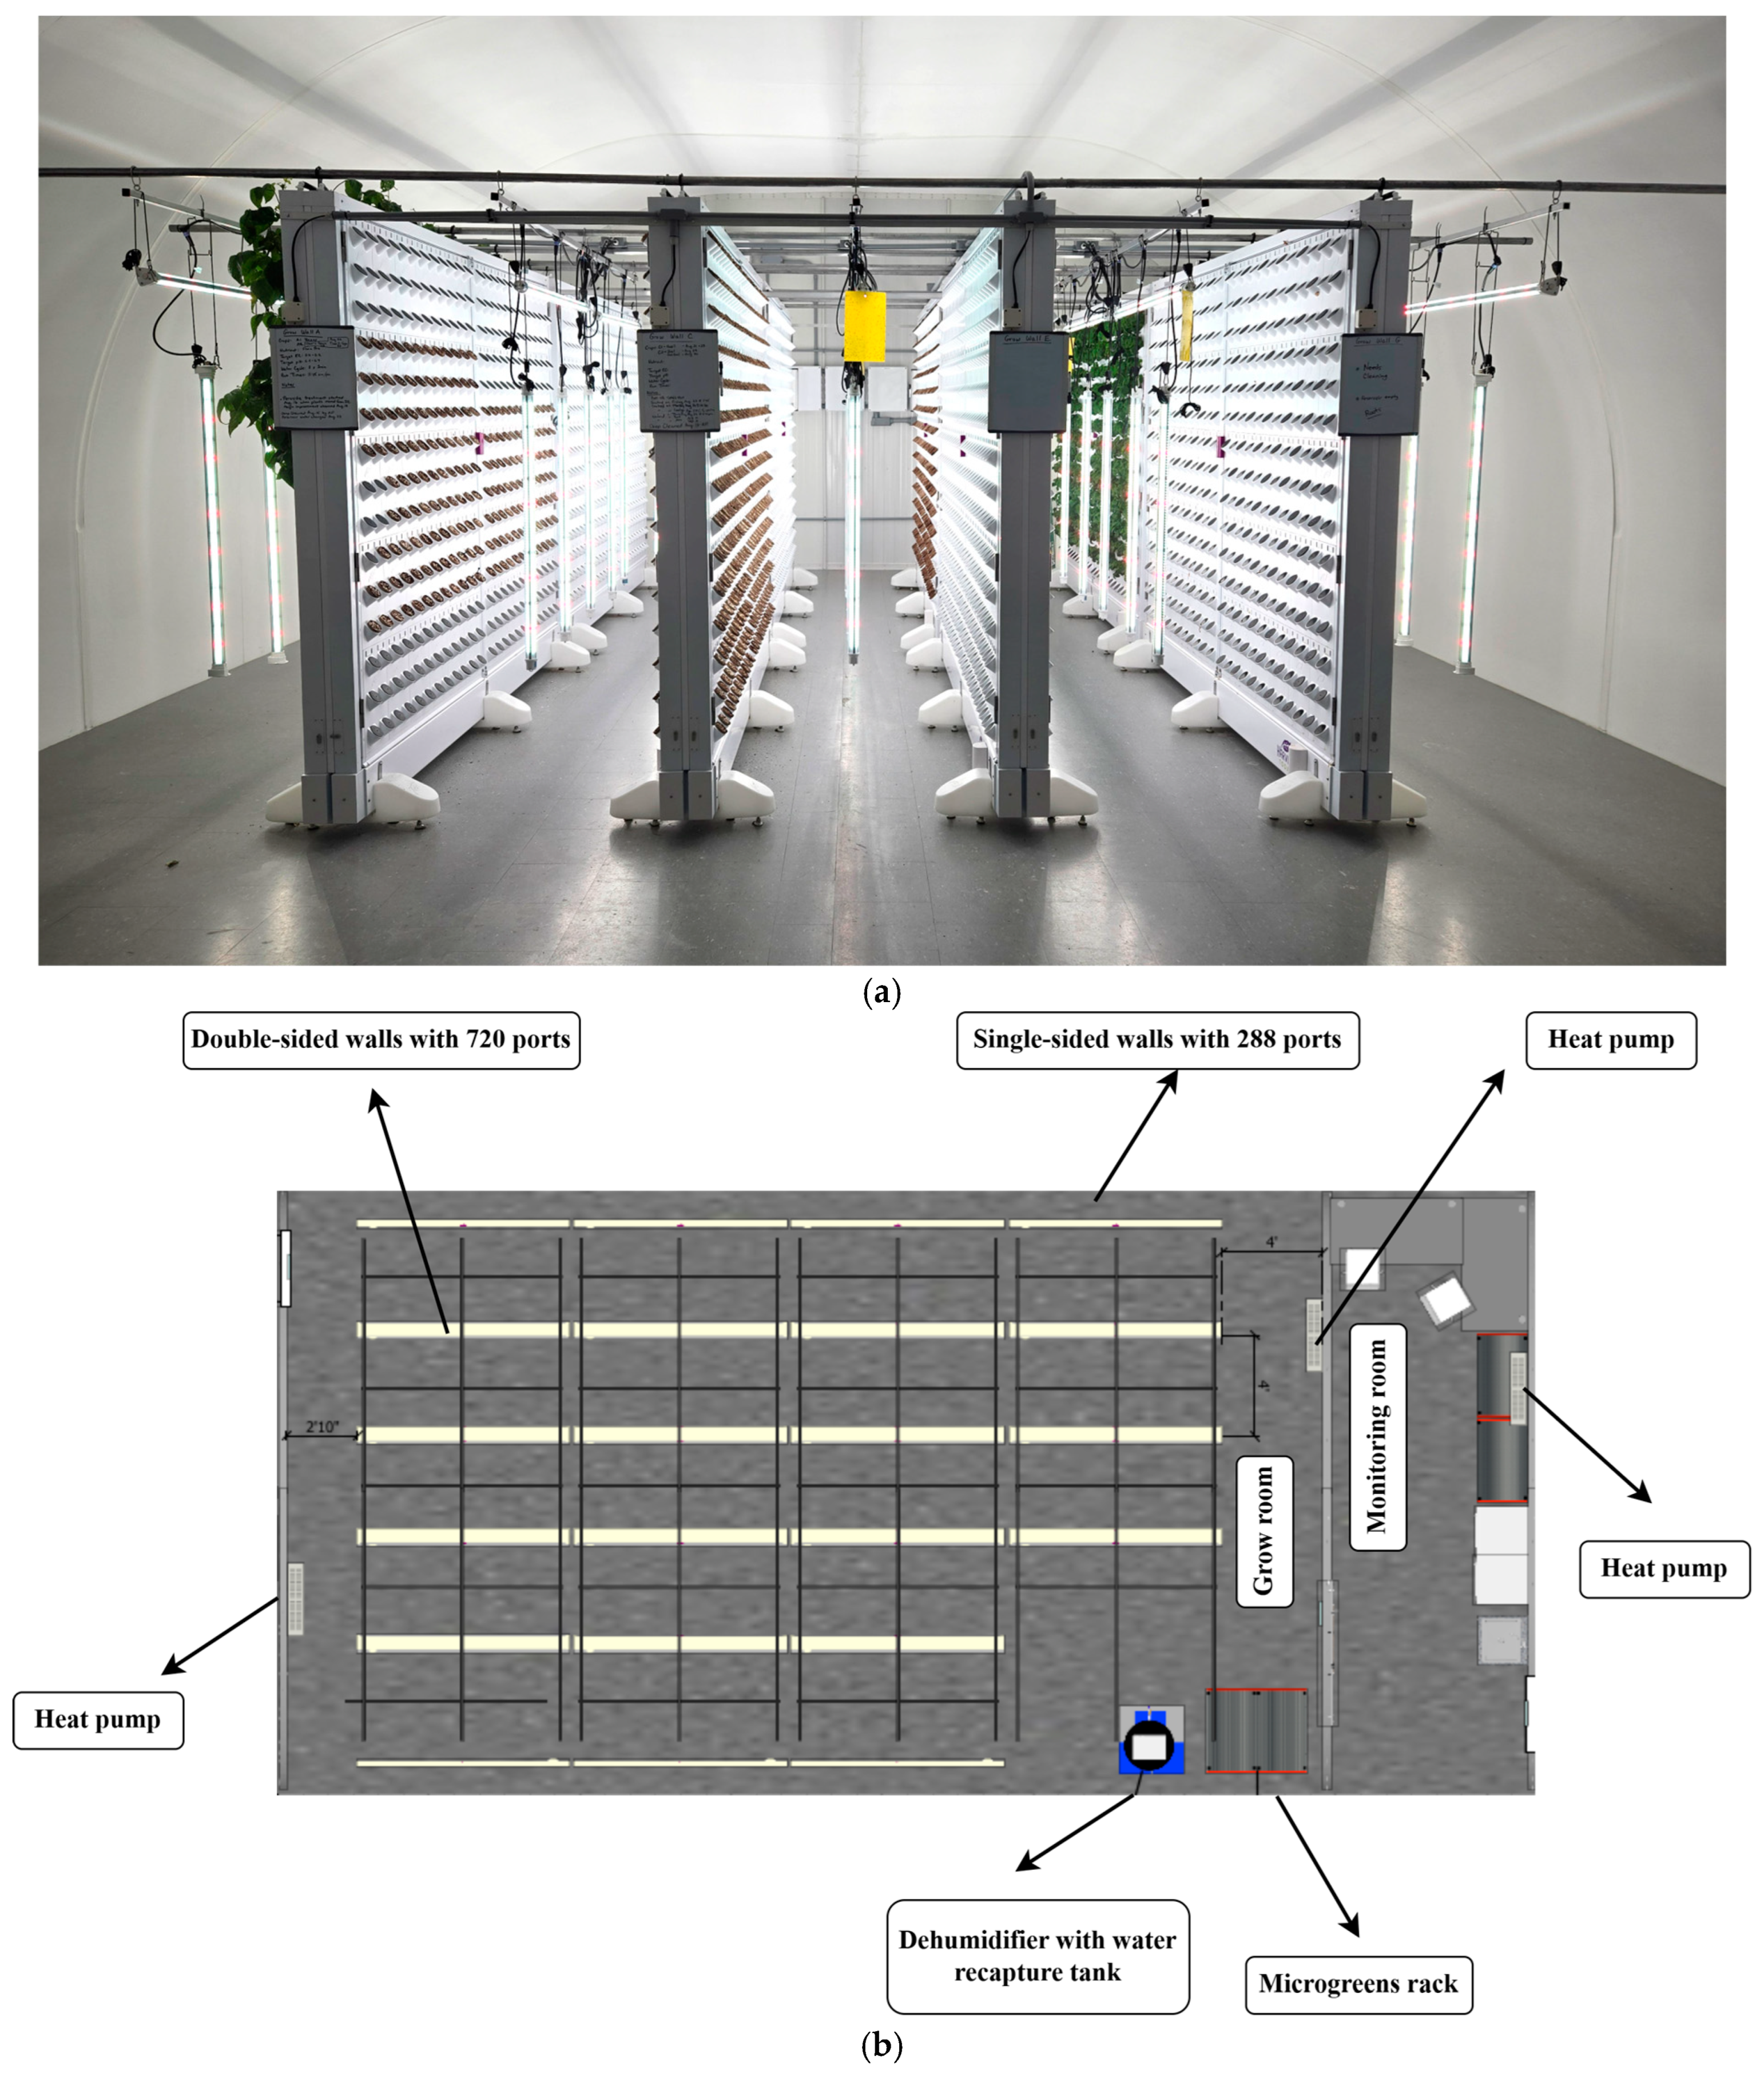
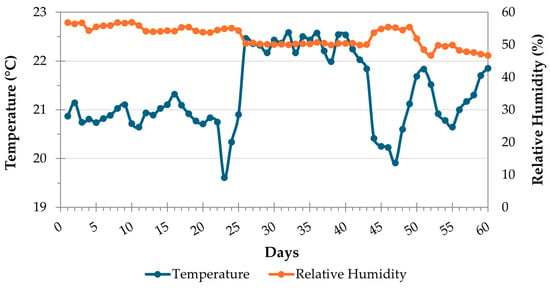
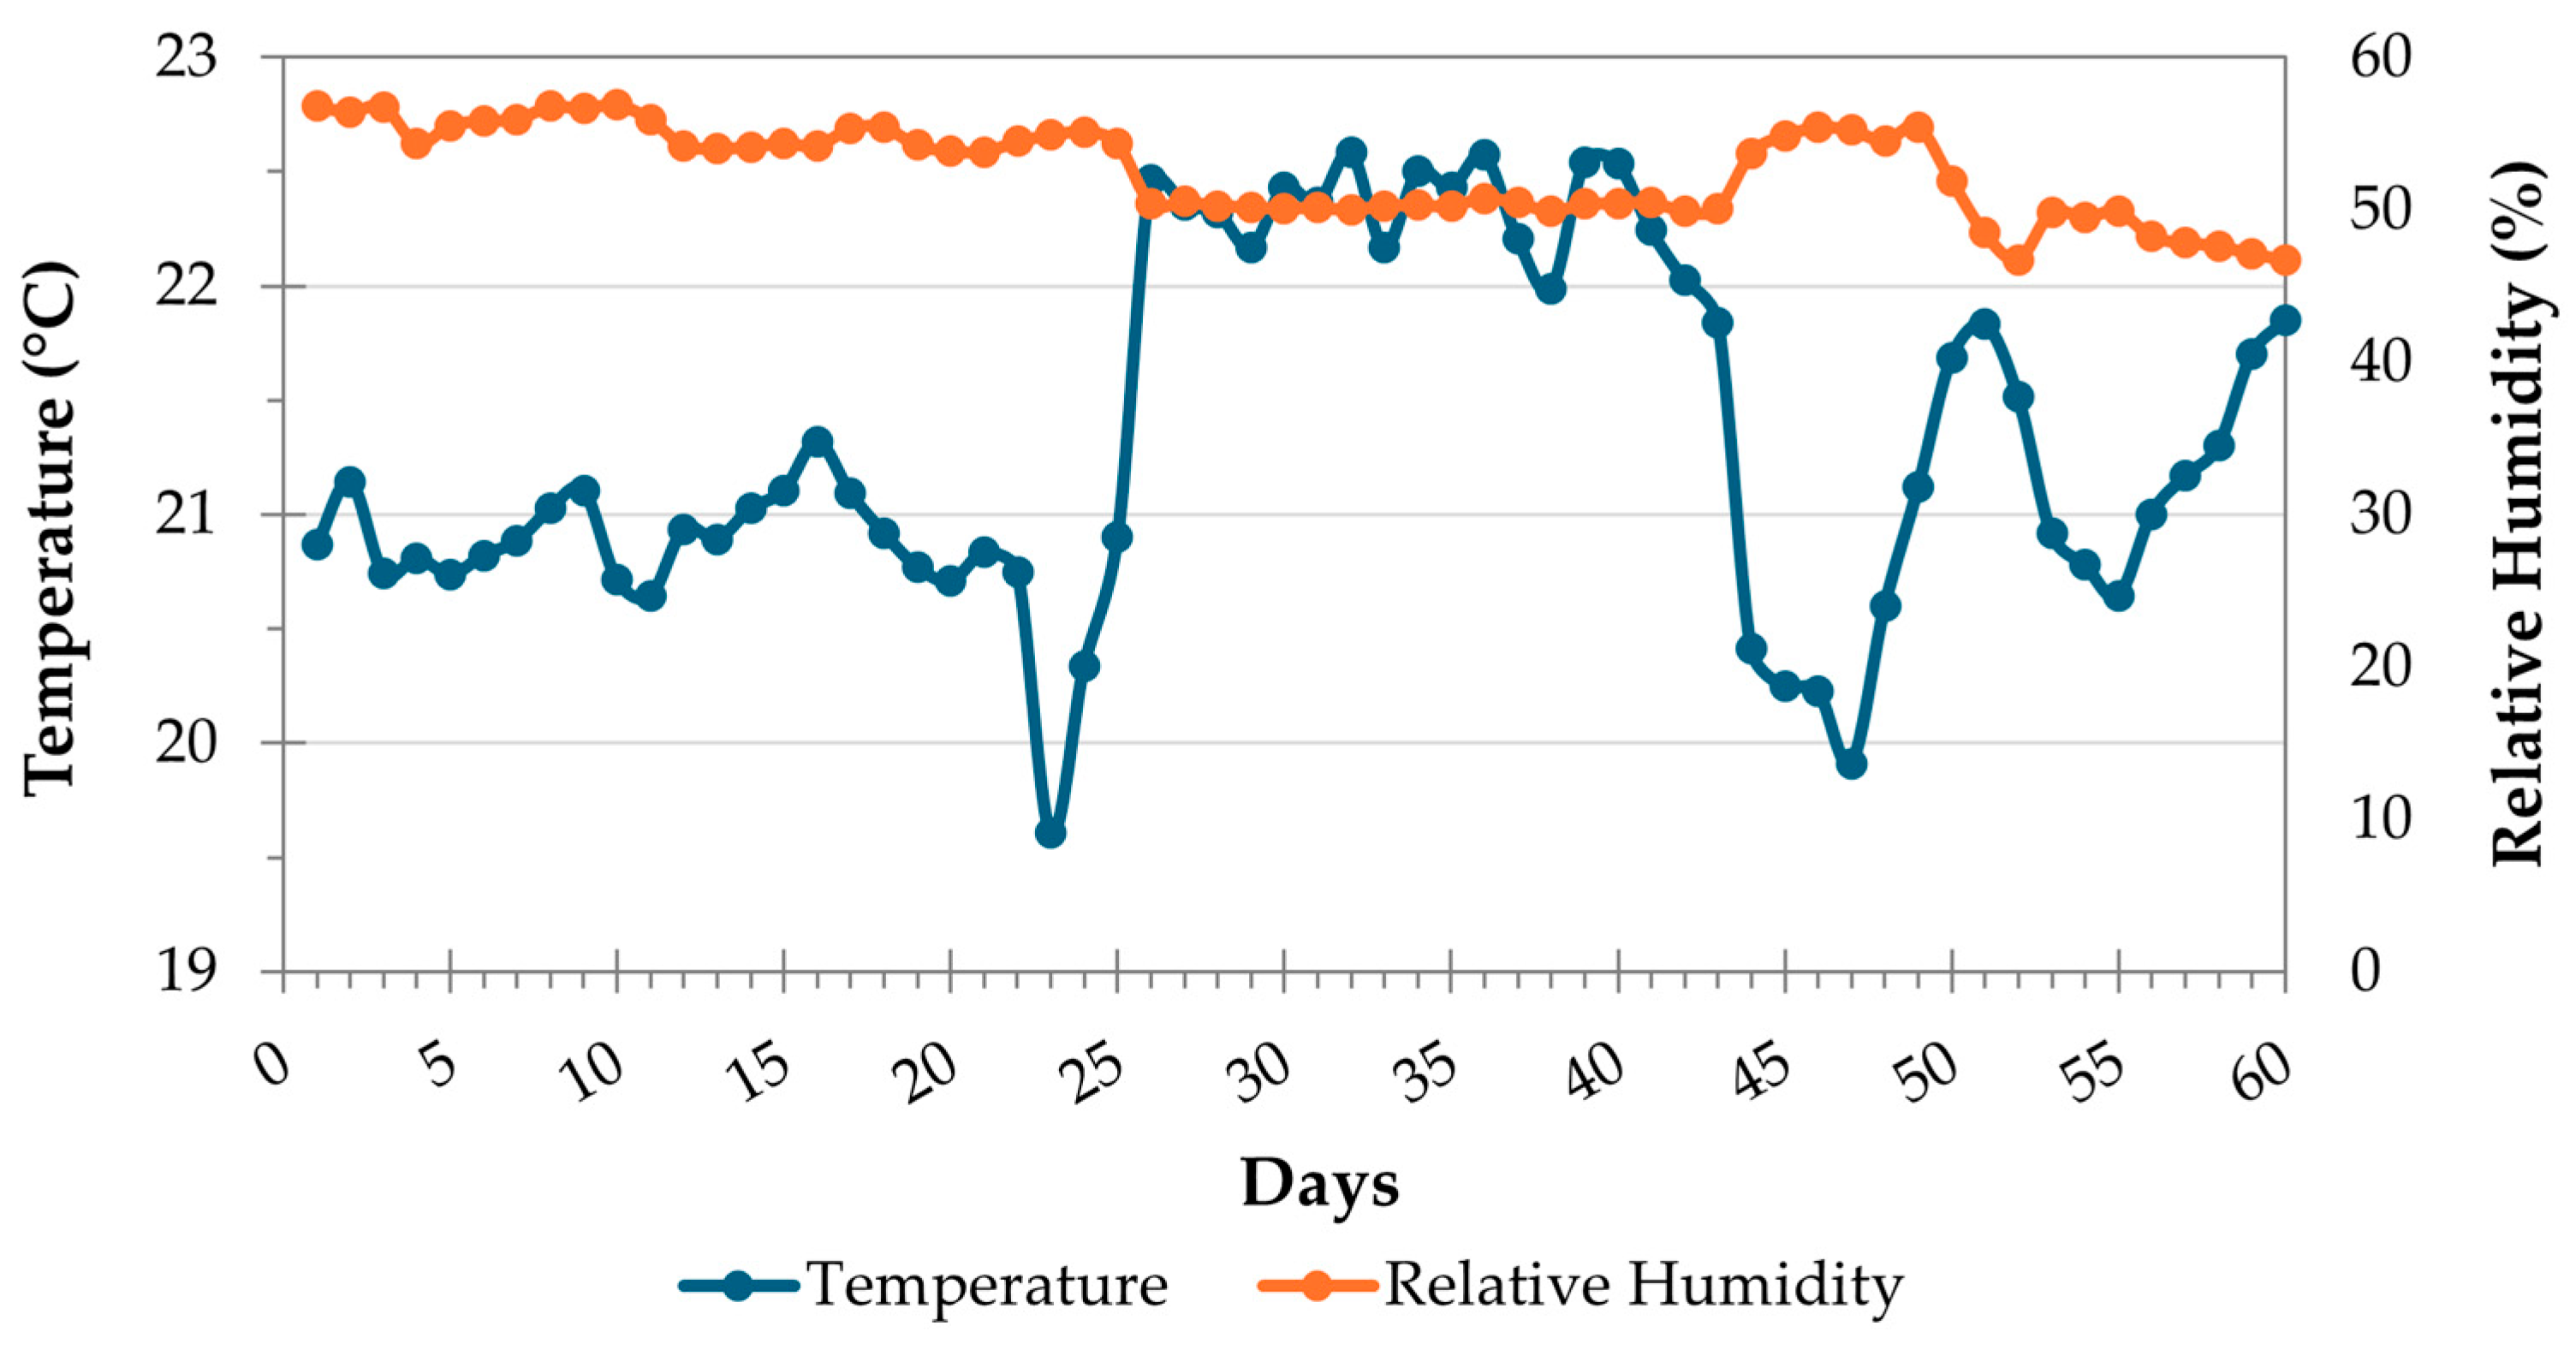
The specific agrotunnel under study, the standard MAX layout (Figure 1b), is a modified and compact pilot version of the original on-grade/mobile agrotunnel unit located at the WIRED system in Ontario (Figure 1a). As depicted in Figure 1b, the standard MAX design includes 15 double-sided and 7 single-sided vertical grow walls, totaling 12,816 ports, along with a microgreen/seedling rack. Both pilot and commercial versions of the agrotunnel occupy a 16 m × 7.5 m (120 m2) [17]. Overall, 70% of the total surface area is dedicated to the grow walls. The walls have true vertical layout, where plants are distributed across the walls in a vertical format. Two heat pumps (HPs), one in the monitoring room and one in the grow room with two split units and a dehumidifier, are used to stabilize the temperature and relative humidity (RH) within the range of 18–22 °C and 50–60%, respectively (Figure 2). Five circulating fans are also deployed to provide more uniform environment within the grow room. The water captured by the dehumidifier is used to refill the reservoirs after adding the necessary nutrients. The grow walls are irrigated by pumps submerged in reservoirs, while lights are suspended in the aisles. Detailed information about the LED lights utilized in this study is provided in Section 2.3.
Figure 1.
Agrotunnel under study: (a) the actual mobile version with eight grow walls located at WIRED; (b) top view of the standard MAX version of agrotunnel with 22 grow walls.
Figure 2.
The maintained temperature and relative humidity of the agrotunnel microclimate during a typical two-month period.
2.2. Cultivation Process
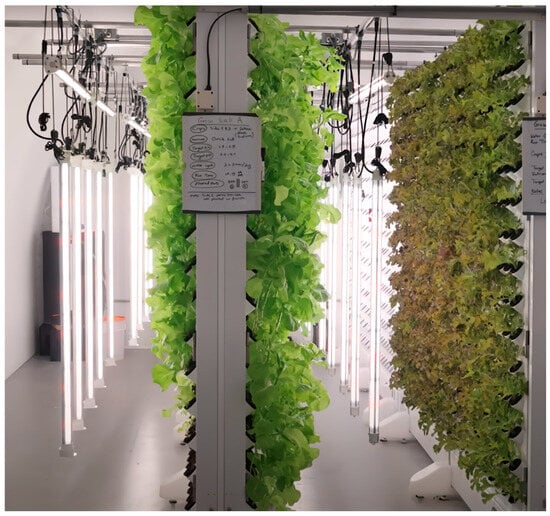
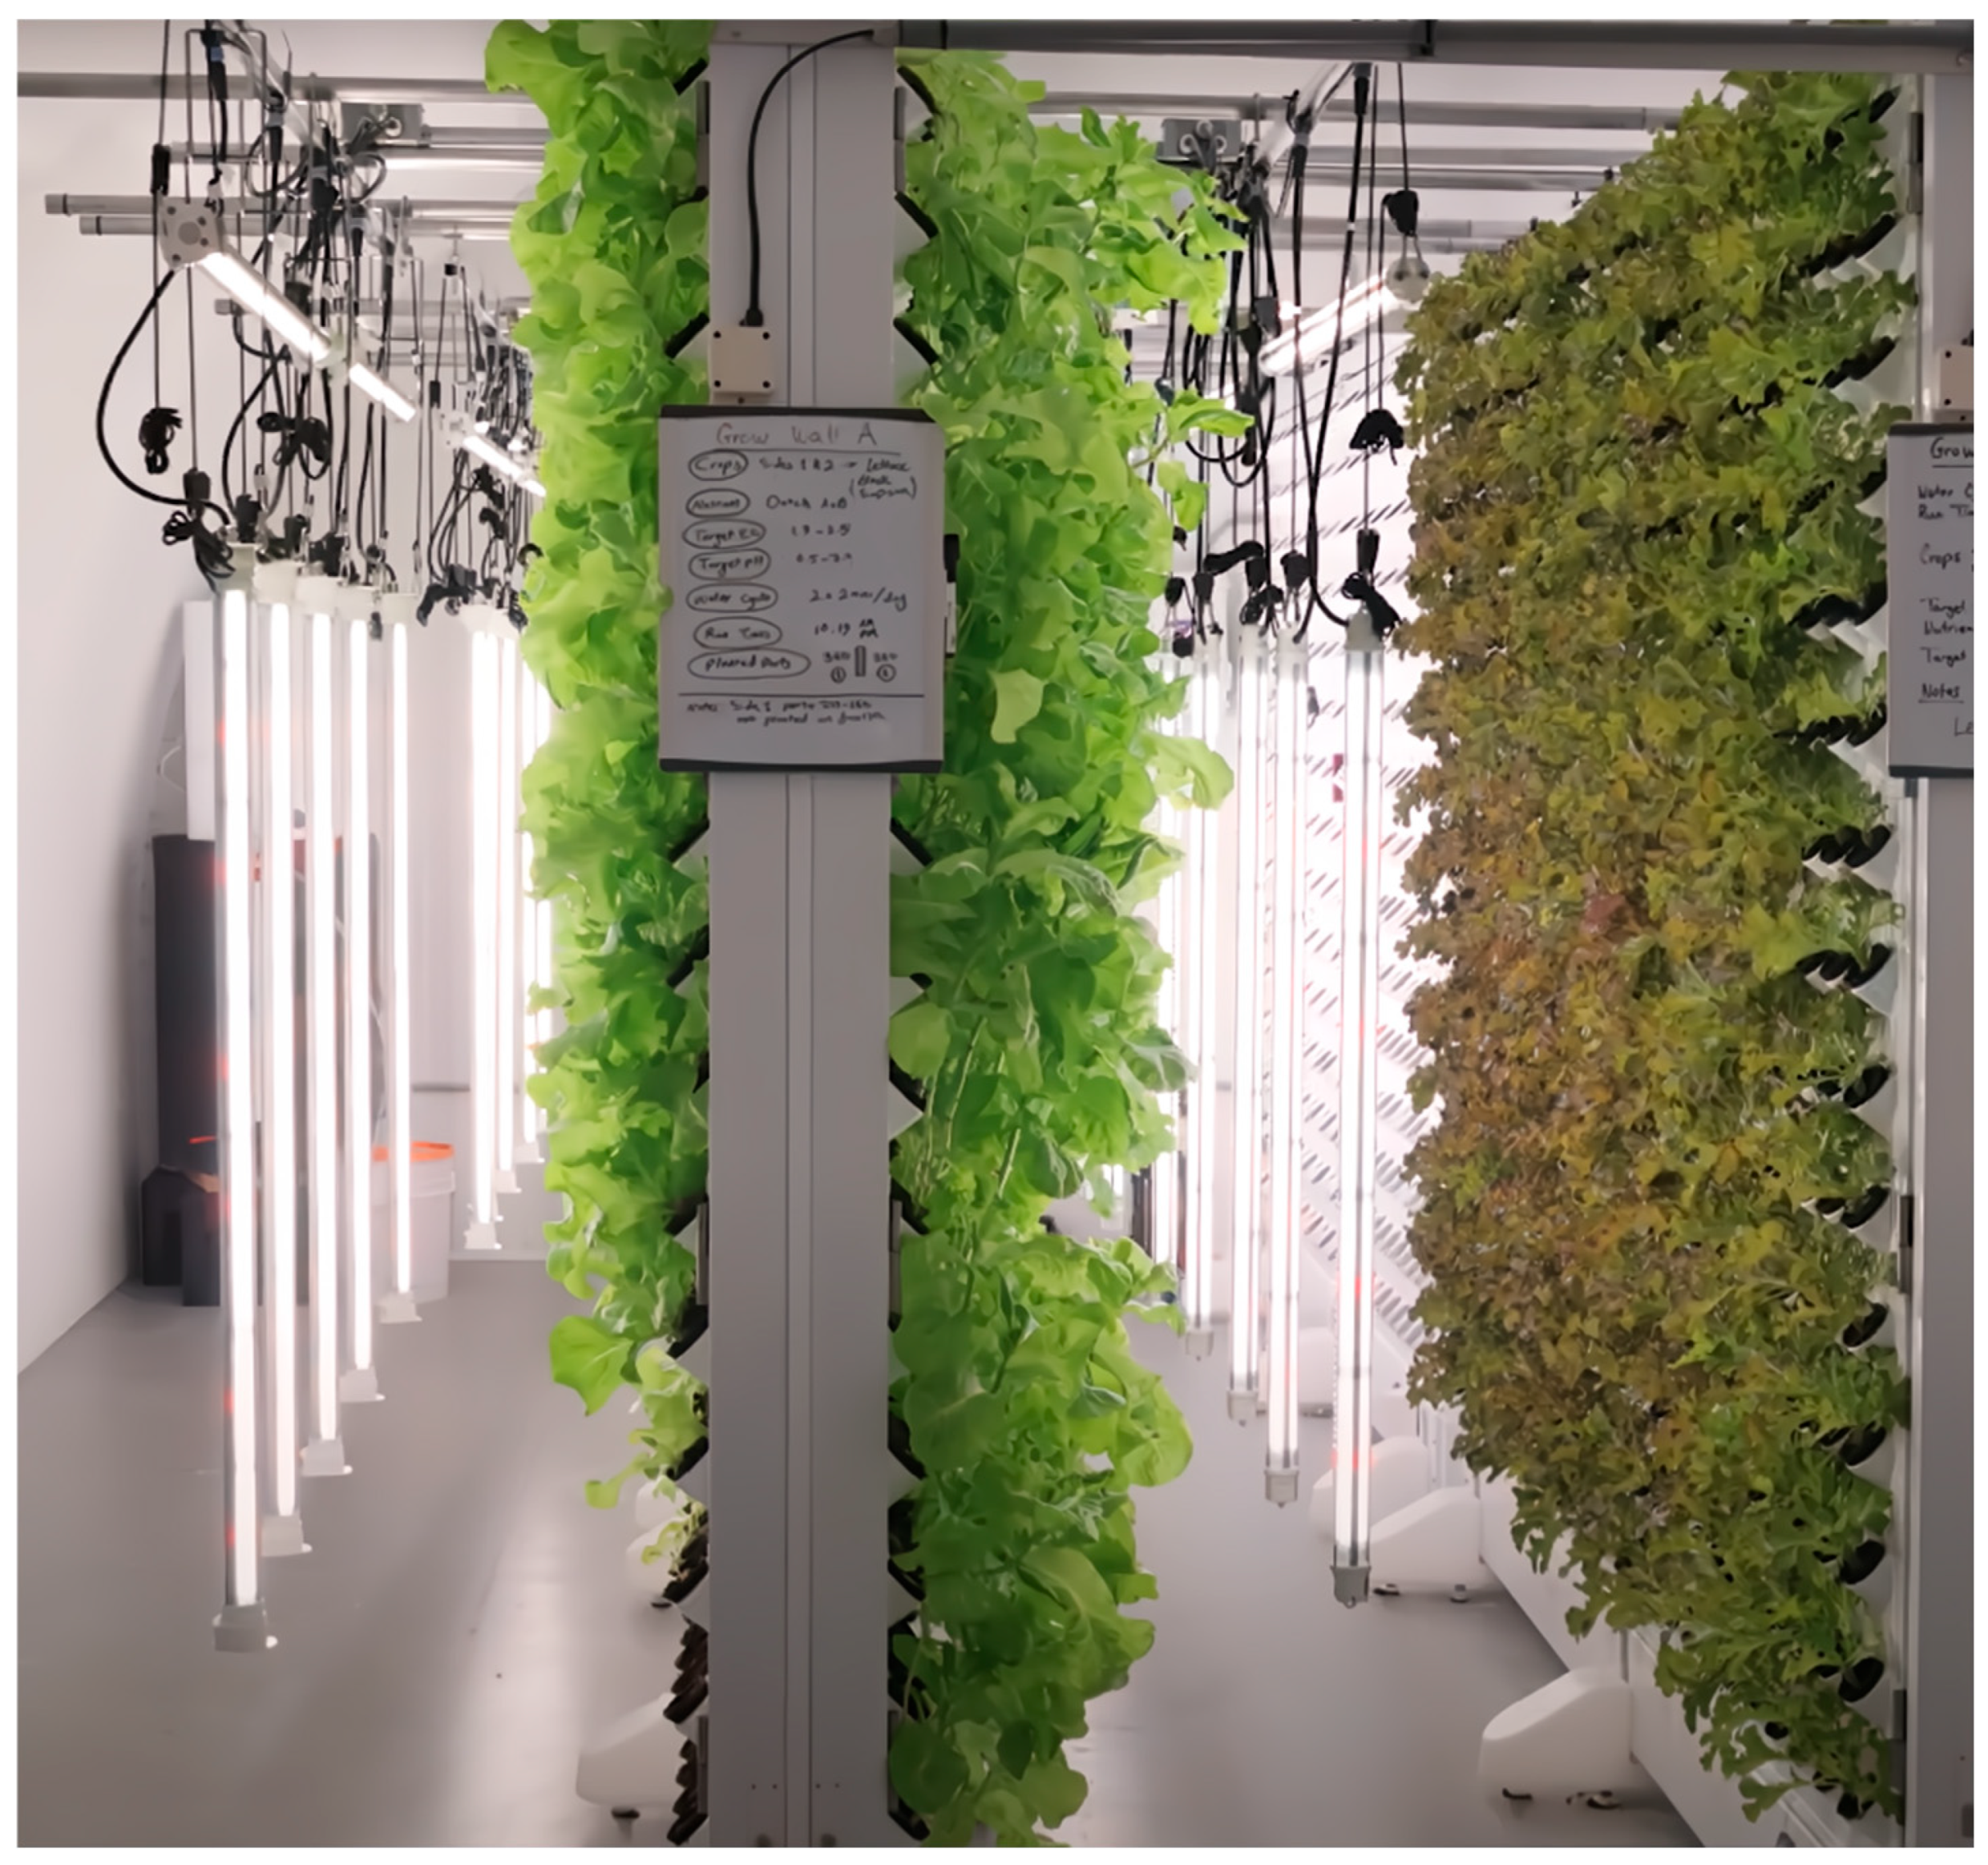
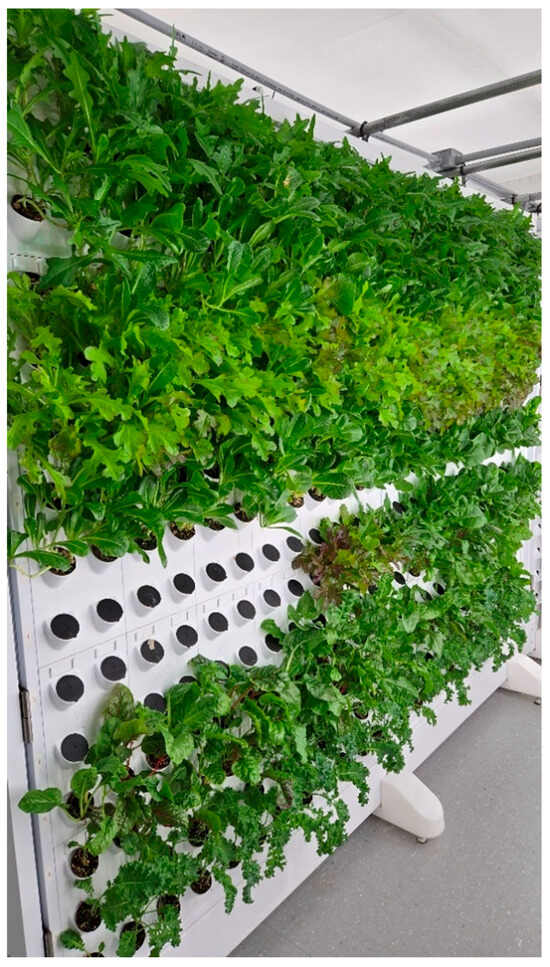
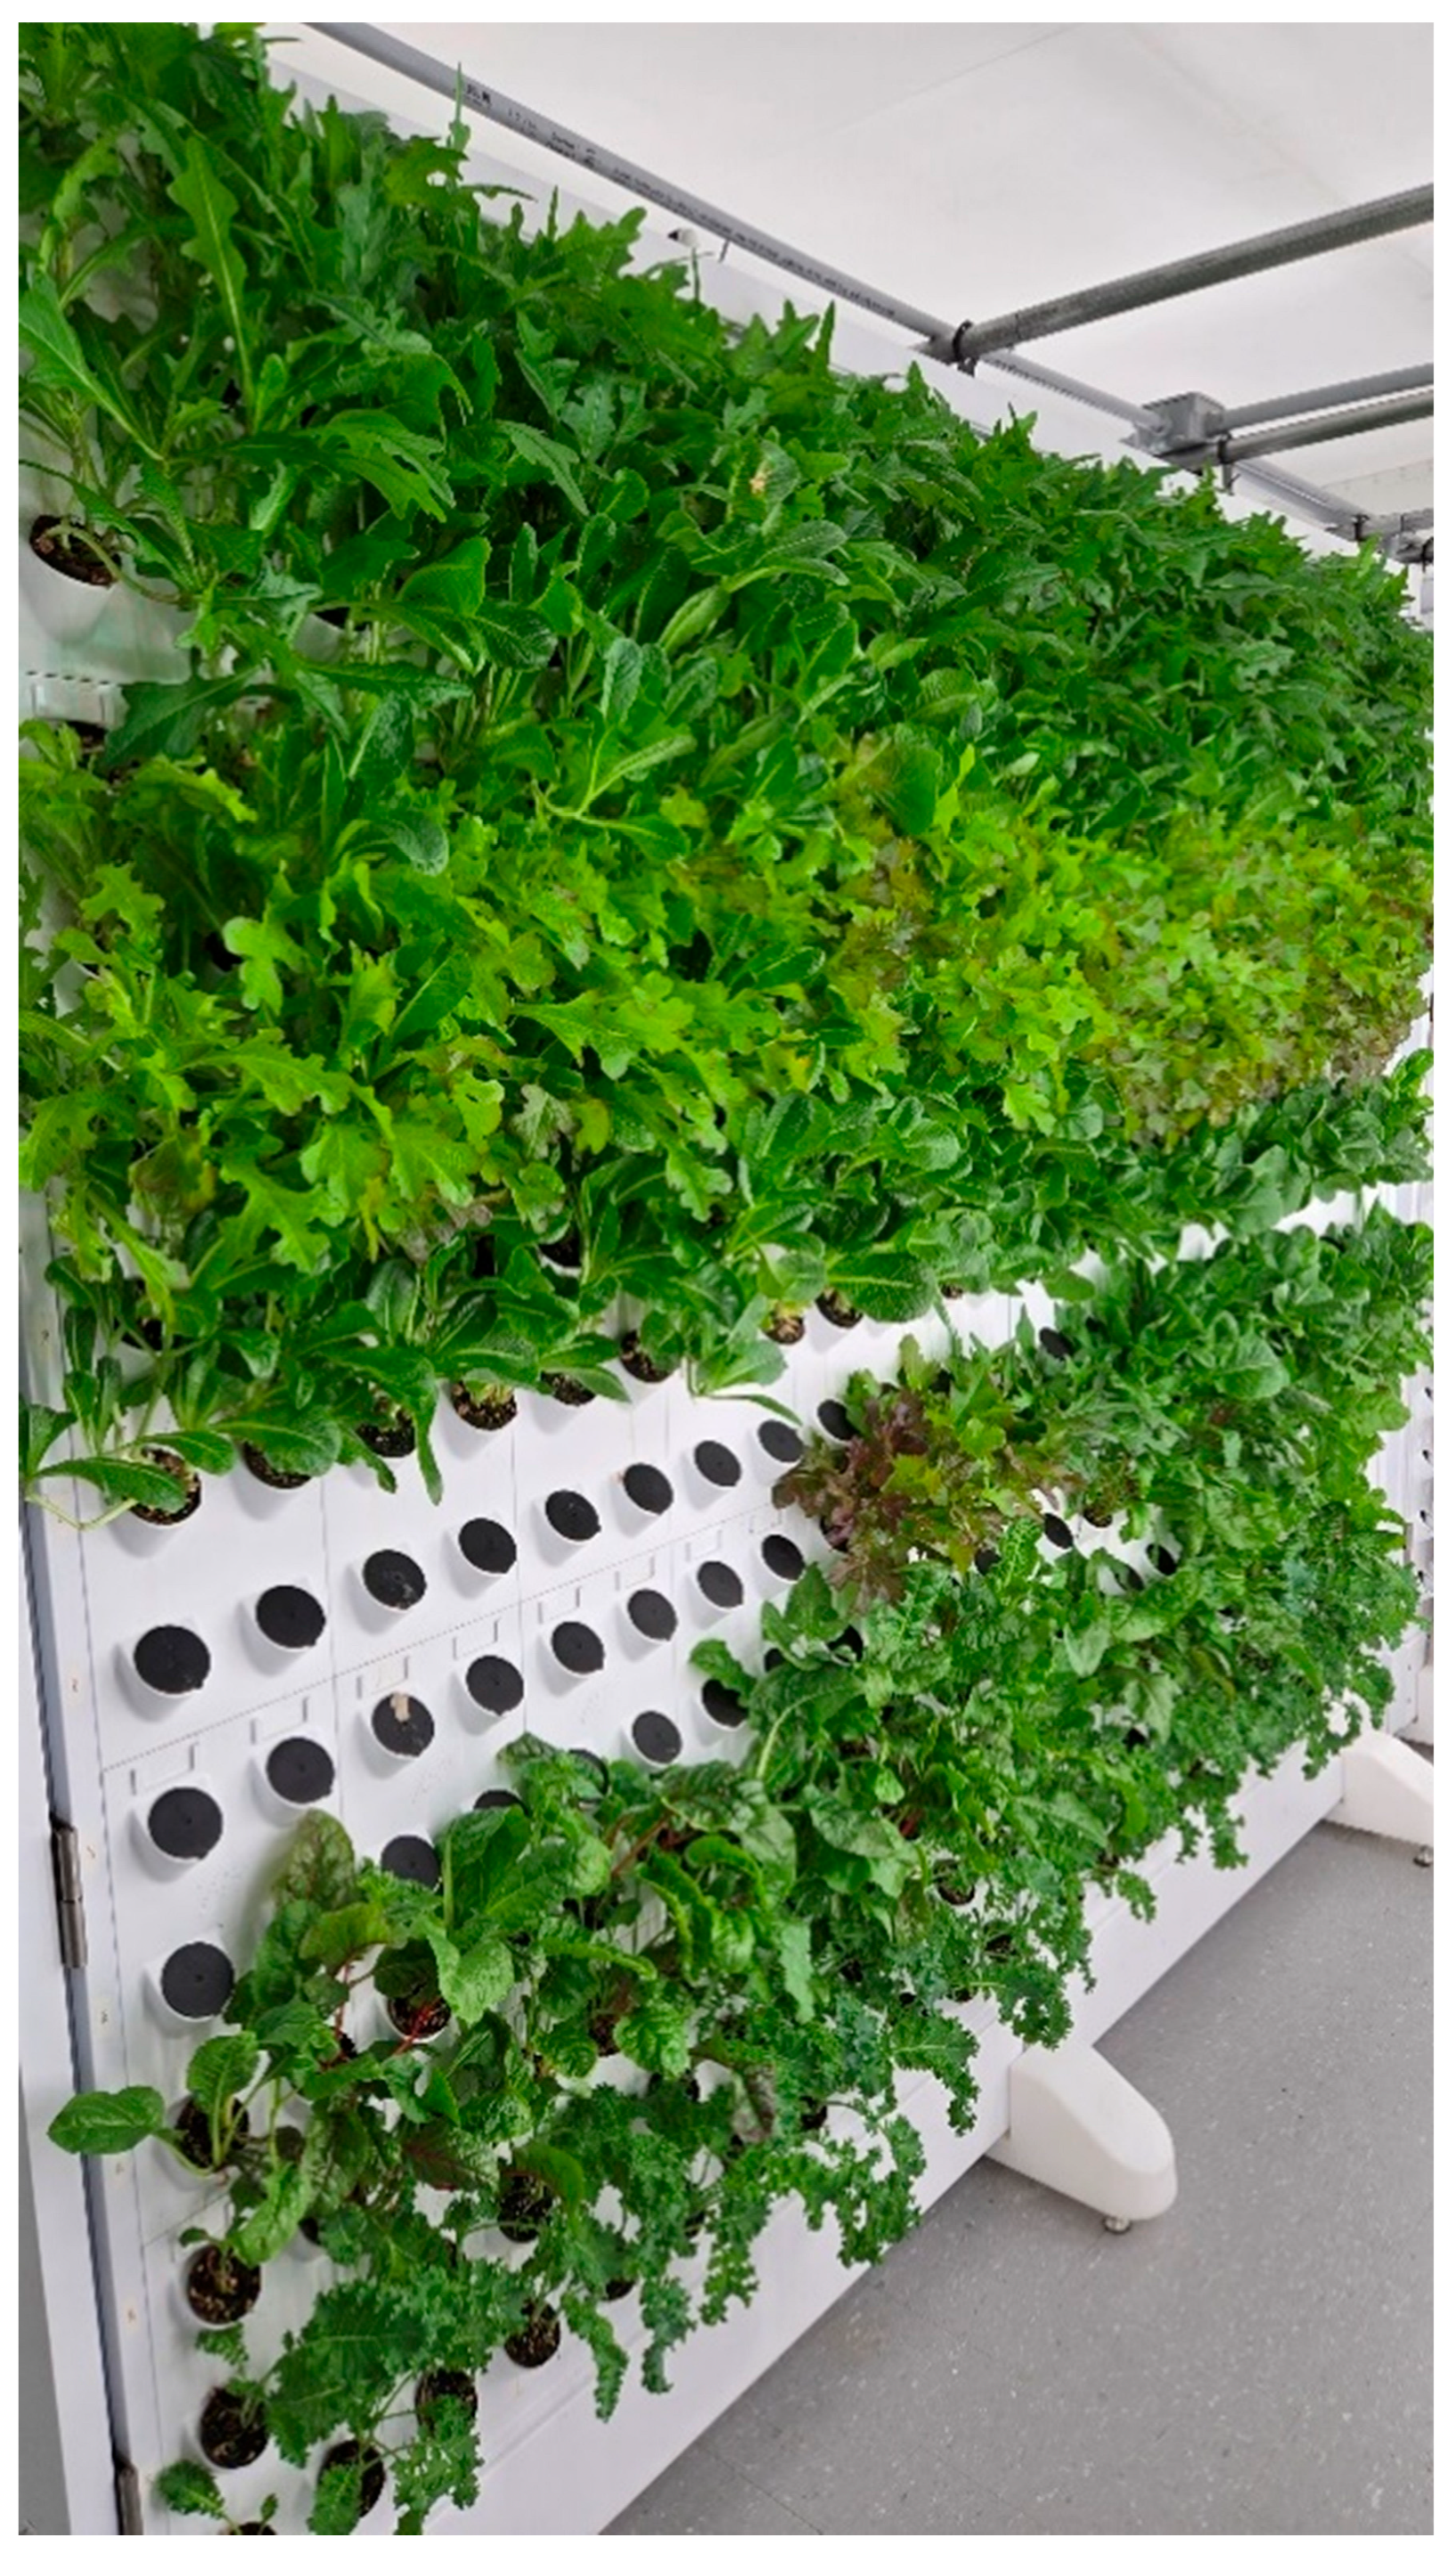
Three cultivar growth strategies were assessed. For the first run, (1) the two cultivars were Black Simpson and Red Salad Bowl (Figure 3). Their germination time was 3–5 days. In the experiment, one wall (720 ports) was entirely covered with Black Simpson, while half of the second wall was planted with Red Salad Bowl (300 ports). The cultivation periods, from seeding to the final harvest, were two months for both cultivars. The second and third approaches assessed were all commercial greens, including (2) Red Oak lettuce, Red Outrageous lettuce, and Romaine lettuce, and the (3) Swiss chard, which were cultivated with the average of four plants per pot (Figure 4). This trial aims to examine the effect of cultivating multiple plants per pot and to identify crops with the highest yields. These plants are structurally robust and less prone to damage during harvesting, making them ideal for inclusion in popular “spring mix” or “field greens” packs [48,49]. The cultivation period was two months for these crops as well. Red Oak lettuce, Red Outrageous lettuce, Romaine lettuce, and Swiss chard were respectively planted in 49, 47, 71, and 46 pots. The leaf picking started right at the beginning of the second month after the first day of planting (in the middle of the cultivation period) and was continued to be done with weekly intervals till the end of the cultivation period (last harvest before the plants get bolt). The yield and water use were measured for these experiments to estimate the revenue, the energy consumption, thereby the size of PV system, and the profitability of the whole system for a feasible range of capital and operation and maintenance costs. The experiments were conducted twice.
Figure 3.
Black Simpson and Red Salad Bowl cultivars on the grow walls of the agrotunnel.
Figure 4.
Cultivated lettuce and Swiss chard in the agrotunnel.
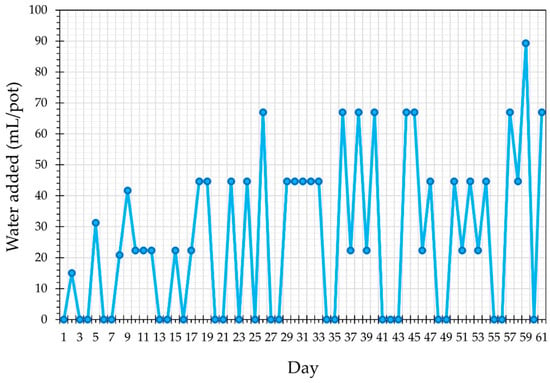
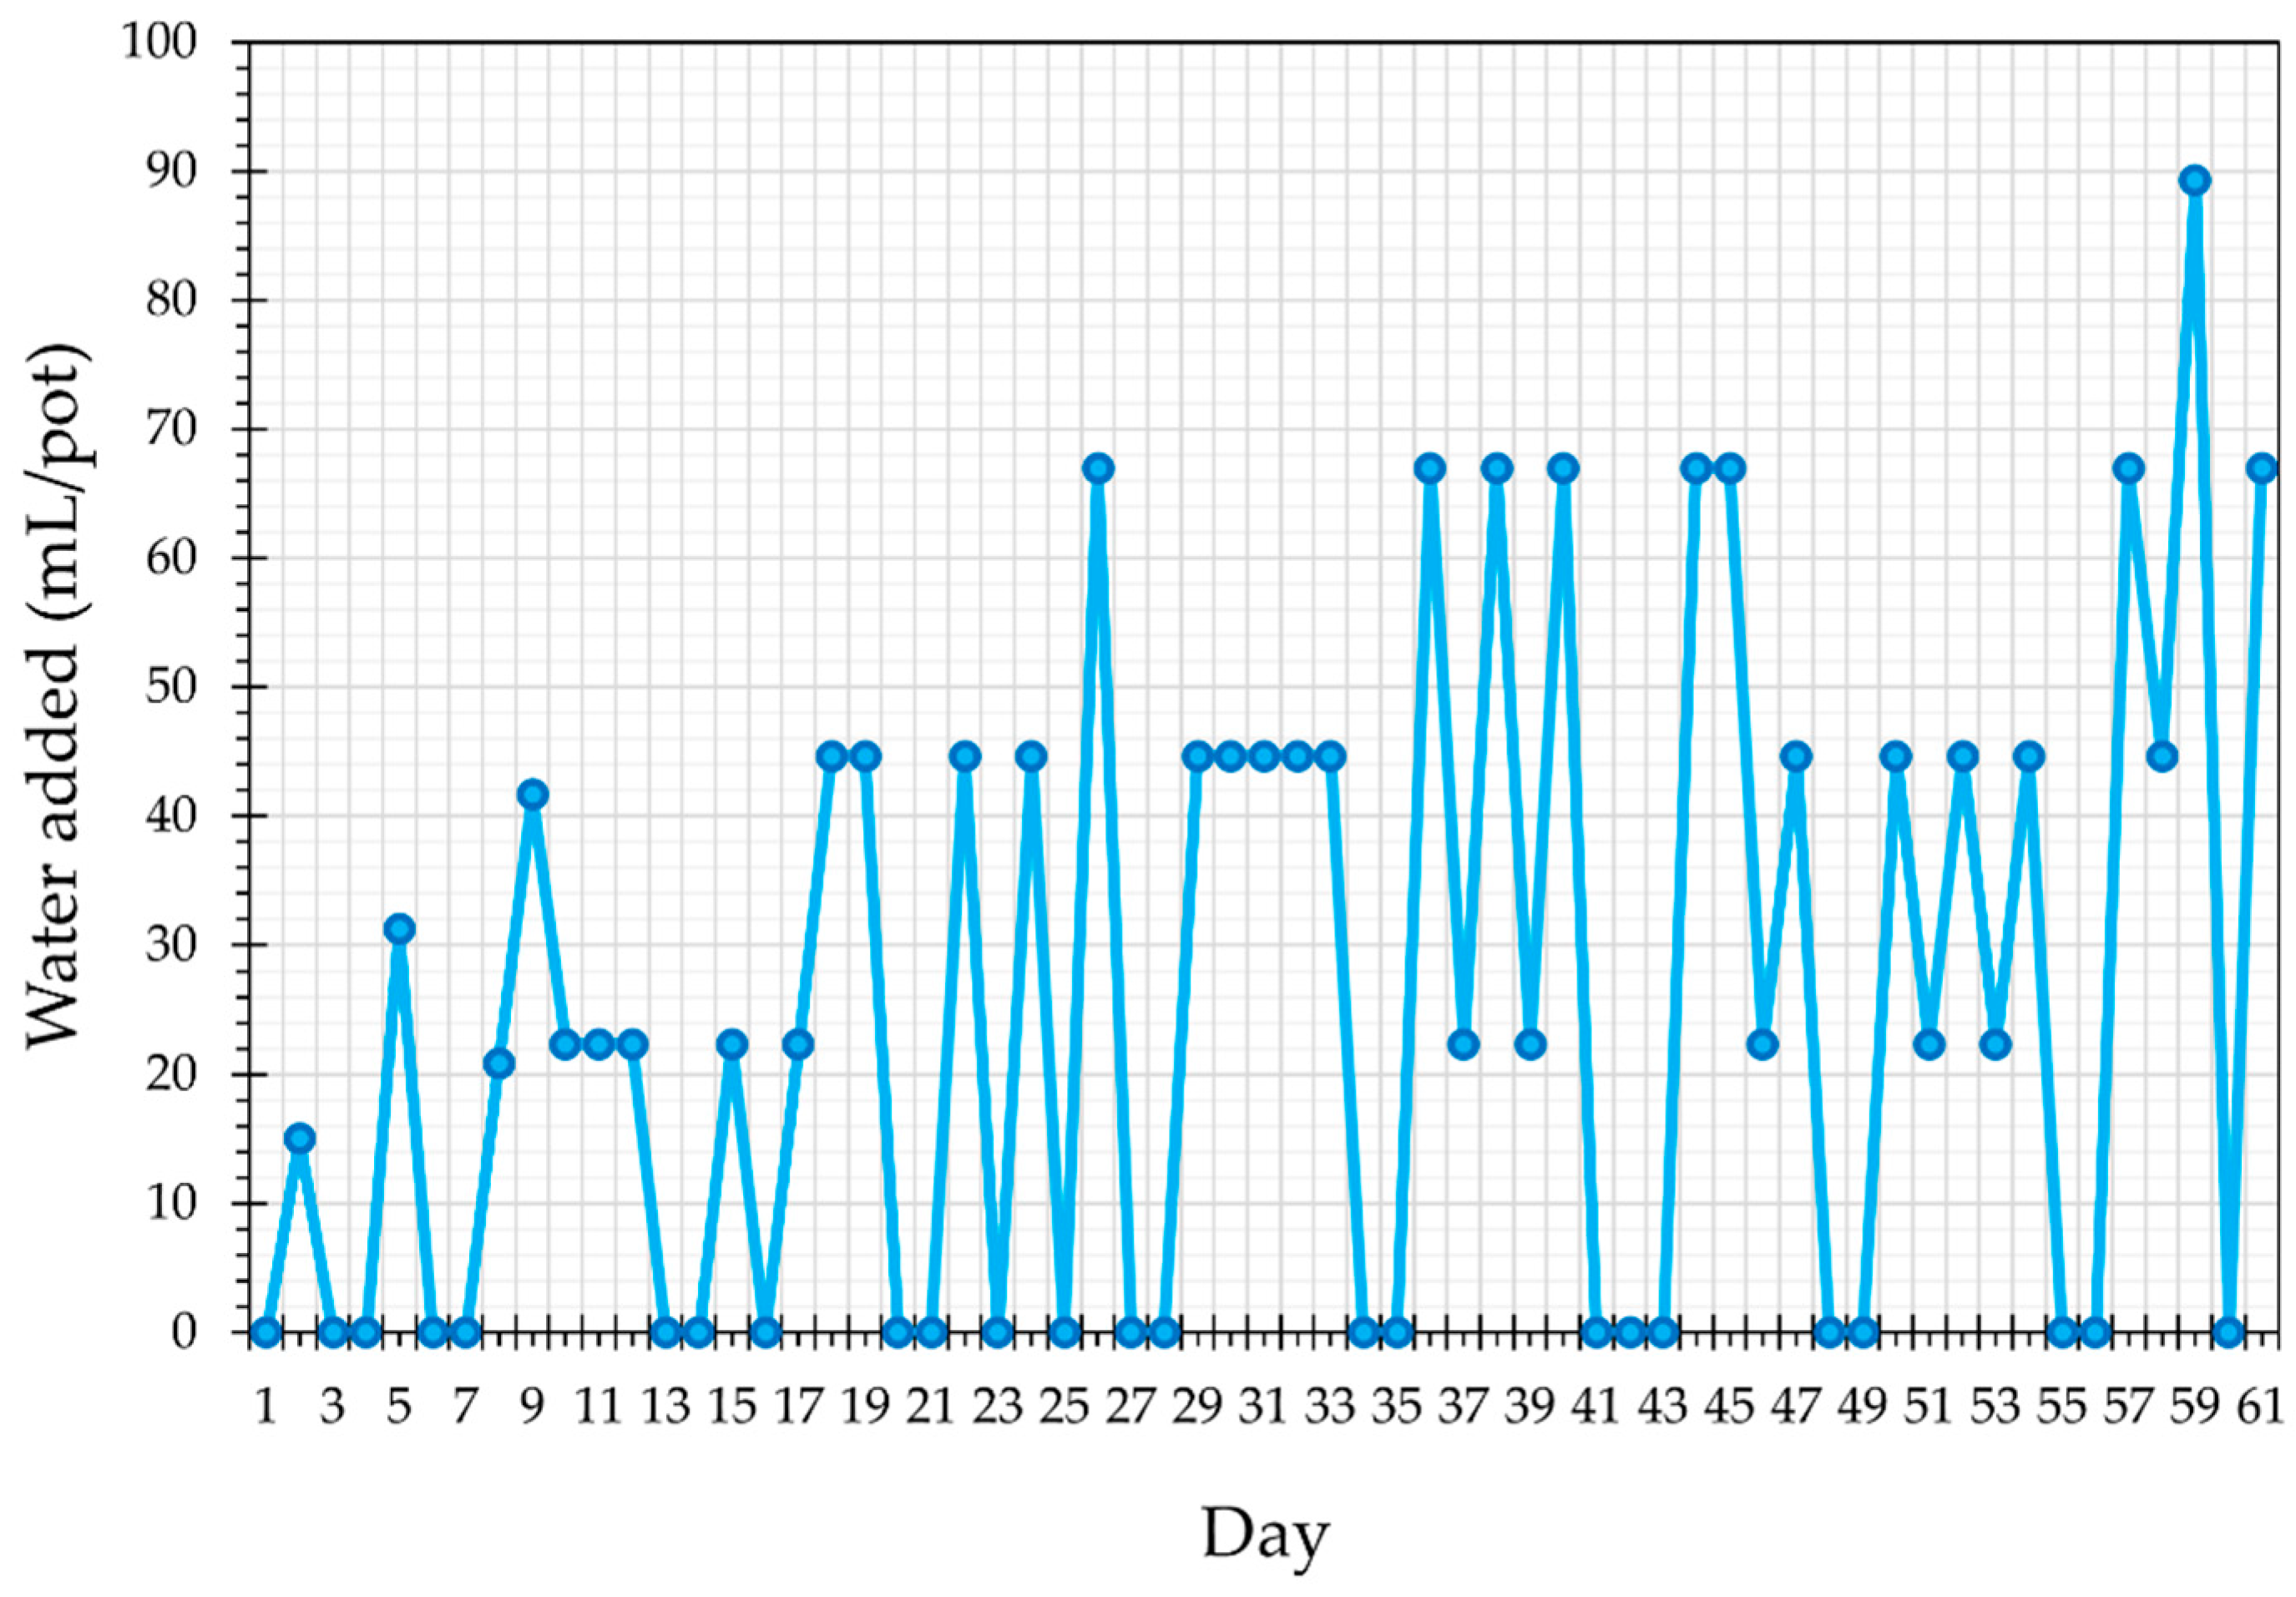
For all trials, Coco coir and Perlite mix was used as the growing substrate, and the crops were nourished with a controlled pH water and nutrient solution. The pH was maintained between 6.5 and 7.0, while the electrical conductivity (EC) ranged from 1.9 to 2.5 mS/cm. Dutch nutrient formulas Gro A (2-0-2) and Gro B (0-1-3) were added to the water to balance the EC levels. Watering frequencies and the amount of water added to the wall reservoirs throughout the cultivation process are plotted in Figure 5. Water is added to the reservoir of each wall, which contains 300 planted or active pots, and is then pumped to the pots. For commercial agrivoltaic agrotunnels, walls should be covered with crops at various stages of growth to ensure consistent food production year-round. Under such conditions, the average water consumption is estimated at 1.15–1.5 mL/h per pot.
Figure 5.
The watering frequency and amount provided for each pot.
2.3. Artificial Lighting System Analysis
Commercial Better Grow Lights (FSSC, London, ON, Canada), specifically designed for indoor vertical farming applications, are used in the agrotunnel. These lights are installed between true vertical walls in the aisles maintaining the 51 cm vertical distance from them. They comprise red (620–700 nm) with 28.9% energy contribution, white (425–650 nm) with 70.2% energy contribution, as well as far-red and penetrative InfraRed (IR) (700–820 nm) with 0.9% energy contribution [50], allowing for higher-density planting and stimulating plant growth at the cellular level [51]. The effectiveness of these LED lights has already been tested and compared to standard lighting [51], so spectrum analysis will not be conducted in this study. Instead, a PPFD light map will be generated for the agrivoltaic agrotunnel’s walls with respect to their location in the building. The distance between the LED lights and the control walls will be varied (41, 51, and 61 cm) to find out the most appropriate PPFD range for lettuce growing under the structural restrictions of the building. The potential possibility of economic savings by increasing the light intensity and reducing the photoperiod (while keeping the plant’s DLI) will be assessed. Ultimately, a thorough discussion will address how wall/light location affects the light intensity and the economic performance of the agrivoltaic system.
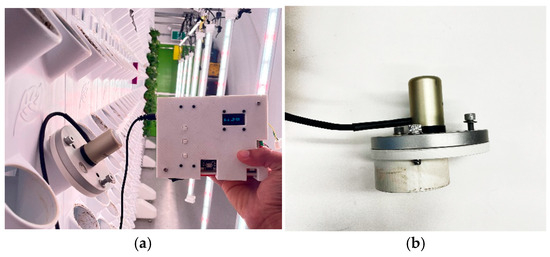
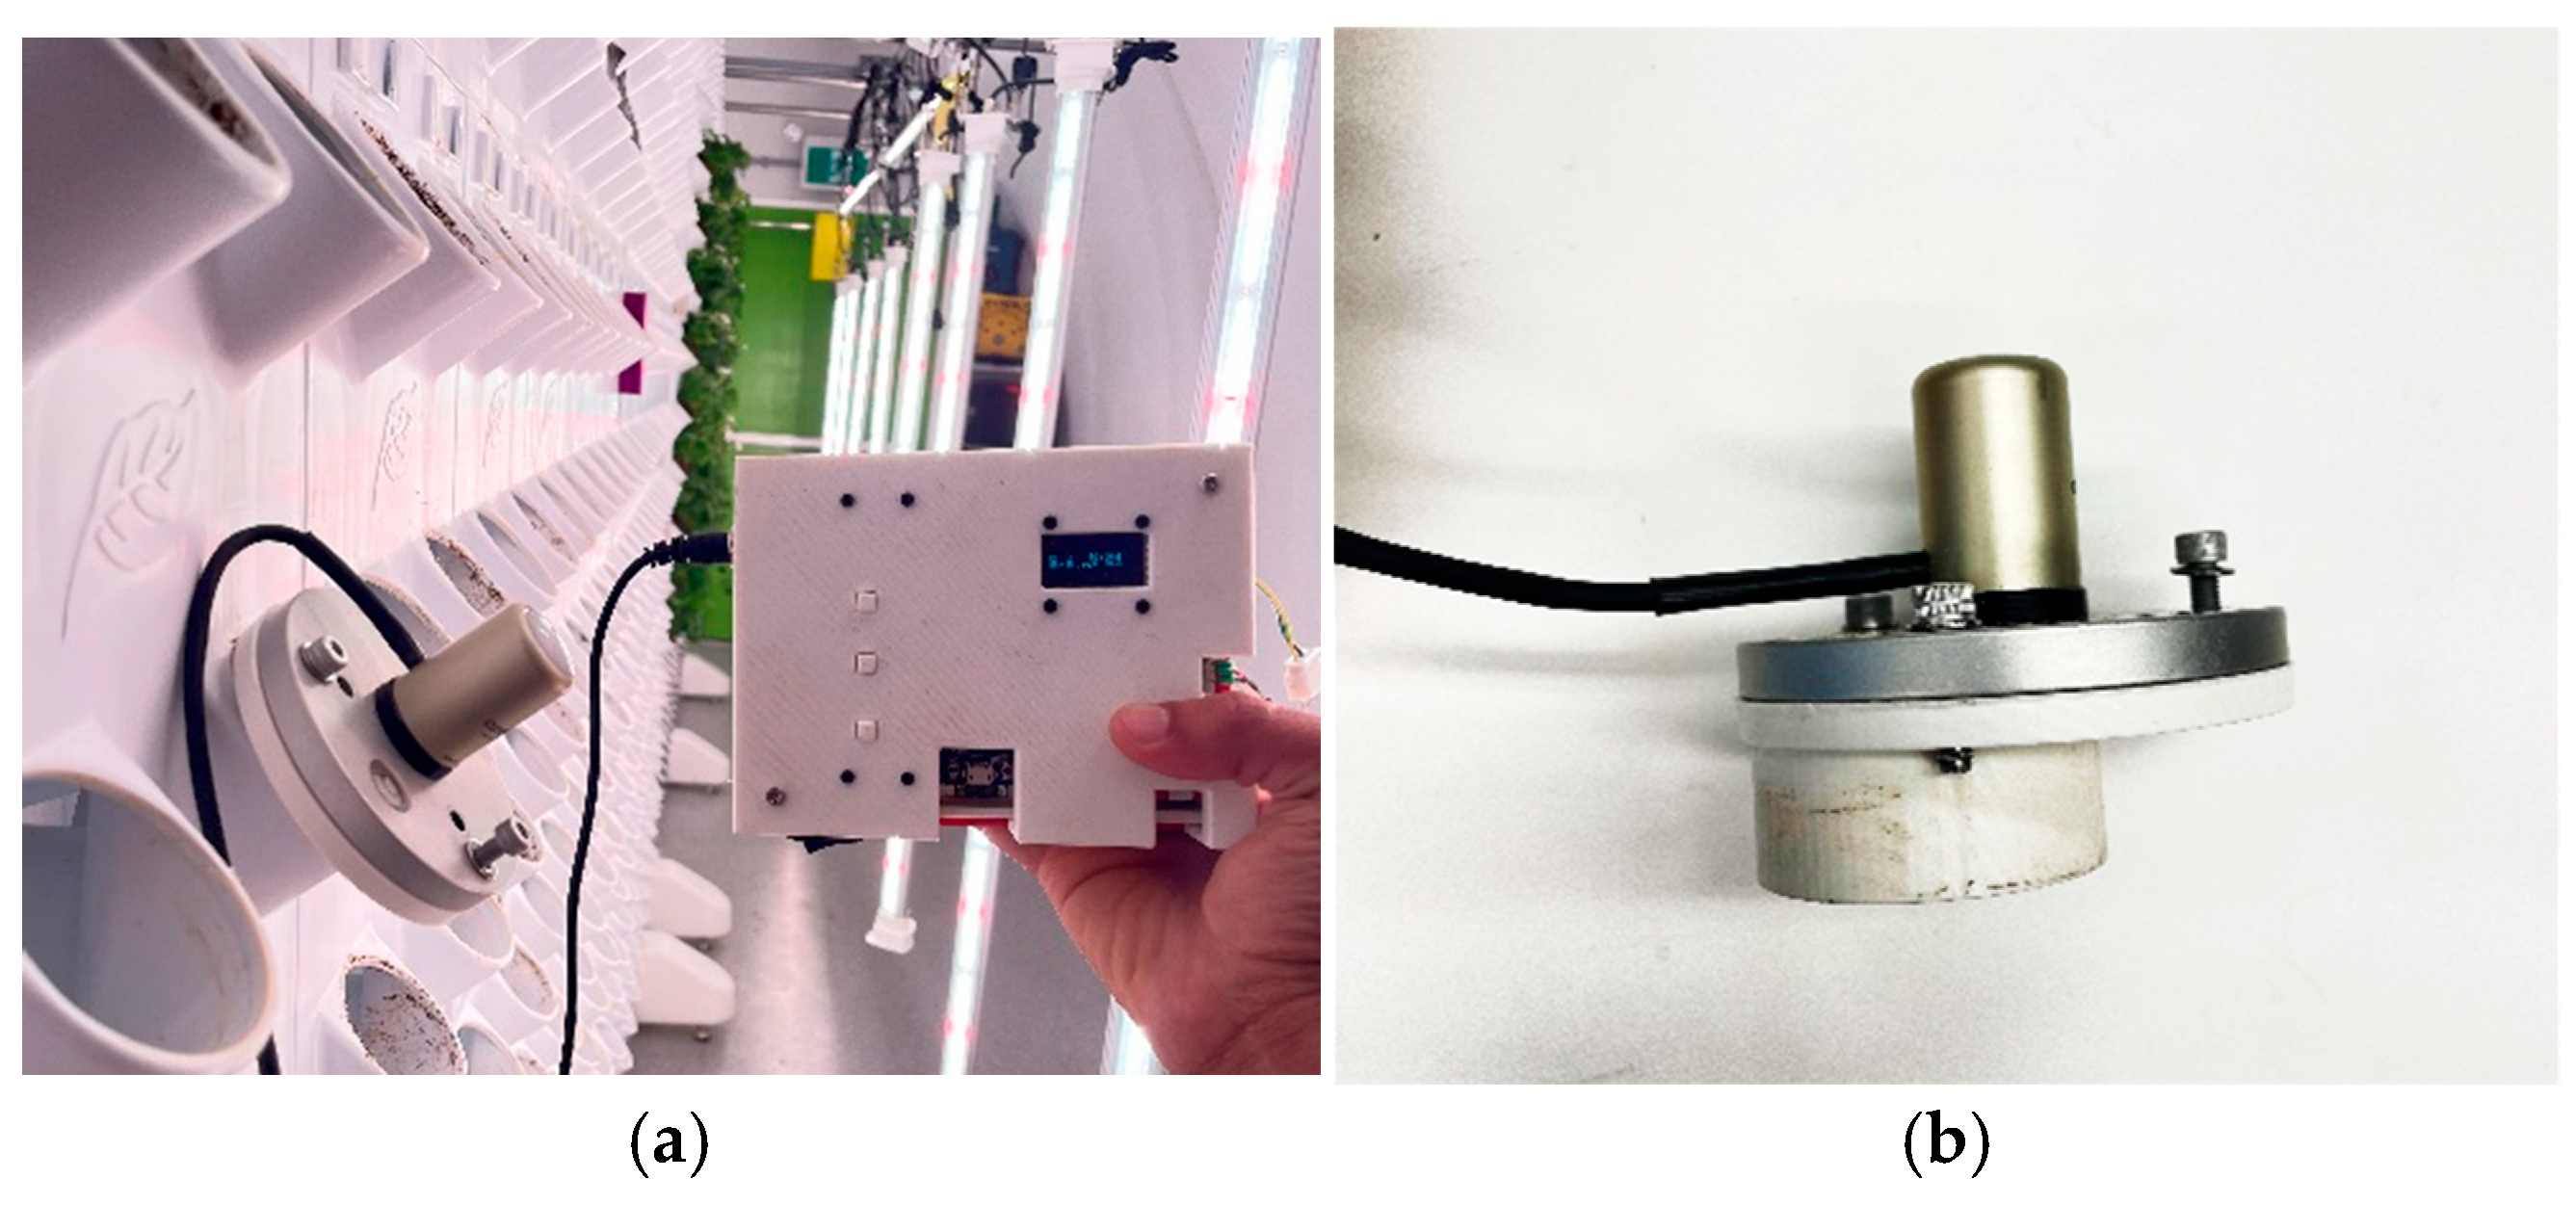
An Apogee SQ-500-SS PAR sensor (Logan, UT, USA) is used to measure PPFD values on the walls [52]. The open-source electronic board is used to record the values in txt format with only one click (Figure 6a). A 3D-printed holder (Figure 6b) stabilizes the optical sensor at each port on the walls, ensuring consistency across all measurements, and is available in the OSF data repository. The Apogee SQ-500-SS PAR sensor is placed in each port and allowed to stabilize before the measurement is saved. Up to five readings on some ports are taken to observe variation in measurements. The deviation of readings in a single port is minimal and never exceeded 0.05 μmol/m2/s.
Figure 6.
The Apogee SQ-500-SS PAR sensor: (a) mounted on the wall with controller, (b) with 3D-printed holder.
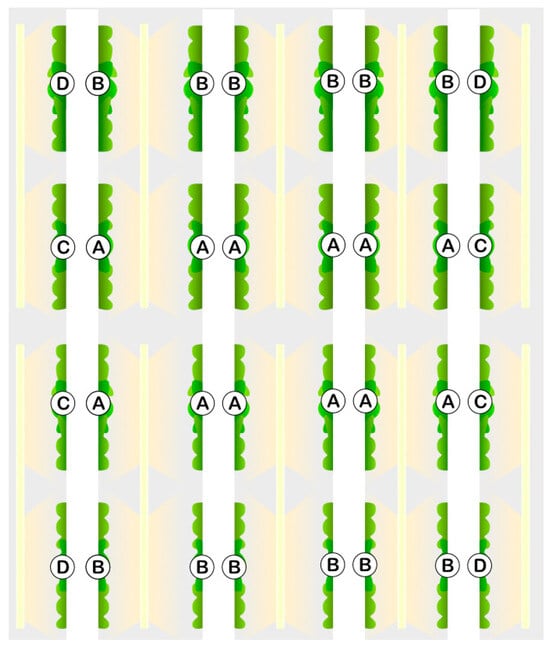
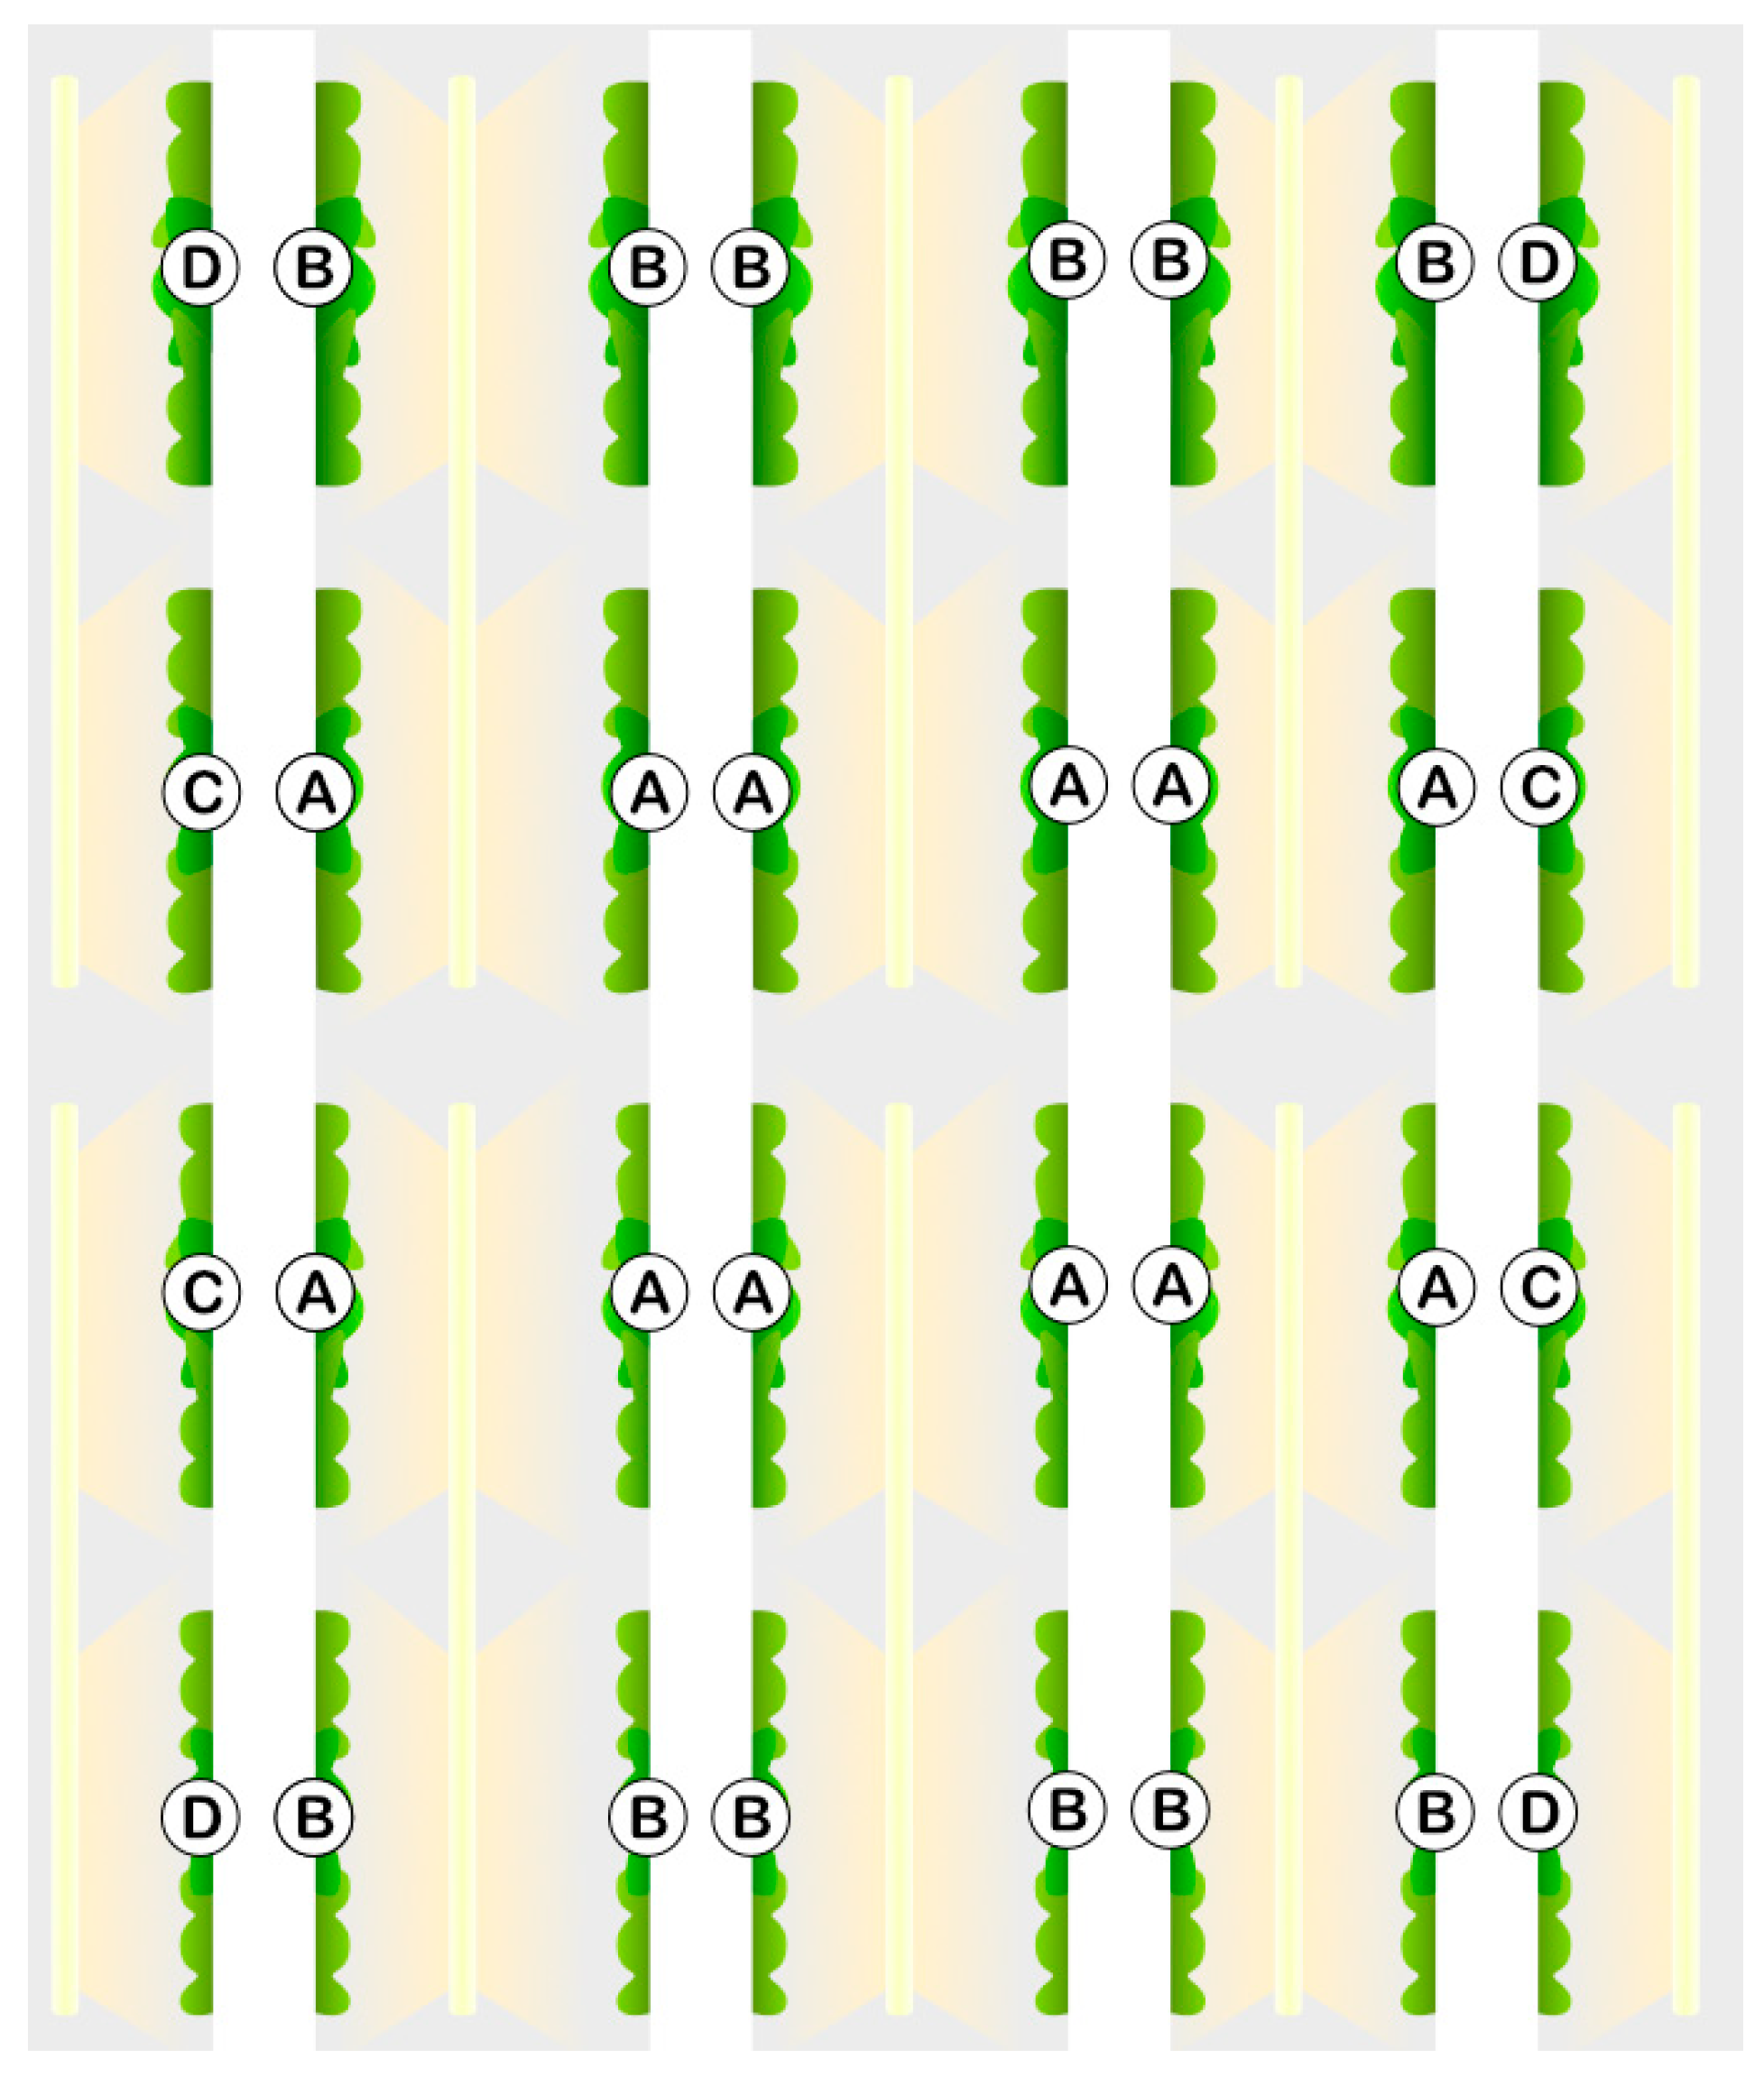
The walls are subdivided into four categories as shown in Figure 7 according to their position in the agrivoltaics agrotunnel relative to other lights, or lack thereof, within its proximity: category A—surrounded by other lights and walls from all directions; category B—surrounded by other lights and walls from the front and back but either the right or left side is empty; category C—surrounded by other lights and walls from the right and left but either the front or back side is empty; and category D—one side from the right or left and one side from the front or back is empty. These categories are defined based on the placement of lights and walls in the prototype version of the agrotunnel to help identify the optimal layout for the MAX version.
Figure 7.
Subdivision of walls based on their location with respect to the other walls and lights in the agrotunnel.
2.4. Technoeconomic Analysis
The technical equipment used to operate the agrivoltaic agrotunnel includes LED grow lights, grow walls, microgreen racks, water pumps, circulating fans, a dehumidifier, heat pumps, and an insulated envelope. All of these contribute to either thermal or electrical loads. Electrical loads are generated by equipment such as lights and pumps, as well as HVAC devices like the dehumidifier, fans, and heat pumps, which meet the agrotunnel’s thermal demands. The methodology for modeling these loads has been detailed in previous work [17]. For the MAX layout, however, the quantity of certain devices has increased. A full description of the technical equipment can be found in Table 1 for the MAX layout. The whole agrotunnel is supposed to be powered by a net-metered grid-connected PV system, which will be optimally sized using open-source Solar Alone Multi-objective Advisor (SAMA) software (version 1.0.2, Western University, London, ON, Canada) [53,54].
Table 1.
The technological information of the equipment used in the agrotunnel MAX layout.
The technoeconomic inputs of SAMA are expressed in Table 2. All these values are based on the case of London, ON. Utility rates are derived from London Hydro data, incorporating applicable adjustments and taxes. Economic factors include the nominal discount rate and expected inflation, representing assumptions used for lifetime financial evaluation. The baseline on-grid PV system cost is set at $1761 USD/kW, according to the 2023 NREL cost benchmark [55,56,57]. PV operation and maintenance (O&M) expenses are assumed at an average of $16.5 USD/kW/year [58].
Table 2.
Technoeconomic inputs of SAMA optimization software for on-grid PV systems.
The revenue gained by producing lettuce and chards will be calculated based on their average annual yields. Harvest data obtained from the cultivation period () in kg per pot for these cultivars is extrapolated to a full year (kg per year) by Equation (1):
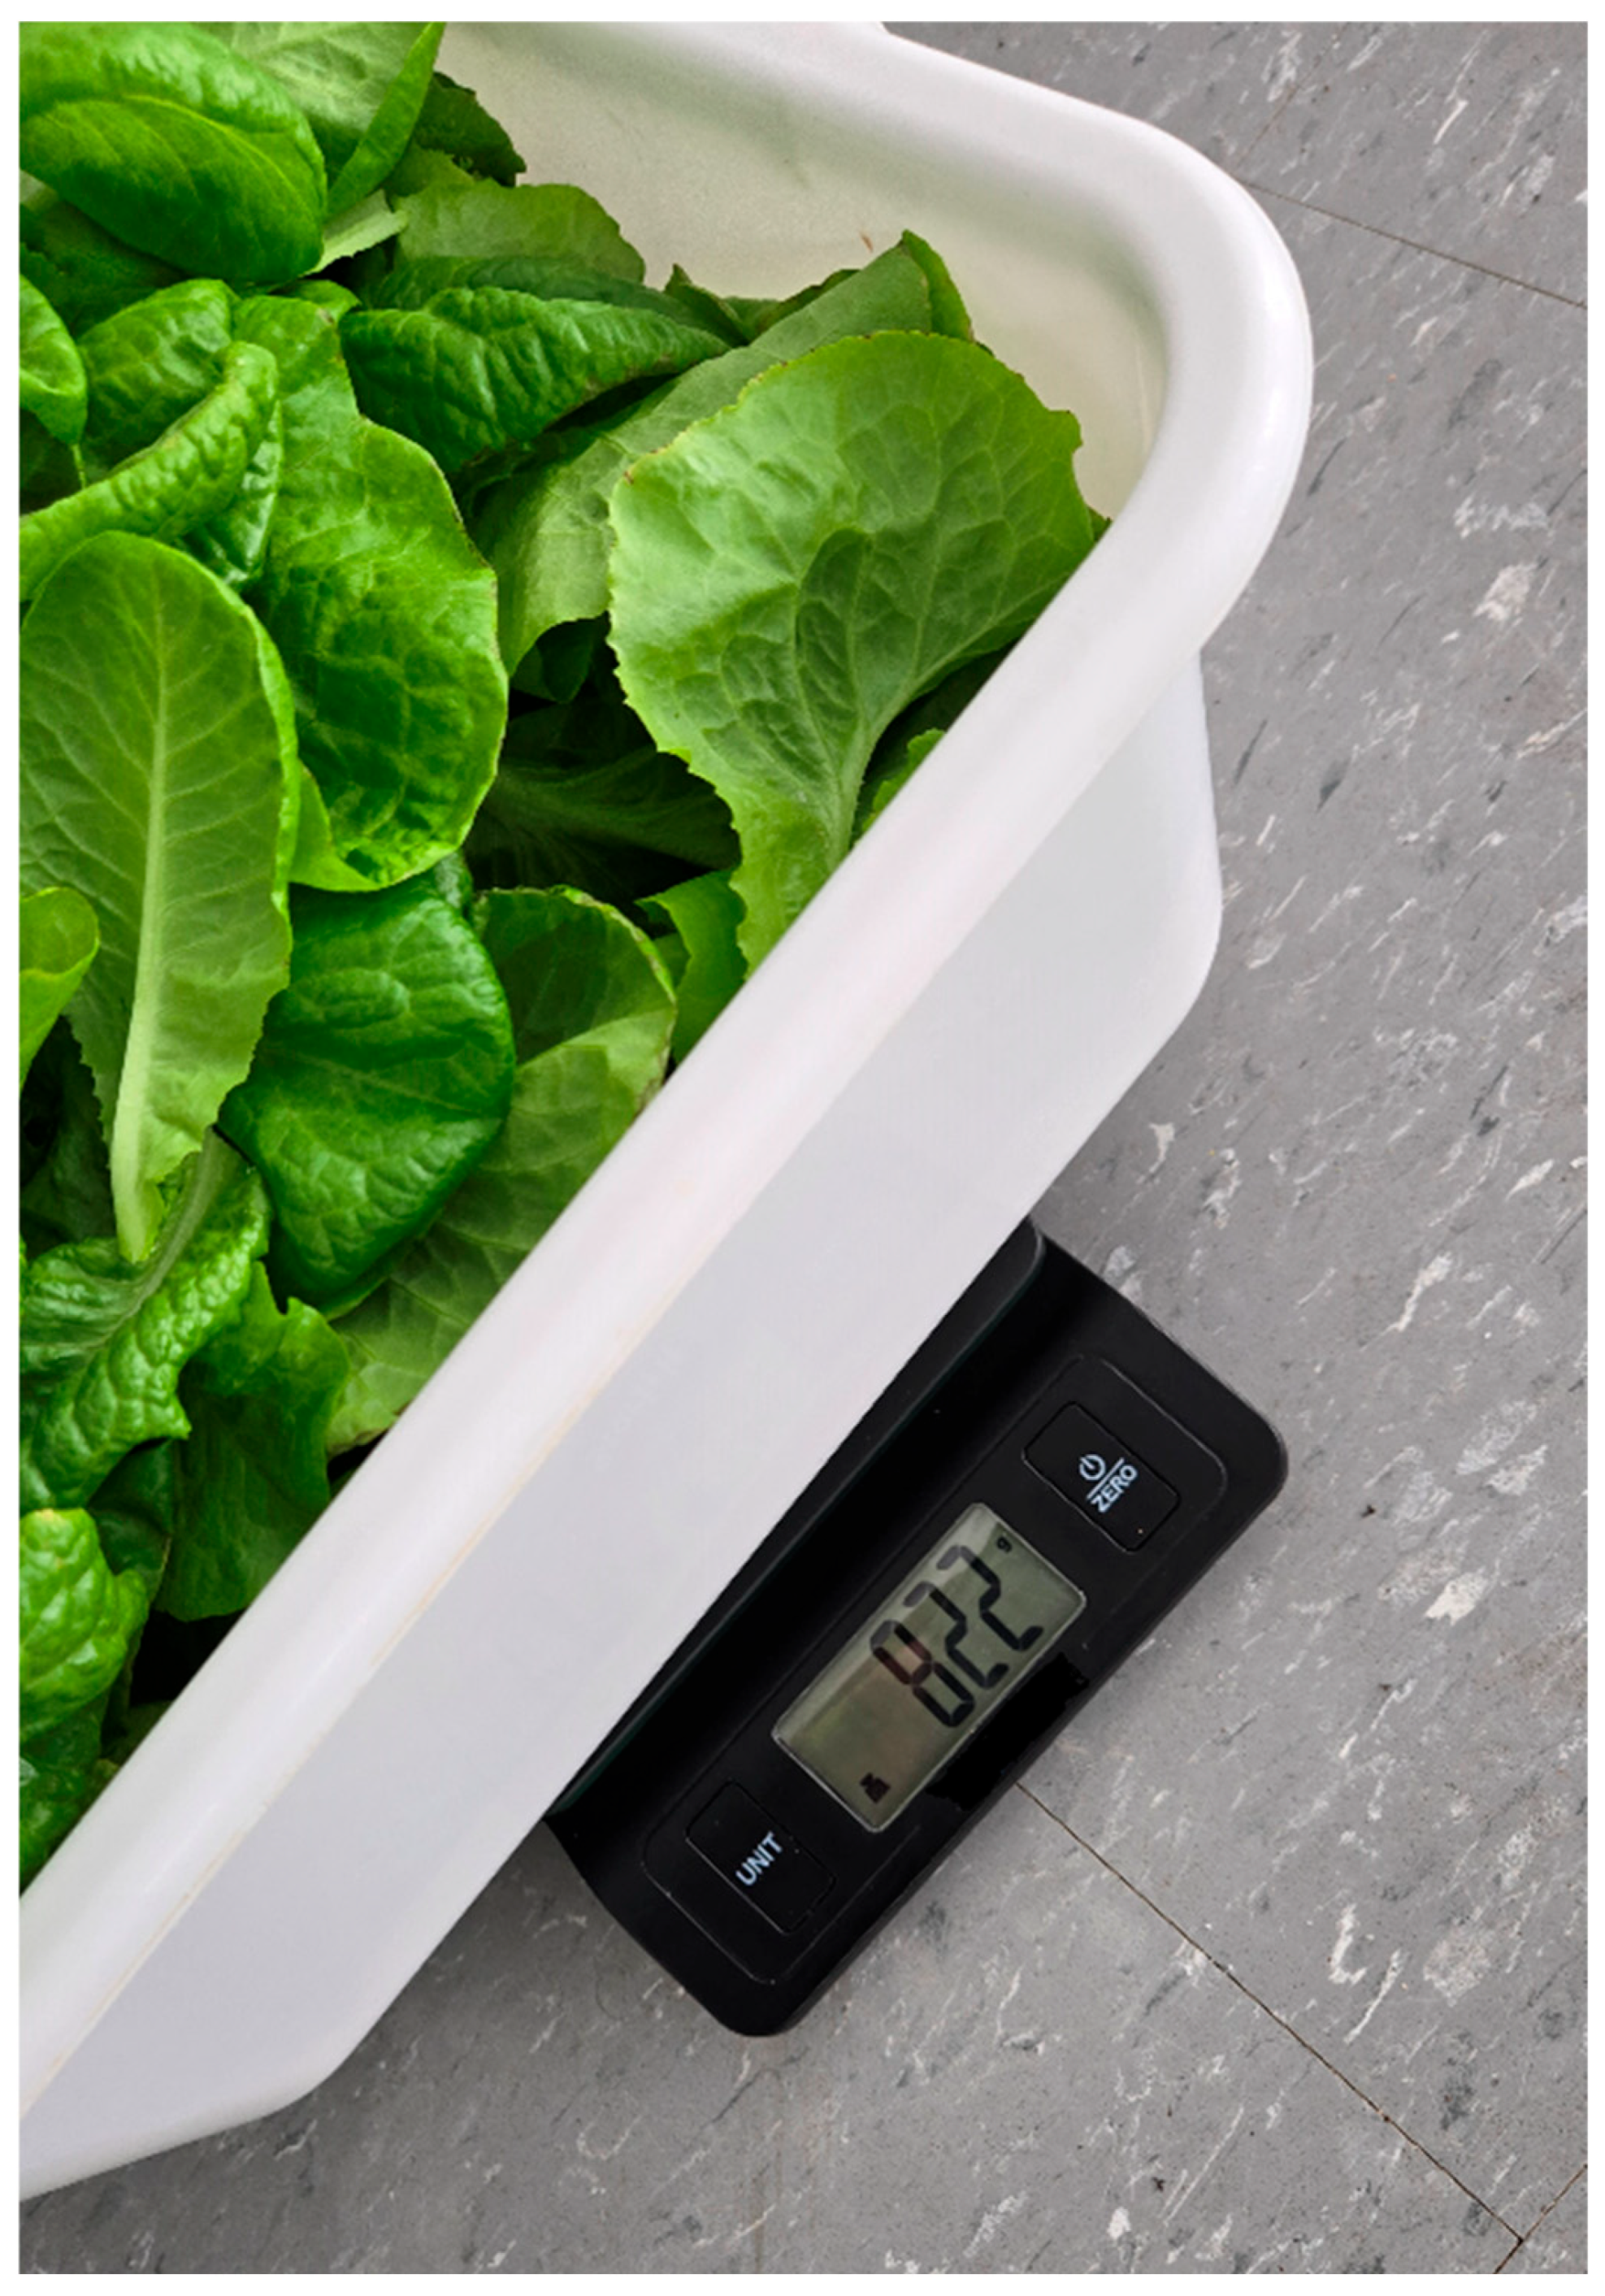
where is the total number of ports to be harvested in the MAX layout and denotes the maximum number of cultivation cycles per year. Harvesting has been carried out at weekly intervals, with the weight of each harvest measured using a scale, as shown in Figure 8.
Figure 8.
Weighing the harvested products using a digital scale.
Specific yield () values can be calculated per gross and cultivated area. The total land area of the agrotunnel is equal to 111 m2, and approximately 70% is dedicated for cultivars. Hence, Equation (2) results in the for each market product. stands for the land area in m2.
The calories per port were determined based on the calories per grams of the cultivars, which are reported in Table 3.
Table 3.
Calorie values per 100 g of Romaine lettuce and Swiss chard.
In the next step, a comprehensive market analysis will evaluate retail and wholesale prices for lettuce, and the sensitivity of revenue to price fluctuations will be assessed based on seasonal and regional variations (U.S., Canada, and Mexico). Finally, the projected income statement will estimate the anticipated revenue for the MAX agrivoltaic agrotunnel dedicated to lettuce production by either Equation (3) or Equation (4) for the constant price or seasonally variable price cases, respectively.
The ROI metric is used to illustrate the system’s profitability by expressing the ratio of net profit () to the total incurred costs or net present cost (), as shown in Equation (5).
includes the total initial costs of the agrotunnel, which is manufactured by FSSC as a turnkey solution and its price may vary between $255,000 USD and $555,000 USD [57], as well as the on-grid PV system, including PV modules, installation, and balance of system (BOS) parts, such as racking, wiring, inverters, switches, meters. refers to all the costs related to labor, supplies, consumables, and maintenance activities for both the agrotunnel and the PV system. Net cash flow () will be estimated by subtracting the total from the revenue over the system lifetime (25 years), as provided in Equation (6). FSSC has reported the total annual of the agrotunnel itself around $79,000 USD [66]. The of the agrivoltaic system is calculated by SAMA. Net present cost (NPC) shows the total investment needed to build and run the agrivoltaic agrotunnel during its entire operation period (), and the calculation considers a discount rate () of 2.75% in Canada [67], as mentioned in Equation (7). The electricity rates are obtained from London Hydro.
Lettuce’s market price is influenced by seasonal variations (Table 4) and geographical differences (Table 5), with notable differences across the U.S., Canada, and Mexico (Table 6). Prices typically increase during colder months, particularly in North America, due to reduced local production and increased reliance on imports. For instance, lettuce prices in the U.S. often surge due to crop shortages in California, a key growing region, during winter months [68,69]. In contrast, Mexico benefits from a more stable climate, allowing for consistent production and lower prices year round [69,70]. Retail prices in Mexico range from USD 0.47 to USD 0.67 per kilogram [69,70], whereas in Canada, they fluctuate between USD 1.23 and USD 4.79 per kilogram, particularly when impacted by winter imports [71,72]. The CAD to USD and the MXN to USD exchange rates are assumed to be 1.43 and 19.6, respectively, at the time of analysis [73]. All the products in the agrotunnel are effectively organic although they are not able to be labeled as such under current regulations [74]. One profitable option for selling them is by offering mix packs, commonly referred to as “field greens” or “spring mix” in Canada. In Canadian markets, prices for organic spring mixes show a range across various store categories (Table 7). For instance, luxury retailers like Whole Foods sell organic spring mix at CAD 8.12 per 283 g pack (CAD 28.70/kg), while budget stores like Walmart offer the same product for CAD 6.97 per 283 g pack (CAD 24.63/kg). In remote northern areas of Canada, the price for fresh produce can be significantly higher due to the high cost of transportation and the lack of infrastructure, making access to fresh food challenging for northern communities [75,76]. This variation highlights how organic lettuce products command significantly higher prices, often four to five times more than conventional lettuce, supporting the potential feasibility of agrotunnel systems in premium markets. The U.S. retail price range falls between USD 1.93 and USD 3.86 per kilogram, while wholesale prices vary from USD 1.35 to USD 2.70 per kilogram [69].
Table 4.
Lettuce seasonal price data in Canada, Mexico, and the U.S.
Table 5.
Average lettuce price in significant cities of Canada, the U.S., and Mexico.
Table 6.
Geographical price variations in lettuce across Canada, Mexico, and the U.S.
Table 7.
Price comparison of organic field greens/spring mixes in Canadian markets (retail, wholesale).
3. Results
The results section presents the key findings of the study, starting with the lighting map analysis results, followed by yield values, and concluding with revenue evaluations.
3.1. Lighting System Analysis
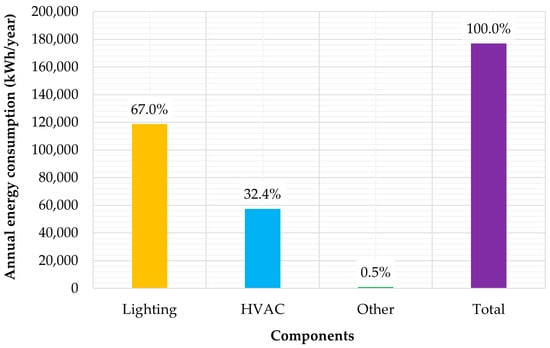
Figure 9 illustrates the energy consumption of all contributors including the whole system and the main components (lighting, HVAC, and other miscellaneous loads). It shows that 67% of the total energy consumption (118,654 kWh/year) in the agrotunnel is attributed to the lighting system. This share was 89% in the previous study for the pilot version, with less than half production level but with the same land area. The declined share in lighting energy indicates that increasing the production capacity further imposes the load on HVAC systems than the lighting system on the constant total gross land area. In addition, in the previous energy model for the pilot version, circulating fans were not included in the building, which operate 24/7 causing considerable energy consumption.
Figure 9.
Total energy consumption breakdown in the MAX agrotunnel.
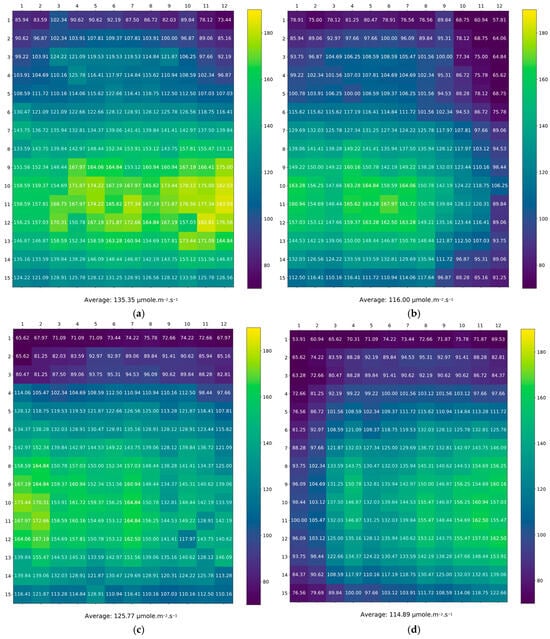
The light intensity on the walls in each category is evaluated in this section, and potential changes in the distance between the LEDs and the walls are analyzed by studying their impact on PPFD values. The PPFD map for each wall category is presented for the baseline scenario, where the distance between the walls and LEDs is 51 cm (Figure 10). As shown in Figure 10, walls in categories A and C receive higher average PAR light intensities (135.35 and 125.77 μmol/m2/s, respectively), due to the reflective effect of the side LEDs. For walls B and D, however, it was expected that ports on these walls would receive lower PPFD compared to their counterparts (walls A and C). The average PPFD received by walls B and D at the 51 cm distance is 116.00 and 114.89 μmol/m2/s, respectively.
Figure 10.
PPFD map of four category grow walls for the baseline scenario (51 cm between the wall and the LEDs): (a) category A, (b) category B, (c) category C, and (d) category D.
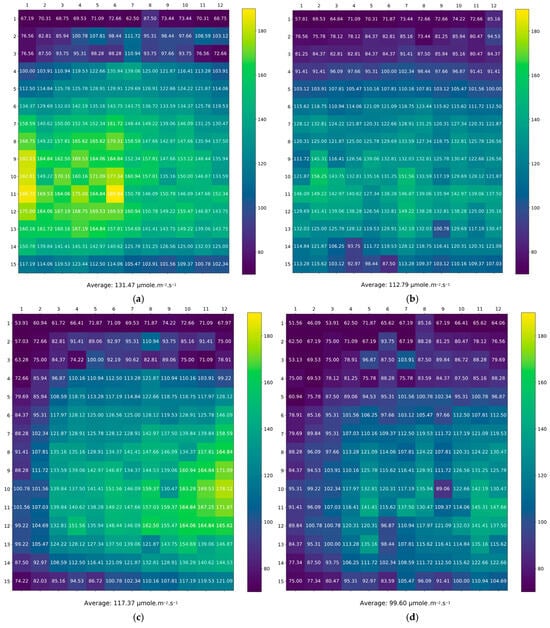
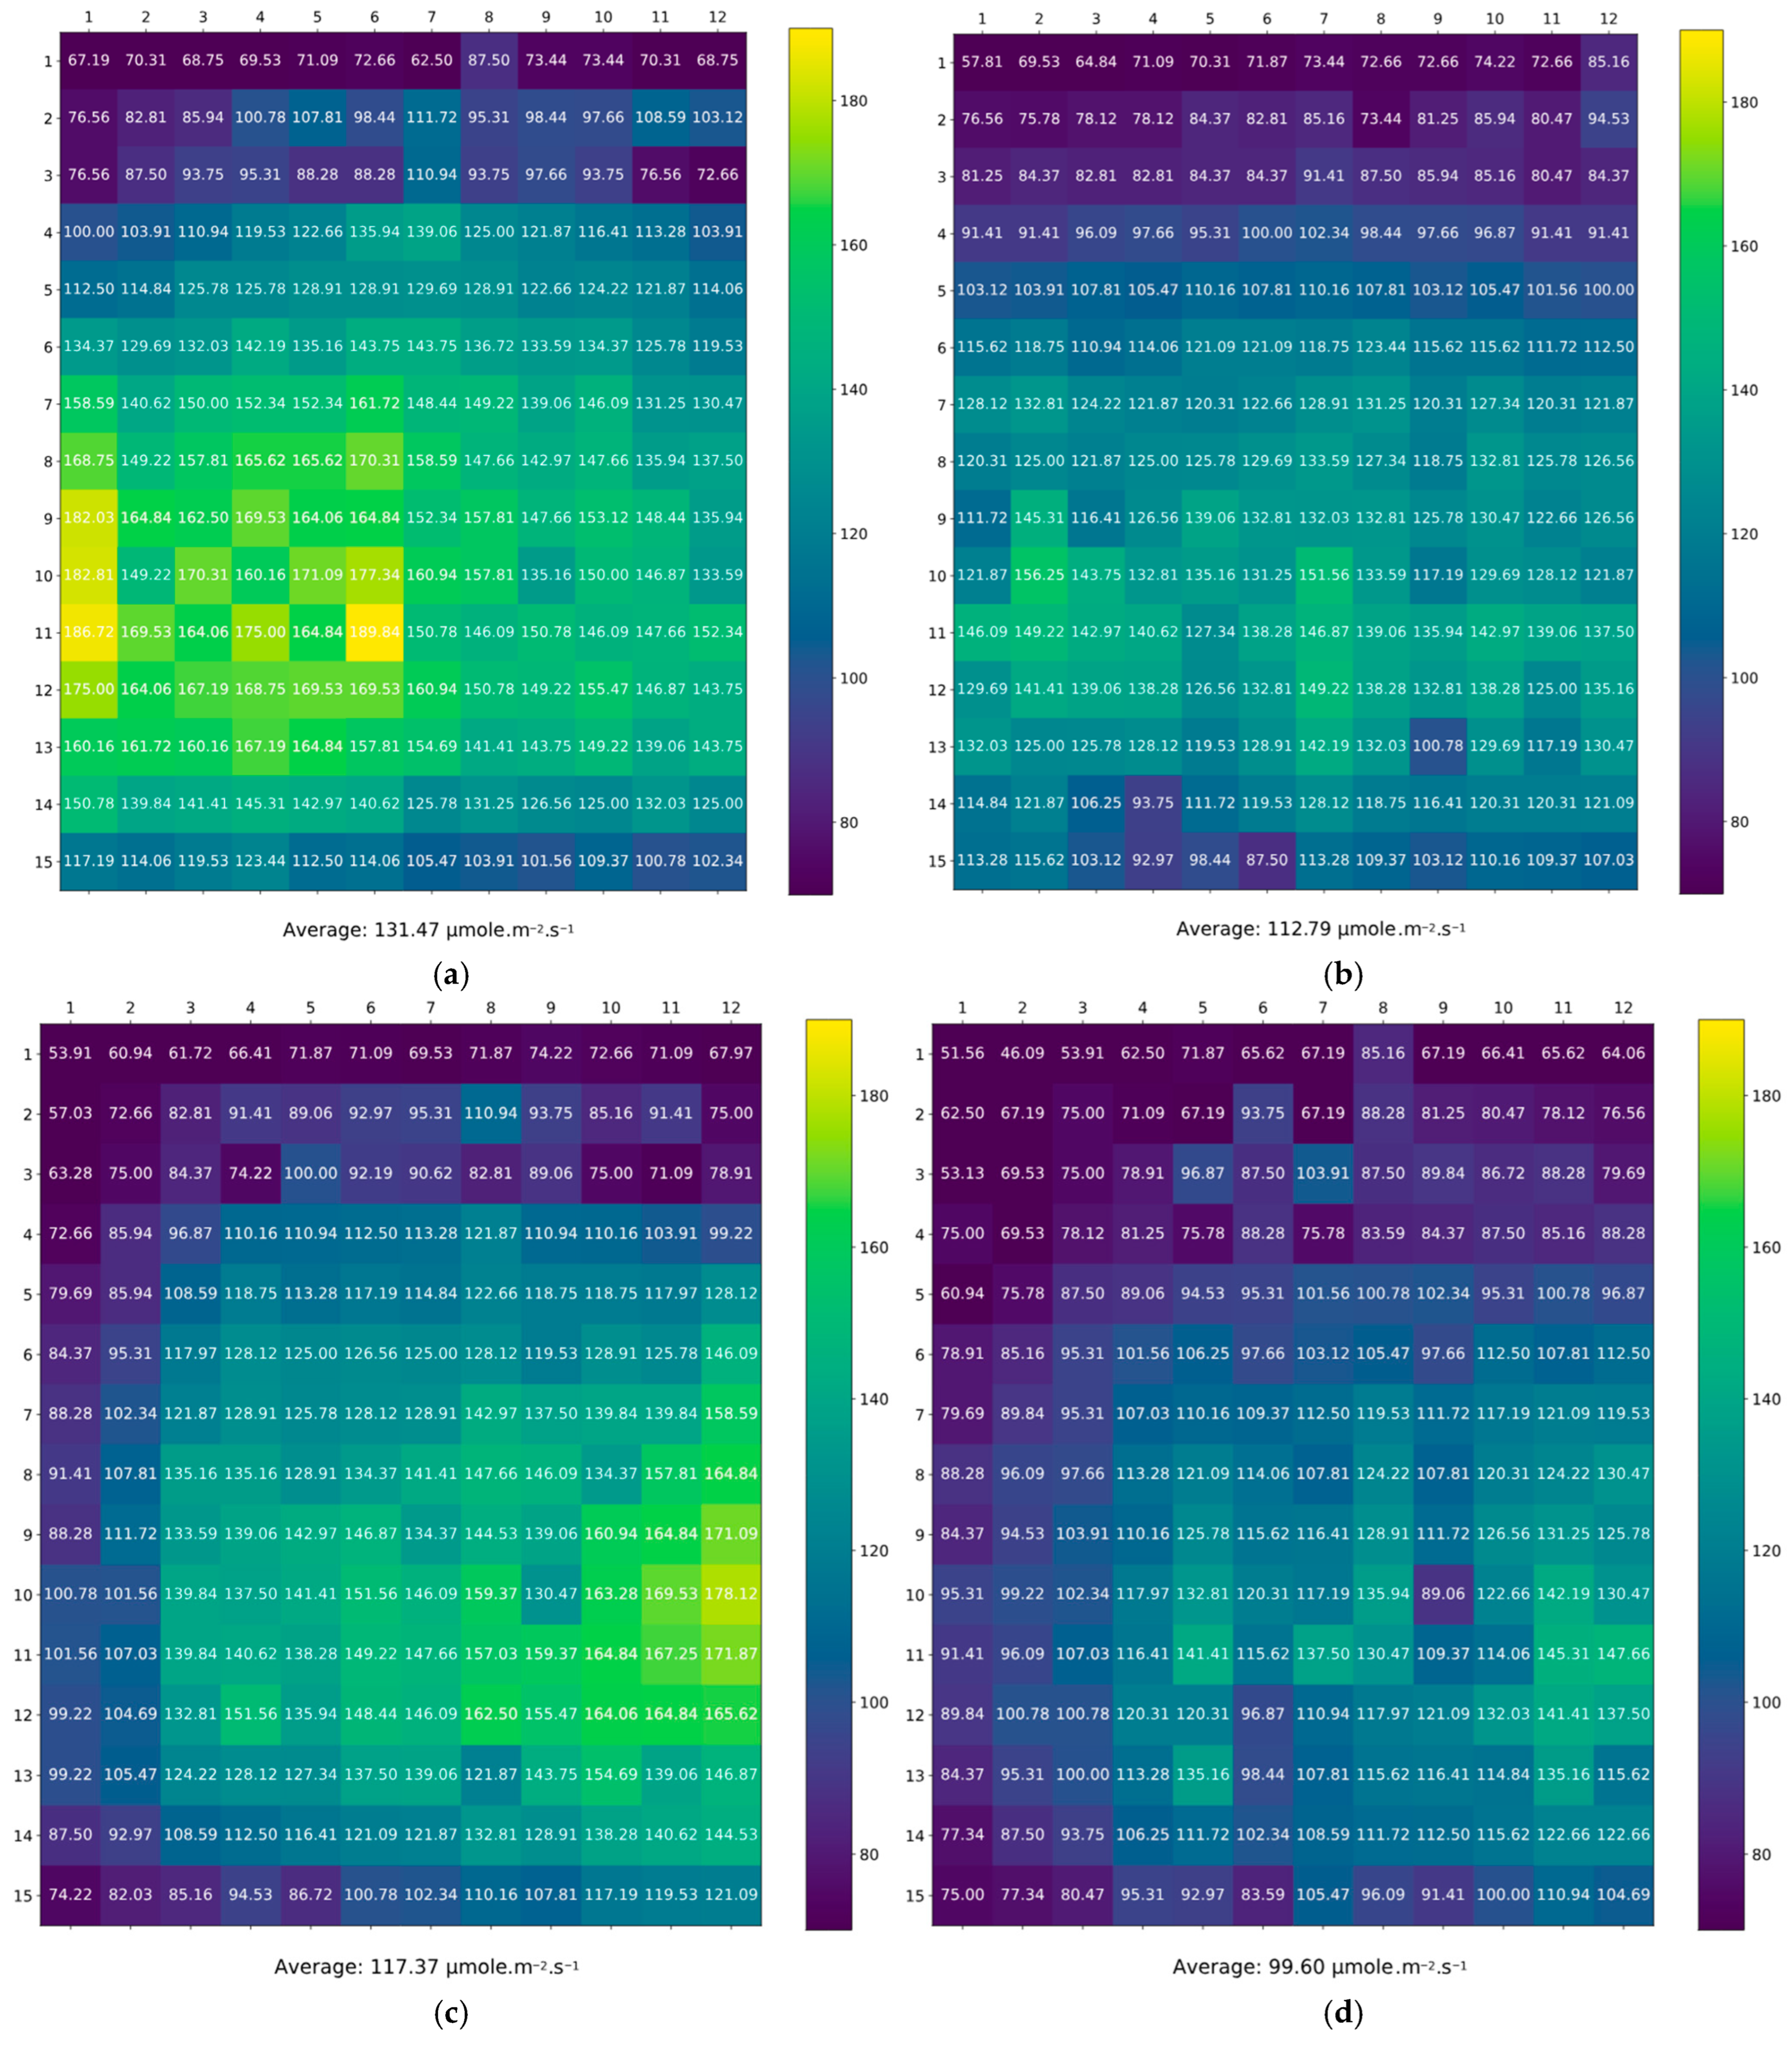
By adjusting the distance between the LED lights and the walls in categories C and D within the range of 41–61 cm, the average PPFD values vary from 112.79 to 131.47 μmol/m2/s for wall C and from 99.60 to 117.37 μmol/m2/s for wall D, as shown in Figure 11. Analyzing the point-to-point PPFD values for all categories shows that, except for a few ports on the top rows of the walls (one in category A, ten in category B, twelve in category C, and sixteen in category D), the majority provides the minimum values of optimal range for leafy greens’ photosynthesis (75.23 to 112.27 μmol/m2/s) [32]. A design distance of 41 cm significantly reduces the number of dark spots, limiting them to only a few points on the top row of walls in categories C and D. The top rows are lit with the sub-optimally oriented horizontal light (as seen in Figure 1).
Figure 11.
PPFD map of grow walls C and D for different design distances between the wall and the LEDs: (a) category C with 41 cm, (b) category C with 61 cm, (c) category D with 41 cm, and (d) category D with 61 cm.
Comparing the average DLI values of walls C and D in baseline (51 cm) with the most optimized scenario (41 cm) in Table 8 revealed that by reducing the photoperiod of lighting system in 41 cm distance scenario from 24 h to 23 h per day, the average DLI will remain almost constant (±0.18–2.11% variation). It should be noted that the possibility of this consistency (or even probable increment) on walls A and B is even higher since bringing the lights closer toward one wall by 10 cm will lead to a decline in the distance between two walls by 20 cm, causing more reflectance from both walls on each other.
Table 8.
Comparing the average PPFD and DLI between the cases of 51 cm and 41 cm distance between the lights and walls of category C and D.
3.2. Yield Analysis
The yield of cultivars in all experiments is presented in Table 9 for the baseline scenario, the distance of 51 cm between the lights and the walls. The per plant average yield values are reported in kg/port with an average of 5% variability within two rounds of experiments. As shown in Table 9, the total yield has been extrapolated for a full year, assuming consistent production. The strategy of cultivating multiple plants in a single pot is effective, potentially increasing crop yields by 44–46% when comparing single-plant approach (such as Black Simpson and Red Salad Bowl) with similar crops in multi-plant setups (Romaine and Red Outrageous). Among the tested varieties, Romaine and Red Outrageous lettuce demonstrated the best compatibility and productivity, achieving the highest yields respectively.
Table 9.
Relative and total yield and calories of cultivars obtained in the MAX layout of the agrotunnel.
Table 10 presents the specific yield values of the agrivoltaic agrotunnel, while comparing with the values reported for the similar lettuce vertical farming facilities with higher lighting intensities. The true vertical farming structure in the agrotunnel leads to higher SY values of lettuce family compared to the vertical farms with higher supplied DLI.
Table 10.
Specific yield of different market products cultivated in agrivoltaic agrotunnels and other similar farms.
Similarly, the specific electricity consumption is reported for all market product options in Table 11. Table 11 provides SEC values for both categories of the whole system and lighting subsystem. The agrotunnel as a distributed vertical farm represents a reasonable SEC value compared to its counterparts in this category, especially for the products such as Romaine, Red Outrageous, and spring mix.
Table 11.
The specific electricity consumption of different market products cultivated in agrivoltaic agrotunnel and other similar farms.
3.3. Economic Results
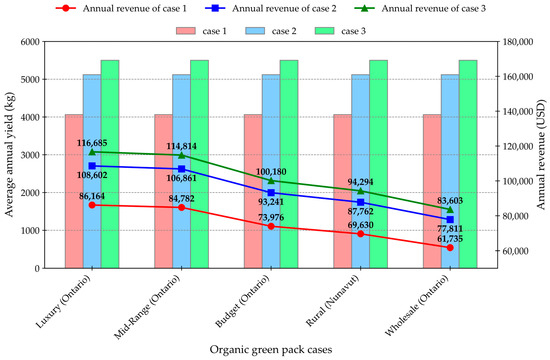
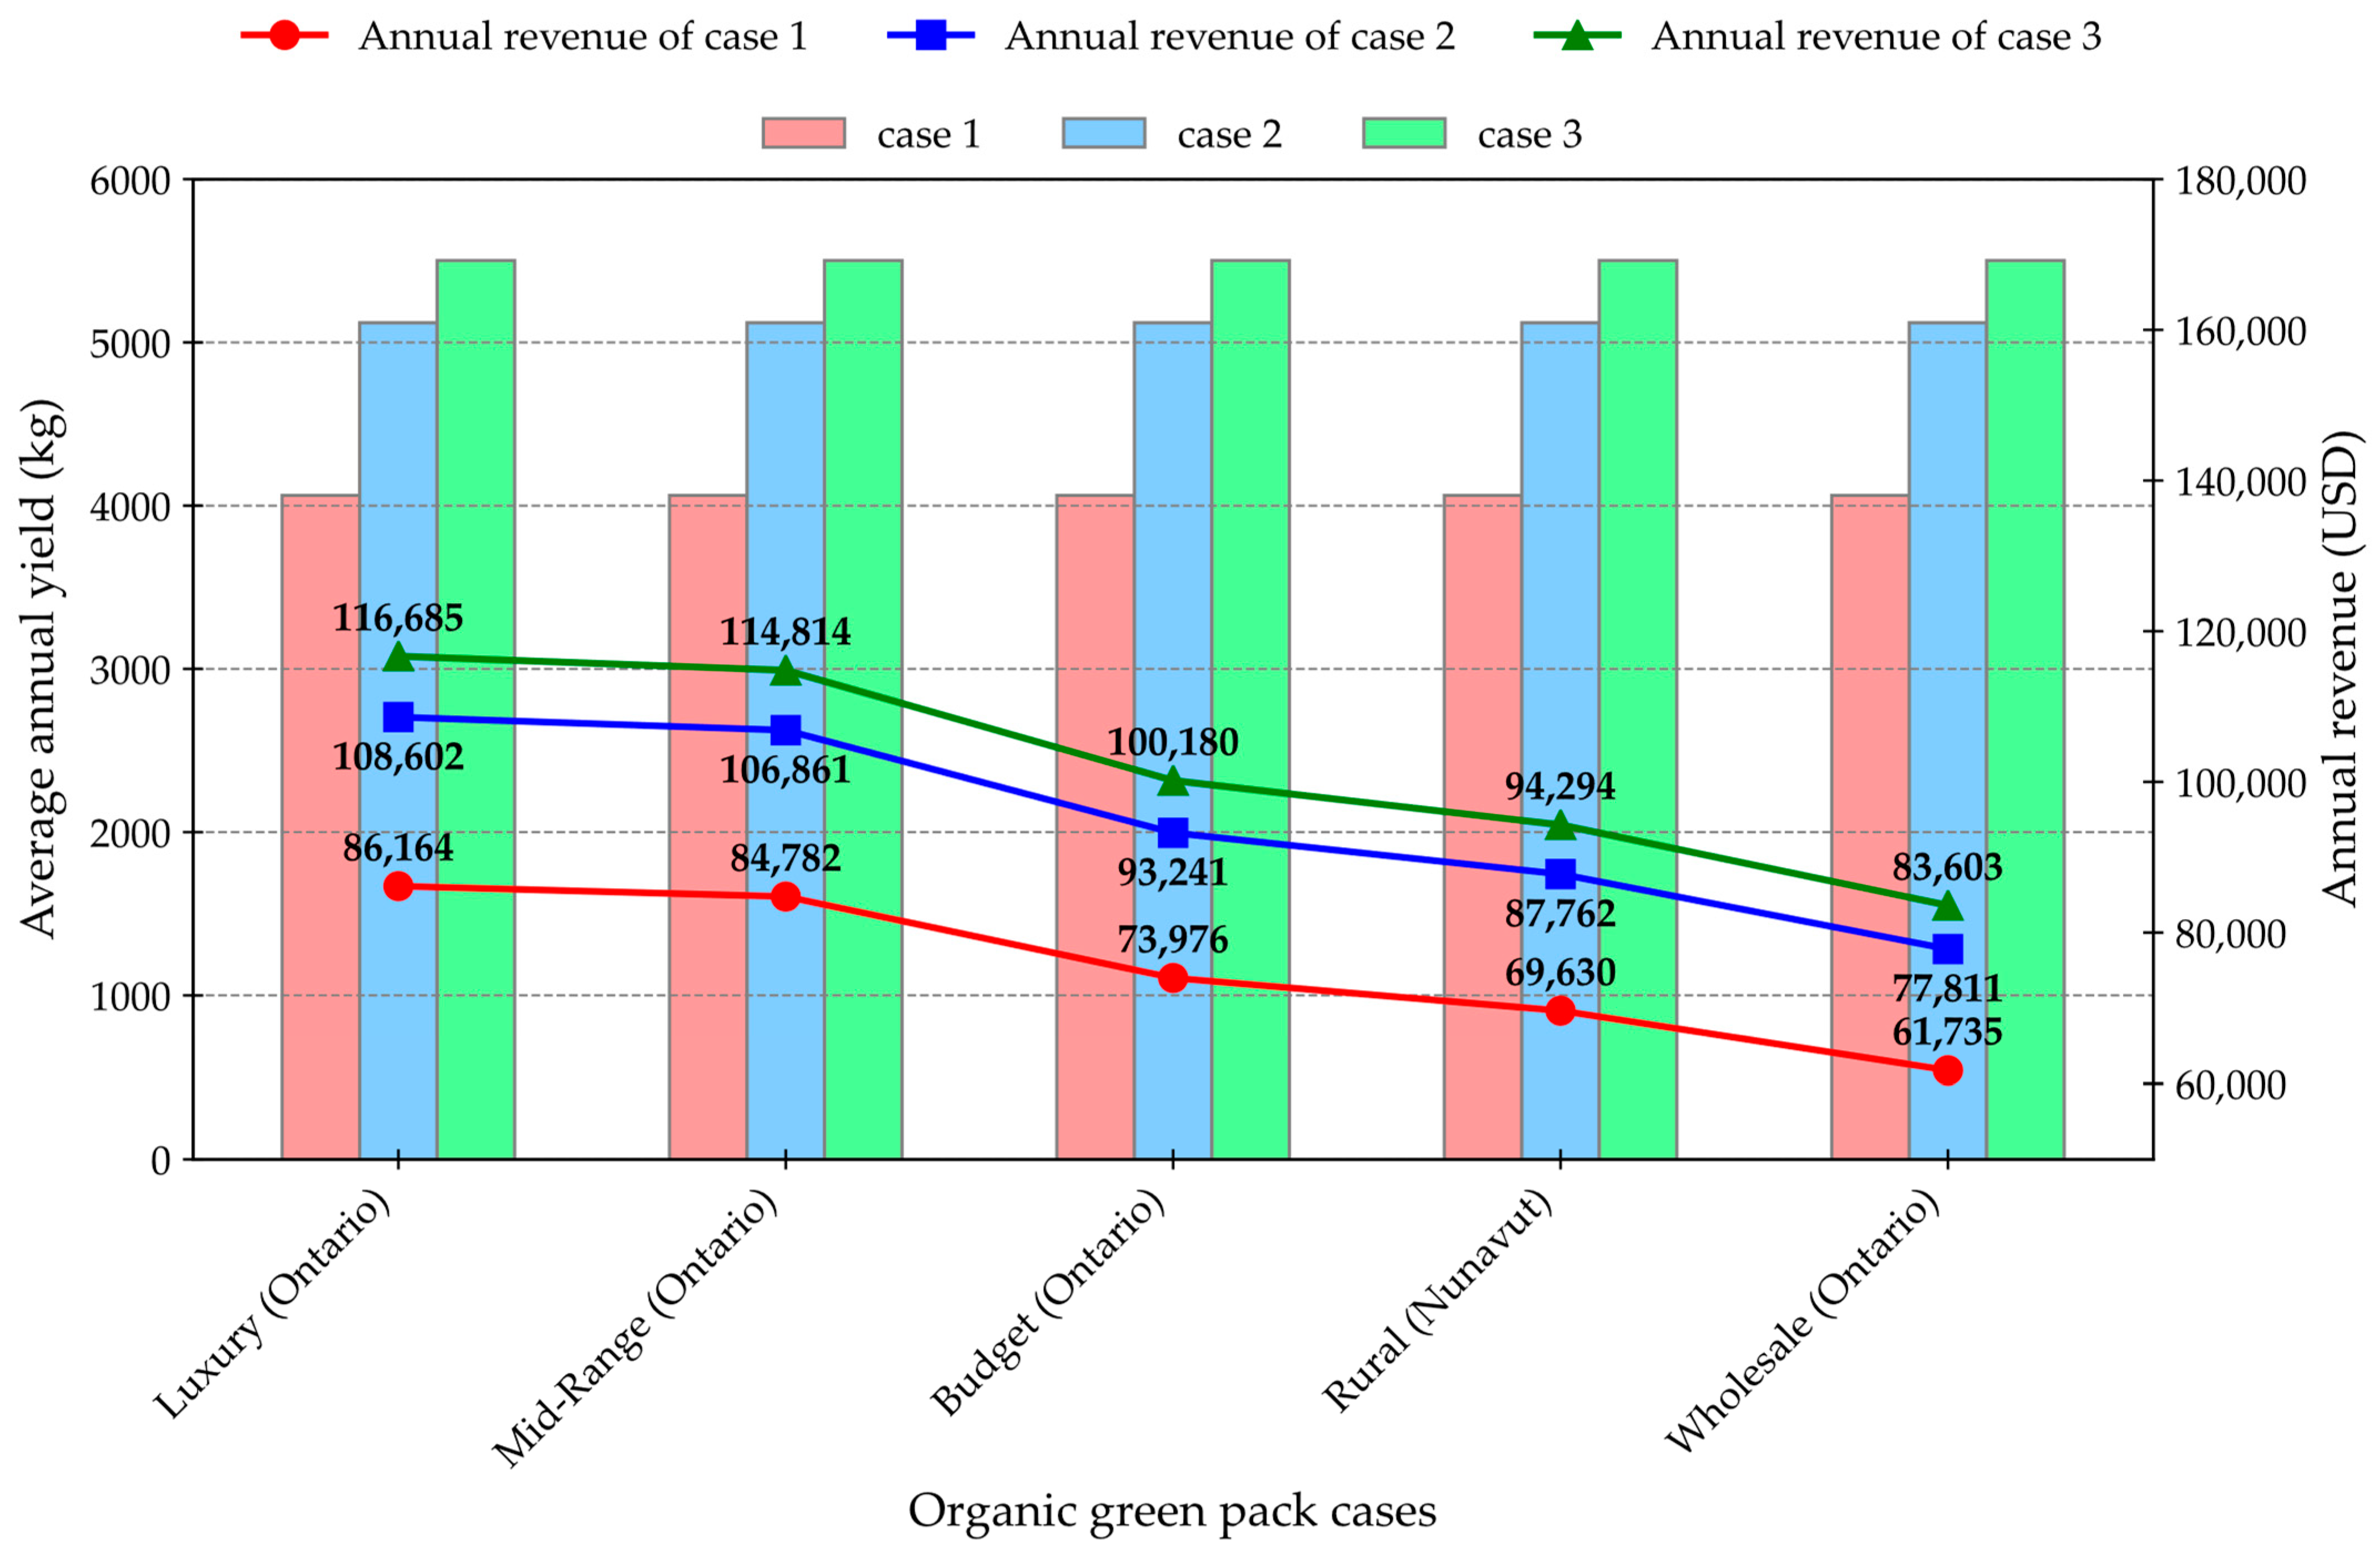
For consistency in economic comparisons, this study uses USD as the constant currency. According to Figure 12, the annual revenue is presented for three spring mix cases: (1) spring mix of Black Simpson and Red Salad Bowl; (2) spring mix of Romaine, Red Oak, and Red Outrageous lettuce with Swiss chard; and (3) spring mix of Romaine, Red Oak, and Red Outrageous lettuce without Swiss chard. Figure 12 shows that case 3 consistently yields the highest revenues across all market pricing options, indicating it is the most profitable case, with revenue reaching $116,685 in the luxury market and remaining above $100,000 even in the budget and rural options. Case 2 also performs well, particularly in the luxury and mid-range pricing options, with revenues exceeding $108,000; however, it falls short compared to case 3. In contrast, case 1 has the lowest revenue figures across the board, with its highest revenue at $86,164 in the luxury market, which drops significantly in other pricing options, suggesting that the single plant per pot strategy is less profitable compared to the multiple plants per pot strategies employed in cases 2 and 3. Crop selection can also play an effective role in optimizing obtained revenue.
Figure 12.
Comparison of the revenue obtained by selling the products as organic field greens/spring mixes in Canada (case 1: spring mix of Black Simpson and Red Salad Bowl in single plant per pot strategy; case 2: spring mix of Romaine, Red Oak, and Red Outrageous lettuce with Swiss chard in multiple plants per pot strategy; and case 3: spring mix of Romaine, Red Oak, and Red Outrageous lettuce without Swiss chard in multiple plants per pot strategy).
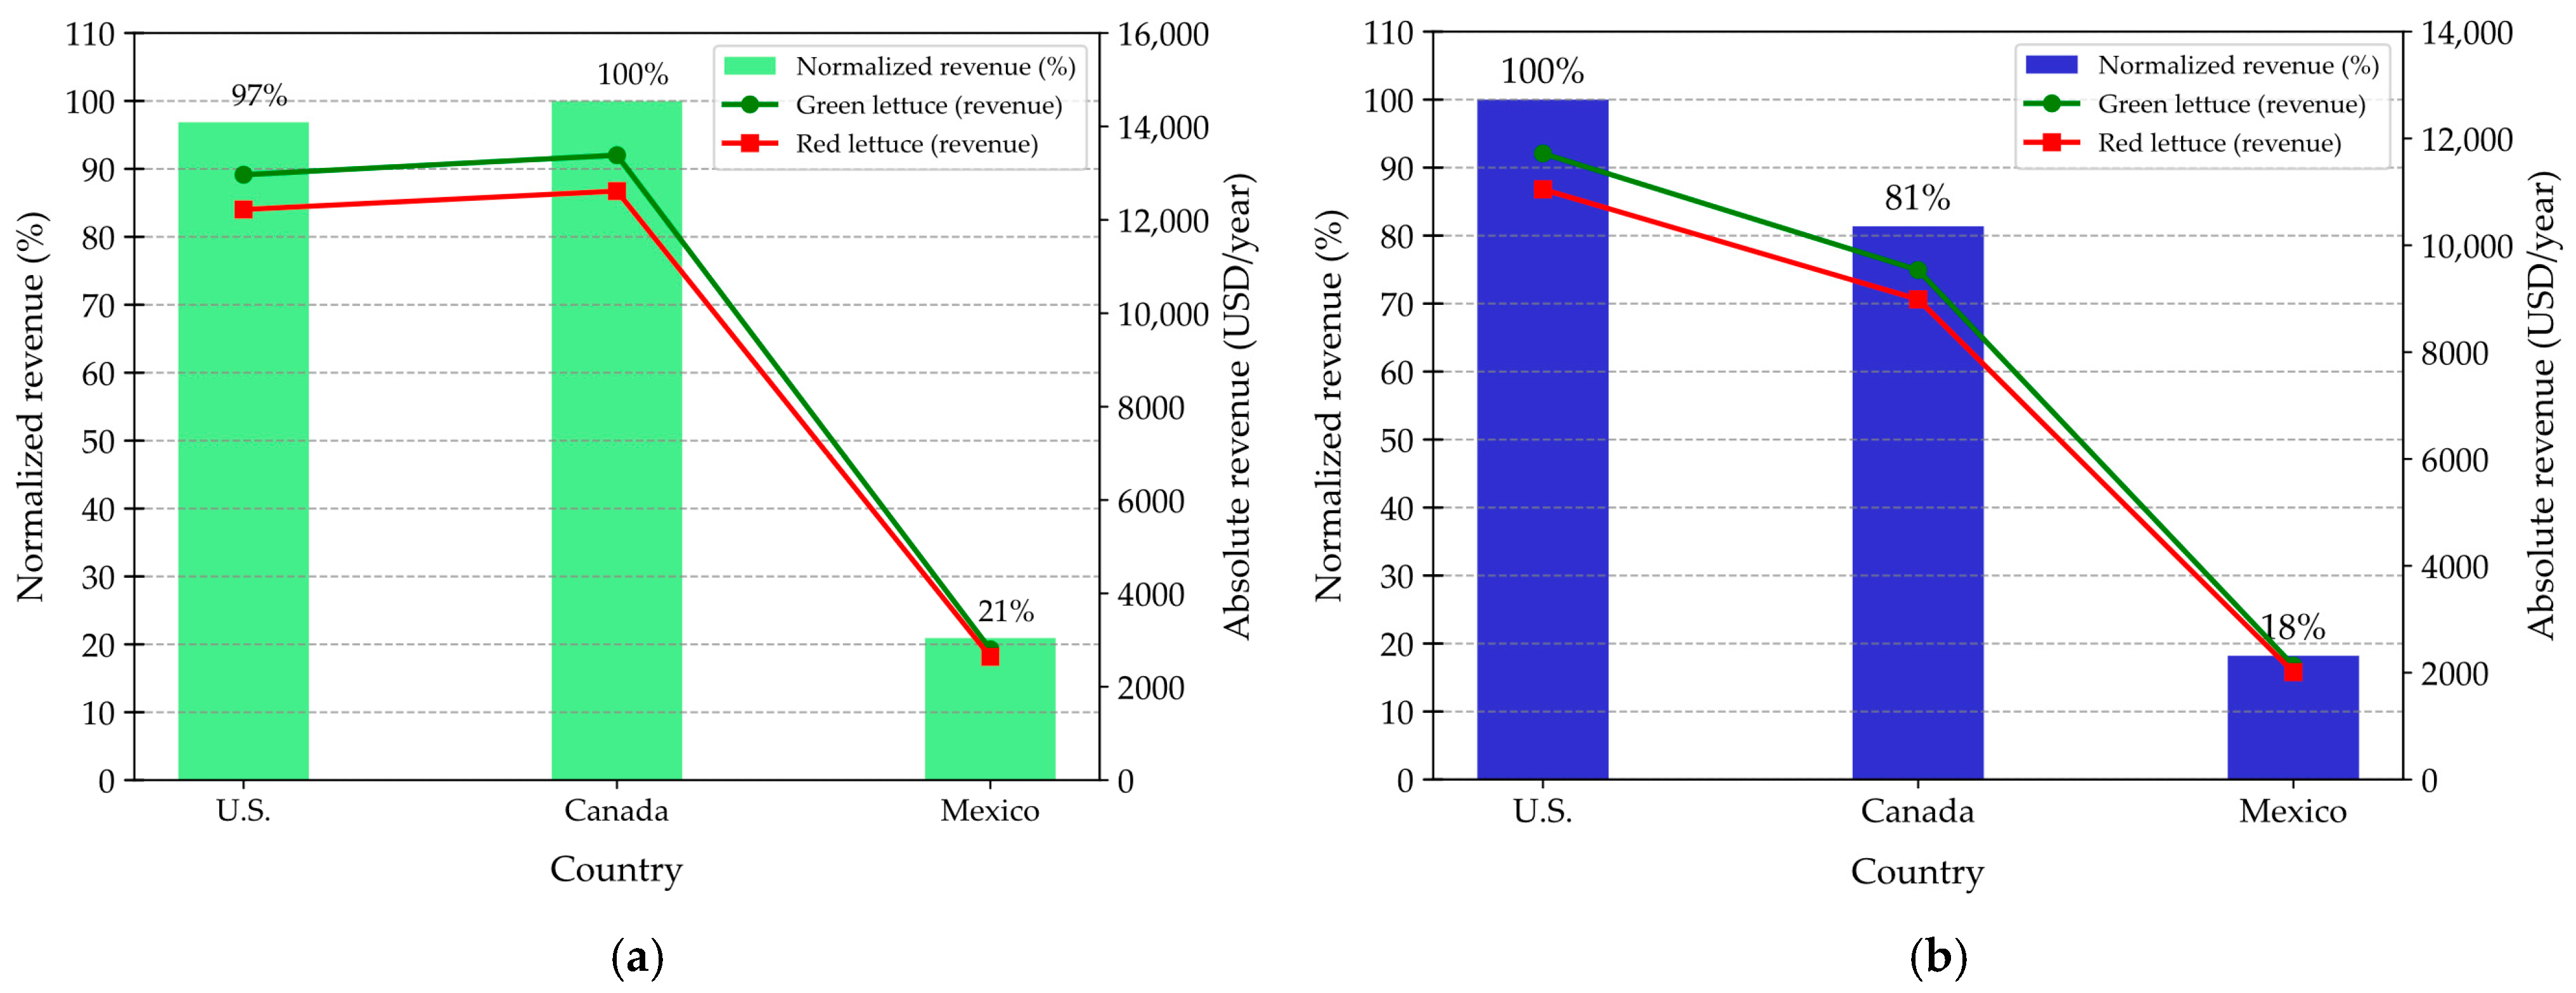
The next step involves a relative comparison of revenue generated from operating an agrotunnel in three different locations across North America, assuming the general price of lettuce in USD. As expected, Figure 13a highlights the significantly higher revenue achieved in Canada and the U.S., compared to that in Mexico (21% of revenue achieved in Canada). This considerable difference between the incomes underscores the importance of conducting a detailed CapEx analysis of the agrotunnel in future studies for payback period and net present value predictions. It should also be noted that currency exchange rates between the USD and MXN (Mexican Peso) may significantly impact the revenue figures. This does not necessarily imply that operating an agrotunnel in Mexico is unprofitable. Other investment and operational costs in Mexico play a significant role in the economic feasibility of the current IF system. Considering the impact of seasonal price variations in the lettuce market across the mentioned regions (based on Table 4), the first rank of the total revenue is captured by the U.S. Figure 13b illustrates the normalized revenue obtained considering the geographical differences in the lettuce price. It shows how the effective price of lettuce during the warmer seasons, driven by high supply levels, can reduce the annual revenue from lettuce production in agrotunnels. This reduction is particularly significant in Canada.
Figure 13.
Comparison between the revenue obtained in the U.S., Canada, and Mexico by producing the red and green lettuce in the agrotunnel: (a) general comparison, (b) seasonal comparison.
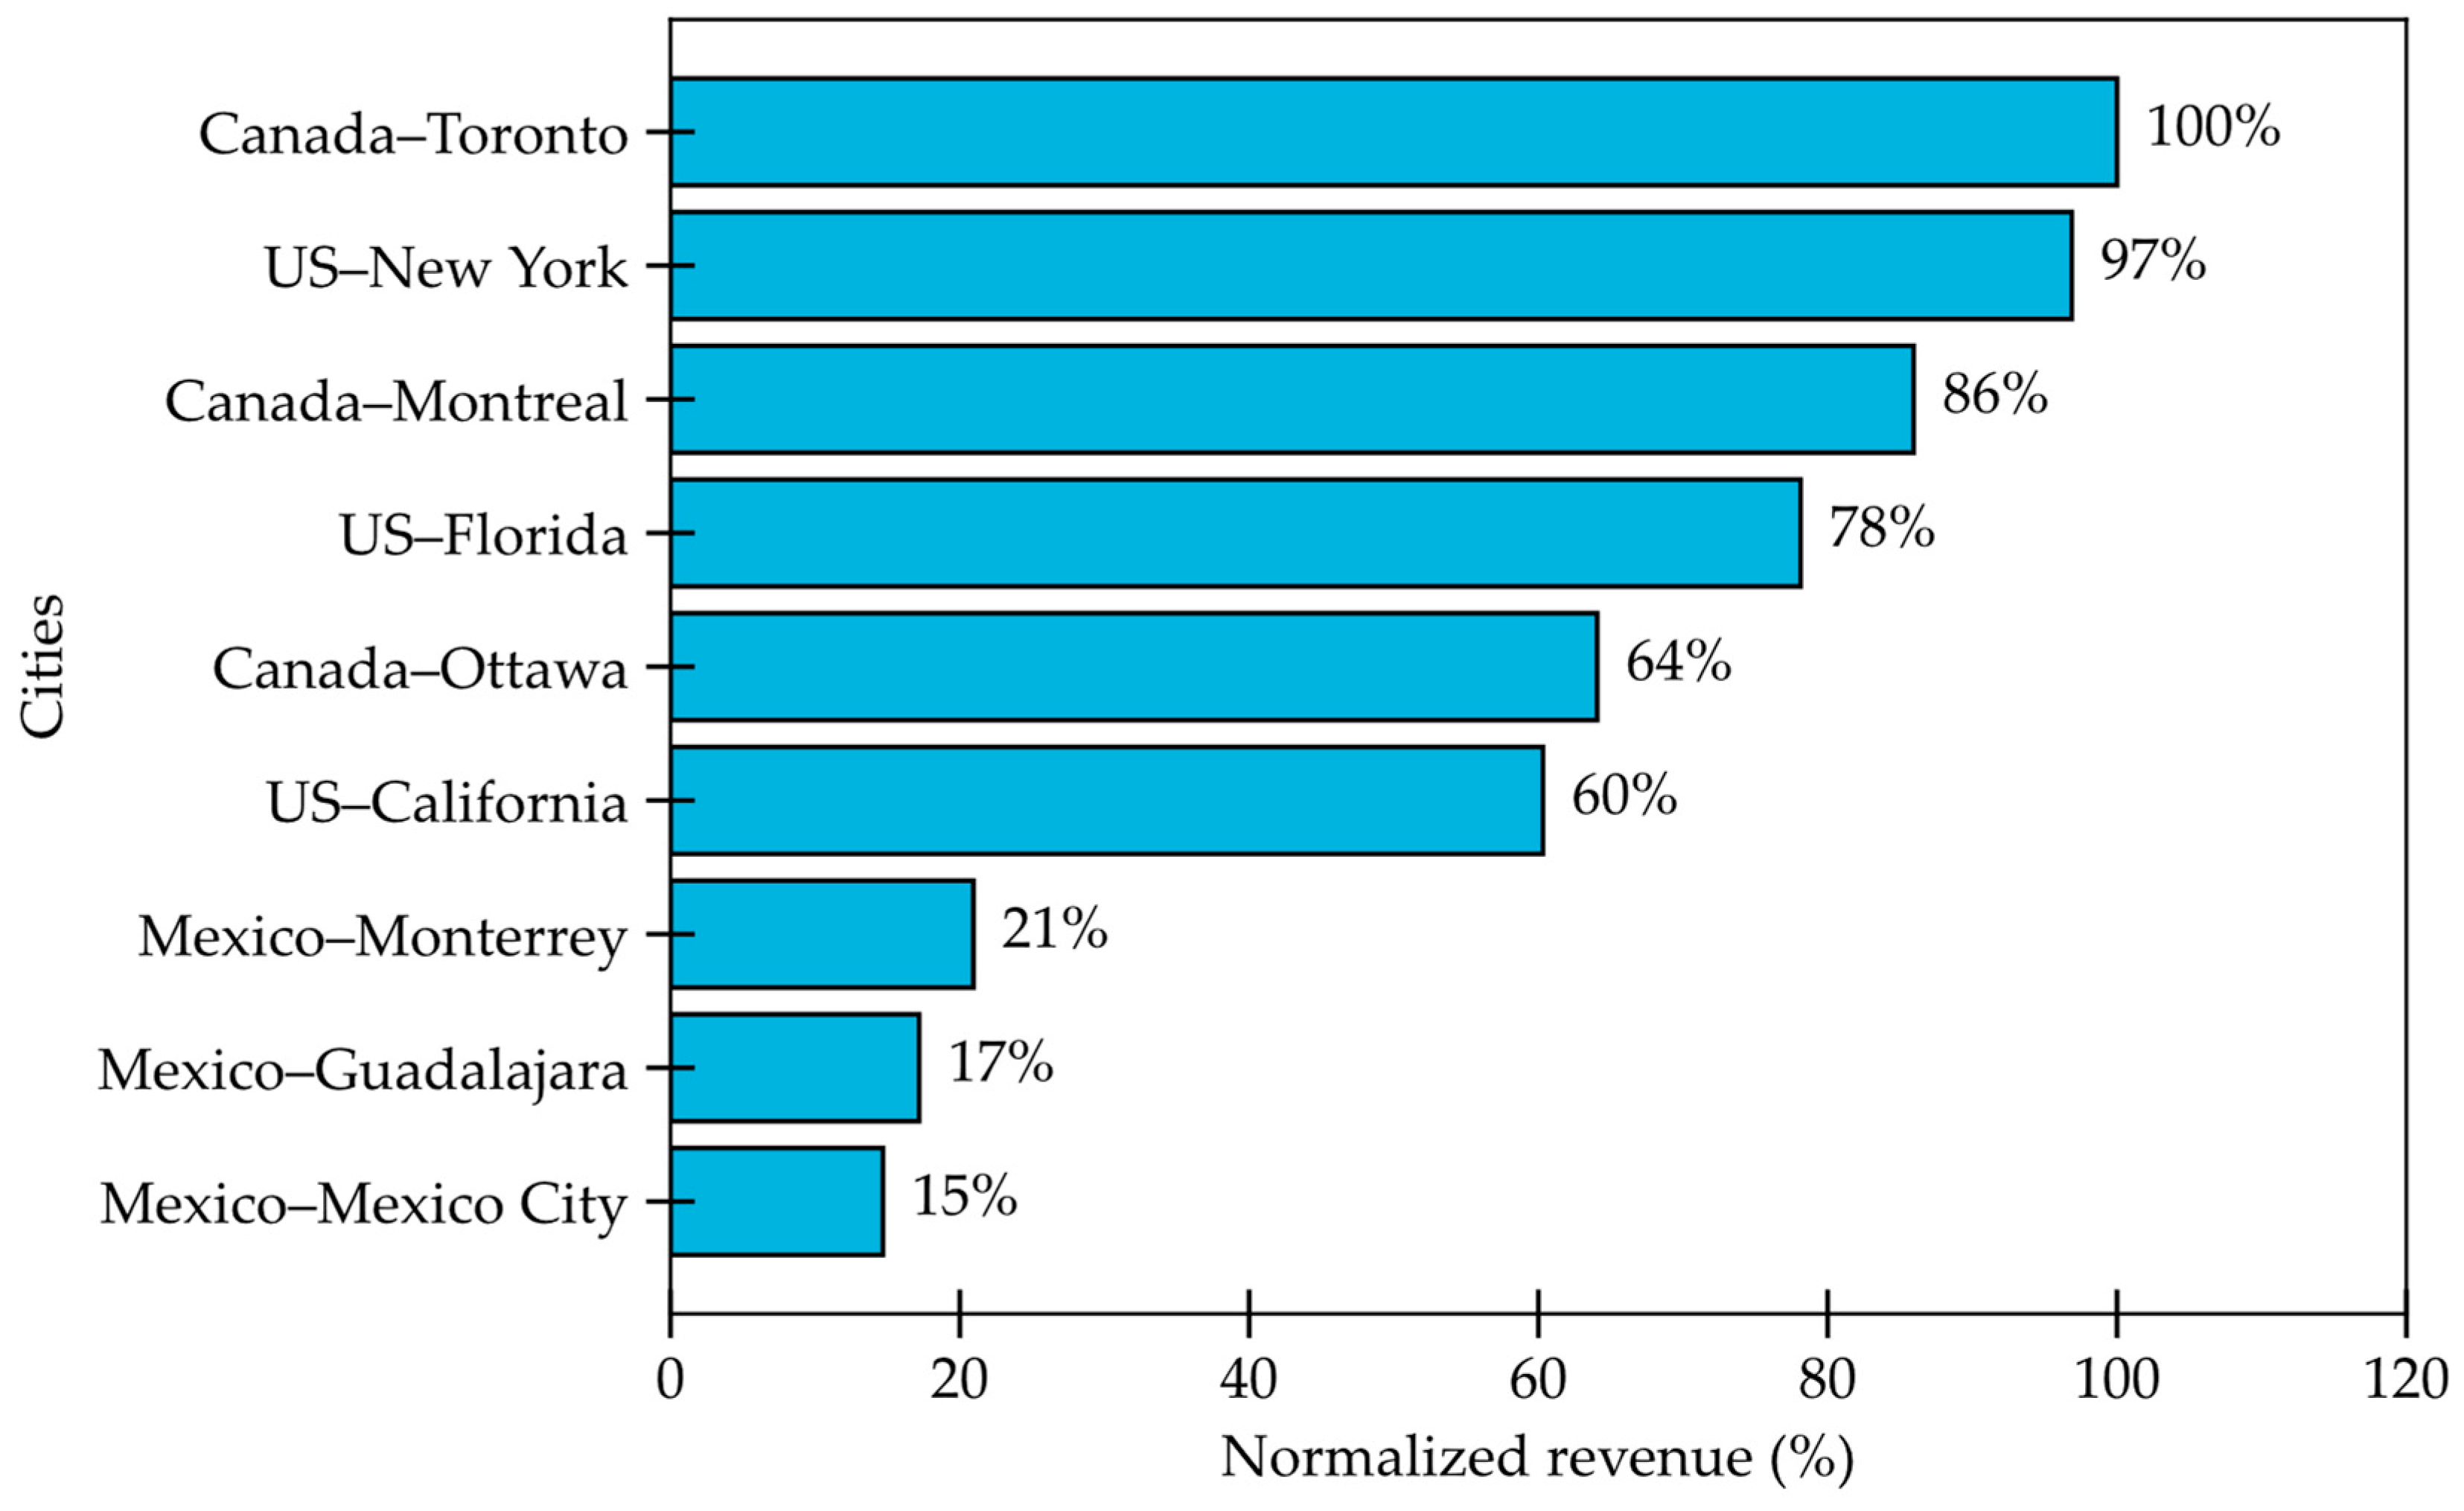
Next, the revenue from lettuce production is plotted for a range of cities across the specified regions considering the historical low and high price fluctuations to underscore the geographic differences in value of an agrivoltaic agrotunnel. As shown in Figure 14, the cities with the highest lettuce prices are Canada–Toronto, U.S.–New York, and Canada–Montreal, while the lowest prices are found in cities across Mexico. This section of the study considers the average yield of both red and green lettuce. According to Figure 14, large cities with higher population growth should be prioritized for implementing urban vertical farming agrotunnel projects. These geographical and seasonal disparities underscore the importance of considering location and time in revenue modeling for lettuce production, particularly when exploring revenue sensitivity in agrotunnel systems. Location influences every other element including crop selection, yields, operating costs, labor costs, and climate challenges. It will even impact capital costs based on locally sourced products and services to support the construction. Furthermore, market trends suggest consumers are willing to pay a 9.8% premium for hazard analysis and critical control points (HACCP)-certified lettuce [86], highlighting how food safety certifications influence consumer behavior.
Figure 14.
Regional comparison between the revenue obtained in the U.S., Canada, and Mexico by producing the red and green lettuce in the agrotunnel.
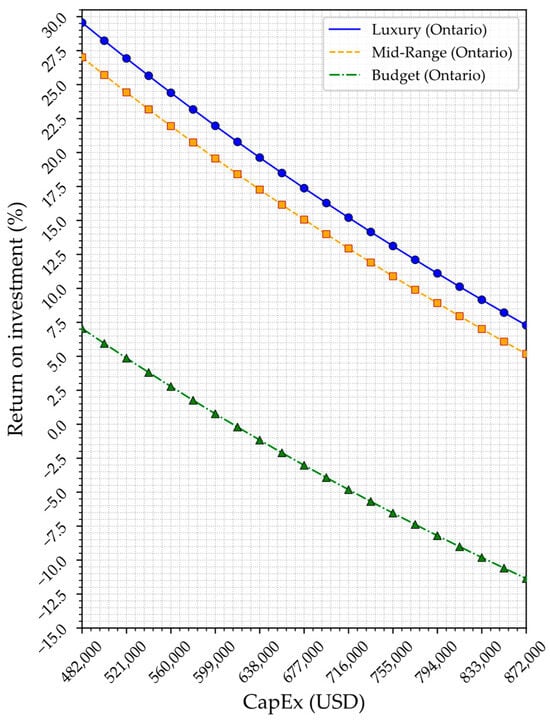
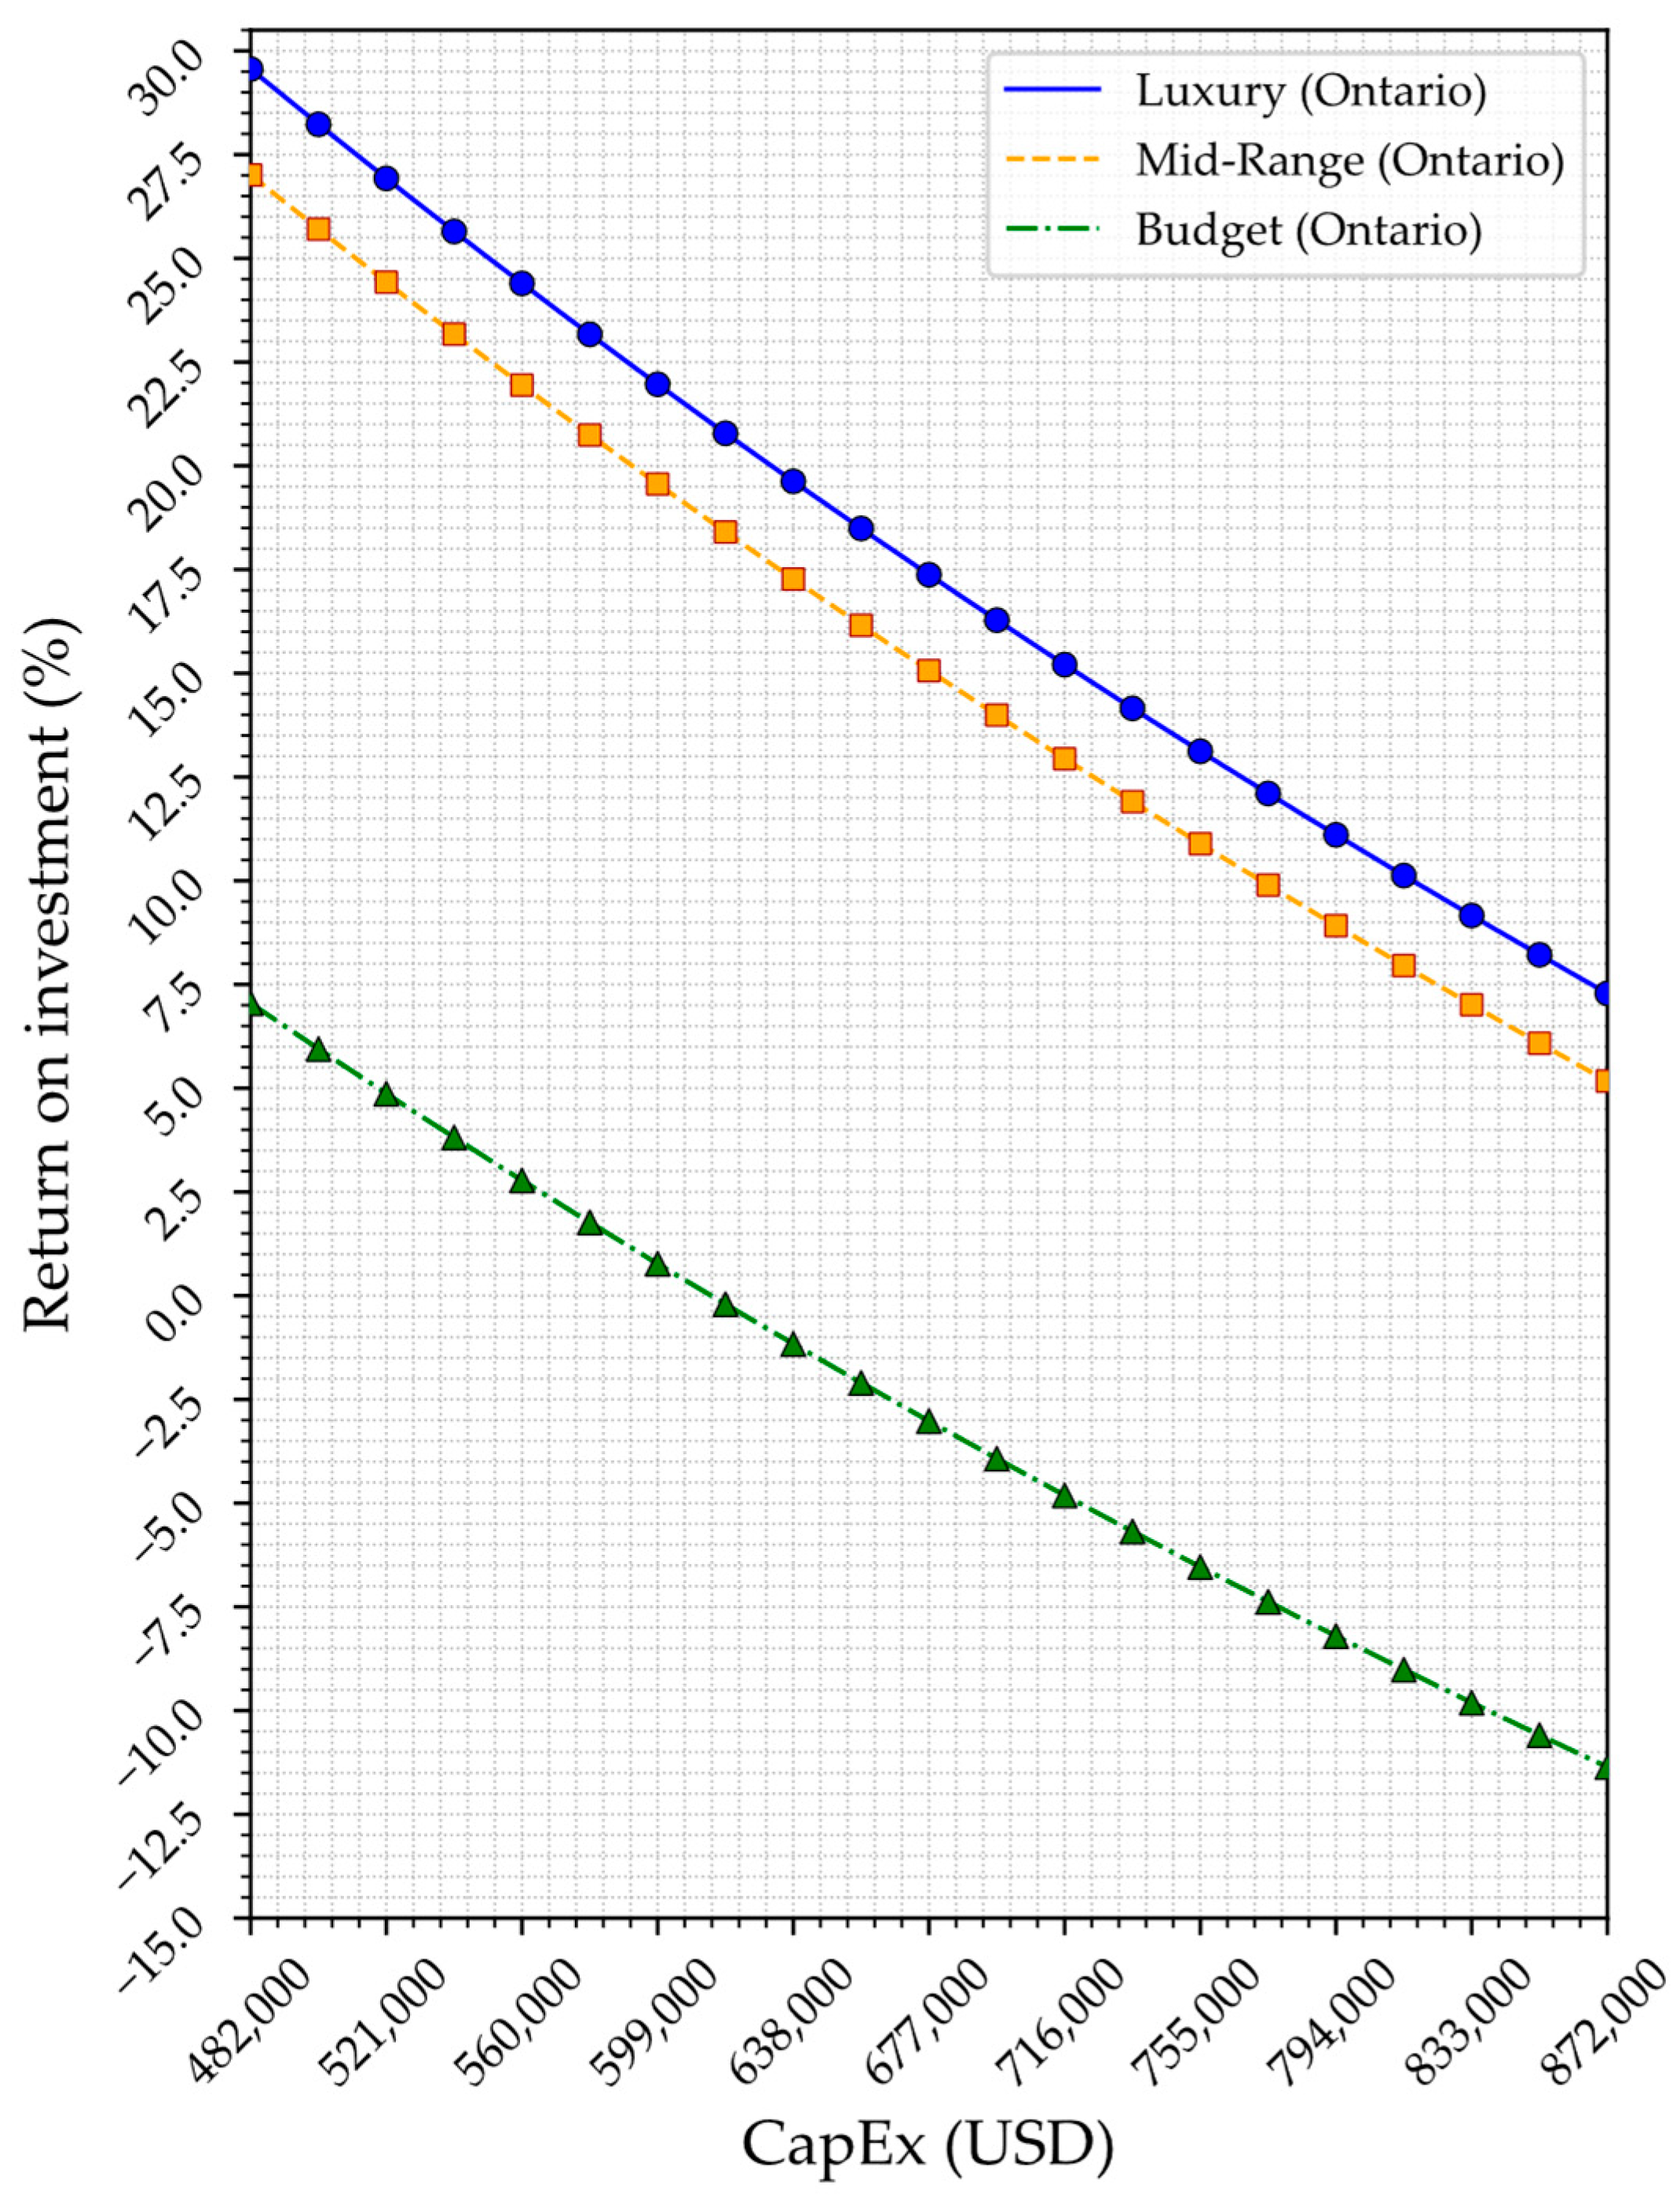
The highest revenue is achieved by producing spring mix packs in Canada, as was shown in Figure 12. The best case (a spring mix pack of Romaine, Red Oak, and Red Outrageous lettuce, without Swiss chard, using the multiple plants per pot strategy) is selected to conduct a sensitivity analysis on how ROI varies within the feasible range of total CapEx. This analysis focuses on the product option with the highest market values (spring mix in case 3, based on Ontario’s top market prices for luxury, mid-range, and budget categories), as illustrated in Figure 15. Figure 15 shows significant variations in ROI caused by changes in total CapEx, highlighting the considerable influence of initial investment on system profitability. As shown in Figure 15, the two higher price categories, luxury and mid-range (>USD 20/kg), offer ROI levels exceeding 10% across all considered capital costs.
Figure 15.
Variations in ROI vs. CapEx of agrivoltaic agrotunnels for producing spring mix of Romaine, Red Oak, and Red Outrageous lettuce without Swiss chard using the multiple plants per pot strategy.
As a suggested solution for energy conservation in the agrotunnel in Section 3.1, the lighting system can possibly operate for 23 h a day. The direct impact on the growth metrics of the plants is not studied, however. To study the economic effectiveness of this solution for future modifications in structure of the grow walls in the agrotunnel, the possible grid-connected and agrivoltaic scenarios for both 24 h and 23 h photoperiods are assessed using SAMA. Table 12 provides possible 24 h (for 51 cm distance) and 23 h (for 41 cm distance) scenarios while comparing their lifetime NPC values for the dedicated energy system only (grid vs. on-grid net-metered PV system), excluding the lifetime cost of agrotunnels and revenue streams. The 23 h photoperiod generates 24 possible scenarios depending on light activation schedules. The optimal 23 h solution must also account for practical considerations such as work shifts and agrotunnel operating hours as a commercial supplier. Accordingly, the most cost-effective option (lowest NPC) within the 7 AM–9 PM period, for nine continuous hours, is identified as the preferred choice (bold in Table 12). According to Table 12, it is first observed that there is a lifetime economic saving option of 13.2% ($245,781 USD compared to $283,154 lifetime NPC), when the agrotunnel is powered by agrivoltaics rather than being dependent solely on the grid. All costs in agrivoltaic scenarios are for investment and O&M of the PV system, since the designed PV system is a net-metered net-zero system. The LCOE is reduced by 44.2% with agrivoltaics. Furthermore, by the potential possibility of a reduction in the lighting system’s photoperiod for only 1 h, a minimization occurs in both the PV system size and grid-paid money. Comparing the selected 23 h scenario with the 24 h one shows a 1.5%, 6.2%, and 8.3% drop in PV size, LCOE, and NPC, respectively, for an agrivoltaic scenario, and a 1.4% and 7.7% drop in LCOE and NPC, respectively, when the system is powered by the grid. Financial savings by zero payments on grid electricity in agrivoltaic scenarios offset the excess additional costs of PV investments and O&M costs. This difference results in a reduced LCOE for the agrivoltaic system compared to the grid-connected scenario.
Table 12.
The economic indicators of optimum agrivoltaic and grid-powered scenarios for all photoperiod options in the agrotunnel.
4. Discussion
Both industrial practice and academic research highlighted that the economic sustainability of indoor farming is primarily driven by energy and operational costs, with lighting systems being a major factor. Similarly, in the present study, the validated simulation model showed that lighting remains the dominant energy consumer in the MAX agrotunnel, contributing to 67% of total energy consumption. Previous studies have established the comparative evaluations on the DLI [25] and the PPFD [26] ranges to target the suitable levels for lettuce production, although the energy/yield impact of light location with respect to the plants was not evaluated. Other works focused on lower photoperiod regimes without explicitly addressing light intensity effects [27,32]. Others have shown the positive effect of reductions in the distance between light sources and plants to improve energy efficiency or yield [33,46], yet these analyses were not conducted within the context of true vertical farming buildings. Overall, the agrotunnel, a true vertical indoor farm, demonstrated competitive specific electricity consumption values relative to other distributed vertical farms [11], particularly for crops such as Romaine, Red Outrageous, and spring mix. Small adjustments to lighting parameters, such as the photoperiod and light quality intensity, can either reduce production costs, as analyzed in this work, or boost yield, which was not investigated in this study. An analysis of both average and point-to-point PPFD values across the grow walls in this study revealed that most ports, except for a few, fall within the optimal photosynthesis range for leafy greens (75.23 to 112.27 μmol/m2/s) [32]. The design distance of 41 cm between the walls and LED lights significantly minimized dark spots, suggesting it could be potentially beneficial for decreasing the energy consumption. The light intensity scenarios at the mentioned three distances, however, were not used for growth and yield comparisons. On the other hand, increased PPFD levels on the walls due to the reduced distance of 41 cm along with the reduced lighting photoperiod for 1 h a day (from 24 to 23 h) led to an almost constant DLI received by lettuce plants. This possibly offers potential economic savings for both agrivoltaic and grid-powered agrotunnels if it is proven in future studies that the overall yield would not be compromised. Future work is necessary to test that hypothesis.
By reviewing the previous studies, energy/yield sensitivity to CO2 concentration and PPFD has been assessed without considering revenue impacts from cultivar selection [12], while potential energy savings from shifting lighting schedules were explored only for non-24 h operations [16]. Economic viability has been tested against financial parameters [35], without sensitivity to product choice. Only one study linked cultivar selection to lighting and economics [36], but not for agrivoltaic and/or true vertical buildings. Agrivoltaics with a considerable NPC (13.2%) and LCOE (44.2%) minimization compared to the grid-powered option, was a promising solution in supplying the energy requirements of the agrotunnel or similar indoor vertical farming systems. This study further highlights the significance of the PV deployments on agricultural farms in generating greater savings for farmers. Lettuce production with agrotunnels could also achieve the reasonable specific yield values for spring mix and quite promising level for Romaine and Red Outrageous cultivars compared to the ranges reported for similar systems [28,29,30,31]. Revenue analysis for lettuce production at full agrotunnel capacity (MAX layout) demonstrated that seasonal and geographical price fluctuations must be factored into all economics. Additionally, large cities with growing populations should be prioritized for urban vertical farming projects, as higher grocery prices driven by demand make these markets more profitable. Among the different market segments, organic field green or spring mix packages were found to be the most lucrative for the lettuce produced in the agrotunnel. Although it should be noted that policy work is necessary to enable CEA to be considered organic if all organic practices are followed [87]. It is clear that a spring mix of Romaine, Red Oak, and Red Outrageous lettuce without Swiss chard, is the most profitable option due to its consistently higher revenue across all pricing strategies, while the absence of Swiss chard may reduce management complexity and still maximize yield. Additionally, the luxury and mid-range market options of the spring mix yield the highest revenue overall, such that evaluating the ROI values indicates that targeting high-end markets can substantially increase profitability for a wider range of capital costs, making them viable even in lower market segments. Focusing on planting multiple crops in one pot should be prioritized as it offers higher yield prospects. If the operation and labor costs for this case remain affordable, this case should be the focus for scaling operations; therefore, conducting a comprehensive economic analysis is essential to ensure profitability is maintained.
For a thorough assessment of the economic feasibility of the proposed indoor farming system, revenue analysis with simplified CapEx and OpEx evaluation (average electricity and PV prices) is insufficient, and the values can be inconsistent. As discussed above, geographical differences are critical in revenue modeling, as the location affects key factors like crop selection, yield, labor, energy, materials costs, and climate challenges. Including insights on areas for optimization can significantly enhance production outcomes. Key considerations include adherence to proven growing protocols, optimized climate controls (temperature, humidity, and airflow), and rigorous biosecurity measures, all of which help maintain plant health and consistency. Additionally, the use of bio stimulants could improve yields; however, the costs of these inputs should be carefully evaluated against the potential increase in productivity to ensure economic viability. High investment costs, along with substantial maintenance, labor, and energy requirements, often result in a lengthy payback period for vertical farms, potentially taking several years to achieve profitability [88]. The commercial systems being offered with a payback period of 3–6 years [89,90] and the scientifically investigated ones with the return on investment of 2–9 years [9,16,39,91] are among the referred cases.
The most important suggestion for future studies is to examine the direct impact of changes in lighting intensity and photoperiod on yield values. In addition, applying safety factors for more realistic yield estimations is recommended to account for unforeseen events, such as pest infestations, infections, operational upgrades, and maintenance pauses. Lastly, it should be pointed out that this entire study focused on the economics of the indoor vertical farming of lettuce; however, in the case of agrivoltaics, there is also the potential for increased yield of lettuce grown outside under partial agrivoltaic shading [92,93,94,95,96]. With climate change being particularly hard on lettuce cultivation movement to agrivoltaic protection, full CEA is becoming even more important [97]. Therefore, a comprehensive economic study that includes both CapEx and OpEx considerations for outdoor and indoor lettuce growth is essential to better understand the payback period and net present value of the agrotunnel is needed for future work. In addition, further studies could explore improved lighting system designs to enhance energy and cultivation efficiency, as well as market development and promotion strategies to support the broader adoption of agrivoltaic-based food production systems.
5. Conclusions
This study identified potential energy savings for lighting systems and revenue increments by selecting high-value crops in CEA. The effectiveness of the agrivoltaic solution in energy conservation practices was investigated. The energy simulations showed that the lighting and HVAC subsystems accounted for 67% and 32.4% of total consumption, respectively. It was compared to 89% in the pilot version with lower production but the same land area. The PPFD light map analysis of the agrotunnel showed that the average PAR light intensities for walls A and C were 135.35 and 125.77 μmol/m2/s, respectively, while walls B and D received 116.00 and 114.89 μmol/m2/s at 51 cm between the LEDs and walls. When the distance was adjusted between 41 and 61 cm, wall C’s average PPFD ranged from 112.79 to 131.47 μmol/m2/s, and wall D’s average from 99.60 to 117.37 μmol/m2/s. Most ports on all walls fall within the optimal PPFD range for leafy greens (75.23 to 112.27 μmol/m2/s). A 41 cm distance reduced dark spots to just a few points on the top row of walls C and D and is recommended for future designs. Reducing the photoperiod from 24 h to 23 h at 41 cm spacing kept the average DLI nearly unchanged (±0.18–2.11%). This effect would likely be stronger for walls A and B, if reducing the gap between two middle walls by 20 cm increases mutual reflectance between them significantly. The 24 h and 23 h photoperiods under both grid-powered and on-grid agrivoltaic scenarios were economically assessed. The agrivoltaics could cut down the lifetime NPC by 13.2% ($245,781 vs. $283,154) and reduce LCOE by 44.2% compared to grid-only power supply. Furthermore, shifting from 24 h to 23 h lowered the PV size, LCOE, and NPC by 1.5%, 6.2%, and 8.3% under agrivoltaics, and minimized LCOE and NPC by 1.4% and 7.7% under grid-only supply.
In this study, Black Simpson and Red Salad Bowl in single plant per pot strategy and Romaine, Red Outrageous, and Red Oak lettuce with Swiss chard in multiple plants per pot strategy were successfully grown in an agrotunnel, and the total yield per pot was 52.90, 51.27, 76.16, 74.95, 63.52, and 51.72 g, respectively, over the cultivation period. By extrapolating these values for the commercial version of the agrotunnel (MAX layout), with a maximized compact arrangement of grow walls, the projected annual yields turned out to be 4182, 3942, 5856, 5763, 4884, and 3977 kg, respectively. Annual revenue from lettuce mix packs could range from $61,735 to $86,164 USD for single plant per pot strategy, from $77,811 to $108,602 USD for multiple plants per pot strategy with Swiss chard in the product packs, and from $83,603 to $116,685 USD for multiple plants per pot strategy without Swiss chard in the product packs. The case of spring mix without Swiss chard was selected as the highest value product option so that it was used for sensitivity analysis on ROI under total CapEx variations. The strong impact of initial investment on profitability was observed, with luxury and mid-range price categories (>$20 USD/kg) maintaining ROI above 10% at all capital cost levels. The true vertical design of the current agrotunnel resulted in higher specific yield for three top lettuce varieties of Romaine, Red Outrageous, and spring mix without Swiss chard compared to similar farms with higher supplied DLI (more than 70 kg/m2canopy/year compared to the range of 52.6–69.1 kg/m2canopy/year). The specific electricity consumption indicated competitive values as well, particularly for Romaine, Red Outrageous, and spring mix.
According to the geographical market price evaluations, the highest revenue would be achieved by selling the products in Ontario’s premium market. The revenue generated from operating an agrotunnel varied significantly across North America, with Canada and the U.S. producing the maximum revenue, while Mexico saw much lower revenue. Seasonal price variations reduced annual revenue, most notably in Canada, whereas in Mexico, it remained relatively constant with a small increment in the U.S. In metropolitan areas such as Toronto, New York, and Montreal, lettuce prices exhibited the higher ranges compared to other selected cities, whereas cities in Mexico have shown consistently lower prices.
Author Contributions
Conceptualization, N.A. and J.M.P.; methodology, N.A. and J.M.P.; software, N.A., A.B. and J.G.; validation, N.A.; formal analysis, N.A. and A.B.; investigation, N.A. and J.G.; resources, J.M.P.; data curation, N.A., A.B. and J.G.; writing—original draft preparation, N.A., A.B. and J.M.P.; writing—review and editing, N.A. and J.M.P.; visualization, N.A. and J.G.; supervision, J.M.P.; project administration, N.A. and J.M.P.; funding acquisition, J.M.P. All authors have read and agreed to the published version of the manuscript.
Funding
This work was supported by Carbon Solutions @ Western and the Thompson Endowment.
Institutional Review Board Statement
Not applicable.
Informed Consent Statement
Not applicable.
Data Availability Statement
Data will be available upon request. The 3D-printed holder is available at https://osf.io/3shuj/ (accessed on 22 March 2026).
Acknowledgments
The authors would like to thank Greg Whiteside, Kim Parker, Jeremy Van Maar, Sarah Van Maar, Janice Kelsey, and Jody Spangler for helpful discussion and technical assistance.
Conflicts of Interest
The authors declare no conflicts of interest.
References
- Beacham, A.M.; Vickers, L.H.; Monaghan, J.M. Vertical Farming: A Summary of Approaches to Growing Skywards. J. Hortic. Sci. Biotechnol. 2019, 94, 277–283. [Google Scholar] [CrossRef] [Scilit]
- Ampim, P.A.Y.; Obeng, E.; Olvera-Gonzalez, E. Indoor Vegetable Production: An Alternative Approach to Increasing Cultivation. Plants 2022, 11, 2843. [Google Scholar] [CrossRef] [Scilit]
- Asgari, N.; McDonald, M.T.; Pearce, J.M. Energy Modeling and Techno-Economic Feasibility Analysis of Greenhouses for Tomato Cultivation Utilizing the Waste Heat of Cryptocurrency Miners. Energies 2023, 16, 1331. [Google Scholar] [CrossRef] [Scilit]
- Sadek, N.; Kamal, N.; Shehata, D. Internet of Things Based Smart Automated Indoor Hydroponics and Aeroponics Greenhouse in Egypt. Ain Shams Eng. J. 2024, 15, 102341. [Google Scholar] [CrossRef] [Scilit]
- Stein, E.W. The Transformative Environmental Effects Large-Scale Indoor Farming May Have on Air, Water, and Soil. Air Soil Water Res. 2021, 14, 1178622121995819. [Google Scholar] [CrossRef] [Scilit]
- Mitchell, C.A. History of Controlled Environment Horticulture: Indoor Farming and Its Key Technologies. HortScience 2022, 57, 247–256. [Google Scholar] [CrossRef] [Scilit]
- Ahamed, M.S.; Sultan, M.; Monfet, D.; Rahman, M.S.; Zhang, Y.; Zahid, A.; Bilal, M.; Ahsan, T.M.A.; Achour, Y. A Critical Review on Efficient Thermal Environment Controls in Indoor Vertical Farming. J. Clean. Prod. 2023, 425, 138923. [Google Scholar] [CrossRef] [Scilit]
- Despommier, D. Vertical Farms, Building a Viable Indoor Farming Model for Cities. Field Actions Sci. Rep. J. Field Actions 2019, 20, 68–73. [Google Scholar]
- Avgoustaki, D.D.; Xydis, G. Indoor Vertical Farming in the Urban Nexus Context: Business Growth and Resource Savings. Sustainability 2020, 12, 1965. [Google Scholar] [CrossRef] [Scilit]
- George, P.; George, N. Hydroponics-(Soilless Cultivation of Plants) for Biodiversity Conservation. Int. J. Mod. Trends Eng. Sci. 2016, 3, 97–104. [Google Scholar]
- Miserocchi, L.; Franco, A. Benchmarking Energy Efficiency in Vertical Farming: Status and Prospects. Therm. Sci. Eng. Prog. 2025, 58, 103165. [Google Scholar] [CrossRef] [Scilit]
- Keyvan, P.; Roshandel, R. An Integrated Energy-Yield-Cost Model to Evaluate Clean Energy Solutions for Vertical Farms. Comput. Electron. Agric. 2024, 219, 108809. [Google Scholar] [CrossRef] [Scilit]
- Keles, K. Indoor Farming: Fancy Concept or Environmental Breakthrough? Economic Analysis of a Small Scaled Indoor Farm Producing Iceberg Lettuce in Bergen. Master’s Thesis, Norwegian School of Economics, Bergen, Norway, 2018. [Google Scholar]
- Arcasi, A.; Mastrullo, R.; Mauro, A.W.; Napoli, G.; Pantaleo, A.M.; Tariello, F. Assessment of the Energy Consumption of Indoor Farming for Different Climates and Lighting System Intensity. J. Phys. Conf. Ser. 2023, 2648, 012011. [Google Scholar] [CrossRef] [Scilit]
- Yeh, N.; Chung, J.-P. High-Brightness LEDs—Energy Efficient Lighting Sources and Their Potential in Indoor Plant Cultivation. Renew. Sustain. Energy Rev. 2009, 13, 2175–2180. [Google Scholar] [CrossRef] [Scilit]
- Avgoustaki, D.D.; Xydis, G. Energy Cost Reduction by Shifting Electricity Demand in Indoor Vertical Farms with Artificial Lighting. Biosyst. Eng. 2021, 211, 219–229. [Google Scholar] [CrossRef] [Scilit]
- Asgari, N.; Jamil, U.; Pearce, J.M. Net Zero Agrivoltaic Arrays for Agrotunnel Vertical Growing Systems: Energy Analysis and System Sizing. Sustainability 2024, 16, 6120. [Google Scholar] [CrossRef] [Scilit]
- Al-Chalabi, M. Vertical Farming: Skyscraper Sustainability? Sustain. Cities Soc. 2015, 18, 74–77. [Google Scholar] [CrossRef] [Scilit]
- Graamans, L.; Baeza, E.; van den Dobbelsteen, A.; Tsafaras, I.; Stanghellini, C. Plant Factories versus Greenhouses: Comparison of Resource Use Efficiency. Agric. Syst. 2018, 160, 31–43. [Google Scholar] [CrossRef] [Scilit]
- Graamans, L.; Tenpierik, M.; van den Dobbelsteen, A.; Stanghellini, C. Plant Factories: Reducing Energy Demand at High Internal Heat Loads through Façade Design. Appl. Energy 2020, 262, 114544. [Google Scholar] [CrossRef] [Scilit]
- Hati, A.J.; Singh, R.R. Smart Indoor Farms: Leveraging Technological Advancements to Power a Sustainable Agricultural Revolution. AgriEngineering 2021, 3, 728–767. [Google Scholar] [CrossRef] [Scilit]
- Kumar, R.; Rathore, S.; Kundlas, K.; Rattan, S.; Warghat, A.R. Chapter 8—Vertical Farming and Organic Farming Integration: A Review. In Organic Farming, 2nd ed.; Sarathchandran, M.U., Thomas, S., Meena, D.K., Eds.; Woodhead Publishing Series in Food Science, Technology and Nutrition; Woodhead Publishing: Cambridge, UK, 2023; pp. 291–315. ISBN 978-0-323-99145-2. [Google Scholar]
- Al-Kodmany, K. The Vertical Farm: A Review of Developments and Implications for the Vertical City. Buildings 2018, 8, 24. [Google Scholar] [CrossRef] [Scilit]
- Sipos, L.; Balázs, L.; Székely, G.; Jung, A.; Sárosi, S.; Radácsi, P.; Csambalik, L. Optimization of Basil (Ocimum basilicum L.) Production in LED Light Environments—A Review. Sci. Hortic. 2021, 289, 110486. [Google Scholar] [CrossRef] [Scilit]
- Matysiak, B.; Ropelewska, E.; Wrzodak, A.; Kowalski, A.; Kaniszewski, S. Yield and Quality of Romaine Lettuce at Different Daily Light Integral in an Indoor Controlled Environment. Agronomy 2022, 12, 1026. [Google Scholar] [CrossRef] [Scilit]
- Pennisi, G.; Pistillo, A.; Orsini, F.; Cellini, A.; Spinelli, F.; Nicola, S.; Fernandez, J.A.; Crepaldi, A.; Gianquinto, G.; Marcelis, L.F.M. Optimal Light Intensity for Sustainable Water and Energy Use in Indoor Cultivation of Lettuce and Basil under Red and Blue LEDs. Sci. Hortic. 2020, 272, 109508. [Google Scholar] [CrossRef] [Scilit]
- Abdullah, A.A.; Lee, C.-L.; Wong, S.-K.; Osman, A.F.A.; Sum, Z.-L.; Chan, K.-Y. The Effect of LED Grow Light Photoperiods on Indoor Hydroponic Lettuce Farming. J. Adv. Res. Appl. Sci. Eng. Technol. 2023, 32, 368–377. [Google Scholar] [CrossRef] [Scilit]
- Eaves, J.; Eaves, S. Comparing the Profitability of a Greenhouse to a Vertical Farm in Quebec. Can. J. Agric. Econ. Can. Agroecon. 2018, 66, 43–54. [Google Scholar] [CrossRef] [Scilit]
- Weidner, T.; Yang, A.; Hamm, M.W. Energy Optimisation of Plant Factories and Greenhouses for Different Climatic Conditions. Energy Convers. Manag. 2021, 243, 114336. [Google Scholar] [CrossRef] [Scilit]
- Talbot, M.-H.; Lalonde, T.; Beaulac, A.; Haillot, D.; Monfet, D. Comparing the Energy Performance of Different Controlled Environment Agriculture Spaces Using TRNSYS; IBPSA: Montreal, QC, Canada, 2022. [Google Scholar]
- Blom, T.; Jenkins, A.; Pulselli, R.M.; van den Dobbelsteen, A.A.J.F. The Embodied Carbon Emissions of Lettuce Production in Vertical Farming, Greenhouse Horticulture, and Open-Field Farming in the Netherlands. J. Clean. Prod. 2022, 377, 134443. [Google Scholar] [CrossRef] [Scilit]
- Paz, M.; Fisher, P.R.; Gómez, C. Minimum Light Requirements for Indoor Gardening of Lettuce. Urban Agric. Reg. Food Syst. 2019, 4, 190001. [Google Scholar] [CrossRef] [Scilit]
- Lozano-Castellanos, L.F.; Navas-Gracia, L.M.; Correa-Guimaraes, A. Light Energy Efficiency in Lettuce Crop: Structural Indoor Designs Simulation. Plants 2023, 12, 3456. [Google Scholar] [CrossRef] [Scilit]
- Wong, T.I.; Zhou, X. Uniform Lighting of High-Power LEDs at a Short Distance to Plants for Energy-Saving and High-Density Indoor Farming. Photonics 2024, 11, 394. [Google Scholar] [CrossRef] [Scilit]
- Liaros, S.; Botsis, K.; Xydis, G. Technoeconomic Evaluation of Urban Plant Factories: The Case of Basil (Ocimum basilicum). Sci. Total Environ. 2016, 554–555, 218–227. [Google Scholar] [CrossRef] [Scilit] [PubMed]
- Tarr, S.T.; Valle de Souza, S.; Lopez, R.G. Influence of Day and Night Temperature and Radiation Intensity on Growth, Quality, and Economics of Indoor Green Butterhead and Red Oakleaf Lettuce Production. Sustainability 2023, 15, 829. [Google Scholar] [CrossRef] [Scilit]
- Shao, Y.; Zhou, Z.; Chen, H.; Zhang, F.; Cui, Y.; Zhou, Z. The Potential of Urban Family Vertical Farming: A Pilot Study of Shanghai. Sustain. Prod. Consum. 2022, 34, 586–599. [Google Scholar] [CrossRef] [Scilit]
- Cichocki, J.; von Cossel, M.; Winkler, B. Techno-Economic Assessment of an Office-Based Indoor Farming Unit. Agronomy 2022, 12, 3182. [Google Scholar] [CrossRef] [Scilit]
- Avgoustaki, D.D.; Xydis, G. Chapter One—How Energy Innovation in Indoor Vertical Farming Can Improve Food Security, Sustainability, and Food Safety? In Advances in Food Security and Sustainability; Elsevier: Amsterdam, The Netherlands, 2020; Volume 5, pp. 1–51. [Google Scholar]
- Delbert, C. It’s Official: Solar Is the Cheapest Electricity in History. Available online: https://www.popularmechanics.com/science/a34372005/solar-cheapest-energy-ever/ (accessed on 7 February 2025).
- Asgari, N.; Hayibo, K.S.; Groza, J.; Rana, S.; Pearce, J.M. Greenhouse Applications of Solar Photovoltaic Driven Heat Pumps in Northern Environments. Renew. Sustain. Energy Rev. 2025, 207, 114920. [Google Scholar] [CrossRef] [Scilit]
- Hao, W.; Tablada, A.; Shi, X.; Wang, L.; Meng, X. Efficiency Analysis of the Photovoltaic Shading and Vertical Farming System by Employing the Artificial Neural Network (ANN) Method. Buildings 2024, 14, 94. [Google Scholar] [CrossRef] [Scilit]
- Teo, Y.L.; Go, Y.I. Techno-Economic-Environmental Analysis of Solar/Hybrid/Storage for Vertical Farming System: A Case Study, Malaysia. Renew. Energy Focus 2021, 37, 50–67. [Google Scholar] [CrossRef] [Scilit]
- Engler, N.; Krarti, M. Optimal Designs for Net Zero Energy Controlled Environment Agriculture Facilities. Energy Build. 2022, 272, 112364. [Google Scholar] [CrossRef] [Scilit]
- Loconsole, D.; Cocetta, G.; Santoro, P.; Ferrante, A. Optimization of LED Lighting and Quality Evaluation of Romaine Lettuce Grown in An Innovative Indoor Cultivation System. Sustainability 2019, 11, 841. [Google Scholar] [CrossRef] [Scilit]
- Sheibani, F.; Bourget, M.; Morrow, R.C.; Mitchell, C.A. Close-Canopy Lighting, an Effective Energy-Saving Strategy for Overhead Sole-Source LED Lighting in Indoor Farming. Front. Plant Sci. 2023, 14, 1215919. [Google Scholar] [CrossRef] [Scilit]
- FSSC. Food Security Structures Canada. Available online: https://www.foodsecuritystructures.ca/home (accessed on 25 March 2024).
- Taylor Farms Spring Mix. Available online: https://www.taylorfarms.com/products/spring-mix/ (accessed on 31 October 2024).
- The Northern Shopper Spring Lettuce Mix. Available online: https://thenorthernshopper.com/products/costco_518247?srsltid=AfmBOoorzfYyxtv1aidI-2XKrCr05tWr6yjYn_8MtNf4Uj0Ull8FWmmA (accessed on 30 September 2024).
- Shadd, A.; Asgari, N.; Pearce, J.M. Effects of Spectral Ranges on Growth and Yield in Vertical Hydroponic–Aeroponic Hybrid Grow Systems for Radishes and Turnips. Foods 2025, 14, 1872. [Google Scholar] [CrossRef] [Scilit]
- FSSC. Food Security Structures Canada—Better Grow Lights. Available online: https://www.foodsecuritystructures.ca/growing-systems/better-grow-lights (accessed on 9 September 2024).
- Apogee Instruments, Inc. Full-Spectrum Quantum Sensor. Available online: https://www.apogeeinstruments.com/sq-500-ss-full-spectrum-quantum-sensor/ (accessed on 30 September 2024).
- Ali Sadat, S.; Takahashi, J.; Pearce, J.M. A Free and Open-Source Microgrid Optimization Tool: SAMA the Solar Alone Multi-Objective Advisor. Energy Convers. Manag. 2023, 298, 117686. [Google Scholar] [CrossRef] [Scilit]
- HOMER—Hybrid Renewable and Distributed Generation System Design Software. Available online: https://www.homerenergy.com/products/pro/index.html (accessed on 29 August 2025).
- Ramasamy, V.; Zuboy, J.; Woodhouse, M.; O’Shaughnessy, E.; Feldman, D.; Desai, J.; Walker, A.; Margolis, R.; Basore, P. US Solar Photovoltaic System and Energy Storage Cost Benchmarks, with Minimum Sustainable Price Analysis: Q1 2023; National Renewable Energy Laboratory (NREL): Golden, CO, USA, 2023. [Google Scholar]
- NREL. Solar Installed System Cost Analysis|Solar Market Research & Analysis|NREL. Available online: https://www.nrel.gov/solar/market-research-analysis/solar-installed-system-cost (accessed on 20 June 2025).
- Asgari, N.; Sadat, S.A.; Pearce, J.M. Technoeconomic Analysis of Indoor Basil Cultivation in Agrivoltaic Agrotunnels with Optimized Near-Zero Energy Systems; NREL: Golden, CO, USA, 2025. [Google Scholar]
- Walker, H. Best Practices for Operation and Maintenance of Photovoltaic and Energy Storage Systems; National Renewable Energy Laboratory (NREL): Golden, CO, USA, 2018. [Google Scholar]
- National Solar Radiation Database (NSRDB). Available online: https://nsrdb.nlr.gov/ (accessed on 22 March 2026).
- Sadat, S.A.; Pearce, J.M. Techno-Economic Evaluation of Electricity Pricing Structures on Photovoltaic and Photovoltaic-Battery Hybrid Systems in Canada. Renew. Energy 2025, 242, 122456. [Google Scholar] [CrossRef] [Scilit]
- NREL. System Advisor Model (SAM). Available online: https://github.com/NREL/SAM (accessed on 22 March 2026).
- London Hydro Electricity Charges for Commercial, Less Than 50 kW with No Interval Meter (Rates Effective 1 May 2025—31 October 2025). Available online: https://www.londonhydro.com/accounts-services/electricity-rates/commercial-electricity-rates (accessed on 20 June 2025).
- Bank of Canada Reduces Policy Rate by 50 Basis Points to 3¼%. Available online: https://www.bankofcanada.ca/2024/12/fad-press-release-2024-12-11/ (accessed on 11 January 2025).
- Bank of Canada Inflation. Available online: https://www.bankofcanada.ca/core-functions/monetary-policy/inflation/ (accessed on 20 June 2025).
- Nutritionix—Largest Verified Nutrition Database. Available online: https://www.nutritionix.com/ (accessed on 28 August 2025).
- Asgari, N.; Pearce, J.M. Full Heads or Cut and Come Again? Economic Analysis of Leafy Green Cultivation in Solar-Powered Indoor Vertical Farms. Green Low-Carbon Econ. 2026, 1–12. [Google Scholar] [CrossRef] [Scilit]
- Canada Interest Rate. Available online: https://tradingeconomics.com/canada/interest-rate (accessed on 1 April 2025).
- Chahrour, R.; Stevens, L. Price Dispersion and the Border Effect. J. Monet. Econ. 2020, 116, 135–146. [Google Scholar] [CrossRef] [Scilit]
- Tridge Mexico Fresh Lettuce. Available online: https://www.tridge.com/intelligences/lettuce/MX/price (accessed on 30 September 2024).
- Selina Wamucii Mexico Lettuce Prices. Available online: https://www.selinawamucii.com/insights/prices/mexico/lettuce/ (accessed on 30 September 2024).
- Government of Canada, S.C. Monthly Average Retail Prices for Selected Products. Available online: https://www150.statcan.gc.ca/t1/tbl1/en/tv.action?pid=1810024501 (accessed on 30 September 2024).
- Selina Wamucii Canada Lettuce Prices. Available online: https://www.selinawamucii.com/insights/prices/canada/lettuce/ (accessed on 30 September 2024).
- Google Finance CAD/USD Currency Exchange Rate & News. Available online: https://www.google.com/finance/quote/CAD-USD (accessed on 3 April 2025).
- Canadian Food Inspection Agency. Regulating Organic Products in Canada. Available online: http://inspection.canada.ca/en/food-labels/organic-products/regulating (accessed on 4 November 2024).
- Leblanc-Laurendeau, O. Food Insecurity in Northern Canada: An Overview. Available online: https://bdp.parl.ca/sites/PublicWebsite/default/en_CA? (accessed on 30 September 2024).
- Nickel, R. Reuters Food Inflation Hits Especially Had in Canada’s North. Available online: https://www.arctictoday.com/ (accessed on 30 September 2024).
- U.S. Bureau of Labor Statistics Consumer Price Index. Available online: https://www.bls.gov/cpi/ (accessed on 30 September 2024).
- Government of Canada Lettuce Have a Look at Some Numbers. Available online: https://www.statcan.gc.ca/o1/en/plus/4143-lettuce-have-look-some-numbers (accessed on 30 September 2024).
- USDA Economic Research Service Selected Weekly Fresh-Market Vegetable Movement and Price. Available online: https://www.ers.usda.gov/data-products/vegetables-and-pulses-data/selected-weekly-fresh-market-vegetable-movement-and-price/ (accessed on 30 September 2024).
- Whole Foods Market Organic Spring Mix. Available online: https://www.wholefoodsmarket.com/product/365-by-whole-foods-market-organic-spring-mix-b074h57s5g (accessed on 30 September 2024).
- Metro Organic Spring Mix. Available online: https://www.metro.ca/en/online-grocery/aisles/fruits-vegetables/packaged-salads-vegetables/organic-spring-mix/p/888048100100 (accessed on 30 September 2024).
- Walmart Fresh Market Organic Spring Mix. Available online: https://www.walmart.ca/en/ip/your-fresh-market-organic-spring-mix/6000203663542 (accessed on 30 September 2024).
- QuickSupply Fresh. Available online: https://quicksupply.ca/products (accessed on 30 September 2024).
- Fireside Farms Wholesale—Spring Mix. Available online: https://www.firesidefarms.ca/products/wholesale-spring-mix-10-lb (accessed on 30 September 2024).
- Common Ground Farm Wholesale Salad Mix. Available online: https://commongroundfarm.ca/products/wholesale-salad-mix (accessed on 30 September 2024).
- Gedikoğlu, H.; Gedikoğlu, A. Consumers’ Awareness of and Willingness to Pay for HACCP-Certified Lettuce in the United States: Regional Differences. Food Control 2021, 130, 108263. [Google Scholar] [CrossRef] [Scilit]
- Linden, T. CEA Organic Certification Still a Divisive Topic|Produce News. Available online: https://theproducenews.com/organic-produce-summit/cea-organic-certification-still-divisive-topic (accessed on 3 November 2024).
- Ehmke, T.; Zuckerberg, K.S. Vertical Farms Must Trim Costs, Hone Business Models to Achieve Profitability; CoBank ACB: Centennial, CO, USA, 2022. [Google Scholar]
- Is Vertical Farming Expensive? Available online: https://www.lettusgrow.com/blog/is-vertical-farming-expensive (accessed on 9 October 2024).
- iFarm Vertical Farming Costs: Calculate the Costs to Run a Farm. Available online: https://web.archive.org/web/20250206121845/https://ifarm.fi/blog/vertical-farming-costs (accessed on 9 October 2024).
- Holliman, J.B.; Adrian, J.; Chappell, J. Integration of Hydroponic Tomato and Indoor Recirculating Aquacultural Production Systems: An Economic Analysis; Auburn University: Auburn, AL, USA, 2008. [Google Scholar]
- Marrou, H.; Wery, J.; Dufour, L.; Dupraz, C. Productivity and Radiation Use Efficiency of Lettuces Grown in the Partial Shade of Photovoltaic Panels. Eur. J. Agron. 2013, 44, 54–66. [Google Scholar] [CrossRef] [Scilit]
- Elamri, Y.; Cheviron, B.; Lopez, J.-M.; Dejean, C.; Belaud, G. Water Budget and Crop Modelling for Agrivoltaic Systems: Application to Irrigated Lettuces. Agric. Water Manag. 2018, 208, 440–453. [Google Scholar] [CrossRef] [Scilit]
- Riaz, M.H.; Imran, H.; Younas, R.; Butt, N.Z. The Optimization of Vertical Bifacial Photovoltaic Farms for Efficient Agrivoltaic Systems. Sol. Energy 2021, 230, 1004–1012. [Google Scholar] [CrossRef] [Scilit]
- Cossu, M.; Tiloca, M.T.; Cossu, A.; Deligios, P.A.; Pala, T.; Ledda, L. Increasing the Agricultural Sustainability of Closed Agrivoltaic Systems with the Integration of Vertical Farming: A Case Study on Baby-Leaf Lettuce. Appl. Energy 2023, 344, 121278. [Google Scholar] [CrossRef] [Scilit]
- Tahir, Z.; Butt, N.Z. Implications of Spatial-Temporal Shading in Agrivoltaics under Fixed Tilt & Tracking Bifacial Photovoltaic Panels. Renew. Energy 2022, 190, 167–176. [Google Scholar] [CrossRef] [Scilit]
- Jamil, U.; Alrayes, L.; Fordjour, E.; Thomas, R.; Pearce, J.M. Toward Climate-Adapted Food Systems: Mitigating Climate Change Impacts on Lettuce Production Through Agrivoltaic Systems. SSRN. Available online: https://papers.ssrn.com/sol3/papers.cfm?abstract_id=5413119 (accessed on 22 March 2026).

Disclaimer/Publisher’s Note: The statements, opinions and data contained in all publications are solely those of the individual author(s) and contributor(s) and not of MDPI and/or the editor(s). MDPI and/or the editor(s) disclaim responsibility for any injury to people or property resulting from any ideas, methods, instructions or products referred to in the content. |
© 2026 by the authors. Licensee MDPI, Basel, Switzerland. This article is an open access article distributed under the terms and conditions of the Creative Commons Attribution (CC BY) license.