


Abstract
Electric two-wheelers (E2Ws) are promoted as lower-emission options in emerging economies. Their long-term cost competitiveness depends mainly on battery durability and how batteries are managed at the end of their life. This research examines Li-ion and nickel-cobalt-manganese (NCM)-type batteries versus the previously common lead-acid batteries in these markets. The study uses a 12-year total cost of ownership (TCO) framework that includes battery degradation, estimated first-life duration, and alternative lifecycle pathways. It covers three sensitivity analysis cases: conservative, base case, and optimistic. Three scenarios are evaluated: (1) no lifecycle management, (2) refurbishment for first-life extension, and (3) integrated lifecycle management with refurbishment, second-life utilisation, and recycling. Results show that managing the battery lifecycle can reduce TCO. The amount of reduction depends on first-life duration, ownership horizon, refurbishment cost, downstream residual value, and use intensity. The greatest TCO gains are found in battery categories with short first-life duration, allowing substantial residual value recovery during ownership. Batteries with first-life durations of 12 years or more provide smaller benefits. These findings support optimising lifecycle pathways for maximum residual value. Improved TCO performance, along with supportive infrastructure, policies, and market development, is critical for broader E2W adoption.
1. Introduction
Decarbonization of road transport is widely recognised as a cornerstone of sustainable development strategies and climate change mitigation efforts [1,2]. Road transport decarbonization increasingly depends on primary zero-emission vehicle technologies, specifically battery-electric vehicles (BEVs) and fuel-cell vehicles (FCVs). Both are widely recognised as sustainable approaches for addressing global environmental challenges, beyond their role in transportation [3,4]. EVs offer zero tailpipe emissions, lower operating costs, and better energy efficiency from regenerative braking [5].
In the transport sector, though their suitability varies by vehicle class, infrastructure availability, and energy system characteristics [4,6]. In emerging economies across Asia, Africa, and Latin America, however, the widespread adoption of EVs continues to encounter significant barriers, including affordability, limited infrastructure, ambiguous regulatory frameworks, and low public awareness [7,8,9,10]. Financial obstacles are largely due to high battery costs and end-of-life battery replacement expenses, both of which substantially increase the TCO [11,12,13]. Amid slow global economic growth, limited public understanding of TCO, and the prevalence of used ICE vehicles (ICEVs), these factors further discourage consumers from transitioning to EVs [14,15].
Following the enactment of Presidential Regulation No. 55 of 2019, public interest in E2Ws has steadily increased in Indonesia [16,17]. In 2020, only 1947 E2Ws were registered [18]. The implementation of Coordinating Minister for Finance Regulation No. 26 of 2023, which introduced EV subsidies, contributed to significant growth in 2023, with registrations reaching 107,841 units, up from 33,461 units in 2022 [18,19]. By June 2025, 196,051 E2Ws had been recorded, representing 71.34% of the total of 274,802 EVs in Indonesia [20]. Despite recent growth, EV penetration remains limited in Indonesia’s two-wheeled vehicle market, which comprises over 150 million motorcycles [21].
A promising approach to overcoming this barrier is to develop a business model for EV battery lifecycle management (LM) systems. EVs require a battery with a state of health (SoH) exceeding 70% to 80% for effective mobility [22,23]. Refurbishing and repurposing retired EV batteries with residual capacity can add value and create new business opportunities. Additionally, implementing a lifecycle management-based system may reduce EV replacement costs [24,25].
Although efficient battery repair, recycling methods, and second-life battery applications have received increasing attention [24,25,26], few studies have systematically examined the impact of lifecycle management of retired EV batteries on affordability in emerging economies. Recent research has primarily focused on the four-wheeled EV market in developed countries [22,27], resulting in a limited understanding of the unique dynamics of EV adoption in regions such as Southeast Asia. While battery lifecycle management offers environmental benefits, its economic implications, particularly regarding the reduction in consumer TCO in emerging economies, remain insufficiently explored. This paper seeks to address this research gap.
This study is motivated by the potential to reduce battery replacement costs and pursues two primary objectives. The first objective is to quantify the impact of battery residual value, generated through refurbishment, second-life use, and recycling, on the TCO of E2W vehicles in Indonesia. Four scenarios are analysed: no lifecycle management (S1); refurbishment (S2); and refurbishment, second-life use, and recycling (S3). The second objective is to provide policy-relevant insights into how developing a circular battery economy can reduce affordability barriers, accelerate electric vehicle adoption, and support Indonesia’s long-term climate and energy goals. By integrating circular economy concepts into TCO modelling, this research offers a novel perspective on literature and ongoing policy discussions in developing countries.
The structure of this paper is as follows. Section 2 provides a review of the literature and methodology related to EV adoption, the lifecycle management of retired EV batteries, and TCO modelling. The subsequent section details the methodology and data sources employed for the scenario analysis. Section 3 presents findings from a case study of EV two-wheelers in Indonesia, while Section 4 discusses results across four residual value scenarios. Section 5 concludes with recommendations for policy, social, and industry implications, and outlines directions for future research.
2. Materials and Methods
This section outlines the conceptual and methodological framework utilised in the present study.
2.1. Electric Vehicle Adoption and Affordability Challenges
The global adoption of EVs has accelerated over the past decade, driven by declining battery costs, stricter environmental policies, and the influence of the global climate agenda [28,29]. Despite this overall growth, adoption patterns vary significantly between developed and emerging economies. In established markets such as Europe, North America, and China, EV penetration is facilitated by comprehensive incentives, well-developed charging infrastructure, and robust industrial ecosystems [30,31]. In contrast, factors such as affordability constraints, policy uncertainty, and insufficient infrastructure continue to impede EV adoption in emerging economies [7,32,33].
Affordability has emerged as a key determinant of EV adoption in low-income countries. Recent studies have shown that consumers in emerging markets are highly sensitive to both initial purchase price and lifecycle costs [32,34,35]. In Indonesia, motorcycles serve as the predominant mode of private transportation, and surveys reveal that the higher upfront cost of EVs compared to ICEVs constitutes a significant barrier to adoption, despite potentially lower long-term operating expenses [12,14]. Similar patterns are observed in Vietnam and India, where consumer willingness to adopt electric two-wheelers is closely linked to perceptions of battery affordability [15,36].
A significant challenge for E2Ws is the widespread perception among consumers that the battery represents both the most costly and the most uncertain component. The potential need for mid-life battery replacement substantially increases TCO, thereby introducing psychological and financial barriers [27,37,38]. Addressing these concerns requires interventions that lower replacement costs or establish mechanisms to capture the residual value of batteries at the end of their mobility service life.
2.2. TCO in EV Adoption
The TCO framework has been widely used to evaluate the comparative economics of EVs and ICEVs, accounting for purchase price, fuel or electricity expenses, maintenance, insurance, taxes, and depreciation [12,39,40]. Literature indicates that EVs typically exhibit higher TCO, primarily due to higher battery costs; however, the ongoing decline in lithium-ion battery prices has reduced this disparity [41,42]. Recent studies demonstrate that the TCO of EVs can reach parity with that of ICEVs when favourable electricity tariffs and policy incentives are in place [37,39,40].
Previous research emphasises the importance of adopting a life-cycle perspective when evaluating competitiveness [43,44,45]. Additionally, subsidies and fiscal incentives play a critical role in influencing TCO outcomes [11,12]. TCO analyses frequently overlook the potential residual value derived from refurbishment, second-cycle reuse, or recycling. Recent studies demonstrate that accounting for residual value enhances the competitiveness of EVs, particularly in fleet or shared mobility applications [22,24,46]. Nevertheless, the majority of research remains focused on the four-wheeled EV market in developed countries. The E2Ws segment, especially in Southeast Asia, is comparatively underexplored, representing a significant research gap addressed in this paper.
2.3. EV Batteries Lifecycle Management
Retired EV batteries are increasingly managed according to a circular economy hierarchy that emphasises value retention through refurbishment (first-lifecycle extension), reuse or repurpose in a second life, and recycling. SOH serves as a practical triage indicator for decision-making. The literature frequently cites an SOH of approximately 70–80% as the conventional end-of-first-life threshold for mobility services; however, many batteries remain technically viable beyond this threshold, depending on specific performance requirements and degradation modes [46,47,48]. Therefore, SOH should be regarded as an initial screening metric and supplemented with assessments of resistance or charge capability, cell imbalance, and safety diagnostics to minimise failure risk and uncertainty when reallocating batteries to repair, second-life, or recycling pathways [47,49].
Estimating battery SoH using remaining capacity and, when possible, verifying with internal resistance growth, provides a practical assessment method. These are the most established indicators for lithium-ion batteries and are widely used in second-life screening. For Indonesian electric two-wheelers, this approach is especially suitable. It is more feasible than full electrochemical or data-intensive methods in real operating conditions. It also captures degradation relevant to high-temperature, variable-duty urban use. Advanced impedance- or machine-learning-based methods are promising but usually require more controlled data and specialised testing infrastructure [50,51].
Retired EV batteries often retain significant residual performance, meaning they can still store and deliver electricity, even if they are no longer suitable for long-distance driving. This creates opportunities in the circular battery economy, which maximises battery value during and after initial use. High battery replacement costs undermine EV affordability, but repair, reconditioning, and refurbishment reduce these costs and address a key barrier to adoption [52]. Many retired EV batteries still have enough capacity for less-demanding stationary applications, such as battery energy storage systems for renewables, uninterruptible power supply systems, and street lighting [38,53]. Deploying batteries in these second-life uses extends battery lifespan and resource efficiency while generating economic value before final disposal or material recovery, especially since stationary systems require less stringent performance standards. Once batteries are unfit for reuse, recycling recovers valuable materials for new battery production, reducing reliance on virgin resources and environmental pressure from battery waste [26,53].
This study employed an SOH-driven decision framework. SOH quantitatively measures a battery’s condition, usually as a percentage of its original capacity. This framework was developed as a decision architecture to assess the suitability of applications for battery circularity systems. Rather than assuming a battery is fit for second-life applications at a fixed SOH threshold, recent research advocates for a more nuanced approach. Second-life feasibility depends on the battery’s actual health indicators—such as power delivery capability, thermal stability, reliability, and projected remaining lifetime—matching the operational needs of the intended use [51,54]. Thus, reaching the end-of-first life in EV use should not be equated with end-of-usefulness. Instead, it marks a transition point where the battery must be re-evaluated against new requirements [55,56]. This framework integrates SOH into a decision structure that combines non-destructive diagnostics, usage history, and pathway-level assessment—such as the evaluation of further use or recycling options. This approach enables stakeholders to distinguish between batteries suited for refurbishment, repurposing in second-life systems, or recycling [56,57]. The chief advantage is treating battery retirement as a relational judgement between condition and use case, rather than a universal threshold. This perspective strengthens the theoretical basis for sustainable and economically efficient retired battery management [54,58]. Figure 1 presents the flow diagram of the SOH-driven decision framework utilised in this study.
Figure 1.
Flow diagram of the SOH-driven decision framework. Adopted from the source [56,57].
For refurbishment or first-life extension. Targeted module or cell replacement, rebalancing, and battery management system (BMS) or thermal repairs can restore performance uniformity and extend service life. However, the feasibility of these interventions depends heavily on pack design and the effort required to dismantle them. Recent techno-economic studies indicate that pack architecture and dismantling complexity significantly influence total dismantling costs, which in turn affect the economic viability of repair or reuse [47,59]. For second-life reuse, retired EV battery packs can still deliver meaningful service in stationary storage. Nevertheless, second-life business models are constrained by high testing and assessment costs, variability in battery history, and the need for reliable sorting and regrouping to ensure consistent performance and warranty outcomes [47,49].
The recycling process involves recovering valuable materials through mechanical pretreatment, followed by pyro- or hydrometallurgical methods, with growing research interest in direct recycling approaches [26,60]. Recent system-level analyses highlight that the optimal combination of reuse and recycling pathways depends on both economic and environmental objectives. These findings have led to the development of decision-making frameworks that explicitly optimise routing under uncertainty, rather than relying on a single SOH threshold [27,45,61].
2.4. Mathematical Formulation
This method uses the battery’s life cycle management framework to calculate all costs in present value terms, applying a discount rate . Literature underscores the importance of using a life-cycle cost and discounting approach when comparing alternatives over a specified time horizon. The present value of each cost component for year t, where t ranges from 0 to N, is calculated by discounting annual costs as follows [11,61]:
The total discounted Total Cost of Ownership ) is calculated as follows [11,61]:
with:
: initial cost, which is the on-the-road price of the motorcycle in Jakarta.
: energy costs, such as fuel or electricity.
: costs for maintenance and repairs.
: annual fees for taxes or licences.
: annual insurance fees.
: the residual value at the end of year N.
: costs to replace components, especially the battery.
Battery degradation in mobility applications is conceptualised as a usage-dependent process, since battery ageing in electric vehicle contexts is influenced by both temporal factors and cumulative operational demand. Additionally, annual distance travel is a primary determinant of ownership cost and battery utilisation intensity [62,63,64]. Cumulative battery use up to a year is measured in equivalent full cycles (EFC) as follows [62,65]:
where denotes the cumulative EFC, denotes annual mileage driven in the year , specifies the electricity consumption per kilometre for the vehicle in a year , and corresponds to the initial usable battery capacity. These definitions align with prior studies [62,65]. This formulation explicitly allows battery life to vary based on vehicles’ annual mileage and operating conditions. Such consideration is crucial for evaluating electric motorcycles that experience different riding intensities [62,66].
The battery SOH is represented using a reduced-form exponential degradation model, which aligns with the nonlinear ageing behaviour commonly observed in lithium-ion batteries for transport applications [50,65,67]. The SOH trajectory is expressed as follows [50,65]:
where is the initial SOH. is the lower asymptotic bound. is the cumulative equivalent of full cycles. is the rated battery lifecycle in cycles. is the degradation-shape parameter [50,65].
Batteries with higher lifecycle ratings, such as 1000 or 1200 cycles, wear out more slowly than those with 800-cycle ratings, even if driven the same number of miles. This is because the same number of EFCs is a smaller portion of the total cycle rating in higher-rated batteries [50,66]. So, for otherwise identical vehicles, a higher cycle life means the battery lasts longer in its first use. However, more annual miles accelerate EFC accumulation and shorten the battery’s lifespan [62,66]. To maintain consistency between the lifecycle specification and the replacement threshold, calibrate . This ensures the battery reaches the designated end-of-life (EOL) condition at its rated cycle life [66,67].
is equal to specifically when equals [66], highlighting the relationship between these variables. Assuming constant battery use, the first-life battery service duration can be approximated as follows [66]:
where battery lifetime in years, represents annual mileage, and indicates average electricity consumption per kilometre during first-life operation [62,63]. This expression demonstrates that battery lifetime is positively correlated with battery lifecycle specification and negatively correlated with annual mileage. Consequently, motorcycles with higher usage deplete their first-life battery value more rapidly, even when battery chemistry and pack size remain constant [62,64].
The effect of the degradation pathway on electricity costs is clearer when modelling how electricity use per kilometre rises as battery SOH drops. This approach shows the links between lithium-ion battery ageing, capacity loss, and higher resistance [68,69]. To quantify this relationship, the following formula defines the effective electricity consumption for the year [68]:
where is the electricity consumption per kilometre in a year , is the beginning-of-life electricity consumption, and is an efficiency-degradation coefficient [68]. The annual electricity cost and its present value over the ownership horizon are defined as follows [70]:
where is the annual mileage in the year and is the electricity tariff or the gasoline tariff in the year [70].
Annual gasoline cost is calculated by multiplying annual fuel consumption by the gasoline price in year i, a standard practice in vehicle total cost of ownership (TCO) analyses that treat fuel as a recurring operating cost [70]. Here, denotes annual mileage in the year (km/year), fuel economy is in kilometres per litre (km/L), and is the gasoline price in year i (USD/L). The annual gasoline cost can thus be expressed as [70]:
Project year t gasoline price from the base-year price using a constant annual escalation rate as described in the literature [70]:
Substituting the escalated fuel price yields [70]:
A vehicle’s value declines with age. The selling price decreases due to depreciation () over its period of use (). The residual value at the end of the period can be represented as:
This relationship is especially important for the TCO analysis of E2Ws in Indonesia. Annual mileage directly affects the degradation rate, replacement schedule, and present value of users’ electricity costs [11,64]. Secondary data were gathered from official automotive manufacturer websites, sales agents, and newspapers to determine initial purchase costs, energy costs for gasoline and electricity, battery replacement and life-cycle costs, and maintenance expenses. We also collected supporting data, including taxes and assumptions on discount rates, insurance, depreciation, increased energy consumption, and mileage, from government websites, energy companies, newspapers, and previous studies [11,12,61,71].
2.5. Vehicle Archetypes and Scenario Design
Table 1 summarises archetypes of Indonesian E2W and ICE, developed using publicly available specifications to determine battery capacity, performance parameters, and upfront purchase cost:
- Entry-level E2W include the Volta 401, which is equipped with 1.34 kWh lithium ferro-phosphate (LFP) batteries, 1.90 kW motor, a top speed of 60 km/h, and an upfront purchase cost of USD 1140.63. This model provides a maximum range of 60 km after five hours of full charging and has 800 battery lifecycles [72].
- Mid-range E2W include the Volta Mandala X, which features 2.69 kWh LFP batteries with 1200 lifecycles, 4 kW motor, maximum range of 150 km after five hours of full charging, top speed of 70 km/h, and an upfront purchase cost of USD 1493.75 [73].
- High-end segment comprises the Charged Rimau, which offers 3.89 kWh nickel-cobalt-manganese (NCM) batteries with 1300 lifecycles, 4 kW motor, maximum range of 200 km after five hours of full charging, top speed of 95 km/h, and an upfront purchase cost of USD 3906.25 [74]. In addition, this segment also includes the Alva Cervo Q as a representative model in the premium E2W category in Indonesia. The vehicle is equipped with a 3.6 kWh NCM battery, a mid-drive motor with a maximum power output of 9.8 kW, a maximum range of up to 125 km per charge under the manufacturer’s stated test conditions, a top speed of up to 103 km/h, and a purchase cost of USD 3093.75 [75].Table 1. Archetypes of E2W and ICEVs in Indonesia were examined in this study.
For comparative purposes, the TCO of ICEVs in the Indonesian market was also calculated. In the entry-level segment, the analysis included the TVS Neo XR, which has an upfront purchase price of USD 918.75, a 110 cc engine, a top speed of 110 km/h, and a maximum range of 172 km [76]. The study also included used ICE motorcycles that are widely utilised by low-income consumers, specifically the five-year-old Yamaha Mio Gear and Honda Beat CBS models. The five-year-old Yamaha Mio Gear features a 125 cc engine, a top speed of 110 km/h, a maximum range of 199.20 km, and a purchase price of USD 562.50 [77]. The five-year-old Honda Beat is equipped with a 110 cc engine, a top speed of 94 km/h, a maximum range of 255 km, and a purchase price of USD 687.50 [78].
In the mid-range segment, the study evaluated the brand-new Yamaha Mio M3, which has an upfront purchase price of USD 1162.81 [79]. For the high-end segment, the Vespa Primavera i-get 150 ABS, equipped with a 154.80 cc engine, a top speed of 98 km/h, a maximum range of 275 km, and a purchase price of USD 3437.50, served as a comparison [80].
2.6. Assumptions
The analysis of the cost of ownership for two-wheeled vehicles requires several assumptions, including usage profile, time horizon, discount rates, energy tariffs, maintenance, residual value, circular value credit, battery replacement, and relevant policies. Table 2 summarises the assumptions obtained from secondary data sources that inform the TCO calculations for each E2W battery life-cycle management scenario. A 12-year ownership horizon was evaluated, enabling the observation of battery lifecycle management schemes within the E2W segment. The vehicle depreciation rate (dv) is 7.08% per annum, and the discount factor (r) is 12.78% [11]. This value is multiplied by the maximum distance achievable per charge and then divided by the annual travel distance. The exchange rate applied is 1 USD to 16,000 IDR [81]. The increase in electricity costs for E2W results from battery degradation, which is determined by battery capacity and lifecycle [71,82]. The escalation rate for energy tariff and maintenance costs is assumed to be 5% per year [83,84].
Table 2.
Main assumptions applied in this study.
Annual fees are calculated by aggregating taxes, licences, and insurance costs. Insurance expenses are set at 1.5% of each vehicle’s residual value [11]. Tax and licence fees are determined according to annual and five-year tax schedules. The Indonesian government provides a 1% value-added tax (VAT) relief for eligible locally produced electric vehicles that meet domestic content requirements. In 2024, additional government-borne VAT and luxury tax relief measures were introduced, further enhancing upfront affordability. These policies were continued and updated in conjunction with the 2025 VAT changes.
This study considers four TCO calculation scenarios for E2W: (S1) without lifecycle management; (S2) with battery refurbishment to extend the first lifecycle; and (S3) with integrated lifecycle management. In addition, the analysis examines the strategic policy framework supporting EV battery lifecycle management. The EV ecosystem is shaped by Presidential Regulation 55/2019, which accelerates the EV programme, infrastructure, and incentives, as well as the Bappenas circular economy roadmap (2025–2045). The latter explicitly targets circular inputs, including battery refurbishment, second-cycle use, and recycling, which underpin the battery replacement cost scenarios in this study.
In the first scenario, which excludes lifecycle management, the full replacement cost is incurred because the residual value of retired EV batteries is not considered. The second scenario, involving battery refurbishment to extend the first cycle life by half, achieves a 40% reduction in battery replacement costs [59]. In the third scenario, the value of a second-life battery and recycling. This second-life battery value is incorporated into the EV battery depreciation calculation as a factor in the replacement cost. The fourth scenario integrates EV battery refurbishment, second-life battery use, and recycling.
2.7. Sensitivity Analysis
The sensitivity analysis was structured to evaluate the robustness of the TCO results. It did so by incorporating specific uncertainties relevant to real-world vehicle use in Indonesia: household electricity category, prevailing fuel type, urban travel intensity (measured as average daily distance travelled), and potential for recovering residual battery value through second-life utilisation and recycling [48,61,85]. Rather than relying solely on generic modelling variations, this approach addresses variables that are particularly significant in Indonesia. For instance, charging costs and motorcycle usage patterns are shaped by diverse urban conditions across cities, while the economic benefits of battery second life and recycling depend on the maturity of downstream value chains [11,86].
The sensitivity analysis was deliberately limited to seven parameters: electricity tariff, fuel price, annual mileage, refurbishment cost, extended first-life after refurbishment, second life and recycling value. The battery pack cost and discount rate remained fixed at their baseline values. The objective was not to capture all possible techno-economic uncertainties. Instead, the focus was on assessing the robustness of TCO outcomes under contextual uncertainties most relevant to users in Indonesia during the use phase and the post-first-life stage. This targeted approach aligns with established TCO literature. In these studies, sensitivity parameters are typically selected based on decision relevance, contextual uncertainty, and policy significance. They are not chosen through exhaustive variation in all model inputs [70,85].
Annual mileage is a significant source of uncertainty in Indonesia, as it varies considerably between cities and directly influences how quickly the higher upfront cost of electric motorcycles can be balanced by savings on operating costs. To address this, city-specific empirical mileage data from Indonesia were used. For the low-mileage scenario, Makassar is selected, where motorcycle travel is 30 km per vehicle per day [87]. The medium-mileage scenario is represented by Semarang, with an average daily motorcycle travel of 40 km [88]. In contrast, Jakarta presents a high-mileage scenario: a study measuring daily travel for both ICEs and E2Ws reports 54.55 km for the medium mobility commuter profile [71], reflecting Jakarta’s more intensive metropolitan travel patterns compared to Bandung and Semarang. This value is thus used as the high-use benchmark in our analysis, enabling clear city-to-city comparisons.
Electricity tariffs in Indonesia are differentiated by representative household customer groups: 900 VA (IDR 1352 or 8.45 cents USD per kWh), 1300–2200 VA (IDR 1444.70 or 9.03 cents USD per kWh), and 3500 VA (IDR 1699.53 or 8.45 cents USD per kWh). This differentiation reflects variations in the affordability of home charging among household classes [89]. Fuel prices were analysed for both subsidised gasoline, Pertalite with research octane number (RON) 90 (IDR 10,000 or 0.63 USD per litre), and non-subsidised gasoline, including Pertamax RON 92 (IDR 12,200 or 0.77 USD per litre) and Pertamax Green RON 95 (IDR 12,900 or 0.81 USD per litre), to address uncertainty in operational cost comparisons between electric motorcycles and internal combustion engine motorcycles [90].
In the sensitivity analysis, the post-refurbishment extension of battery use in mobility applications is represented as a percentage of the initial fresh-battery service life, rather than as an absolute number of years. This approach enables consistent application across battery classes with varying nominal cycle-life ratings. Refurbishment costs are set at USD 76.67/kWh for the conservative case, USD 59.82/kWh for the base case, and USD 55.47/kWh for the optimistic case, within the range reported by previous research [91]. The post-refurbishment life-extension assumption is adapted from literature [52], who used 2, 4, and 6 years as lower-, central-, and upper-bound sensitivity values for reconditioned EV batteries in continued vehicle use. To convert these values to a relative form, an 8-year fresh-battery reference life is used, consistent with the 8–10-year EV battery warranty range summarised in the literature [53]. Accordingly, the additional mobility life after refurbishment is defined as 25% of the initial fresh-battery life in the conservative case, 50% in the base case, and 75% in the optimistic case. Refurbishment remains a recognised life-cycle management pathway for EV batteries prior to second-life deployment or final recycling; however, its economic viability depends on retained battery condition, repair intensity, and market context.
The sensitivity analysis parameterised the economic value of second-life utilisation using a three-case structure to address uncertainty in the market value of repurposed retired EV batteries, as reported in prior techno-economic and lifecycle studies [43,92,93]. The conservative case applies a second-life value range of USD 44–72/kWh, with an average of USD 58/kWh, representing lower-bound market conditions where repurposing revenues are constrained by battery degradation, testing and reconfiguration costs, or deployment in lower-value stationary applications [43,92]. The base case uses a value range of USD 72–116/kWh, averaging USD 94/kWh, to reflect moderate market conditions and values consistent with recent estimates of second-life battery economics under commercially plausible repurposing scenarios [43,93]. The optimistic case adopts a value range of USD 116–180/kWh, with an average of USD 148/kWh, representing favourable conditions in which retired batteries maintain strong residual performance and are suitable for higher-value stationary energy storage applications after repurposing [43,92].
Unlike sensitivity tiers, recycling value was set by battery chemistry, such as lithium iron phosphate (LFP) or nickel-cobalt-manganese (NCM). The economic return from end-of-life recycling depends on material composition and the value of critical metals [94]. Recycling value was set at approximately USD 15/kWh for LFP batteries and USD 42/kWh for NCM batteries. This reflects the higher recovery value of nickel- and cobalt-containing chemistries, such as NCM, compared to LFP [94]. This approach allows the model to separate uncertainty in second-life market valuation from variation in chemistry-specific end-of-life recovery value. As a result, it supports better evaluation of lifecycle management strategies for retired EV batteries within the TCO framework [43,93,94].
Table 3 summarises the assumptions used in the case-based sensitivity analysis for conservative, base-case, and optimistic conditions. These assumptions account for variations in electricity tariffs, fuel price comparators, annual mileage, refurbishment cost and post-refurbishment mobility life, second-life value, and recycling value, all specific to Indonesian conditions. The conservative case reflects less favourable operating conditions. In contrast, the optimistic case represents more favourable ones. The base case reflects the central model assumptions. These cases are applied across Scenarios 1, 2, and 3. This enables the assessment of the robustness of TCO results and the evaluation of whether the relative benefit of lifecycle management persists under varying real-world conditions.
Table 3.
Assumptions used in the case-based sensitivity analysis.
3. Results
3.1. Summary of Results Across Sensitivity-Analysis Cases and Lifecycle-Management Scenarios
Table 4 reports the 12-year TCO for all vehicle classes across three sensitivity analysis cases: conservative, base case, and optimistic. These results are further analysed across three lifecycle-management scenarios. Scenario 1 represents the absence of lifecycle management; Scenario 2 involves refurbishment to extend the first life cycle; and Scenario 3 incorporates integrated lifecycle management, including refurbishment, second-life utilisation, and recycling. Table 5 provides the approximate first-life years for each E2W battery category.
Table 4.
Recapitulation of 12-year TCO for all cases and scenarios.
Table 5.
Recapitulation of 12 years approx. first-life years for all cases and scenarios.
Table 4 indicates substantial variation in overall TCO across the different cases and scenarios. The lowest TCO is recorded for the subsidised entry-level E2W under the optimistic case and Scenario 3, at USD 1014.13. In contrast, the highest TCO is found for the high-end ICE under the conservative case and Scenario 1, at USD 5559.39. These findings demonstrate that the 12-year ownership cost is influenced by both the underlying assumptions of the sensitivity analysis cases and the implementation of lifecycle management strategies. Specifically, Table 4 reveals a general trend of decreasing TCO from the conservative to the base-case and further to the optimistic case, as well as from Scenario 1 to Scenario 2 and Scenario 3 for most E2W categories. However, the magnitude of this decline is inconsistent and is strongly affected by the battery’s approximate first-life years, as discussed below.
The three sensitivity-analysis cases are defined by distinct combinations of assumptions regarding operating costs, battery-reuse economics, and post-refurbishment performance. The conservative case applies the highest electricity tariff, the highest daily mileage, the highest refurbishment cost, the shortest post-refurbishment life extension, and the lowest second-life value, representing the least favourable economic conditions for E2Ws and lifecycle interventions. In contrast, the optimistic case features lower electricity tariffs, daily mileage, and refurbishment costs, as well as longer post-refurbishment extensions and higher second-life values, resulting in more favourable TCO outcomes. The base case represents an intermediate scenario. These assumptions influence not only TCO levels but also the timing of battery depletion and the practical significance of refurbishment, second-life utilisation, and recycling over the 12-year ownership period.
Table 6 summarises that the economic impact of battery lifecycle management differs significantly across vehicle segments and case assumptions. Across all applicable E2W categories, Scenario 3 consistently results in greater TCO reductions compared to Scenario 2. The most substantial improvement occurs in the entry-level E2W segment, where the percentage reduction increases from 7.74–8.27% in the conservative case to 9.72–10.31% in the base case and 11.94–12.58% in the optimistic case. This trend indicates that lifecycle integration becomes increasingly valuable under more favourable operating conditions. A similar, though less pronounced, pattern is observed for subsidised entry-level E2Ws (4.41–5.15%, 4.55–5.41%, and 5.05–5.93%) and high-end E2W #1, where reductions range from 4.80–5.84% for subsidised models and 5.12–6.05% for non-subsidised models in the conservative case, rising to above 8% in the optimistic case for subsidised models. In contrast, the mid-range E2W segment exhibits a highly case-dependent response, with only marginal reductions in the conservative and optimistic cases (0.00–0.79%) but substantially larger gains in the base case, reaching 9.76–10.43% for subsidised and 7.57–8.09% for non-subsidised models. High-end E2W #2 shows the smallest gains, at only 0.00–1.54%. All ICE comparators remain inapplicable, confirming that the lifecycle scenarios are specific to battery-based vehicles. In summary, Table 5 indicates that the TCO benefit of lifecycle management is most significant in entry-level E2Ws and selected high-end models, while its effectiveness in other segments is highly dependent on the underlying case assumptions.
Table 6.
Percentage differences in 12-Year Total Cost of Ownership across all cases and scenarios.
3.2. Role of Approximate First-Life Years in Mediating Lifecycle-Management Effectiveness
Table 5 shows notable variation in estimated first-life years across vehicle classes. Entry-level E2W consistently has the shortest first-life durations, increasing from 2.41 (conservative), to 3.29 (base), and 4.38 (optimistic) years. Mid-range E2W displays much longer first-life spans, ranging from 9.05 to 16.46 years, depending on the scenario. High-end E2W#1 exhibits intermediate values from 6.28 to 11.42 years. High-end E2W#2 stands out with the longest first-life durations, ranging from 13.06 to 23.74 years across scenarios. These patterns indicate that higher-priced models deliver greater initial battery longevity. Figure 2 presents the 12-year projected total cost of ownership (TCO) for all battery lifecycle management scenarios and motorcycle segments.
Figure 2.
12-year projected TCO for all battery lifecycle management scenarios and motorcycle segments.
A comparison of Table 4 and Table 6 shows that approximate first-life years are a key explanatory variable for TCO patterns across scenarios. Without these interventions, battery replacement would be necessary during the ownership period. In these cases, Scenarios 2 and 3 can substantially reduce TCO through refurbishment and value recovery. Conversely, as the battery’s first life approaches or exceeds 12 years, the incremental TCO benefit of lifecycle management is limited. The battery remains serviceable for most or all of the ownership period. Results in Table 4 should be interpreted alongside Table 5. The cost impact of lifecycle management depends on the timing of first-life exhaustion relative to the analysis horizon. This relationship is especially pronounced when comparing vehicle classes. Entry-level E2Ws exhibit a short first-life duration, leading to repeated battery-related lifecycle costs over the 12-year period. Thus, Scenarios 2 and 3 are particularly impactful for this class. High-end E2W#2 has extended first-life duration, so replacement within the ownership horizon is less likely, limiting direct TCO gains from refurbishment. Mid-range E2W and high-end E2W#1 are intermediate cases. Their economic significance for lifecycle management is more sensitive to specific case assumptions.
3.2.1. Results for the Entry-Level Segment
Table 4 shows that the subsidised entry-level E2W consistently achieves the lowest TCO among entry-level alternatives across all sensitivity analysis cases and lifecycle management scenarios. In the conservative case, its TCO decreases from USD 1282.69 in Scenario 1 to USD 1226.17 in Scenario 2, and to USD 1216.67 in Scenario 3. In the base case, the TCO values are USD 1109.70, USD 1059.20, and USD 1049.70 for Scenarios 1–3, respectively. Under the optimistic case, the TCO further declines to USD 1078.02, USD 1023.63, and USD 1014.13. These findings demonstrate that, even for an already cost-competitive subsidised entry-level E2W, incorporating lifecycle management pathways further enhances long-term ownership economics.
The non-subsidised entry-level E2W also exhibits a significant TCO reduction across scenarios, although it remains more expensive than the subsidised variant in all cases. Under conservative assumptions, its TCO decreases from USD 1777.91 in Scenario 1 to USD 1640.39 in Scenario 2 and USD 1630.88 in Scenario 3. In the base case, the TCO values are USD 1604.93, USD 1449.00, and USD 1439.50, while under the optimistic case, they are USD 1484.87, USD 1307.57, and USD 1298.07. When considered alongside Table 5, these results align with the short first-life duration of the entry-level battery, which ranges from 2.41 to 4.38 years across the three cases. Because this first life is substantially shorter than the 12-year ownership horizon, refurbishment and integrated lifecycle management are critical for reducing cumulative ownership costs.
The percentage-difference results extracted from the calculation workbook further support this interpretation. From Scenario 1 to Scenario 3, the subsidised entry-level E2W achieves cumulative TCO reductions of 5.15%, 5.41%, and 5.93% under conservative, base-case, and optimistic assumptions, respectively. For the non-subsidised entry-level E2W, the reductions are even greater at 8.27%, 10.31%, and 12.58%. These findings indicate that lifecycle management interventions are most economically significant in battery categories with the shortest initial first-life. Thus, Table 4 and Table 5 together suggest that the entry-level segment is most sensitive to lifecycle strategy, as its battery first-life is depleted relatively early during the analysis period.
3.2.2. Results for the Mid-Range Segment
The mid-range segment shows greater variability in TCO across different lifecycle management scenarios. For the subsidised mid-range E2W, Table 4 presents TCO values of USD 1470.76, USD 1470.12, and USD 1460.61 for Scenarios 1–3, respectively, under the conservative case. In the base case, the corresponding values are USD 1404.91, USD 1267.85, and USD 1258.34. Under the optimistic case, the TCO values are USD 1202.47, USD 1202.47, and USD 1192.97. The non-subsidised mid-range E2W exhibits a similar trend, with TCO values of USD 1877.61, USD 1876.70, and USD 1867.20 in the conservative case; USD 1811.76, USD 1674.70, and USD 1665.19 in the base-case; and USD 1609.32, USD 1609.32, and USD 1599.82 in the optimistic case.
Table 5 indicates that the estimated first-life duration of the mid-range battery is 9.05 years in the conservative case, 12.34 years in the base case, and 16.46 years in the optimistic case. The percentage-difference analysis reveals that the cumulative reduction in TCO from Scenario 1 to Scenario 3 for the subsidised mid-range E2W is 0.69% in the conservative case, 10.43% in the base case, and 0.79% in the optimistic case. The non-subsidised mid-range E2W displays a comparable trend, with reductions of 0.55%, 8.09%, and 0.59%, respectively.
3.2.3. Results for the High-End Segment
Table 4 presents two distinct patterns in the high-end segment, each corresponding to a specific battery-performance configuration. For high-end E2W#1, the subsidised variant records TCO values of USD 3401.00, USD 3237.86, and USD 3202.23 in the conservative case for Scenarios 1, 2, and 3, respectively, clearly showing a declining trend as scenarios progress. Similarly, in the base case, these values change from USD 3030.71 in Scenario 1 to USD 2820.76 in Scenario 2 and to USD 2785.12 in Scenario 3, while in the optimistic case, the TCO shifts from USD 2992.09 in Scenario 1 to USD 2778.45 in Scenario 2 and to USD 2742.82 in Scenario 3. The non-subsidised high-end E2W#1 also demonstrates a decline, with TCO values decreasing from USD 3823.14 in Scenario 1 to USD 3627.48 in Scenario 2 and USD 3591.85 in Scenario 3 in the conservative case. The base case follows this pattern, dropping from USD 3452.85 to USD 3242.90 and then to USD 3207.26, while the optimistic case shows a reduction from USD 3414.23 to USD 3200.59 and then to USD 3164.96 from Scenario 1 to Scenario 3.
For high-end E2W#2, TCO changes across scenarios are less pronounced. The subsidised high-end E2W#2 records TCO values of USD 3624.03 in both Scenarios 1 and 2, and USD 3570.59 in Scenario 3 under the conservative case, indicating little change until the final scenario. In the base case, values remain at USD 3516.52 for Scenarios 1 and 2, then decrease to USD 3462.57 in Scenario 3. Similarly, the optimistic case holds at USD 3478.55 for Scenarios 1 and 2, then lowers to USD 3425.10 in Scenario 3. The non-subsidised high-end E2W#2 exhibits a similar trend, with reductions becoming noticeable only from Scenario 2 onward.
Table 5 indicates that the approximate first-life duration of high-end E2W#1 is 6.28 years under conservative assumptions, increases to 8.56 years in the base case, and reaches 11.42 years in the optimistic scenario, reflecting a progression across the scenarios. In contrast, high-end E2W#2 achieves 13.06 years in the conservative scenario, extending to 17.81 years (base-case) and 23.74 years (optimistic). This disparity is also evident in the percentage-difference results: from Scenario 1 to Scenario 3, the cumulative TCO reduction for the subsidised high-end E2W#1 reaches 5.84%, 8.10%, and 8.33% for conservative, base-case, and optimistic scenarios, respectively. For the subsidised high-end E2W#2, the reduction remains limited to approximately 1.47–1.54% across scenarios. A similar pattern is observed in the non-subsidised variants.
3.3. Comparative Analysis with ICE Motorcycles
For the high-end segment, Table 4 identifies two distinct patterns corresponding to two battery-performance configurations. For high-end E2W#1, the subsidised variant records USD 3401.00, USD 3237.86, and USD 3202.23 in the conservative case for Scenarios 1–3, respectively. Under the base case, the values are USD 3030.71, USD 2820.76, and USD 2785.12, while under the optimistic case, they are USD 2992.09, USD 2778.45, and USD 2742.82. The non-subsidised high-end E2W#1 likewise declines from USD 3823.14 to USD 3627.48 and USD 3591.85 in the conservative case, from USD 3452.85 to USD 3242.90 and USD 3207.26 in the base-case, and from USD 3414.23 to USD 3200.59 and USD 3164.96 in the optimistic case.
4. Discussion
4.1. Lifecycle Pathway Optimisation Framed as a Residual-Value Problem
The present findings indicate that retired electric motorcycle batteries are best evaluated using a lifecycle pathway optimisation model, which maximises residual value through first-life extension, second-life utilisation, and final material recovery, rather than adhering to a fixed end-of-life rule. Within this framework, the selection among continued first-life use, refurbishment, second-life deployment, and recycling is determined by the interplay of technical condition, retirement timing, remaining useful life, and downstream economic return [53,57]. The importance of this optimisation perspective is demonstrated by the three sensitivity-analysis cases in this study. The conservative case constitutes the least favourable optimisation environment, combining higher electricity costs, greater usage intensity, increased refurbishment costs, shorter post-refurbishment extension, and reduced downstream value recovery. The base case serves as an intermediate optimisation environment, while the optimistic case offers the most favourable value-capture scenario, as more battery value is retained through lower operating costs, less expensive interventions, and enhanced post-first-life recovery potential. Thus, the sensitivity analysis not only alters TCO magnitudes but also affects the economic feasibility of the pathway optimisation problem itself [57,63].
Within this framework, Scenario 1 represents a non-optimised baseline where battery value is primarily realised during initial mobility use. Scenario 2 reflects a partial optimisation strategy focused on refurbishment and extended first-life service. Scenario 3 constitutes the most comprehensive optimisation pathway, as it integrates refurbishment, second-life utilisation, and recycling. The empirical results in Section 3 demonstrate that transitioning from Scenario 1 to Scenario 3 yields the greatest economic benefit when the battery retains significant recoverable value that can be monetised within a 12-year period. This finding aligns with pathway-optimisation studies, which argue that reuse and recycling decisions should be assessed collectively as value-retention strategies rather than as isolated technical endpoints [57]. It also aligns with EV battery life-cycle management literature, which underscores the need to embed end-of-life management within the EV ecosystem to maximise total battery and material value [53].
4.2. The Impact of Sensitivity-Analysis Cases on Lifecycle Management
The findings demonstrate that approximate first-life years are the primary variable determining whether lifecycle pathway optimisation can significantly reduce TCO during the ownership period. When first life is short relative to the 12-year horizon, the battery reaches a decision point early enough for refurbishment and downstream reuse to influence owner-level economics. Conversely, when first-life exceeds the ownership horizon, most of the battery’s usable value is realised in the original application, resulting in a smaller incremental gain from intervention within the ownership period. This interpretation aligns with recent optimisation research on retired lithium-ion batteries, which indicates that pathway selection should be based on the balance between remaining functional value and the economic or environmental returns from alternative downstream uses [57]. Similarly, research on cascading applications demonstrates that lifetime extension across stages is determined by state of health and remaining useful life, rather than by a universal post-retirement rule [96].
This optimisation logic is clearer when considered alongside the three sensitivity-analysis cases, which contrast in their impacts. In the conservative scenario, higher mileage accelerates the approach to the first-life boundary, limiting the recoverable residual value due to higher refurbishment costs and reduced downstream value. By contrast, in the optimistic scenario, first life typically extends, so downstream value capture becomes more attractive. Yet if the battery lifespan already surpasses the 12-year horizon, this does not yield substantial TCO reductions during ownership because switching pathways cannot occur early enough. The base case lies between these extremes, as it often reflects scenarios in which first life is relevant to the ownership horizon and residual-value recovery remains viable. Therefore, the study concludes that lifecycle pathway optimisation is not simply a monotonic function of improved assumptions; instead, it depends on how scenario assumptions reposition the battery relative to the ownership horizon, thereby reshaping the value-maximising pathway [57,63].
4.2.1. Entry-Level E2Ws: A Compelling Case for Lifecycle Integration
The entry-level segment most clearly demonstrates the necessity of integrating lifecycle management directly into TCO modelling, rather than addressing it solely as an end-of-life consideration. Since the estimated first-life of entry-level batteries is consistently shorter than the 12-year ownership period across all scenarios, owners encounter battery-related cost pressures early in the vehicle’s lifespan. In these circumstances, refurbishment and integrated lifecycle management significantly reduce cumulative costs by distributing battery value across multiple stages, rather than relying on a simple replacement or disposal approach. This perspective aligns with the literature [53] which conceptualises EV battery management as a comprehensive life-cycle system encompassing reuse, repurposing, remanufacturing, and recycling, rather than as a limited disposal decision. It also aligns with broader circular-economy literature, which identifies value retention as the principal economic justification for post-first-life battery pathways [97,98].
This consideration becomes clearer when compared to low-cost used ICE motorcycles, which often serve as the main benchmark in lower-priced market segments. In these segments, customers typically consider a depreciated used ICE vehicle, not a new one, as their primary alternative. This raises the competitiveness threshold for EVs, making affordability crucial. In this context, circular battery strategies do more than support sustainability; they directly help keep E2Ws cost-competitive with used ICE motorcycles. The findings suggest that, especially in cost-sensitive markets, E2W adoption depends as much on preserving downstream battery value through refurbishment, second-life use, and recycling as on initial purchase subsidies. This is consistent with TCO studies that show EV competitiveness in low-cost segments is highly sensitive to usage patterns and assumptions about residual value [63,99].
4.2.2. The Mid-Range Threshold Effect
The mid-range segment shows a more complex economic mechanism. Here, lifecycle management delivers the most value when the first-life duration matches the ownership horizon, and refurbishment assumptions are favourable enough to shift costs within that period. In the conservative scenario, the battery degrades during the 12-year window. However, high refurbishment costs and limited extension after refurbishment restrict economic returns. In the optimistic scenario, the first life exceeds the ownership horizon, so no intervention is needed within that period. As a result, the base case is the most relevant context for lifecycle intervention. In this case, battery durability and downstream economics are balanced. Refurbishment and lifecycle management can then strongly influence ownership costs.
This threshold view aligns with the existing refurbishment and circularity literature. The literature shows that refurbishment economics depend on how the cost structure, market conditions, and process timing interact [91]. It is not a simple replacement decision. Studies on circular battery systems also find that reuse and repurposing values depend on battery condition, chemistry, application matching, and the organisation of the downstream market [97,98]. The mid-range findings in this study show this logic. Lifecycle management brings the most savings in the intermediate range. Here, first-life duration closely matches the ownership boundary, and refurbishment economics justify intervention [91].
4.2.3. Distinction Between High-End E2W#1 and High-End E2W#2
The distinction between high-end E2W#1 and high-end E2W#2 is significant. It demonstrates that maximising residual value does not always require earlier or more frequent interventions. High-end E2W#1 continues to benefit from Scenarios 2 and 3. Its first-life duration remains within or near the ownership horizon across conservative, base, and optimistic scenarios. In this context, refurbishment and downstream utilisation modify the owner’s cost structure as the battery approaches the stage at which its residual value can be redeployed. In contrast, high-end E2W#2 realises most of its value through extended first-life use. It is estimated that first-life surpasses the 12-year horizon in all scenarios. Therefore, the optimal strategy is to prioritise continued first-life service, followed by subsequent second-life use or recycling. This finding aligns with optimisation research. The preferred pathway is determined by the point of greatest total retained value, rather than a universal preference for early reuse [57].
This interpretation is further supported by recent research on battery reconditioning. A recent study demonstrates that the effectiveness of reconditioning depends on both the availability and suitability of batteries entering the reconditioning stream. It also depends on the prevailing market and stakeholder conditions [52]. The present findings reflect this conclusion. High-end E2W#2 does not benefit less from lifecycle management because circular pathways are inherently less important. Instead, the original battery’s performance is high enough that extending first-life value is the most economically advantageous strategy. Therefore, pathway optimisation for long-life batteries should focus on determining the best timing for transferring residual value from first life to subsequent stages. Accelerating refurbishment is not always the priority.
4.2.4. Sensitivity Analysis and the Hierarchy of Residual-Value Pathways
The results show a hierarchy: refurbishment, second-life use, and recycling each capture distinct layers of residual value. The sensitivity analysis compares the relative appeal of these layers under three scenarios. In the conservative scenario, higher refurbishment costs and lower downstream value reduce economic benefits for all post-first-life pathways, with optimisation gains only strong for batteries with a clearly short first life. When moving to the base scenario, a better cost-value balance makes refurbishment and integrated pathway design more attractive for a wider range of batteries. In the optimistic scenario, downstream value capture is most attractive; however, this benefit depends on whether the battery reaches pathway switching within the ownership horizon. Thus, the case structure not only affects residual values but also changes the ranking of alternative pathways within the optimisation framework.
This hierarchy matches the battery life-cycle management literature. Refurbishment primarily extends the use of the original application and captures residual mobility value. Second-life deployment takes advantage of the remaining functional value of a battery after it is no longer fit for mobility use. Recycling recovers material value after other uses are no longer justified [53,97]. Scenario 3 in this study comes closest to a complete life-cycle pathway optimisation model. It aims to monetise value at several stages and avoids leaving value after first-life retirement. Scenario 3 performs best for short- and intermediate-life batteries. Value maximisation is greatest when recoverable value remains after first use and when sensitivity assumptions support effective value capture.
4.3. Methodological Implication: TCO Models Should Endogenise Residual-Value Pathway Choice
A key methodological implication of this study is that TCO models should move beyond representing residual value as a single exogenous salvage parameter. Instead, residual value should be treated as the outcome of lifecycle pathway optimisation. In this framework, residual value is determined by factors such as degradation timing, first-life duration, refurbishment economics, second-life marketability, and recycling recovery, rather than being imposed as a fixed terminal assumption. This perspective aligns with studies that model reuse and recycling decisions as pathway choices to optimise economic and environmental outcomes, as well as with research advocating for the integration of reuse and recycling into the broader EV ecosystem rather than treating them as isolated downstream events [53,57].
This implication is further underscored by the sensitivity analysis. In the conservative scenario, higher usage intensity and weaker downstream value recovery reduce the economically recoverable residual value, so the optimal pathway may remain close to the baseline unless the first life is sufficiently short. In the base scenario, the balance between degradation timing and recoverable downstream value is more favourable, allowing pathway optimisation to materially affect TCO. In the optimistic scenario, downstream value recovery is strongest, but the economic benefit from intervention still depends on whether the battery reaches the relevant switching point within the 12-year horizon. Thus, the conservative, base, and optimistic assumptions not only alter total cost levels but also shift the economically optimal residual-value pathway. This interpretation is consistent with TCO literature, which shows that EV ownership economics are highly sensitive to use-intensity and cost assumptions, particularly distance travelled and residual-value conditions [63].
The results substantiate the need for a segment-specific optimisation framework. Short-life batteries, such as those in the entry-level category, should prioritise early value-retention strategies because a significant portion of battery value can be captured during the ownership period. Intermediate-life batteries require case-specific optimisation, as the preferred pathway depends on the balance between intervention costs and recoverable value. Long-life batteries may prioritise extended first-life use, with second-life utilisation and recycling as subsequent value-maximising stages. This argument aligns with recent circular-battery research, which emphasises that EV battery pathways should be tailored to technical condition and downstream application potential rather than governed by a universal rule [57,97].
In summary, the methodological contribution of this study is not only the incorporation of post-first-life pathways into TCO analysis, but also the demonstration that these pathways should be treated as endogenous optimisation choices under varying sensitivity settings. The optimal strategy is therefore not fixed across battery classes; instead, it is the pathway that maximises residual value under the specific technical and economic conditions defined by the conservative, base, and optimistic scenarios [53,57].
5. Conclusions, Policy Implications, Limitations, and Future Research
5.1. Conclusions
This study investigates the impact of battery degradation, estimated first-life duration, and alternative lifecycle pathways on the 12-year TCO of E2Ws under conservative, base-case, and optimistic sensitivity-analysis scenarios. The findings demonstrate that effective lifecycle management can reduce TCO; however, the extent of this reduction depends heavily on battery durability during the ownership period and on the economic viability of refurbishment, second-life use, and recycling. Specifically, the analysis indicates that TCO benefits are maximised when the battery reaches the end of its first life early enough to allow residual value recovery within the ownership period, whereas the marginal benefit diminishes as the horizon extends.
A central conclusion of this study is that the economic relevance of lifecycle management is conditional rather than universal. Refurbishment, second-life utilisation, and recycling do not contribute equally across all battery classes; instead, their value depends on four key drivers: battery first-life (the duration and quality of initial use), use intensity (how heavily the battery is used), intervention cost (the expenses involved in refurbishing or repurposing), and downstream value recovery (the benefits gained from subsequent use or recycling). Given these factors, the study supports a lifecycle-pathway-optimisation perspective. Specifically, the preferred pathway is the one that maximises residual value under particular technical and economic conditions. This approach contrasts with a fixed rule that assumes refurbishment or second-life deployment is always optimal. Notably, this interpretation aligns with recent research, which suggests that pathway selection for retired batteries should be an optimisation problem considering both economic and environmental objectives, rather than a single predetermined route [57]. It also complements the battery lifecycle management literature, which views reuse, repurposing, and recycling as interconnected stages of value retention rather than isolated end-of-life decisions [53].
This study diverges from existing TCO literature in two key ways. First, previous keyways usually treat battery residual value as a static assumption. Here, TCO is directly linked to battery degradation, estimated first-life duration, and post-first-life pathway selection. Second, instead of considering only an average scenario, this analysis evaluates lifecycle pathways under conservative, base-case, and optimistic sensitivity settings. This reveals that a single battery may have different economically preferred pathways depending on operating and market conditions. Thus, the framework moves beyond standard first-life vehicle costing to offer a more structured, circular-economy view of ownership costs. Findings require caution: the study does not find a universally optimal pathway for all E2W batteries. Instead, it shows how pathway attractiveness shifts under different technical and economic assumptions.
The scientific justification for this research is to address a significant gap between battery degradation modelling and ownership-cost modelling. Existing studies on EV adoption and TCO show that ownership economics are influenced by factors such as usage patterns, infrastructure availability, perceived value, and policy context. However, these studies also indicate that TCO alone does not fully account for adoption outcomes [11,12,70]. This study advances the field by integrating battery first-life timing and lifecycle pathway design into TCO analysis in a more endogenous manner. This approach clarifies the economic relevance of post-first-life interventions. Socially, the research is justified by the need to enhance the affordability and sustainability of E2W transitions in emerging economies. In these regions, consumers are highly price sensitive. Downstream battery management affects waste reduction, resource efficiency, and the broader legitimacy of electric mobility transitions [100,101,102].
5.2. Policy Implications
The policy implications of these findings requires careful consideration. First, the battery circularity policy should be customised by battery class and expected first-life duration, rather than applied uniformly to all E2Ws. Shorter first-life batteries require increased support for refurbishment and downstream use, while longer-life batteries need policies that maintain first-life value and build effective second-life and recycling markets. Second, supporting E2W adoption must go beyond purchase incentives. Where affordability is a barrier, especially in lower-cost segments competing with used ICE motorcycles, complement policies to reduce refurbishment costs, develop second-life markets, and boost recycling systems to enhance E2W economic viability. Third, since adoption depends on more than ownership cost, address charging infrastructure, consumer awareness, perceived reliability, and other social or infrastructural barriers identified in the electric vehicle adoption literature [14,103].
5.3. Research Limitations
The study’s limitations are threefold. First, it relies on scenario assumptions for refurbishment costs, life extension, second-life value, and recycling value rather than observed market transactions; these factors are likely to differ across battery technologies, firms, policy contexts, and market maturity. Second, while approximating first-life years is analytically useful, actual battery decisions depend on factors such as state of health, safety, warranty, user behaviour, and technical criteria. Third, although lifecycle management can reduce TCO in some cases, lower TCO alone may not drive E2W adoption; instead, broader research shows EV uptake is influenced by infrastructure, range anxiety, attitudes, policy, awareness, and social factors [14,100,103].
5.4. Future Research
Future research should expand the current framework by using empirical market data on refurbishment, second-life utilisation, and recycling. This will help assess how robust scenario results are under real commercial conditions. Integrating TCO model with consumer-adoption frameworks would allow examination of cost competitiveness and its relationship with infrastructure, behavioural intention, social acceptance, and institutional support. Further studies could develop a formal lifecycle pathway optimisation model. This model would consider switching decisions among refurbishment, second-life use, and recycling, based on state of health, risk, market value, and environmental performance [57]. Comparative analysis across emerging economies are also needed, as adoption conditions, policies, and business models may differ greatly [15,32,104]. These findings indicate that lifecycle management can enhance the ownership-cost profile of E2Ws. However, its impact on broader market adoption will depend on technical, behavioural, institutional, and infrastructural factors not addressed in this study.
Author Contributions
Conceptualization, F.F., K.L. and J.C.L.; methodology, F.F. and K.L.; software, F.F.; validation, F.F., K.L. and J.C.L.; formal analysis, F.F., K.L. and J.C.L.; investigation, F.F., K.L. and J.C.L.; resources, F.F., K.L. and J.C.L.; data curation, F.F.; writing—original draft preparation, F.F., K.L. and J.C.L.; writing—review and editing, K.L. and J.C.L.; visualisation, F.F.; supervision, K.L. and J.C.L.; project administration, F.F.; funding acquisition, K.L. and J.C.L. All authors have read and agreed to the published version of the manuscript.
Funding
The contributions of J.C.L. and K.L. were funded by the project “Creating resilient sustainable microgrids through hybrid renewable energy systems” (EPSRC. EP/R030243/1) and the University of Leeds International Strategy Fund ‘Indonesia Net Zero Network’ project. F.F was fully supported by doctoral study scholarships from PT Pertamina (Persero).
Institutional Review Board Statement
Not applicable.
Informed Consent Statement
Not applicable.
Data Availability Statement
The data presented in this study are available upon request from the corresponding author because the data are part of an ongoing study.
Acknowledgments
The authors acknowledge the administrative support provided by the School of Geography and the School of Electronic and Electrical Engineering at the University of Leeds. The authors also thank the editors and reviewers for their constructive comments and valuable suggestions.
Conflicts of Interest
Author Ferry Fathoni was employed by the company PT Pertamina (Persero). The remaining authors declare that the research was conducted in the absence of any commercial or financial relationships that could be construed as a potential conflict of interest. The authors declare that this study received funding from UK Research and Innovation (UKRI) and the University of Leeds International Strategy Fund. The funder had the following involvement with the study: “Creating resilient sustainable microgrids through hybrid renewable energy systems” (EPSRC. EP/R030243/1) and ‘Indonesia Net Zero Network’ project.
Abbreviations
The following abbreviations are used in this manuscript:
| BEV | Battery electric vehicle |
| BMS | Battery management system |
| E2W | Electric two-wheelers |
| EFC | Equivalent full cycles |
| EOL | End-of-life |
| EV | Electric vehicle |
| FCV | Fuel-cell vehicle |
| ICEV | Internal combustion engine vehicle |
| IDR | Indonesian rupiah |
| LFP | Lithium Ferro-Phosphate |
| LM | Lifecycle management |
| NCM | Nickel-Cobalt-Manganese |
| RON | Research Octane Number |
| RUL | Remaining useful life |
| RV | Resale value |
| SOH | State of Health |
| TCO | Total cost of ownership |
| USD | United States dollar |
| VAT | Value-added tax |
References
- Foster, V.; Dim, J.U.; Vollmer, S.; Zhang, F. Understanding the challenge of decoupling transport-related CO2 emissions from economic growth in developing countries. World Dev. Sustain. 2023, 3, 100111. [Google Scholar] [CrossRef] [Scilit]
- Lindstad, E.; Ask, T.Ø.; Cariou, P.; Eskeland, G.S.; Rialland, A. Wise use of renewable energy in transport. Transp. Res. Part D Transp. Environ. 2023, 119, 103713. [Google Scholar] [CrossRef] [Scilit]
- Trung, D.D.; Dudić, B.; Bao, N.C.; Thinh, H.X.; Duc, D.V.; Ašonja, A. Applying Probability Method for Battery Electric Vehicle Selection. In Proceedings of the 2025 24th International Symposium INFOTEH-JAHORINA (INFOTEH), East Sarajevo, Bosnia and Herzegovina, 19–21 March 2025; pp. 1–5. [Google Scholar] [CrossRef] [Scilit]
- Jia, C.; Liu, W.; Chau, K.T.; He, H.; Zhou, J.; Niu, S. Passenger-aware reinforcement learning for efficient and robust energy management of fuel cell buses. eTransportation 2026, 27, 100537. [Google Scholar] [CrossRef] [Scilit]
- Patil, L.N.; Siraskar, G.D.; Patil, D.S.; Shinde, N.; Agrawal, V.K. Experimental Investigation on Electric Vehicle Braking System Using Machine Learning for Enhanced Performance and Safety. Adv. Eng. Lett. 2026, 5, 39. [Google Scholar] [CrossRef] [Scilit]
- Reddy, V.J.; Hariram, N.P.; Maity, R.; Ghazali, M.F.; Kumarasamy, S. Sustainable vehicles for decarbonizing the transport sector: A comparison of biofuel, electric, fuel cell and solar-powered vehicles. World Electr. Veh. J. 2024, 15, 93. [Google Scholar] [CrossRef] [Scilit]
- Ayetor, G.K.; Mashele, J.; Mbonigaba, I. The progress toward the transition to electromobility in Africa. Renew. Sustain. Energy Rev. 2023, 183, 113533. [Google Scholar] [CrossRef] [Scilit]
- Fathoni, F.; Kesidou, E.; Rifansha, M.M.; Tiftazani, A. Drivers and barriers of eco-innovation in electric vehicle diffusion: Evidence from Indonesia. J. Environ. Manag. 2025, 389, 126021. [Google Scholar] [CrossRef] [Scilit]
- Fernández, S.; Torrecillas, C.; Labra, R.E. Drivers of eco-innovation in developing countries: The case of Chilean firms. Technol. Forecast. Soc. Change 2021, 170, 120902. [Google Scholar] [CrossRef] [Scilit]
- Maghfiroh, M.F.N.; Pandyaswargo, A.H.; Onoda, H. Current readiness status of electric vehicles in Indonesia: Multistakeholder perceptions. Sustainability 2021, 13, 13177. [Google Scholar] [CrossRef] [Scilit]
- Afraah, S.M.; Yuniaristanto, Y.; Sutopo, W.; Hisjam, M. Comparing total cost of ownership of electric and conventional motorcycles in Indonesia. J. Tek. Ind. 2021, 22, 196–210. [Google Scholar] [CrossRef] [Scilit]
- al Irsyad, M.I.; Firmansyah, A.I.; Harisetyawan, V.T.F.; Supriatna, N.K.; Gunawan, Y.; Jupesta, J.; Yaumidin, U.K.; Purwanto, J.; Inayah, I. Comparative total cost assessments of electric and conventional vehicles in ASEAN: Commercial vehicles and motorcycle conversion. Energy Sustain. Dev. 2025, 85, 101599. [Google Scholar] [CrossRef] [Scilit]
- Ji, D.; Gan, H. Effects of providing total cost of ownership information on below-40 young consumers’ intent to purchase an electric vehicle: A case study in China. Energy Policy 2022, 165, 112954. [Google Scholar] [CrossRef] [Scilit]
- Balijepalli, C.; Shepherd, S.; Crastes Dit Sourd, R.; Farda, M.; Praesha, T.; Lubis, H.A.-R. Preferences for electric motorcycle adoption in Bandung, Indonesia. Urban Plan. Transp. Res. 2023, 11, 2238033. [Google Scholar] [CrossRef] [Scilit]
- Tarei, P.K.; Chand, P.; Gupta, H. Barriers to the adoption of electric vehicles: Evidence from India. J. Clean. Prod. 2021, 291, 125847. [Google Scholar] [CrossRef] [Scilit]
- Fathoni, F.; Lovett, J.C.; Rifansha, M.M. A multi-level perspective on transition to renewable energy in the Indonesian transport sector. Energies 2025, 18, 5723. [Google Scholar] [CrossRef] [Scilit]
- Hakam, D.F.; Jumayla, S. Electric vehicle adoption in Indonesia: Lesson learned from developed and developing countries. Sustain. Futur. 2024, 8, 100348. [Google Scholar] [CrossRef] [Scilit]
- Deloitte; Foundry. An Electric Revolution: The Rise of Indonesia’s E-Motorcycle. 2023. Available online: https://drive.google.com/file/d/1f6O51-CjkojJ3skhL8zDVTsMUMHfXJvB/view (accessed on 12 February 2024).
- Agustiar, D. Number of Electric Vehicles in Indonesia Reaches 85 Thousand! IDN Times, 16 January 2024. Available online: https://www.idntimes.com/automotive/motorbike/dwi-agustiar/jumlah-kendaraan-listrik-di-indonesia-tembus-85-ribu (accessed on 16 January 2024).
- Ministry of Industry. Contribution of the Automotive Sector to the National Economy. 2025. Available online: https://www.gaikindo.or.id/wp-content/uploads/2025/07/02.-Bahan-Dirjen-ILMATE-Seminar-GIIAS-_31-Juli-2025_-rev1.pdf (accessed on 24 February 2026).
- CNA. Indonesia’s Motorized Vehicles Reach 168 Million, Where Are the Most Numerous? 2025. Available online: https://www.cna.id/indonesia/kendaraan-bermotor-indonesia-tembus-168-jutaan-paling-banyak-di-mana-31031 (accessed on 24 February 2026).
- Kampker, A.; Heimes, H.H.; Offermanns, C.; Vienenkötter, J.; Frank, M.; Holz, D. Identification of challenges for second-life battery systems—A literature review. World Electr. Veh. J. 2023, 14, 80. [Google Scholar] [CrossRef] [Scilit]
- Song, H.; Chen, H.; Wang, Y.; Sun, X.-E. An overview about second-life battery utilization for energy storage: Key challenges and solutions. Energies 2024, 17, 6163. [Google Scholar] [CrossRef] [Scilit]
- Altuntas Vural, C.; van Loon, P.; Halldórsson, Á.; Fransson, J.; Josefsson, F. Life after use: Circular supply chains for second-life of electric vehicle batteries. Prod. Plan. Control 2025, 36, 1229–1246. [Google Scholar] [CrossRef] [Scilit]
- Glöser-Chahoud, S.; Huster, S.; Rosenberg, S.; Baazouzi, S.; Kiemel, S.; Singh, S.; Schneider, C.; Weeber, M.; Miehe, R.; Schultmann, F. Industrial disassembling as a key enabler of circular economy solutions for obsolete electric vehicle battery systems. Resour. Conserv. Recycl. 2021, 174, 105735. [Google Scholar] [CrossRef] [Scilit]
- Perdana, I.; Aprilianto, D.R.; Fadillah, F.A.; Fadli, R.; Petrus, H.T.B.M.; Astuti, W.; Muflikhun, M.A.; Nilasary, H.; Oktaviano, H.S.; Fathoni, F.; et al. Lithium recovery from mixed spent LFP-NMC batteries through atmospheric water leaching. Sci. Rep. 2025, 15, 2591. [Google Scholar] [CrossRef] [Scilit]
- Rufino Júnior, C.A.; Riva Sanseverino, E.; Gallo, P.; Koch, D.; Kotak, Y.; Schweiger, H.-G.; Zanin, H. Towards a business model for second-life batteries: Barriers, opportunities, uncertainties, and technologies. J. Energy Chem. 2023, 78, 507–525. [Google Scholar] [CrossRef] [Scilit]
- Shamsuddoha, M.; Nasir, T. The road ahead for hybrid or electric vehicles in developing countries: Market growth, infrastructure, and policy needs. World Electr. Veh. J. 2025, 16, 180. [Google Scholar] [CrossRef] [Scilit]
- Pandita, D.; Bhatt, V.; Kumar, V.R.; Fatma, A.; Vapiwala, F. Electrifying the future: Analysing the determinants of electric vehicle adoption. Int. J. Energy Sect. Manag. 2024, 18, 1767–1786. [Google Scholar] [CrossRef] [Scilit]
- Schulz, F.; Rode, J. Public charging infrastructure and electric vehicles in Norway. Energy Policy 2022, 160, 112660. [Google Scholar] [CrossRef] [Scilit]
- Yang, A.; Liu, C.; Yang, D.; Lu, C. Electric vehicle adoption in a mature market: A case study of Norway. J. Transp. Geogr. 2023, 106, 103489. [Google Scholar] [CrossRef] [Scilit]
- Atombo, C.; Pappoe, G.; Akple, M.S.; Adzah, D. Evaluating the adoption of electric vehicles: Insights from Ghana. Afr. Transp. Stud. 2024, 2, 100007. [Google Scholar] [CrossRef] [Scilit]
- Bhattacharyya, S.S.; Thakre, S. Exploring the factors influencing electric vehicle adoption: An empirical investigation in the emerging economy context of India. Foresight 2021, 23, 311–326. [Google Scholar] [CrossRef] [Scilit]
- Deng, C.; Qian, Y.; Song, X.; Xie, M.; Duan, H.; Shen, P.; Qiao, Q. Are electric vehicles really the optimal option for the transportation sector in China to approach pollution reduction and carbon neutrality goals? J. Environ. Manag. 2024, 356, 120648. [Google Scholar] [CrossRef] [Scilit] [PubMed]
- Kautish, P.; Lavuri, R.; Roubaud, D.; Grebinevych, O. Electric vehicles’ choice behaviour: An emerging market scenario. J. Environ. Manag. 2024, 354, 120250. [Google Scholar] [CrossRef] [Scilit]
- Ninh, N.G. Resistance to change and purchase intention of electric vehicles: Empirical evidence from Vietnam. Asian J. Bus. Res. 2021, 11, 83–101. [Google Scholar] [CrossRef] [Scilit]
- Kester, J.; Noel, L.; Zarazua de Rubens, G.; Sovacool, B.K. Policy mechanisms to accelerate electric vehicle adoption: A qualitative review from the Nordic region. Renew. Sustain. Energy Rev. 2018, 94, 719–731. [Google Scholar] [CrossRef] [Scilit]
- Martinez-Laserna, E.; Gandiaga, I.; Sarasketa-Zabala, E.; Badeda, J.; Stroe, D.I.; Swierczynski, M.; Goikoetxea, A. Battery second life: Hype, hope or reality? a critical review of the state of the art. Renew. Sustain. Energy Rev. 2018, 93, 701–718. [Google Scholar] [CrossRef] [Scilit]
- Costa, E.; Horta, A.; Correia, A.; Seixas, J.; Costa, G.; Sperling, D. Diffusion of electric vehicles in Brazil from the stakeholders’ perspective. Int. J. Sustain. Transp. 2020, 15, 865–878. [Google Scholar] [CrossRef] [Scilit]
- Woody, M.; Adderly, S.A.; Bohra, R.; Keoleian, G.A. Electric and gasoline vehicle total cost of ownership across US cities. J. Ind. Ecol. 2024, 28, 194–215. [Google Scholar] [CrossRef] [Scilit]
- Link, S.; Stephan, A.; Speth, D.; Plötz, P. Rapidly declining costs of truck batteries and fuel cells enable large-scale road freight electrification. Nat. Energy 2024, 9, 1032–1039. [Google Scholar] [CrossRef] [Scilit]
- Nykvist, B.; Nilsson, M. Rapidly falling costs of battery packs for electric vehicles. Nat. Clim. Change 2015, 5, 329–332. [Google Scholar] [CrossRef] [Scilit]
- Dong, Q.; Liang, S.; Li, J.; Kim, H.C.; Shen, W.; Wallington, T.J. Cost, energy, and carbon footprint benefits of second-life electric vehicle battery use. iScience 2023, 26, 107195. [Google Scholar] [CrossRef] [Scilit]
- Verma, S.; Dwivedi, G.; Verma, P. Life cycle assessment of electric vehicles in comparison to combustion engine vehicles: A review. In Proceedings of the International Conference on Advancement in Materials, Manufacturing and Energy Engineering (ICAMME-2021), Macau, China, 19–21 November 2021; pp. 217–222. [Google Scholar]
- Xia, X.; Li, P. A review of the life cycle assessment of electric vehicles: Considering the influence of batteries. Sci. Total Environ. 2022, 814, 152870. [Google Scholar] [CrossRef] [Scilit]
- Kamath, D.; Shukla, S.; Arsenault, R.; Kim, H.C.; Anctil, A. Evaluating the cost and carbon footprint of second-life electric vehicle batteries in residential and utility-level applications. Waste Manag. 2020, 113, 497–507. [Google Scholar] [CrossRef] [Scilit]
- Alfaro-Algaba, M.; Ramirez, F.J. Techno-economic and environmental disassembly planning of lithium-ion electric vehicle battery packs for remanufacturing. Resour. Conserv. Recycl. 2020, 154, 104461. [Google Scholar] [CrossRef] [Scilit]
- Iqbal, H.; Sarwar, S.; Kirli, D.; Shek, J.K.H.; Kiprakis, A.E. A survey of second-life batteries based on techno-economic perspective and applications-based analysis. Carbon Neutrality 2023, 2, 8. [Google Scholar] [CrossRef] [Scilit]
- Lai, X.; Huang, Y.; Deng, C.; Gu, H.; Han, X.; Zheng, Y.; Ouyang, M. Sorting, regrouping, and echelon utilization of the large-scale retired lithium batteries: A critical review. Renew. Sustain. Energy Rev. 2021, 146, 111162. [Google Scholar] [CrossRef] [Scilit]
- Lee, H.; Lee, B.; Lee, J.; Choi, J.; Kim, K. Lifetime Prediction of Lithium-Ion Batteries Based on the Correlation Between Internal Resistance Growth and State of Health (SoH). Appl. Sci. 2025, 15, 12875. [Google Scholar] [CrossRef] [Scilit]
- Vignesh, S.; Che, H.S.; Selvaraj, J.; Tey, K.S. State of health indicators for second life battery through non-destructive test approaches from repurposer perspective. J. Energy Storage 2024, 89, 111656. [Google Scholar] [CrossRef] [Scilit]
- Huster, S.; Heck, R.; Rudi, A.; Rosenberg, S.; Schultmann, F. Will electric vehicle battery reconditioning succeed?—A flexible simulation approach considering stakeholders’ interests. J. Environ. Manag. 2025, 389, 125783. [Google Scholar] [CrossRef] [Scilit] [PubMed]
- Pesaran, A.; Roman, L.; Kincaide, J. Electric Vehicle Lithium-Ion Battery Life Cycle Management; National Renewable Energy Laboratory (NREL): Golden, CO, USA, 2023; Available online: https://docs.nrel.gov/docs/fy23osti/84520.pdf (accessed on 17 April 2026).
- Gharebaghi, M.; Rezaei, O.; Li, C.; Wang, Z.; Tang, Y. A Survey on Using Second-Life Batteries in Stationary Energy Storage Applications. Energies 2025, 18, 42. [Google Scholar] [CrossRef] [Scilit]
- Gu, X.; Bai, H.; Cui, X.; Zhu, J.; Zhuang, W.; Li, Z.; Hu, X.; Song, Z. Challenges and opportunities for second-life batteries: Key technologies and economy. Renew. Sustain. Energy Rev. 2024, 192, 114191. [Google Scholar] [CrossRef] [Scilit]
- Hassini, M.; Redondo-Iglesias, E.; Venet, P. Battery Passports for Second-Life Batteries: An Experimental Assessment of Suitability for Mobile Applications. Batteries 2024, 10, 153. [Google Scholar] [CrossRef] [Scilit]
- Ma, R.; Tao, S.; Sun, X.; Ren, Y.; Sun, C.; Ji, G.; Xu, J.; Wang, X.; Zhang, X.; Wu, Q.; et al. Pathway decisions for reuse and recycling of retired lithium-ion batteries considering economic and environmental functions. Nat. Commun. 2024, 15, 7641. [Google Scholar] [CrossRef] [Scilit]
- Zhuang, J.; Bach, A.; van Vlijmen, B.H.C.; Reichelstein, S.J.; Chueh, W.; Onori, S.; Benson, S.M. Technoeconomic decision support for second-life batteries. Appl. Energy 2025, 390, 125800. [Google Scholar] [CrossRef] [Scilit]
- Ohnemüller, G.; Beller, M.; Rosemann, B.; Döpper, F. Disassembly and Its Obstacles: Challenges Facing Remanufacturers of Lithium-Ion Traction Batteries. Processes 2025, 13, 123. [Google Scholar] [CrossRef] [Scilit]
- Harper, G.; Sommerville, R.; Kendrick, E.; Driscoll, L.; Slater, P.; Stolkin, R.; Walton, A.; Christensen, P.; Heidrich, O.; Lambert, S.; et al. Recycling lithium-ion batteries from electric vehicles. Nature 2019, 575, 75–86. [Google Scholar] [CrossRef] [Scilit] [PubMed]
- Kumar, P.; Chakrabarty, S. Total cost of ownership analysis of the impact of vehicle usage on the economic viability of electric vehicles in India. Transp. Res. Rec. 2020, 2674, 563–572. [Google Scholar] [CrossRef] [Scilit]
- Canals Casals, L.; Etxandi-Santolaya, M.; Bibiloni-Mulet, P.A.; Corchero, C.; Trilla, L. Electric Vehicle Battery Health Expected at End of Life in the Upcoming Years Based on UK Data. Batteries 2022, 8, 164. [Google Scholar] [CrossRef] [Scilit]
- Scorrano, M.; Danielis, R.; Giansoldati, M. Dissecting the total cost of ownership of fully electric cars in Italy: The impact of annual distance travelled, home charging and urban driving. Res. Transp. Econ. 2020, 80, 100799. [Google Scholar] [CrossRef] [Scilit]
- Yuniaristanto; Sutopo, W.; Hisjam, M.; Wicaksono, H. Estimating the market share of electric motorcycles: A system dynamics approach with the policy mix and sustainable life cycle costs. Energy Policy 2024, 195, 114345. [Google Scholar] [CrossRef] [Scilit]
- Redondo-Iglesias, E.; Venet, P.; Pelissier, S. Modelling Lithium-Ion Battery Ageing in Electric Vehicle Applications—Calendar and Cycling Ageing Combination Effects. Batteries 2020, 6, 14. [Google Scholar] [CrossRef] [Scilit]
- Etxandi-Santolaya, M.; Canals Casals, L.; Corchero, C. Extending the electric vehicle battery first life: Performance beyond the current end of life threshold. Heliyon 2024, 10, e26066. [Google Scholar] [CrossRef] [Scilit]
- Madani, S.S.; Shabeer, Y.; Allard, F.; Fowler, M.; Ziebert, C.; Wang, Z.; Panchal, S.; Chaoui, H.; Mekhilef, S.; Dou, S.X.; et al. A Comprehensive Review on Lithium-Ion Battery Lifetime Prediction and Aging Mechanism Analysis. Batteries 2025, 11, 127. [Google Scholar] [CrossRef] [Scilit]
- Fischer, M.; Brand, M.J.; Karger, A.; Gomez, M.R.; Rehm, M.; Natterer, J.; Jossen, A. How degradation of lithium-ion batteries impacts capacity fade and resistance increase: A systematic, correlative analysis. J. Power Sources 2025, 656, 237921. [Google Scholar] [CrossRef] [Scilit]
- Sciatti, F.; Tamburrano, P.; Distaso, E.; Amirante, R.; Radogna, A.V.; Morciano, A.; Grassi, G. A comprehensive overview of lithium-ion batteries for electric vehicles: Materials, performance, safety, recycling, and emerging technologies. J. Energy Storage 2026, 144, 119694. [Google Scholar] [CrossRef] [Scilit]
- Bauer, J.; Letmathe, P.; Woeste, R. Total cost of ownership for battery electric vehicles: The role of energy prices. Appl. Energy 2025, 389, 125764. [Google Scholar] [CrossRef] [Scilit]
- Saputra, B.A.; Sari, D.N.; Rifqi, H.; Tazkia, S.N.; Nurdini, A.; Nurcahyo, R. Comparison of life cycle cost (LCC) and carbon impact between conventional and electric motorcycle for daily use in Jakarta. In Proceedings of the International Conference on Industrial Engineering and Operations Management, Manila, Philippines, 7–9 March 2023; IEOM Society International: Southfield, MI, USA, 2023. [Google Scholar]
- Volta Indonesia. Buy Volta 401 Reguler. 2024. Available online: https://voltaindonesia.com/volta-reguler/volta-reguler-401 (accessed on 2 March 2026).
- Volta Indonesia. Volta MandalaX. 2026. Available online: https://voltaindonesia.com/model/detail?type=mandalax (accessed on 6 January 2026).
- Charged Tech Indonesia. Ride for Good! 2026. Available online: https://charged.co.id/bike/rimau (accessed on 2 March 2026).
- ALVA. Cervo Q. 2026. Available online: https://www.alvaauto.com/id/product/alva-cervo-q (accessed on 6 April 2026).
- Oto. 2026 TVS Neo XR Motorbike. 2026. Available online: https://www.oto.com/motor-baru/tvs/neo-xr (accessed on 6 January 2026).
- AstraOtoshop.com. Looking to Buy a Used Mio Motorcycle? Check Prices Starting at Millions of Rupiah in 2025! 2025. Available online: https://astraotoshop.com/article/harga-motor-mio-bekas (accessed on 2 March 2026).
- Prastya, M. The Price of Used Honda BeAT Motorcycles Is Stable, Proof That This Scooter Will Never Die. 2025. Available online: https://www.carmudi.co.id/journal/harga-motor-honda-beat-bekas-stabil-bukti-skutik-ini-nggak-ada-matinya/ (accessed on 2 March 2026).
- Yamaha Indonesia. Yamaha Mio M3 125, Complete Specifications and Latest Prices. 2025. Available online: https://www.yamaha-motor.co.id/product/mio-m3/ (accessed on 6 January 2026).
- Vespa Piaggio Sinergi Jabodetabek. Vespa Primavera 150. 2026. Available online: https://vespapiaggiojakarta.com/primavera/ (accessed on 3 March 2026).
- Secretariat General of the Parliamentary Council. Presidential Policy on Foreign Exchange from Natural Resource Exports to Increase National Economic Resilience; Secretariat General of the Parliamentary Council: Jakarta, Indonesia, 2025. [Google Scholar]
- Darmawan, A.P.; Adhi, I.S. Household Electricity Token Prices for January 2026: Here’s the kWh You’ll Get if You Buy IDR 100,000. 2026. Available online: https://www.kompas.com/tren/read/2026/01/06/090000365/harga-token-listrik-rumah-tangga-januari-2026-ini-kwh-yang-didapat-jika (accessed on 6 January 2026).
- Islas-Samperio, J.M.; Manzini, F.; Grande-Acosta, G.K. Toward a Low-Carbon Transport Sector in Mexico. Energies 2020, 13, 84. [Google Scholar] [CrossRef] [Scilit]
- Warto; Sheila, T. Techno-Economic Analysis of Floating Solar PV on Reservoir Ash Pond in Coal-Fired Power Plants. Int. J. Educ. Sci. Technol. Eng. 2024, 7, 98–105. [Google Scholar] [CrossRef] [Scilit]
- Danielis, R.; Giansoldati, M.; Rotaris, L. A probabilistic total cost of ownership model to evaluate the current and future prospects of electric cars uptake in Italy. Energy Policy 2018, 119, 268–281. [Google Scholar] [CrossRef] [Scilit]
- Neigum, K.; Wang, Z. Technology, economic, and environmental analysis of second-life batteries as stationary energy storage: A review. J. Energy Storage 2024, 103, 114393. [Google Scholar] [CrossRef] [Scilit]
- Rachman, R. Study of Commuter Travel Characteristics of Makassar Suburban. Int. J. Innov. Res. Sci. Eng. Technol. 2018, 7, 1535–1542. Available online: http://www.ijirset.com/upload/2018/february/92_%20Rais%20modifications.pdf (accessed on 1 October 2025).
- Buanawati, T.T.; Huboyo, H.S.; Samadikun, B.P. Estimation of Conventional Air Pollutant Emissions (SOx, NOx, CO, and PM) from Private Vehicles Based on the International Vehicle Emission (IVE) Method on Several Roads in Semarang City. Doctoral Dissertation, Diponegoro University, Semarang, Indonesia, 2017. [Google Scholar]
- Muliawati, F.D. It’s Official! Here’s the List of PLN Electricity Rates per kWh, Effective 1 October 2025. 2025. Available online: https://www.cnbcindonesia.com/news/20251001073226-4-671728/resmi-ini-daftar-tarif-listrik-per-kwh-pln-berlaku-1-oktober-2025 (accessed on 1 October 2025).
- Muliawati, F.D.; Setiawan, V.N. Latest Official Fuel Prices at All Indonesian Gas Stations, Effective 2 April 2026. 2026. Available online: https://www.cnbcindonesia.com/news/20260402073434-4-723398/harga-bbm-resmi-terbaru-di-semua-spbu-ri-berlaku-2-april-2026#:~:text=Kemudian%2C%20Pertamax%20Green%20atau%20RON%2095%20pada,Pertamax%20Turbo%20seharga%20Rp%2013.100%20per%20liter (accessed on 2 April 2026).
- Shaikh, W.A.; Kalwar, M.A.; Khan, M.A.; Wassan, A.N.; Wadho, M.H.; Shahzad, M.F. A System Dynamics Costing Model for The Refurbishment of Electric Vehicle Batteries. Jordan J. Mech. Ind. Eng. 2023, 17, 15–32. [Google Scholar] [CrossRef] [Scilit]
- Neubauer, J.; Brooker, A.; Wood, E. Sensitivity of battery electric vehicle economics to drive patterns, vehicle range, and charge strategies. J. Power Sources 2012, 209, 269–277. [Google Scholar] [CrossRef] [Scilit]
- Wu, W.; Lin, B.; Xie, C.; Elliott, R.J.R.; Radcliffe, J. Does energy storage provide a profitable second life for electric vehicle batteries? Energy Econ. 2020, 92, 105010. [Google Scholar] [CrossRef] [Scilit]
- Zanoletti, A.; Carena, E.; Ferrara, C.; Bontempi, E. A Review of Lithium-Ion Battery Recycling: Technologies, Sustainability, and Open Issues. Batteries 2024, 10, 38. [Google Scholar] [CrossRef] [Scilit]
- Restiana, D.I.; Permadi, D.A. Estimation of Air Pollutant Emission Reduction Impact of Bus Rapid Transit Operation in Bandung City. J. Serambi Eng. 2023, 8, 5124–5134. [Google Scholar]
- Quinteros-Condoretty, A.R.; Laukkanen, M.; Kainiemi, L.; Pinto, S.M.; Lourenço, E.J.; Oliveira, L.; Albareda, L.; Barbiellini, B. Conceptual model for extending electric vehicle battery lifetime. Resour. Conserv. Recycl. 2025, 212, 107943. [Google Scholar] [CrossRef] [Scilit]
- Antony Jose, S.; Dworkin, L.; Montano, S.; Noack, W.C.; Rusche, N.; Williams, D.; Menezes, P.L. Pathways to Circular Economy for Electric Vehicle Batteries. Recycling 2024, 9, 76. [Google Scholar] [CrossRef] [Scilit]
- Picatoste, A.; Justel, D.; Mendoza, J.M.F. Circularity and life cycle environmental impact assessment of batteries for electric vehicles: Industrial challenges, best practices and research guidelines. Renew. Sustain. Energy Rev. 2022, 169, 112941. [Google Scholar] [CrossRef] [Scilit]
- Lebeau, P.; Macharis, C.; Van Mierlo, J. How to Improve the Total Cost of Ownership of Electric Vehicles: An Analysis of the Light Commercial Vehicle Segment. World Electr. Veh. J. 2019, 10, 90. [Google Scholar] [CrossRef] [Scilit]
- Murtiningrum, A.D.; Darmawan, A.; Wong, H. The adoption of electric motorcycles: A survey of public perception in Indonesia. J. Clean. Prod. 2022, 379, 134737. [Google Scholar] [CrossRef] [Scilit]
- Tilly, N.; Yigitcanlar, T.; Degirmenci, K.; Paz, A. How sustainable is electric vehicle adoption? Insights from a PRISMA review. Sustain. Cities Soc. 2024, 117, 105950. [Google Scholar] [CrossRef] [Scilit]
- Wang, Y.; Witlox, F. Global trends in electric vehicle adoption and the impact of environmental awareness, user attributes, and barriers. Energy Rep. 2025, 13, 1125–1137. [Google Scholar] [CrossRef] [Scilit]
- Pamidimukkala, A.; Kermanshachi, S.; Rosenberger, J.M.; Hladik, G. Barriers and motivators to the adoption of electric vehicles: A global review. Green Energy Intell. Transp. 2024, 3, 100153. [Google Scholar] [CrossRef] [Scilit]
- Wang, C.; Wei, Y.; Wu, L. Global eco-innovation and its local impact in emerging economies: Boundary conditions of environmental regulations and pollution intensity. J. Prod. Innov. Manag. 2023, 40, 761–793. [Google Scholar] [CrossRef] [Scilit]
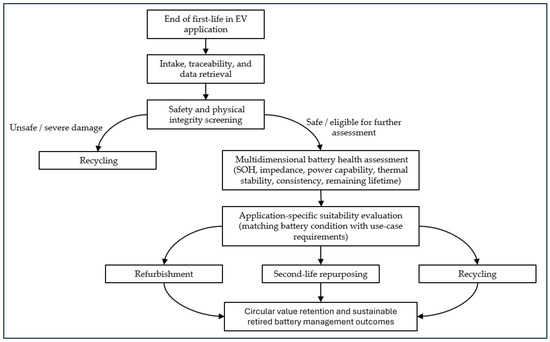
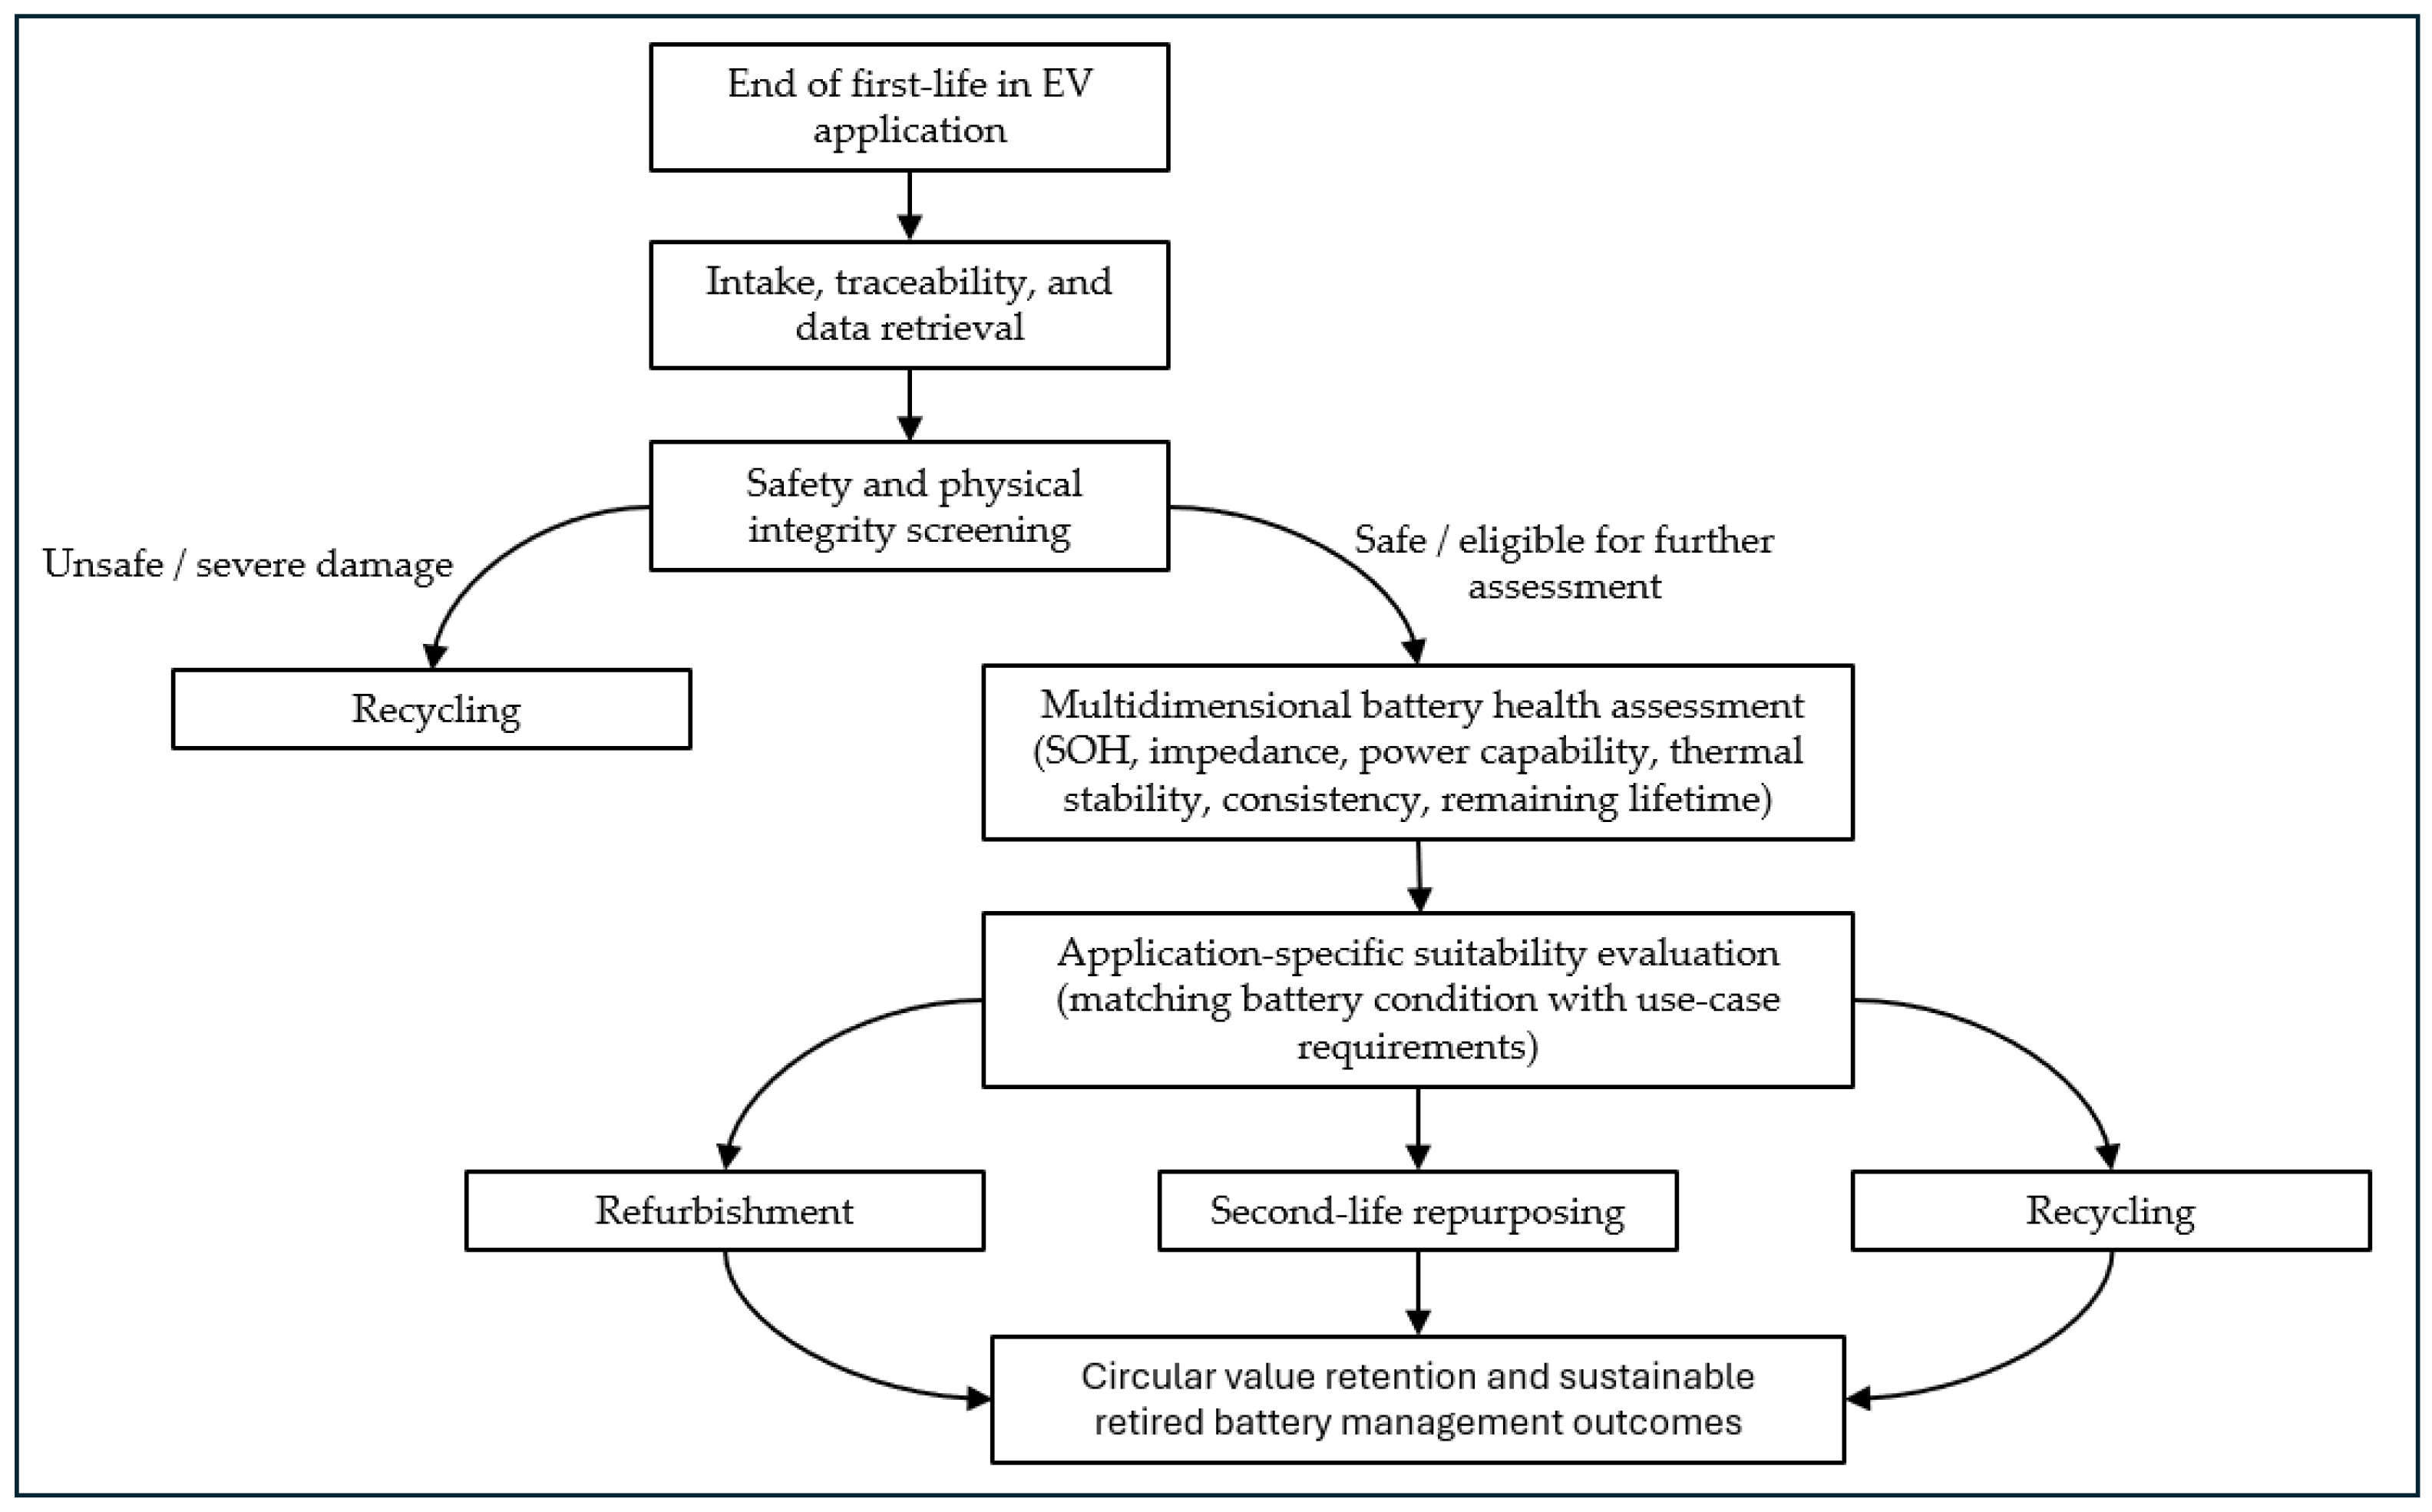
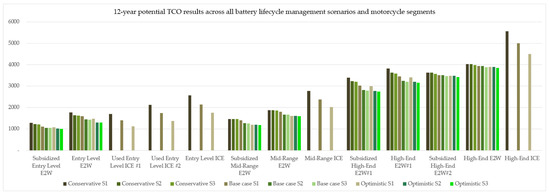
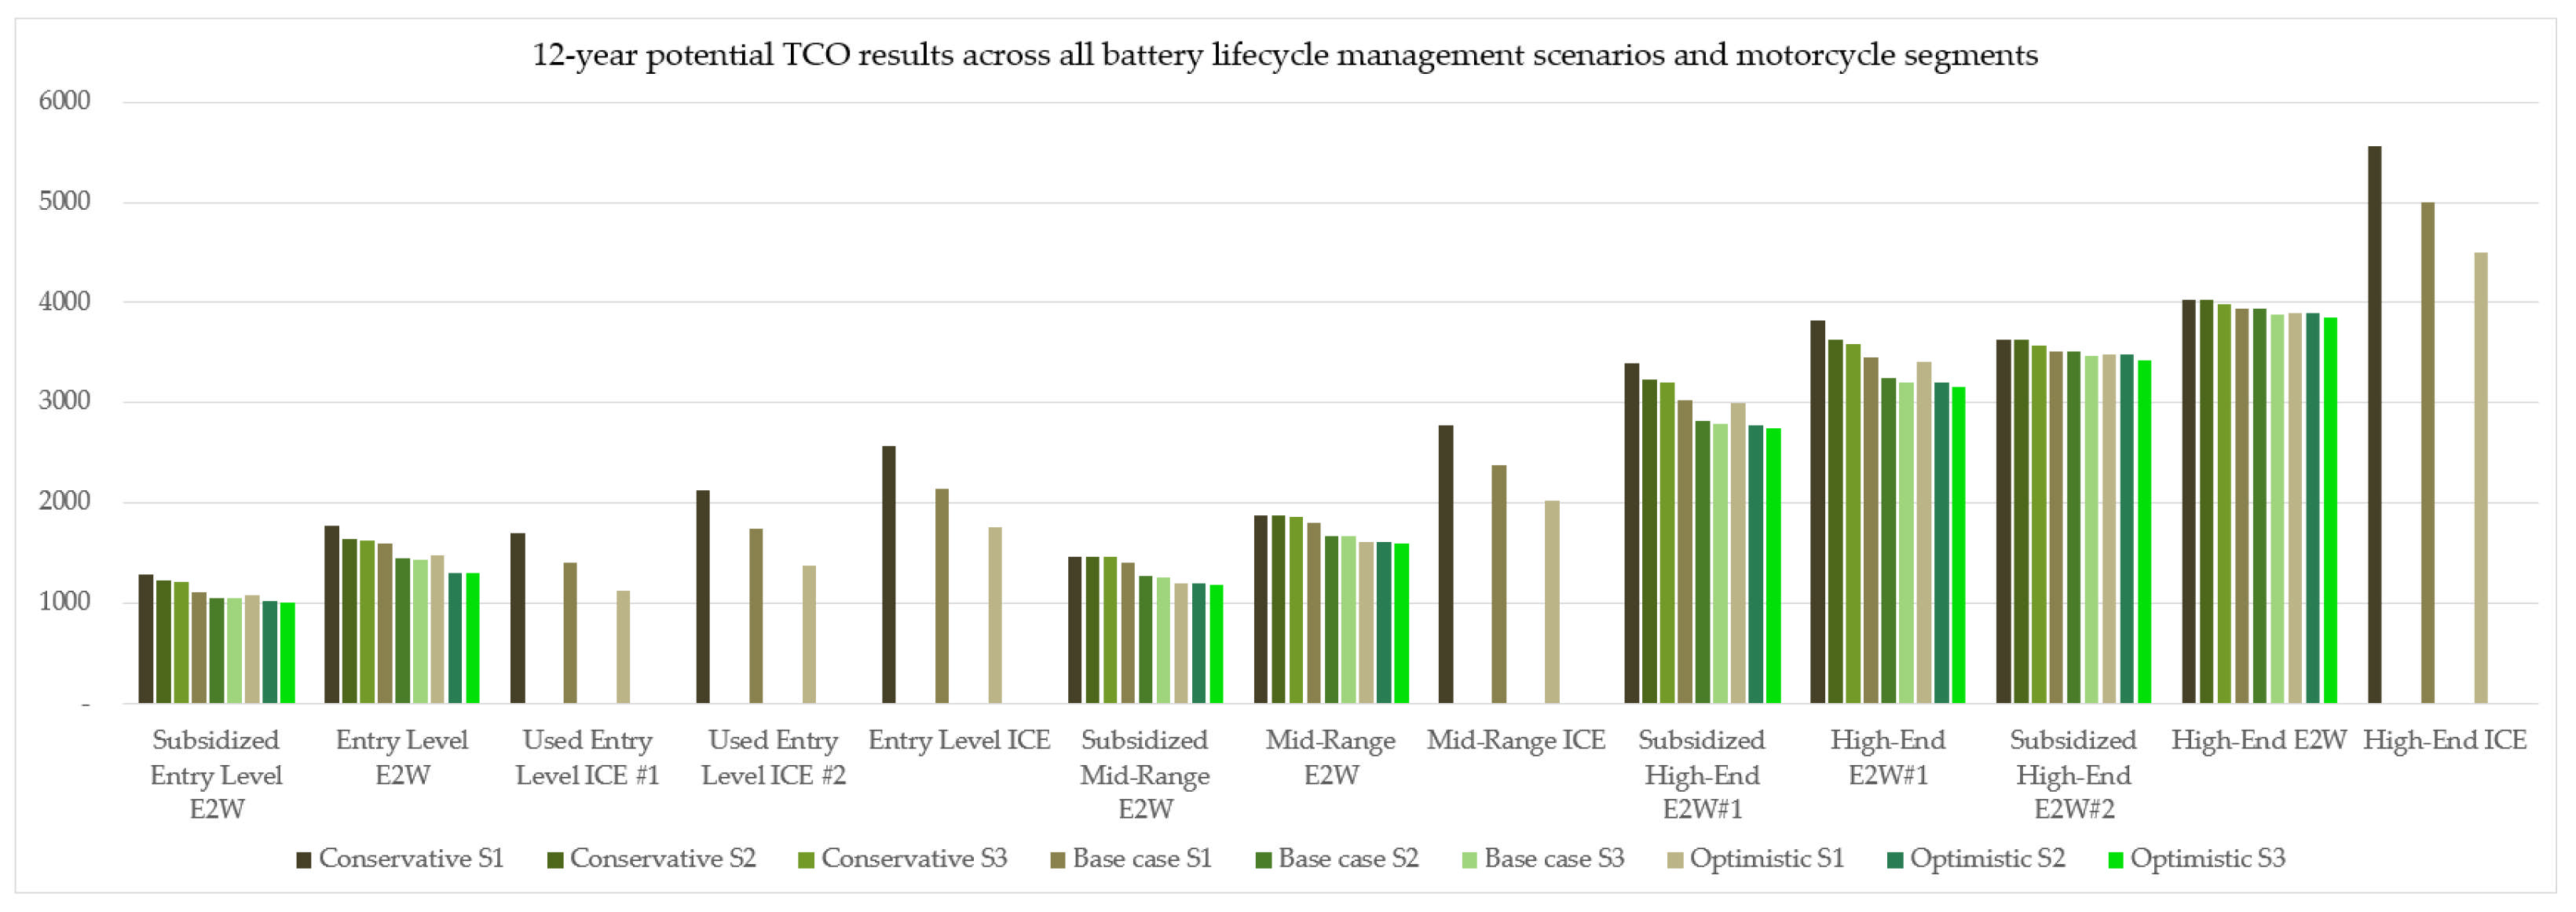

Disclaimer/Publisher’s Note: The statements, opinions and data contained in all publications are solely those of the individual author(s) and contributor(s) and not of MDPI and/or the editor(s). MDPI and/or the editor(s) disclaim responsibility for any injury to people or property resulting from any ideas, methods, instructions or products referred to in the content. |
© 2026 by the authors. Licensee MDPI, Basel, Switzerland. This article is an open access article distributed under the terms and conditions of the Creative Commons Attribution (CC BY) license.