


Abstract
This study investigates the environmental and energy performance of rice straw-based energy pathways in Egypt, combining life cycle assessment (LCA) with supply chain optimization to improve system efficiency. The analysis covers thirteen governorates producing over 4.45 million tons of rice straw annually. It examines the whole supply chain from paddy farming, straw collection, and transport to electricity generation and ash disposal. Total energy consumption was 11,287 TJ, dominated by farming (5673 TJ) and transport (5490 TJ). Greenhouse gas (GHG) emissions were estimated at 12,007.5 million kg CO2-eq, with significant contributions from farming (5158 million), combustion (3630 million), and natural gas use (3039 million). Gross electricity output was 5525 GWh, yielding a net of 4973 GWh, equivalent to 1116.5 kWh per ton of straw. Scenario analysis highlighted that the optimized multi-hub system, prioritizing Cluster 1 in the Nile Delta, which contributes over 92% of straw production and 4607 GWh of net electricity, achieved a reduction of more than 25% in transport distances and an 18% decrease in diesel consumption and related emissions. Sensitivity analysis further indicated that delivered electricity and GHG intensity are more sensitive to conversion efficiency and transmission and distribution losses than to moderate changes in transport assumptions. In addition to environmental improvements, the optimized scenario indicates potential social co-benefits, including rural employment generation, additional income opportunities for farmers, and improved air quality associated with reduced open-field burning. These outcomes are presented as indicative qualitative insights. Findings confirm rice straw as a strategic, scalable, and sustainable energy resource aligned with Egypt’s Vision 2030 and the UN Sustainable Development Goals (SDGs).
1. Introduction
Utilizing agricultural biomass residues as an alternative energy source to replace fossil fuels brings significant environmental, economic, and social advantages [1]. These residues, often seen as waste, can serve as a renewable and locally available energy resource that helps lower greenhouse gas (GHG) emissions, address waste management challenges, and improve energy security [2]. However, to fully unlock the potential of agricultural biomass residues for energy production, it is crucial to overcome challenges related to logistics, technology, and policy [3]. With proper infrastructure, ongoing research, and supportive policy frameworks, agricultural residues can be key in advancing toward a more sustainable and resilient energy future [1].
Egypt’s agricultural sector generates substantial yearly crop residues, including rice straw, wheat straw, corn stover, cotton stalks, and sugarcane bagasse [4]. Among these, rice straw is frequently discarded, burned, or underutilized, leading to environmental pollution and the loss of a valuable renewable resource [5]. Rice straw in Egypt has several potential applications, including energy generation, animal feed, organic fertilizer production, and soil amendment [6,7]. However, Egypt’s Vision 2030 prioritizes expanding renewable energy and promoting waste valorization as key pillars of sustainable development [8]. In this context, converting rice straw into energy offers a promising pathway to reduce open-field burning, improve waste management, and support renewable electricity generation [9].
Rice cultivation in Egypt is primarily concentrated in certain governorates that offer optimal conditions, such as fertile soil and ample water supply from the Nile. As a result, these regions account for the highest rice straw production, a byproduct of the harvesting process [10]. The major rice-producing governorates are Dakahlia, Kafr-El-Sheikh, Sharqia, Behera, Gharbia, Damietta, and Port Said. The dense concentration of rice farming in these governorates produces millions of tons of rice straw annually [4]. However, conventional disposal practices, such as open-field burning, have posed significant environmental challenges, including air pollution and carbon emissions. These issues are especially severe in the heavily populated Nile Delta region [11].
Life Cycle Assessment (LCA) is a robust analytical tool to evaluate a product’s environmental impacts throughout its life cycle [12]. In that sense, LCA covers the whole supply chain, from raw material extraction to product disposal and post-use. Having such an analysis for each phase helps in understanding the environmental implications. It enables strategic sustainability planning and can be a tool for identifying market opportunities and developing disruptive business models. According to the International Organization for Standardization (ISO) standards, LCA consists of four key phases: definition of goal and scope, life cycle inventory analysis, life cycle impact assessment, and interpretation [13]. Defining the goal of LCA is key to ensuring consistency in the study, the interpretation of its outcomes, and the development of action plans [14].
Although LCA has been considered a linear model, it has recently been integrated with circular economic approaches to develop circular LCA models [15]. This depends on the goals that require either an attributional or a consequential approach. The key difference between the two approaches lies in the scope of address and the types of emissions considered. At the same time, attributional LCA focuses on the product system and its direct emissions throughout its life, whereas consequential LCA is more focused on the changes the product system may cause through direct and indirect emissions [16]. Applying LCA to rice straw-based power generation offers crucial insights into the environmental benefits and challenges of using this biomass as a renewable energy resource [17]. By examining key stages such as cultivation, collection, transportation, energy conversion, and waste management, LCA helps pinpoint areas with significant emissions, energy consumption, and resource use [9].
Recent scholarship on LCA, supply chain logistics, and the energy–environmental implications of using agricultural crop residues for energy generation in Egypt can be summarized in several key contributions. The broader status of LCA in Africa, with particular emphasis on Egypt, has been assessed [18]. A techno-economic analysis was conducted to design a national agro-biomass power plant network [19]. The availability, sustainability, and accessibility of agricultural residues and solar resources for pyrolysis-based production of high-value chemicals have been investigated [5]. LCA of cultivation processes for major vegetable crops in Southern Egypt has been reported [20]. A comparative cradle-to-gate LCA of three sustainable applications of cotton stalk waste was performed [21]. The sustainable utilization of sugarcane bagasse for wood-based panels has been highlighted as a waste management strategy [22]. Energy efficiency improvements and GHG reduction in small-scale wheat production were analyzed using data envelopment analysis [5]. Finally, Egypt’s energy balance and GHG emissions of rice straw-to-energy pathways were evaluated [9].
The existing literature on biomass energy systems can be broadly categorized into three main methodological streams: (i) LCA-based environmental assessments, (ii) optimization and logistics-focused studies, and (iii) integrated bioenergy system analyses. LCA-based studies, Said et al. [9], Karkour et al. [18], Abdelkader et al. [20], and Ibrahim et al. [21] have provided detailed evaluations of environmental impacts; however, they are often limited to environmental accounting and rely on simplified assumptions regarding transport distances, facility siting, and biomass aggregation. In this context, logistics are typically treated as fixed parameters rather than dynamic decision variables [23,24,25,26]. Moreover, recent studies highlight inconsistencies in system boundaries, allocation approaches, and emission accounting, which reduce comparability and introduce uncertainty in LCA results [9,17]. In parallel, optimization-based approaches focus on improving supply chain efficiency [19,27,28,29,30]; however, Abdelhady et al. [19] emphasize cost optimization without fully integrating life-cycle environmental impacts, while studies such as Said et al. [9] and El-Sayed et al. [5] treat logistics as fixed parameters. Consequently, the interaction between spatial logistics design and environmental performance remains insufficiently addressed. In addition, studies such as Karkour et al. [18] and Wang et al. [25] emphasize the critical role of transport logistics and feedstock dispersion in determining system performance, yet these factors are often treated exogenously.
In contrast, optimization and logistics-based studies focus on improving supply chain efficiency through facility location, transport routing, and cost minimization approaches [19,27,28,29,30]. Although these studies provide important insights into biomass aggregation and infrastructure planning, they often neglect comprehensive life-cycle environmental impacts or rely on simplified emission assumptions. Consequently, solutions identified as optimal from an economic or logistical perspective may not be environmentally optimal when evaluated under full LCA frameworks. Integrated bioenergy system studies seek to incorporate environmental, economic, and energy dimensions within a unified analytical framework; however, many remain limited in scope. This is primarily due to their emphasis on techno-economic performance or reliance on partial environmental indicators rather than comprehensive life-cycle assessments. In addition, the integration of spatial optimization with LCA remains insufficiently developed, particularly for residue-based systems characterized by geographically concentrated feedstocks, such as rice straw in Egypt.
These methodological limitations point to a critical gap in the current literature: the absence of integrated frameworks that simultaneously account for environmental impacts and spatial supply chain design under consistent system boundaries. Consequently, the ability to evaluate trade-offs between logistics efficiency, energy performance, and environmental sustainability remains constrained. This limitation is especially pronounced in rice straw systems, where low bulk density and spatial concentration render transport distances and hub configurations key determinants of overall system performance. Despite the growing body of research on biomass LCA, techno-economic analysis, and supply chain design, these dimensions are often addressed in isolation. Such fragmentation restricts the capacity to assess how spatial logistics decisions influence life-cycle outcomes in an integrated manner, thereby underscoring the need for more comprehensive and methodologically consistent approaches to agricultural-residue energy systems.
To address this gap, the present study develops an integrated framework for rice straw-to-electricity planning in Egypt, combining attributional LCA with spatial clustering and facility location–allocation optimization to evaluate alternative system configurations, including centralized and multi-hub structures. Egypt represents a particularly relevant case due to the spatial concentration of rice straw production in the Nile Delta and the environmental challenges associated with open-field burning and seasonal air pollution. Accordingly, the study aims to: (1) quantify energy consumption and GHG emissions across the rice straw-to-electricity supply chain; (2) compare centralized, clustered, and optimized Delta-focused configurations under consistent system boundaries; (3) identify logistics-efficient biomass aggregation structures using a hybrid clustering and location–allocation approach; (4) assess the robustness of system configurations through sensitivity and feedstock availability scenario analysis; and (5) examine preliminary economic and indicator-based social implications for sustainable biomass deployment in Egypt.
The contribution of this study is primarily methodological. It introduces an integrated framework that enables the simultaneous assessment of environmental impacts and logistics decisions under consistent system boundaries. Unlike previous studies, which typically apply LCA and supply chain optimization sequentially or under simplified assumptions, the proposed framework explicitly couples these components within a unified, spatially explicit modeling framework. In this approach, logistics variables, such as biomass aggregation patterns, transport distances, and facility siting, are treated as endogenous decision variables rather than predefined inputs. The approach incorporates spatially explicit modeling to better represent biomass distribution, transport dynamics, and aggregation patterns, addressing limitations in conventional LCA studies that rely on simplified logistics assumptions. In addition, a structured robustness analysis is included through sensitivity testing and feedstock availability scenarios, improving the reliability and interpretability of the results.
It should be noted that the analysis adopts an attributional LCA perspective, focusing on direct emissions within defined system boundaries. While suitable for process-level comparisons of alternative configurations, this approach does not capture broader system-wide effects, such as energy substitution, market-mediated responses, or indirect emissions associated with large-scale biomass deployment. Therefore, the results should be interpreted as relative performance comparisons rather than a full assessment of climate mitigation potential at the energy system level. This limitation has important policy implications. In particular, the exclusion of consequential LCA means that potential fossil fuel displacement, interactions with national energy systems, and indirect environmental impacts are not explicitly addressed. Future research incorporating consequential LCA would provide a more comprehensive evaluation of policy-relevant outcomes, especially in relation to energy substitution effects and long-term decarbonization strategies. Overall, by emphasizing methodological integration, this study contributes to the development of more comprehensive and decision-relevant frameworks for assessing the sustainability of biomass-based energy systems.
2. Methodology
This study adopts an attributional LCA approach to quantify the environmental impacts of rice straw-to-electricity supply chains within clearly defined system boundaries. The framework is selected to enable a transparent and consistent comparison of the environmental performance of the scenarios studied. Accordingly, the analysis focuses on the direct emissions and environmental burdens associated with the processes included in the rice straw-to-energy supply chain. Consequential effects, indirect market interactions, system expansion, marginal electricity substitution, and avoided burden approaches are excluded, as the study aims to assess the attributional impacts of the current system configurations.
2.1. Rice Straw-to-Electricity Scenarios
The methodology for assessing rice straw utilization in Egypt’s power generation system considered the full supply chain stages, beginning with paddy cultivation, followed by straw collection, transportation to collection centers and power plants, combustion for electricity generation, and finally ash disposal. Two alternative scenarios (centralized and decentralized multi-hubs) were designed to capture the impact of different supply chain structures on energy use, logistics, and GHG emissions. The supply chain follows the same stages in the two scenarios: rice cultivation, straw collection, transportation to the collection center and power plants, combustion, electricity generation, electricity transmission and distribution (T&D), and ash disposal. The system boundaries of the rice straw-to-energy supply chain are illustrated in Figure 1.
Figure 1.
System boundaries of the rice straw-to-energy supply chain.
2.2. Supply Chain Design Optimization
Efficient transportation is a critical determinant of the sustainable performance of the bioenergy value chain. Due to the low energy density of rice straw and the dispersed nature of agricultural residues, logistics represent a significant share of costs and GHG emissions. A key aspect is to optimize the supply chain logistics design to minimize the distances traveled between facilities. To address this challenge, a hybrid spatial optimization framework was developed by combining K-means clustering with a facility location–allocation linear programming model [23,24,25].
K-means clustering was applied to group rice-producing governorates based on geographic proximity and biomass availability to reduce the dimensionality of the model. Then, a facility location–allocation optimization model was implemented within each cluster to determine the optimal placement of biomass aggregation hubs and the allocation of rice straw supplies from individual governorates to the hubs.
The model inputs combine spatial, agricultural, and techno-economic data. Rice straw availability at the governorate level was derived from annual paddy production and cultivated area statistics obtained from national agricultural datasets [4]. Straw yield was estimated using a fixed residue-to-product ratio, assuming proportionality between paddy production and straw generation. Geographical coordinates of each governorate centroid were used to represent supply locations with transportation distances calculated using Euclidean distance as an approximation of road distance as derived from digital maps. A sensitivity range of 20% was later applied to account for potential deviations from actual road networks. The following key assumptions were adopted: (1) rice straw is available for collection and energy use within each producing governorate; (2) transportation is performed using uniform truck capacity and fuel efficiency parameters; (3) hub capacities are predetermined based on aggregated straw availability within each cluster; (4) transportation cost is assumed to be piecewise-linear and concave; and (5) seasonal variability in straw availability is not explicitly modelled but addressed through scenario analysis.
Optimization minimizes transportation distance and associated energy consumption while respecting facility capacity constraints. Equation (1) gives the clustering objective function, and Equations (2)–(7) give the objective function and constraints of the facility location–allocation model. Figure 2 gives the framework of the hybrid spatial optimization framework.
where K: number of clusters; I: set of governorates; J: set of hubs; Gi: centroid of governorate i; µk: centroid of cluster k; Ck: group of governorates in cluster k; Si: supply of rice straw at governorate i; fj: cost of opening hub j; dij: distance between governorate i and hub j; cij: per unit per distance transportation cost between governorate i and hub j; qj: capacity of hub j; yj: binary variable equal to 1 if hub j is open and 0 otherwise; xij: quantity transported from governorate i to hub j.
Figure 2.
Framework of the proposed optimization model for supply chain design.
The optimization objective minimizes total transportation cost, which serves as a proxy for both economic cost and environmental burden (fuel consumption and emissions). The facility location–allocation problem is formulated as a mixed-integer linear programming (MILP) model solved using Gurobi Optimizer (v. 12.0.3). The K-means clustering algorithm was applied using standard library functions with multiple initializations to ensure convergence to a stable solution. Equations (3)–(7) ensure the feasibility of the system: Equation (3) is a flow conservation constraint ensuring consistency between transported quantities and available supply, meaning that all available rice straw from each governorate is allocated to a hub. Equation (4) ensures that the number of open hubs is equal to the pre-defined number of clusters. Equation (5) is a capacity constraint limiting the amount of biomass processed at each hub by its physical and operational capacity. Finally, Equation (6) is a non-negativity constraint, and Equation (7) is a binary constraint enforcing that hubs are either opened or closed.
2.3. Scenario Design and Configuration
The scenario design focuses on two main configurations: a centralized system and a clustered (multi-hub) system. These configurations were selected as representative extremes of supply chain organization, allowing the study to capture the trade-offs between centralized economies of scale and decentralized logistics efficiency under consistent system boundaries.
While additional configurations, such as fully decentralized small-scale plants, hybrid multitier networks, or dynamic routing systems, could be considered, their inclusion would significantly increase model complexity and data requirements beyond the scope of the present study. Therefore, the selected scenarios are intended to provide a structured and comparable basis for evaluating system performance rather than an exhaustive exploration of all possible configurations.
2.3.1. Centralized Hub Scenario
In this scenario, a single hub was created to serve all rice-producing clusters across Egypt. The hub’s location was determined by applying a center-of-gravity approach weighted by total rice straw production quantities in the governorates. Rice straw is first collected from paddy fields using baling machines, then transported by trucks to collection centers and the centralized power plant. At the plant, straw undergoes combustion in a boiler, coupled with a steam turbine cycle, to produce electricity with assumed efficiencies of 85% (combustion) and 30% (electricity conversion). Auxiliary energy consumption (10% of output) and T&D losses (19.40% of net output) were also considered [26]. Residual ash, assumed at 16.81% of straw mass, was transported by trucks to the nearest sanitary landfill [27].
2.3.2. Multi-Hub (Decentralized) Scenario
Multiple hubs were established within each cluster, with locations optimized based on straw production. Governorates were grouped into three clusters, and within each cluster, hub locations were adjusted to reflect straw availability, ensuring shorter average transportation distances. K-means clustering was performed on the governorate coordinates. Based on the silhouette score, the optimal number of clusters was determined to be three using the elbow curve.
The decentralized supply chain reduces logistics burden and improves efficiency. It follows the same stages as the centralized scenario: collection, local transport to cluster hubs, trucking to nearby power plants, combustion, electricity generation, and ash disposal, but transport burdens are distributed across multiple hubs. This configuration significantly reduces logistics effort, cutting diesel consumption and GHG emissions associated with straw and ash. It also improves energy efficiency by localizing conversion facilities closer to high-yield areas, especially in the Delta, where most of Egypt’s rice straw is concentrated.
2.4. Calculation Methods
2.4.1. Energy Consumption Calculations
Rice straw preparation encompasses three main stages: paddy farming, straw collection, and transportation. The total energy consumption for paddy farming is estimated at 12,225.97 MJ/ha [9,28]. For straw collection, energy consumption accounted for all machinery involved in the baling process, with diesel consumption being a key factor. The energy content of diesel is 38.19 MJ/L, and the collection process is based on an average diesel consumption of 7 L per hectare of paddy fields [28,29]. Transportation energy consumption was estimated using the procedures described in a previous study [30]. Rice straw is transported from the farm to the collection center using a truck with a capacity of 20 bales, operating at a diesel efficiency of 5.5 km/L when loaded and 6.5 km/L when unloaded. Each rice straw bale weighs approximately 20 kg [30].
Auxiliary power consumption refers to the energy used to operate the power plant’s pumps, fans, motors, and other auxiliary equipment. This is typically a percentage of the total electrical output, 10% [31]. Moreover, the electricity T&D losses in the grid were estimated using the electricity losses factor (19.40% of the power plant’s net electricity output) [26]. To estimate the energy required for ash transportation, the amount of ash generated was calculated based on a 16.81% ash content in rice straw [27]. The resulting ash is assumed to be transported by a 10-ton capacity truck from the power plant to the nearest landfill site.
2.4.2. GHG Emissions Calculations
The analysis quantifies carbon dioxide equivalent (CO2-eq) emissions for the three primary GHGs: carbon dioxide (CO2), methane (CH4), and nitrous oxide (N2O) [26]. GHG emissions resulting from open-field burning of rice straw are estimated at 11 tons of CO2-eq/ha (9.34 tons of CO2, 0.1 tons of CH4, and 1.57 tons of N2O) [11,32]. GHG emissions from paddy production arise from machinery operations (including irrigation pumps, mowers, and threshers), rice cultivation, and fertilizer application. These emissions were estimated based on previous research [33], with a total GHG emission of 1.2 kg CO2-eq per kg of paddy rice. For straw collection, 83.8 g of CO2-eq are emitted per MJ of energy consumed [34]. GHG emissions from road transport are expressed in grams of CO2-eq per ton-kilometer (g CO2-eq/TKM). Considering both loaded and unloaded travel distances and rice straw yield, emissions were estimated at 221 g CO2-eq per TKM [34].
GHG emissions from electricity generation and ancillary processes were also assessed. Combustion processes emit approximately 0.73 kg CO2-eq per kWh, corresponding to conventional steam turbine technology and consistent with operational emission intensities reported by the Egyptian Electricity Holding Company [32]. The use of natural gas for the plant’s internal operations results in 0.55 kg of CO2 per kWh of electricity [32]. GHG emissions from electricity T&D in the grid were estimated based on the GHG emission factor (89 g CO2-eq/kWh of electricity losses) [35]. The GHG emissions associated with transporting ash to the landfill site were estimated using an emission factor of 2.68 kg CO2-eq per liter of diesel consumed [36]. This framework provides a realistic benchmark for evaluating emission intensity associated electricity generation within the current technological context of Egypt’s power sector.
2.4.3. Electricity Generation Calculations
For electricity generation, the combustion power plant, with combustion efficiency (85%), is combined with a steam turbine cycle, with an electric efficiency of 30% [37]. The energy generation from the process is computed using the following equation:
where EGRS: electricity generation from rice straw; RS: rice straw production; LHVRS: lower heating value of rice straw; µcombustion: combustion efficiency of power plant; and µelectricity: electric conversion efficiency.
2.5. Sensitivity Analysis
A sensitivity analysis was conducted to evaluate the influence of key input parameters on the study’s results. The analysis focuses on parameters subject to uncertainty and variability, including transportation distances, emission factors, and electricity conversion efficiency. To assess the robustness of the optimized scenario configuration, a deterministic one-way sensitivity analysis was performed around the base-case assumptions. The optimized spatial layout was kept fixed, and one parameter was varied at a time, while all other inputs remained unchanged [38,39]. This approach was selected to provide a transparent, computationally efficient assessment of parameter influence, given the model’s deterministic nature.
The tested parameters were average straw transport distance (−20% and +20%), road transport GHG emission factor (−20% and +20%), combustion efficiency (80% and 90% around the base value of 85%), electric conversion efficiency (25% and 35% around the base value of 30%), and electricity T&D losses (15% and 25% around the base value of 19.40%) [40,41,42,43,44,45]. A simple feedstock-availability scenario analysis was also conducted using the interannual variation in national rice production reported for 2019–2021. Because the modelled inventory corresponds to the 2021 production year, the 2020 and 2019 values were treated as medium and high feedstock cases, respectively, assuming unchanged regional shares. Electricity output was recalculated using Equation (8); net electricity was obtained by accounting for 10% auxiliary consumption; and delivered electricity was estimated by subtracting T&D losses. Total GHG emissions were then recalculated by updating the affected life-cycle components while keeping the remaining inventory terms constant.
3. Results
3.1. Rice Straw Management Scenarios
Open-field burning of rice straw remains widespread in Egypt, particularly after the rice harvesting season. The total cultivated area is approximately 464,019 ha, generating about 4.45 million tons of rice straw annually [4], which corresponds to approximately 5100 million kg of CO2-eq emissions per year. This study relies on average annual rice production data, with national rice production totaling 4.8 million tons in 2019, 4.44 million tons in 2020, and 4.24 million tons in 2021 [6]. Table 1 presents Egypt’s annual paddy production and associated straw yield across governorates under the proposed scenarios.
Table 1.
Annual paddy production, cultivated area, and straw production for the different provinces in Egypt [4].
Dakahlia is the largest contributor, accounting for 27.87% of total straw production. Kafr-El-Sheikh (24.17%), Sharkia (17.72%), and Behera (15.87%), while other governorates contribute marginally. In the multi-hub scenario, hubs were established and optimized based on rice straw availability. The optimal number of clusters (k = 3) was determined using the elbow method, as illustrated in Figure 3a, while Figure 3b presents the spatial distribution of the resulting clusters. The results identify three clusters: Cluster 1 (Delta region, including Dakahlia, Kafr-El-Sheikh, Sharkia, and Behera), Cluster 2 (eastern coastal region, including Port Said, Damietta, Ismailia, and Suez), and Cluster 3 (southern region, including Fayoum and Beni-Suef). Hub locations were determined based on straw availability.
Figure 3.
(a) Elbow curve and (b) governorate clusters proportional to quantities.
Data for the three geographic clusters in Egypt are presented in Table 1. Cluster 1 is the dominant region, accounting for 92.65% of total straw production, with major contributions from Dakahlia, Kafr-El-Sheikh, and Sharkia. Cluster 2, which includes Port Said, Ismailia, Damietta, and Suez, accounts for 7.2% of total production, with Damietta being the largest contributor within this group. Cluster 3, comprising Fayoum and Beni-Suef, contributes only 0.16% of total straw production.
Figure 4a illustrates the spatial distribution of the centralized hub, where circle sizes are proportional to straw production. Larger circles represent higher production levels. Figure 4b presents the decentralized hub configuration, with hub locations determined based on straw availability.
Figure 4.
Location of (a) Centralized hub and (b) Decentralized hubs for the three clusters with quantity considerations.
Table 2 quantifies the transportation effort and energy consumption associated with paddy straw transport using trucks across Egyptian governorates. In the first scenario, Dakahlia and Kafr-El-Sheikh exhibit the highest transportation activity, with substantial diesel consumption. Energy use under loaded conditions reached 430.95 TJ in Dakahlia and approximately 598 TJ in Kafr-El-Sheikh. In contrast, smaller regions such as Suez and Beni-Suef showed minimal contributions. The total system-wide diesel consumption amounted to approximately 78 million liters for loaded trips and 66 million liters for unloaded trips.
Table 2.
Trucks trips and diesel and energy consumption for the straw transportation process.
In the second scenario, transportation activity is concentrated within Cluster 1, which dominates both truck movement and energy consumption. This cluster accounted for diesel consumption exceeding 63 million liters for loaded trips and 53 million liters for unloaded trips. As a result, total energy consumption in Cluster 1 reached approximately 4.47 million GJ. Cluster 2 represents a smaller share, with diesel consumption of around 7.40 million liters, corresponding to about 282 TJ of energy use. Cluster 3 contributes minimally, with total energy consumption slightly above 2.2 TJ.
Table 3 presents energy consumption for paddy farming, straw collection, and transportation across Egyptian governorates. In the first scenario, paddy farming represents the most energy-intensive stage, accounting for approximately 50% of the total energy demand, with overall consumption exceeding 5673 TJ. Dakahlia and Kafr-El-Sheikh are the main contributors. Transportation also constitutes a significant share, with total energy consumption reaching approximately 5490 TJ, while straw collection contributes around 124 TJ. In the first scenario, the majority of GHG emissions originate from the farming phase, contributing approximately 5157.94 million kg CO2-eq. Dakahlia records the highest emissions (1437.53 million kg CO2-eq), followed by Kafr-El-Sheikh (1246.78 million kg CO2-eq) and Sharkia (914.04 million kg CO2-eq).
Table 3.
Energy consumption (TJ) and GHG emissions (million kg CO2-eq) from paddy farming, straw collection, and transportation.
The emission intensity of paddy farming is estimated at 1.16 kg CO2-eq per kg of straw. Straw collection contributes approximately 10.40 million kg CO2-eq to total emissions. Transportation-related emissions amount to approximately 75.73 million kg CO2-eq at the national level. These emissions vary across governorates, with Sharkia and Behera recording relatively high values.
In the second scenario, Cluster 1 accounts for most of the energy consumption. Dakahlia alone records 1512.30 TJ for paddy farming and 1034.28 TJ for transportation. Clusters 2 and 3 exhibit lower energy consumption compared to Cluster 1, reflecting smaller-scale operations. Cluster 2 records total energy consumption of 418.12 TJ for paddy farming and 281.97 TJ for transportation. Cluster 3 has the lowest energy consumption, with 10.73 TJ for farming and 2.27 TJ for transportation.
Regarding GHG emissions, Cluster 1 accounts for most emissions, with 4778.58 million kg CO2-eq from farming. Cluster 2 produces lower emissions, totaling 371.33 million kg CO2-eq from farming. Cluster 3 records the lowest emissions, with approximately 8.03 million kg CO2-eq from farming. Transitioning to a cluster-based system reduces transportation emissions from 75.73 to 65.62 t CO2-eq (13.4%) and transport energy demand from 5490.43 to 4757.49 TJ. Spatial variations persist, with a slight increase in major production regions and reductions in others. Cluster 2 demonstrates the most substantial decline in emissions, emphasizing the effectiveness of spatial optimization in enhancing transport efficiency.
Table 4 presents the energy performance and associated GHG emissions for the two combustion-based power plant scenarios. In Scenario 1, total electricity generation amounts to 5525.29 GWh, of which 552.53 GWh is consumed internally, yielding a net output of 4972.76 GWh. The electricity generation efficiency is estimated at 1116.52 kWh per ton of rice straw. Total GHG emissions are approximately 3630.11 million kg CO2-eq, corresponding to an emission factor of 0.73 kg CO2-eq per kWh, T&D losses remain considerable, with a loss rate of 19.40%, resulting in about 964.72 GWh of electricity losses and 85.86 million kg CO2-eq.
Table 4.
Energy and GHG emissions of combustion power plants, electricity T&D losses, and ash transportation.
The total ash produced is 748.69 million kg, requiring approximately 74,869 truck trips. The transport distance to the nearest landfill (Al Salam landfill) is 127 km. Diesel consumption amounts to 1728.78 thousand liters for loaded trips and 1462.82 thousand liters for unloaded return trips.
In the second scenario, electricity generation is heavily concentrated in Cluster 1, which produces 5118.91 GWh with a net output of 4607.02 GWh, while Cluster 2 and Cluster 3 contribute marginal shares. Cluster 1 dominates GHG emissions with 3363.13 million kg CO2-eq, compared to significantly lower values in the remaining clusters. Cluster 1 accounts for most T&D losses (893.76 GWh and 79.54 million kg CO2-eq), while Clusters 2 and 3 exhibit lower values.
Cluster 1 accounts for the majority of ash production, followed by much smaller shares in Clusters 2 and 3. Consequently, most transport activity, diesel consumption, and associated emissions are concentrated in Cluster 1, while Clusters 2 and 3 exhibit minimal contributions. Ash transportation results in moderate emissions, totaling approximately a few million kg CO2-eq.
Table 5 shows that GHG emissions in the rice straw-to-energy system are distributed across Scopes 1, 2, and 3, with contributions from all stages. In the first scenario, Scope 1 emissions from straw combustion reach 3630.11 million kg CO2-eq, while Scope 2 emissions from natural gas use total 3038.91 million kg CO2-eq. Scope 3 emissions are dominated by upstream activities, particularly paddy farming. The paddy farming contributes the largest share at 5157.94 million kg CO2-eq.
Table 5.
Scopes of GHG emissions from rice straw to the energy chain for different scenarios.
In the second scenario, emissions are distributed across three clusters. Under Scope 1, Cluster 1 contributes 3363.13 million kg CO2-eq, representing most of total emissions, while Clusters 2 and 3 contribute significantly lower values. Scope 2 emissions follow a similar pattern, with Cluster 1 accounting for 2815.40 million kg CO2-eq, compared to lower contributions from the remaining clusters. Scope 3 emissions, which include upstream and downstream activities, show variability across clusters. Paddy farming is the largest contributor, accounting for 5157.94 million kg CO2-eq, with Cluster 1 contributing 4778.58 million kg CO2-eq. Straw collection contributes relatively minor emissions.
Straw transportation emissions amount to 61.69 million kg CO2-eq in Cluster 1 and lower values in other clusters. Similarly, emissions from electricity T&D are 79.54 million kg CO2-eq in Cluster 1 and lower values elsewhere. Ash transportation contributes 9.36 million kg CO2-eq in Cluster 1, with lower values in the other clusters.
3.2. Economic Implications
To explore the economic dimension of the rice straw-based electricity generation, indicative economic metrics reported in the literature are used to estimate the nominal levelized cost of energy (LCOE), which measures the average present cost of 1 kWh of energy [46]. The economic analysis model proposed by Aduba et al. [47] was used, and the LCOE was calculated using Equation (9) [48]:
where ACC is the annualized capital cost, ADRS is the annual quantity of rice straw, AOM is the annual operation and maintenance cost, is the annual operating hours, and ε is the plant capacity (kW).
Cost assumptions were based on current conditions in the Egyptian market, using an average discount rate of 20% [49]. Capital expenditures (CAPEX) were estimated at 3000–5000 USD per kW of installed capacity, while operational expenditures (OPEX), including procurement, operations, maintenance, labor, and transportation, were estimated at 4–6% of CAPEX [50,51,52]. Based on these assumptions, the LCOE is estimated to range between 0.08 and 0.15 USD per kWh.
3.3. Social Implications
While various studies have examined the environmental and economic impacts of renewable energy production from agricultural residues, limited attention has been given to the social dimension [53]. In this study, a conceptual Social Life Cycle Assessment (S-LCA) informed perspective is adopted to evaluate the potential social implications of rice straw-to-energy systems in Egypt. Such a qualitative approach has been used in previous works [54,55]. Table 6 presents the identified social impact categories, including workers, consumers, local communities, society, and value chain actors, along with their associated subcategories and relevant Sustainable Development Goals (SDGs) and Egypt Vision 2030 pillars [8].
Table 6.
Social implications of rice straw-to-energy in Egypt.
The table also includes proposed quantitative key performance indicators (KPIs) for each category, enabling a more measurable and structured assessment of social performance. This framework provides an indicative mapping of potential social impacts aligned with S-LCA stakeholder groups and sustainability objectives.
3.4. Scenario Comparison and Optimization
Scenario-based analysis was applied to evaluate the sensitivity of the system to variations in key parameters. The comparison across four rice straw management pathways, open-field burning, Scenario 1, Scenario 2, and the optimized Cluster 1 configuration, is presented in Table 7. Open-field burning, representing the baseline scenario, generates no electricity while releasing approximately 10,258 million kg CO2-eq. In contrast, the alternative scenarios involve energy recovery from rice straw.
Table 7.
Rice straw management scenarios and optimization.
Scenario 1, based on a single centralized hub, generates approximately 4973 GWh of electricity from rice straw. This configuration requires more than 10 million truck trips to transport biomass residues nationwide. Total GHG emissions reach approximately 12,008 million kg CO2-eq, with Scope 1 and Scope 2 emissions contributing about 6669 million kg CO2-eq, and Scope 3 emissions accounting for approximately 5338 million kg CO2-eq.
Scenario 2 adopts a decentralized multi-hub configuration, with facilities distributed across three clusters based on production intensity. Cluster 1 accounts for more than 92% of total straw production, while Clusters 2 and 3 contribute smaller shares. In this scenario, net electricity generation remains approximately 4973 GWh. Total GHG emissions decrease slightly to about 11,999 million kg CO2-eq. Transport distances are reduced by over 25%, and diesel consumption and related emissions decrease by approximately 18% compared to Scenario 1. This reduction is primarily driven by shorter transport distances and improved spatial distribution of processing facilities, enhancing logistics efficiency through localized biomass aggregation.
The optimized Cluster 1 scenario focuses on the Nile Delta region, where over 92% of Egypt’s rice straw is produced [68]. This configuration generates approximately 4607 GWh of net electricity. Total GHG emissions are reduced to about 11,117 million kg CO2-eq, with Scope 1 emissions accounting for 3363 million kg CO2-eq, Scope 2 emissions for 2815 million kg CO2-eq, and Scope 3 emissions for 4939 million kg CO2-eq. Compared to other scenarios, this configuration reduces transportation distances and associated diesel consumption, reflecting a more efficient supply chain structure.
3.5. Sensitivity Analysis
The sensitivity analysis indicates that the optimized Cluster 1 configuration exhibits varying degrees of sensitivity to key input parameters, as presented in Table 8. Variations in average straw transport distance and road transport emission factors (±20%) result in only minor changes in total life cycle GHG emissions, ranging from 11,104.98 to 11,129.65 million kg CO2-eq.
Table 8.
One-way sensitivity analysis of the optimized Cluster 1 configuration. (Delivered electricity = net electricity after auxiliary consumption and T&D losses.)
In contrast, electric conversion efficiency has a significant impact on system performance. Reducing electric efficiency to 25% decreases delivered electricity to 3094.38 GWh and increases GHG intensity to 3.26 kg CO2-eq/kWh delivered. Increasing efficiency to 35% raises delivered electricity to 4332.14 GWh and reduces GHG intensity to 2.81 kg CO2-eq/kWh delivered.
Similarly, varying T&D losses between 15% and 25% changes delivered electricity from 3915.97 to 3455.27 GWh and shifted GHG intensity from 2.83 to 3.22 kg CO2-eq/kWh delivered. Combustion efficiency also influences electricity output and emission intensity, although to a lesser extent. Variations in feedstock availability primarily affect total electricity generation and total emissions proportionally, with minimal impact on emission intensity.
3.6. Risks and Challenges
A qualitative risk assessment was conducted to evaluate the potential challenges associated with utilizing rice straw for bioenergy systems, considering infrastructural, technical, and investment-related dimensions. Table 9 summarizes the key risks identified for biomass power deployment in Egypt, along with corresponding mitigation measures. Figure 5 presents the risk matrix based on likelihood and impact. The results indicate that the highest-risk categories include supply consistency, logistics costs, infrastructure limitations, and investment and financial risks.
Table 9.
Main risks for the rice straw-to-energy supply chain.
Figure 5.
Risk matrix for the Rice Straw to bioenergy supply chain.
4. Discussion
4.1. Environmental and Energy Performance Across Scenarios
The continued reliance on open-field burning presents significant environmental challenges, contributing to substantial GHG emissions and severe air pollution, including the recurring “black cloud” phenomenon. These impacts highlight the need to transition toward more sustainable rice straw management practices.
Spatial variations in rice straw production reflect differences in agricultural conditions, including irrigation availability, cultivated land area, and agronomic practices. The dominance of governorates such as Dakahlia and Kafr-El-Sheikh indicates a strong spatial concentration of biomass resources in the Nile Delta, with important implications for supply chain design and system optimization. Clustering analysis further confirms pronounced spatial heterogeneity in biomass distribution, with the Delta region forming the primary production hub. Optimizing hub locations within clusters reduces transportation distances, thereby improving logistical efficiency and lowering environmental and economic costs, emphasizing the importance of spatially informed logistics planning.
The findings reveal a strong relationship between biomass availability and transportation demand, as regions with higher production volumes exhibit greater transport activity and fuel consumption. The prominence of Dakahlia, Kafr-El-Sheikh, and Sharkia reflects the concentration of agricultural production in the Nile Delta, which directly drives increased logistical requirements. While clustering supports efficient biomass aggregation, it also introduces challenges related to transport intensity and associated emissions, particularly within Cluster 1. In contrast, Clusters 2 and 3 experience lower logistical pressures due to their smaller production scales. These results underscore the importance of optimizing transportation networks and supply chain configurations to enhance environmental performance.
Energy analysis indicates that paddy cultivation is the most energy-intensive stage, reflecting the input-intensive nature of rice production, particularly fertilizer use and mechanized operations. This observation is consistent with previous studies highlighting the high energy demand of rice systems [28,33,69]. Transportation also constitutes a major share of total energy consumption, further emphasizing the critical role of logistics in biomass supply chains. Compared with the literature benchmarks, transport energy intensity exceeds the commonly reported value of 0.87 MJ/kg, while cultivation and collection remain within or below previously reported ranges [28]. These variations reflect differences in machinery efficiency, collection techniques and transport assumptions [28,29,30].
Similarly, GHG emissions are dominated by the cultivation phase, driven primarily by fertilizer application, mechanized operations, and field management practices. Although partial carbon offset occurs through photosynthesis, net emissions remain substantial. The estimated emission intensity for paddy cultivation (1.16 kg CO2-eq/kg straw) is lower than values reported in previous studies (1.50–1.78 kg CO2-eq/kg) [28,70,71], while the emission factor for straw collection (0.002 kg CO2-eq/kg) is also significantly lower than ranges (0.023–0.060) reported in previous studies [28,72,73]. These discrepancies may arise from differences in system boundaries, input data, and methodological assumptions. Transportation emissions, although smaller in magnitude, vary across regions depending on transport distances and logistical efficiency, with an estimated emission intensity of 0.017 kg CO2-eq/kg straw, falling within the range (0.006–0.130) reported in the literature [71,72,74].
Cluster-based analysis highlights the dominant role of Cluster 1 in both energy consumption and emissions, reflecting its concentration of biomass resources in the Nile Delta. While this concentration facilitates efficient feedstock aggregation, it also increases transport-related energy demand. In contrast, Clusters 2 and 3 exhibit lower energy consumption and emissions. These findings suggest that mitigation efforts should prioritize high-production regions, particularly Cluster 1, where the greatest emission reductions can be achieved.
The observed reduction in transportation emissions under the cluster-based configuration underscores the importance of supply chain design in improving environmental performance. Variations in emissions are driven by differences in intra-cluster transport distances and spatial biomass distribution. While slight increases are observed in high-production regions such as Dakahlia and Sharkia, reductions in other provinces reflect the benefits of shorter average hauling distances. Reduction in Cluster 2 further demonstrates the effectiveness of proximity-based aggregation.
The internal electricity consumption rate of approximately 10% aligns with typical values reported for thermal power plants, indicating moderate operational efficiency [31]. The estimated electricity generation per ton of rice straw (1116.52 kWh) falls within the range reported in the literature, exceeding some values (937.52 kWh) while remaining below others (1367 kWh) [28,30], due to variations in feedstock characteristics and plant design assumptions [17].
The emission factor of 0.73 kg CO2-eq/kWh reflects the performance of conventional biomass combustion systems and is lower than the values reported in international studies on rice straw-based power generation, which range between 0.85 and 0.99 kg CO2-eq/kWh [28,75]. However, such systems generally operate at lower efficiencies compared to advanced technologies, such as gasification combined-cycle systems or co-firing configurations, which can achieve emission intensities below 0.4 kg CO2-eq/kWh [19,32,76,77]. Nevertheless, when compared to natural gas-based electricity generation in Egypt (0.92 kg CO2-eq/kWh) [32], rice straw-based systems offer an emission reduction of approximately 0.19 kg CO2-eq/kWh, corresponding to about 870 million kg of CO2-eq annually at an output of 4607 GWh.
This mitigation potential is further strengthened by the biogenic nature of CO2 emissions from rice straw combustion, which are generally considered carbon-neutral due to their reabsorption through photosynthesis in subsequent crop cycles [9,78,79]. Additionally, diverting rice straw from open-field burning to energy production avoids approximately 770 million kg CO2-eq of CH4 and N2O emissions, providing further climate benefits beyond carbon neutrality. Biomass-based systems exhibit higher life-cycle emissions compared to other renewable energy technologies, such as solar photovoltaic and wind power (48 and 11–12 g CO2-eq/kWh, respectively) [57]. However, they offer co-benefits, including improved waste management, enhanced air quality, and increased rural employment opportunities.
Losses and associated GHG emissions from transmitting electricity after generation are presented in Table 4. Based on the T&D losses (19.40%) and 89 g CO2-eq/kWh of electricity losses, total losses can reach about 964.72 GWh and emit 85.86 million kg of CO2-eq. The T&D losses are nearly equivalent to those recorded in South Africa, which stand at 18.64% [35,80]. The GHG emissions for T&D losses are lower than the value (97 g CO2-eq/kWh) reported in previous research [81] and higher than the value (66 g CO2-eq/kWh) reported in another study [82]. These losses could be due to old infrastructure limitations and transmission distances [82,83], highlighting the importance of improving grid efficiency and plant siting [84].
Finally, the results demonstrate that both direct (Scope 1) and indirect (Scope 3) emissions contribute significantly to the overall carbon footprint, with upstream agricultural activities, particularly paddy cultivation, being the dominant source. The strong dominance of Cluster 1 across all emission scopes reflects its large-scale production and operational intensity, indicating that mitigation strategies should focus on high-production regions. Variations across clusters further emphasize the influence of spatial factors, logistics, and system scale on environmental performance. These findings highlight the need of integrated strategies combining agricultural, logistical, and technological improvements supported by spatial planning.
4.2. Economic Performance and Cost Analysis
The indicative LCOE range estimated in this study (0.08–0.15 USD/kWh) falls broadly within the range reported in the rice straw and biomass power literature, although its upper bound is relatively conservative. Egypt-specific studies report values ranging from 0.06 to 0.11 USD/kWh [67] and an average of approximately 0.07 USD/kWh [19], while international evidence from Thailand indicates costs of 0.07–0.09 USD/kWh for rice straw combustion systems [85]. These comparisons suggest that rice straw-based electricity can be economically competitive with conventional energy sources, including oil-based generation and, to some extent, natural gas [86,87].
Beyond direct cost performance, the utilization of rice straw provides additional indirect economic benefits, such as environmental improvements, public health gains, and reduced exposure to global energy supply disruptions. However, logistics costs account for a significant share of total supply chain expenses, ranging from 34% to 90% [88], underscoring the importance of optimizing transport and supply chain design to enhance economic feasibility and attract investment.
It should be noted that the relatively wide LCOE range reflects the use of broad CAPEX and OPEX assumptions and a relatively high discount rate. This study presents a preliminary and simplified techno-economic assessment. Therefore, the results should be interpreted as a conservative screening estimate rather than a precise project-level cost forecast. A comprehensive financial assessment, including indicators such as net present value (NPV) and internal rate of return (IRR), would require detailed project-specific data on cash flows, financing structures, tariffs, and policy incentives, and is recommended for future research.
4.3. Social Sustainability Implications
The incorporation of social dimensions into biomass energy systems highlights the broader value of rice straw utilization beyond environmental and economic considerations. Based on the indicators presented in Table 6, the social impacts can be evaluated across key stakeholder groups.
From a labor perspective, rice straw-based systems demonstrate substantial potential for rural employment and income generation. Biomass systems are estimated to create approximately 3–5 jobs per MW across collection, transport, and plant operation stages [56], while providing additional income to farmers through straw sales, potentially increasing farm income by 25–30% [57]. These outcomes directly support SDG 8 and Egypt’s Vision 2030 economic development pillar. However, ensuring safe working conditions and social protection remains critical, as reflected in reported workplace risks (1.7–2.1 fatalities per 100,000 workers/year) [58,59] and the need to expand access to social and medical insurance (30–80% of workers) [60].
At the consumer level, the system contributes to both energy access and public health improvements. It has the potential to supply electricity to approximately 2.3–2.5 million households [61], while reducing electricity costs by around 20% compared to fossil-based generation [19]. In addition, reduced air pollution from avoided open-field burning directly improves health outcomes in the Nile Delta, aligning with SDGs 3 and 7.
For local communities, the benefits extend to broader development and environmental improvements. The reduction in open-field burning is associated with an estimated 28% decrease in PM2.5 concentrations [62,63] and approximately 25% reduction in respiratory disease cases [64]. Infrastructure investments can further support local economic development. These outcomes support SDGs 11 and 13 and contribute to environmental sustainability under Egypt’s Vision 2030.
At the societal level, biomass systems contribute to technological advancement and social inclusion. The deployment of 1–5 new biomass technologies [1], combined with workforce training (approximately 160 h per worker annually) [65], enhances technical capacity and knowledge transfer. In addition, promoting gender inclusion, through female participation rates of 10–30% across the supply chain [56], supports SDGs 5 and 10.
The performance of value chain actors is closely linked to governance and institutional frameworks. Strengthening farmer participation through supply contracts (50–60% participation rates) [57,66], fair pricing mechanisms (approximately 25 USD/ton) [67], and long-term agreements (3–15 years) [57] is essential for ensuring supply stability. Policy instruments such as subsidies and incentives can increase farmer income by 25–30% [57], supporting SDGs 4 and 12.
Overall, these findings demonstrate that rice straw-based energy systems can deliver substantial social co-benefits when supported by effective policies, inclusive governance, and optimized supply chains. The use of quantitative KPIs (Table 6) supports a structured evaluation of social sustainability. In contrast, open-field burning remains the least sustainable management pathway, as it generates significant GHG emissions and contributes to severe air pollution, including the recurring “black cloud.” This practice adversely affects public health, making it inconsistent with national and global sustainability objectives. To further strengthen social impact assessment, digital tools such as Natural Language Processing (NLP) and Artificial Intelligence (AI) methods can enhance evaluation and support informed decision-making [89].
4.4. Interpretation of Scenario Performance and Optimization Results
The scenario comparison highlights clear trade-offs between uncontrolled disposal and energy valorization pathways, as indicated in Table 7. Open-field burning remains the least sustainable option due to its high GHG emissions and severe air pollution impacts, with no energy recovery. In contrast, biomass-based energy scenarios enable both emission reduction and resource utilization, supporting decarbonization objectives.
Comparing system configurations reveals that the centralized model (Scenario 1), while enabling large-scale energy recovery, is constrained by high logistical demands, increased diesel consumption, and elevated indirect emissions. The decentralized multi-hub configuration (Scenario 2) improves system performance by reducing transport distances and associated emissions, enhancing logistical efficiency and system resilience, although overall emission reductions remain moderate. These differences are driven by spatial logistics factors, where decentralized aggregation reduces transport demand, while centralized systems benefit from economies of scale but increase logistics burdens. Similar conclusions have been reported in the biomass logistics literature, where hub-based or clustered designs improve supply chain efficiency when biomass is geographically dispersed, seasonal, and low in bulk density [90,91].
The optimized Cluster 1 configuration emerges as the most effective approach by aligning energy conversion processes with the spatial concentration of biomass resources in the Nile Delta. This configuration achieves a more favorable balance between electricity generation, emission reduction, and supply chain efficiency, while also delivering notable socio-economic co-benefits, including enhanced rural employment and improved public health outcomes. This interpretation is consistent with Egypt-specific techno-economic studies, such as Abdelhady et al. [76], which demonstrate that biomass system performance is highly sensitive to collection radius and facility location.
However, the superiority of this Delta-focused configuration should be interpreted as a context-specific planning outcome rather than a universal preference for centralization. The recent review literature on bio-hubs indicates that the optimal degree of centralization depends on multiple factors, including feedstock dispersion, seasonal variability, storage and preprocessing requirements, road accessibility, and the trade-off between economies of scale and transportation burdens [90,91]. Accordingly, while the concentration of activities enhances efficiency under current conditions, it may also introduce challenges related to grid capacity and spatial equity, highlighting the importance of exploring multi-regional optimization strategies in future system planning.
Overall, the results demonstrate that supply chain design and spatial optimization are critical to improving the performance of biomass systems. Integrating environmental assessment with logistics optimization provides a comprehensive framework for developing scalable and efficient bioenergy systems. Nevertheless, key limitations remain, including dependence on feedstock availability, transport-related emissions, and relatively low conversion efficiencies, which should be addressed in future system design and policy development. The scenario design is limited to two configurations, and future research should examine a broader range of system designs to improve generalizability. These findings are particularly relevant under conditions of fuel price volatility, where improving transport efficiency and reducing reliance on fossil fuels become essential. In this context, decentralized configurations and optimized logistics, along with the adoption of alternative or electrified transport systems, offer effective pathways to enhance system resilience and long-term sustainability.
4.5. Sensitivity Analysis and System Performance
The sensitivity analysis indicates that the system is relatively insensitive to moderate variations in transport-related parameters, suggesting that logistics contribute a relatively small share to the overall environmental footprint within the defined system boundary. This implies that the optimized configuration remains robust to uncertainties in transport assumptions.
In contrast, system efficiency parameters, particularly electric conversion efficiency and T&D losses, emerge as the most critical determinants of both electricity output and carbon intensity. Enhancing conversion efficiency improves system performance by increasing electricity generation while simultaneously reducing emissions per unit of energy. Likewise, minimizing T&D losses is essential for improving overall efficiency and reducing indirect emissions.
The relatively low sensitivity of emission intensity to feedstock availability suggests that changes in biomass supply primarily influence system scale rather than operational efficiency. Overall, these findings highlight that improvements in conversion technologies and grid infrastructure are more effective at reducing life-cycle emissions than logistics adjustments alone.
4.6. Risk Assessment and Implementation Challenges
The identified risks represent significant challenges to the large-scale deployment of biomass-based energy systems in Egypt, as indicated in Table 9. Supply consistency is affected by seasonal fluctuations and competing uses of agricultural residues. In addition, high logistics costs and infrastructure constraints highlight the difficulties associated with collecting, transporting, and processing geographically dispersed biomass resources [90,91]. Investment-related risks highlight the importance of stable policy environments, well-defined regulatory frameworks, and targeted financial incentives to encourage private sector involvement. Addressing these challenges requires integrated strategies combining infrastructure development, supply chain optimization, and policy support [57,67]. Overall, successful implementation depends on both technical feasibility and effective risk management supported by strong institutional frameworks.
5. Recommendations and Future Research Directions
Table 10 outlines several key research priorities that could enhance the robustness and sustainability of rice straw-based bioenergy systems. These priorities emphasize the need to improve feedstock availability modeling through multi-year agricultural data and climate variability scenarios to better capture fluctuations in rice straw supply, while also exploring the potential use of alternative agricultural residues. Methodological advancements are also highlighted, including the application of consequential LCA to better account for broader system interactions and policy implications, and the incorporation of dynamic carbon modeling to assess temporal carbon fluxes and soil carbon impacts.
Table 10.
Future research directions for strengthening rice straw energy systems.
In addition, trade-off analyses are necessary to balance the energy use of rice straw with alternative uses, such as animal feed or compost, to maintain agricultural sustainability. To strengthen the reliability of results, future studies should incorporate sensitivity and uncertainty analyses, for example, through Monte Carlo simulations or scenario-based approaches. The table also highlights the importance of integrating S-LCA to quantify potential social benefits, such as employment opportunities and health improvements from reduced open-field burning, alongside techno-economic analysis that combines CAPEX, OPEX, and LCOE with environmental LCA. Finally, the application of multi-objective optimization techniques, such as MILP, can support decision-making by identifying optimal facility locations, transportation networks, and system configurations.
6. Conclusions
This study demonstrates the potential of rice straw as a significant renewable resource for electricity generation in Egypt, providing both environmental and social benefits. Egypt produces over 4.45 million tons of rice straw annually, with nearly 70% concentrated in Dakahlia, Kafr-El-Sheikh, and Sharkia. Life cycle analysis estimated total energy consumption at 11,287 TJ, mainly from farming (5673 TJ) and transportation (5490 TJ), identifying cultivation and logistics as the main energy hotspots. Total GHG emissions reached 12,007.5 million kg CO2-eq, largely driven by farming, combustion, and natural gas use in power plants. The system generated 5525 GWh of electricity (4973 GWh net), equivalent to 1116.5 kWh per ton of straw. Sensitivity analysis further showed that both delivered electricity and GHG intensity are more strongly influenced by conversion efficiency and T&D losses than by moderate variations in transport assumptions. Scenario comparison showed that while centralized systems benefit from scale, they require extensive transport. In contrast, the optimized multi-hub scenario in the Nile Delta reduced transport distances by over 25% and emissions by about 18%, producing more than 4607 GWh of net electricity. In addition to environmental improvements, the optimized scenario indicates potential social co-benefits, including rural employment generation, increased income opportunities for farmers, and improved air quality resulting from reduced open-field burning. Overall, the optimized multi-hub system represents the most sustainable pathway, supporting Egypt’s Vision 2030 and the UN SDGs.
Author Contributions
N.S., M.M.A.-D., Y.A.A., A.A.M., and N.A.M.: Conceptualization, Methodology; N.S., M.M.A.-D., and N.A.M.: Software; N.S., M.M.A.-D., and N.A.M.: Data curation; N.S., M.M.A.-D., and N.A.M.: Writing—Original draft preparation; N.S., M.M.A.-D., Y.A.A., A.A.M., and N.A.M.: Visualization, Investigation; N.S., M.M.A.-D., and N.A.M.: Supervision; N.S., M.M.A.-D., Y.A.A., A.A.M., and N.A.M.: Writing—Reviewing and Editing. All authors have read and agreed to the published version of the manuscript.
Funding
This research received no external funding.
Institutional Review Board Statement
Not applicable.
Informed Consent Statement
Not applicable.
Data Availability Statement
The data for this work can be found within the article, and for further data, feel free to contact the corresponding authors.
Acknowledgments
The authors express their sincere gratitude to the teams at Zagazig University, Shaqra University, and the British University in Egypt, for their valuable suggestions and continuous support throughout this study.
Conflicts of Interest
The authors confirm that there are no conflicts concerning the publication of this manuscript.
References
- Kumar, J.A.; Sathish, S.; Prabu, D.; Renita, A.A.; Saravanan, A.; Deivayanai, V.C.; Anish, M.; Jayaprabakar, J.; Baigenzhenov, O.; Hosseini-Bandegharaei, A. Agricultural waste biomass for sustainable bioenergy production: Feedstock, characterization and pre-treatment methodologies. Chemosphere 2023, 331, 138680. [Google Scholar] [CrossRef] [Scilit]
- Juneja, P. Biomass Waste Conversion Technologies for its Utilization and Energy Generation in India: A Perspective. IOP Conf. Ser. Earth Environ. Sci. 2024, 1285, 12010. [Google Scholar] [CrossRef] [Scilit]
- Mossissa, M.H.; Afessa, M.M.; Nega, T.D.; Ahsan Amjed, A.M.; Venkata, A.R. Opportunities and challenges of harnessing biomass wastes for decentralized heat and energy generation and climate mitigation via fluidized-bed gasification pathway. In From Biomass to Biobased Products; IntechOpen: London, UK, 2024; pp. 2–31. [Google Scholar]
- CAPMAS. Central Agency for Public Mobilization and Statistics. 2024. Available online: https://www.capmas.gov.eg/Pages/Publications.aspx?page_id=5104 (accessed on 1 April 2026).
- El-Sayed, S.A.; Ismail, M.A.; Mostafa, M.E.; Noseir, E.H.; Khass, T.M. Availability, sustainability and accessibility of agro crop residue production and solar radiation in Egypt for producing highly chemical products through pyrolysis processes. Clean Energy 2023, 7, 654–670. [Google Scholar] [CrossRef] [Scilit]
- Said, N.; Alrowais, R.; Abdel-Daiem, M.M.; Mostafa, N.A. Bio-Waste to Bioenergy: Critical Assessment of Sustainable Energy Supply Chain in Egypt. Resources 2025, 14, 131. [Google Scholar] [CrossRef] [Scilit]
- Abdel Daiem, M.; Alotaibi, A.; Alosime, E.; Zaidi, B.; Said, N. Structural-property relationship in activated carbon synthesized from rice straw for electronic application. Pol. J. Environ. Stud. 2020, 29, 3535–3547. [Google Scholar] [CrossRef] [Scilit] [PubMed]
- Ministry of Planning and Economic Development. The National Agenda for Sustainable Development. 2023. Available online: https://mped.gov.eg/Files/Egypt_Vision_2030_EnglishDigitalUse.pdf?utm_source=chatgpt.com (accessed on 1 January 2026).
- Said, N.; Alblawi, A.; Hendy, I.A.; Abdel Daiem, M.M. Analysis of Energy and Greenhouse Gas Emissions of Rice Straw to Energy Chain in Egypt. BioResources 2020, 15, 1510–1520. [Google Scholar] [CrossRef] [Scilit]
- Mathieu, R. Mapping of Rice Areas in Egypt Using SAR Imagery; CGIAR System Organization: Montpellier, France, 2022. [Google Scholar]
- El Safty, A. Environmental and health impact of open burning rice straw. Egypt. J. Occup. Med. 2020, 44, 679–708. [Google Scholar]
- Liu, M.; Zhu, G.; Tian, Y. The historical evolution and research trends of life cycle assessment. Green Carbon 2024, 2, 425–437. [Google Scholar] [CrossRef] [Scilit]
- Hauschild, M.Z. Introduction to LCA methodology. In Life Cycle Assessment: Theory and Practice; Springer: Cham, Switzerland, 2017; pp. 59–66. [Google Scholar]
- Schrijvers, D.; Loubet, P.; Sonnemann, G. Archetypes of goal and scope definitions for consistent allocation in LCA. Sustainability 2020, 12, 5587. [Google Scholar] [CrossRef] [Scilit]
- Palomero, J.C.; Freboeuf, L.; Ciroth, A.; Sonnemann, G. Integrating circularity into Life Cycle Assessment: Circularity with a life cycle perspective. Clean. Environ. Syst. 2024, 12, 100175. [Google Scholar] [CrossRef] [Scilit]
- Heijungs, R. Marginal and average considerations in LCA and their role for defining emission factors and characterization factors. Int. J. Life Cycle Assess. 2025, 30, 525–542. [Google Scholar] [CrossRef] [Scilit]
- Firdaus, R.; Harun, S.N.; Hanafiah, M.M.; Mat Deli, M.; Adhikary, S.K. Life cycle assessment of rice straw for energy valorization: A comprehensive review of methodological trends and future outlooks. WIREs Energy Environ. 2024, 13, e520. [Google Scholar] [CrossRef] [Scilit]
- Karkour, S.; Rachid, S.; Maaoui, M.; Lin, C.-C.; Itsubo, N. Status of life cycle assessment (LCA) in Africa. Environments 2021, 8, 10. [Google Scholar] [CrossRef] [Scilit]
- Abdelhady, S.; Shalaby, M.A.; Shaban, A. Techno-economic analysis for the optimal design of a national network of agro-energy biomass power plants in Egypt. Energies 2021, 14, 3063. [Google Scholar] [CrossRef] [Scilit]
- Abdelkader, M.; Zargar, M.; Murtazova, K.M.-S.; Nakhaev, M.R. Life Cycle Assessment of the Cultivation Processes for the Main Vegetable Crops in Southern Egypt. Agronomy 2022, 12, 1527. [Google Scholar] [CrossRef] [Scilit]
- Ibrahim, R.A.; Inan, H.; Fahim, I.S. A comparative cradle-to-gate life cycle assessment of three cotton stalk waste sustainable applications. Sci. Rep. 2023, 13, 20781. [Google Scholar] [CrossRef] [Scilit]
- Salatein, N.M.; Ibrahim, R.A.; Fahim, I.S. Sustainable utilization of sugarcane bagasse for wood-based panels: A promising approach for waste management in Egypt. J. Eng. Res. 2024, 13, 2549–2558. [Google Scholar] [CrossRef] [Scilit]
- Wu, J.; Liu, X.; Li, Y.; Yang, L.; Yuan, W.; Ba, Y. A Two-Stage Model with an Improved Clustering Algorithm for a Distribution Center Location Problem under Uncertainty. Mathematics 2022, 10, 2519. [Google Scholar] [CrossRef] [Scilit]
- Mostafa, N.; Eltawil, A. Solving the Heterogeneous Capacitated Vehicle Routing Problem using K-Means Clustering and Valid Inequalities. In Proceedings of the 7th International Conference on Industrial Engineering and Operations Management (IEOM), Rabat, Morocco, 11–13 April 2017; pp. 2239–2249. Available online: https://index.ieomsociety.org/index.cfm/article/view/ID/9094 (accessed on 1 January 2026).
- Wang, L.; Liu, X.; Wang, X.; Jiang, Y. Location optimization of cold chain logistics parks based on Bayesian probability theory and K-means clustering analysis in China. Sci. Rep. 2025, 15, 39912. [Google Scholar] [CrossRef] [Scilit]
- Sakr, D.; Nakhla, D.; Shawky, A.; Abdelmeguid, N.; Khairy, M.; Magdy, N. Egypt’s First Biennial Transparency Report, Chapter 3; SHiFTERRA Consultancy: Cairo, Egypt, 2024; Available online: https://www.undp.org/sites/g/files/zskgke326/files/2024-06/ToR_Adaptation_-BTR1-Egypt_final.pdf (accessed on 1 January 2026).
- Abdel Daiem, M.M.; Said, N. Assessment and Contribution of Biomass Residues to Renewable Energy Resources in Egypt. In The Handbook of Environmental Chemistry; Springer: Berlin/Heidelberg, Germany, 2024; pp. 345–372. [Google Scholar]
- Shafie, S.M.; Masjuki, H.H.; Mahlia, T.M.I. Life cycle assessment of rice straw-based power generation in Malaysia. Energy 2014, 70, 401–410. [Google Scholar] [CrossRef] [Scilit]
- El Shimi, H.I.; Moustafa, S.S. Biodiesel production from microalgae grown on domestic wastewater: Feasibility and Egyptian case study. Renew. Sustain. Energy Rev. 2018, 82, 4238–4244. [Google Scholar] [CrossRef] [Scilit]
- Soam, S.; Borjesson, P.; Sharma, P.K.; Gupta, R.P.; Tuli, D.K.; Kumar, R. Life cycle assessment of rice straw utilization practices in India. Bioresour. Technol. 2017, 228, 89–98. [Google Scholar] [CrossRef] [Scilit]
- Bolarinwa, M.A.; Udensi, F.-G. Operational Performance Analysis of Generating Power Plant. Eur. J. Energy Res. 2024, 4, 44–56. [Google Scholar] [CrossRef] [Scilit]
- Abdallah, L.; El-Shennawy, T. Evaluation of CO2 emission from Egypt’s future power plants. Euro-Mediterr. J. Environ. Integr. 2020, 5, 49. [Google Scholar] [CrossRef] [Scilit]
- Farag, A.A.; Radwan, H.A.; Abdrabbo, M.A.A.; Heggi, M.A.M.; McCarl, B.A. Carbon footprint for paddy rice production in Egypt. Nat. Sci. 2013, 11, 36–45. [Google Scholar]
- Bakker, A.B. An evidence-based model of work engagement. Curr. Dir. Psychol. Sci. 2011, 20, 265–269. [Google Scholar] [CrossRef] [Scilit]
- Creecy, B.D. South Africa’s 2021 Grid Emission Factors Report. 2024. Available online: https://www.dffe.gov.za/sites/default/files/legislations/southafrica2021gridemissionfactorsreport_g50071_gon4317.pdf (accessed on 1 January 2026).
- EPA. GHG Emission Factors Hub. 2025. Available online: https://www.epa.gov/climateleadership/ghg-emission-factors-hub (accessed on 1 January 2026).
- Jiang, Y.; Havrysh, V.; Klymchuk, O.; Nitsenko, V.; Balezentis, T.; Streimikiene, D. Utilization of crop residue for power generation: The case of Ukraine. Sustainability 2019, 11, 7004. [Google Scholar] [CrossRef] [Scilit]
- ISO 14044:2006; Environmental Management—Life Cycle Assessment—Requirements and Guidelines. International Organization for Standardization: Geneva, Switzerland, 2006.
- Huijbregts, M.A.J.; Gilijamse, W.; Ragas, A.M.J.; Reijnders, L. Evaluating uncertainty in environmental life-cycle assessment: A case study comparing two insulation options for a Dutch one-family dwelling. Environ. Sci. Technol. 2003, 37, 2600–2608. [Google Scholar] [CrossRef] [Scilit] [PubMed]
- IPCC. Climate Change 2022: Mitigation of Climate Change; Contribution of Working Group III to the Sixth Assessment Report; Cambridge University Press: Cambridge, UK, 2022. [Google Scholar]
- IEA. Bioenergy for Sustainable Development: Potential and Policy Implications; International Energy Agency: Paris, France, 2021. [Google Scholar]
- IPCC. IPCC Guidelines for National Greenhouse Gas Inventories; Intergovernmental Panel on Climate Change: Geneva, Switzerland, 2006. [Google Scholar]
- European Commission—Joint Research Centre (JRC). International Reference Life Cycle Data System (ILCD) Handbook—General Guide for Life Cycle Assessment; Publications Office of the European Union: Luxembourg, 2010.
- IRENA. Renewable Power Generation Costs in 2021; International Renewable Energy Agency: Abu Dhabi, United Arab Emirates, 2021. [Google Scholar]
- International Energy Agency Bioenergy. Technology Roadmap: Delivering Sustainable Bioenergy; International Energy Agency Bioenergy: Paris, France, 2019. [Google Scholar]
- Lai, C.S.; McCulloch, M.D. Levelized cost of electricity for solar photovoltaic and electrical energy storage. Appl. Energy 2017, 190, 191–203. [Google Scholar] [CrossRef] [Scilit]
- Aduba, J.J.; Shimada, K.; Longfor, N.R. Harnessing biomass waste-to-energy for sustainable electricity generation: Prospects, viability, and policy implications for low-carbon urban development. Clean Technol. Environ. Policy 2025, 27, 8669–8690. [Google Scholar] [CrossRef] [Scilit]
- Ezekwem, C.; Muthusamy, S. Feasibility study of integrating the renewable energy system for increased electricity access: A case study of Choba community in Nigeria. Sci. Afr. 2023, 21, e01781. [Google Scholar] [CrossRef] [Scilit]
- Central Bank of Egypt. Discount Rates. 2025. Available online: https://www.cbe.org.eg/en/economic-research/statistics/discount-rates (accessed on 1 January 2026).
- Ibrahim, M.M. Techno-Economic Analysis of a Biomass Grid-Connected Power Plant for Consistent Rural Electrification in New Noubarya in Egypt. Case Stud. Environ. 2025, 9, 2705031. [Google Scholar] [CrossRef] [Scilit]
- Balobaid, A.; Abd-Elhafiez, W.M.; Nagy, S.M.; Trabay, D.W. Integrating Multi-Criteria Decision-Making Techniques in Assessing Renewable Energy Potential: A Case Study of Egypt. IEEE Access 2024, 12, 103594–103605. [Google Scholar] [CrossRef] [Scilit]
- Torad, M.M.; Elbanna, S.H.A.; El-Dabah, M.A.; Diab, A.A.Z. Optimal Design of a Grid-Connected Microgrid Incorporating Biomass: Case Study in New Valley, Egypt. In 2025 7th International Youth Conference on Radio Electronics, Electrical and Power Engineering (REEPE), Moscow, Russian Federation, 8–10 April 2025; IEEE: Piscataway, NJ, USA, 2025; pp. 1–8. [Google Scholar] [CrossRef] [Scilit]
- Thakur, B.; Kaur, R.; Kaur, S.; Tripathi, M. Policies for the Conversion of Biowaste into Bioenergy. In Biotechnological Advancements in Biomass to Bioenergy Biotransformation: Sustainable Implications in Circular Economy; Springer: Singapore, 2025; pp. 245–265. [Google Scholar]
- Luthin, A.; Traverso, M.; Crawford, R.H. Circular life cycle sustainability assessment: An integrated framework. J. Ind. Ecol. 2024, 28, 41–58. [Google Scholar] [CrossRef] [Scilit]
- Larsen, V.G.; Tollin, N.; Sattrup, P.A.; Birkved, M.; Holmboe, T. What are the challenges in assessing circular economy for the built environment? A literature review on integrating LCA, LCC and S-LCA in life cycle sustainability assessment, LCSA. J. Build. Eng. 2022, 50, 104203. [Google Scholar] [CrossRef] [Scilit]
- IRENA. Renewable Power Generation Costs in 2024; International Renewable Energy Agency: Abu Dhabi, United Arab Emirates, 2025. [Google Scholar]
- Ymeri, P.; Gyuricza, C.; Fogarassy, C. Farmers’ attitudes towards the use of biomass as renewable energy—A case study from Southeastern Europe. Sustainability 2020, 12, 4009. [Google Scholar] [CrossRef] [Scilit]
- Ugolini, M.; Recchia, L.; Avolio, C.; Barragan Yebra, C. Social Life Cycle Assessment of Multifunctional Bioenergy Systems: Social and Socioeconomic Impacts of Hydrothermal Treatment of Wet Biogenic Residues into Intermediate Bioenergy Carriers and Sustainable Solid Biofuels. Energies 2025, 18, 3695. [Google Scholar] [CrossRef] [Scilit]
- ESAW. Accidents at Work Statistics; Eurostat: Luxembourg, 2026; pp. 1–11. Available online: https://ec.europa.eu/eurostat/statistics-explained/SEPDF/cache/11539.pdf (accessed on 1 January 2026).
- Assaad, R.; Selwaness, I.N. Social Protection in Egypt; WIDER Working Paper; The United Nations University World Institute for Development Economics Research: Helsinki, Finland, 2026; Available online: https://www.econstor.eu/handle/10419/339301 (accessed on 1 January 2026).
- Egyptian Electricity Holding Company. Annual Report; Egyptian Electricity Holding Company: Cairo, Egypt, 2024. Available online: http://www.moee.gov.eg/test_new/PDFReports/24-05-2025-154065Arr.pdf (accessed on 1 January 2026).
- Wang, W.; Wang, C. Divergent Urban Ozone Responses to Straw Burning in Northern China from Observational Data: Roles of Meteorology and Photochemistry. Atmosphere 2025, 16, 1296. [Google Scholar] [CrossRef] [Scilit]
- Balasubramanian, S.; Domingo, N.G.G.; Hunt, N.D.; Gittlin, M.; Colgan, K.K.; Marshall, J.D.; Robinson, A.L.; Azevedo, I.M.L.; Thakrar, S.K.; Clark, M.A.; et al. The food we eat, the air we breathe: A review of the fine particulate matter-induced air quality health impacts of the global food system. Environ. Res. Lett. 2021, 16, 103004. [Google Scholar] [CrossRef] [Scilit]
- WHO. Air Quality, Energy Access and Health Science and Policy Summaries: An Introduction; World Health Organization: Geneva, Switzerland, 2025; Available online: https://iris.who.int/server/api/core/bitstreams/b9640be7-586d-48b2-82d7-f78e3dc8ed6c/content (accessed on 1 January 2026).
- IEA. Skills Development and Inclusivity for Clean Energy Transitions; International Energy Agency: Paris, France, 2022. [Google Scholar]
- Ek, H.T.; Singh, J.; Winberg, J.; Brady, M.V.; Clough, Y. Farmers’ motivations to cultivate biomass for energy and implications. Energy Policy 2024, 193, 114295. [Google Scholar] [CrossRef] [Scilit]
- Abdelhady, S.; Borello, D.; Shaban, A. Techno-economic assessment of biomass power plant fed with rice straw: Sensitivity and parametric analysis of the performance and the LCOE. Renew. Energy 2018, 115, 1026–1034. [Google Scholar] [CrossRef] [Scilit]
- Elbasiouny, H.; Elbehiry, F. Rice Production in Egypt: The Challenges of Climate Change and Water Deficiency. In Climate Change Impacts on Agriculture and Food Security in Egypt; Ewis Omran, E.-S., Negm, A.M., Eds.; Springer International Publishing: Cham, Switzerland, 2020; pp. 295–319. ISBN 978-3-030-41629-4. [Google Scholar]
- Shafie, S.M.; Mahlia, T.M.I.; Masjuki, H.H. Life cycle assessment of rice straw co-firing with coal power generation in Malaysia. Energy 2013, 57, 284–294. [Google Scholar] [CrossRef] [Scilit]
- Rahman, M.H.A.; Chen, S.S.; Razak, P.R.A.; Bakar, N.A.A.; Shahrun, M.S.; Zawawi, N.Z.; Mujab, A.A.M.; Abdullah, F.; Jumat, F.; Kamaruzaman, R.; et al. Life cycle assessment in conventional rice farming system: Estimation of greenhouse gas emissions using cradle-to-gate approach. J. Clean. Prod. 2019, 212, 1526–1535. [Google Scholar]
- Ngo, T.T.T.; Ho, V.K.; Tran, S.N.; Duong, V.C.; Nguyen, V.C.; Nguyen, V.H. Quantification of direct and indirect greenhouse gas emissions from rice field cultivation with different rice straw management practices—A study in the autumn-winter season in An Giang Province, Vietnam. J. Vietnam. Environ. 2018, 10, 49–55. [Google Scholar] [CrossRef] [Scilit]
- Alengebawy, A.; Mohamed, B.A.; Ran, Y.; Yang, Y.; Pezzuolo, A.; Samer, M.; Ai, P. A comparative environmental life cycle assessment of rice straw-based bioenergy projects in China. Environ. Res. 2022, 212, 113404. [Google Scholar] [CrossRef] [Scilit]
- Van Nguyen, H.; Nguyen, C.D.; Van Tran, T.; Hau, H.D.; Nguyen, N.T.; Gummert, M. Energy efficiency, greenhouse gas emissions, and cost of rice straw collection in the mekong river delta of vietnam. Field Crops Res. 2016, 198, 16–22. [Google Scholar] [CrossRef] [Scilit]
- Miller, P.; Kumar, A. Development of emission parameters and net energy ratio for renewable diesel from Canola and Camelina. Energy 2013, 58, 426–437. [Google Scholar] [CrossRef] [Scilit]
- Yang, Q.; Han, F.; Chen, Y.; Yang, H.; Chen, H. Greenhouse gas emissions of a biomass-based pyrolysis plant in China. Renew. Sustain. Energy Rev. 2016, 53, 1580–1590. [Google Scholar] [CrossRef] [Scilit]
- Abdelhady, S. Performance and cost evaluation of solar dish power plant: Sensitivity analysis of levelized cost of electricity (LCOE) and net present value (NPV). Renew. Energy 2021, 168, 332–342. [Google Scholar] [CrossRef] [Scilit]
- Abu-Elyazeed, O.S.M.; Nofal, M.; Ibrahim, K.; Yang, J. Co-combustion of RDF and biomass mixture with bituminous coal: A case study of clinker production plant in Egypt. Waste Dispos. Sustain. Energy 2021, 3, 257–266. [Google Scholar] [CrossRef] [Scilit]
- Abdelhady, S.; Borello, D.; Shaban, A.; Rispoli, F. Viability study of biomass power plant fired with rice straw in Egypt. Energy Procedia 2014, 61, 211–215. [Google Scholar] [CrossRef] [Scilit]
- CBI. C.B.I. Electrical Paper Utilities Background Development of Eligibility Criteria Under the Climate Bonds Standard & Certification Scheme Final for Issuance. 2024. Available online: https://www.climatebonds.net/files/documents/Climate-Bonds_Electric-Utilities_Criteria-document_Mar-2024.pdf (accessed on 1 April 2026).
- Adams, S.; Atsu, F.; Klobodu, E.M.; Richmond, L. Electricity transmission, distribution losses and economic growth in South Africa. Heliyon 2020, 6, e05564. [Google Scholar] [CrossRef] [Scilit] [PubMed]
- Ramachandran, S.; Siala, K.; de La Rúa, C.; Massier, T.; Ahmed, A.; Hamacher, T. Life Cycle Climate Change Impact of a Cost-Optimal HVDC Connection to Import Solar Energy from Australia to Singapore. Energies 2021, 14, 7178. [Google Scholar] [CrossRef] [Scilit]
- Li, X.; Li, W.; Dong, Y. Importance of reducing GHG emissions in power transmission and distribution systems. Energy Rep. 2024, 11, 3149–3162. [Google Scholar] [CrossRef] [Scilit]
- Matos, D.; Lassio, J.G.; Garcia, K.C.; Raupp, I.; Medeiros, A.M.; Abreu, J.L.S.; Guimarães, A.P.C. Carbon footprint of electricity transmission: Insights from a Brazilian case study. Carbon Footpr. 2025, 4, 5. [Google Scholar] [CrossRef] [Scilit]
- Abdel-Hameed, A.; Kim, J.; Hyun, J.-H.; Ramadhan, H.H.; Joseph, S.R.; Nandutu, M. Optimization of Electricity Generation Technologies to Reduce Carbon Dioxide Emissions in Egypt. Appl. Sci. 2021, 11, 8788. [Google Scholar] [CrossRef] [Scilit]
- Delivand, M.K.; Barz, M.; Garivait, S. Overall analyses of using rice straw residues for power generation in Thailand—Project feasibility and environmental GHG impacts assessment. J. Sustain. Energy Environ. 2011, 39–46. [Google Scholar]
- Mostafa, N.; Aboelzz, A. Feasibility-sustainability study of power generation using solar energy at an industrial site: A case study from Egypt. Energy Sustain. Soc. 2024, 14, 36. [Google Scholar] [CrossRef] [Scilit]
- Saif, O.; Elazab, R.; Daowd, M. Smart home energy management for sustainable socioeconomic development in Egyptian households. Sci. Rep. 2026, 16, 5654. [Google Scholar] [CrossRef] [Scilit]
- Kawa, A.; Dujak, D. The impact of logistics requirements and adjustments on firm performance: Evidence from wood biomass supply chains. Clean. Logist. Supply Chain 2025, 16, 100243. [Google Scholar] [CrossRef] [Scilit]
- Mostafa, N.; Abdelazim, K.; Grida, M. Using Natural Language Processing and Data Mining for Forecasting Consumer Spending Through Social Media. In Intelligent Systems and Applications; Arai, K., Ed.; IntelliSys 2023, Lecture Notes in Networks and Systems; Springer: Cham, Switzerland, 2024; Volume 825. [Google Scholar] [CrossRef] [Scilit]
- Valipour, M.; Mafakheri, F.; Gagnon, B.; Prinz, R.; Bergström, D.; Brown, M.; Wang, C. Integrating bio-hubs in biomass supply chains: Insights from a systematic literature review. J. Clean. Prod. 2024, 467, 142930. [Google Scholar] [CrossRef] [Scilit]
- Wang, S.; Huang, X.; Yin, C.; Richel, A. A critical review on the key issues and optimization of agricultural residue transportation. Biomass Bioenergy 2021, 146, 105979. [Google Scholar] [CrossRef] [Scilit]
- Ly, A.M.; Cope, M.R. New conceptual model of social sustainability: Review from past concepts and ideas. Int. J. Environ. Res. Public Health 2023, 20, 5350. [Google Scholar] [CrossRef] [Scilit] [PubMed]
- Sánchez, A.; Benveniste, G.; Ferreira, V.J.; Bulfaro, I.; Igualada, L.; Corchero, C. Methodology for social life cycle impact assessment enhanced with gender aspects applied to electric vehicle Li-ion batteries. Int. J. Life Cycle Assess. 2024, 30, 1229–1245. [Google Scholar] [CrossRef] [Scilit]
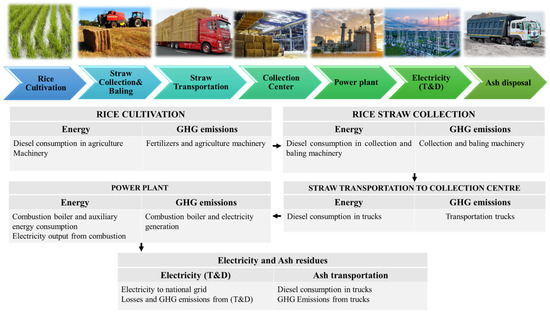
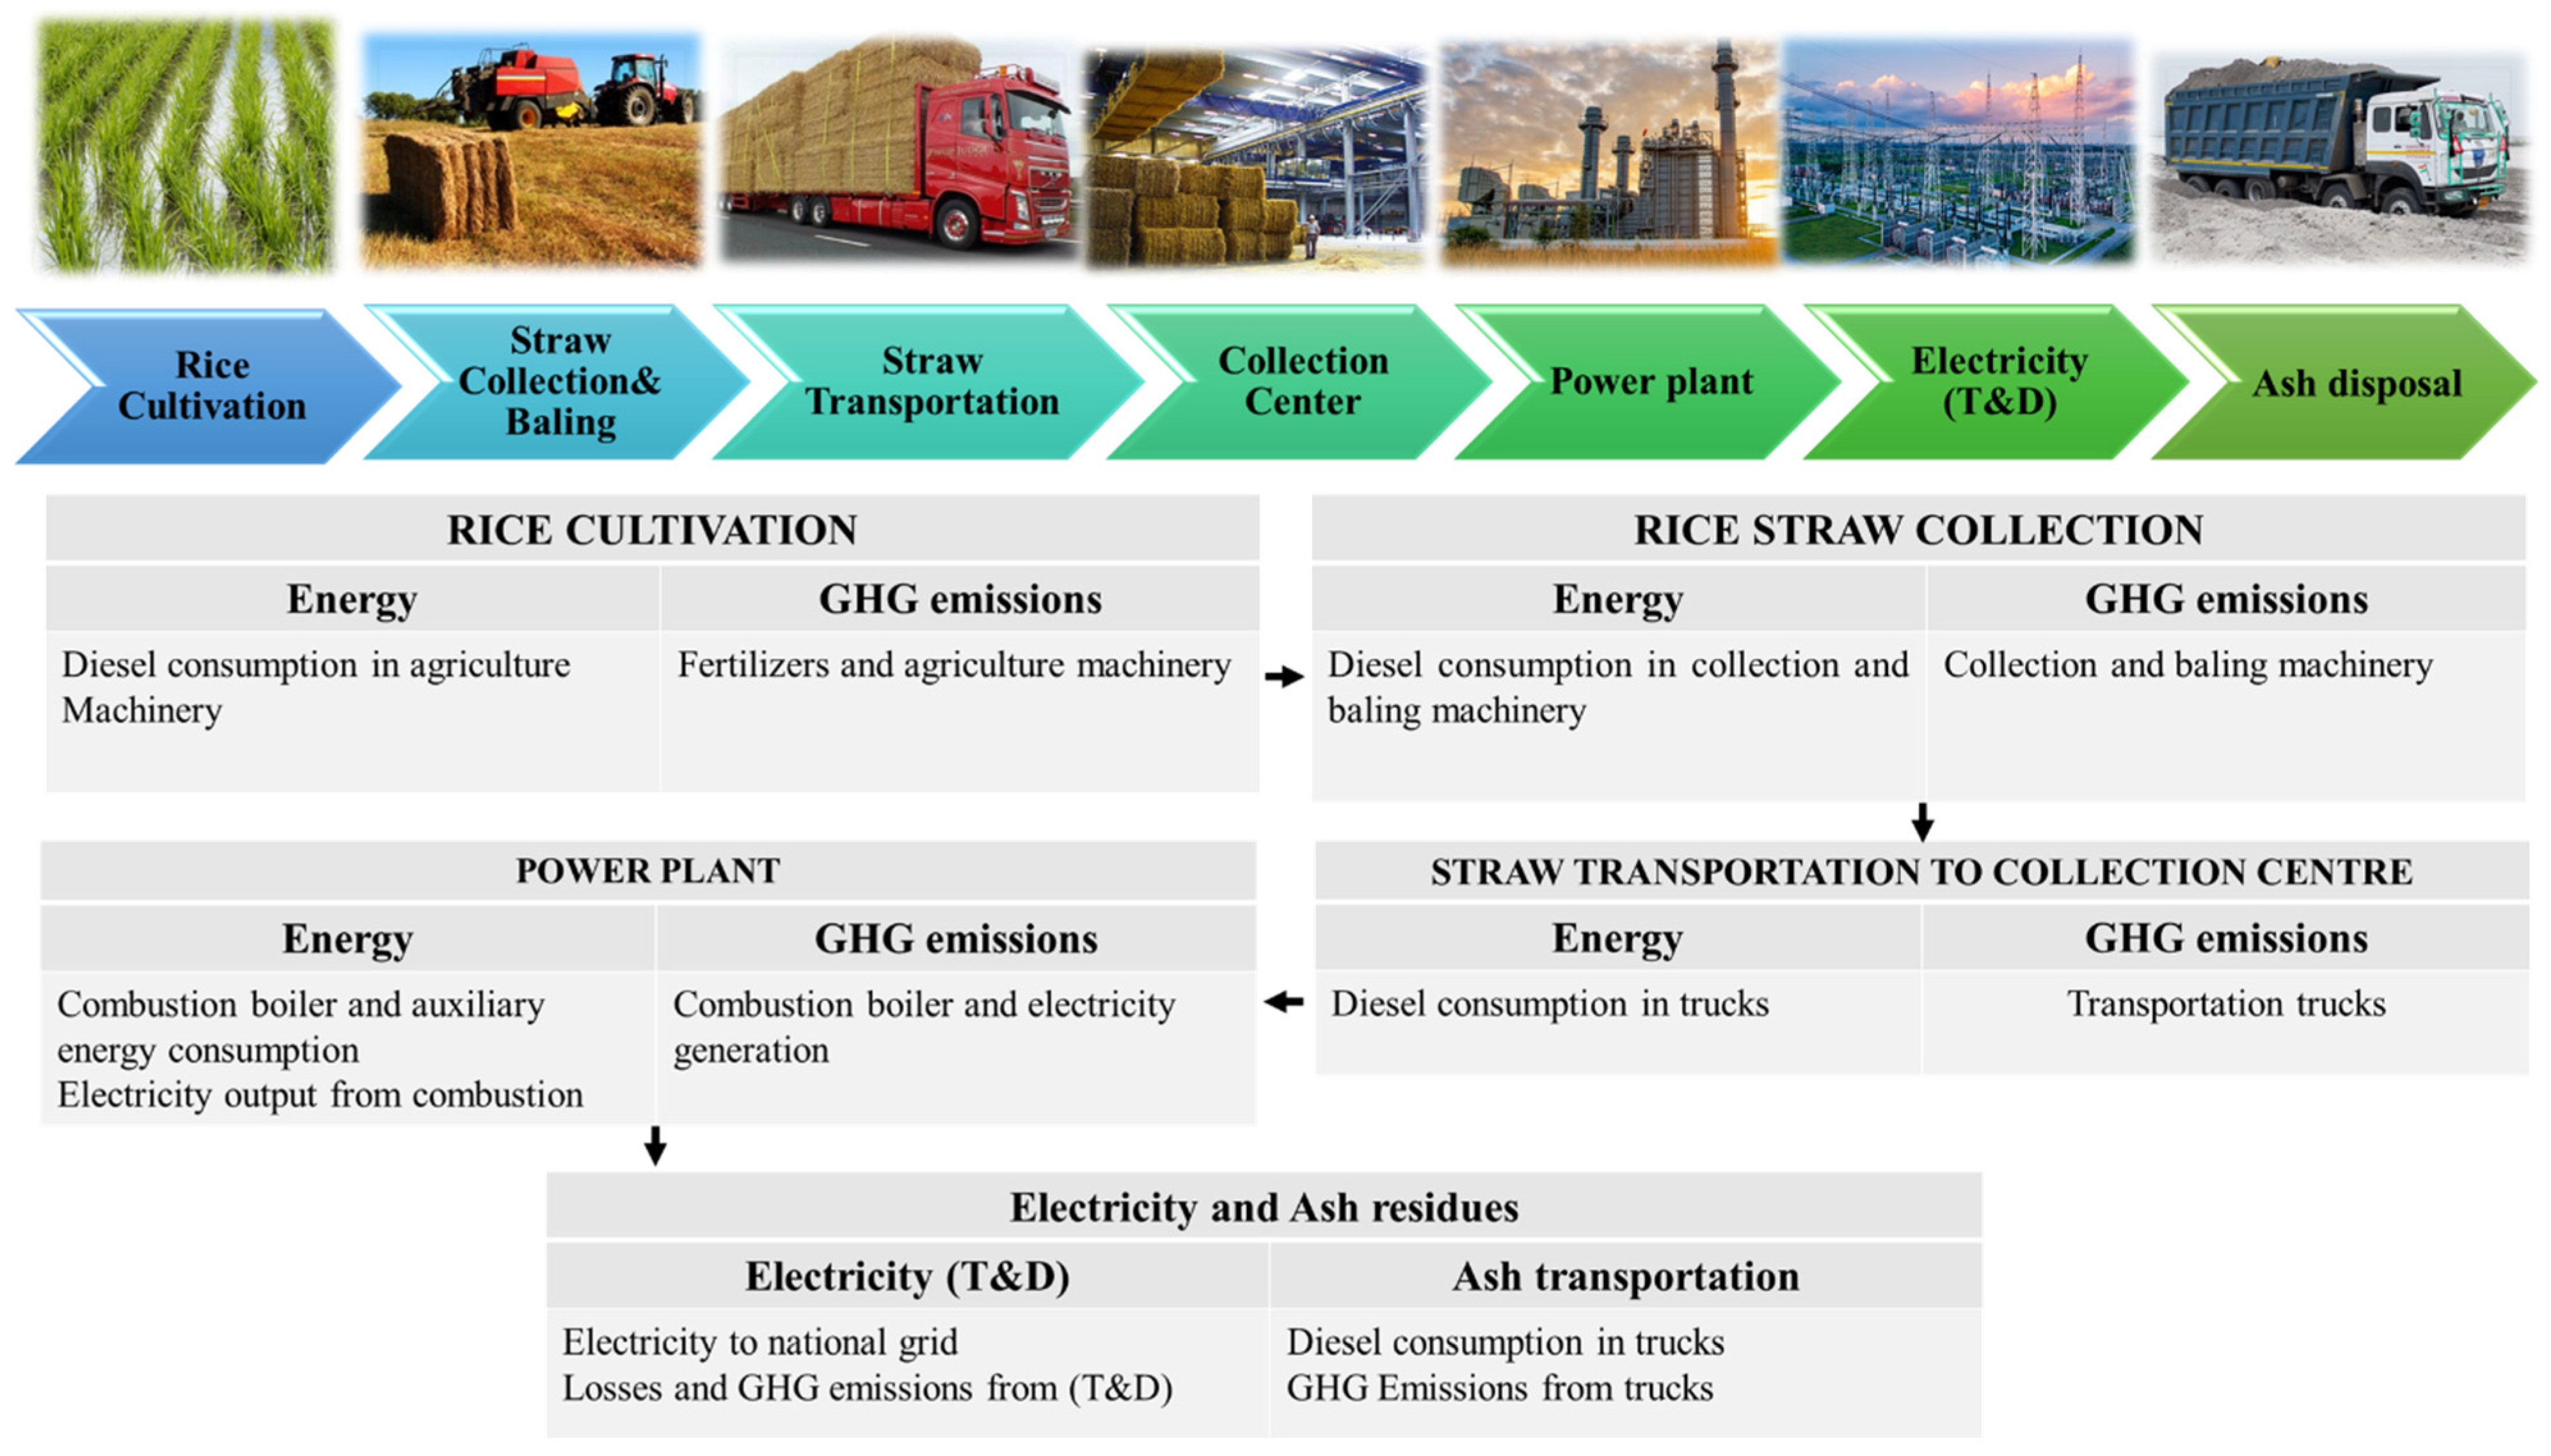
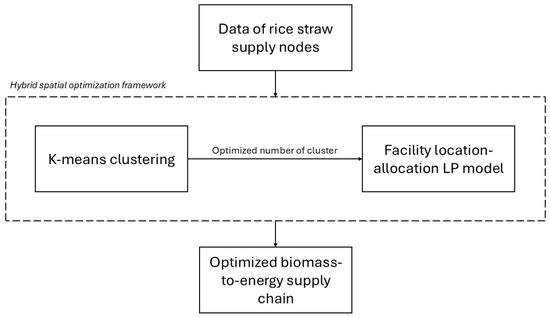
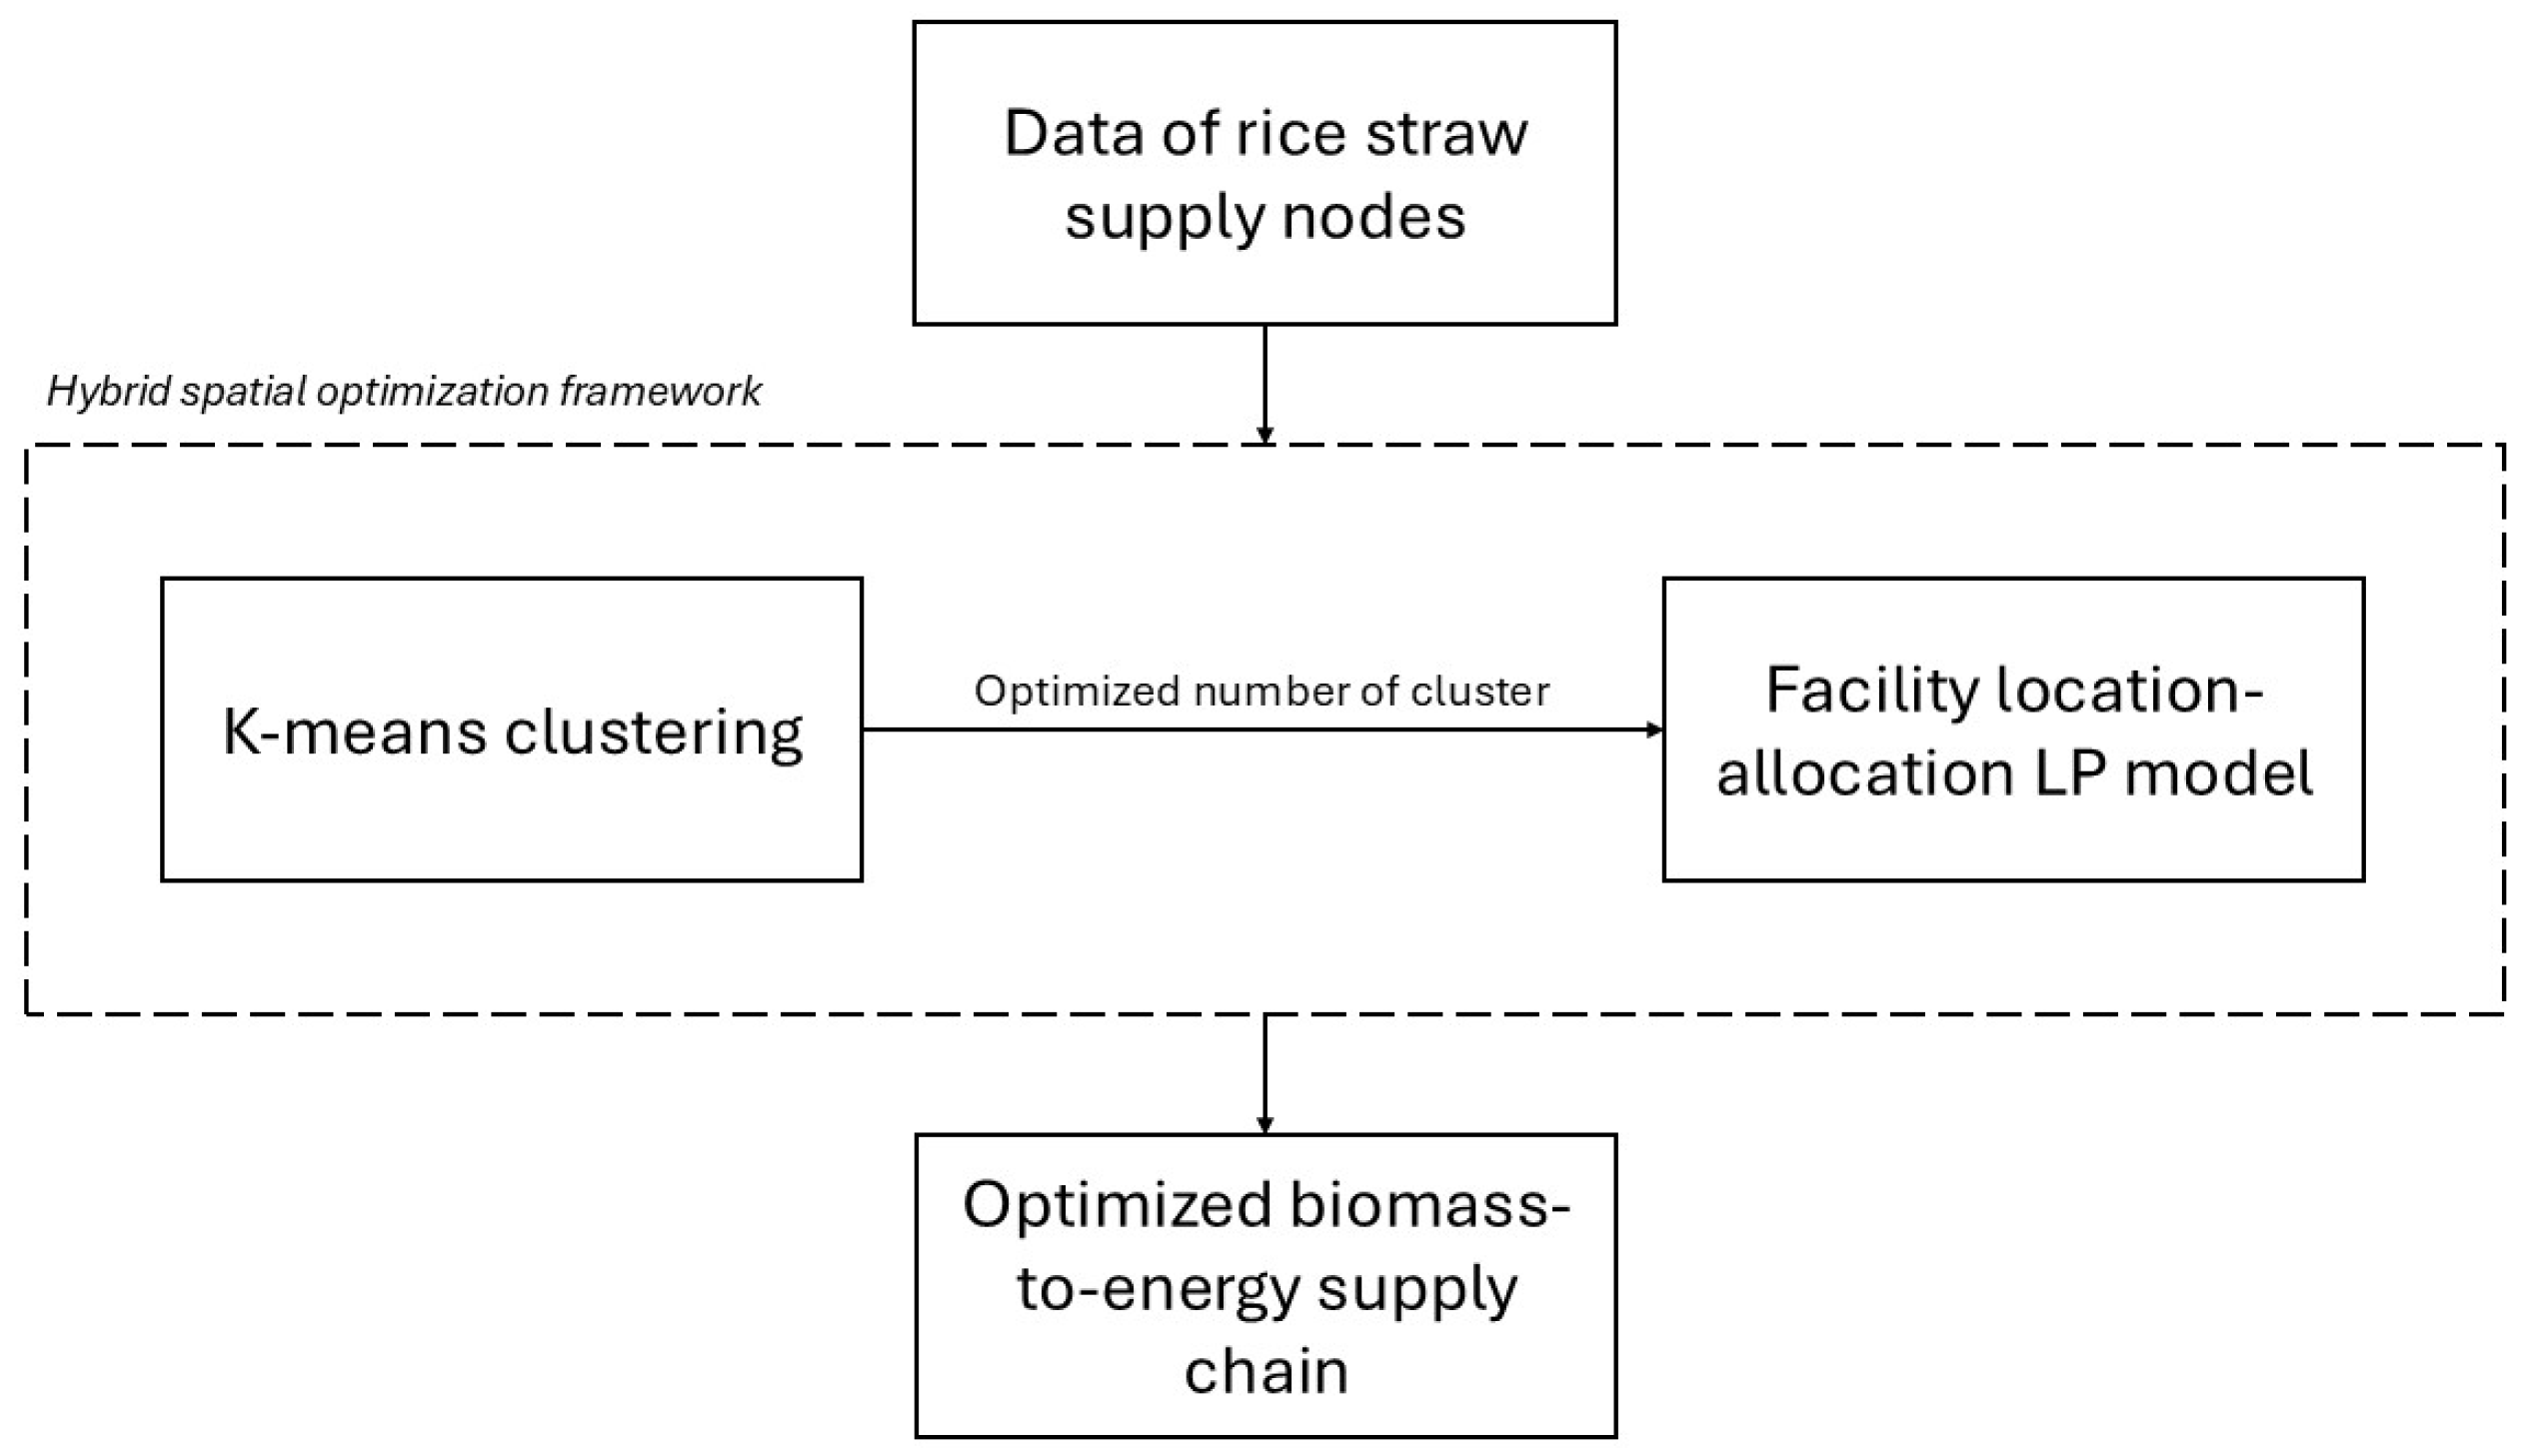
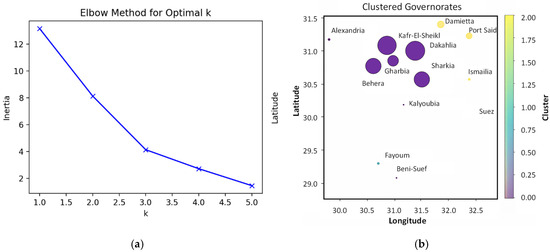
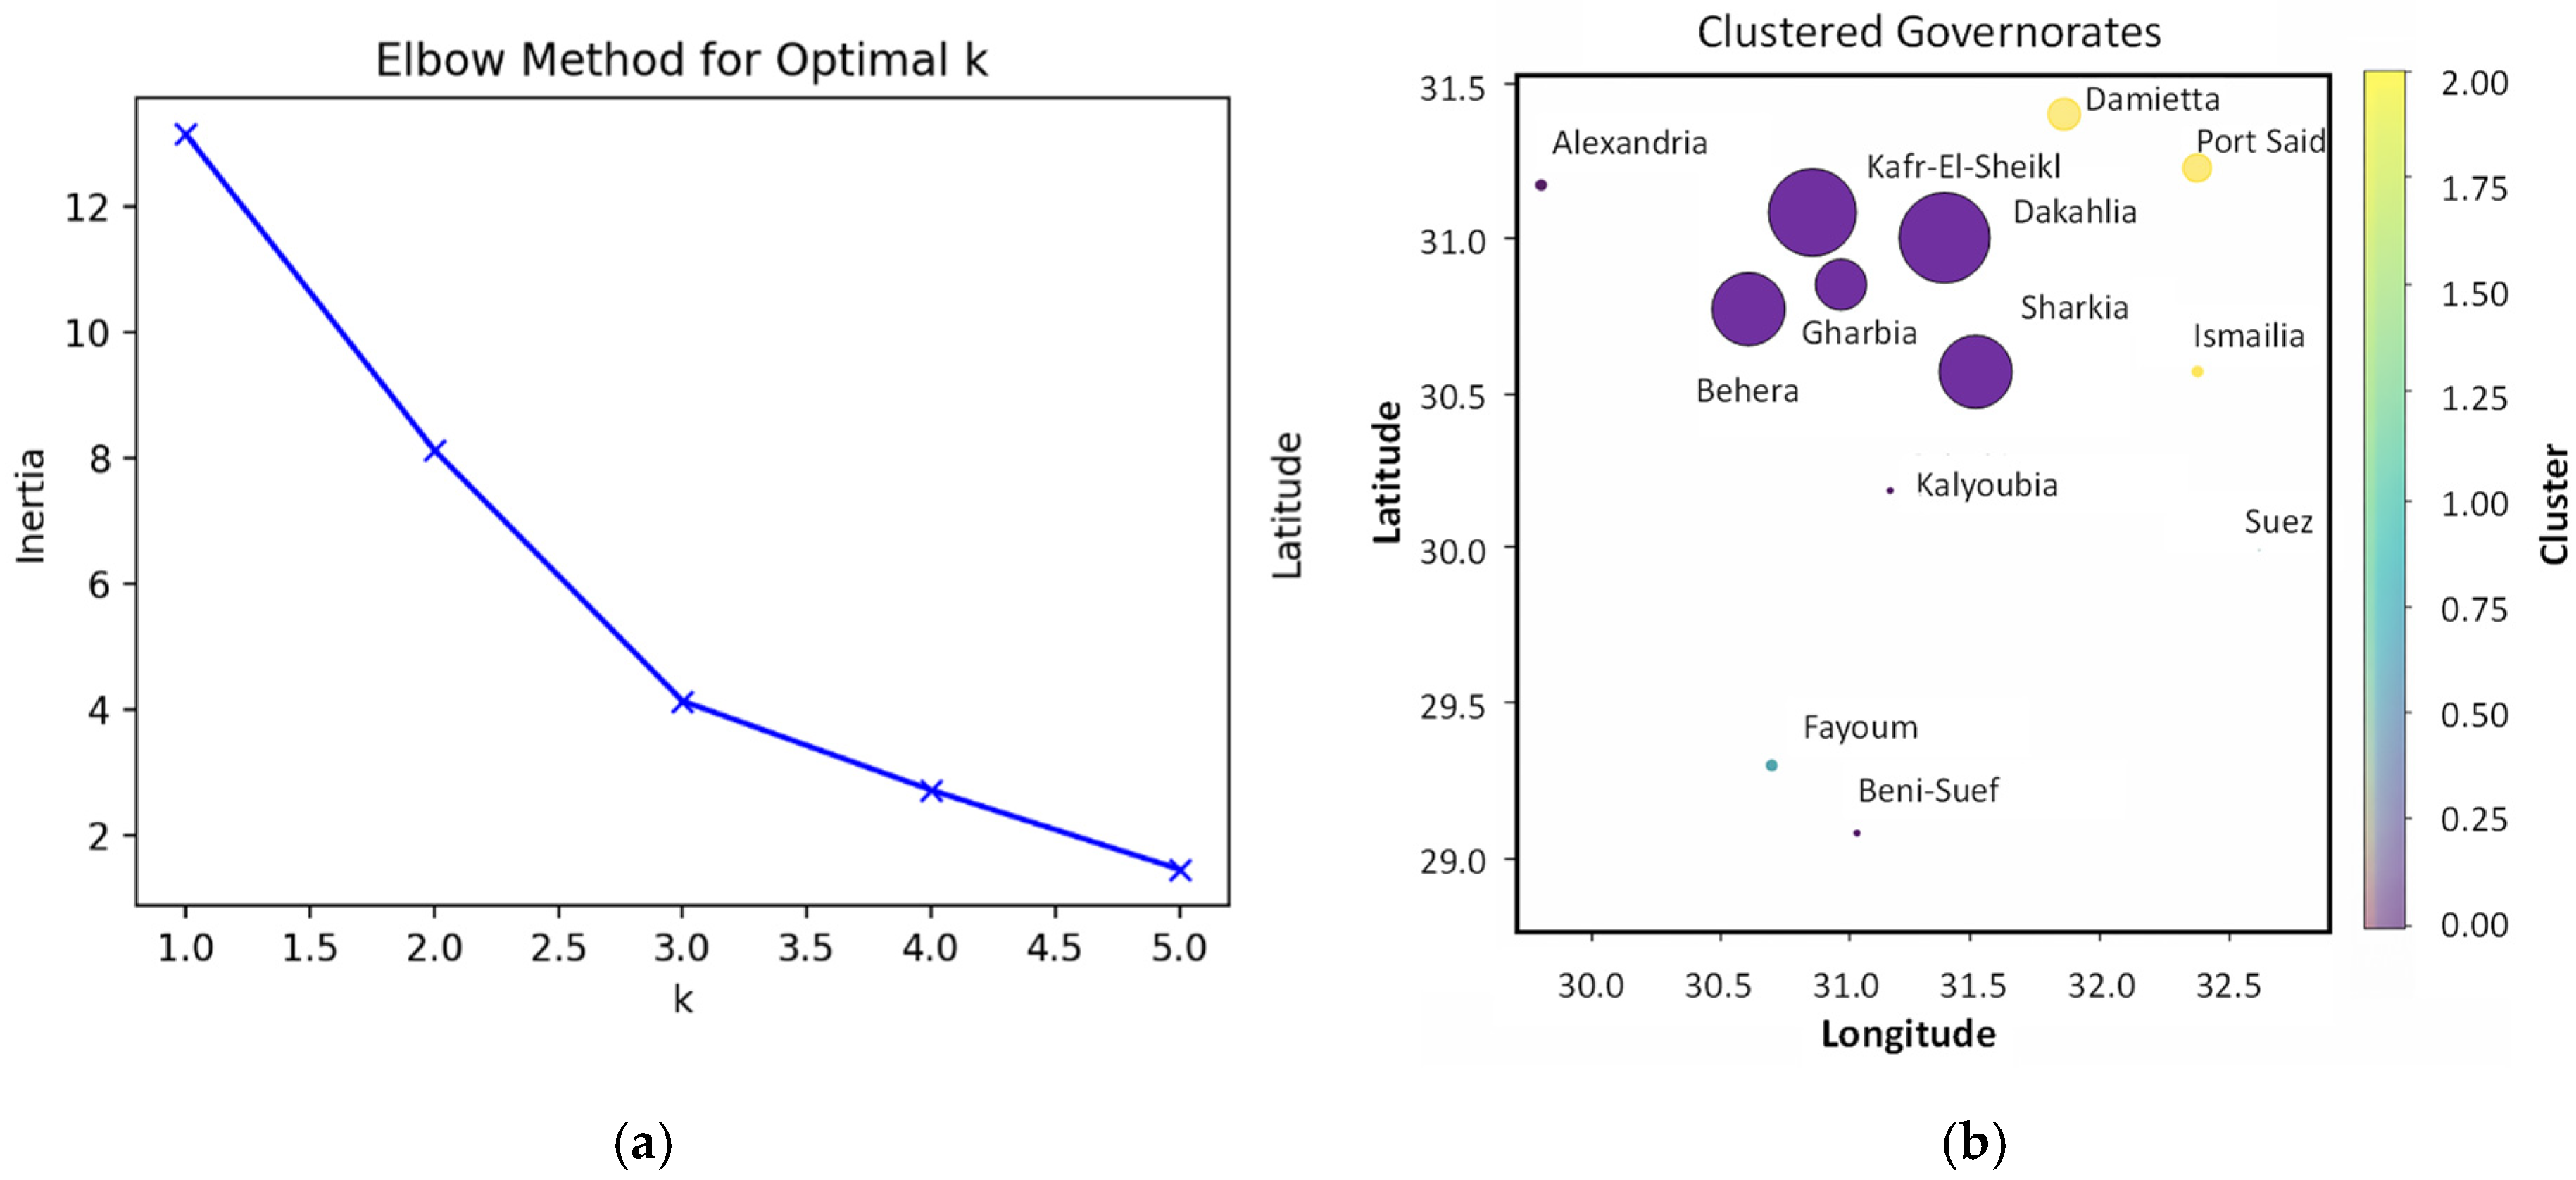
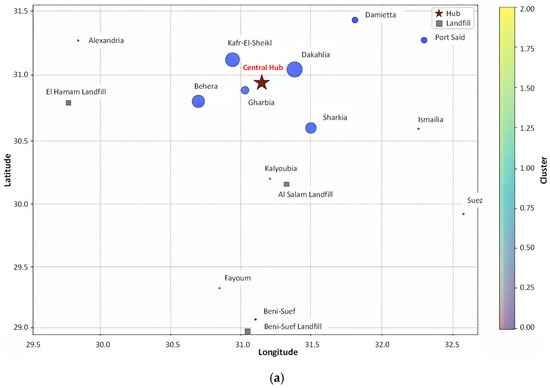
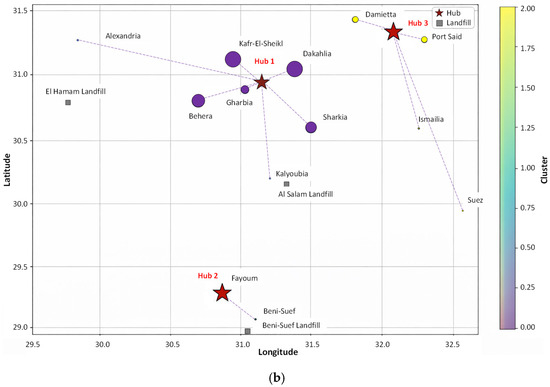
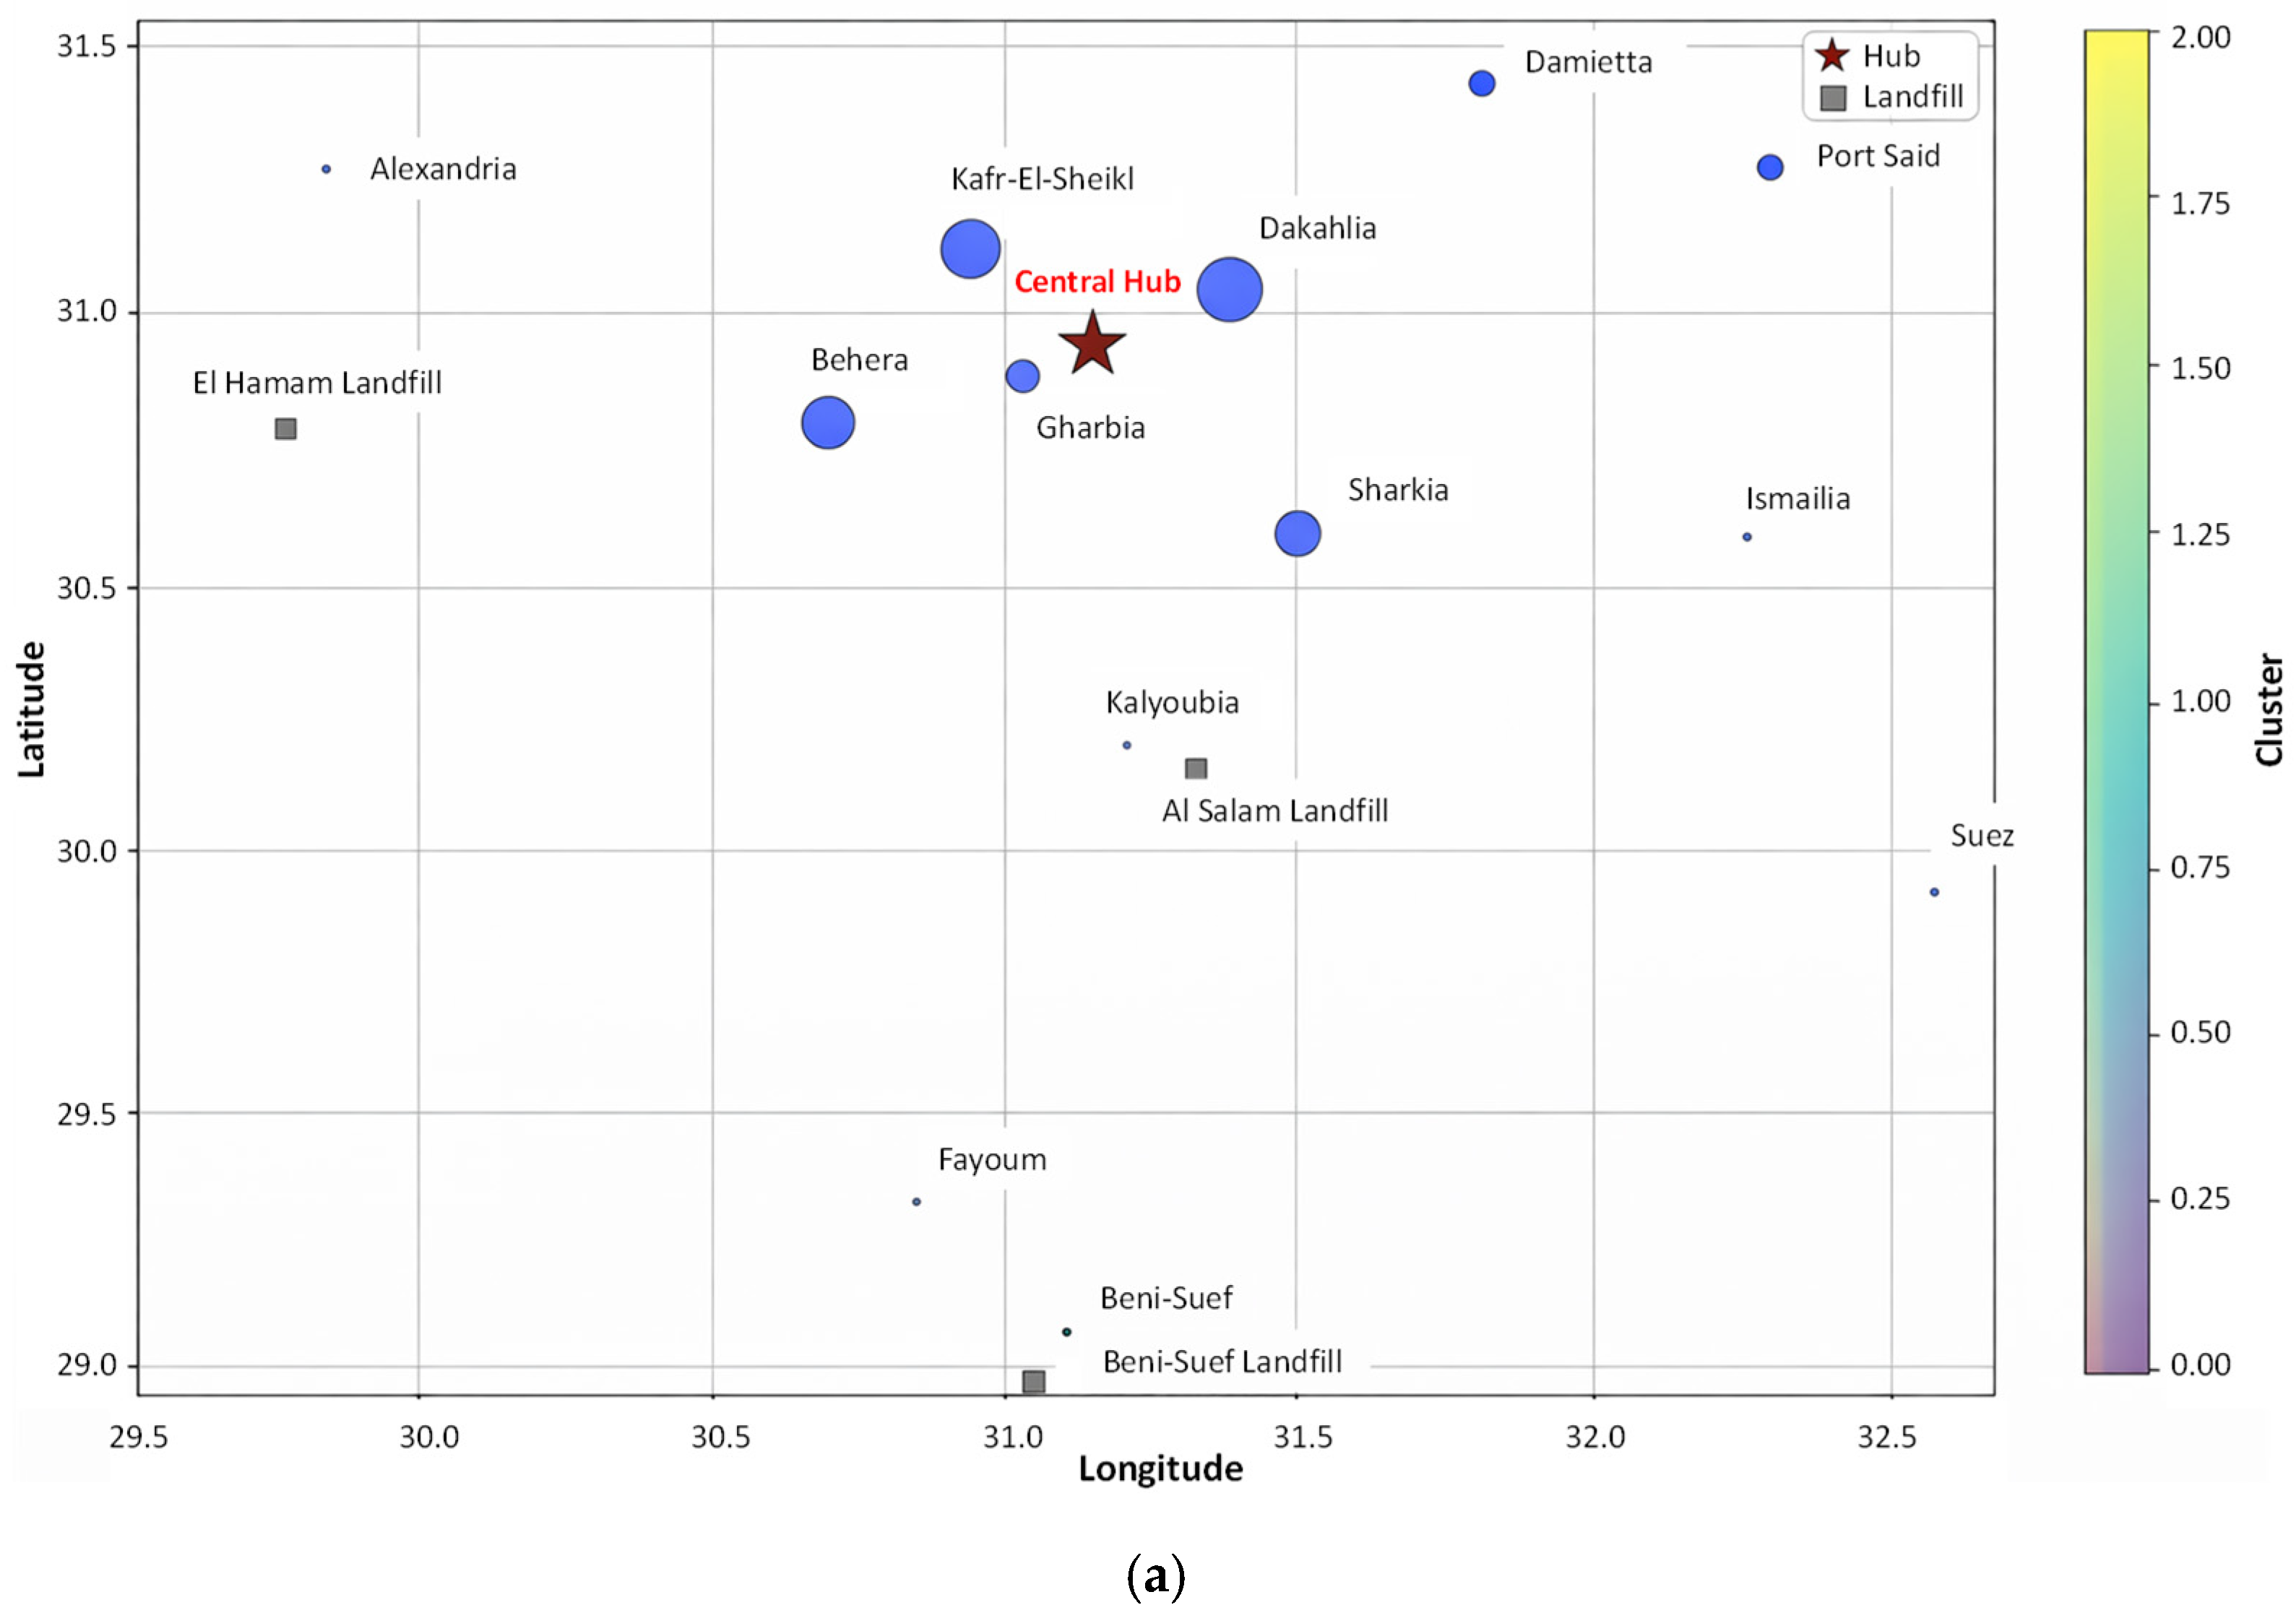
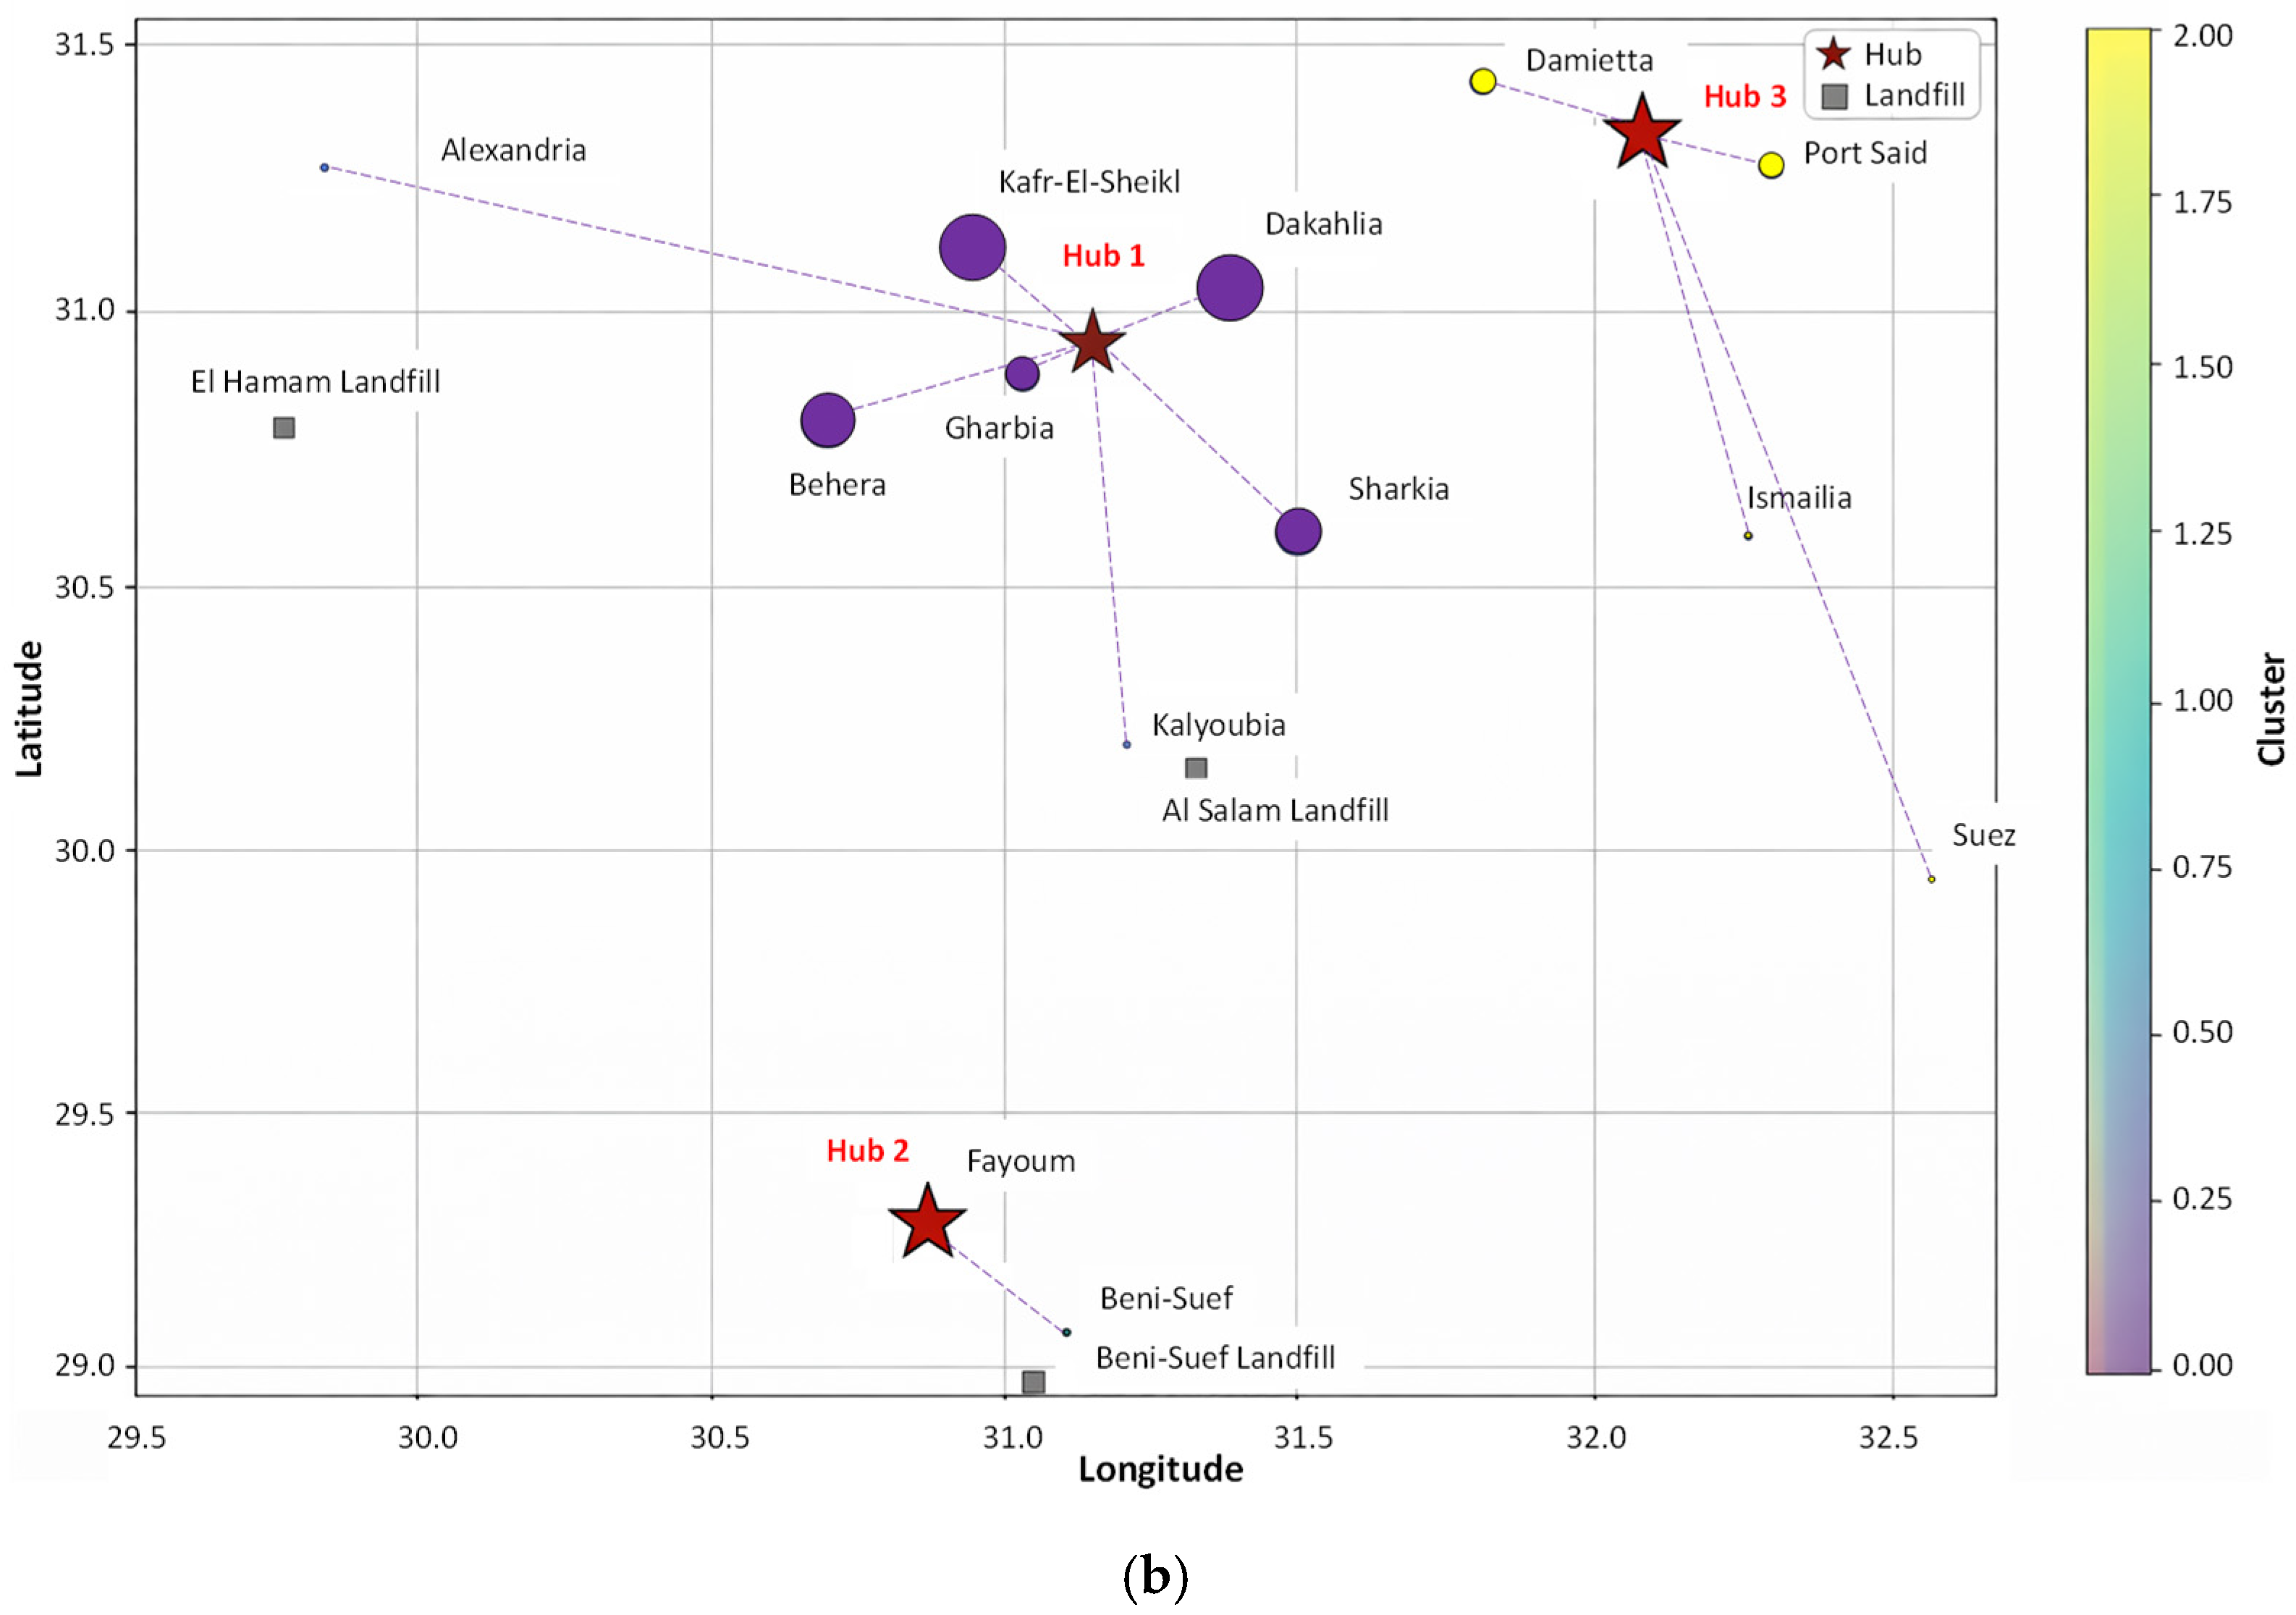
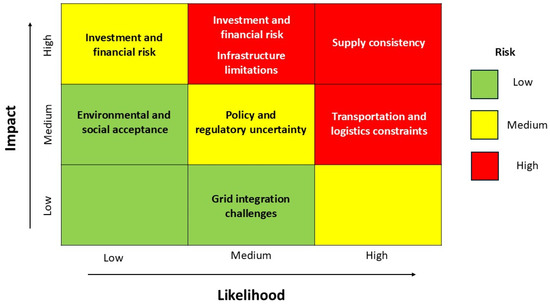
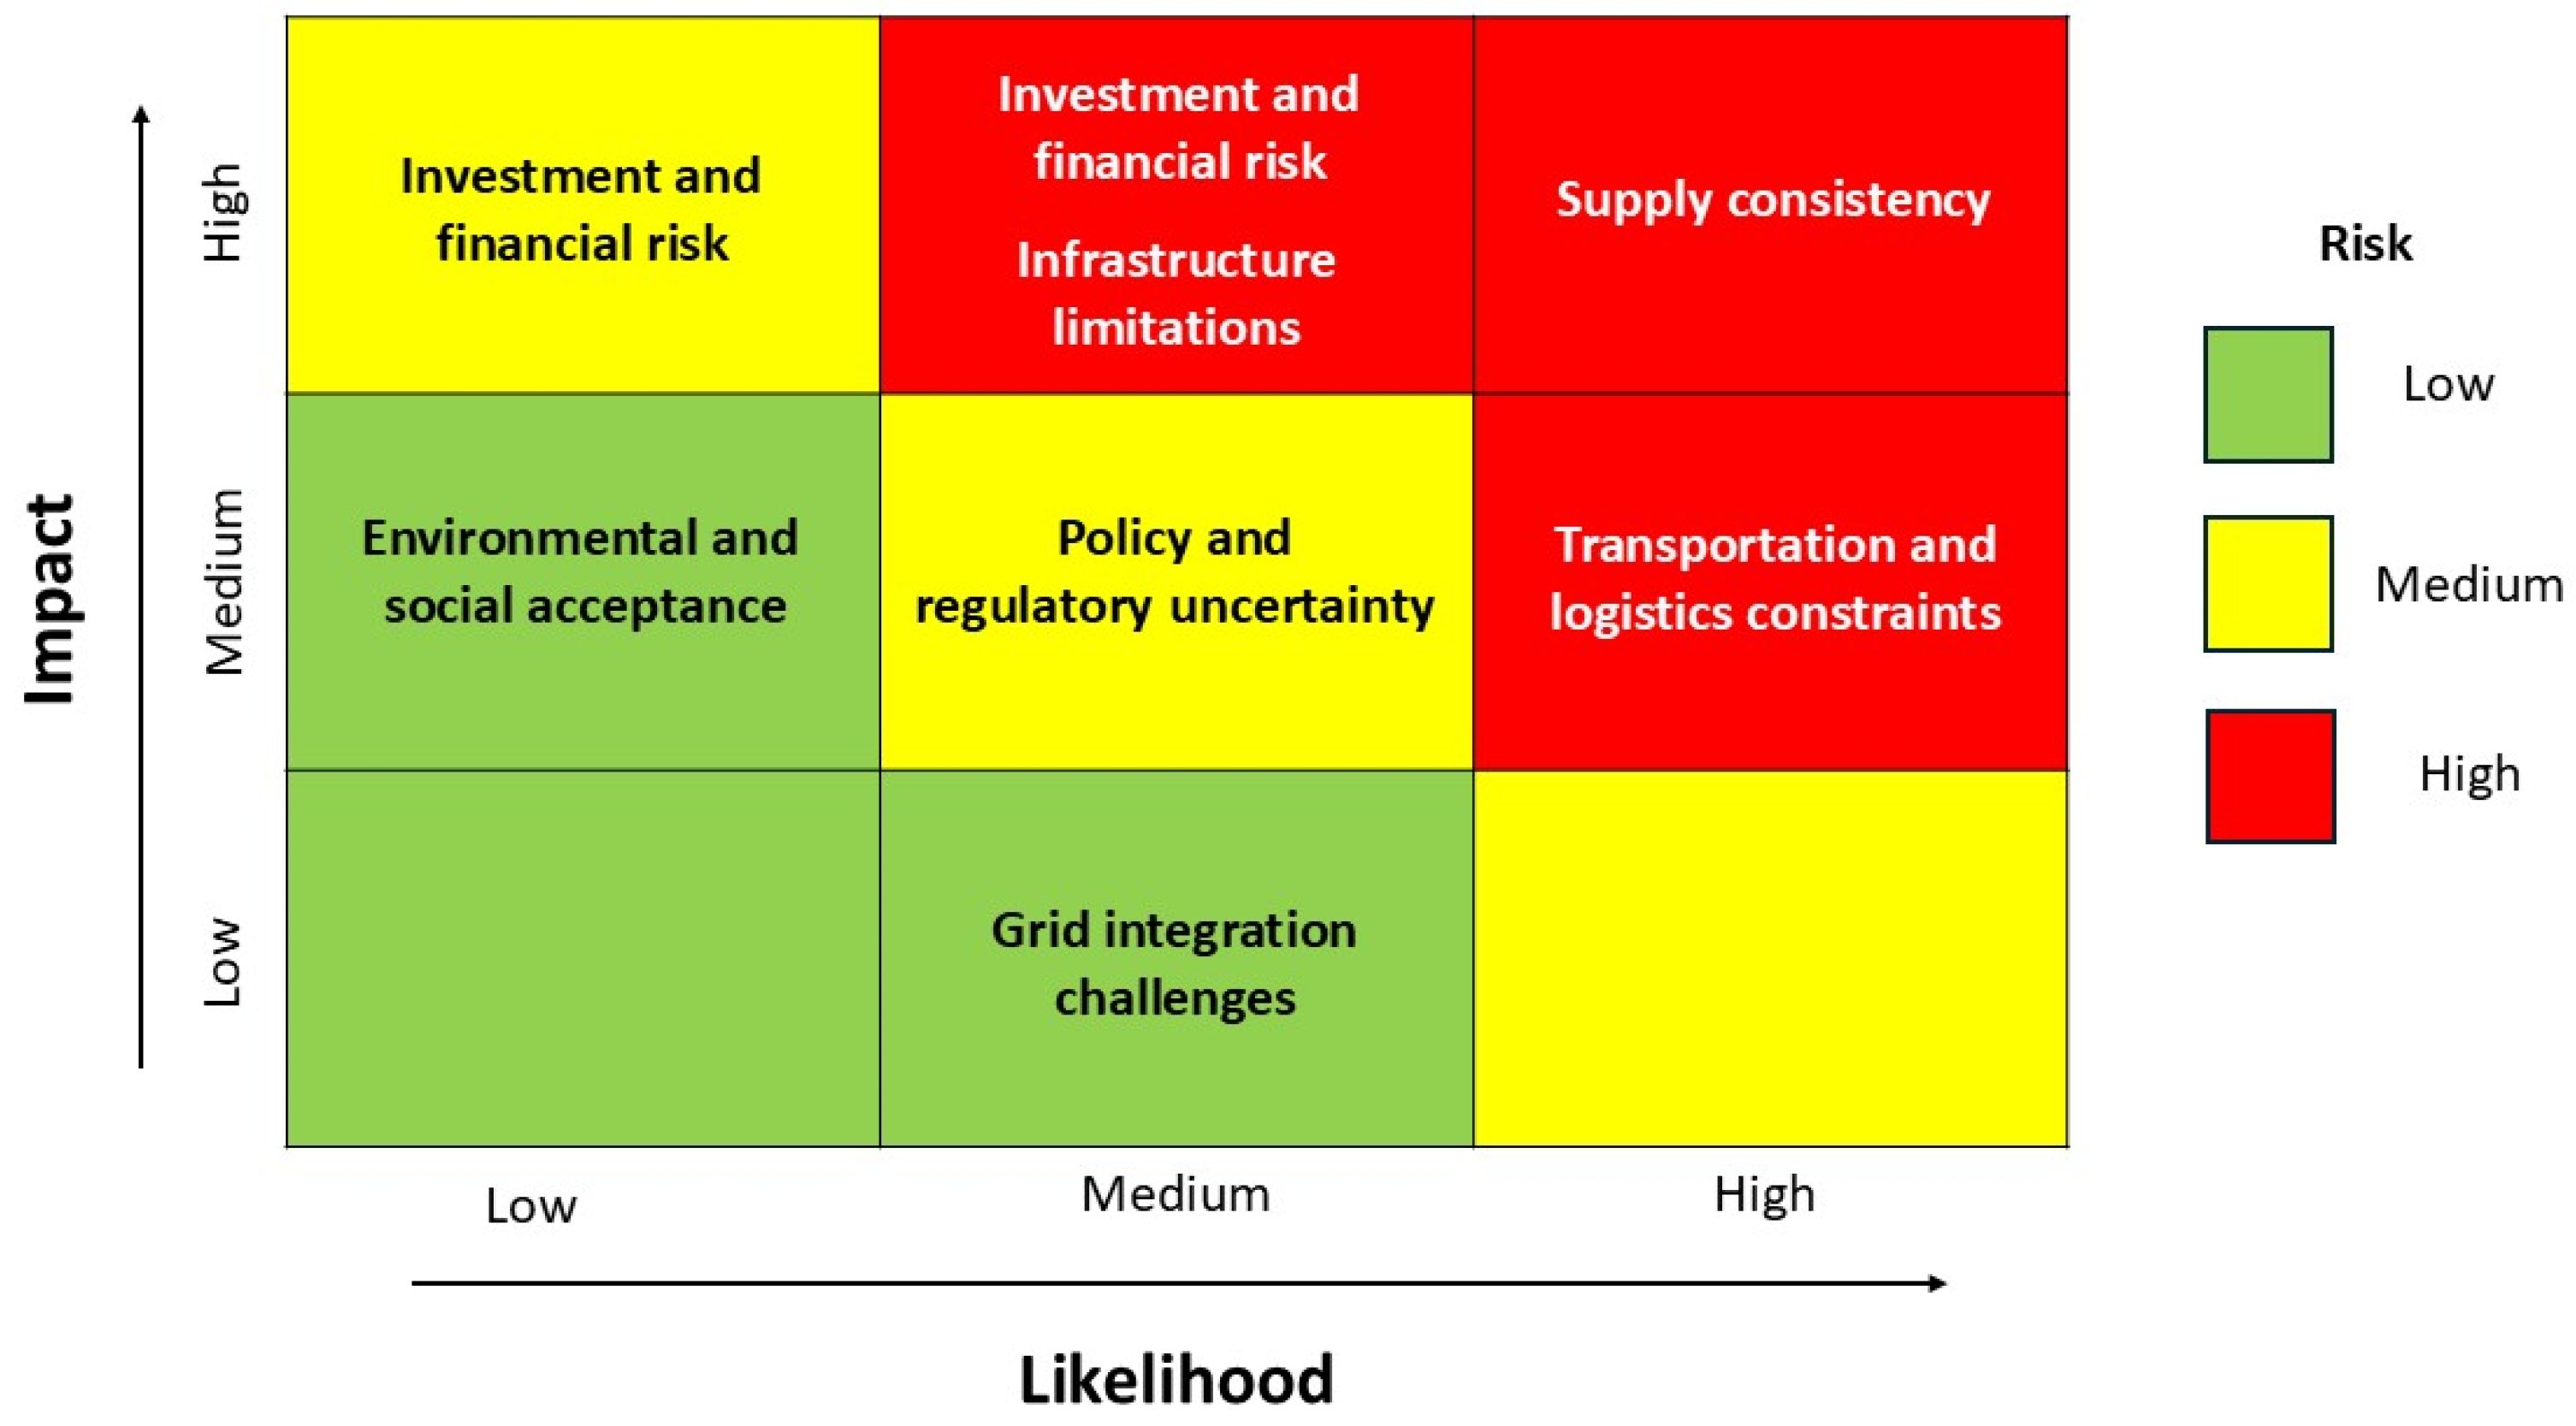

Disclaimer/Publisher’s Note: The statements, opinions and data contained in all publications are solely those of the individual author(s) and contributor(s) and not of MDPI and/or the editor(s). MDPI and/or the editor(s) disclaim responsibility for any injury to people or property resulting from any ideas, methods, instructions or products referred to in the content. |
© 2026 by the authors. Licensee MDPI, Basel, Switzerland. This article is an open access article distributed under the terms and conditions of the Creative Commons Attribution (CC BY) license.