


Abstract
This study evaluates how validation design affects the assessment of photovoltaic (PV) inverter fault prediction under sparse operational event conditions. Using an 89-day dataset from 18 co-located inverters at a single PV plant, minute-level SCADA measurements were transformed into 56-step input windows with 15 min future event labels. Three validation configurations were compared under the same XGBoost-based forecasting task: single-equipment temporal validation, pooled temporal validation, and leave-one-equipment-out (LOEO) validation. The results show that the three configurations provide different interpretations of predictive usefulness. Single-equipment validation achieved a mean PR-AUC of 0.699, pooled temporal validation achieved a PR-AUC of 0.637, and LOEO validation achieved a mean PR-AUC of 0.718 with a mean ROC-AUC of 0.930. Bootstrap confidence intervals confirmed that held-out equipment performance estimates were statistically more stable than in extremely sparse short-window settings; for example, held-out equipment 4 achieved a PR-AUC of 0.734 with a 95% confidence interval of 0.704–0.762. Variable-level permutation importance showed that predictive performance was mainly associated with DC-side voltage/current and selected AC-side electrical variables. These findings demonstrate that validation design is not a secondary implementation detail but a substantive methodological choice in PV predictive-maintenance evaluation. The study provides practical guidance for selecting validation strategies according to deployment scenarios, including asset-specific modeling, shared plant-level prediction, and predictive coverage for unseen or data-limited inverters.
1. Introduction and Related Works
1.1. Background: Operational Reliability and Sustainable PV Energy
Photovoltaic (PV) power generation has become a core technology for low-carbon energy transition, but its sustainability contribution depends on reliable long-term operation as well as installation capacity. Jordan and Kurtz [1] showed that PV degradation rates directly affect lifetime energy yield and long-term system performance. Abdulla et al. [2] further emphasized that operation and maintenance strategies are essential for preserving PV system performance, reducing avoidable losses, and supporting the economic value of solar assets.
Inverters are among the most operationally important components in grid-connected PV systems because they convert DC power from PV modules into grid-compatible AC power. Faults in PV systems can reduce output, interrupt normal operation, and increase maintenance burden. Pillai and Rajasekar [3] reviewed protection challenges and fault diagnosis in PV systems and showed that undetected faults can affect both system reliability and operational safety. Therefore, inverter-level fault prediction should be understood as part of broader PV reliability management rather than as an isolated classification task.
Predictive maintenance has consequently become an important direction in PV asset management. Ahmed et al. [4] reviewed predictive-maintenance approaches for PV systems and highlighted the growing role of data-driven monitoring in improving maintenance planning. Vichare and Gaikwad [5] similarly identified AI-based predictive maintenance as a promising approach for reducing unplanned failures and improving PV system availability. However, applying fault prediction in real operating plants remains difficult because fault-related events are often sparse, unevenly distributed across equipment, and constrained by the structure of available monitoring data.
1.2. Fault Diagnosis and Predictive Maintenance in PV Systems
Fault diagnosis and predictive maintenance for PV systems have been studied across several technical levels, including modules, arrays, strings, inverters, and grid-connected plant operation. Pillai and Rajasekar [3] reviewed protection challenges and fault diagnosis in PV systems, emphasizing that undetected faults can affect system reliability and operation. El-Banby et al. [6] organized PV fault detection techniques and fault types, including conventional detection methods and AI-supported approaches. Osmani et al. [7] further distinguished AC-side and DC-side PV faults and reviewed corresponding detection methods, showing that PV fault diagnosis is a broad and technically diverse research area. Taghezouit et al. [8] focused on model-based fault detection and summarized recent advances in PV monitoring, modeling, and fault-detection strategies.
Recent studies have also demonstrated the growing role of machine learning and deep learning models in PV fault diagnosis. Chen et al. [9] applied random forest learning to PV array fault diagnosis using array voltage and string current features. Amiri et al. [10] similarly developed a random forest-based fault detection and diagnosis procedure for PV systems. Kapucu and Cubukcu [11] proposed a supervised ensemble learning method for PV string fault diagnosis, while Lodhi et al. [12] introduced a deep stack-based ensemble learning approach for PV array fault detection and classification. These studies show that classifier design and feature representation can substantially improve diagnostic performance when fault labels and operating signals are sufficiently available.
Deep learning-based approaches have further expanded the methodological range of PV fault diagnosis. Harrou et al. [13] proposed a variational-autoencoder-based monitoring method for fault detection in grid-connected PV systems. Titouni et al. [14] introduced a hybrid CNN–autoencoder model for accurate and efficient fault diagnosis in grid-connected PV systems. Bougoffa et al. [15] also reported a hybrid deep learning framework for PV fault diagnosis. In addition, Teta et al. [16] used transfer learning and ensemble methods to improve fault diagnosis in grid-connected PV systems.
Although these studies demonstrate that high diagnostic performance is achievable with appropriate data and model design, their primary emphasis is usually on improving the fault-diagnosis algorithm itself. Less attention has been paid to how the validation design and learning unit affect the perceived usefulness of fault prediction under sparse and unevenly distributed operational event conditions. This distinction is important because a PV operator must decide not only which classifier to use, but also whether models should be trained and evaluated at the individual-inverter level, across pooled inverters, or under held-out equipment conditions.
1.3. SCADA-Based and Operational Inverter Studies
A particularly relevant branch of PV fault-prediction research uses SCADA or other operational monitoring streams collected under field conditions. Betti et al. [17] proposed a SCADA-based fault prediction and early-detection method for large PV power plants using self-organizing maps and an operational key performance indicator. Their study is important because it demonstrates that plant-level monitoring data can support early warning beyond purely laboratory or simulated fault settings.
Syamsuddin et al. [18] developed a predictive-maintenance approach for PV systems using SCADA data and machine learning-based anomaly detection. Because their data were not fully labeled for supervised fault classification, the study focused on learning normal operating patterns and identifying deviations as potential anomalies. This highlights a common operational constraint in PV maintenance analytics: field monitoring data are often available, but complete and balanced fault labels are not.
More recent studies have further extended SCADA-based PV monitoring toward industrial and inverter-level applications. Snytko et al. [19] presented a validated industrial SCADA framework for PV fault diagnosis, showing how operational indicators can be used for accelerated diagnosis in practical monitoring environments. Stanchev and Hinov [20] proposed a data-driven reliability assessment framework for PV inverters using SCADA measurements, combining drift analysis, machine learning outputs, and temporal consistency modeling. Francisti et al. [21] developed a machine learning framework for PV inverter output prediction, anomaly detection, and operating-state classification, demonstrating that inverter-level electrical and temporal data can be used for practical monitoring tasks.
These studies confirm that operational PV monitoring streams can support fault prediction, anomaly detection, and reliability assessment. However, most SCADA-based studies emphasize the feasibility of detection or prediction under a particular modeling setup, often using aggregate plant-level evaluation or a single train–test design. Less attention has been paid to whether different learning units—individual inverters, pooled inverter groups, or held-out inverters—lead to different conclusions about model usefulness when fault-related events are sparse and unevenly distributed across equipment. This gap is operationally important because plant operators must decide whether predictive-maintenance models should be trained separately for each inverter or shared across co-located assets.
1.4. Transfer Learning, Cross-Equipment Generalization, and Validation Design
Transfer learning and domain adaptation have increasingly been used to address data deficiency and domain mismatch in fault diagnosis. Guo et al. [22] proposed a domain-specific adaptation network for inverter fault diagnosis that transfers knowledge from simulation data to physical-domain measurements. Their study shows that inverter fault diagnosis can benefit from transfer-oriented learning when labeled physical data are limited or costly to obtain.
Beyond PV and inverter applications, transfer learning has also been examined in broader engineering fault-diagnosis settings. Cho et al. [23] developed a transfer learning-based fault diagnosis approach under data-deficient conditions, demonstrating that source-domain information can be used to improve diagnosis when target-domain data are insufficient. Wang and Gao [24] further showed that cross-domain learning can enhance machine fault diagnosis in manufacturing by transferring learned representations across different machines or operating conditions. More recently, Guo W. et al. [25] applied transfer learning to photovoltaic fault diagnosis, further indicating the relevance of transfer-oriented methods in PV applications.
These studies are relevant because they highlight a general problem that also appears in PV inverter maintenance: a model trained under one data condition may not remain reliable under another. However, the present study does not address transfer learning in the conventional sense of simulation-to-physical transfer, cross-domain adaptation, or source–target model adaptation. Instead, it focuses on a narrower validation-design question in an operational PV plant: when multiple co-located inverters share the same plant environment but differ in event frequency, how do single-equipment temporal validation, pooled temporal validation, and leave-one-equipment-out validation change the assessment of fault-prediction usefulness?
This distinction is important because cross-equipment generalization is not only a modeling issue but also an evaluation issue. A pooled model may appear useful under a temporal split while still failing to demonstrate whether learned patterns transfer to an unseen inverter. Conversely, a held-out-equipment design can reveal whether shared operational patterns are predictive beyond the specific inverter used for training. Therefore, the present study treats leave-one-equipment-out validation not as a transfer learning algorithm but as an evaluation strategy for testing within-plant cross-equipment generalization under sparse-event conditions.
1.5. Event Sparsity, Class Imbalance, and Evaluation Design
Sparse fault prediction is closely related to the broader problem of learning from imbalanced data. He and Garcia [26] described imbalanced learning as a setting in which underrepresented classes and severe class-distribution skews can degrade the performance of standard learning algorithms. Krawczyk [27] further emphasized that imbalanced learning is not only a matter of class ratio, but also involves data-level, algorithm-level, and application-specific challenges. These issues are directly relevant to PV inverter fault prediction because fault-related events usually occupy only a small fraction of the total operational monitoring stream.
Metric selection is also critical under sparse-event conditions. Saito and Rehmsmeier [28] showed that precision–recall analysis is more informative than ROC analysis when evaluating binary classifiers on imbalanced datasets. This is particularly important in PV fault prediction because a model may achieve an apparently acceptable ROC-AUC while still producing low precision for rare fault-related events. Aguiar et al. [29] extended the discussion to imbalanced data streams and highlighted the need for reproducible and carefully designed evaluation frameworks when class scarcity persists over time.
A related issue concerns evaluation design for temporally ordered data. Bergmeir and Benítez [30] examined cross-validation for time-series predictor evaluation and discussed the theoretical concerns caused by temporal dependencies and time-evolving effects. Liu and Zhou [31] similarly showed that cross-validation methods for time-series model selection have both advantages and pitfalls, depending on data characteristics and model structure. These studies indicate that predictive performance cannot be interpreted independently of the validation protocol used to obtain it.
For operational PV inverter forecasting, event sparsity and temporal dependence occur simultaneously. The same model can appear more or less useful depending on whether the evaluation is performed within each inverter over time, across a pooled temporal split, or on an inverter held out entirely from training. Therefore, this study treats validation design as a central object of analysis rather than as a secondary implementation detail. This perspective is necessary because maintenance decisions based on misleading validation results may lead to inappropriate allocation of inspection effort, missed early warnings, or unnecessary maintenance actions.
1.6. Research Gap, Scientific Objective, and Contributions
Based on the literature reviewed above, the present study is positioned at the intersection of PV fault diagnosis, SCADA-based operational monitoring, transfer-oriented robustness, and evaluation under sparse and imbalanced events. Existing studies have demonstrated that data-driven PV fault diagnosis is technically feasible and that operational monitoring streams can support predictive maintenance. However, the literature has paid less attention to how the choice of validation design and learning unit changes the perceived usefulness of inverter fault prediction when fault-related events are sparse and unevenly distributed across equipment.
The scientific objective of this study is therefore to determine how different validation configurations affect the assessment of PV inverter fault-prediction capability under sparse operational event conditions. Rather than proposing a new classifier architecture, this study focuses on a practical evaluation question faced by PV operators: should fault-prediction models be evaluated using equipment-specific temporal validation, pooled temporal validation, or held-out-equipment validation when multiple inverters operate within the same plant but exhibit different event frequencies?
To address this objective, this study uses an 89-day operational dataset from 18 co-located inverters at a single PV plant. Minute-level inverter measurements are transformed into supervised forecasting samples using 56-step input windows, 14 operational variables, and a 15 min future event horizon. Three validation configurations are compared under the same forecasting target and model specification: (i) single-equipment temporal validation, (ii) pooled temporal validation, and (iii) leave-one-equipment-out (LOEO) validation.
The contributions of this study are threefold. First, it provides operational evidence on how sparse and uneven event support differs across co-located PV inverters and how this affects predictive evaluation. Second, it compares three validation configurations to show that they answer different operational questions rather than serving as interchangeable performance tests. Third, it strengthens the reliability and interpretability of the evaluation by reporting bootstrap confidence intervals and feature-importance analysis, thereby linking predictive performance to transferable electrical operating patterns.
The study should therefore be interpreted as a controlled within-plant operational evaluation, not as a universal claim about all PV plants, climates, or inverter fleets. Its main contribution is to show that validation design is itself a critical component of PV fault-prediction assessment, especially when maintenance decisions must be made under sparse-event conditions.
The remainder of this paper is organized as follows. Section 2 describes the operational dataset, forecasting target, validation configurations, model specification, and evaluation metrics. Section 3 presents the event-sparsity analysis, validation results, confidence-interval analysis, and interpretability results. Section 4 discusses the implications of the findings for sustainable PV operation and predictive-maintenance design. Section 5 summarizes the main scientific and practical conclusions and outlines future research directions.
2. Materials and Methods
2.1. Overall Analytical Workflow
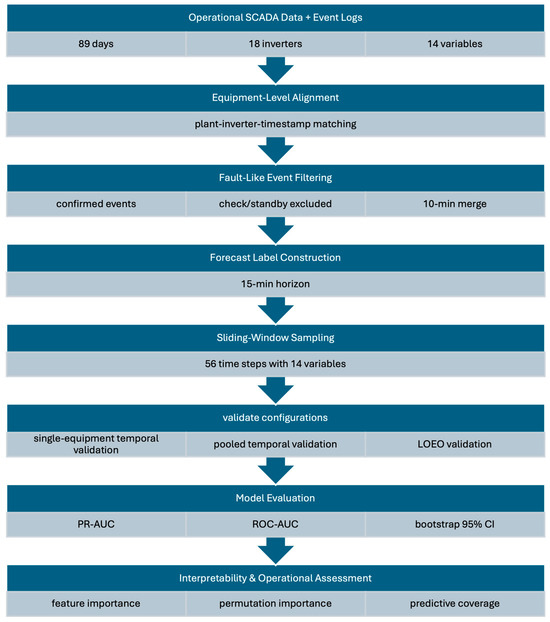
To evaluate how validation design affects PV inverter fault prediction under sparse operational event conditions, the analytical workflow was organized into five stages. The procedure was designed to ensure that data alignment, label construction, sliding-window sampling, model evaluation, and interpretability analysis were applied consistently across all validation configurations.
First, minute-level SCADA measurements and inverter-specific event records were collected from a single PV plant and aligned by plant identifier, inverter identifier, and timestamp. The dataset covered an 89-day operating period and included 18 co-located inverters for which both operational snapshots and event logs were available. Because the objective of this study is to evaluate within-plant validation behavior rather than cross-plant deployment, all analyses were conducted within this controlled single-plant setting.
Second, confirmed fault-like event records were used to construct the forecasting labels. Non-fault operational states such as check and standby records were excluded from the main label definition. Closely repeated event records were merged using a predefined temporal gap to avoid counting one continuous abnormal episode as multiple independent events. For each snapshot timestamp, future event labels were assigned over a 15 min prediction horizon and then aggregated into a binary target indicating whether at least one fault-like event occurred within the horizon.
Third, the aligned time series were converted into supervised learning samples using fixed-length sliding windows. Each sample consisted of a 56-step historical input sequence with 14 operational variables and a corresponding 15 min future event label. The resulting dataset was audited by inverter to quantify sample size, positive-event support, and event-rate heterogeneity before formal model evaluation.
Fourth, three validation configurations were applied to the same forecasting target and feature representation: single-equipment temporal validation, pooled temporal validation, and leave-one-equipment-out (LOEO) validation. These configurations were selected because they answer different operational questions: whether each inverter can support its own temporal model, whether a pooled plant-level model is useful under temporal holdout, and whether learned patterns transfer to an inverter excluded from training.
Finally, model performance and reliability were evaluated using PR-AUC, ROC-AUC, and bootstrap confidence intervals. To address model behavior and practical interpretability, XGBoost gain-based feature importance and grouped permutation importance were also computed. This final stage was added to examine whether predictive performance was associated with meaningful electrical operating variables rather than only aggregate performance scores.
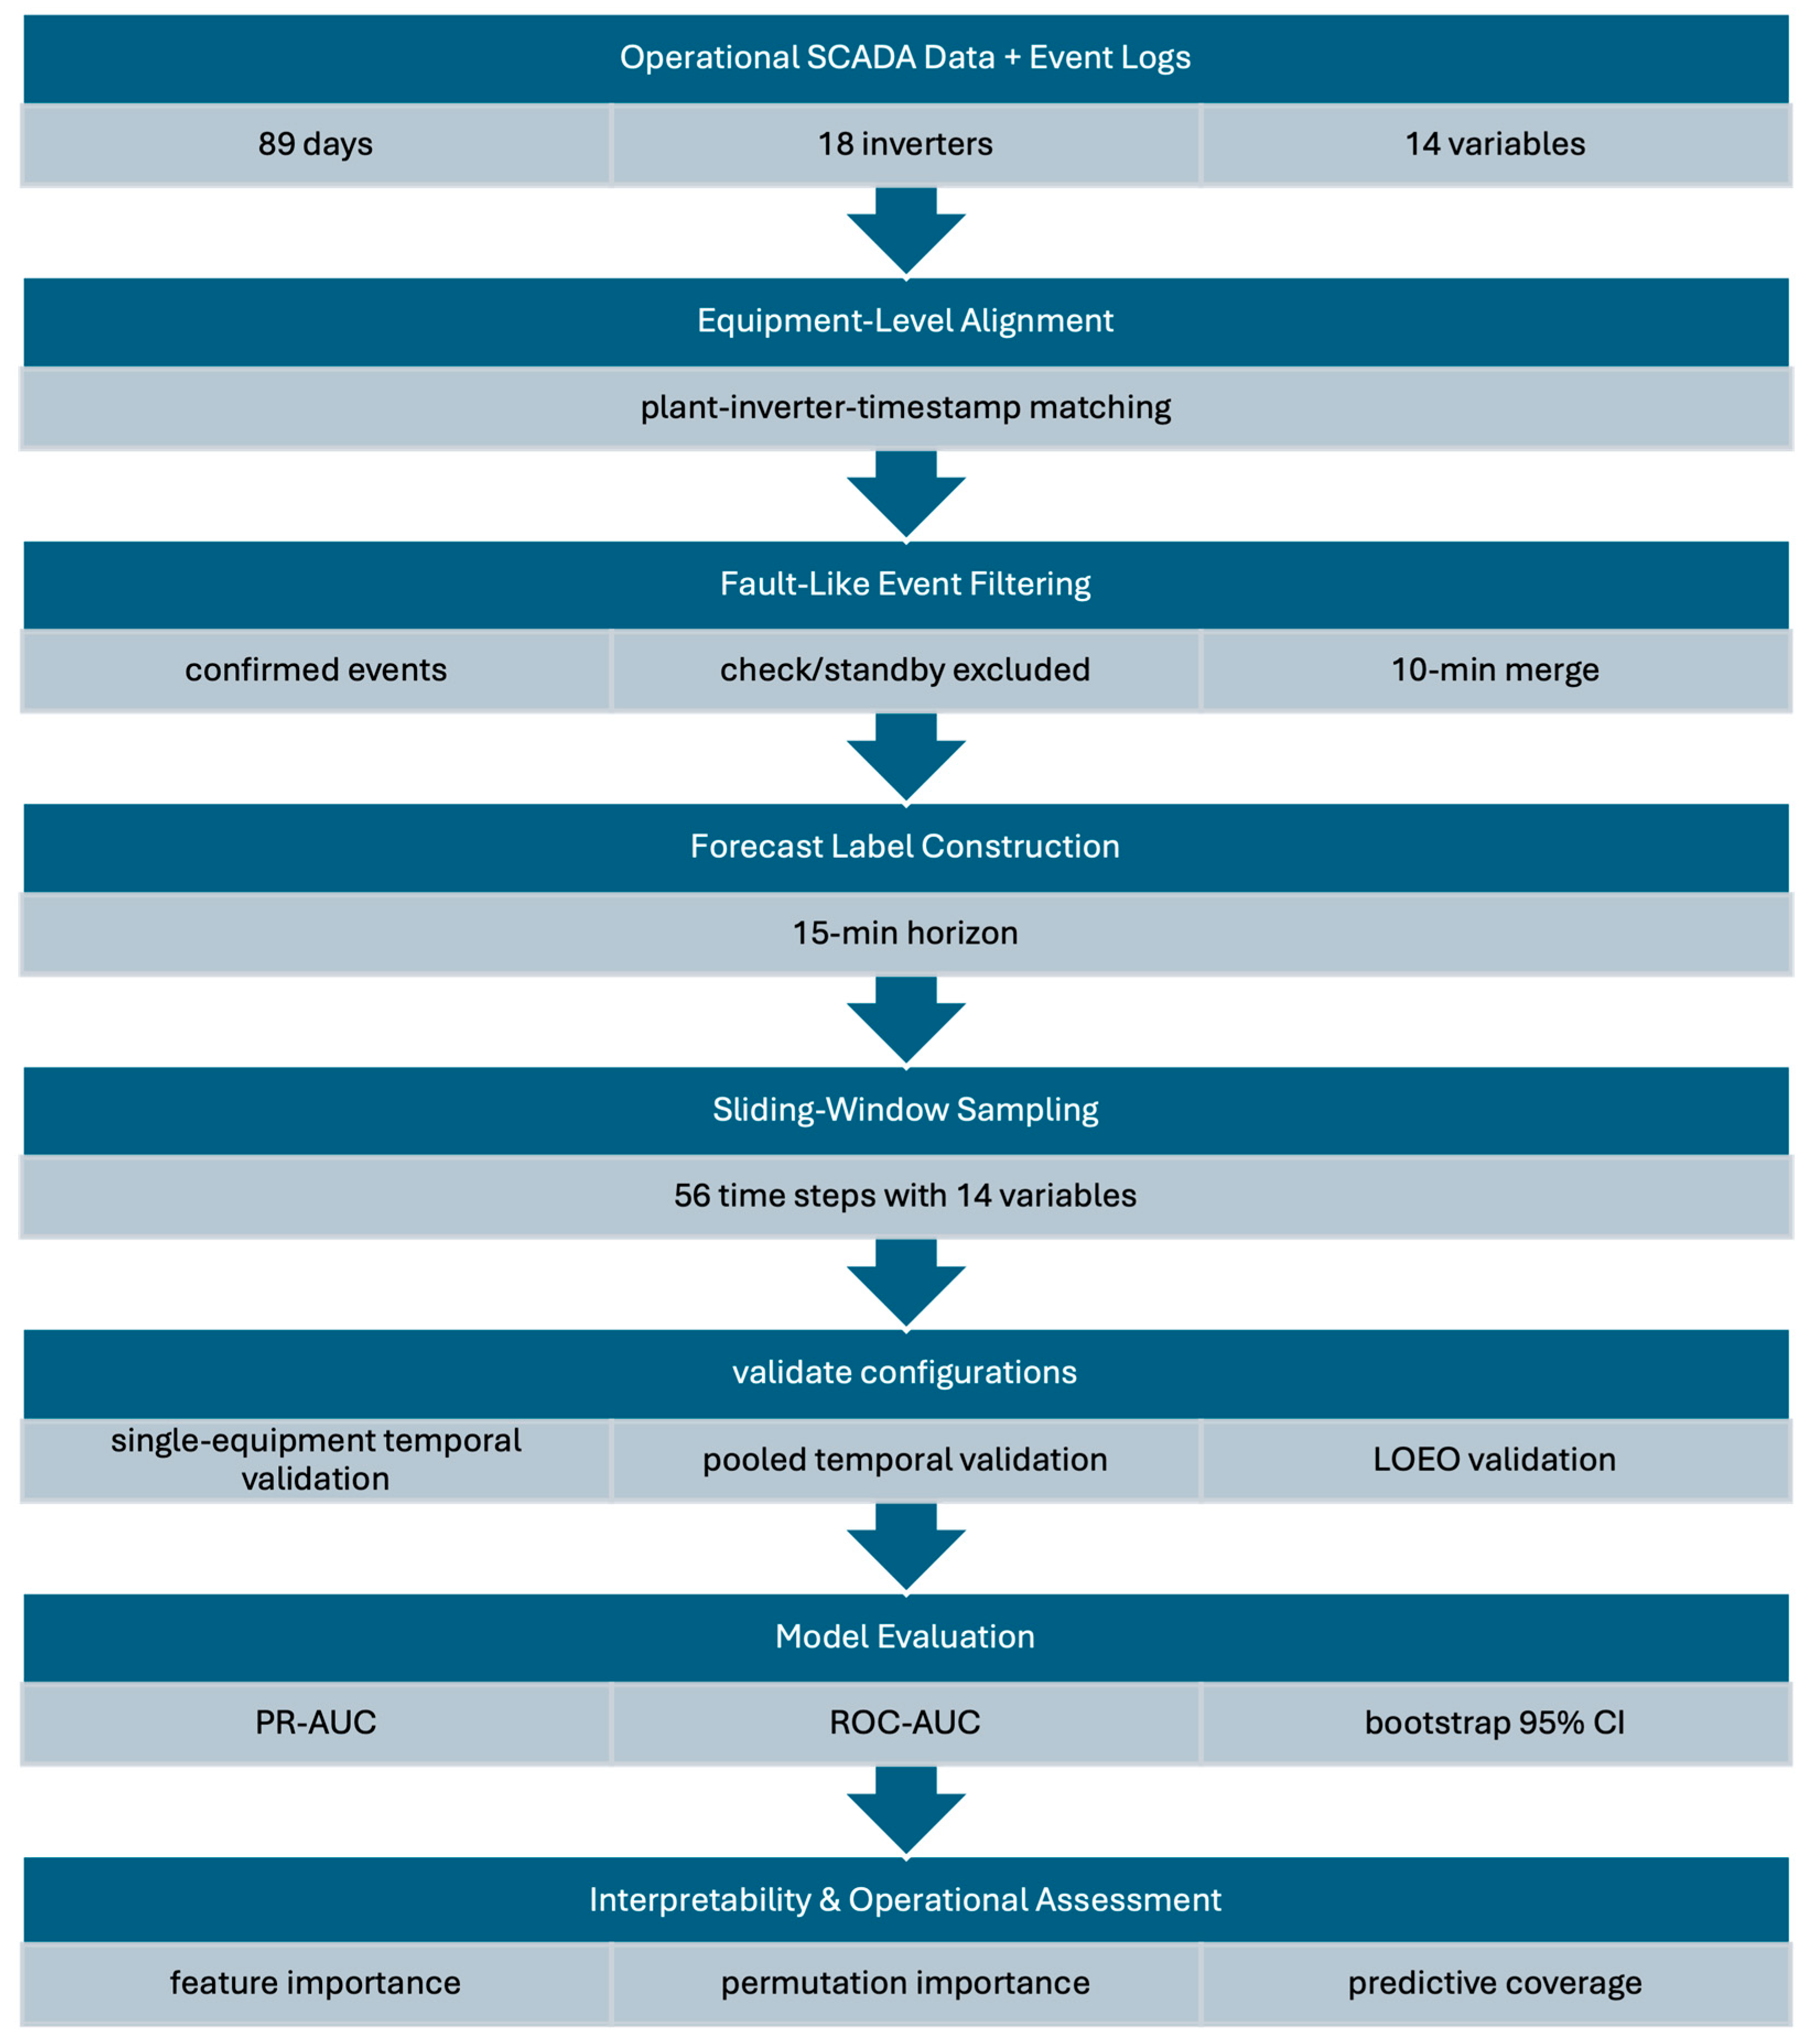
The full workflow can therefore be summarized as follows: SCADA snapshots and event logs were aligned; confirmed fault-like events were filtered and merged; 15 min future labels were constructed; 56-step sliding-window samples were generated; three validation configurations were compared; and the resulting performance was assessed using discrimination metrics, confidence intervals, and feature-importance analysis. A schematic flow chart of this procedure is presented in Figure 1.
Figure 1.
Analytical workflow for PV inverter fault prediction under sparse operational event conditions. Minute-level SCADA data and inverter-specific event logs were aligned by equipment and timestamp. Confirmed fault-like events were filtered and merged, 15 min future labels were constructed, and 56-step sliding-window samples were generated. Three validation configurations were then evaluated using PR-AUC, ROC-AUC, bootstrap confidence intervals, and feature-importance analysis.
2.2. Forecasting Target and Dataset Construction
The forecasting task was defined as a short-horizon binary event-prediction problem using minute-level operational inverter data. At each snapshot timestamp, the objective was to predict whether at least one confirmed fault-like event would occur within the subsequent 15 min. This formulation was selected to reflect an operational early-warning setting rather than a retrospective fault-classification task.
The input data consisted of SCADA-based inverter operational measurements and inverter-specific event logs from a single PV plant. SCADA streams are widely used in PV monitoring and predictive-maintenance applications; for example, Betti et al. [17] used SCADA data for fault prediction and early detection in large PV plants, while Ferlito et al. [32] presented an IoT-based SCADA architecture for PV utility plants that supports historical data storage and predictive-maintenance protocols. In this study, the dataset covered an 89-day operating period from 15 January 2026 to 13 April 2026 and included 18 co-located inverters for which both operational snapshots and event records were available.
Fourteen operational variables were retained as predictors: direct current voltage (vDC), direct current (iDC), input DC current (InDC), output AC power (outAC), accumulated power (accPro), phase-to-phase voltages (vRS, vST, vTR), phase currents (iR, iS, iT), grid frequency (frequency), power factor (pFactor), and temperature (tmp). These variables were used directly as the representation of the inverter operating state. Rated inverter capacity was not included as an input variable because the analysis focused on co-located inverters monitored under the same plant-level system, and no varying rated-capacity covariate was available in the operational dataset. If future multi-plant datasets contain heterogeneous inverter sizes, rated capacity can be incorporated as an equipment-level covariate or used for stratified validation.
Event records were filtered to confirmed fault-like events. Records corresponding to non-fault operational states, such as check and standby states, were excluded from the main label definition. Because repeated event records can occur within a short time interval and may represent the same abnormal episode, neighboring events were merged using a 10 min temporal gap. This merging step was applied to reduce artificial inflation of positive labels caused by repeated alarm logging.
For each inverter and snapshot timestamp , horizon-wise binary labels were assigned over the subsequent 15 one-minute intervals. Let denote the set of merged event timestamps for inverter . The horizon-specific label was defined as:
The aggregated future-event label used in the main classification experiments was then defined as:
Thus, indicates that at least one confirmed fault-like event occurred within the next 15 min, regardless of the exact minute-ahead horizon. This aggregated label was used because the purpose of the study was to compare validation designs under sparse-event conditions rather than to optimize horizon-specific alarm timing.
To convert the continuous time series into supervised learning samples, fixed-length sliding windows were applied to each inverter stream. For each timestamp , a historical input window of 56 time steps was extracted and paired with . Each sample therefore consisted of a input tensor and one aggregated binary future-event label. Sample-level metadata, including plant identifier, inverter identifier, and timestamp, were retained to support equipment-level validation and traceability.
Applying this procedure to the 89-day dataset yielded 1,538,262 windowed samples across 18 inverters. The dataset was then summarized by inverter to quantify the number of windowed samples, positive labels, and positive-event rates. This audit was used to characterize equipment-level event sparsity before model evaluation and to support interpretation of the validation results.
2.3. Validation Configurations
To assess whether validation design affects the perceived usefulness of PV inverter fault prediction, three validation configurations were compared under the same forecasting target, feature representation, and model specification. These configurations were designed to separate three operational questions: whether each inverter can support its own temporal model, whether a pooled plant-level model is useful under temporal holdout, and whether learned patterns transfer to an inverter that is completely excluded from training.
The three validation configurations are summarized in Table 1. In all configurations, the chronological order of samples was preserved whenever a temporal split was used, and no test samples were used during model fitting.
Table 1.
Validation configurations used in this study.
In the single-equipment temporal configuration, each inverter was treated as an independent learning unit. Samples for a given inverter were sorted chronologically, with the first 80% used for training and the final 20% reserved for testing. This setting represents the conventional asset-specific modeling strategy and evaluates whether each inverter contains enough event support to train its own model.
In the pooled temporal configuration, samples from all 18 inverters were combined into a single plant-level dataset. The pooled data were then sorted temporally and split into an 80% training period and a 20% test period. This setting evaluates whether aggregating co-located inverters improves prediction under a global temporal holdout. It reflects a practical strategy in which a plant operator trains one shared model for the monitored inverter fleet.
In the leave-one-equipment-out (LOEO) configuration, one inverter was held out entirely as the test unit, and the model was trained using samples from the remaining 17 inverters. This process was repeated so that each inverter served once as the held-out test equipment. LOEO validation directly evaluates within-plant cross-equipment generalization, because the model is tested on an inverter whose samples were not present during training.
These configurations should not be interpreted as interchangeable estimates of the same quantity. Instead, they answer complementary operational questions. Single-equipment temporal validation measures asset-specific temporal predictability, pooled temporal validation measures plant-level temporal generalization, and LOEO validation measures transferability to unseen equipment. This distinction is central to the study because sparse and uneven event support can make a model appear useful under one validation design but less useful under another.
In addition to the three main configurations, reliability and interpretability analyses were added to support the evaluation. Bootstrap confidence intervals were computed for LOEO performance estimates to assess statistical stability under sparse positive-event support. Feature-importance analysis was also conducted to examine whether the predictive signal was associated with meaningful electrical operating variables rather than being judged only by aggregate performance metrics.
2.4. Model Specification, Evaluation Metrics, and Robustness Checks
The objective of this study was not to propose a new forecasting architecture, but to evaluate how different validation configurations change the assessment of PV inverter fault-prediction capability under sparse-event conditions. Therefore, the same model family and feature representation were used across all experiments. Extreme Gradient Boosting (XGBoost) was adopted as the classifier because it provides an efficient tree-boosting framework for tabular and high-dimensional structured features [33]. Each sliding window was flattened into a 784-dimensional feature vector, and the aggregated 15 min future-event label was used as the binary target.
To address class imbalance, the XGBoost scale_pos_weight parameter was computed separately within each training split. Let and denote the number of positive and negative training samples, respectively. The class-weighting parameter was defined as:
This setting follows the standard use of scale_pos_weight for imbalanced binary classification, where the positive class is upweighted according to the imbalance ratio. The parameter was calculated using only the training data in each validation configuration to avoid using information from the test set.
Model performance was evaluated using precision–recall area under the curve (PR-AUC) and receiver operating characteristic area under the curve (ROC-AUC). For a given threshold, precision and recall were defined as:
where , , and denote true positives, false positives, and false negatives, respectively. PR-AUC summarizes the precision–recall trade-off over possible classification thresholds. Because the positive class in this study is rare, PR-AUC was treated as the primary evaluation metric. This choice is consistent with prior work showing that precision–recall analysis is more informative than ROC analysis for imbalanced binary classification [28]. ROC-AUC was reported as a complementary threshold-independent ranking metric.
For each validation configuration, the number of training samples, test samples, test positives, positive rate, PR-AUC, and ROC-AUC were recorded. In the LOEO analysis, 95% bootstrap confidence intervals were also computed for PR-AUC and ROC-AUC by resampling test predictions with replacement. This analysis was added to evaluate the statistical reliability of held-out-equipment performance estimates, especially for inverters with lower positive-event support.
To examine model behavior beyond aggregate performance metrics, feature-importance analysis was conducted using two complementary approaches. First, XGBoost gain-based importance was computed to identify features that contributed strongly to tree splits. Second, grouped permutation importance was computed by permuting all lagged instances of each operational variable together. For example, the 56 lagged features corresponding to were permuted as one group. This grouped approach allowed the flattened 784-dimensional input representation to be interpreted at the sensor-variable level. The interpretability analysis was used to examine whether predictive performance was associated with physically meaningful electrical operating variables.
Robustness and reliability were therefore assessed through three components: consistent validation under the three learning configurations, bootstrap confidence intervals for held-out-equipment evaluation, and feature-importance analysis for model interpretation. Together, these procedures were designed to address both predictive performance and the reliability of the conclusions drawn from the validation design.
3. Results
3.1. Dataset Characteristics and Equipment-Level Event Sparsity
The operational dataset was first examined to characterize the distribution of fault-like events across the 18 co-located inverters. After applying the 56-step sliding-window procedure, the dataset contained 1,538,262 windowed samples over an 89-day operating period. Each inverter contributed 85,459 samples, providing a balanced temporal sample structure across equipment.
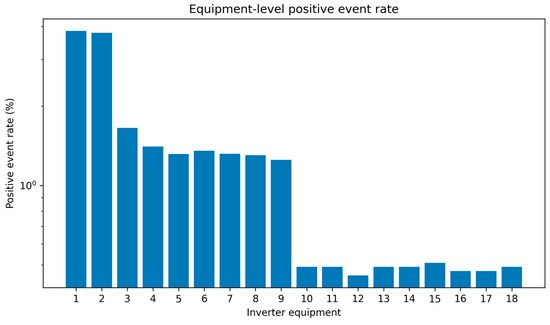
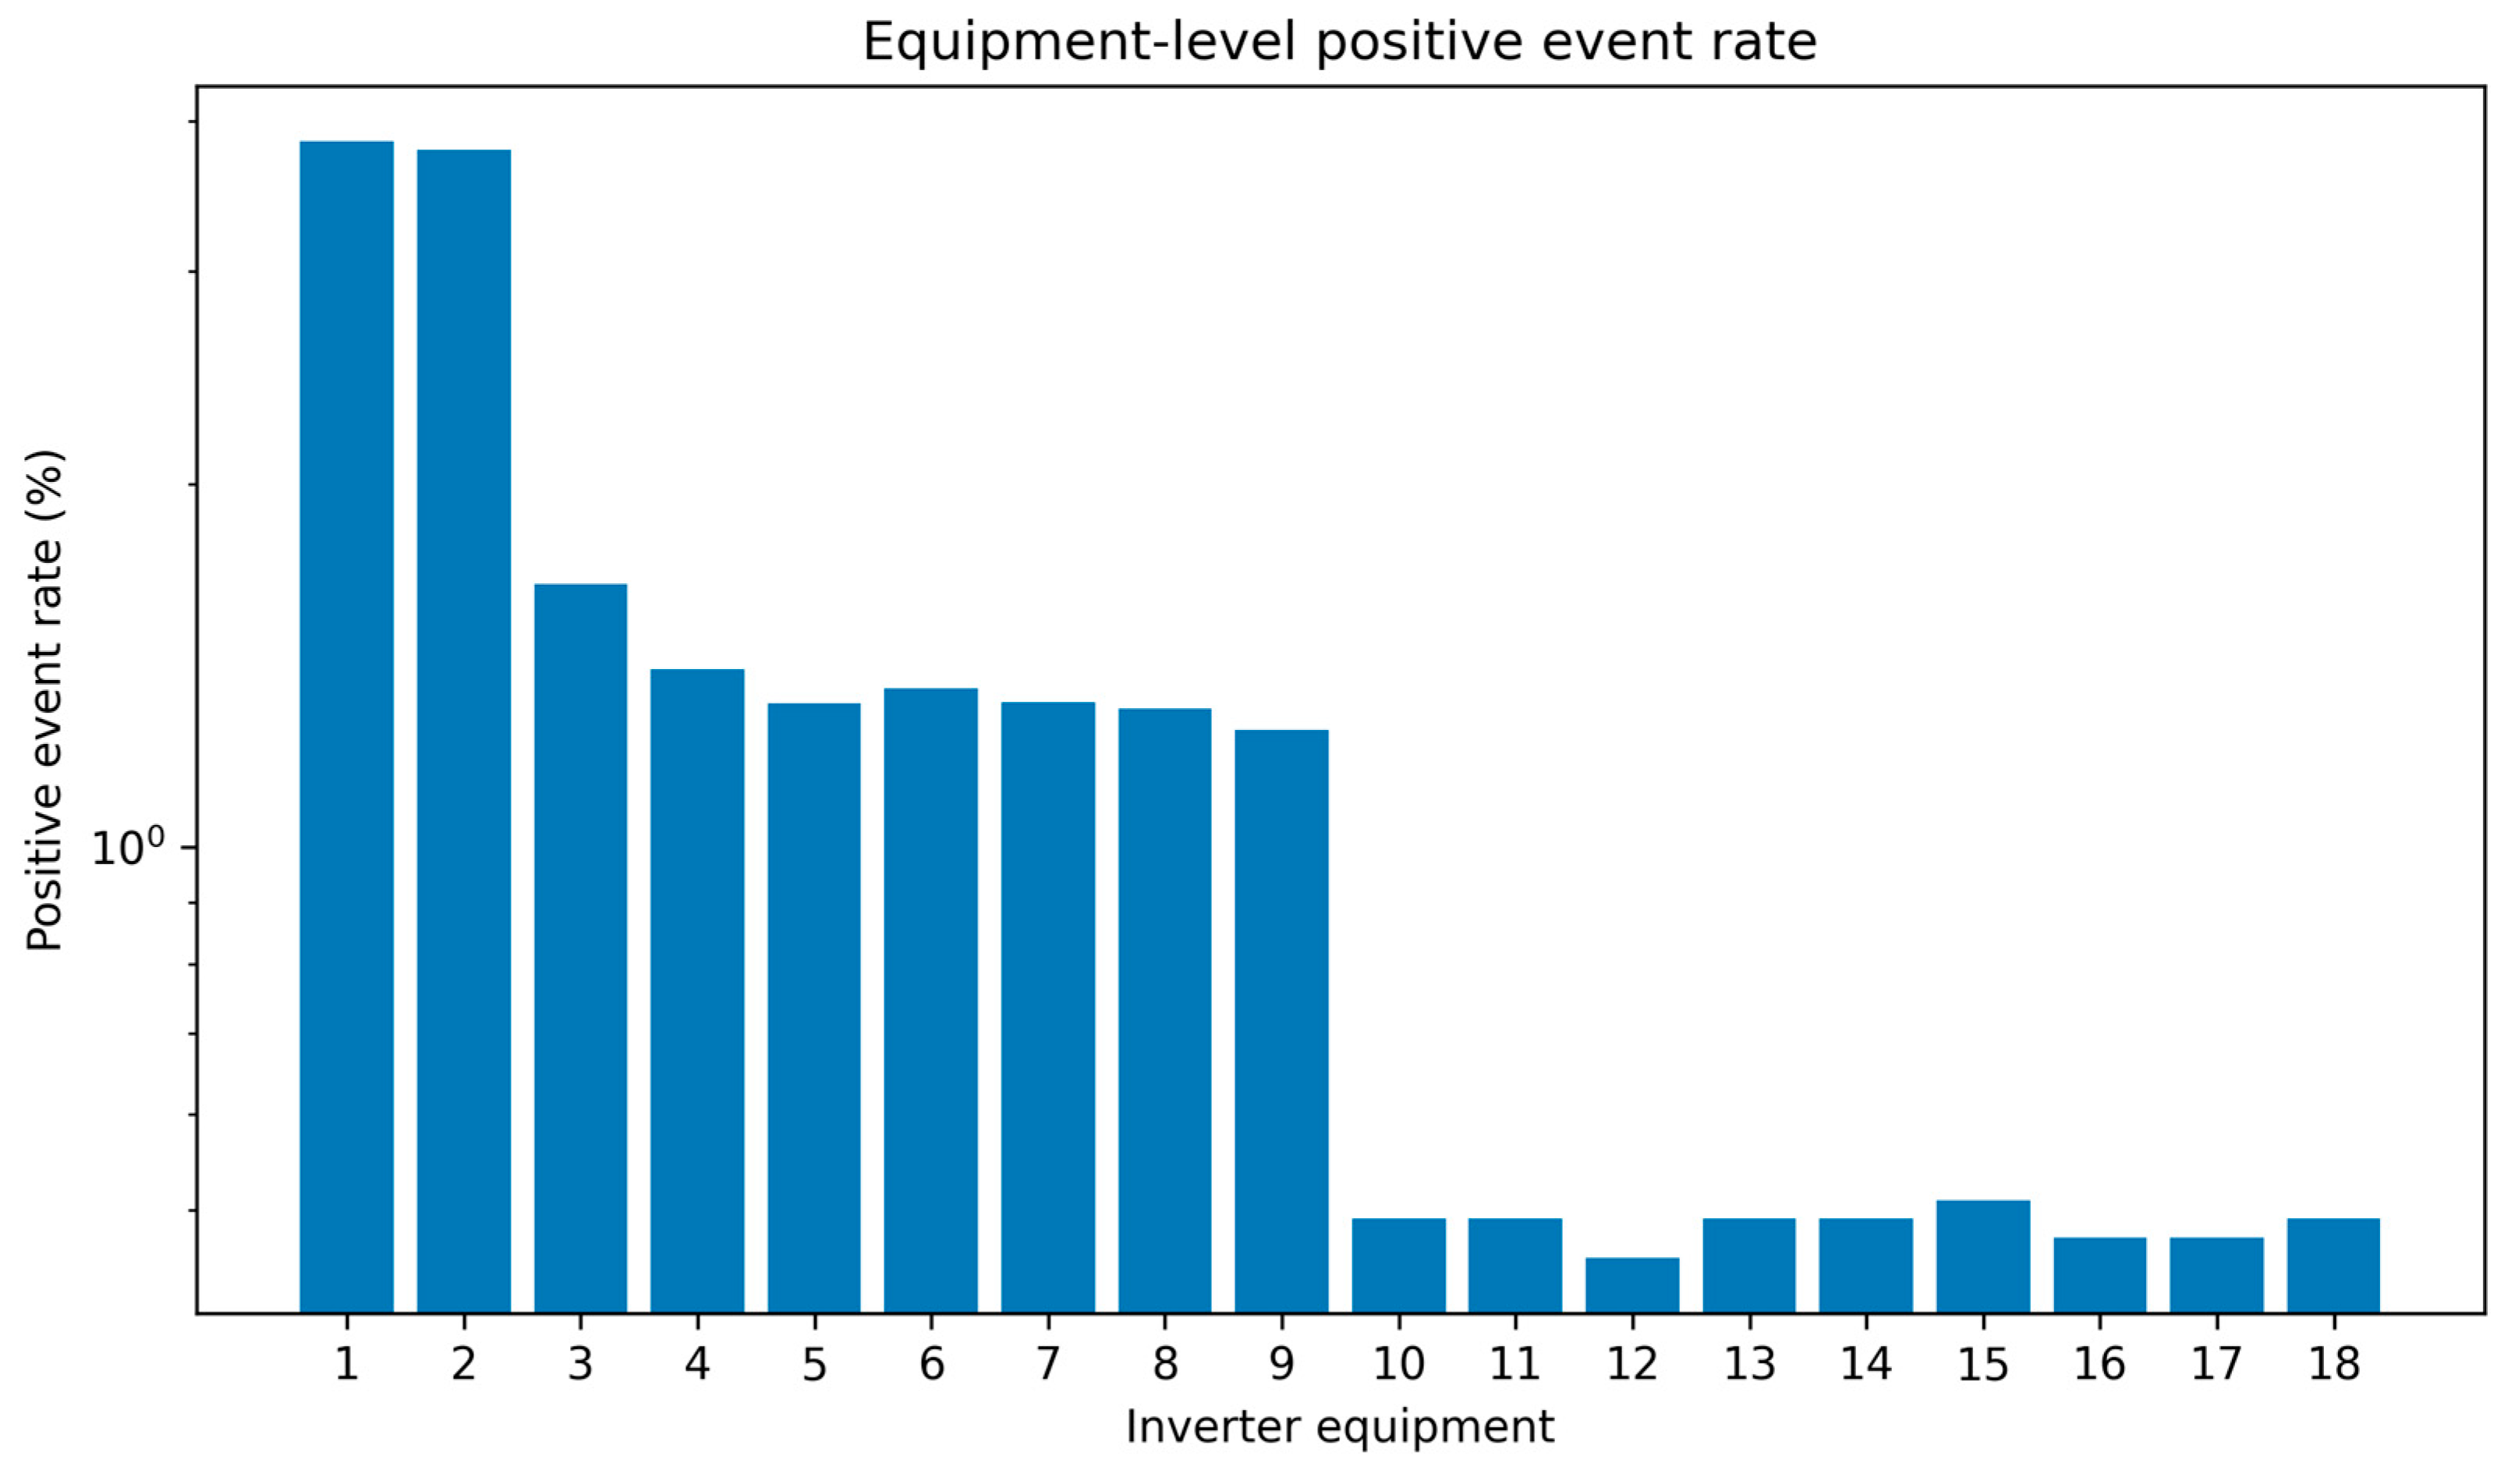
Although the number of samples was identical across inverters, the number of positive labels differed substantially. As summarized in Table 2, positive samples ranged from 390 to 3283, corresponding to positive rates between 0.456% and 3.842%. This confirms that fault-like events were sparse and unevenly distributed across equipment, even within the same PV plant. Figure 2 visualizes the same equipment-level event imbalance on a logarithmic scale. The figure highlights that event sparsity is not limited to a single inverter but is a recurring pattern across multiple equipment units.
Table 2.
Dataset summary by inverter.
Figure 2.
Equipment-level positive event rates in the 89-day 18-inverter operational dataset. The y-axis is shown on a logarithmic scale to highlight event sparsity across inverters.
The results show that equal monitoring duration does not imply equal event support for learning. Equipment 1 and 2 had positive rates above 3.7%, whereas equipment 10–18 mostly remained below 0.6%. This equipment-level heterogeneity is important because sparse positive-event support can affect both model training and the reliability of validation results.
Therefore, the dataset provides an appropriate test case for examining whether different validation configurations lead to different interpretations of predictive usefulness under sparse and unevenly distributed operational event conditions.
3.2. Single-Equipment Temporal Validation
Single-equipment temporal validation was conducted to examine whether each inverter could support an equipment-specific model using only its own historical data. For each inverter, the first 80% of chronologically ordered samples were used for training, and the final 20% were reserved for testing.
As shown in Table 3, all 18 inverters could be trained and evaluated under this configuration. Each inverter had 68,367 training samples and 17,092 test samples. The mean PR-AUC across inverters was 0.699, the median PR-AUC was 0.755, and the mean ROC-AUC was 0.890. These results indicate that equipment-specific temporal learning was feasible for all inverters in the 89-day operational dataset.
Table 3.
Results of single-equipment temporal validation.
The performance was not uniform across equipment. Equipment 1 and 2 showed relatively low PR-AUC values despite having the largest number of positive test samples, whereas many other inverters achieved PR-AUC values above 0.70. This indicates that positive-event quantity alone does not fully determine predictive performance; the temporal structure and operating patterns of each inverter also affect model behavior.
Overall, the single-equipment results show that asset-specific temporal learning can be feasible when sufficient operational history is available. However, the variation across inverters also indicates that this validation configuration primarily evaluates equipment-specific temporal predictability and should not be interpreted as evidence of cross-equipment transferability.
3.3. Pooled Temporal Validation
Pooled temporal validation was conducted to evaluate whether a single plant-level model could provide useful temporal prediction when samples from all 18 inverters were combined. In this configuration, the pooled dataset was chronologically split into the first 80% for training and the final 20% for testing.
As shown in Table 4, the pooled temporal model was trained on 1,230,606 samples and evaluated on 307,656 test samples, including 5635 positive samples. The pooled model achieved a PR-AUC of 0.637 and a ROC-AUC of 0.883.
Table 4.
Pooled temporal validation result.
This result indicates that a shared plant-level model can achieve stable discrimination when trained on the combined inverter dataset. However, pooled temporal validation evaluates temporal generalization within a mixed plant-level sample rather than transfer to an unseen inverter. Therefore, this result should be interpreted as evidence of plant-level temporal predictability, not as evidence that the model generalizes equally well to equipment excluded from training.
Compared with single-equipment temporal validation, pooled temporal validation produced a lower PR-AUC than the mean single-equipment result. This does not necessarily imply that pooling is ineffective. Rather, it reflects that the pooled model averages heterogeneous operating and event patterns across all inverters. In operational terms, pooled temporal validation is useful for assessing whether one shared model can support plant-level prediction, but it does not replace equipment-specific or held-out-equipment validation.
3.4. Leave-One-Equipment-Out Validation with Confidence Intervals
Leave-one-equipment-out (LOEO) validation was conducted to evaluate whether fault-prediction patterns learned from co-located inverters could transfer to an inverter excluded from training. For each iteration, one inverter was held out as the test unit, and the model was trained using samples from the remaining 17 inverters.
As shown in Table 5, the LOEO configuration produced a mean PR-AUC of 0.718, a median PR-AUC of 0.763, and a mean ROC-AUC of 0.930 across the 18 held-out inverters. The results also show substantial equipment-level variation. Held-out equipment 1 and 2 produced lower PR-AUC values, whereas most other inverters showed moderate to high PR-AUC values.
Table 5.
LOEO validation results with bootstrap confidence intervals.
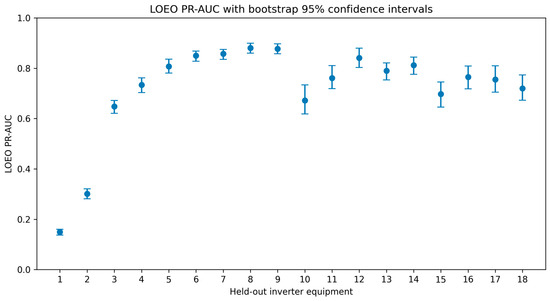
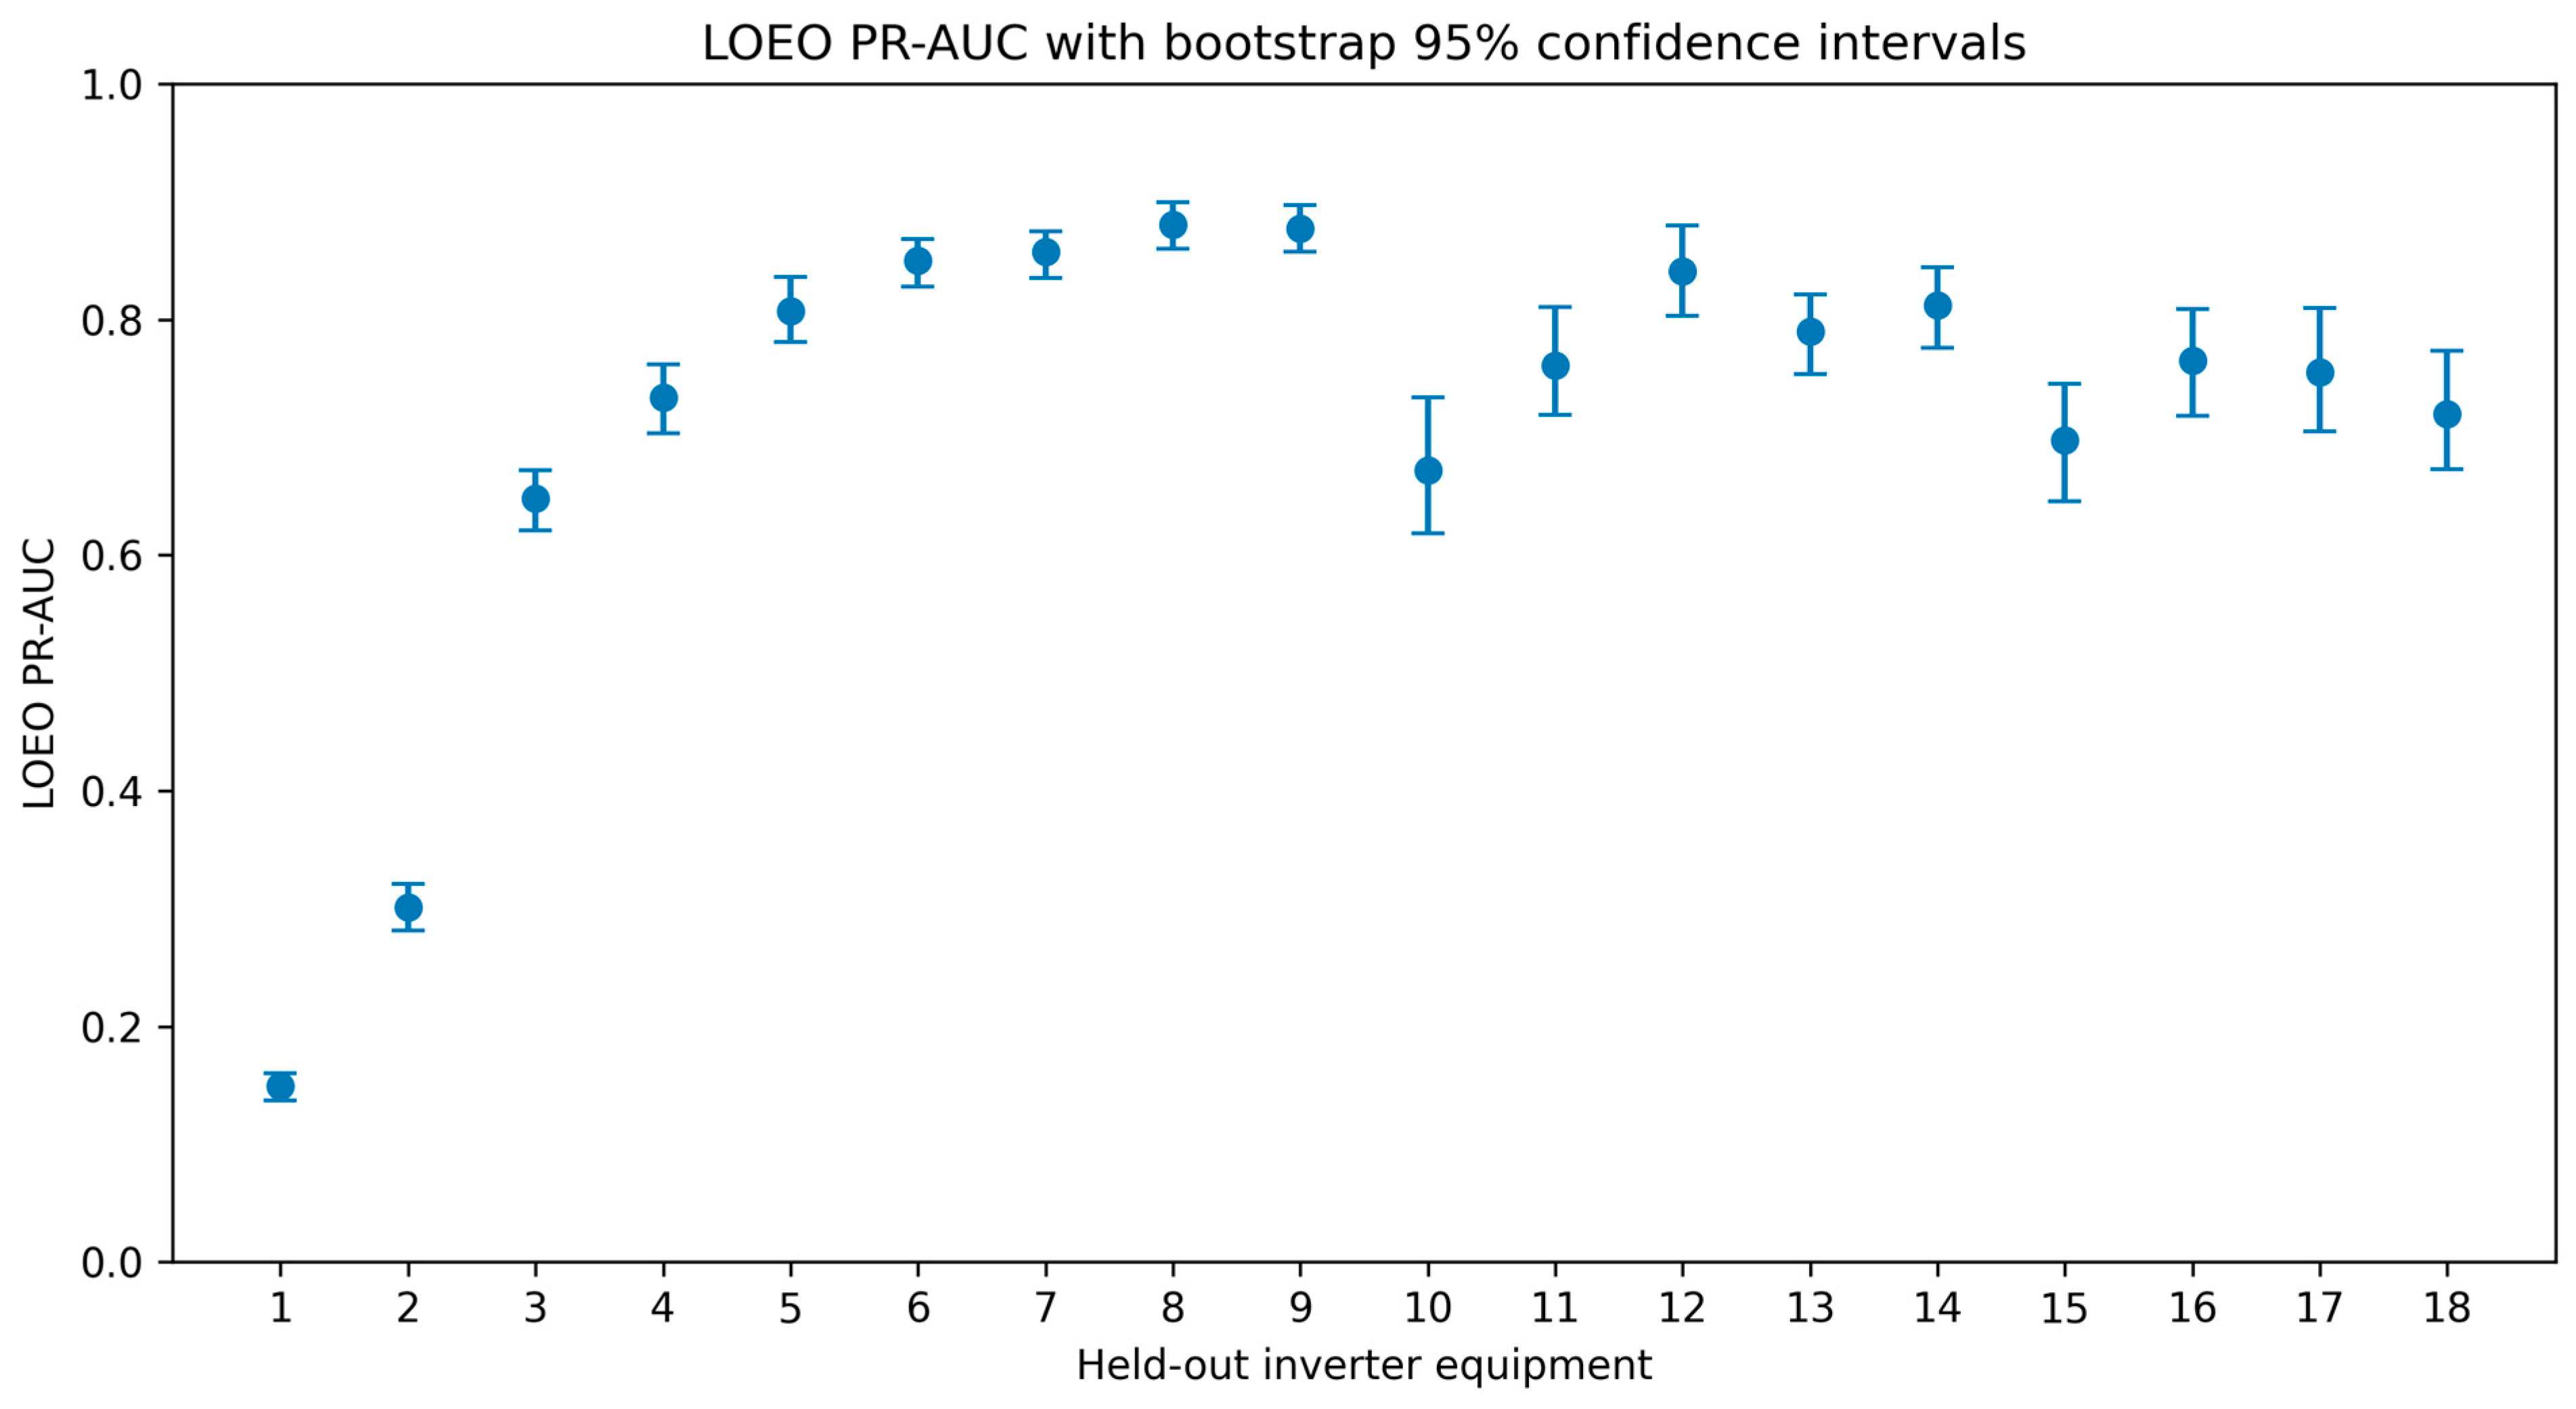
Figure 3 visualizes the PR-AUC estimates and bootstrap 95% confidence intervals for all held-out inverters. The figure shows two important patterns. First, held-out equipment 1 and 2 had lower PR-AUC values than the remaining inverters, indicating that cross-equipment transferability was not uniform across the plant. Second, most inverters had relatively narrow confidence intervals, suggesting that the LOEO estimates were statistically more stable than would be expected from extremely small positive-event counts alone.
Figure 3.
LOEO PR-AUC with bootstrap 95% confidence intervals for each held-out inverter.
The bootstrap confidence intervals provide a more reliable interpretation of held-out equipment performance than point estimates alone. For example, equipment 4 achieved a PR-AUC of 0.734 with a 95% confidence interval of 0.704–0.762, based on 1199 positive test samples. This indicates that the held-out performance estimate was not dependent on only a few positive events.
The LOEO results should not be interpreted as showing uniform improvement for every inverter. Instead, they demonstrate that held-out-equipment validation evaluates a different operational property: whether patterns learned from other inverters can generalize to unseen equipment. This distinction is important because a model may appear useful under temporal validation while still requiring separate evidence of cross-equipment transferability.
3.5. Summary Comparison of Validation Configurations
To synthesize the three main validation results, Table 6 summarizes the overall performance of the single-equipment temporal, pooled temporal, and LOEO configurations in the 89-day 18-inverter dataset. The single-equipment and LOEO results are reported as averages across the 18 inverters, whereas the pooled temporal result is reported as one plant-level model.
Table 6.
Summary comparison of validation configuration in the 89-day 18-inverter dataset.
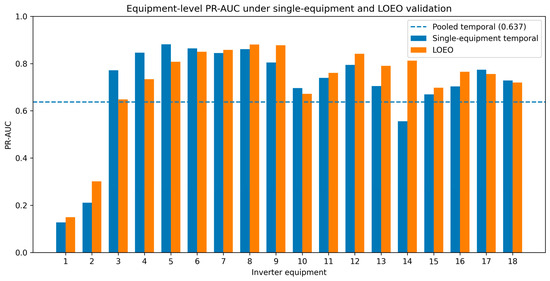
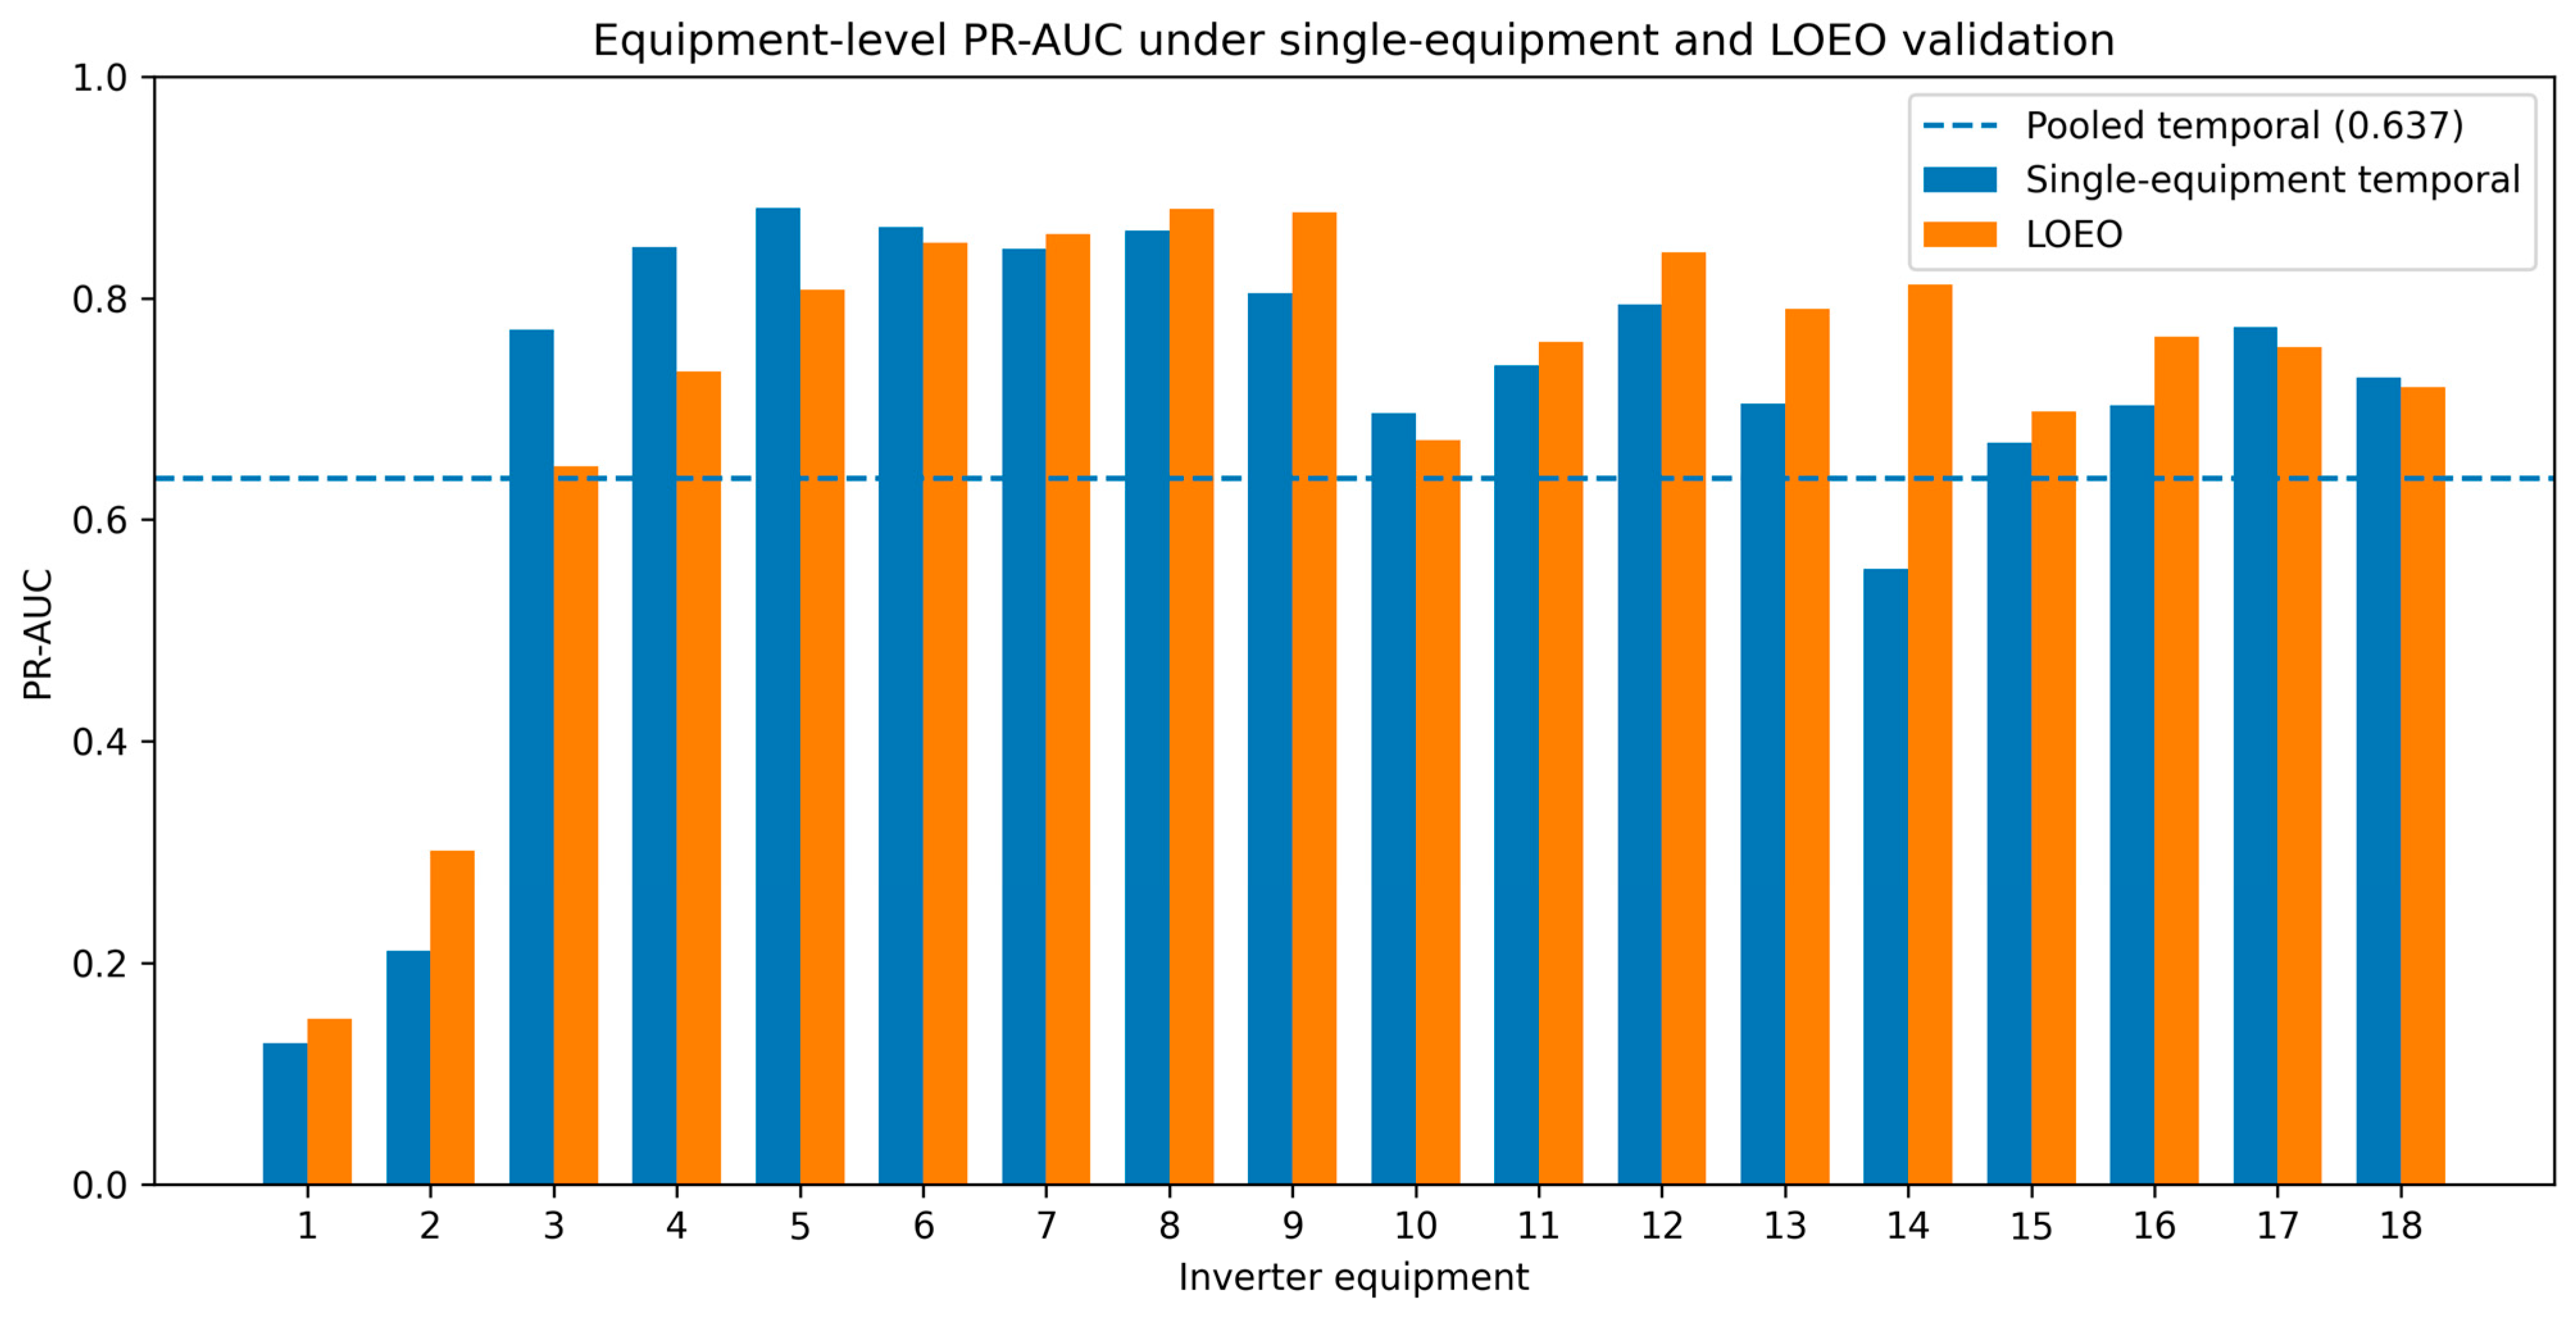
Figure 4 further illustrates the equipment-level differences between single-equipment temporal validation and LOEO validation, with the pooled temporal PR-AUC shown as a horizontal reference line. The figure shows that the validation configurations do not produce identical equipment-level performance profiles. For some inverters, LOEO produced higher PR-AUC than single-equipment validation, whereas for others the single-equipment temporal model performed similarly or better. Therefore, the main implication is not that one configuration is universally superior, but that each validation design evaluates a different operational aspect of fault-prediction usefulness.
Figure 4.
Equipment-level PR-AUC under single-equipment temporal and LOEO validation. The dashed horizontal line indicates the pooled temporal PR-AUC. The figure is intended to show that validation configurations produce different equipment-level performance profiles rather than to rank the configurations as interchangeable tests.
3.6. Temporal Robustness Analysis
To examine whether the validation patterns were affected by temporal coverage, a robustness analysis was conducted using the subset of inverters for which records were available across the full monitoring span. This subset consisted of four inverters and covered 109 days, from 26 December 2025 to 13 April 2026, after removing overlapping records between monitoring periods. This analysis was not intended to replace the main 18-inverter evaluation, but to test whether the validation patterns remained interpretable under a wider temporal span for the common inverter subset.
The robustness dataset contained 452,700 samples in total, with 113,175 samples per inverter. The number of positive labels ranged from 1231 to 3823, corresponding to positive rates between 1.088% and 3.378% (Table 7). The validation results are summarized in Table 8. The mean PR-AUC values were 0.452 for single-equipment temporal validation, 0.379 for pooled temporal validation, and 0.420 for LOEO validation. The corresponding ROC-AUC values were 0.771, 0.752, and 0.773, respectively. Detailed LOEO results are shown in Table 9. Held-out equipment 4 showed the highest PR-AUC among the four inverters, with 0.704 and a 95% confidence interval of 0.671–0.727. This estimate was based on 1231 positive test samples.
Table 7.
Summary of the temporal robustness dataset.
Table 8.
Validation performance in the temporal robustness analysis.
Table 9.
LOEO results in the temporal robustness analysis.
These results show that increasing temporal coverage for the common inverter subset did not produce uniformly higher performance. Rather, the validation results remained dependent on equipment composition, temporal structure, and event distribution. This supports the main finding that validation design is a key factor in interpreting the operational usefulness of PV inverter fault prediction.
3.7. Interpretability and Operational Relevance
To examine model behavior beyond aggregate discrimination metrics, feature-importance analysis was conducted using XGBoost gain-based importance and grouped permutation importance. Because the model input was a flattened window, grouped permutation importance was computed by permuting all 56 lagged features belonging to the same original sensor variable together. This allowed the results to be interpreted at the operational variable level.
The interpretability analysis was applied to two model contexts: the pooled temporal model and a LOEO diagnostic case. The pooled temporal model was used to examine plant-level temporal prediction. The LOEO diagnostic case used held-out equipment 4 because this equipment provided a useful test of held-out inverter prediction under relatively low event support while still having sufficient positive samples for stable interpretation.
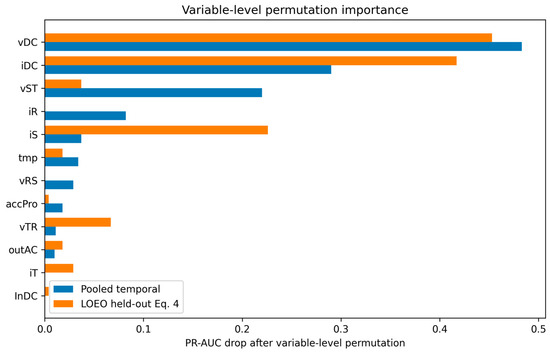
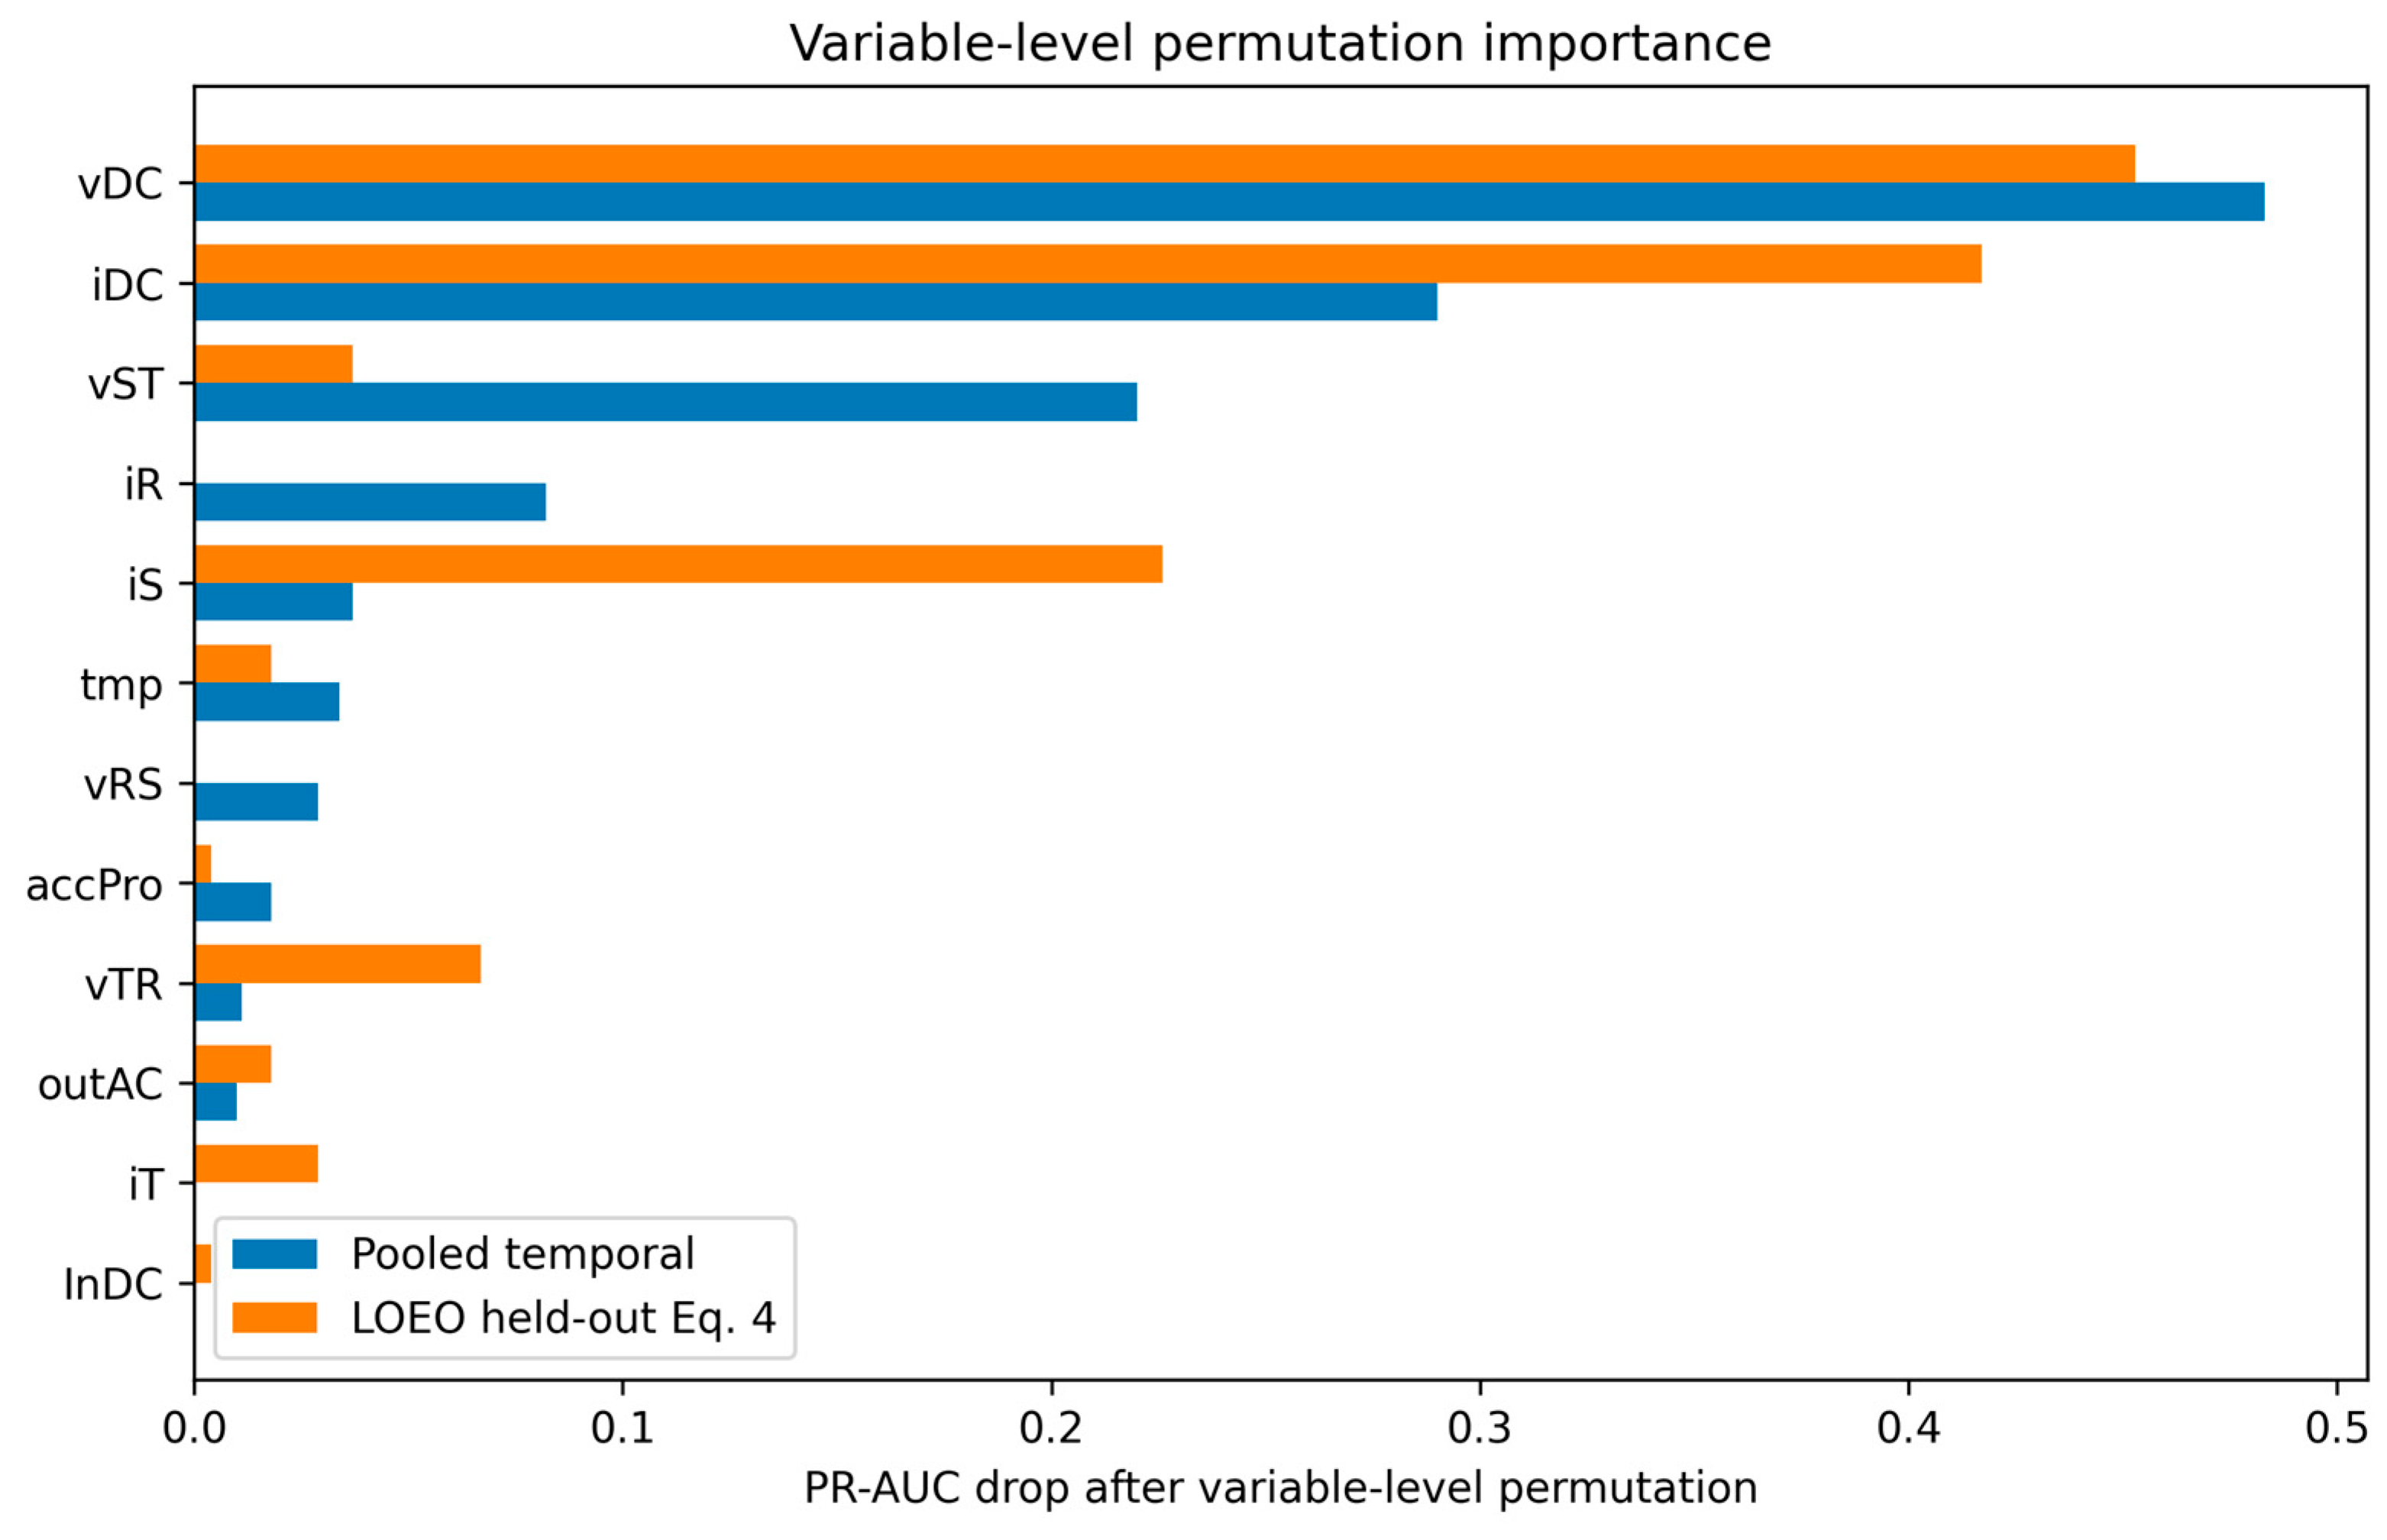
Figure 5 and Table 10 demonstrate the variable-level permutation results and show that DC-side variables produced the largest PR-AUC reductions in both model contexts. The pooled temporal model showed the largest PR-AUC reductions when vDC, iDC, and vST were permuted. In the LOEO diagnostic case, vDC and iDC again produced the largest PR-AUC reductions, followed by AC-side current and voltage variables such as iS, vTR, and vST. This consistency suggests that the predictive signal was not driven only by an arbitrary equipment-specific artifact.
Figure 5.
Variable-level permutation importance for the pooled temporal model and the LOEO held-out equipment 4 model. For each sensor variable, all 56 lagged features were jointly permuted, and the resulting PR-AUC drop was recorded.
Table 10.
Variable-level grouped permutation importance by validation context.
Overall, the feature-importance results indicate that fault-prediction performance was associated with physically meaningful inverter operating variables. DC-side voltage and current variables were consistently influential, while AC-side voltage and current variables also contributed to discrimination. From an operational perspective, this is important because these variables are routinely available in inverter monitoring systems. The interpretability analysis, therefore, supports the practical relevance of the validation results by linking predictive performance to measurable electrical operating conditions rather than reporting PR-AUC and ROC-AUC alone.
4. Discussion
4.1. Principal Findings and Validation-Design Implications
This study shows that validation design materially changes how PV inverter fault-prediction performance should be interpreted under sparse operational event conditions. Using an 89-day dataset from 18 co-located inverters, all three validation configurations were feasible, but they did not answer the same operational question. Single-equipment temporal validation assessed whether each inverter could support its own asset-specific model, pooled temporal validation assessed whether a shared plant-level model could predict future events under temporal holdout, and LOEO validation assessed whether learned patterns could transfer to an inverter excluded from training.
The main finding is therefore not that one validation configuration is universally superior. Rather, the results show that each configuration provides a different view of predictive usefulness. Single-equipment temporal validation produced a mean PR-AUC of 0.699, indicating that equipment-specific models can be useful when sufficient operational history is available. The pooled temporal model achieved a PR-AUC of 0.637, showing that a shared plant-level model can also provide meaningful discrimination. LOEO validation produced a mean PR-AUC of 0.718 and a mean ROC-AUC of 0.930, demonstrating that cross-equipment transferability can be evaluated directly when one inverter is excluded from training.
The equipment-level results further show why these validation designs should not be treated as interchangeable. Some inverters performed better under single-equipment temporal validation, whereas others performed better under LOEO validation. This indicates that apparent model usefulness depends on the relationship between event distribution, temporal structure, and the validation question being asked. A model that appears useful under a pooled temporal split may not necessarily demonstrate transferability to unseen equipment, while a held-out-equipment result may reveal whether shared operating patterns exist across co-located inverters.
The bootstrap confidence intervals in the LOEO analysis also strengthen the interpretation of held-out-equipment performance. For example, held-out equipment 4 achieved a PR-AUC of 0.734 with a 95% confidence interval of 0.704–0.762 based on 1199 positive test samples. This provides a more stable basis for interpretation than relying only on point estimates under extremely sparse event counts. Overall, these findings support the central claim that validation design is a substantive methodological choice in operational PV fault prediction, not a secondary implementation detail.
The observed differences among the three validation configurations reflect the influence of equipment-level event sparsity and cross-equipment heterogeneity within the plant. When positive-event support is sufficient, single-equipment temporal validation can provide stable asset-specific prediction. Under sparse or uneven event distributions, however, performance becomes more sensitive to the validation design, and configurations that use information from other co-located inverters provide a different perspective on predictive usefulness by testing whether shared operating patterns generalize beyond a single unit. These results show that the three validation configurations should not be interpreted as interchangeable performance tests, because each captures a different aspect of model behavior under sparse-event operating conditions.
4.2. Operational Implications for PV Predictive Maintenance
The results have direct implications for how predictive-maintenance models should be evaluated before operational use. In plant operation, the practical question is not only whether a model achieves a high discrimination score, but also whether the validation design reflects the intended deployment setting. If each inverter has sufficient historical event support, an equipment-specific model may be appropriate. If a plant operator wants one shared model for the inverter fleet, pooled temporal validation is more relevant. If the target is to support an inverter with limited or no training history, LOEO validation provides the closest evaluation setting.
This distinction is important for maintenance planning. The single-equipment results show that inverter-specific models can be feasible, but their performance remains equipment-dependent. The pooled temporal result shows that a shared model can support plant-level prediction, but it does not test whether the model can generalize to a new or data-sparse inverter. The LOEO results address this missing question by testing predictive coverage for held-out equipment. Therefore, the three configurations should be viewed as complementary evidence for deployment planning rather than competing model-selection scores.
From an operational perspective, this framework can help plant operators decide how to allocate monitoring and maintenance resources. Inverters with stable single-equipment performance may be managed using asset-specific models, whereas inverters with limited event history may require shared learning or held-out-equipment evaluation before deployment. This can reduce the risk of applying a model that appears effective under one validation setting but fails under the actual operational use case.
The sustainability relevance follows from this operational interpretation. More reliable early warning can help reduce unplanned inverter downtime, support condition-based maintenance, and avoid unnecessary component replacement. At the plant level, these effects can contribute to higher energy availability and more efficient use of maintenance resources. However, these benefits depend on whether the evaluation design realistically reflects the deployment scenario. Thus, validation design is not only a statistical concern but also a practical requirement for dependable PV asset management.
4.3. Transferable Operating Patterns and Model Interpretability
The interpretability analysis provides additional insight into why cross-equipment prediction was possible in the LOEO setting. Rather than relying only on aggregate PR-AUC and ROC-AUC values, variable-level permutation importance was used to identify which operational measurements contributed most strongly to prediction.
Across both the pooled temporal model and the LOEO held-out equipment 4 model, DC-side variables were consistently important. In particular, vDC and iDC produced the largest PR-AUC reductions when their 56 lagged features were jointly permuted. AC-side variables, including vST, vTR, iR, iS, and iT, also contributed to model performance. This suggests that the predictive signal was associated with measurable electrical operating patterns rather than arbitrary equipment-specific artifacts.
This finding supports the interpretation that within-plant transferability is plausible because co-located inverters share similar electrical and environmental operating contexts. However, the result should not be interpreted as a causal explanation of fault mechanisms. The importance analysis identifies variables that contributed to predictive discrimination in the fitted models, but it does not prove that these variables directly caused the recorded events.
From a practical standpoint, the important variables identified in the analysis are routinely available in inverter monitoring systems. This is useful because it suggests that the validation framework can be implemented using standard operational measurements without requiring specialized additional sensors. The interpretability results, therefore, strengthen the operational relevance of the proposed evaluation framework by linking predictive performance to recognizable inverter operating variables.
4.4. Limitations and Future Directions
Several limitations should be acknowledged. First, the analysis was conducted using data from a single PV plant. Although this setting provides a controlled basis for comparing validation configurations among co-located inverters, it does not establish universal generalization across different plants, climates, inverter models, or grid conditions. Future studies should therefore evaluate the same validation framework using multi-plant datasets.
Second, the main analysis used an 89-day operating period, with an additional temporal robustness analysis based on a 109-day four-inverter dataset. These periods are substantially more informative than very short monitoring windows, but they still do not cover a full annual cycle. Seasonal irradiance, temperature, humidity, and maintenance schedules may affect inverter behavior and event occurrence patterns. Future work should extend the analysis to one-year or multi-year datasets to test whether the observed validation-design effects remain stable across seasons.
Third, inverter rated capacity was not included as a model input because the available operational dataset did not provide rated capacity as a varying equipment-level covariate. If future datasets include inverters with different capacities, manufacturers, or configurations, these variables should be incorporated as equipment-level features or used for stratified validation.
Finally, the interpretability analysis was based on feature importance and permutation importance. These methods help identify influential operational variables, but they do not provide a causal explanation of fault mechanisms. Future research should combine data-driven prediction with physical inverter diagnostics, maintenance records, and expert fault-code interpretation to better connect predictive signals with actionable maintenance decisions.
5. Conclusions
This study evaluated how validation design influences the interpretation of PV inverter fault-prediction performance under sparse operational event conditions. Using an 89-day dataset from 18 co-located inverters, the study compared three validation configurations: single-equipment temporal validation, pooled temporal validation, and leave-one-equipment-out (LOEO) validation. The results show that these configurations do not provide interchangeable performance estimates; instead, each evaluates a different operational question.
The main scientific contribution is that this study demonstrates validation design itself as a critical factor in PV predictive-maintenance assessment. Single-equipment temporal validation showed asset-specific predictability, pooled temporal validation showed plant-level temporal predictability, and LOEO validation directly tested cross-equipment transferability. The results therefore move beyond reporting a single model score and show how the choice of learning unit can change conclusions about model usefulness.
The methodological contribution is the integration of performance evaluation, confidence-interval analysis, and interpretability analysis within the same validation framework. Bootstrap confidence intervals improved the reliability of held-out-equipment interpretation, while variable-level permutation importance showed that predictive performance was associated with meaningful inverter operating variables, particularly DC voltage, DC current, and selected AC-side voltage/current patterns.
The practical contribution is that the findings provide guidance for PV operators selecting validation strategies before deployment. Equipment-specific models may be appropriate when each inverter has sufficient history, pooled temporal models may support shared plant-level prediction, and LOEO validation is necessary when predictive coverage for unseen or data-limited inverters is required. This distinction can support more reliable early warning, better maintenance prioritization, and more efficient use of monitoring data.
Future work should extend this framework to multi-plant, multi-season, and multi-year datasets. Future studies should also incorporate inverter capacity, manufacturer information, and equipment metadata when available, and should combine data-driven prediction with maintenance records and physical fault interpretation. These extensions would help determine whether the validation-design effects observed in this study remain stable across broader PV operating environments.
Author Contributions
Conceptualization, H.-S.Y., T.-Y.K., S.-J.L. and J.K.; Methodology, H.-S.Y., T.-Y.K., S.-J.L. and J.K.; Software, H.-S.Y., T.-Y.K., S.-J.L. and J.K.; Validation, H.-S.Y., T.-Y.K., S.-J.L. and J.K.; Formal Analysis, H.-S.Y., T.-Y.K., S.-J.L. and J.K.; Investigation, H.-S.Y., T.-Y.K., S.-J.L. and J.K.; Resources, H.-S.Y., T.-Y.K., S.-J.L. and J.K.; Data Curation, H.-S.Y., T.-Y.K., S.-J.L. and J.K.; Writing—Original Draft Preparation, H.-S.Y., T.-Y.K., S.-J.L. and J.K.; Writing—Review and Editing, H.-S.Y., S.-J.L. and J.K.; Visualization, H.-S.Y., S.-J.L. and J.K.; Supervision, H.-S.Y., S.-J.L. and J.K.; Project Administration, H.-S.Y., S.-J.L. and J.K.; Funding Acquisition, H.-S.Y., S.-J.L. and J.K. All authors have read and agreed to the published version of the manuscript.
Funding
This work was supported by a National Research Foundation of Korea (NRF) grant funded by the Korea government (MSIT) (RS–2026–25488422).
Institutional Review Board Statement
Not applicable.
Informed Consent Statement
Not applicable.
Data Availability Statement
The data used in this study are derived from operational photovoltaic inverter systems and are not publicly available due to confidentiality and commercial restrictions. A subset of processed data or aggregated results may be made available by the authors upon reasonable request. The implementation details necessary to reproduce the experimental setup are described in the manuscript.
Conflicts of Interest
The authors declare no conflicts of interest.
Abbreviations
The following abbreviations are used in this manuscript:
| AC | Alternating Current |
| AI | Artificial Intelligence |
| CI | Confidence Interval |
| DC | Direct Current |
| LOEO | Leave-One-Equipment-Out |
| ML | Machine Learning |
| PR-AUC | Precision–Recall Area Under the Curve |
| PV | Photovoltaic |
| ROC-AUC | Receiver Operating Characteristic Area Under the Curve |
| SCADA | Supervisory Control and Data Acquisition |
| XGBoost | Extreme Gradient Boosting |
References
- Jordan, D.C.; Kurtz, S.R. Photovoltaic Degradation Rates—An Analytical Review. Prog. Photovolt. 2013, 21, 12–29. [Google Scholar] [CrossRef] [Scilit]
- Abdulla, H.; Sleptchenko, A.; Nayfeh, A. Photovoltaic Systems Operation and Maintenance: A Review and Future Directions. Renew. Sustain. Energy Rev. 2024, 195, 114342. [Google Scholar] [CrossRef] [Scilit]
- Pillai, D.S.; Rajasekar, N. A Comprehensive Review on Protection Challenges and Fault Diagnosis in PV Systems. Renew. Sustain. Energy Rev. 2018, 91, 18–40. [Google Scholar] [CrossRef] [Scilit]
- Ahmed, A.M.; Li, L.; Khalilpour, K. Predictive Maintenance of Solar Photovoltaic Systems: A Comprehensive Review. IET Renew. Power Gen. 2025, 19, e70152. [Google Scholar] [CrossRef] [Scilit]
- Vichare, R.V.; Gaikwad, S.R. AI-Based Predictive Maintenance of Solar Photovoltaics Systems: A Comprehensive Review. Energy Inf. 2025, 8, 128. [Google Scholar] [CrossRef] [Scilit]
- El-Banby, G.M.; Moawad, N.M.; Abouzalm, B.A.; Abouzaid, W.F.; Ramadan, E.A. Photovoltaic System Fault Detection Techniques: A Review. Neural Comput. Appl. 2023, 35, 24829–24842. [Google Scholar] [CrossRef] [Scilit]
- Osmani, K.; Haddad, A.; Lemenand, T.; Castanier, B.; Alkhedher, M.; Ramadan, M. A Critical Review of PV Systems’ Faults with the Relevant Detection Methods. Energy Nexus 2023, 12, 100257. [Google Scholar] [CrossRef] [Scilit]
- Taghezouit, B.; Harrou, F.; Sun, Y.; Merrouche, W. Model-Based Fault Detection in Photovoltaic Systems: A Comprehensive Review and Avenues for Enhancement. Results Eng. 2024, 21, 101835. [Google Scholar] [CrossRef] [Scilit]
- Chen, Z.; Han, F.; Wu, L.; Yu, J.; Cheng, S.; Lin, P.; Chen, H. Random Forest Based Intelligent Fault Diagnosis for PV Arrays Using Array Voltage and String Currents. Energy Convers. Manag. 2018, 178, 250–264. [Google Scholar] [CrossRef] [Scilit]
- Amiri, A.F.; Oudira, H.; Chouder, A.; Kichou, S. Faults Detection and Diagnosis of PV Systems Based on Machine Learning Approach Using Random Forest Classifier. Energy Convers. Manag. 2024, 301, 118076. [Google Scholar] [CrossRef] [Scilit]
- Kapucu, C.; Cubukcu, M. A Supervised Ensemble Learning Method for Fault Diagnosis in Photovoltaic Strings. Energy 2021, 227, 120463. [Google Scholar] [CrossRef] [Scilit]
- Lodhi, E.; Wang, F.-Y.; Xiong, G.; Zhu, L.; Tamir, T.S.; Rehman, W.U.; Khan, M.A. A Novel Deep Stack-Based Ensemble Learning Approach for Fault Detection and Classification in Photovoltaic Arrays. Remote Sens. 2023, 15, 1277. [Google Scholar] [CrossRef] [Scilit]
- Harrou, F.; Dairi, A.; Taghezouit, B.; Khaldi, B.; Sun, Y. Automatic Fault Detection in Grid-Connected Photovoltaic Systems via Variational Autoencoder-Based Monitoring. Energy Convers. Manag. 2024, 314, 118665. [Google Scholar] [CrossRef] [Scilit]
- Titouni, S.; Hammache, B.; Belazzoug, M.; Himeur, Y.; Messaoudene, I.; Oulefki, A.; Dawoud, D.W.; Chetouah, F.; Atalla, S.; Mansoor, W. Hybrid CNN-Autoencoder Model for Accurate and Efficient Fault Diagnosis in Grid-Connected Photovoltaic Systems. Int. J. Electr. Power Energy Syst. 2025, 173, 111454. [Google Scholar] [CrossRef] [Scilit]
- Bougoffa, M.; Benmoussa, S.; Djeziri, M.; Palais, O. Hybrid Deep Learning for Fault Diagnosis in Photovoltaic Systems. Machines 2025, 13, 378. [Google Scholar] [CrossRef] [Scilit]
- Teta, A.; Medkour, M.; Chennana, A.; Chouchane, A.; Himeur, Y.; Gadhafi, R.; Ouanas Belabbaci, E.; Atalla, S.; Mansoor, W. Enhanced Fault Diagnosis in Grid-Connected Photovoltaic Systems: Leveraging Transfer Learning and Ensemble Methods for Superior Accuracy. IEEE Access 2024, 12, 194786–194803. [Google Scholar] [CrossRef] [Scilit]
- Betti, A.; Tucci, M.; Crisostomi, E.; Piazzi, A.; Barmada, S.; Thomopulos, D. Fault Prediction and Early-Detection in Large PV Power Plants Based on Self-Organizing Maps. Sensors 2021, 21, 1687. [Google Scholar] [CrossRef] [Scilit] [PubMed]
- Syamsuddin, A.; Adhi, A.C.; Kusumawardhani, A.; Prahasto, T.; Widodo, A. Predictive Maintenance Based on Anomaly Detection in Photovoltaic System Using SCADA Data and Machine Learning. Results Eng. 2024, 24, 103589. [Google Scholar] [CrossRef] [Scilit]
- Snytko, A.; Jiménez-Castillo, G.; Muñoz-Rodríguez, F.J.; Rus-Casas, C. Fault Diagnosis for Photovoltaic Systems: A Validated Industrial SCADA Framework. Appl. Sci. 2025, 15, 12656. [Google Scholar] [CrossRef] [Scilit]
- Stanchev, P.; Hinov, N. Data-Driven Reliability Assessment of PV Inverters Using SCADA Measurements. Energies 2025, 19, 237. [Google Scholar] [CrossRef] [Scilit]
- Francisti, J.; Fodor, K.; Balogh, Z.; Magdin, M. Predictive Modeling and Anomaly Detection in Solar PV Inverters Using Machine Learning. Results Eng. 2025, 28, 108348. [Google Scholar] [CrossRef] [Scilit]
- Guo, Q.; Li, G.; Lin, J. Domain-Specific Adaptation Network for Inverter Fault Diagnosis: Knowledge Transfer from Simulation to Physical Domain. Measurement 2024, 227, 114299. [Google Scholar] [CrossRef] [Scilit]
- Cho, S.H.; Kim, S.; Choi, J.-H. Transfer Learning-Based Fault Diagnosis under Data Deficiency. Appl. Sci. 2020, 10, 7768. [Google Scholar] [CrossRef] [Scilit]
- Wang, P.; Gao, R.X. Transfer Learning for Enhanced Machine Fault Diagnosis in Manufacturing. CIRP Ann. 2020, 69, 413–416. [Google Scholar] [CrossRef] [Scilit]
- Guo, W.; Liu, L.; Qi, Y.; Wang, S. Research on Photovoltaic Fault Diagnosis Based on Transfer Learning. In Proceedings of the 2025 IEEE 5th New Energy and Energy Storage System Control Summit Forum (NEESSC), Hohhot, China, 15 August 2025; IEEE: Hohhot, China, 2025; pp. 9–13. [Google Scholar]
- He, H.; Garcia, E.A. Learning from Imbalanced Data. IEEE Trans. Knowl. Data Eng. 2009, 21, 1263–1284. [Google Scholar] [CrossRef] [Scilit]
- Krawczyk, B. Learning from Imbalanced Data: Open Challenges and Future Directions. Prog. Artif. Intell. 2016, 5, 221–232. [Google Scholar] [CrossRef] [Scilit]
- Saito, T.; Rehmsmeier, M. The Precision-Recall Plot Is More Informative than the ROC Plot When Evaluating Binary Classifiers on Imbalanced Datasets. PLoS ONE 2015, 10, e0118432. [Google Scholar] [CrossRef] [Scilit]
- Aguiar, G.; Krawczyk, B.; Cano, A. A Survey on Learning from Imbalanced Data Streams: Taxonomy, Challenges, Empirical Study, and Reproducible Experimental Framework. Mach. Learn. 2024, 113, 4165–4243. [Google Scholar] [CrossRef] [Scilit]
- Bergmeir, C.; Benítez, J.M. On the Use of Cross-Validation for Time Series Predictor Evaluation. Inf. Sci. 2012, 191, 192–213. [Google Scholar] [CrossRef] [Scilit]
- Liu, S.; Zhou, D.J. Using Cross-validation Methods to Select Time Series Models: Promises and Pitfalls. Brit J. Math. Statis 2024, 77, 337–355. [Google Scholar] [CrossRef] [Scilit]
- Ferlito, S.; Ippolito, S.; Santagata, C.; Schiattarella, P.; Di Francia, G. A Study on an IoT-Based SCADA System for Photovoltaic Utility Plants. Electronics 2024, 13, 2065. [Google Scholar] [CrossRef] [Scilit]
- Chen, T.; Guestrin, C. XGBoost: A Scalable Tree Boosting System. In Proceedings of the 22nd ACM SIGKDD International Conference on Knowledge Discovery and Data Mining, San Francisco, CA, USA, 13 August 2016; ACM: San Francisco, CA, USA, 2016; pp. 785–794. [Google Scholar]

Disclaimer/Publisher’s Note: The statements, opinions and data contained in all publications are solely those of the individual author(s) and contributor(s) and not of MDPI and/or the editor(s). MDPI and/or the editor(s) disclaim responsibility for any injury to people or property resulting from any ideas, methods, instructions or products referred to in the content. |
© 2026 by the authors. Licensee MDPI, Basel, Switzerland. This article is an open access article distributed under the terms and conditions of the Creative Commons Attribution (CC BY) license.