


Abstract
This study investigates the spatiotemporal evolution and migration path coupling of the “water–land–energy–carbon” nexus system in the Beijing–Tianjin–Hebei region from 2002 to 2023 using multi-source data. The Coefficient of Variation and Shannon entropy were employed to assess the stability of elements, while Dynamic Time Warping (DTW) was applied to couple their migration paths. The results reveal the following: (1) Terrestrial water and groundwater exhibited similar evolution patterns, though groundwater showed greater volatility. Land use remained stable, with primary conversion being cropland to impervious. Nighttime light intensity increased significantly in urban areas, reflecting growth in energy consumption. Carbon emissions increased in most areas but decreased in some urban centers. (2) Element centroids displayed differentiated migration: water resources and cropland shifted southwest, and ecological land expanded northwest, while impervious, carbon emissions, and nighttime light concentrated in the southeast and northeast. (3) Two strongly coupled paths were identified: “terrestrial water–groundwater–cropland,” reflecting agricultural dependence on water resources, and “impervious –nighttime light–carbon emissions,” revealing the linkage between urban expansion, energy consumption, and carbon emissions. This study reveals the migration patterns of factors driven by both natural factors and human activities, providing quantitative support for resource optimization and low-carbon development policies in the Beijing–Tianjin–Hebei region.
1. Introduction
Water, land, and energy are fundamental resources that sustain human survival and socio-economic development. In the context of climate change, carbon emissions have become a critical issue related to national development and international competitiveness [1]. The United Nations Sustainable Development Goals (SDGs) aim to address sustainability challenges across economic, social, and environmental dimensions through coordinated global actions. Among these goals, water (SDG6), land (SDG15), energy (SDG7), and climate action related to carbon reduction (SDG13) constitute key components of sustainable development [2]. At the 75th session of the United Nations General Assembly, China pledged to peak its CO2 emissions by 2030 and achieve carbon neutrality by 2060. As key components of the Earth’s surface system, water, land, and energy are involved in continuous material circulation, energy exchange, and information transfer, forming complex nonlinear dynamic feedback relationships [3,4]. Under the influence of climate change, global ecological and environmental challenges have become increasingly prominent. Conflicts between carbon neutrality goals and the utilization of water, land, and energy resources have gradually intensified, resulting in increasing uncertainty and systemic risks.
Numerous scholars have investigated the interactions and feedback mechanisms between pairs of resource elements from multiple perspectives. For example, research on the “water–land” relationship mainly examines the coupling between water and soil resources [5], the carrying capacity of water–land systems [6], the optimal regulation of water and land resources [7], the matching of agricultural water and land resources [8], the balance between water and soil resources [9], and the effects of land use and land cover on water quality [10]. Research on the “water–energy” nexus focuses on the interdependence between water resources and energy systems [11], the security management of water and energy resources [12], energy consumption in water resource development and utilization [13], and water consumption during energy production and extraction [14]. Studies examining the relationship between individual resource elements and carbon emissions mainly address carbon emissions associated with water resource use [15], the effects of land use change on carbon emissions [16], and emissions generated from energy production and consumption [17]. The spatial representation of energy elements has long been a key issue in related research. Due to the difficulty in obtaining high-resolution energy statistical data, previous studies have widely employed nighttime light data as a proxy variable for energy consumption and the intensity of human activities. Relevant studies have demonstrated that nighttime light intensity is significantly correlated with regional electricity consumption, economic development level, and carbon emissions and can be used to effectively characterize the spatial distribution of energy consumption at the regional scale. Therefore, nighttime light data have been widely adopted as an important approach for the spatial representation of energy elements [18,19].
Scholars have increasingly recognized the coupling mechanisms among different resource elements. Studies on the interactions and feedback among three resource elements have gradually emerged, covering multiple spatial scales, including national [20] and regional [21] levels. These studies mainly focus on the coupling relationships among “water–energy–carbon”, “water–land–energy”, and “water–land–carbon” systems [22], as well as system risk assessment [23], collaborative security optimal regulation [24], and evaluations of energy conservation and emission reduction policies [25]. Coordinating the interactions and constraints among multiple resource elements and promoting resource-efficient, low-carbon production and lifestyles have become key research topics in academia. Some scholars have carried out preliminary attempts to explore the interactions among the four “water–land–energy–carbon” elements, including studies on their relationships in agricultural management [26], their coupling in industrial production [27], and the network characteristics of “water–land–energy–carbon” nexus systems in regions and river basins [28]. Previous studies have not only revealed the spatiotemporal dynamics of interactions and feedback within the “water–land–energy–carbon” nexus system but have also proposed pathways that promote sustainable development from resource optimization and policy regulation perspectives. However, a systematic understanding of the overall synergistic effects within this multi-element system still needs to be further deepened. Particularly in the context of megacities or regions with high-intensity development, water scarcity, land use transformation, increasing energy consumption, and carbon emissions constraints often coexist. Under such conditions, the elements are not only coupled but may also generate cumulative effects and synergistic risks in cases of improper allocation or management imbalance. For instance, the expansion of construction land may encroach upon cultivated land resources and increase energy demand, thereby driving an increase in carbon emissions, while water resource constraints may further intensify conflicts between land and energy use, ultimately resulting in systemic pressures arising from multi-element interactions. Therefore, extending the traditional “water–energy–food” nexus to a comprehensive analytical framework that incorporates “land” and “carbon”—namely, the “water–land–energy–carbon” nexus system—is of great theoretical significance and practical necessity for revealing the complex feedback mechanisms and potential risks under multi-element interactions.
The Beijing–Tianjin–Hebei region is a key area where water, land, energy, and carbon emissions interact, and it faces significant challenges related to resource supply–demand imbalance and environmental constraints. The coordinated development of the Beijing–Tianjin–Hebei region has entered a critical stage, in which green development and low-carbon transformation have become inevitable trends, while the urgency of ecological civilization construction continues to increase [29]. Existing studies have characterized the relationships, interactions, and coupling mechanisms of the “water–land–energy–carbon” nexus system from various resource and environmental perspectives, and they have researched collaborative optimization strategies. However, research that comprehensively considers the “water–land–energy–carbon” nexus system at the regional scale remains in an exploratory stage. Most studies have primarily focused on the strength of inter-element relationships or static coupling, while insufficient attention has been focused on the dynamic evolution of multi-element systems in the spatiotemporal dimension. In particular, there is a lack of research that reveals the interaction processes among elements from the perspective of migration paths, and the coupling mechanisms of migration paths remain unclear. In view of this, this study takes the Beijing–Tianjin–Hebei region as the study area. Based on multi-source raster data from 2002 to 2023, the Coefficient of Variation and Shannon entropy were employed to quantify the spatiotemporal stability of each element in the “water–land–energy–carbon” nexus system. Combined with their increasing and decreasing trends, the spatiotemporal evolution patterns of the elements were revealed. Furthermore, the geometric centroids of each element were extracted to identify their migration paths during the spatiotemporal evolution process. A Dynamic Time Warping (DTW) algorithm was then applied to couple the migration paths of multiple elements, through which key nodes, pathways, and coordinated evolution characteristics of element migration were identified. On this basis, a dual driving mechanism dominated by natural factors and human activities was proposed, and the intrinsic mechanism of path coupling during migration was elucidated, with the aim of providing a reference for regional resource optimization and low-carbon transition.
2. Overview of the Study Area and Data Sources
2.1. Overview of the Study Area
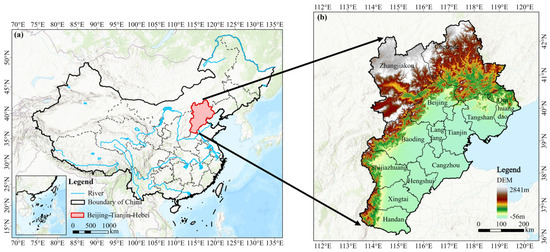
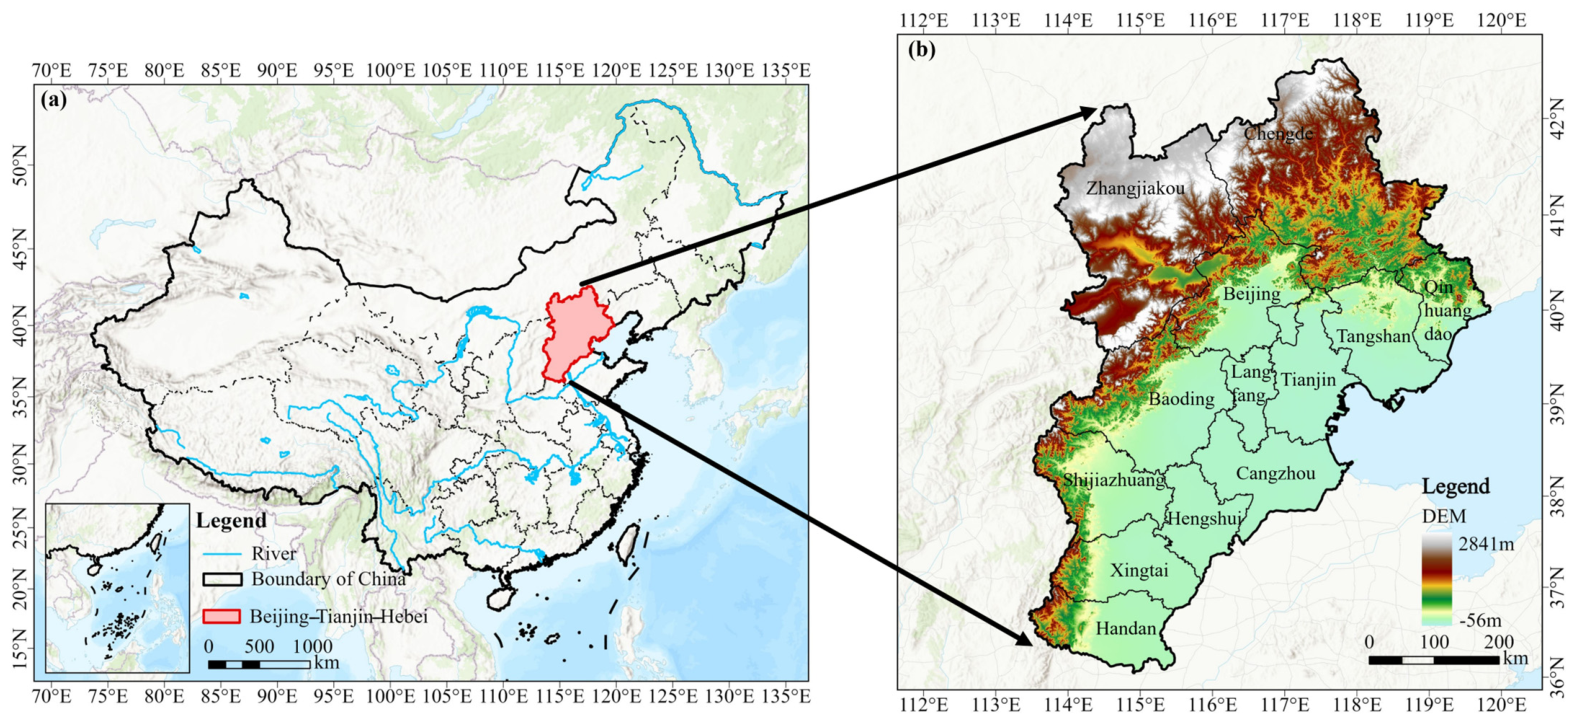
The Beijing–Tianjin–Hebei region, comprising Beijing, Tianjin, and Hebei Province, is the largest and most dynamic economic region in northern China (Figure 1). Driven by rapid industrialization and urbanization, the region has become a highly concentrated hub of population and economic activity. It supports 7.76% of the national population, 6.35% of the irrigated land, and 8.29% of the national GDP, while accounting for only 2.00% of the country’s land area and 1.17% of its water resources. Meanwhile, total carbon emissions in the Beijing–Tianjin–Hebei region account for more than 10.00% of the national total, making it one of China’s major carbon-emitting regions. Water, land, energy, and environmental security in the region have long been in a state of imbalance. Furthermore, the continuous expansion of impervious surfaces, such as urban construction and transportation land, has weakened the region’s soil and water conservation capacity. Additionally, energy consumption in the region has continued to increase since 2000, with total carbon emissions reaching approximately 1.25 billion tons in 2024, thereby exerting substantial pressure on emission reduction efforts.
Figure 1.
Schematic diagram of the study area: (a) The Location of Beijing–Tianjin–Hebei in China, (b) The topographic distribution of Beijing–Tianjin–Hebei.
2.2. Data Sources
This study integrates multi-source datasets (Table 1). All data were standardized to the coordinate system EPSG:3857, and the spatial resolution was resampled to 500 m × 500 m to ensure spatial consistency among different elements. Due to differences in the spatial resolutions of the original datasets, the resampling process during scale unification may introduce potential uncertainties and “mixed pixel” effects. However, this study primarily focuses on the overall evolutionary characteristics and migration path patterns of elements at the regional scale. The analytical methods employed emphasize the overall structural features of spatial distribution and are relatively insensitive to fine-scale pixel-level variations. Therefore, the impact of resampling is reduced to a certain extent. On this basis, unifying the spatial resolution effectively improves comparability among different datasets and avoids systematic biases caused by scale inconsistencies.
Table 1.
Data types and sources.
This study focuses on the spatiotemporal evolution and migration path characteristics at the regional scale. The influence of mixed pixels on overall trend identification and the determination of dynamic coupling relationships is, therefore, relatively limited. The analytical methods employed emphasize the overall spatial structural patterns rather than fine-scale pixel-level variations, which further mitigates the impact of resampling. On this basis, unifying the spatial resolution effectively enhances comparability among different datasets and avoids systematic biases caused by scale inconsistencies [30].
Water resource data were obtained from the terrestrial water and groundwater products developed by the research team led by Xiong and Feng at Sun Yat-sen University. These data integrate large-scale temporal information on terrestrial water changes derived from satellite gravimetry with high-resolution spatial information on different water storage components from land hydrological models to isolate groundwater variations [31]. The land use data were obtained from the 30 m annual land cover dataset of China developed by a research team led by Yang and Huang at Wuhan University. Based on 5463 visually interpreted samples, the dataset achieves an overall classification accuracy of 80% [32]. Nighttime light data were obtained from the NPP-VIIRS-like nighttime light dataset developed by a research team led by Chen and Yu. This dataset applies a cross-sensor correction scheme integrating DMSP-OLS and NPP-VIIRS data. It maintains parameter consistency with NPP-VIIRS nighttime light data and achieves comparable data quality [33]. Carbon emissions data were obtained from the Emissions Database for Global Atmospheric Research (EDGAR). The data used in this study represent fossil CO2 emissions, including all fossil-fuel-related CO2 sources. In this study, carbon emissions refer exclusively to CO2 emissions and exclude other greenhouse gases [34,35].
3. Research Methods
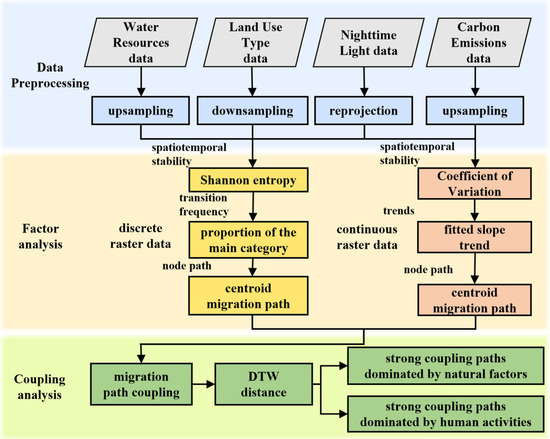
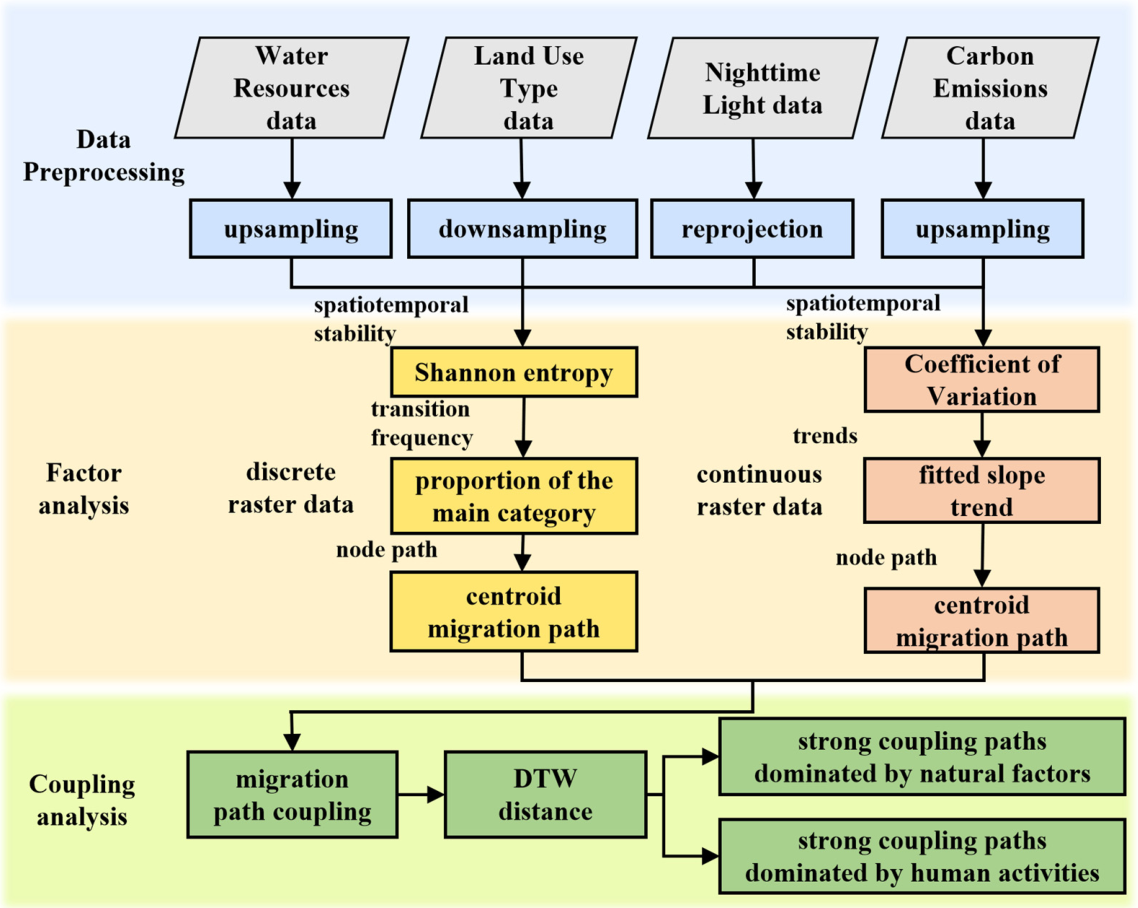
This study adopts a spatiotemporal perspective and uses two-dimensional raster data to analyze the evolution patterns of elements and the coupling characteristics of their migration paths within the “water–land–energy–carbon” nexus system in the Beijing–Tianjin–Hebei region. The overall technical route is illustrated in Figure 2. Initially, we preprocessed multi-temporal raster data to calculate the stability and increasing or decreasing trends for each element, revealing the spatiotemporal evolution patterns of these elements. Subsequently, we then identified the spatiotemporal migration paths of each element, coupled these migration paths using Dynamic Time Warping, and explored their coupled characteristics.
Figure 2.
Technical roadmap.
3.1. Coefficient of Variation
The Coefficient of Variation (CV) is commonly used to assess the stability of continuous raster data. By overlaying multi-temporal raster datasets and constructing a pixel-level time series, the CV is calculated to measure the relative variability of pixel values over time. A higher CV indicates greater temporal variability in the time series data, whereas a lower CV indicates higher stability [36].
where represents the standard deviation, and represents the average.
3.2. Least Squares
Based on individual pixels of continuous raster data, the least squares method is employed to calculate their slopes, aiming to explore their increasing or decreasing trends and distribution. A k-value greater than 0 indicates an increasing trend, while a negative k-value indicates a decreasing trend [37]:
where is the length of the time series, represents the time point, represents the mean value at the time point, represents the value of the pixel in the i-th image, and represents the temporal mean value of the pixel. To test the significance of the trend, a t test was performed on the slope based on a linear regression model, with p < 0.05 adopted as the criterion for statistical significance. If p < 0.05, the pixel’s trend was considered statistically significant; otherwise, it was regarded as not significant.
3.3. Shannon Entropy
Discrete raster data typically employs entropy indices to assess its degree of mixing. Shannon entropy can be used to measure the diversity or degree of chaos in the land use types experienced by a pixel throughout the time series. The greater the uncertainty of a variable, the higher the degree of mixing, indicating more drastic changes in land use types and higher entropy. Conversely, lower entropy indicates greater stability [38]. It essentially reflects the complexity and uncertainty of land use type changes and does not possess explicit positive or negative attributes; its magnitude is primarily used to characterize the intensity of spatiotemporal evolution:
where represents the number of different types experienced by the pixel, and represents the frequency of the j-th land use type, which is the percentage of its occurrence.
3.4. Centroid Calculation
Extracting the geometric centroid of raster data reveals the centroid evolution trend of long-term time series data in the temporal dimension, and it reflects the spatial concentration of data in the spatial dimension, thereby depicting the migration path of data distributions in spatiotemporal evolution [39]. Centroid migration analysis is an aggregate statistical method based on the overall spatial distribution. Its results primarily reflect the evolution of spatial structure at the regional scale, and they are not sensitive to errors at the local pixel level. Therefore, even if a certain degree of uncertainty is introduced during the resampling of multi-source data, the main conclusions regarding the overall evolution trend in centroid migration will not be affected. In continuous raster data, where pixels have different numerical values, a weighted centroid is used:
where (,) represents the central coordinate of the pixel, and represents the pixel value (weight).
If all pixels in the discrete raster data have equal weights, the average coordinates of all non-empty pixels are calculated:
where (,) represents the central coordinates of non-empty pixels, and n denotes the total number of non-empty pixels.
3.5. Dynamic Time Warping
Dynamic Time Warping (DTW) is a method used to measure the similarity between two time series under a nonlinear time scale, and it enables optimal matching between sequences by elastically stretching or compressing the time axis. In contrast, methods such as correlation analysis, regression, and principal component analysis mainly capture synchronous variation among variables; thus, they have difficulty reflecting potential lagged responses and path misalignments during spatial migration among different elements.
The centroid migration paths of elements within the “water–land–energy–carbon” nexus system exhibit pronounced stage-wise and asynchronous characteristics. DTW can effectively identify evolution processes with time lags or phase misalignments. By progressively stretching or compressing elements within the time series to achieve the optimal alignment, the cumulative distance is calculated, and a cumulative distance matrix is ultimately obtained. The minimum value in this matrix indicates the similarity between two time series [40,41]. U(G, H) represents the total distance of a certain path, starting from the starting point (1, 1) and ending at the end point (t, m), used to obtain the globally optimal path [42,43]. The DTW algorithm is shown in Equation (6):
The DTW distance reflects the cumulative difference between two time series along the optimal matching path. A smaller value indicates a higher similarity in terms of variation trends and evolution paths, whereas a larger value suggests greater differences in their evolution processes. Therefore, the DTW distance can be used to characterize the degree of dynamic coupling between the migration paths of different elements.
4. Results and Analysis
4.1. Spatiotemporal Evolution and Migration Path of Water Resources
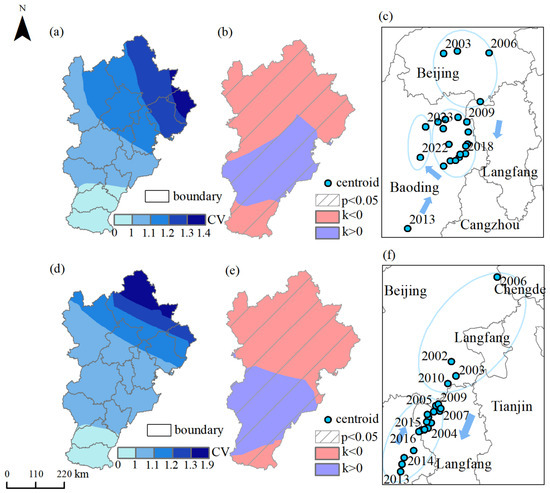
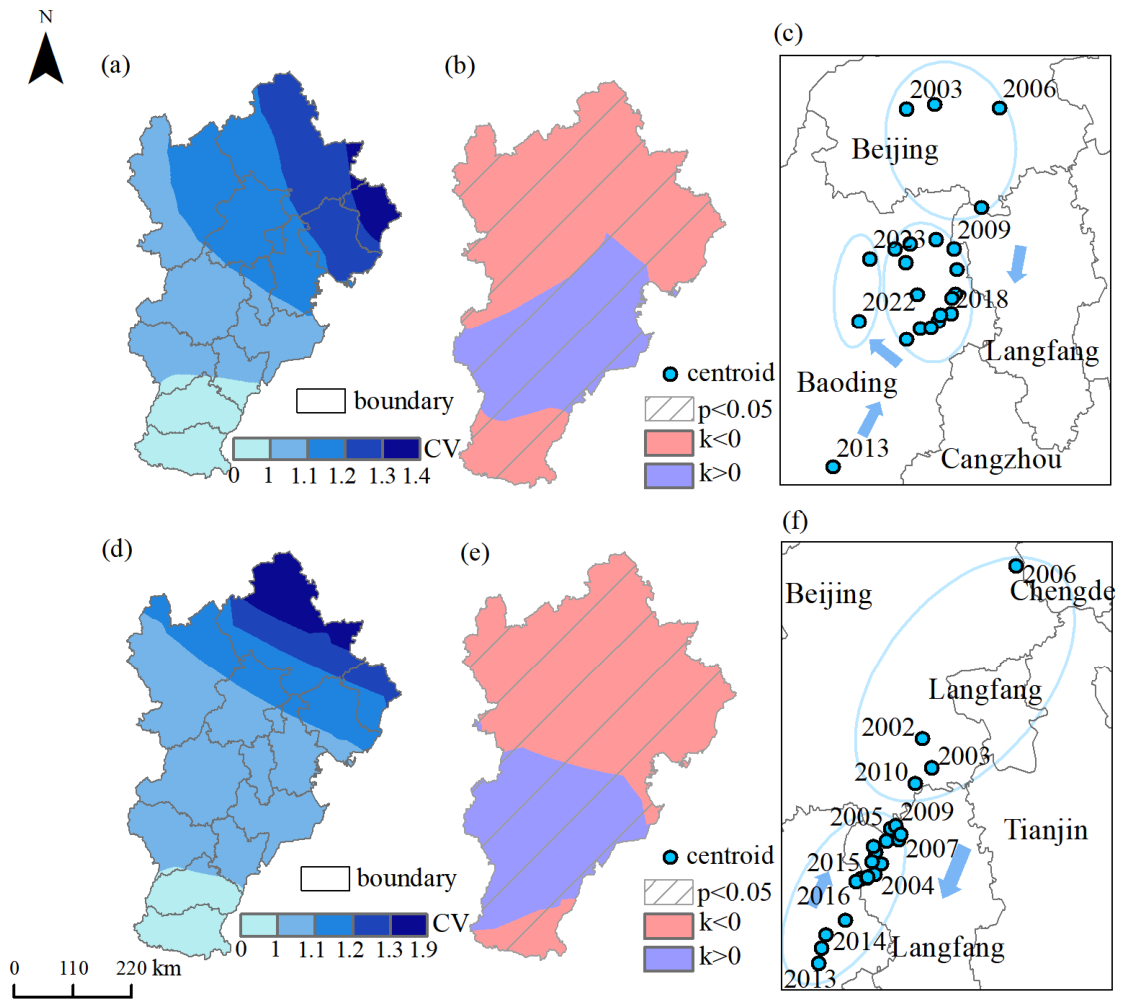
Water reserves are important indicators for characterizing changes in regional water resources. As shown in Figure 3, terrestrial water and groundwater exhibit similar patterns in both stability and increasing or decreasing trends. From 2002 to 2023, the Coefficient of Variation in terrestrial water ranged from 0 to 1.4, whereas that of groundwater ranged from 0 to 1.9. This result indicates that groundwater are more volatile, likely due to intensive human extraction and delayed recharge processes [44]. The Coefficient of Variation for both types of water generally increases from south to north and from west to east. Regions with significant interannual fluctuations are mainly located in the northeastern part of the study area.
Figure 3.
Spatiotemporal evolution and migration path of water resources: (a) Coefficient of Variation of Terrestrial Water, (b) Slope of Terrestrial Water, (c) Centroid of Terrestrial Water, (d) Coefficient of Variation of Groundwater, (e) Slope of Groundwater, (f) Centroid of Groundwater. Note: The arrow indicates the direction of the centroid’s movement.
Using the least squares method, the temporal series of water resources was fitted to identify trends, and statistical significance was assessed based on a regression significance test (p < 0.05). The results indicate that the proportion of statistically significant pixels for both terrestrial water and groundwater reached 100% across the study area. This suggests that the observed variations in water resources are statistically significant rather than random fluctuations, exhibiting consistent temporal evolution characteristics. This pattern can be attributed to the nature of water resources as a slow-changing variable, which is driven by long-term and relatively stable factors, including climate change, groundwater extraction, and large-scale human interventions such as the South-to-North Water Diversion Project. Consequently, the time series demonstrates a clear unidirectional trend with relatively low stochastic variability, resulting in the widespread statistical significance of the detected trends.
In terms of change trends, both types of water reserves show a spatial pattern characterized by decreases in the northern and southern areas and increases in the central region. Specifically, terrestrial water and groundwater show increasing trends in the southern areas of Shijiazhuang, Baoding, Hengshui, Xingtai, and Langfang. In contrast, both types of water reserves exhibit decreasing trends in the northern areas of Beijing, Chengde, Zhangjiakou, Tangshan, Qinhuangdao, Handan, and Langfang. In Tianjin, terrestrial water exhibit an increasing trend, whereas groundwater exhibit a decreasing trend.
As shown in Figure 3c,f, the centroid migration paths of terrestrial water and groundwater are highly coupled. The migration distances are 813.48 km and 833.65 km, with direction angles of 209.85° and 211.82°, respectively (true north = 0°, angles increasing clockwise). Both centroids initially migrated southward and then gradually returned northward.
Except for 2004, the centroid of terrestrial water was located within Beijing from 2002 to 2006. Since 2007, it moved southward to Baoding, reaching its southernmost point in 2013 (115.36° E, 38.51° N). Since the central route of the South-to-North Water Diversion Project began supplying water to the Beijing–Tianjin–Hebei section in 2014, the regional water supply structure has undergone significant adjustments. Transferred water has gradually replaced groundwater as a major water source, thereby alleviating water use competition within the study area [45]. According to the China Water Resources Statistical Yearbook (2009–2024), groundwater supply in Beijing decreased from 2.29 billion m3 in 2008 to 1.24 billion m3 in 2023, representing a reduction of nearly 50%. In Tianjin, groundwater supply declined from 0.63 billion m3 in 2008 to 0.26 billion m3 in 2023. Similarly, in Hebei Province, groundwater supply continuously decreased from 15.62 billion m3 in 2008 to 7.50 billion m3 in 2023, indicating a substantial reduction in groundwater extraction. These changes indicate that the South-to-North Water Diversion Project has reshaped the regional water supply pattern at a large scale. By introducing external water sources, dependence on groundwater has been reduced, thereby promoting a northward rebalancing of the spatial distribution of water resources.
The centroid of terrestrial water has been consistently located in the northeastern part of Baoding (115.90° E, 39.17° N). During 2022–2023, the centroid shifted northwestward and was located at approximately 115.67° E, 39.33° N in 2023, remaining close to its position in relatively stable years. The migration path of the groundwater centroid is broadly consistent with that of terrestrial water. However, during 2002–2006, its centroid was located within Beijing. Since 2007, it has migrated southwestward toward Langfang. From 2007 to 2020, it remained mainly concentrated near the boundary between Langfang and Baoding (116.31° E, 39.34° N). In 2013, 2014, 2021, and 2022, it shifted further southwest to Baoding, reaching its southernmost point in 2013 (115.93° E, 38.99° N). Due to the influence of the South-to-North Water Diversion Project, the centroid began moving back northward in 2014, and by 2023, it had returned northeastward to 116.29° E, 39.41° N, close to its position during years of stable groundwater.
4.2. Spatiotemporal Evolution and Migration Path of Land Use
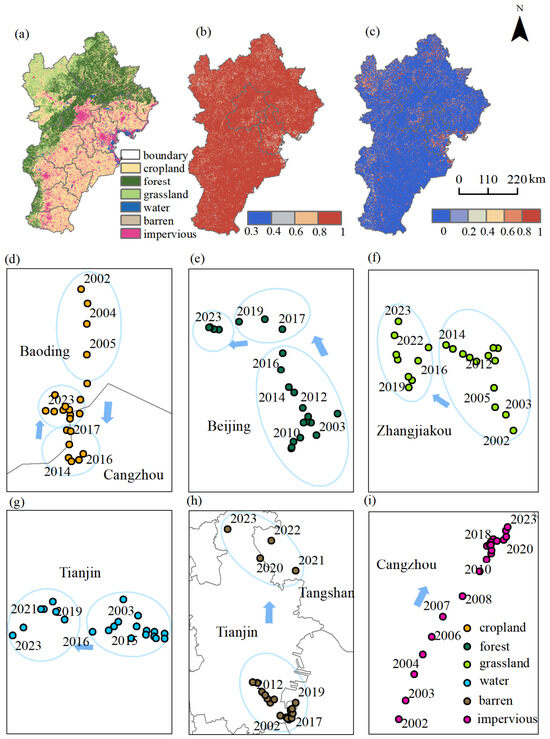
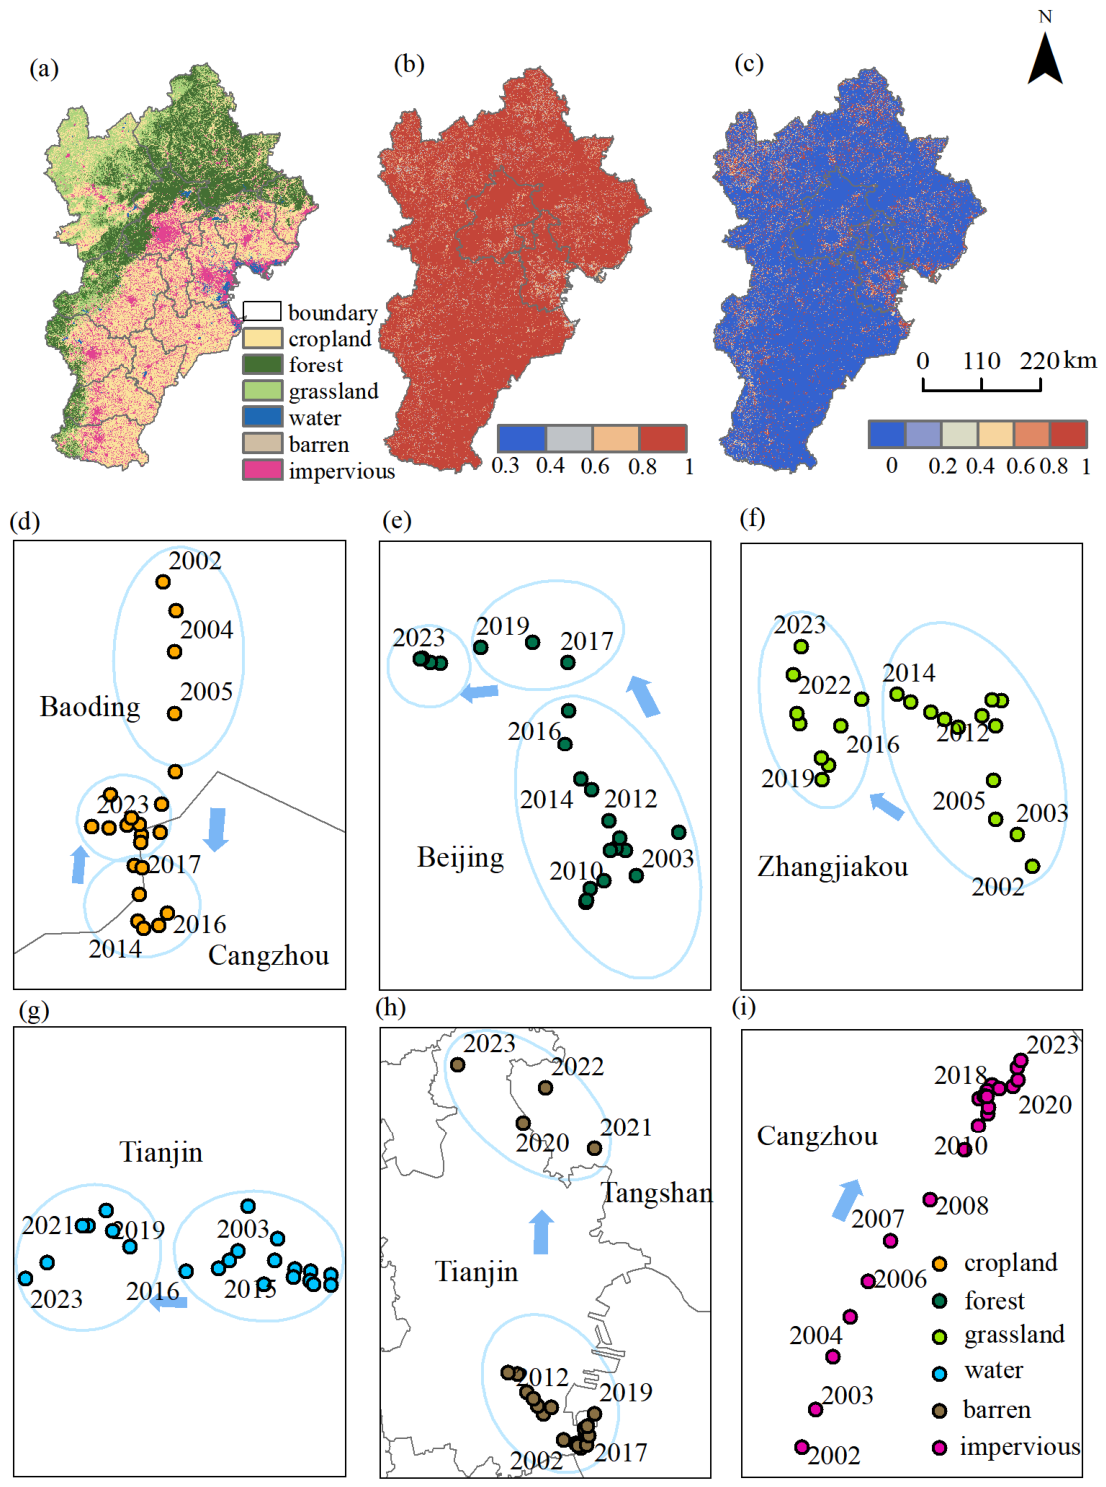
As shown in Figure 4, changes in land use patterns reflect the combined influence of natural factors and human activities on the regional environment. Overall, land use in the Beijing–Tianjin–Hebei region remains relatively stable, with the main change being the conversion of cropland to impervious for impervious purposes [46], illustrating the impact of urbanization pressure. In central urban areas, fully urbanized surroundings, and along key economic and population growth corridors, land use entropy values are generally high, indicating the diversification of land use types, rapid expansion of newly added impervious, and increased mixing of land use types. In these regions, the integration of multifunctional land use and the frequent transformation of land use types represent a comprehensive manifestation of structural adjustment and spatial reorganization during the process of urbanization. In contrast, agricultural and ecological areas exhibit more homogeneous land use and lower entropy values, reflecting relatively stable land patterns.
Figure 4.
Spatiotemporal evolution and migration paths of land use: (a) Main Land Use, (b) Proportion of Main Land Use, (c) Shannon Entropy of Land Use, (d) Centroid of Cropland, (e) Centroid of Forest, (f) Centroid of Grassland, (g) Centroid of Water, (h) Centroid of Barren, (i) Centroid of Impervious. Note: The arrow indicates the direction of the centroid’s movement.
Centroid migration paths vary significantly among different land use types. Natural ecological lands, such as forest, grassland, and water, generally shift westward. Barren and impervious shift northward, while cropland initially moves southward before returning northward. The centroids of forest and grassland have similar migration angles at 309.87° and 318.80°, respectively, both moving northwest with relatively stable distributions. Forest centroids are consistently located in Beijing, whereas grassland centroids remain in Zhangjiakou, demonstrating the stability of ecological land in the northwestern mountainous areas. Water centroids shift almost directly westward and remain stable in Tianjin. The centroid of barren migrates a significant distance of 446.09 km, primarily northward, and is located in Tianjin in most years except 2021 and 2022, when it was in Tangshan. Impervious centroids move northeastward with a direction angle of 36.90°, showing a gradually concentrated distribution and reduced migration distance, all situated in Cangzhou, indicating increasingly stable development and utilization. Cropland centroids gradually shifted southward from Cangzhou between 2002 and 2013, reaching the southernmost point at 116.11° E, 38.91° N in 2013, and subsequently returned northward. By 2023, the centroid had moved back to Baoding (116.10° E, 38.94° N), consistent with the migration path of water resource centroids, highlighting the strong dependence of agricultural activities on water resource distribution.
4.3. Spatiotemporal Evolution and Migration Path of Energy
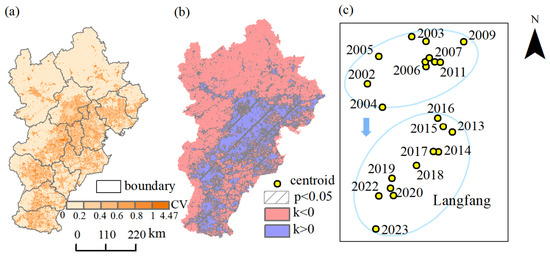
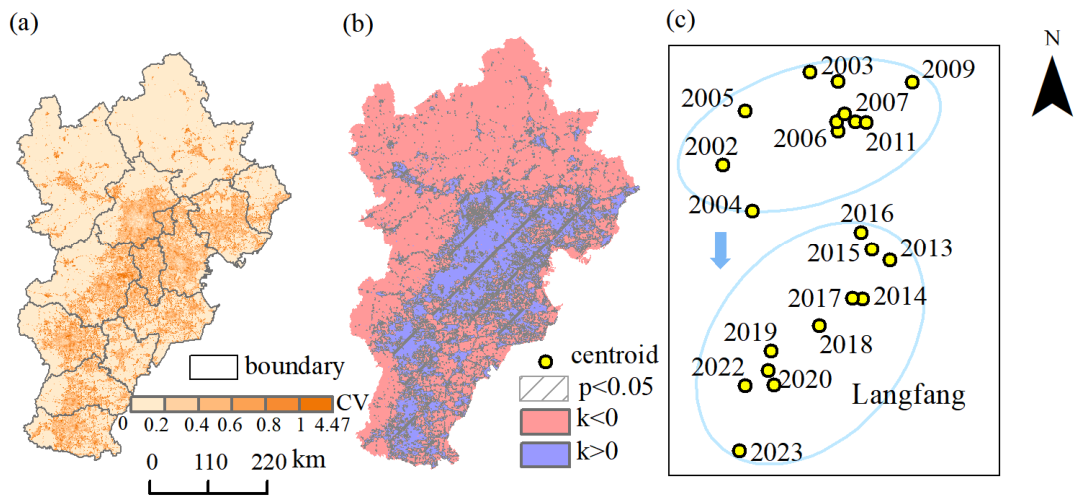
Energy intensity is closely linked to human activities, and the total radiance of nighttime light data is commonly used as a proxy for energy consumption levels [47]. As shown in Figure 5, the Coefficient of Variation of nighttime light intensity exceeds 0.2 in regions with positive slopes, which are primarily located in major urban centers and urban expansion zones. This indicates an overall increase in light brightness, reflecting rapid growth in energy consumption and economic development, particularly in Beijing, Tianjin, and the urban cores of Hebei cities, as well as along transportation and industrial corridors. In contrast, mountainous areas and ecological protection zones dominated by forest and grassland exhibit Coefficients of Variation below 0.2 and negative slopes, indicating relatively slower economic development and limited, declining energy consumption.
Figure 5.
Spatiotemporal evolution and migration path of energy: (a) Coefficient of Variation of Nighttime Light, (b) Slope of Nighttime Light, (c) Centroid o Nighttime Light. Note: The arrow indicates the direction of the centroid’s movement.
Using the least squares method, the nighttime light time series was fitted to identify trends, and statistical significance was determined based on a regression significance test (p < 0.05). The results indicate that the proportion of pixels exhibiting significant change in the study area reached 67.64%. These significant pixels largely coincide with regions characterized by positive slopes (k > 0), and they are mainly distributed in urban centers and their surrounding expansion areas. Driven by persistent factors such as urbanization processes, industrial agglomeration, and intensified population activities, the overall trend is dominated by growth. Moreover, due to the strong spatial continuity and expansion inertia of urban development, the spatial distribution of increasing energy consumption demonstrates pronounced statistical significance and spatial consistency.
Regarding the centroid migration of nighttime light, from 2002 to 2023, the centroid remained within Langfang, with a cumulative migration distance of 138.57 km and an overall direction angle of 183.47°, nearly due south. The migration can be divided into two stages: from 2002 to 2012, the centroid shifted northeast, concentrated near northern Langfang (116.63° E, 39.38° N); from 2013 to 2023, it shifted southwest, reaching the southwestern edge in 2023 (116.50° E, 39.16° N). This southward movement reflects the gradual relocation of the economic center in the Beijing–Tianjin–Hebei region, driven by industrial transfers from the Beijing–Tianjin metropolitan area to Hebei and the development of new areas, such as Xiong’an New Area, which alleviates non-capital functions in Beijing and promotes regional economic growth [18].
4.4. Spatiotemporal Evolution and Migration Path of Carbon Emissions
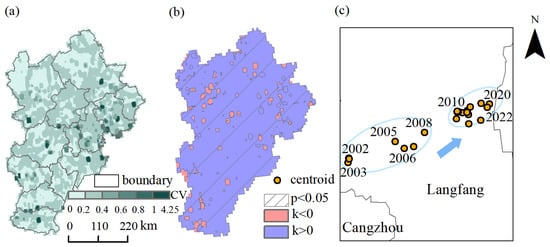
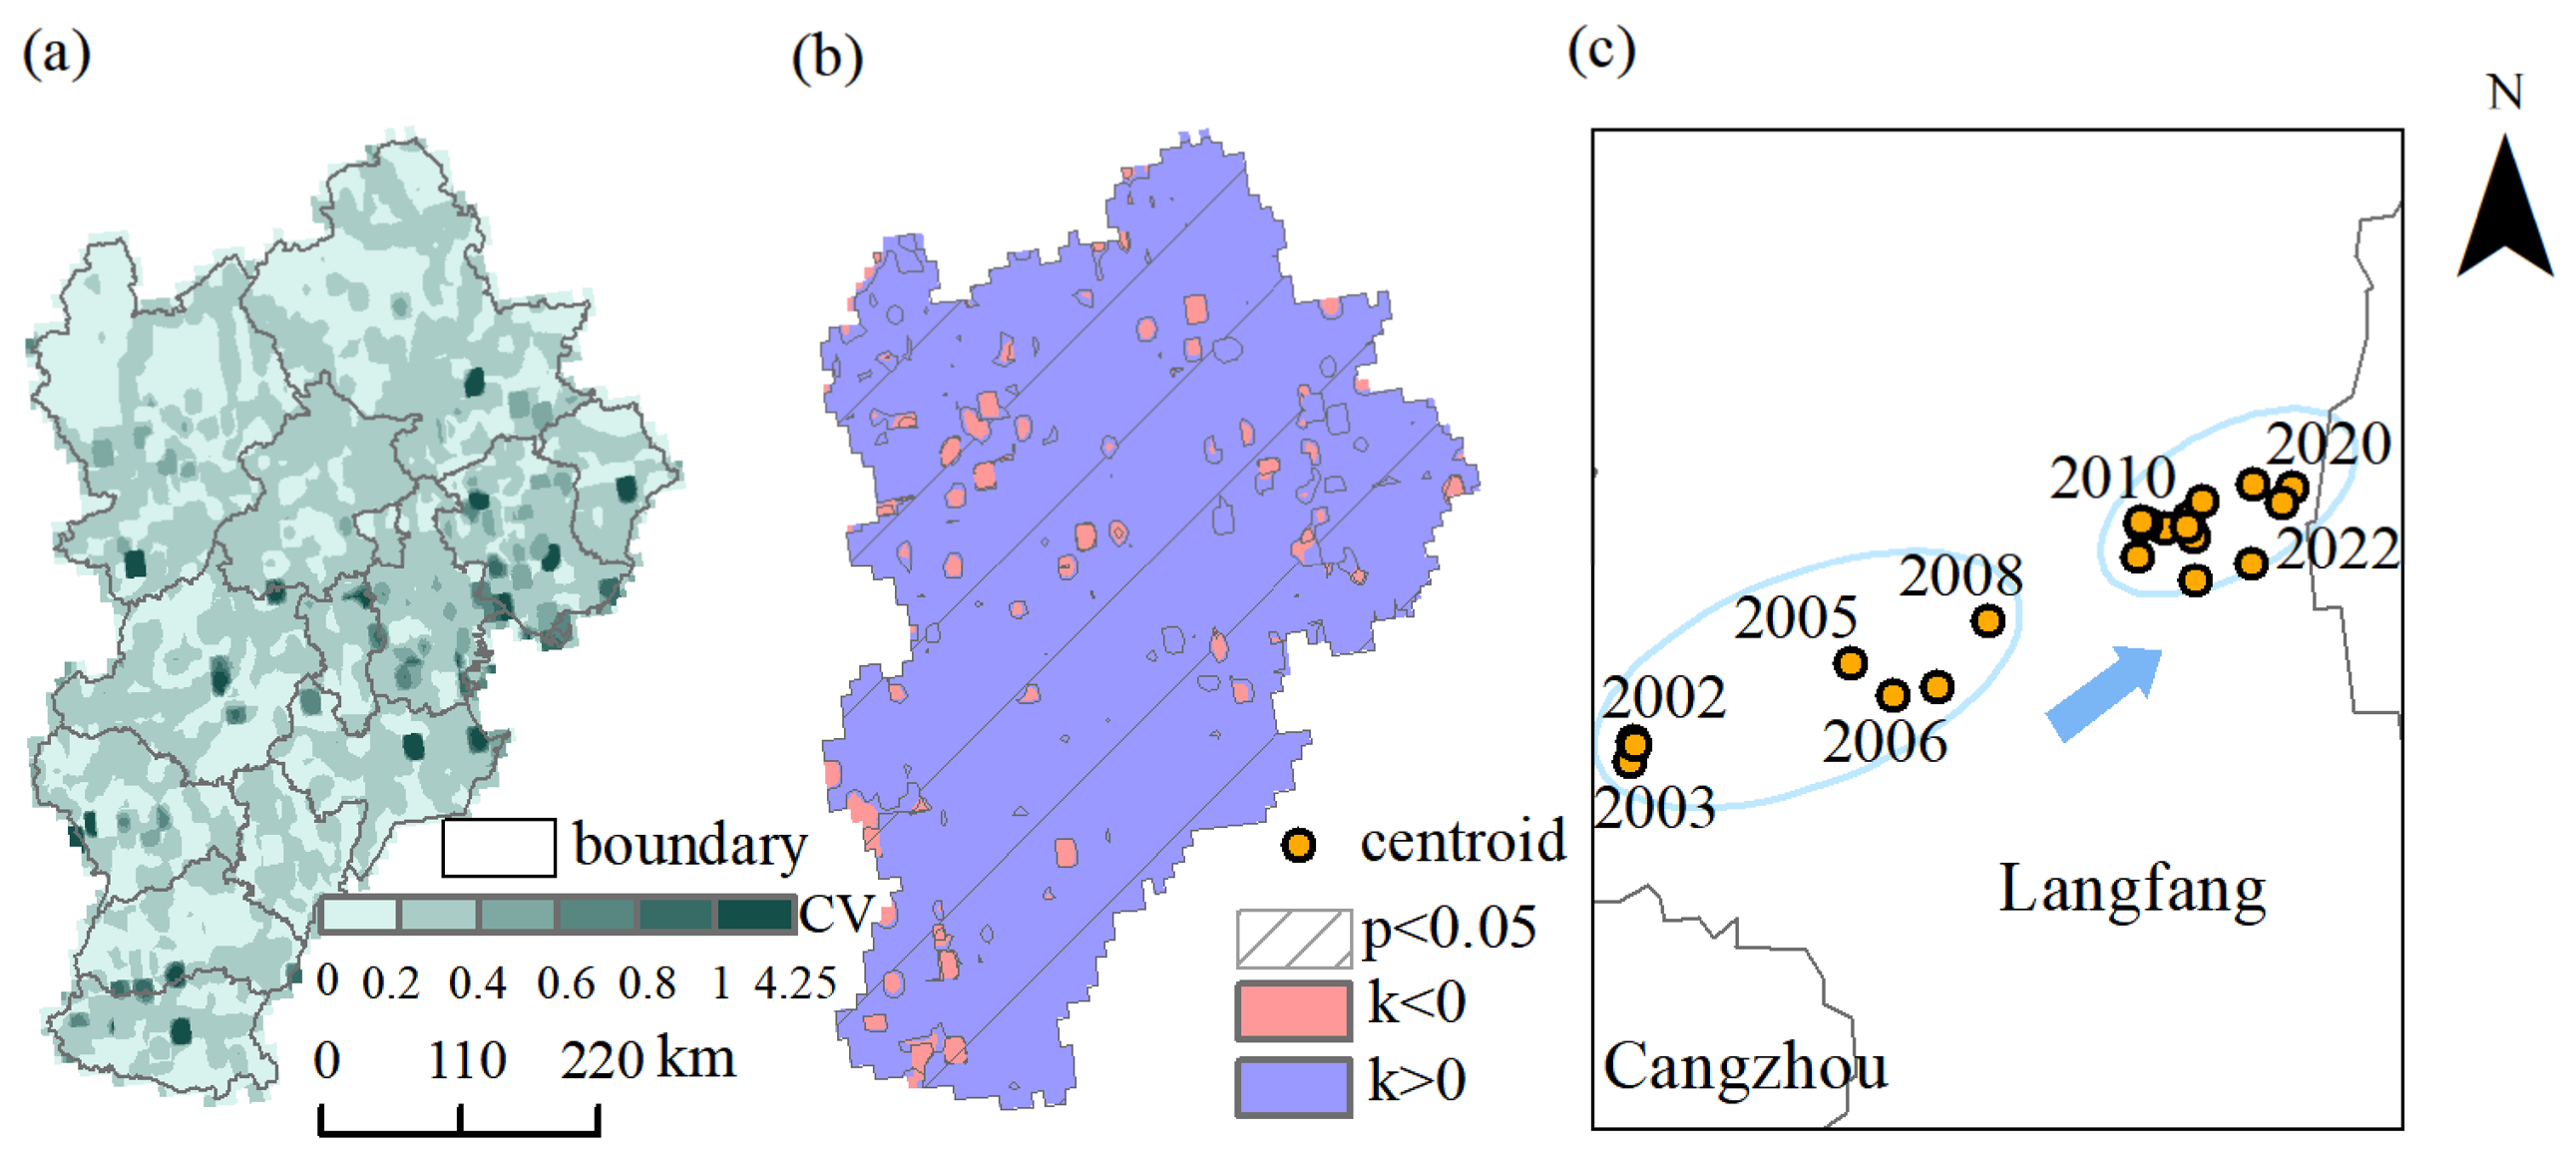
Carbon emissions directly reflect energy consumption and the intensity of industrial activities. As shown in Figure 6, most areas in the Beijing–Tianjin–Hebei region exhibit a Coefficient of Variation greater than 0.2 with a positive slope, indicating an overall increasing trend in carbon emissions, consistent with regional economic growth and rising energy demand. In certain urban centers and fully urbanized areas, however, carbon emissions have decreased due to mature economic structures, industrial optimization and upgrading, and strict environmental regulations. Similarly, in northern and western areas with high vegetation coverage and lower economic activity, carbon emissions have also declined. These patterns highlight the close relationship between the spatial distribution of carbon emissions, industrial structure, policy measures, and natural environmental factors.
Figure 6.
Spatiotemporal evolution and migration path of carbon emissions: (a) Coefficient of Variation of Carbon Emissions, (b) Slope of Carbon Emissions, (c) Centroid of Carbon Emissions. Note: The arrow indicates the direction of the centroid’s movement.
Using the least squares method, the carbon emission time series was fitted to identify trends, and statistical significance was assessed based on a regression significance test (p < 0.05). The results show that the proportion of pixels exhibiting significant change in the study area reached 92.67%. These significant pixels are mainly distributed in regions with positive slopes (k > 0), indicating that variations in carbon emissions are driven by persistent factors such as economic growth, increased energy consumption, and industrial expansion. Meanwhile, the spatial continuity of urban and industrial agglomeration areas further enhances the statistical significance of the observed trends.
The centroids of carbon emissions are consistently located in southern Langfang, migrating a total of 70.42 km toward the northeast with a direction angle of 76.68°. The centroid distribution has become increasingly concentrated and stable, with decreasing migration distances. By 2023, centroids are situated near southeastern Langfang (116.69° E, 38.94° N), closely aligned with the migration path of impervious centroids. This alignment indicates that the migration of carbon emissions centers in the Beijing–Tianjin–Hebei region closely follows the movement of human activity centers.
4.5. Coupling of “Water–Land–Energy–Carbon” Migration Pathways
By comparing the centroid positions, cumulative migration distances, and migration direction angles of various elements listed in Table 2, three typical migration patterns can be identified:
Table 2.
“Water–land–energy–carbon” migration path information.
(1). Southwest Migration Type (200–220°): The southwest migration type includes terrestrial water, groundwater, and cropland. This pattern indicates that the spatial shifts of water resources and cropland tend to converge. Agricultural activities are highly dependent on water distribution, resulting in alignment between agricultural activity and the movement of water resources. In the Beijing–Tianjin–Hebei region, agricultural irrigation follows a multi-source water supply model, in which groundwater serves as one of the primary water sources. In addition, water from the Yellow River and the Haihe River is diverted into irrigation channels through water transfer projects, providing supplementary irrigation for cropland. When regional water resource availability changes, agricultural production intensity and cropland use patterns are adjusted accordingly, which in turn leads to a synchronous shift between the centroid of cultivated land and the center of water resources.
(2). Northwest Migration Type (300–320°): The northwest migration type includes ecological land such as forest and grassland. Migration distances are relatively small, reflecting the stability of natural ecological succession and the northward spatial expansion driven by ecological engineering projects. In the Beijing–Tianjin–Hebei region, under the implementation of major ecological restoration programs, such as the “Grain for Green” project, forest and grassland have been effectively protected, and their spatial distribution has remained relatively stable overall. This indicates that the spatiotemporal evolution of ecological land is primarily driven by ecological projects and policy interventions rather than purely by resource constraint mechanisms, resulting in divergent spatial evolution patterns between ecological and agricultural land.
(3). Southeast and Northeast Migration Type (36–180°): The southeast and northeast migration type includes impervious, carbon emissions, and nighttime light. This pattern reflects the southward and eastward migration of human activity centers, energy consumption, and carbon emissions centers toward urban cores and the eastern economic belt. Under the coordinated development strategy of the Beijing–Tianjin–Hebei region, industrial transfer and functional decentralization have resulted in a significant correlation between the spatial distribution of carbon emissions and the expansion of impervious.
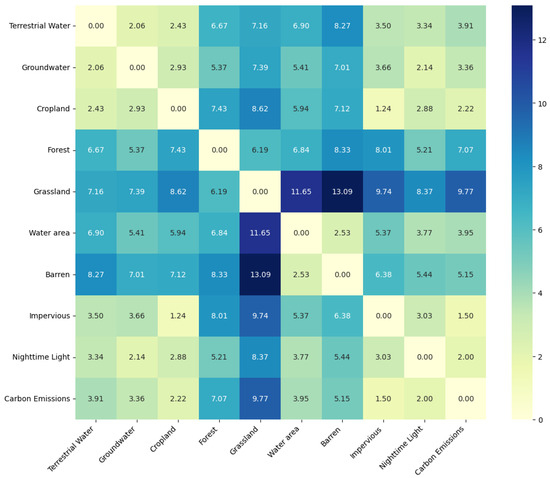
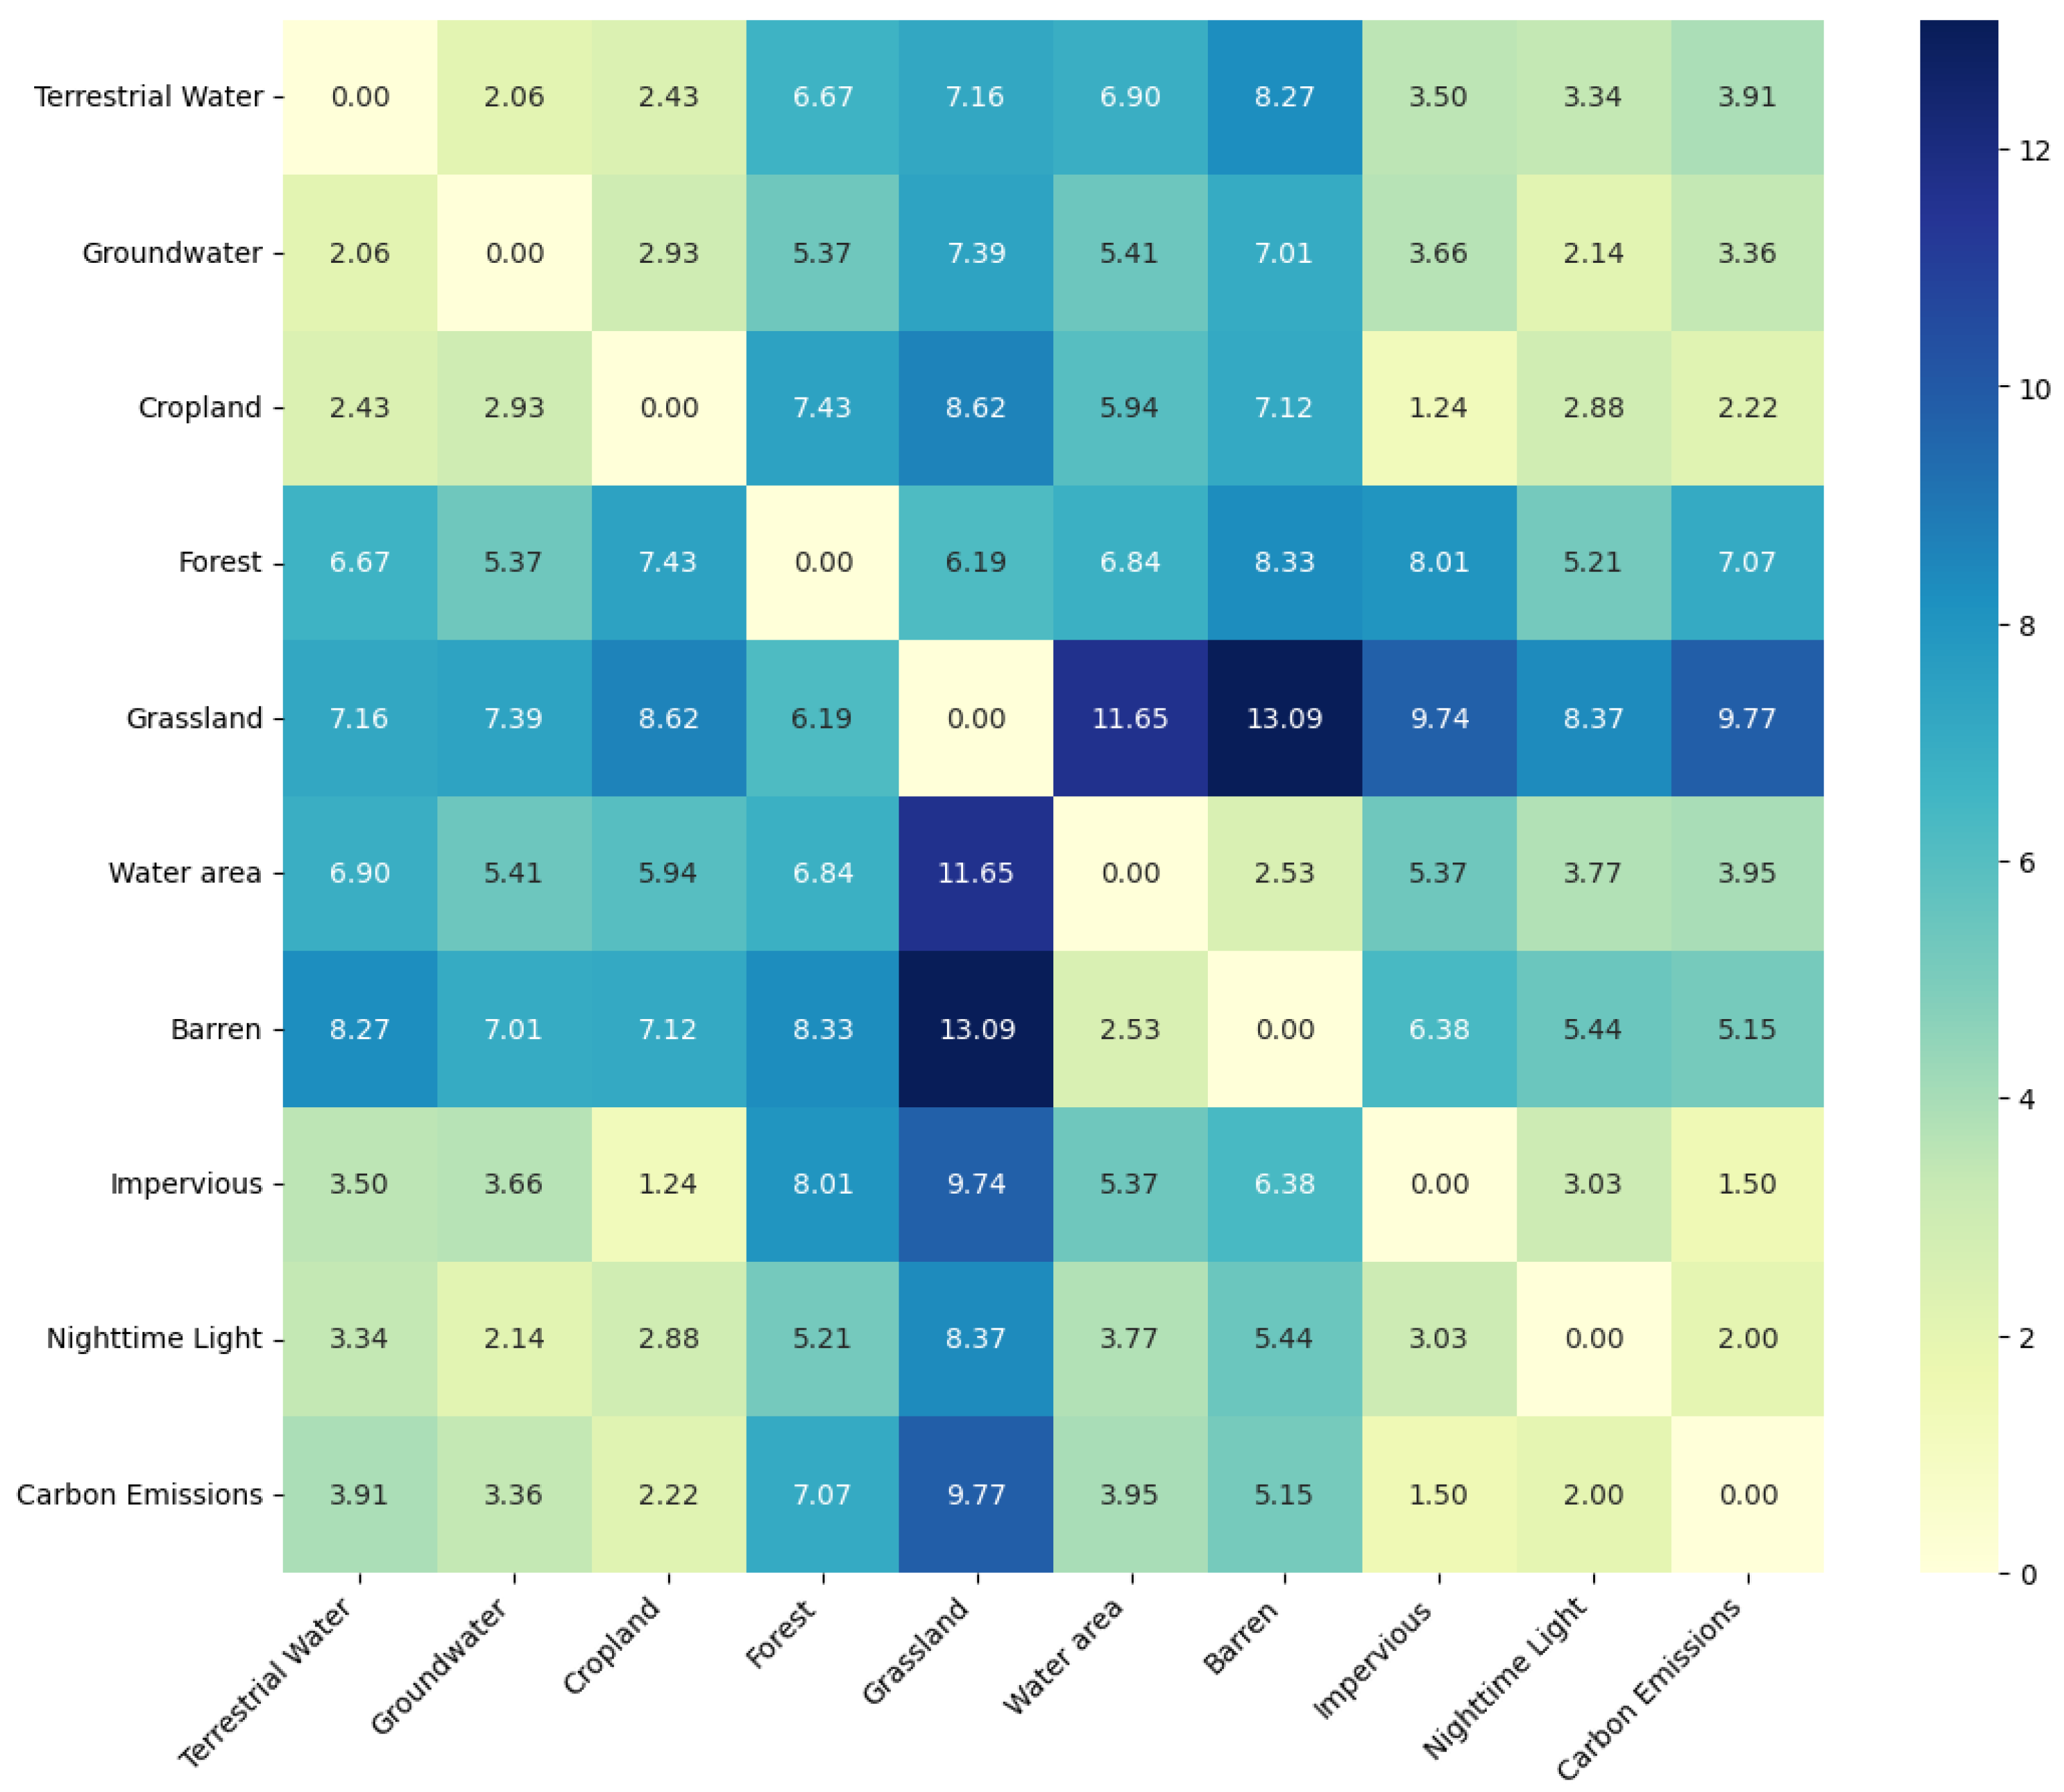
Based on Equation (6), the Dynamic Time Warping (DTW) distance of centroid migration paths for each element was calculated. The initial distance values between each pair of elements were first computed to construct an initialization matrix, after which each value in the matrix was recursively calculated. The minimum value was selected to determine the current path distance. Figure 7 presents the DTW distances between each pair of elements, which are used to couple the migration paths of elements within the “water–land–energy–carbon” nexus system and to explore their dynamic coupling relationships.
Figure 7.
DTW distance of “water–land–energy–carbon” migration path.
Since the DTW distance is a continuous variable, with smaller values indicating higher similarity between two time series in terms of variation trends and evolution paths, it was further classified into different levels to reflect the strength of coupling relationships among elements within the water–land–energy–carbon nexus system. To ensure a consistent classification scale, the overall DTW distance range [0, 13.09] was divided into four equal intervals using the equal-interval method [48]: [0, 3.27), [3.27, 6.54), [6.54, 9.81), and [9.81, 13.09]. As the highest interval [9.81, 13.09] contained relatively few samples, it was merged with the adjacent interval [6.54, 9.81) to improve the stability and representativeness of the classification [49]. Consequently, a three-level classification scheme was established. Specifically, [0, 3.27) was defined as strong coupling paths, [3.27, 6.54) as moderate coupling paths, and [6.54, 13.09] as weak coupling paths, thereby enabling a quantitative categorization of coupling strength. Based on this classification and its practical implications, Figure 7 reveals that two groups of typical strong coupling paths exist within the system.
The first group comprises terrestrial water groundwater, and cropland, whose migration paths exhibit significant spatiotemporal coupling. The DTW distances between any two of these elements are 2.06, 2.43, and 2.93, substantially lower than most other combinations, indicating strong synchronicity and spatial coordination. This highlights that agricultural activities are highly dependent on the spatial distribution of water resources, with the distribution of cropland closely linked to the dynamic evolution of both terrestrial water and groundwater. This coupling structure reflects a water-resource-dominated agricultural allocation pattern, emphasizing the influence of natural endowments on the spatial evolution of agriculture.
The second group includes impervious, nighttime light, and carbon emissions, which also exhibit strong coupling. The DTW distances between impervious, nighttime light, and carbon emissions are 1.50 and 2.00, respectively, indicating that the coupling between impervious and carbon emissions is strongest, followed by nighttime light. As the spatial carrier of urban expansion, the DTW distance between impervious and nighttime light is only 3.03. These three human-activity-related elements demonstrate significant spatiotemporal coupling, reflecting that urbanization and industrial agglomeration are key drivers of regional energy consumption and carbon emissions patterns. The migration of densely populated economic areas simultaneously drives increased energy demand and carbon concentration.
In contrast, ecological land uses such as forest and grassland exhibit generally large DTW distances from other elements, exceeding 6.54 and belonging to the weak coupling paths. Specifically, the DTW distance between grassland and carbon emissions is 7.07, and between grassland and carbon sinks, it is 9.77, indicating strong spatial heterogeneity between ecological element migration paths and carbon-related elements. The relatively independent migration of these ecological elements reflects their dependence on natural succession and ecological protection policies, with limited coupling to elements driven by human activities.
5. Discussion
This study, from the perspective of multi-element coupling within the “water–land–energy–carbon” nexus system, reveals the coupling mechanisms underlying regional element migration paths. Previous studies have analyzed the response mechanisms of carbon emissions based on land use change [50] and have further revealed the relationship between human activities and carbon emissions through energy consumption and the intensity of economic activities [19]. These findings indicate that multiple elements do not evolve independently but instead exhibit significant spatial associations and temporal coordination [51], which is consistent with the conclusions of this study. Building upon this foundation, the present study further extends the analytical framework by shifting from static spatial relationship analysis to dynamic migration path and process-based coupling analysis. At the path level, a dual driving mechanism dominated by natural factors and human activities is proposed. Compared with traditional approaches based on correlation or spatial overlay analysis, this framework enhances the ability to characterize the spatial dynamic coupling processes and intrinsic mechanisms of the “water–land–energy–carbon” nexus system, thereby expanding from “relationship analysis” to “process coupling and mechanism identification” in both methodological framework and analytical perspective.
In this study, nighttime light data are used to represent the energy element, which can effectively reflect the spatial distribution of human activity intensity and energy consumption at the regional scale. However, as an indirect proxy indicator, it still has certain limitations in characterizing the structure and specific types of energy consumption. Future research could integrate more direct energy statistics or high-resolution energy databases to cross-validate and complement the energy element represented by nighttime light data, thereby improving the accuracy and interpretability of the results. In addition, during the processing of multi-source raster data, differences in spatial resolution among datasets inevitably require upscaling or resampling to achieve a unified analytical scale [52]. This process may introduce some degree of uncertainty, but it also provides a practical basis for the development and optimization of multi-scale coupling analysis methods. Future studies could further incorporate multi-scale fusion techniques and scale-consistency correction methods to reduce the impact of scale transformation.
Furthermore, as a typical region characterized by a high level of urbanization and industrialization in China, the Beijing–Tianjin–Hebei region is strongly influenced by multiple factors, including policy regulation, industrial restructuring, and coordinated regional development strategies. This regional specificity increases the complexity of element coupling relationships to some extent. Therefore, it is necessary to conduct comparative studies across different types of regions in the future to test the applicability and robustness of the findings. At the application level, future research could further integrate regional resource constraints and development demands to explore the optimization of water-resource-equivalent land allocation or to develop carbon compensation zoning and coordinated management strategies based on the spatial differentiation of carbon emissions [53]. These efforts would enhance the practical value of multi-element coupling analyses in territorial spatial optimization and low-carbon transition.
6. Conclusions
Based on multi-source remote sensing and statistical data from the Beijing–Tianjin–Hebei region for 2002–2023, this study quantitatively analyzed the coupling characteristics of elements within the “water–land–energy–carbon” nexus system. The spatiotemporal evolution patterns and dynamic coupling of element migration paths were systematically examined using the Coefficient of Variation, the least squares method, Shannon entropy, and the Dynamic Time Warping (DTW) algorithm. The main conclusions are summarized as follows.
Stability and Trends of Key Resources: Terrestrial water and groundwater exhibit similar patterns in stability and trends, although groundwatershow more pronounced fluctuations. Overall land use remains relatively stable, with the primary change being the conversion of cropland to impervious. Nighttime light evolution is concentrated in major urban centers and urban expansion areas, reflecting rapid growth in energy consumption and economic development. Carbon emissions generally show an increasing trend, while some urban centers with mature economic structures, optimized industrial upgrades, and stricter environmental regulations exhibit decreasing carbon emissions.
Migration Paths of Element Centroids: Centroids of terrestrial water, groundwater, and cropland have generally migrated southwest, indicating that agricultural spatial patterns are strongly influenced by the distribution of natural water resources. Ecological land, such as forest and grassland, has migrated northwest over shorter distances, reflecting relatively stable natural succession. In contrast, centroids of impervious, carbon emissions, and nighttime light—elements strongly influenced by human activities—have shifted northeast and southeast with decreasing migration distances, suggesting increasing stability in urbanization processes and the relocation of economic centers.
Strong Coupling Paths Within the System: Two strong coupling paths are identified. The first, terrestrial water–groundwater–cropland, exhibits DTW distances all below 3.27, indicating tight spatiotemporal coupling between water resources and agricultural land. The second, impervious–nighttime light–carbon emissions, has DTW distances all below 3.27 too, representing a strong human-activity-driven coupling linking urban expansion, energy consumption, and rising carbon emissions. These two paths illustrate coupling dominated by natural factors and human activities, respectively, highlighting the distinct drivers shaping the spatial evolution of the Beijing–Tianjin–Hebei region.
7. Recommendations
Regional coordinated governance in the Beijing–Tianjin–Hebei region should be grounded in its coupling mechanisms, with a system-oriented governance model integrating multiple elements. On the one hand, for the coupling mechanism of “terrestrial water–groundwater–cropland,” which is dominated by natural factors, the migration path exhibits a significant pattern of spatially coordinated convergence, indicating that the spatial layout of agriculture is highly dependent on natural resource endowment. Accordingly, governance strategies should shift toward resource-constraint-oriented regulation. Agricultural development boundaries should be delineated based on water resource carrying capacity, and the expansion of high water-consuming agriculture in resource-constrained areas should be strictly restricted. Agricultural production should be guided to moderately concentrate in areas with more favorable resource conditions, while cross-regional ecological compensation and coordinated cropland protection mechanisms should be strengthened to reduce systemic risks arising from the mismatch of natural elements.
On the other hand, for the coupling mechanism of “impervious–nighttime light–carbon emissions,” which is dominated by human activities, the migration path is highly consistent with urban expansion and industrial transfer, reflecting the spatial reorganization of development factors. Therefore, a coordinated regulation mechanism oriented toward urban agglomerations should be implemented. Urban expansion, industrial layout, energy consumption, and carbon emissions should be incorporated into a unified governance framework. Through cross-regional industrial division of labor and functional decentralization, high-energy-consuming and high-emission activities should be transferred in an orderly manner. Meanwhile, a regionally unified coordination mechanism for energy use and carbon emission constraints should be established to achieve the synergistic optimization of spatial development, economic growth, and carbon reduction. Overall, in the Beijing–Tianjin–Hebei region, system coupling relationships should be used as a basis to strengthen cross-regional and cross-sectoral coordination mechanisms and promote the formation of an integrated governance system, thereby enhancing the overall efficiency and sustainability of regional coordinated development.
Compared with the Beijing–Tianjin–Hebei region, where coordinated governance is characterized by multi-element coupling constraints, the Guangdong–Hong Kong–Macao Greater Bay Area [54] has developed a relatively mature coordination model through clearly defined urban functional positioning and division of labor. It emphasizes improving overall development efficiency through institutional coordination and factor mobility in cross-regional resource allocation, industrial collaboration, and infrastructure connectivity. In contrast, the Beijing–Tianjin–Hebei region not only faces challenges related to development disparities and functional division but is also subject to resource and environmental constraints, as well as multi-element coupling effects, rendering coordinated governance more systemically complex. Therefore, in advancing regional coordination, the Beijing–Tianjin–Hebei region should not only strengthen administrative coordination and industrial collaboration but also place greater emphasis on the integrated regulation and system optimization of multiple elements. At the same time, it can draw on the experience of the Greater Bay Area in cross-regional coordination mechanisms and integrated institutional design to promote transformation toward system-based coordinated governance.
Author Contributions
Conceptualization, Methodology, Formal analysis, Writing—review & editing, Data curation, Visualization, Investigation, Writing—original draft, N.Z.; Conceptualization, Funding acquisition, Y.C.; Writing—review & editing, X.G.; Data curation, Visualization, J.W.; Methodology, Formal analysis, Writing—review & editing, Y.X. All authors have read and agreed to the published version of the manuscript.
Funding
This research was funded by National Natural Science Foundation of China, grant number: 52579016, 52379021.
Institutional Review Board Statement
Not applicable.
Informed Consent Statement
Not applicable.
Data Availability Statement
The original contributions presented in this study are included in the article. Further inquiries can be directed to the authors.
Conflicts of Interest
We declare that we do not have any commercial or associative interest that represents a conflict of interest in connection with the work submitted.
Abbreviations
The following abbreviations are used in this manuscript:
| CV | Coefficient of Variation |
| DMSP-OLS | Defense Meteorological Satellite Program—Operational Linescan System |
| DTW | Dynamic Time Warping |
| EDGAR | Emissions Database for Global Atmospheric Research |
| EPSG | European Petroleum Survey Group |
| GDP | Gross Domestic Product |
| NPP-VIIRS | National Polar-orbiting Partnership—Visible Infrared Imaging Radiometer Suite |
| SDGs | Sustainable Development Goals |
References
- Hao, L.; Yu, J.; Wang, P.; Han, C. Analysis of the Water-Energy-Food Nexus System for Sustainable Development and Its Research Framework. Prog. Geogr. 2023, 42, 173–184. [Google Scholar] [CrossRef] [Scilit]
- Li, X.; Huang, G.; Wang, S.; Zhang, X.; Luo, B. Synergistic Management of Water, Energy, and Carbon: A Case Study from Shandong Province, China. Appl. Energy 2025, 381, 125192. [Google Scholar] [CrossRef] [Scilit]
- Wang, H.R.; Zhao, W.J.; Deng, C.Y.; Yan, J.W. Analysis on Issues of Water-Energy-Food Nexus. J. Nat. Resour. 2022, 37, 307. [Google Scholar] [CrossRef] [Scilit]
- Zhang, J.; Dong, Z. Assessment of Coupling Coordination Degree and Water Resources Carrying Capacity of Hebei Province (China) Based on WRESP2D2P Framework and GTWR Approach. Sustain. Cities Soc. 2022, 82, 103862. [Google Scholar] [CrossRef] [Scilit]
- Li, J.; Liu, X.; Huang, W.; Wei, L.; Li, X.; Gao, H. Investigation of the Interactions and Influencing Variables between Water and Land Resources in the Upper Yellow River’s Wind-Sand Region. Ecol. Indic. 2023, 154, 110554. [Google Scholar] [CrossRef] [Scilit]
- Wen, Q.; Sun, J.; Fan, L.; Li, X.; Li, Q. Evaluation of Agricultural Soil-Water Resources Carrying Capacity (ASWCC) and Relation Analysis Based on Entropy Weight TOPSIS in Henan Province. Res. Soil Water Conserv. 2022, 29, 333–338. [Google Scholar] [CrossRef]
- Cheng, H.; Jiang, X.; Wang, M.; Zhu, T.; Wang, L.; Miao, L.; Chen, X.; Qiu, J.; Shu, J.; Cheng, J. Optimal Allocation of Agricultural Water and Land Resources Integrated with Virtual Water Trade: A Perspective on Spatial Virtual Water Coordination. J. Environ. Manag. 2023, 347, 119189. [Google Scholar] [CrossRef] [Scilit]
- Liu, T. Dynamic Evaluation of the Matching Degree and Utilization Condition of Generalized Agricultural Water and Arable Land Resources in China. Trans. Chin. Soc. Agric. Eng. (Trans. CSAE) 2023, 39, 56. [Google Scholar] [CrossRef]
- Zhou, H.; Xia, W.; Lei, G. Balance between Land Use and Water Resources for Cultivated Land and Its Appropriate Scale in Naoli River Basin. Trans. Chin. Soc. Agric. Eng. 2021, 37, 278. [Google Scholar] [CrossRef]
- Wang, W.; Yang, P.; Xia, J.; Huang, H.; Li, J. Impact of Land Use on Water Quality in Buffer Zones at Different Scales in the Poyang Lake, Middle Reaches of the Yangtze River Basin. Sci. Total Environ. 2023, 896, 165161. [Google Scholar] [CrossRef] [Scilit]
- Zeng, M.; Zhang, Y.; Wang, H.; Yang, Y.; Hong, S.; Zhao, Y. Bidirectional Consumption Accounting of Water-Energy Nexus in China. Water Resour. Prot. 2022, 38, 159–165. [Google Scholar]
- Jiang, S.; Wang, J.; Liu, H.; Zhu, Y.; He, G.; Li, W.; Huang, H. Coordinated Development of Water, Food, and Energy in Upper and Middle Reaches of the Yellow River. Chin. J. Eng. Sci. 2023, 25, 180. [Google Scholar] [CrossRef] [Scilit]
- Li, L.; Qiu, G. Analysis on Energy Consumption and Economics of Urban Water Resource Development and Utilization: A Case Study in Shenzhen. Ecol. Econ. 2023, 39, 95–101. [Google Scholar]
- Grubert, E. Water Consumption from Electrolytic Hydrogen in a Carbon-Neutral US Energy System. Clean. Prod. Lett. 2023, 4, 100037. [Google Scholar] [CrossRef] [Scilit]
- Zuo, Q.; Liu, J.; Jiang, G.; Ma, J.; Zhao, C. Two-dimensional decoupling analysis of water resource behavior carbon dioxide emission and economic growth in China. Water Resour. Prot. 2024, 40, 1–9. [Google Scholar]
- Wang, Y.J.; Zhai, C.X.; Liu, C.Y.; Chen, Z.Y. Analysis of Spatiotemporal Differences and Influencing Factors of Land Use Carbon Emissions in Ningxia. Environ. Sci. 2024, 45, 5049–5059. [Google Scholar] [CrossRef] [Scilit]
- Qin, J.; Duan, W.; Zou, S.; Chen, Y.; Huang, W.; Rosa, L. Global Energy Use and Carbon Emissions from Irrigated Agriculture. Nat. Commun. 2024, 15, 3084. [Google Scholar] [CrossRef] [Scilit]
- Tang, Z.; Zhang, Z.; Zuo, L.; Wang, X.; Zhao, X.; Liu, F.; Hu, S.; Yi, L.; Xu, J. Spatial Evolution of Urban Expansion in the Beijing–Tianjin–Hebei Coordinated Development Region. Sustainability 2021, 13, 1579. [Google Scholar] [CrossRef] [Scilit]
- Zhou, S.; Cao, Y.; Yao, J.; Wang, F.; Chang, Z. Spatio-Temporal Distribution and Influencing Factors of Carbon Source/Sink, Carbon Surplus and Deficit in Three Northeast Provinces. Acta Ecol. Sin. 2023, 43, 9266–9280. [Google Scholar] [CrossRef]
- Wang, X.C.; Klemeš, J.J.; Long, X.; Zhang, P.; Varbanov, P.S.; Fan, W.; Dong, X.; Wang, Y. Measuring the Environmental Performance of the EU27 from the Water-Energy-Carbon Nexus Perspective. J. Clean. Prod. 2020, 265, 121832. [Google Scholar] [CrossRef] [Scilit]
- Li, R.; Zhao, R.; Xie, Z.; Xiao, L.; Chuai, X.; Feng, M.; Zhang, H.; Luo, H. Water–Energy–Carbon Nexus at Campus Scale: Case of North China University of Water Resources and Electric Power. Energy Policy 2022, 166, 113001. [Google Scholar] [CrossRef] [Scilit]
- Sun, J.; Liu, Y.; Zhao, R.; Yang, W.; Wu, H.; Peng, C.; Guo, M.; Liu, K. The flow analysis of inter-provincial agricultural water, land and carbon footprints in China based on input-output model. Acta Ecol. Sin. 2022, 42, 9615–9626. [Google Scholar]
- He, G.; Zhang, S.; Yang, X.; Bao, K.; Zhu, Y. Safety evaluation and joint risk probability calculation of Water-Land-Energy systems in Anhui Province. J. Saf. Environ. 2024, 24, 4094–4106. [Google Scholar] [CrossRef]
- Liang, M.S.; Huang, G.H.; Chen, J.P.; Li, Y.P. Energy-Water-Carbon Nexus System Planning: A Case Study of Yangtze River Delta Urban Agglomeration, China. Appl. Energy 2022, 308, 118144. [Google Scholar] [CrossRef] [Scilit]
- Zhang, J.; Liu, L.; Xie, Y.; Han, D.; Zhang, Y.; Li, Z.; Guo, H. Revealing the Impact of an Energy–Water–Carbon Nexus–Based Joint Tax Management Policy on the Environ-Economic System. Appl. Energy 2023, 331, 120397. [Google Scholar] [CrossRef] [Scilit]
- Gu, W.; Ma, G.; Wang, R.; Scherer, L.; He, P.; Xia, L.; Zhu, Y.; Bi, J.; Liu, B. Climate Adaptation through Crop Migration Requires a Nexus Perspective for Environmental Sustainability in the North China Plain. Nat. Food 2024, 5, 569–580. [Google Scholar] [CrossRef] [Scilit] [PubMed]
- Jiang, W.; Zhang, Z.; Wen, J.; Yin, L.; Song, B. Spatio-Temporal Variation and Influencing Factors of Industrial Carbon Emission Effect in China Based on Water-Land-Energy-Carbon Nexus. Ecol. Indic. 2023, 152, 110307. [Google Scholar] [CrossRef] [Scilit]
- Wang, M.; An, Y.; Yang, R.; Shan, X.; Li, L.; Feng, X. Analysis of the Coupling Coordinated Development of the Water-Soil-Energy-Carbon System in Northwest China. Land 2024, 13, 715. [Google Scholar] [CrossRef] [Scilit]
- Duan, Z.; Zhu, X. The Carbon Paradox in Urban China: High-Quality Development under the Dual-Control Policy. Sustain. Cities Soc. 2025, 130, 106585. [Google Scholar] [CrossRef] [Scilit]
- Samadzadegan, F.; Toosi, A.; Dadrass Javan, F. A Critical Review on Multi-Sensor and Multi-Platform Remote Sensing Data Fusion Approaches: Current Status and Prospects. Int. J. Remote Sens. 2025, 46, 1327–1402. [Google Scholar] [CrossRef] [Scilit]
- Xiong, Y.; Feng, W. Satellite Gravity-Based Products for Terrestrial Water and Groundwater Storage Changes in the China Region (2002–2022). National Tibetan Plateau/Third Pole Environment Data Center. 2023. Available online: https://doi.org/10.11888/Terre.tpdc.300563 (accessed on 5 April 2026).
- Yang, J.; Huang, X. The 30 m Annual Land Cover Dataset and Its Dynamics in China from 1990 to 2019. Earth Syst. Sci. Data 2021, 13, 3907–3925. [Google Scholar] [CrossRef] [Scilit]
- Chen, Z.; Yu, B.; Yang, C.; Zhou, Y.; Yao, S.; Qian, X.; Wang, C.; Wu, B.; Wu, J. An Extended Time Series (2000–2018) of Global NPP-VIIRS-like Nighttime Light Data from a Cross-Sensor Calibration. Earth Syst. Sci. Data 2021, 13, 889–906. [Google Scholar] [CrossRef] [Scilit]
- Yue, H.; Wu, B.; Duan, J.; Yue, Y.; Guan, H.; Zhang, J. Impact Factors and Structural Pathways of Carbon Emissions in the Power Sector of the Beijing–Tianjin–Hebei Region Using MRIO Analysis. Atmosphere 2025, 16, 177. [Google Scholar] [CrossRef] [Scilit]
- Lou, T.; Ma, J.; Liu, Y.; Yu, L.; Guo, Z.; He, Y. A Heterogeneity Study of Carbon Emissions Driving Factors in Beijing-Tianjin-Hebei Region, China, Based on PGTWR Model. Int. J. Environ. Res. Public Health 2022, 19, 6644. [Google Scholar] [CrossRef] [Scilit] [PubMed]
- Luo, R.; Yu, H.; Zhang, W.; Yang, X. Temporal and Spatial Pattern Changes of Vegetation Net Primary Productivity in Sichuan Province and the Analysis of Its Driving Factors. Environ. Sci. 2026, 47, 2329–2342. [Google Scholar] [CrossRef] [Scilit]
- Liu, P.; Din, A.H.M.; Hamden, M.H. Unveiling Regional and Seasonal Sea Level Dynamics along China’s Coast: Insights from 30 Years of Multi-Mission Satellite Altimetry Data. Sci. Remote Sens. 2025, 12, 100280. [Google Scholar] [CrossRef] [Scilit]
- Liu, B.; Deng, Y.; Li, M.; Yang, J.; Liu, T. Classification Schemes and Identification Methods for Urban Functional Zone: A Review of Recent Papers. Appl. Sci. 2021, 11, 9968. [Google Scholar] [CrossRef] [Scilit]
- Huang, X.; Feng, J.; Dong, J.; Zhang, J.; Yang, Q.; Yu, C.; Wu, M.; Zhang, W.; Ling, J. Spartina Alterniflora Invasion and Mangrove Restoration Alter Diversity and Composition of Sediment Diazotrophic Community. Appl. Soil Ecol. 2022, 177, 104519. [Google Scholar] [CrossRef] [Scilit]
- Wang, H.; Zheng, Q. Improvement and Application of Hale’s Dynamic Time Warping Algorithm. Symmetry 2024, 16, 645. [Google Scholar] [CrossRef] [Scilit]
- Kim, S.H.; Lee, H.S.; Ko, H.J.; Jeong, S.H.; Byun, H.W.; Oh, K.J. Pattern Matching Trading System Based on the Dynamic Time Warping Algorithm. Sustainability 2018, 10, 4641. [Google Scholar] [CrossRef] [Scilit]
- Shahbazkia, H.R.; Khosravani, H.R.; Pulatov, A.; Hajimani, E.; Kiazadeh, M. A Comprehensive Comparative Study of Quick Invariant Signature (QIS), Dynamic Time Warping (DTW), and Hybrid QIS + DTW for Time Series Analysis. Mathematics 2025, 13, 999. [Google Scholar] [CrossRef] [Scilit]
- Nagendar, G.; Ranjan, V.; Harit, G.; Jawahar, C.V. Efficient Query Specific DTW Distance for Document Retrieval with Unlimited Vocabulary. J. Imaging 2018, 4, 37. [Google Scholar] [CrossRef] [Scilit]
- Li, X.; Zhang, D.; Hou, Y. Analysis of Shield Tunnel Ground Deformation Characteristics and Affecting Factors in Water-Rich Soft Stratum: A Case Study on the Section Tunnel of Tianjin Metro Line 6. Appl. Sci. 2022, 12, 6208. [Google Scholar] [CrossRef] [Scilit]
- Yan, H.; Lin, Y.; Chen, Q.; Zhang, J.; He, S.; Feng, T.; Wang, Z.; Chen, C.; Ding, J. A Review of the Eco-Environmental Impacts of the South-to-North Water Diversion: Implications for Interbasin Water Transfers. Engineering 2023, 30, 161–169. [Google Scholar] [CrossRef] [Scilit]
- Yang, Y.; Bao, W.; Liu, Y. Scenario Simulation of Land System Change in the Beijing-Tianjin-Hebei Region. Land Use Policy 2020, 96, 104677. [Google Scholar] [CrossRef] [Scilit]
- Ren, F.; Yu, X. Coupling Analysis of Urbanization and Ecological Total Factor Energy Efficiency—A Case Study from Hebei Province in China. Sustain. Cities Soc. 2021, 74, 103183. [Google Scholar] [CrossRef] [Scilit]
- Esri Data Classification Methods. Available online: https://pro.arcgis.com/en/pro-app/latest/help/mapping/layer-properties/data-classification-methods.htm (accessed on 5 April 2026).
- Grzymala-Busse, J.W.; Mroczek, T. Merging of Numerical Intervals in Entropy-Based Discretization. Entropy 2018, 20, 880. [Google Scholar] [CrossRef] [Scilit]
- Qiu, J.; Ju, Z.; Wang, H.; Wu, J. The Double-Edged Sword Effects of Land Use Optimization Based on Dual Carbon Goals: A Perspective from Landscape Ecological Risk. J. Environ. Manag. 2025, 380, 125044. [Google Scholar] [CrossRef] [Scilit] [PubMed]
- Ma, X.; Yuan, H. Ecological Footprint and Carrying Capacity of Agricultural Water-Land-Energy Nexus in China. Ecol. Indic. 2024, 168, 112786. [Google Scholar] [CrossRef] [Scilit]
- Xu, X.; Kong, W.; Wang, L.; Wang, T.; Luo, P.; Cui, J. A Novel and Dynamic Land Use/Cover Change Research Framework Based on an Improved PLUS Model and a Fuzzy Multiobjective Programming Model. Ecol. Inform. 2024, 80, 102460. [Google Scholar] [CrossRef] [Scilit]
- Gao, Y.; Ding, D.; Zhang, Y.; Li, P.; Li, K.; Ruan, T.; Han, Y.; Ma, C. Evaluation of Carrying Capacity of Agricultural Water and Soil Resources and Targeted Regional Management in Northwest China. J. Environ. Manag. 2025, 395, 127841. [Google Scholar] [CrossRef] [Scilit] [PubMed]
- Zhang, Z.; He, Y.; Chen, X.; Tan, Q. Improvement of WEAP Model Considering Regional and Industrial Water Distribution Priority and Its Application. J. Hydrol. Reg. Stud. 2023, 47, 101414. [Google Scholar] [CrossRef] [Scilit]

Disclaimer/Publisher’s Note: The statements, opinions and data contained in all publications are solely those of the individual author(s) and contributor(s) and not of MDPI and/or the editor(s). MDPI and/or the editor(s) disclaim responsibility for any injury to people or property resulting from any ideas, methods, instructions or products referred to in the content. |
© 2026 by the authors. Licensee MDPI, Basel, Switzerland. This article is an open access article distributed under the terms and conditions of the Creative Commons Attribution (CC BY) license.