


Abstract
Rapid urbanization has aggravated challenges in sustaining the peri-urban rice farming sector. Challenges arising from rapid urbanization threaten rice farmers in peri-urban areas because of increasing economic and land pressures. This has caused significant marginalization among rice farmers. In Indonesia, despite contributing 13.28% of the national gross domestic product (GDP) in 2021, the agricultural sector is dominated by marginal farmers who struggle with poverty and lack land ownership. This study aims to identify different pathways for the marginalization of rice farmers by integrating spatiotemporal land use and land cover (LULC) change analysis, landscape fragmentation metrics, and systems thinking (ST) through causal loop diagrams (CLDs). Furthermore, an attempt to reconceptualize the term marginal rice farmers is made by considering the total number of cultivated rice fields and broader factors that contribute to the feedback loop of marginalization. This study shows that rice farmer marginalization in peri-urban areas is caused by small land size or poverty, and the interactions between ecosystem service degradation, productivity decline, economic pressure, and land conversion differ across landscape configurations. Moreover, this study enhances the understanding of peri-urban agricultural transformation and provides landscape-sensitive policy insights to support inclusive and resilient agricultural systems by reconceptualizing the marginalization of rice farmers as a dynamic socio-spatial process.
1. Introduction
A peri-urban area is a junction of urban and rural areas, where elements of metropolitan and natural landscapes shape its development direction and dynamics. These areas play a critical role as buffers that provide essential ecosystem services, particularly food production, to urban and rural populations [1,2]. Rapid urbanization is becoming a global trend as modern society pursues productivity and economic gains. However, after exceeding the urban development threshold, urbanization mutates into urban sprawl, exerting intense pressure on rural landscapes [3,4,5]. Urban sprawl is characterized by urban encroachment into peri-urban and rural areas, disrupting the ecological balance and causing a significant decline in agricultural land, leading to the loss of agricultural land, forests, and vegetation land cover [6]. In Indonesia, this dynamic has contributed to the widespread marginalization of farmers, particularly rice farmers, in peri-urban areas. Despite contributing 13.28% of the national gross domestic product (GDP) in 2021, the agricultural sector is carried by farmers who struggle with poverty and lack of land ownership [7]. Furthermore, in 2023, the food crop farming sector, including rice farming, was dominated by marginal farmers at 62% [8]. Internationally, a marginal farmer is defined as a farmer who cultivates less than 2 hectares of farmland. However, Indonesia applies a much lower threshold for marginal farmers, the Petani Gurem in Bahasa Indonesia, which is less than 0.5 hectares. This marginalization of rice farmers in peri-urban areas, owing to their limited access to land and resources amid intense urban sprawl, is particularly concerning.
Previous studies examining the connection between farmland marginalization and peri-urban development have indicated that topographic and geomorphological factors significantly influence land-use changes and agricultural viability [9,10]. In agricultural landscapes, physical elements such as land-use patterns, elevation, and water source availability interact with socioeconomic factors and shape different environments for farming. However, despite the extensive literature on urbanization and peri-urban transformation, most studies treated marginalization as linear and uniform outcomes from urban expansion, and little attention has been paid to how geomorphological differences within peri-urban basins shape diverse marginalization pathways for rice farmers. This study argues that peri-urban systems are better understood as interconnected social–ecological systems (SESs), in which physical and socioeconomic factors interact through feedback processes to generate heterogeneous outcomes. By emphasizing the variability of landscape configurations, this research adopts a systems thinking (ST) approach and employs causal loop diagrams (CLDs) to analyze how marginalization arises from multivariable interactions. The analysis focuses on the coping strategies of local actors and farmers as integral components of these feedback mechanisms. Although these strategies are often regarded as adaptive responses, some may inadvertently reinforce existing constraints and perpetuate marginalization over time. This perspective reframes marginalization as a process that may be internally generated, rather than solely imposed by external pressures. The main objective of this study is to identify different pathways for the marginalization of rice farmers by comparing cases in the upland and lowland landscapes of peri-urban areas. Additionally, the marginalization of rice farmers is reconceptualized by considering broader factors that contribute to the feedback loop of marginalization. This study addresses two research questions: (1) How do physical–spatial and socioeconomic marginalization of rice farmers unfold differently in lowland and upland landscapes? (2) How do physical–spatial and socioeconomic driving factors create a feedback loop for the marginalization of rice farmers? Four districts in the Bandung Regency were selected as the study area. These districts were chosen because their geomorphological characteristics and rapid urban development provide an ideal context for examining rice farming marginalization in the same peri-urban area, while also considering variations in geomorphological characteristics. This study highlights the feedback loops from the interconnected physical and socioeconomic components in peri-urban rice farming that drive the degradation of ecosystem services and intensify the marginalization of rice farmers.
Conceptual Framework: A Social–Ecological and Systems Thinking Perspective on the Marginalization of Rice Farmers
This section explains the SES and ST perspectives as theoretical and analytical foundations for understanding the marginalization of rice farmers. SES studies describe or visualize complicated mechanisms and patterns of dynamic interactions between humans and natural elements [11,12]. Earlier studies stated that SES is constructed from a connected complex adaptive system (CAS), which refers to networks of micro-interactions of socio-ecological elements that result in macro-level outcomes [12,13]. Current sustainable development challenges arise from the interplay of social–ecological coupling systems, which require a systems-thinking approach that considers feedback loops and nonlinear dynamics [14].
Traditional approaches often address social and ecological issues separately, which can obscure our understanding of the complex causal relationships that cause changes in both social and ecological elements. The SES approach views social and ecological attributes as part of the same interconnected and interdependent system, which is better equipped to address contemporary sustainable development challenges. In this case, ST translates SES components into variables in a causal loop diagram (CLD) or as stocks, flows, and feedback loops in an SD simulation [15]. The CLD and SD models originate from the ST approach [16,17].
A CLD is regarded as a tool that bridges ST and SD, enabling the integration of qualitative and quantitative data to understand the mechanisms of systemic problems [16]. The conceptual foundation of ST can be traced back to General Systems Thinking (GST) proposed by Ludwig von Bertalanffy [17]. ST provides an analytical lens for restructuring complex problems by identifying and rearranging variables, their interconnectedness, and feedback loops [18]. Within this framework, the CLD functions as a qualitative tool that visualizes feedback structures and nonlinear relationships among variables, thereby supporting the interpretation of complex system behaviors. In the context of SD, the CLD is typically used as an intermediate conceptual step before the development of stock-and-flow models and quantitative simulations [19,20]. At later stages, CLDs can be further formalized by incorporating quantitative data to simulate system behavior and explore future trajectories. However, in this study, the use of the CLD was intentionally limited to its role in ST, with a focus on developing a conceptual understanding of the mechanisms underlying the marginalization of rice farmers rather than conducting quantitative simulations. From the SES perspective, this study identified the social and ecological elements embedded in lowland and upland rice farming systems, followed by the use of the CLD to map feedback loops and identify pathways involved in the marginalization of rice farmers.
The multifunctionality of peri-urban areas often causes conflicts of interest between urban and rural societies. A previous study has stated that the diverse functionality of peri-urban areas encourages agricultural actors to explore alternative business models and diversify their agricultural livelihoods [21]. Close proximity to urban areas allows for lower distribution costs and a direct marketing strategy that nurtures connections between peri-urban farmers and consumers [22]. In contrast, the proximity of peri-urban areas to urban areas and the economic opportunities that come with them have resulted in a close interconnection and high sensitivity of peri-urban land-use conversion. The distance from the agricultural zone to the urban area has a positive impact on livelihood diversification, local market development, and urban sprawl, as the spillover effect of urban growth disturbs the environment for agricultural activity by causing farmland parcels and environmental degradation. This ultimately leads to the marginalization of farmers. Peri-urban areas are best observed as integrated SES because they are formed through an accumulation of socioecological component interactions in the coupling of urban and rural systems, which generate their own system of peri-urban areas.
Ref. [23] discussed the ongoing debate among SES scientists regarding the bias in the representation of social components in SES applications. This bias is often attributed to the popularity of SES among social scientists. This study addresses this issue by combining social components and spatiotemporal analysis to build a set of variables representing the social and ecological conditions of agricultural zones in peri-urban areas. Therefore, it accurately visualizes the pathways of the physical and socioeconomic marginalization of rice farmers in lowland and upland landscapes. Additionally, the CLD acts as a tool that structures and visualizes connections among all identified variables, revealing the reinforcing or balancing loops that emerge as core materials for discussion [19,24]. The integration of the SES approach with CLDs offers a robust analytical combination to capture the complexity of peri-urban agricultural systems and the dynamics of rice farmers’ physical and socioeconomic marginalization in the lowland and upland agricultural zones of peri-urban areas.
2. Materials and Methods
2.1. Study Area
Bandung Regency is the neighboring region of Bandung Capital City, which is experiencing rapid urbanization due to urban development in the capital city. Statistical data on rice field dynamics in the Bandung Regency indicate a persistent decline in agricultural land driven by ongoing land conversion. A previous study documented a consistent increase in the rate of rice field conversion in West Java, from approximately 7406.6 hectares per year in 1993 to an average of 10,359.08 hectares per year from 1994 to 1999, reflecting an accelerating trend of agricultural land loss [25]. This trend has continued to the present as the expansion of urbanization has intensified land conversion, leading to an increase in agricultural land loss over time. This shift is accompanied by a rising prevalence of marginalized farming, particularly in the Bandung Regency [8]. The geomorphological properties of the basin divide the Bandung Regency into lowland and upland landscapes, resulting in diverse agricultural systems. Generally, the agricultural zones in lowland landscapes are dominated by wet rice fields on flat farmlands, whereas those in upland landscapes are dominated by a mix of terraced rice fields, horticultural farms, and plantations. The rich variability in agricultural characteristics, coupled with the dynamics of land conversion in peri-urban areas, is suitable for exploring different pathways for the marginalization of rice farmers.
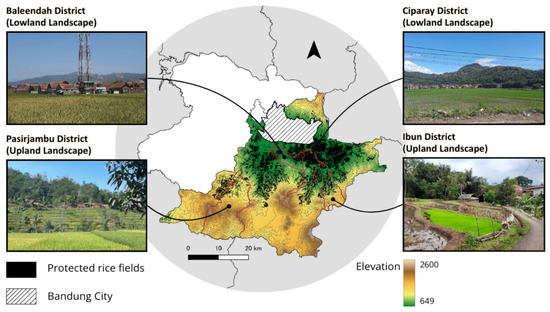
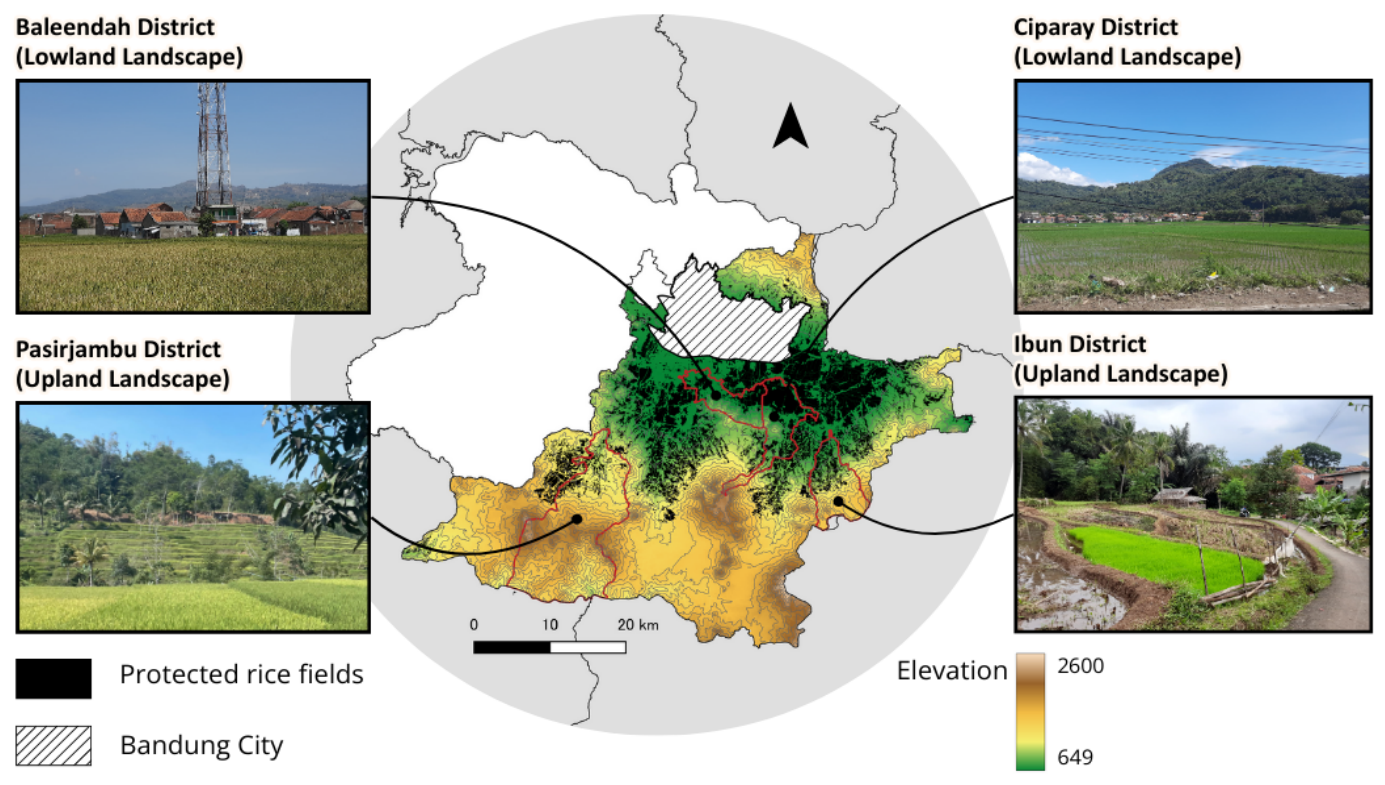
In recent years, the agricultural system, particularly rice farming, in the peri-urban area of the Bandung Basin has significantly transformed owing to the rapid conversion of rice fields to industrial, residential, and infrastructural uses [26,27,28,29]. This process is largely driven by economic pressure and increasing land value, while existing land protection policies remain insufficiently implemented. In addition to land loss, urbanization degrades agricultural systems by reducing irrigation capacity, fragmenting farmland, and intensifying competition for water resources [6,30]. These changes contribute to declining productivity and economic viability of rice farming. To mitigate the rapid conversion of rice fields, the Indonesian government implemented a land reform policy (Basic Agrarian Law (UUPA), 1960) that regulated land rental and farmland management rights (Law No. 56 of 1960 and Law No. 2 of 1960). In 2009, an additional agrarian reform policy (Law No. 41 of 2009 concerning the Protection of Sustainable Food Agricultural Land (LP2B)) was implemented to protect food crop farmland, including rice fields (Figure 1). As an integral component of the LP2B regulation, the Rice Field Protection (LSD) regulation prevents broader rice field conversion for non-agricultural land use by mapping the selected protected rice fields. Currently, implementation of these policies relies on a hybrid approach that integrates top-down and bottom-up strategies. Furthermore, LSD regulations have been adopted at the district level, including in the Bandung Regency, which specifically created Rice Field Protection Regulation No. 1 in 2019, followed by the establishment of protected rice field maps in 2021. These regulations were implemented through incentive and disincentive mechanisms specifically targeting rice farmers. However, these mechanisms are ineffective because most farmers are not landowners. Thus, they have no authority over the farmland they manage and cannot prevent its conversion. This loophole in the regulations has resulted in the ongoing conversion of farmland into built-up areas despite regulations.
Figure 1.
Map of the studied districts and rice field protection areas.
This study selected four districts: Baleendah and Ciparay for the lowland landscape and Ibun and Pasirjambu for the upland landscape. The agricultural zones in the lowland landscape are dominated by rice farming, whereas the upland agricultural zones are a mix of rice and horticultural/plantation farming. The Baleendah and Ciparay districts have low elevations of approximately 664 m and 1248 m above sea level, respectively [31,32]. A significant portion of both districts consists of plains, making them suitable for rice farming. However, the Ciparay district has a varied topography that allows rice farmers in higher areas to mix rice farming with a small portion of horticultural farming. The Ibun and Pasirjambu districts are located in mountainous or hilly terrain, with altitudes ranging from 765 m to 1057 m above sea level [33,34]. Here, agricultural zones are a combination of rice fields, horticultural farms, and tea and coffee plantations intertwined with forest patches.
Most marginal rice farmers were tenant farmers, indicating that landless farmers dominated the rice-farming sector in the selected districts. Tenant farmers must pay rent to landowners based on agreements between the tenant farmers and landowners. The most common land rent arrangement among rice farmers is to divide the total yield equally while fully covering the production cost. This arrangement makes it impossible for farmers to gain adequate profits through advanced agricultural businesses or innovations that could potentially improve their economic conditions. To reduce production costs, the government provides fertilizer subsidies and seeds. Nevertheless, tenant farmers are still very vulnerable to rice field conversion because they have no authority to prevent it and may lose the rice fields on which they work if the owner decides to sell the fields. In this case, farmers would have to search for other rice fields or switch their occupation to non-farming.
2.2. Methodology
To capture the dynamic interconnections of spatial and socioeconomic variables contributing to rice farmers’ marginalization, this study combines remote sensing analysis and desk review of agricultural extension reports in selected districts of lowland and upland landscapes.
2.2.1. Remote Sensing Analysis
This study utilized satellite and primary data to ensure the accurate interpretation of rice farming marginalization based on land use and land cover (LULC) change and rice field fragmentation analysis. For satellite data collection, we retrieved the Sentinel-2 Level-1C data of all four studied regions using Google Earth Engine (GEE). The analysis covered the period from 2019 to 2025. The selected periods represent the initial phase of policy introduction and the most recent observable land use conditions. Additionally, while 2019 was the period of formal enactment of the Rice Field Protection Regulation, actual Protected Rice Field Maps were created and operationalized in 2021. This timeframe helps capture realistic responses to policy implementation, which is crucial in studying land protection policies where temporal lags are common during implementation [35,36,37]. Consequently, this study treated 2019 as the baseline condition before concrete institutional intervention, rather than a fully implemented stage [38,39,40]. Additionally, the 3–6 years interval is sufficient to detect structural land use transitions, such as rice fields to built-up areas, in comparison to short-term variability. To enhance the contrast between different LULC and highlight the rice field visualization, we retrieved data from the beginning of August 2019 and 2025, just before the harvesting month (usually September) of the first planting season. In special cases where there were shifts in the planting season, usually owing to a prolonged dry season, the retrieval period was adjusted.
Supervised classification was employed to map LULC changes. Using the random forest classifier in the GEE, LULC was classified into built-up areas, rice fields, horticulture/plantations, forests, and shrubs. Training samples were developed based on a combination of field-based ground-truth data and visual interpretation of satellite imagery. Ground-truth data were collected during field surveys, and representative locations of each land cover class were identified. To support LULC classification, a set of spectral indices was employed, including the Normalized Difference Vegetation Index (NDVI), Normalized Difference Moisture Index (NDMI), Normalized Difference Water Index (NDWI), Land Surface Water Index (LSI), Enhanced Vegetation Index (EVI), and Bare Soil Index (BSI). A total of 750–1000 samples were collected from each district, with approximately 150–200 samples per class, to maintain class balance. More samples were collected from upland regions because of their larger areas and more mixed land-use configurations. To evaluate classification performance, the dataset was randomly split into training (80%) and validation (20%) subsets using a randomization approach (randomColumn() function in GEE). The Random Forest classifier was trained using 100 trees and applied to classify the entire study area.
Additionally, this study employed landscape indices to understand land conversion and fragmentation dynamics in detail. Landscape indices are quantitative tools used to describe the spatial composition and configuration of LULC [41]. Composition refers to the proportion of each LULC type in each landscape. Configuration refers to the arrangement and interactions between all types of patches within a landscape. In agricultural landscapes, these indices reveal the arrangement, connection, and fragmentation of patches in the study area [40]. When applied to rice farming zones, landscape indices reveal the extent of rice field fragmentation and conversion to other land uses such as settlement areas, recreational facilities, and plantation areas. High landscape diversity or reduced cohesion often indicates a mixed and fragmented land system, which is a characteristic of transitional peri-urban zones. To analyze the livelihoods of marginal rice farmers, landscape indices offer evidence of spatial constraints and opportunities that influence production systems. In peri-urban areas, these indices are useful for assessing how urban expansion reshapes agricultural mosaics.
A study conducted by Li and Wu [42] addressed the issue of misuse and misinterpretation of landscape indices by highlighting the risk of disconnection of patterns emerging from mathematically constructed landscape indices from the pattern formation process. Several studies have documented the limitations of landscape indices, including classification errors and their descriptive nature, which may not adequately explain the underlying ecological and socio-economic interconnection dynamics [38,39,40]. To address these limitations, Creswell [43] suggested pairing landscape indices with socioeconomic variables derived from qualitative data, thereby enabling researchers to connect spatial processes with the socio-ecological dynamics of farming households. Accordingly, this study mitigates this issue by incorporating qualitative data derived from reports published by local agricultural extension agencies. Moreover, as landscape indices are employed mainly as complementary tools to support the analysis of LULC change trends, their integration with LULC analysis, local government reports, and field observations provides a more robust and triangulated approach for capturing the processes of rice farming marginalization in the Bandung Regency.
2.2.2. Causal Loop Diagram (CLD)
The CLD was selected as an analysis tool to visualize the relationship between the LULC change analysis results and the local government report iteration results because of its capacity to structure complex and multisectoral problems. Previous studies have used CLDs in cases involving complex problems related to social and environmental factors [44,45,46]. These studies demonstrated its effectiveness in capturing feedback-driven dynamics and revealing nonlinear interdependencies that are often overlooked in linear approaches. In this study, the CLD was employed to elucidate the relationship between the socioeconomic and spatial-physical variables that construct the mechanism contributing to the marginalization of rice farmers. Furthermore, this study utilized reports from the Agricultural Extension Agency (AEA) as an alternative source for CLD construction. The AEA report is created annually; its primary objective is to serve as a technical guideline for extension officers in implementing agricultural extension activities throughout the fiscal year, based on the evaluation of previously implemented agricultural programs. The preparation process involves coordination meetings between extension officers and farmer groups, and is often aligned with the outcomes of the development planning forum. The approach to deriving the CLD variables and interconnections from reports is aligned with previous studies demonstrating that in addition to the common participatory approach in constructing CLDs [45], CLDs can also be developed through the systematic analysis of secondary data, including policy documents, institutional reports, and literature sources [16,47,48]. In this study, the AEA reports provided sufficient information to capture the mechanisms underlying rice field marginalization, including implemented programs, program evaluations, production outcomes, encountered challenges, and farmers’ adaptation strategies, from the perspectives of farmers and local governments. By synthesizing these documents into CLDs, coupled with a spatial-temporal analysis of LULC change results, this study reconstructed feedback structures and interdependencies across socioeconomic and spatial–physical dimensions. This enables a systematic understanding of the pathways involved in the marginalization of rice farmers.
The CLD was developed through a structured qualitative system modeling process adapted from [16,19,20]. The process consisted of six steps: (1) problem articulation; (2) variable identification through analysis of LULC trends and extension agency reports; (3) identification of causal relationships; (4) construction of the initial CLD; (5) identification of feedback loops; and (6) iterative refinement.
- Problem articulation defined the focus and boundaries of the analysis. In this study, the central problem was rice farmers’ marginalization within agricultural systems. This study argues that the marginalization of rice farmers goes beyond the inadequacy of small rice fields. Consequently, the boundaries of analysis were broadened by incorporating spatial, physical, and socioeconomic variables.
- Variable identification was conducted through data extraction and coding methods. The variables were derived from two sources: LULC and rice fragmentation trends, and agricultural extension agency reports. The LULC change and rice fragmentation trends helped identify the changes in land configurations in the lowland and upland agricultural zones. This shows how the rice field conversion occurred from rice fields to land use. Additionally, four recent AEA reports were systematically analyzed using thematic coding to extract socioeconomic variables and further understand the reasons behind rice field conversions identified from remote sensing analysis.
- Identification of causal relationship was conducted by defining the relationship between variables and assessing the influence of one variable on others. A positive relationship indicates that the variables change in the same direction (usually marked with (+) in the CLD), whereas a negative relationship indicates an inverse relationship (usually marked with (−) in the CLD). The translation of findings from remote sensing analysis and the AEA’s report review into variable structured relationships that later construct the CLD occurs during this process.
- Construction of initial CLD is the stage in which the identified variables are connected through causal links to form a preliminary system structure. To better understand the relationship between socioeconomic and physical–spatial variables contributing to rice farmers’ marginalization, we grouped the variables of the same sector. At this stage, we performed several refinements to ensure that the constructed CLD captured the actual marginalization of rice farmers.
- Identification of feedback loops was conducted by following chains of causal relationships that form closed cycles. These loops were categorized as reinforcing loops, which amplify system changes, or balancing loops, which stabilize the system. By explicitly linking LULC-related variables with socioeconomic and institutional factors, the diagram captures the cross-domain feedback loops that shape overall system behavior. This integration is particularly important for understanding how land-use changes interact with farmers’ livelihoods and policy interventions, providing a more holistic representation of the agricultural system.
- Iterative refinement is the stage in which the diagram is reviewed and adjusted to ensure logical consistency, clarity, and coherence with the empirical data. Redundant variables were removed, ambiguous relationships were clarified, and the overall structure was simplified without losing the critical system dynamics. This iterative process enhanced the robustness and interpretability of the model.
3. Results
3.1. Land Use and Land Cover Change Trends in the Lowland and Upland Landscapes
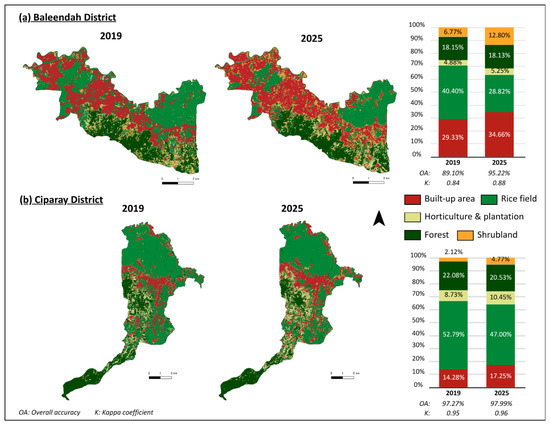
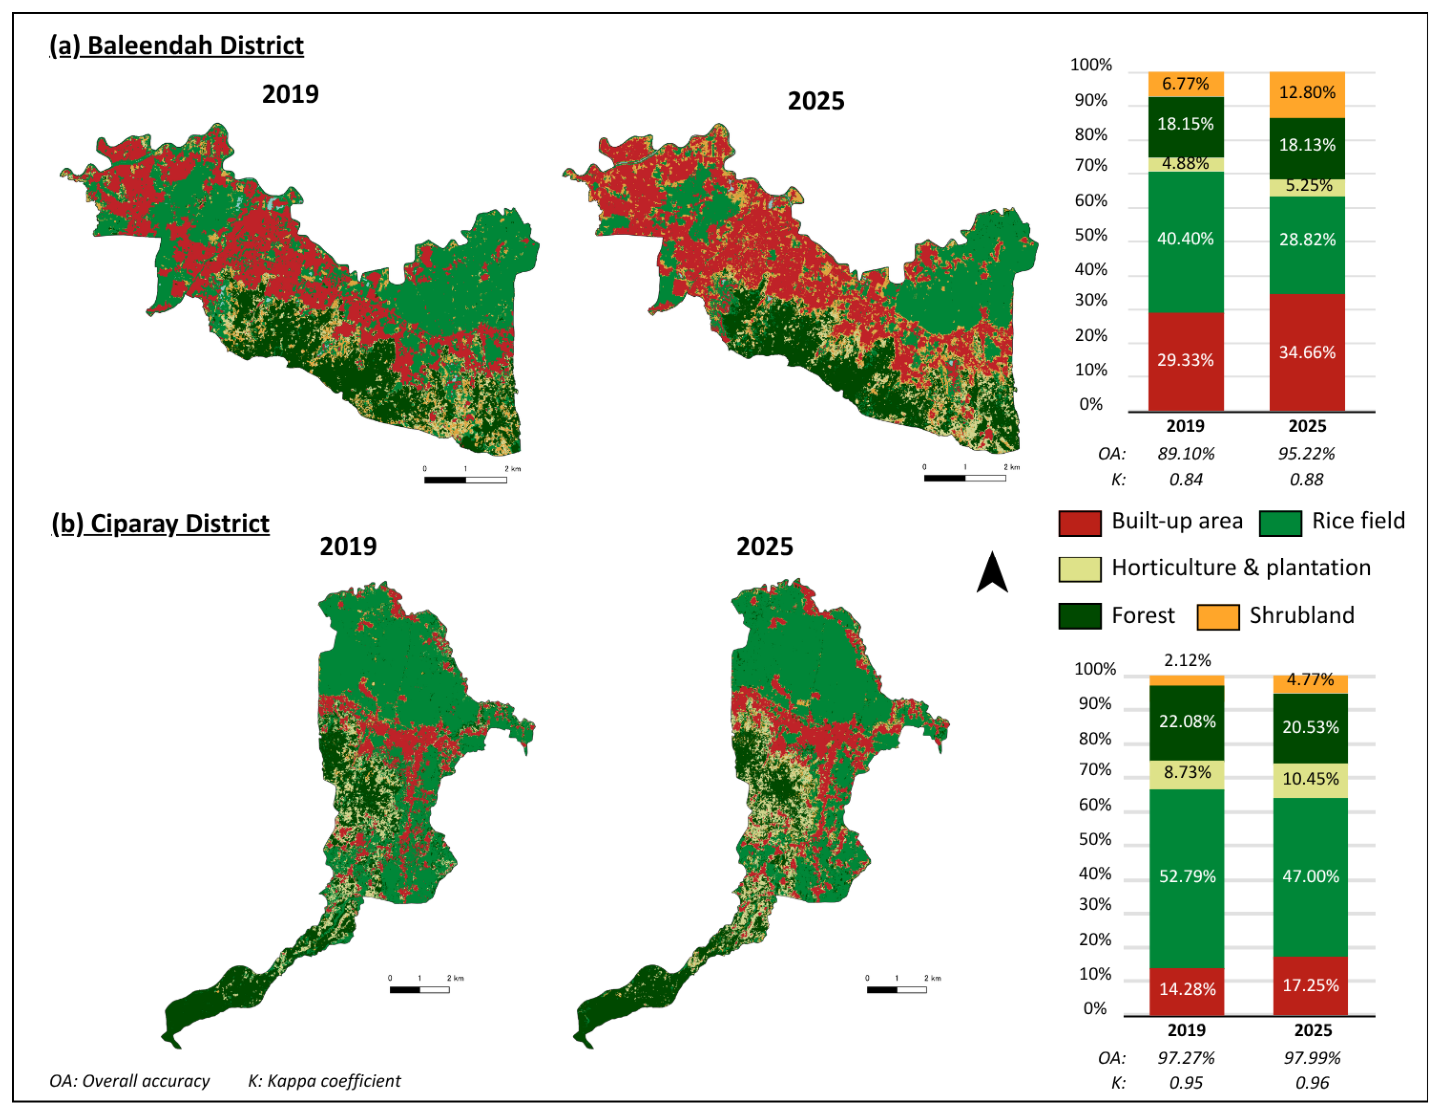
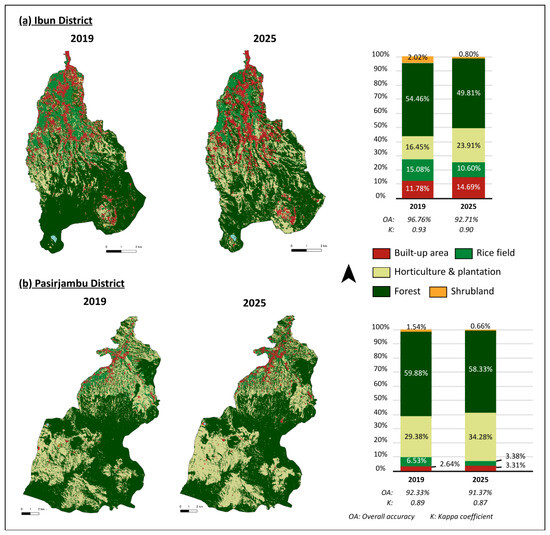
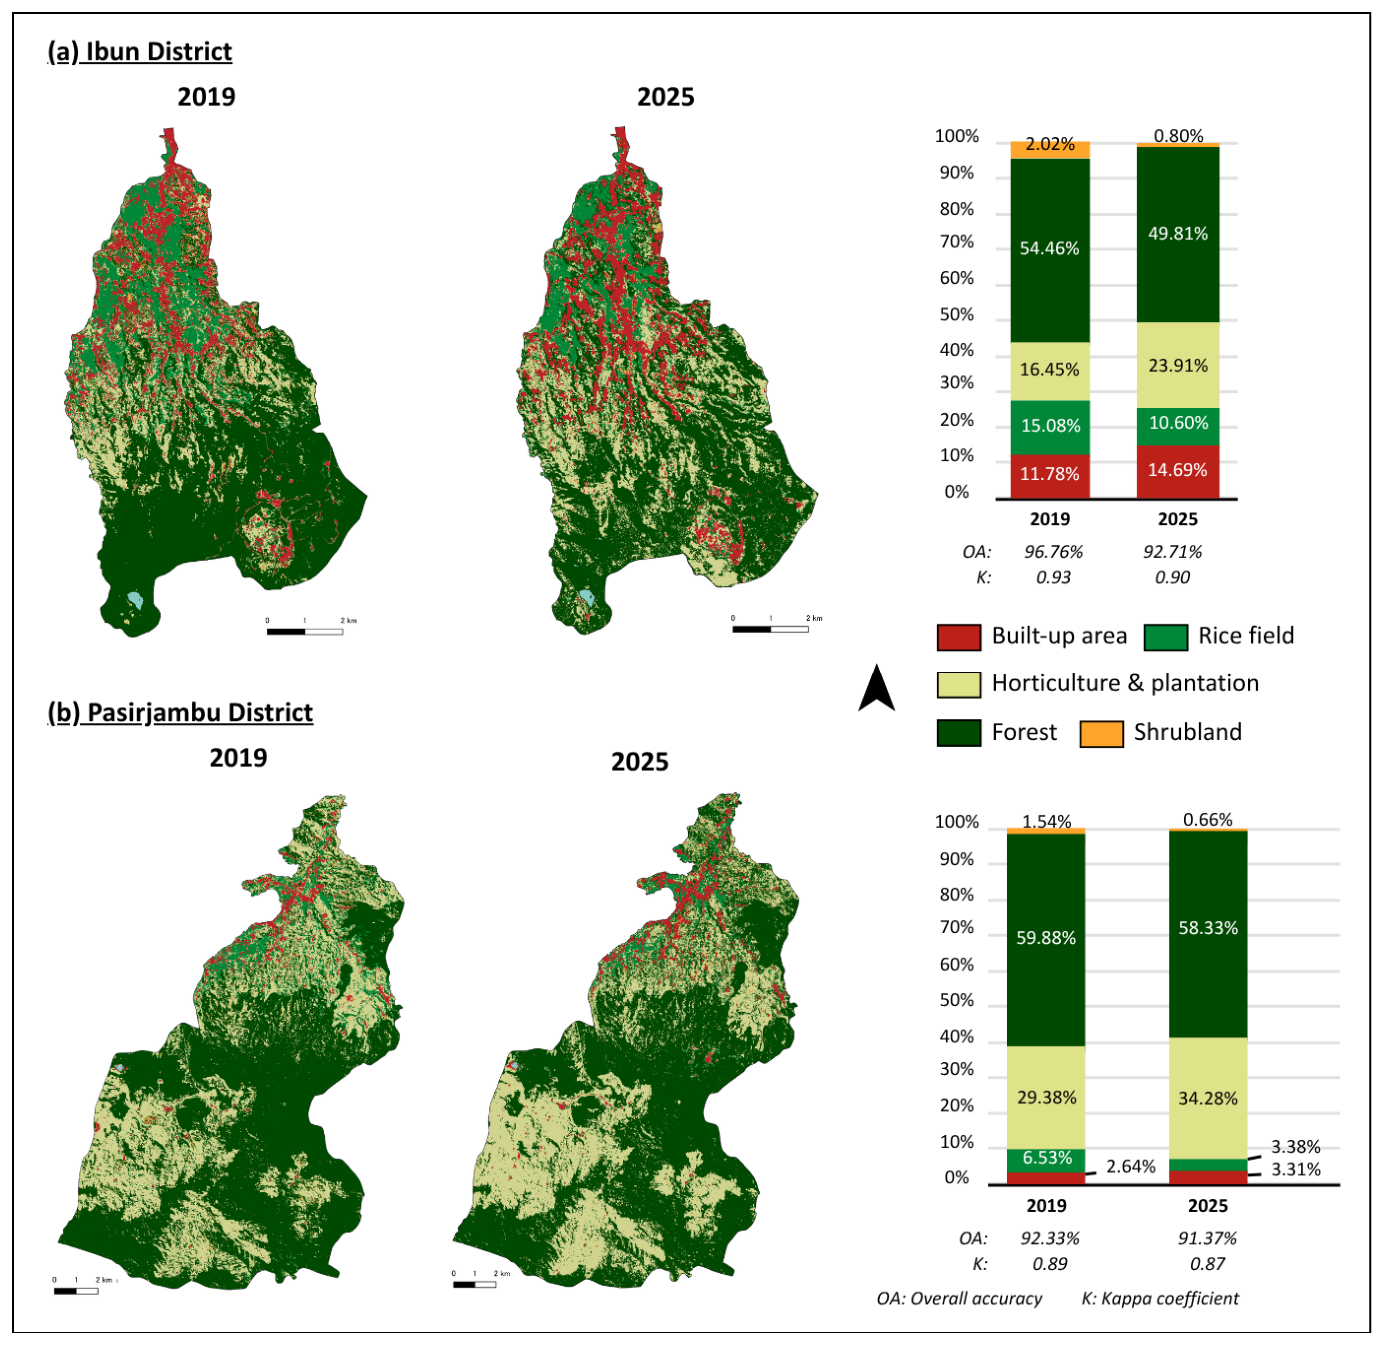
The LULC maps were extracted from the Sentinel-2 Multispectral Instrument Level-1C, followed by supervised classification of LULC using a random forest classifier in the GEE. The results show significant LULC changes between 2019 and 2025 in all four districts (Figure 2 and Figure 3). The total area of rice fields generally declined in all four districts, which briefly represents the potential for marginalization among rice farmers. Additionally, it demonstrated variations in LULC change patterns in lowland and upland landscapes.
Figure 2.
LULC maps and proportions of lowland districts in 2019 and 2025.
Figure 3.
LULC maps and proportions of upland districts in 2019 and 2025.
The selected lowland districts experienced a significant decline in rice fields followed by an increase in built-up areas (Figure 2). There was also a slight increase in horticulture and plantation farm areas and shrublands and a decline in forest areas. Between 2019 and 2025, the landscape configuration of Baleendah district transitioned from being predominantly covered by rice fields to built-up areas. In contrast, Ciparay district is still dominated by rice fields, despite experiencing a significant decline in rice fields and an increase in built-up areas. Built-up areas, including residential and commercial zones, expanded by 5.33% in the Baleendah district and 2.97% in the Ciparay district, whereas rice fields declined by 11.58% and 5.79%, respectively. Furthermore, as shown in Figure 2, the LULC configurations in Baleendah and Ciparay districts revealed proximity between built-up areas and rice fields, whereas horticulture and plantation farms were adjacent to forest areas. These patterns support the potential LULC conversion trends from rice fields to built-up areas and from forest areas to horticulture or plantation farms in the lowland landscape.
In agricultural zones of lowland landscapes, shrublands act as buffers between rice fields and built-up areas during LULC conversion. These shrublands often originate from rice fields abandoned for land transactions. Typically, tenant farmers manage these rice fields; however, landowners may decide to convert them into settlement areas. During the waiting period for the construction of these settlement areas, vegetation can grow, leading to the transformation of land cover into shrublands. Some of these new settlement areas were fully completed by 2025, whereas others remained as shrublands. In the satellite imagery, emerging road networks clearly outline the internal layouts of housing complexes for this type of land cover. This emphasizes the importance of combining satellite imagery analysis with field surveys to gain a deeper understanding of the factors underlying land conversion, particularly in regions with complex mixed land-use configurations.
As shown in Figure 3, the upland landscape was dominated by forests and plantations. The two most common conversions were from rice fields to recreational areas and from rice farms and forests to horticulture or plantation farms. Built-up areas, including residential and recreational areas, expanded by 2.91% in the Ibun district and 0.67% in the Pasirjambu district, whereas rice fields declined by 4.48% and 3.15%, respectively. Furthermore, horticultural and plantation areas increased by 7.46% and 4.90% in Ibun and Pasirjambu districts, respectively, whereas forest cover decreased slightly by 4.65% and 1.55%, respectively.
The confusion matrix generally indicates a high classification performance, particularly for built-up areas, rice fields, and water bodies, which exhibit strong spectral separability. However, notable confusion occurs among agricultural and vegetation-related classes. Specifically, in upland areas, horticulture showed relatively low classification accuracy, with several pixels misclassified as vegetation, reflecting spectral similarity and heterogeneous cropping patterns (Table A2). Additionally, since horticultural areas are concentrated on the middle to higher elevation parts of the districts, nested between rice farming areas and perennial crop plantations, such as tea and coffee, the relatively weak performance of the horticultural class was also influenced by highly dynamic and integrated horticulture-rice farming crop rotations.
Similarly, in lowland areas, the confusion between the rice fields and shrublands suggests transitional or fallow conditions (Table A2). The observed confusion between rice fields and shrublands can be attributed to the land abandonment processes in the study area. For example, some portions of the rice fields in the Baleendah district are temporarily or permanently left uncultivated and are gradually transitioning into shrublands. This process is often linked to socioeconomic factors, including land sales, which result in farmers losing access to cultivated land, as well as strategic decisions by farmers to suspend cultivation during certain seasons owing to financial constraints and instead seek off-farm employment in urban areas. Consequently, these transitional or fallow conditions exhibit spectral characteristics that overlap with those of shrublands, leading to misclassification.
3.2. Land Use and Land Cover Fragmentation Trends in the Lowland and Upland Landscapes
Landscape fragmentation metrics provide a quantitative understanding of the distribution and structure of LULC across the study area. Land fragmentation indices were employed to further assess the detailed patterns of LULC change and support the results of LULC change trends in 2019 and 2025. Landscape indices were measured using the landscape ecology plugins in QGIS. Landscape proportion (LP) indicates the share of the landscape occupied by a specific LULC class. A higher LP reflects a dominant and continuous land use type. Patch number (PN) represents the total number of patches that exist within each class, and more patches indicate greater fragmentation. Mean patch area (MPA) provided further information on the mean size of the patches in the LULC class. Edge density (ED) measures the total length of the patch boundaries relative to the area. High ED values indicated irregular and highly fragmented landscapes with complex edges. Differences were observed in the interpretation of the values of the selected indices. For example, a higher landscape proportion and mean patch area suggest a dominant and less fragmented LULC. In contrast, higher values of the other indices corresponded to increased fragmentation. To enhance readability and facilitate comparison of the landscape index results, all indices were normalized. Additionally, LP and MPA were reversed (multiplied by −1) because higher values of these indices indicate less fragmented LULC, whereas higher values of the other indices indicate greater fragmentation. This transformation ensured that higher values consistently represented higher fragmentation across all the indices. Table 1 and Table A1 present the normalized and non-normalized landscape index scores for the LULC classes in 2019 and 2025, followed by explanation on the index’s interpretation utilized for the CLD (Table 2). Changes in the values of landscape indices, highlighted in red, represent LULC changes associated with fragmentation characteristics. In contrast, green indicates LULC changes associated with non-fragmentation or agglomeration.
Table 1.
Temporal normalized landscape indices scores of lowland and upland landscapes in 2019 and 2025.
Table 2.
Interpretation of landscape indices scores.
Overall, there was an increase in built-up areas and a decline in rice fields across all studied districts in these landscapes, indicating the conversion of rice fields into built-up areas. However, the PN, RMPA, and ED scores revealed differing patterns of built-up area encroachment into rice fields in lowland and upland landscapes. In the lowland landscape, particularly in the Baleendah district, the rising proportion of built-up areas corresponds to the emergence of small patches of these areas, signaling the development of new clusters of built-up regions outside existing urban boundaries, particularly in rice field zones. This finding is reinforced by higher ED scores, which indicate a complex boundary for built-up areas, potentially due to the formation of new developments outside established regions. In the upland landscape, the increasing proportion of built-up areas was not followed by an increase in patches with relatively uniform boundaries. This suggests that the construction of new built-up areas extended from existing urban regions, resulting in the conversion of rice fields closest to or adjacent to these built-up areas.
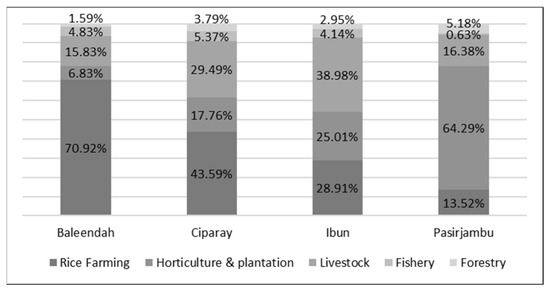
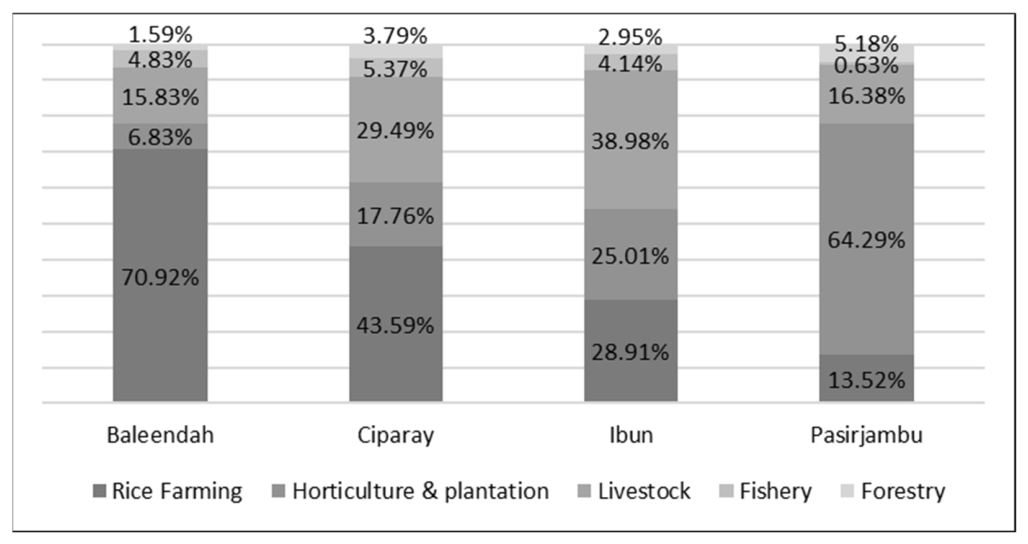
Furthermore, the geomorphological and climatic conditions of upland landscapes are conducive to horticultural and plantation activities, which tend to be more profitable. Consequently, many farmers in upland regions either combine rice farming with horticulture and plantation farming or entirely transition to these alternatives over time, leading to increased rice field conversion and deforestation. In Ibun district, the encroachment of horticultural and plantation farms is less fragmented, following the existing LULC boundaries. In contrast, in Pasirjambu district, the encroachment of horticulture and plantation farms into forest areas is fragmented and occurs in smaller clusters. A lower ED score indicated that these encroachments occurred primarily in forested zones. Additionally, despite being located in a lowland landscape, the Ciparay district saw an increased proportion of horticulture and plantation farms, possibly because of its varied geomorphological conditions. Furthermore, the encroachment of built-up areas in the Ciparay district was not as severe, resulting in less significant rice field fragmentation than that in the Baleendah District. These findings of LULC transformation dynamics were further validated using secondary data from the Agricultural Census on the distribution of agricultural activities in the studied districts (Figure 4). This indicates that the geomorphological conditions of the districts contribute to the dynamics of rice field conversion by influencing the direction of built-up area development and farmers’ adaptive strategies to transition to a more profitable livelihood, such as horticulture/plantation farming in upland districts, and non-farming livelihoods in lowland districts.
Figure 4.
Proportion of agricultural activities in the studied lowland and upland districts.
Results from the spatial-temporal analysis of LULC change show a decline in rice field areas across all districts between 2019 and 2025, alongside an increase in built-up areas. This demonstrates that lowland areas experienced a more intensive conversion of rice fields into built-up land, whereas upland areas shifted toward horticulture and plantation systems. Fragmentation analysis revealed an increasing fragmentation of rice fields in lowland landscapes driven by dispersed urban expansion. In contrast, upland land-use changes are less fragmented and follow existing landscape structures. Overall, the results highlight the role of geomorphological conditions in shaping distinct land-use transitions and farmer adaptation pathways.
3.3. Feedback Structures of Rice Farmer Marginalization in Lowland and Upland Landscapes
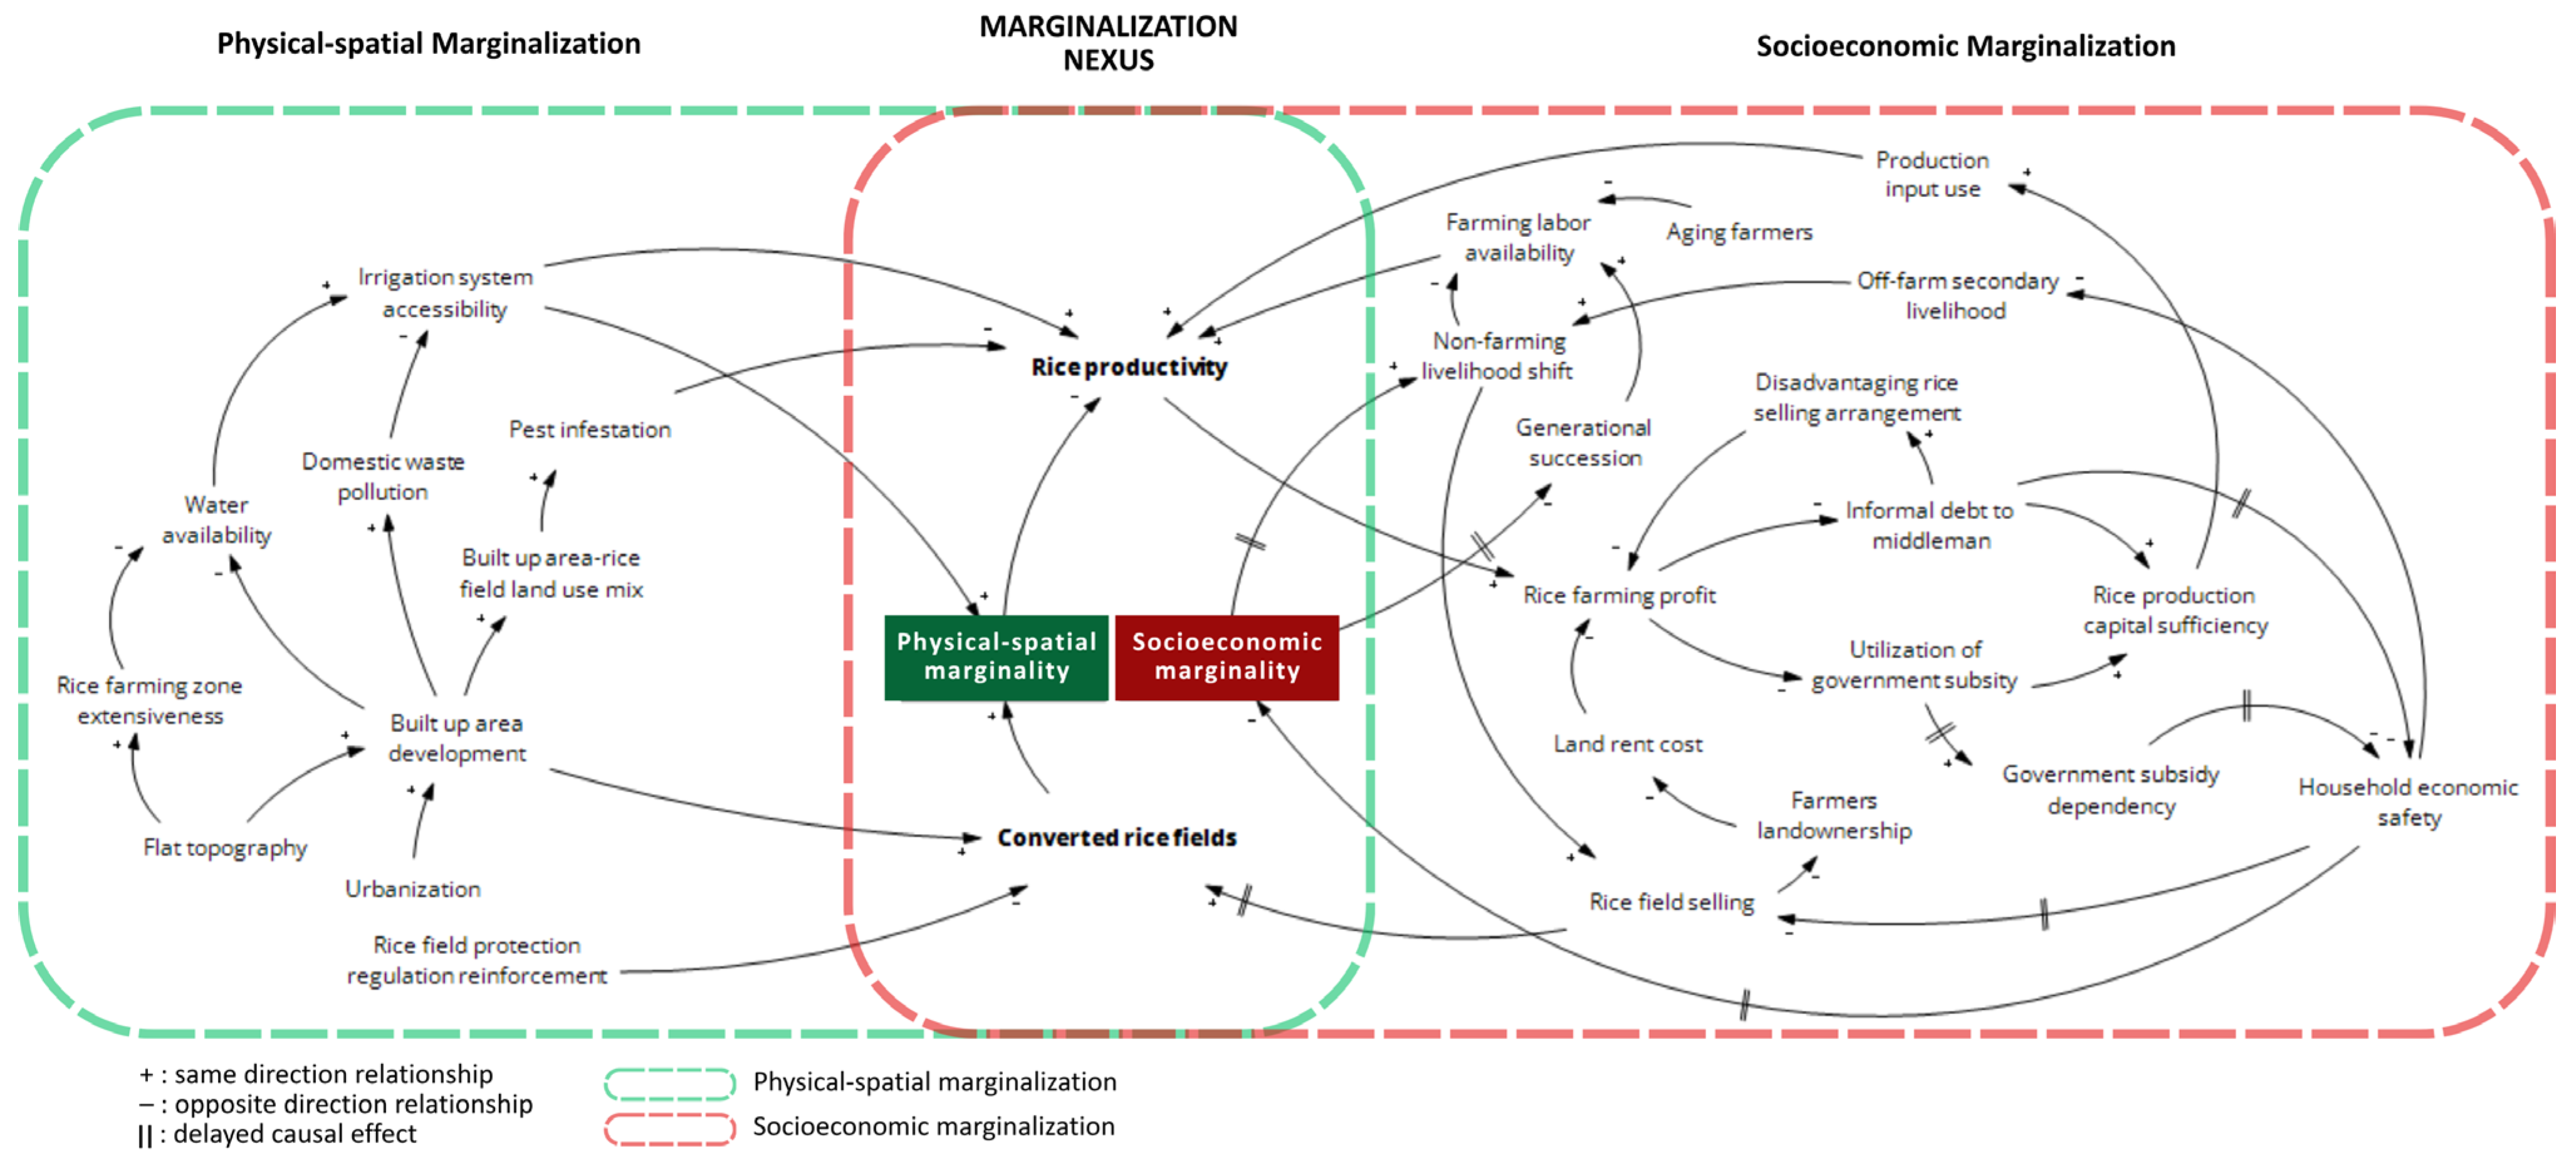
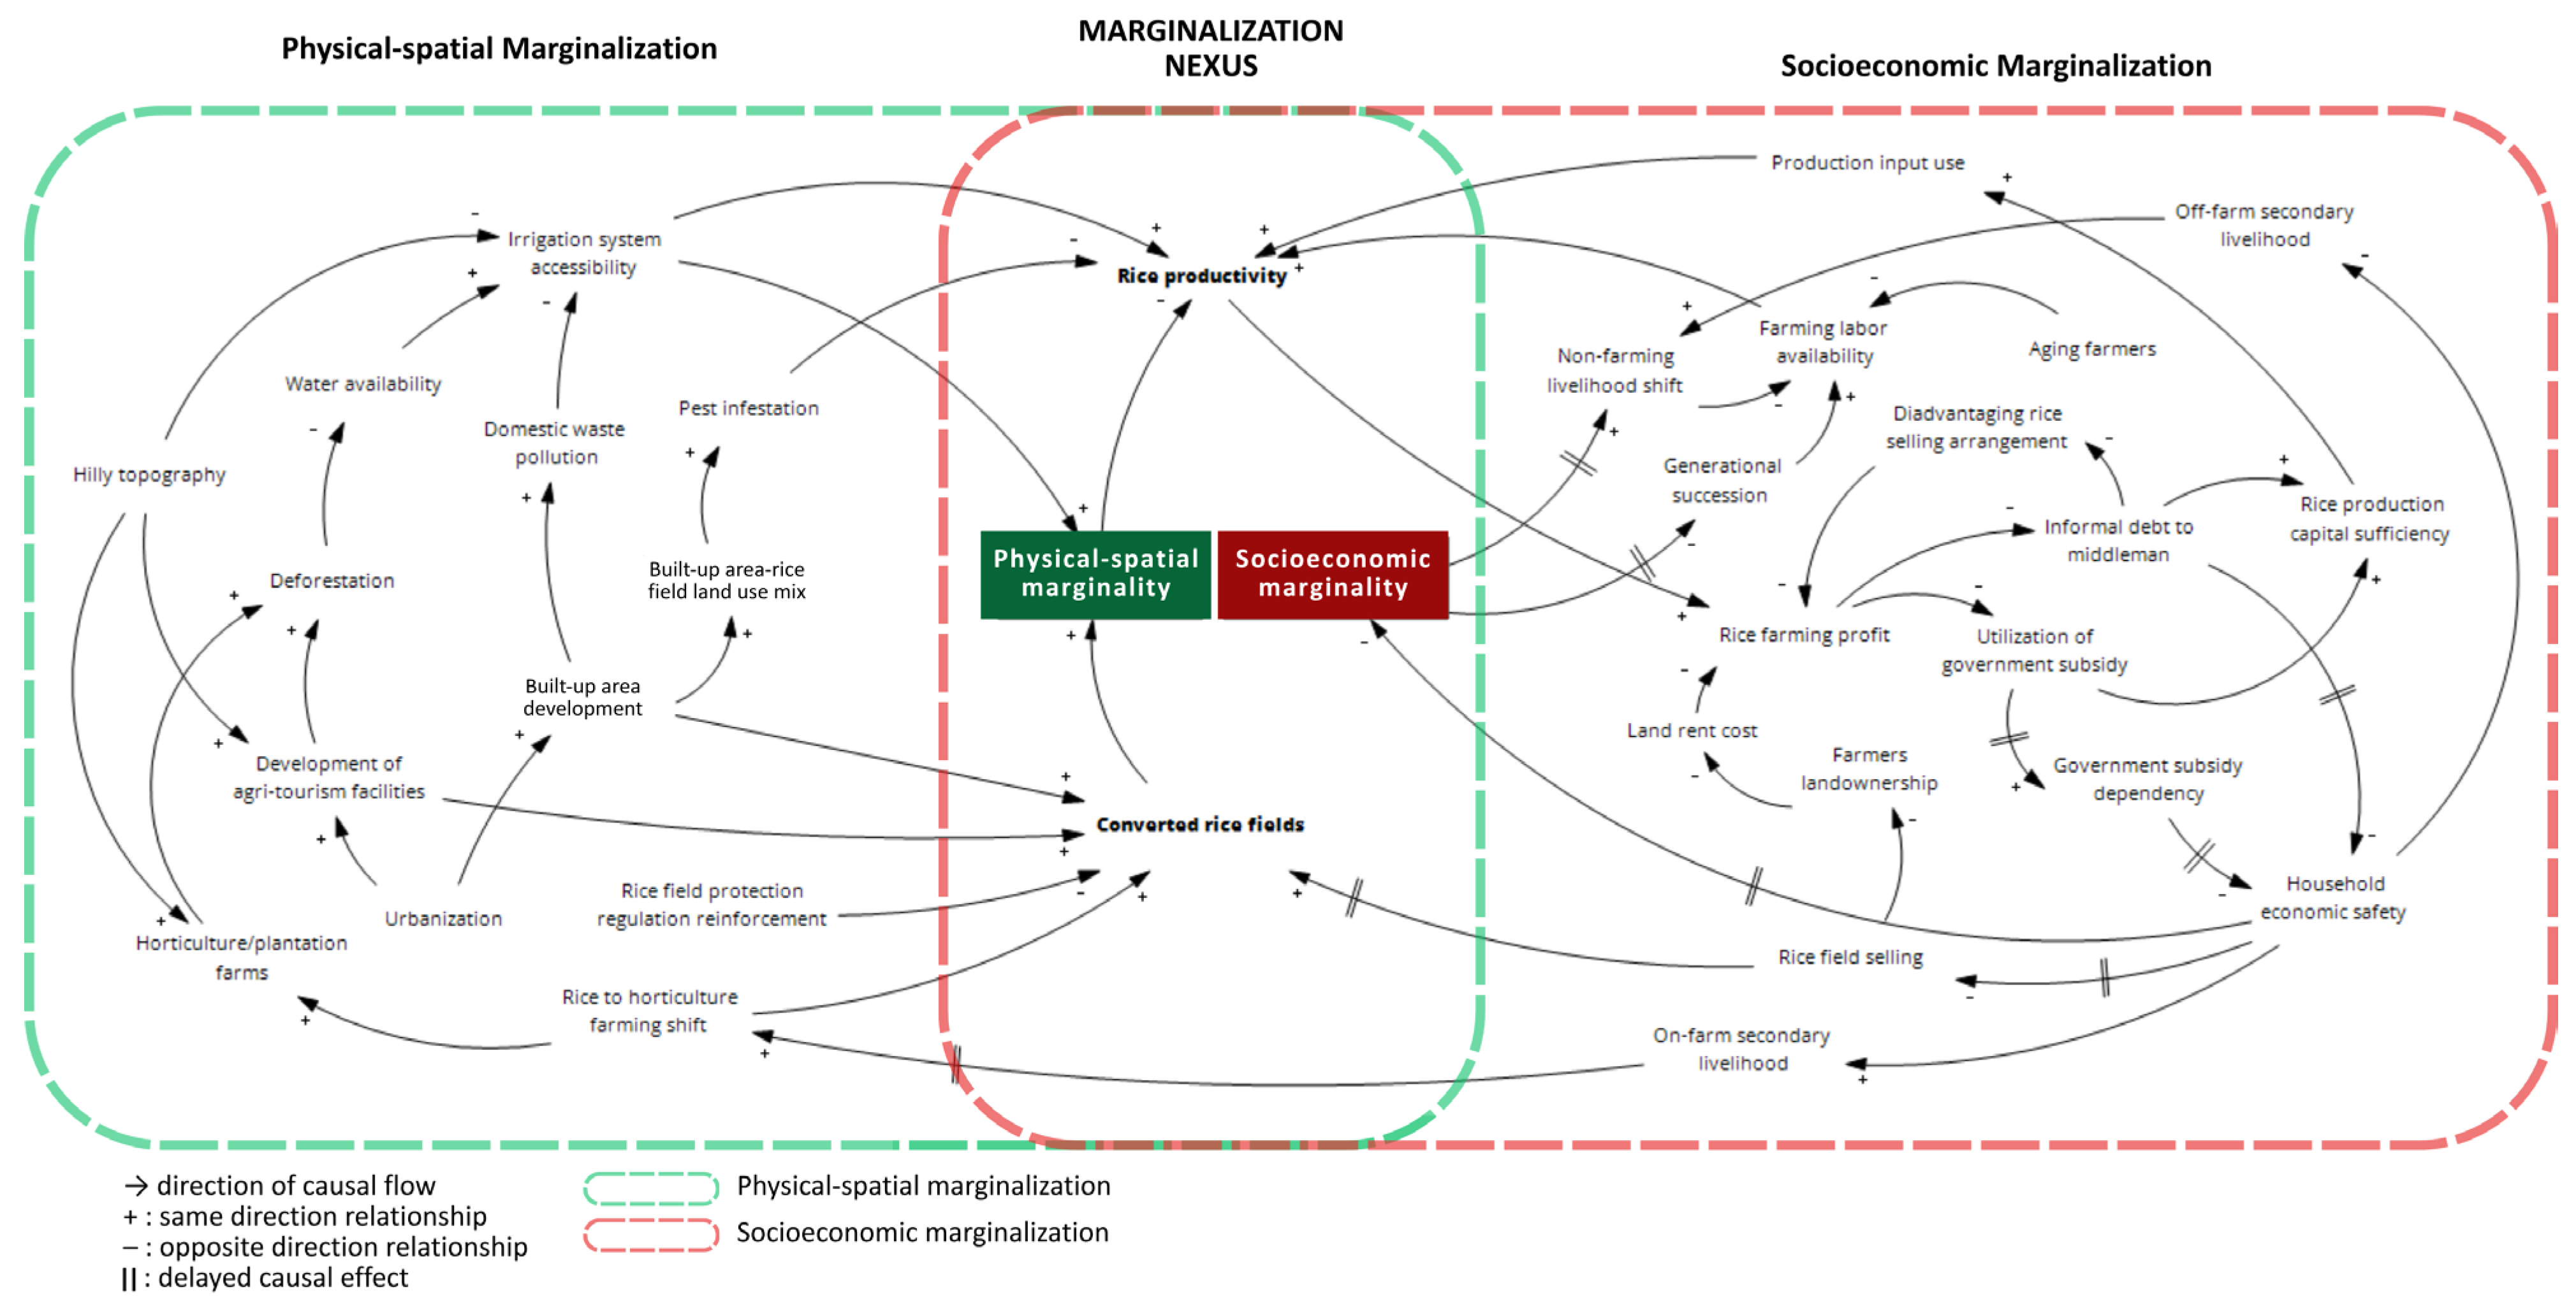
The CLD was employed as a conceptual tool to organize and interpret complex interdependencies rather than to predict or confirm system behavior over time. The results demonstrate feedback loop structures based on the integration of LULC changes (Figure 2 and Figure 3), fragmentation indices (Table 1 and Table 2), and institutional report analysis results (Table 3). Additionally, the created loops visualized the qualitative mechanisms, highlighting the coupling of spatial–physical and socioeconomic processes of rice farmers’ marginalization in the lowland and upland landscapes. This reveals that physical constraints, such as insufficient water sources, poor access to irrigation systems, and rice field conversion resulting from rapid urbanization in peri-urban areas, interact dynamically with socioeconomic components, including access to production capital, labor availability, and overall rice farming economic viability, as the main livelihoods of farmers. However, while marginalization in both lowland and upland landscapes was shaped by the coupling of physical–spatial and socio-economic variables, the pathways of marginalization in both landscapes varied in their dominant drivers and sequences of change.
Table 3.
Example of thematic coding from reports.
In both landscapes, land conversion and rice productivity emerged as the pivotal factors that translated physical degradation into economic vulnerability. Rice productivity, which is related to the sufficiency of productive farmland and irrigation systems, directly affects the economic viability of rice farming, including profits, household income, and production capital. In addition, converted rice fields have emerged as a critical factor that translates economic vulnerability into physical degradation. During economic crises, farmers tend to sell their assets, including rice fields, to meet their urgent financial needs, leading to a decline in rice fields, land conversion, and ecological stress. This negative coping mechanism links economic vulnerability to physical degradation, creating a feedback loop for the marginalization of rice farmers.
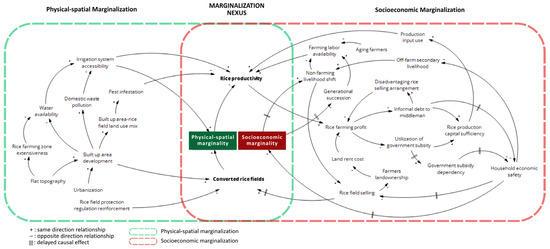
In lowland landscapes, marginalization is mainly associated with variables such as urbanization and land conversion processes (Figure 5). The expansion of built-up areas, mainly peri-urban housing, drives the conversion of rice fields into non-agricultural land. The conversion of rice fields is followed by a decline in rice production and loss of land ownership. Thus, rice farming becomes less economically viable, leading to reduced incomes and increasing pressure on farmers to sell their land. This process further accelerates the reduction in rice fields. These processes highlight the central role of land conversion as both the cause and consequence of economic pressure on rice farmers in lowland landscapes. Therefore, the marginalization of rice farmers in the lowland landscape can be understood as being shaped by external developmental pressure.
Figure 5.
Causal loop diagram of rice farmers’ marginalization in the lowland landscape.
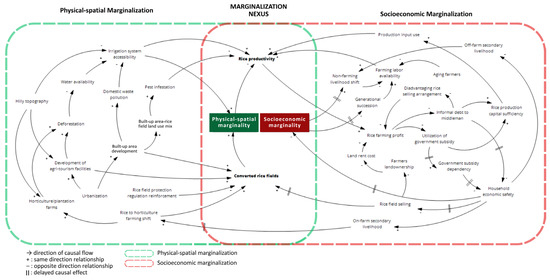
In contrast, the upland landscape is characterized by biophysical and structural constraints that limit access to resources for rice farming (Figure 6). Factors such as limited water availability, hilly topography, and low accessibility to irrigation systems contribute to unstable rice productivity. These conditions reduce the economic viability of rice farming and encourage farmers to shift to horticultural or plantation farming as their primary source of income. Thus, rice farmers’ marginalization of the upland landscape is mainly driven by the internal limitations of the production environment, coupled with a gradual livelihood transition as an adaptive strategy.
Figure 6.
Causal loop diagram of rice farmers’ marginalization in the upland landscape.
A key difference between the two landscapes lies in the role of land conversion and how farmers respond when rice productivity is affected by it. In lowland landscapes, land conversion is a dominant and visible process that interlinks urbanization and the degradation of rice farmers’ economic conditions. However, in upland landscapes, it is more closely related to production constraints and livelihood adaptations. These differences highlight the importance of considering landscape-specific conditions when interpreting the processes that shape agricultural marginalization.
4. Discussion: The Pathways for Rice Farmers’ Marginalization in Lowland and Upland Landscapes
4.1. The Influence of Varied Landscape Configurations on the Marginalization of Rice Farmers
Marginalization of rice farmers is a multi-dimensional process that connects socioeconomics and physical–spatial variables and exhibits variation in its patterns across different landscape configurations. Previous studies on farmer marginalization in peri-urban agricultural areas have identified contributing factors such as land conversion driven by urbanization, economic pressure, and inadequate irrigation systems [6,26,27,28,29,30]. While earlier studies have highlighted the multidimensional issues in farmers’ marginalization, the marginalization is generally treated as a linear outcome of the contributing variables. It secluded the varied interconnection pathways that shape the marginalization among rice farmers. By comparing lowland and upland areas, this study identifies distinct cascading effects of urbanization.
While it is widely recognized that marginal farmers face poverty because of low productivity in small rice field plots, it has not been clearly established whether their experiences of land marginality are uniform across all landscape types. Furthermore, despite varying driving factors and coping capacities affecting marginal farmers across regions, they are often perceived as homogeneous and impoverished in policy discussions. The findings of this study indicate that although the study areas are geographically close and situated within the same peri-urban zones, the unique geomorphological conditions of the lowland and upland districts produce distinct patterns of land transformation, which contribute differently to the feedback mechanism of rice farming marginalization. Furthermore, reports by local agricultural extension agencies enriched our understanding of these findings from the physical–spatial and socioeconomic perspectives by providing a background on why land transformation occurs in these areas and how it affects the livelihoods of farmers (Table 4).
Table 4.
The multidimensionality of marginalization in lowland and upland landscapes.
In lowland districts, the development of built-up areas tends to create fragmented clusters outside existing built-up areas. These fragmented built-up areas are usually new housing clusters built in rice farming zones. This type of landscape conversion creates a mix of rice fields and housing areas, leading to problems such as pest infestations and water pollution from domestic waste. Consequently, this has caused a decline in rice production and exacerbated the marginalization of rice farmers. Conversely, in upland districts, urbanization takes a different form. Built-up area development generally follows that of existing built-up areas, particularly in the lower areas of districts in the upland landscape. Additionally, due to greater distance from urban centers and hilly topography, development is more closely associated with tourism infrastructure. These facilities are often located in upstream areas, where they convert forest to built-up areas, disrupt and pollute water flows, reducing irrigation reliability. This, in turn, constrains planting frequency and lowers productivity, gradually contributing to farmer marginalization.
The varying geomorphological conditions in both landscapes also contribute to the enabling factors of rice farmers’ coping strategies in the face of agricultural crises such as crop failure. Lowland areas provide a suitable environment for rice cultivation, resulting in significantly higher yields. However, the physical characteristics of lowland landscapes are unsuitable for horticultural or plantation farming, limiting the potential for secondary on-farm income. Consequently, rice farmers in lowland areas often opt for off-farm secondary income sources such as construction labor and driving for online ride-sharing platforms. In times of urgent financial need, they resort to informal debt from middlemen. By contrast, upland landscapes are less suitable for optimal rice production, but their physical conditions allow farmers to engage in horticultural or plantation farming, thereby offering safe secondary income sources. The four studied districts in the lowland and upland landscapes demonstrate how different patterns and relationships in LULC class transformations uniquely contribute to the marginalization of rice farmers. It shows that marginalization does not follow a single trajectory, but rather emerges through varied pathways shaped by socioeconomics and physical–spatial constraints, and farmers’ livelihood responses.
4.2. Inadvertent Outcomes of Coping Mechanisms in Rice Farming
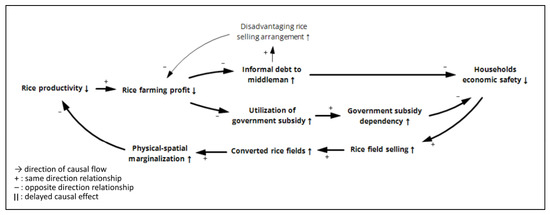
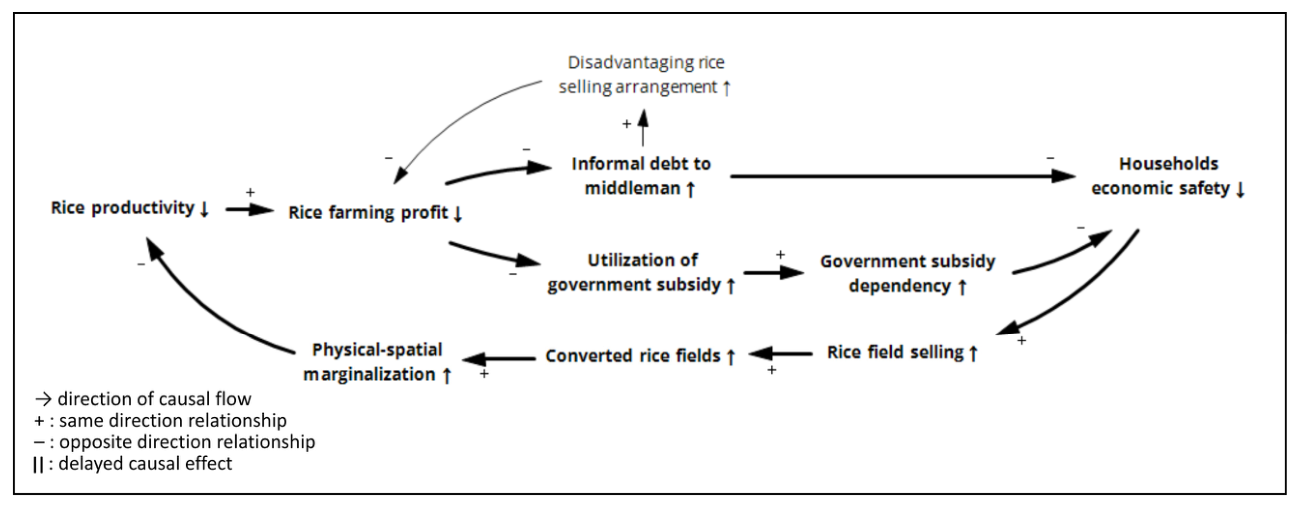
This study identified a balancing-type process that maintains the system in an undesirable state (Figure 7). In response to the declining income from rice farming, farmers adopted coping strategies such as reliance on informal debt from middlemen and government subsidies. While these coping strategies acted as short-term relief by providing access to production capital to continue rice farming activity, they exacerbated the vulnerability of farmers’ economic safety through disadvantageous rice selling arrangements and high dependency on government subsidies. Consequently, this mechanism creates persistent economic pressure among rice farmers, driving them to sell their rice fields, ultimately leading to further decline of rice productivity and a higher risk of rice farmers’ marginalization. In contrast to conventional interpretations of balancing loops as corrective mechanisms, usually through policy or program implementation, the findings of this study suggest that balancing processes may also create an equilibrium state under unfavorable conditions. In this case, the coping mechanism does not address the underlying drivers of marginalization but instead regulates the system that drives the decline in economic viability and production capacity.
Figure 7.
Adverse balancing loops underlying persistent economic pressure among rice farmers.
This type of adverse balancing loop is consistent with well-established system archetypes in ST, namely the “shifting the burden” system archetype. This archetype describes the situation in which the system relies on symptomatic solutions rather than addressing the root cause of the problem, which in the longer term leads to worse system performance and outcomes [49,50,51]. In the context of this study, symptomatic solutions refer to farmers’ reliance on informal debts to middlemen and government subsidies without resolving the structural problems underlying marginalization. This interpretation suggests that despite the presence of a balancing loop, if the coping strategies creating the balancing loop are structurally disadvantageous and oriented toward symptom relief rather than structural change, they may function as adversity mechanisms that perpetuate the problem.
4.3. Rethinking Farmers’ Marginalization as a Dynamic Interconnected Process
The marginalization of farmers extends beyond the decline in cultivated land. Many researchers and international organizations define the term “small farmers” as farmers who cultivate less than 2 ha of farmland [52,53,54]. However, although landholding size is commonly used as the main variable to classify farmers’ types or statuses owing to its measurability [53,55], it fails to capture the heterogeneity of farmers’ conditions within the same landholding size. Recent studies advocate for a multidimensional understanding of farmer conditions that incorporates not only landholding size but also economic capacity, access to resources, and adaptive strategies. As a result, reliance on land size alone leads to conceptual ambiguity and may distort policy interventions aimed at improving farmers’ livelihoods.
In the case of Indonesia, governments and researchers commonly use the term petani gurem, which translates to small or marginal farmers, to refer to those who cultivate less than 0.5 ha of farmland [56,57,58,59]. However, several studies show that farmers cultivating more than 0.5 ha continue to experience economic instability and remain highly dependent on government subsidies, particularly in the absence of adequate access to agricultural inputs, markets, and financial resources [60,61,62]. This discrepancy is further exacerbated by the design of Indonesia’s fertilizer subsidy policy, which targets farmers who cultivate less than 0.5 ha. As a result, despite being economically vulnerable, farmers with larger landholdings remain excluded from subsidy access despite facing similar structural constraints. This creates a policy gap, in which eligibility criteria based solely on land size fail to reflect the complex realities of farmers’ livelihoods. Given that marginality is shaped by multidimensional and interconnected factors, reliance on land size as the primary determinant of eligibility for support is insufficient. This raises important concerns about the effectiveness and equity of the current policy approaches.
Ref. [63] conceptualized marginality through a broader lens, including employment, income, economic value, and social roles. Similarly, other studies have highlighted the importance of access to markets, institutional support, and adaptive responses in shaping farmers’ livelihoods [64]. These perspectives demonstrate how multisectoral constraints beyond land size contribute to the marginalization process. Despite these advances, much of the literature remains limited to a static analytical approach that treats the contributing factors as separate and independent variables. Additionally, when marginalization is observed as a process, most earlier studies conceptualized it in two separate domains: farmland marginalization and farmer marginalization. Studies related to farmland marginalization have mainly focused on the physical attributes that drive land abandonment and the decline in its economic value [65,66,67], whereas studies on marginal farmers have focused more on economic vulnerability and coping strategies among farmers [68,69]. Despite the close link between farmland and farmer marginalization, previous studies have addressed both phenomena in separate discussions. However, treating both marginalization independently eliminates the feedback mechanisms through which physical and socioeconomic factors interact.
There are still gaps in understanding rice farmers’ marginalization based only on the size of the farmland or from the separate domains of physical and economic marginalization. Understanding the pathways leading to marginalization is crucial because farmers actively respond to constraints through various adaptation strategies. While intended to cope with immediate challenges, these responses may have unintended consequences [70,71,72]. To fill the gaps in the understanding of marginalization beyond the static conditions of land scarcity, this study reconceptualizes the marginalization of rice farmers as an interconnection between the dynamic socioeconomic and physical components. The marginalization of rice farmers is defined as the progressive deterioration of their access to economically viable rice farming systems and sufficient ecosystem services through interactions between uncontrolled LULC conversion and socioeconomic pressures. Furthermore, marginal farmers are considered active land users who suffer from poverty traps, despite actively adopting adaptive strategies. In the context of agricultural policymaking, this perspective provides a more comprehensive understanding of farmer marginalization as a systemic and interconnected process. By examining the pathways through which marginalization develops, policymakers can better anticipate the secondary effects of interventions and understand how farmers’ responses to policies and external pressures may influence policy outcomes. This approach supports a more context-sensitive and adaptive policy design, particularly for rapidly changing peri-urban agricultural landscapes.
5. Conclusions
In discussions surrounding agricultural sustainability and food security, evaluation frameworks have solely focused on the dynamics of rice productivity as the primary criterion when assessing the sustainability of rice farming systems, overlooking the structural conditions that contribute to farmers’ inability to build a sustainable livelihood through rice farming. The marginalization of rice farmers can be viewed as a reflection of systemic dysfunction within the rice farming system, which highlights socioeconomic, institutional, and spatial imbalances. To foster a more sustainable rice farming system, this study presents a multidimensional analysis of rice farmer marginalization that extends beyond productivity indicators by focusing on the interplay of physical–spatial and socioeconomic elements in the rice farming system. Accordingly, it explores the structural vulnerabilities that potentially exacerbate the decline in productive rice fields and farming households.
A comparative analysis of lowland and upland landscapes highlights that geomorphological variation plays an important role in shaping distinct marginalization pathways. These variations in landscape configuration further shaped the farmers’ coping strategies. Furthermore, this study reveals how the marginalization of rice farmers is produced and reinforced through interconnected feedback mechanisms, rather than isolated drivers, by combining spatiotemporal LULC and landscape fragmentation analyses with CLDs. Critical factors in the marginalization nexus are rice productivity and converted rice fields. Thus, rice productivity changes from physical degradation to economic vulnerability. Conversely, rice field conversion translates to economic vulnerability due to physical degradation. These feedback mechanisms create poverty traps and environmental degradation, leading to marginalization and disengagement among rice farmers.
In conclusion, this study contributes theoretically by reframing farmer marginalization as a dynamic socio-ecological process shaped by interconnected feedback loops between land use change, institutional factors, and livelihood constraints, rather than a static condition defined solely by land size or economic status. The integrated methodological framework proposed in this study offers a transferable approach for identifying sustainability risks in peri-urban agricultural areas with heterogeneous terrain dominated by small-scale farming households. The CLD suggests the need to move beyond sectoral responses toward integrated strategies that simultaneously protect productive landscapes, strengthen irrigation governance, expand access to affordable production capital, and support intergenerational farming continuity. Linking land-use dynamics, geomorphological variability, and farmers’ livelihood conditions provides insights for policymakers to promote adaptive and socially inclusive agricultural planning.
From a policy perspective, targeted intervention aligned with existing rice field protection policies (LP2B and LSD) is important to ensure that the implemented policy prioritizes the land safety and livelihood resilience of marginal rice farmers. In lowland peri-urban areas, stricter enforcement of rice field protection zoning and improved monitoring of land conversion should be prioritized. Additionally, owing to the lack of rice field ownership among farmers, it is important to improve landowners’ participation and awareness. This measure requires improvement and proper updating of the land ownership data. In upland areas, strengthening irrigation infrastructure and local water governance is critical to sustain productivity. Additionally, the findings highlight the need to move beyond short-term support measures to interventions that strengthen farmers’ endogenous economic capacities. Policy efforts should prioritize improving the economic viability of rice farming through enhanced access to affordable and sustainable financing mechanisms rather than relying on informal credit. In addition, strengthening irrigation infrastructure, input accessibility, and productivity-enhancing technologies can help stabilize production capacity. In upland areas, policies should support diversified yet complementary agricultural systems that allow farmers to maintain engagement in rice farming while expanding their income sources.
Despite its contributions, this study has a limitation. While the CLD captures the key feedback mechanisms underlying rice farmer marginalization, it represents a qualitative system structure and does not quantify the strength or directionality of the relationships. Therefore, it lacks the ability to predict the possible future development of rice farmer marginalization. Future research could strengthen the robustness of these findings by incorporating participatory validation with local stakeholders, which could help refine the system structure and enhance the empirical validity of the identified marginalization processes.
Author Contributions
Conceptualization, A.A.; Methodology, A.A.; Software, A.A.; Validation, A.A. and I.S.; Formal Analysis, A.A.; Data Curation, A.A. and I.S.; Writing—Original Draft Preparation, A.A.; Writing—Review and Editing, A.A. and I.S.; Visualization, A.A.; Supervision, I.S. All authors have read and agreed to the published version of the manuscript.
Funding
This research was supported by JSPS KAKENHI Grant Number 25K03341.
Institutional Review Board Statement
Not applicable.
Informed Consent Statement
Not applicable.
Data Availability Statement
The satellite data used in this study were obtained from Sentinel-2 imagery available on the Google Earth Engine (GEE) platform. Secondary data were collected from official reports provided by local agricultural extension agencies. The processed datasets generated and analyzed in the current study are available from the corresponding author upon reasonable request and are subject to agreement with relevant data providers.
Conflicts of Interest
The authors declare no conflicts of interest.
Appendix A
Table A1.
Non-normalized landscape indices result.
Table A2.
Class accuracy.
References
- Follmann, A. Geographies of Peri-urbanization in the Global South. Geogr. Compass 2022, 16, e12650. [Google Scholar] [CrossRef] [Scilit]
- Zasada, I. Multifunctional Peri-Urban Agriculture—A Review of Societal Demands and the Provision of Goods and Services by Farming. Land Use Policy 2011, 28, 639–648. [Google Scholar] [CrossRef] [Scilit]
- Nadoushan, M.A. Advancing Urban Planning in Arid Agricultural-Urbanized Landscapes of Iran: Spatial Modeling Evidence from a Rapidly Developing Region. Sustain. Cities Soc. 2022, 87, 104230. [Google Scholar] [CrossRef] [Scilit]
- Shaw, B.J.; Van Vliet, J.; Verburg, P.H. The Peri-Urbanization of Europe: A Systematic Review of a Multifaceted Process. Landsc. Urban Plan. 2020, 196, 103733. [Google Scholar] [CrossRef] [Scilit]
- Wadduwage, S.; Millington, A.; Crossman, N.D.; Sandhu, H. Agricultural Land Fragmentation at Urban Fringes: An Application of Urban-To-Rural Gradient Analysis in Adelaide. Land 2017, 6, 28. [Google Scholar] [CrossRef] [Scilit]
- Rustiadi, E.; Pravitasari, A.E.; Setiawan, Y.; Mulya, S.P.; Pribadi, D.O.; Tsutsumida, N. Impact of Continuous Jakarta Megacity Urban Expansion on the Formation of the Jakarta-Bandung Conurbation over the Rice Farm Regions. Cities 2021, 111, 103000. [Google Scholar] [CrossRef] [Scilit]
- Statistics Indonesia. Statistical Yearbook of Indonesia 2021; Statistics Indonesia: Jakarta, Indonesia, 2021. [Google Scholar]
- Statistics Indonesia. Statistical Yearbook of Indonesia 2023; Statistics Indonesia: Jakarta, Indonesia, 2023. [Google Scholar]
- Wu, L.; Yang, Y.; Yang, H.; Xie, B.; Luo, W. A Comparative Study on Land Use/Land Cover Change and Topographic Gradient Effect between Mountains and Flatlands of Southwest China. Land 2023, 12, 1242. [Google Scholar] [CrossRef] [Scilit]
- Wang, F.; Fu, W.; Chen, J. Spatial–Temporal Evolution of Ecosystem Service Value in Yunnan Based on Land Use. Land 2022, 11, 2217. [Google Scholar] [CrossRef] [Scilit]
- Liu, F.; Dai, E.; Yin, J. A Review of Social–Ecological System Research and Geographical Applications. Sustainability 2023, 15, 6930. [Google Scholar] [CrossRef] [Scilit]
- Schlüter, M.; Haider, L.J.; Lade, S.J.; Lindkvist, E.; Martin, R.; Orach, K.; Wijermans, N.; Folke, C. Capturing Emergent Phenomena in Social-Ecological Systems: An Analytical Framework. Ecol. Soc. 2019, 24, 11. [Google Scholar] [CrossRef] [Scilit]
- Preiser, R.; Biggs, R.; De Vos, A.; Folke, C. Social-Ecological Systems as Complex Adaptive Systems: Organizing Principles for Advancing Research Methods and Approaches. Ecol. Soc. 2018, 23, 46. [Google Scholar] [CrossRef] [Scilit]
- Gain, A.K.; Giupponi, C.; Renaud, F.G.; Vafeidis, A.T. Sustainability of Complex Social-Ecological Systems: Methods, Tools, and Approaches. Reg. Environ. Change 2020, 20, 102. [Google Scholar] [CrossRef] [Scilit]
- Meadows, D.H. Thinking in Systems: A Primer; Earthscan: London, UK, 2009. [Google Scholar]
- Barbrook-Johnson, P.; Penn, A.S. Systems Mapping: How to Build and Use Causal Models of Systems; Springer International Publishing: Cham, Switzerland, 2022. [Google Scholar] [CrossRef] [Scilit]
- Von Bertalanffy, L. General System Theory: Foundations, Development; George Braziller: New York, NY, USA, 1968. [Google Scholar]
- Arnold, R.D.; Wade, J.P. A Definition of Systems Thinking: A Systems Approach. Procedia Comput. Sci. 2015, 44, 669–678. [Google Scholar] [CrossRef] [Scilit]
- Crielaard, L.; Uleman, J.F.; Châtel, B.D.L.; Epskamp, S.; Sloot, P.M.A.; Quax, R. Refining the Causal Loop Diagram: A Tutorial for Maximizing the Contribution of Domain Expertise in Computational System Dynamics Modeling. Psychol. Methods 2024, 29, 169–201. [Google Scholar] [CrossRef] [Scilit] [PubMed]
- Sterman, J.D. Learning from Evidence in a Complex World. Am. J. Public Health 2006, 96, 505–514. [Google Scholar] [CrossRef] [Scilit] [PubMed]
- Yoshida, S. Effects of Urbanization on Farmland Size and Diversified Farm Activities in Japan: An Analysis Based on the Land Parcel Database. Land 2020, 9, 315. [Google Scholar] [CrossRef] [Scilit]
- Uematsu, H.; Mishra, A.K. Use of Direct Marketing Strategies by Farmers and Their Impact on Farm Business Income. Agric. Resour. Econ. Rev. 2011, 40, 1–19. [Google Scholar] [CrossRef] [Scilit]
- Partelow, S. A Review of the Social-Ecological Systems Framework: Applications, Methods, Modifications, and Challenges. Ecol. Soc. 2018, 23, 36. [Google Scholar] [CrossRef] [Scilit]
- Lin, G.; Palopoli, M.; Dadwal, V. From Causal Loop Diagrams to System Dynamics Models in a Data-Rich Ecosystem. In Leveraging Data Science for Global Health; Celi, L.A., Majumder, M.S., Ordóñez, P., Osorio, J.S., Paik, K.E., Somai, M., Eds.; Springer International Publishing: Cham, Switzerland, 2020; pp. 77–98. [Google Scholar] [CrossRef] [Scilit]
- Ashari, N. Tinjauan tentang Alih Fungsi Lahan Sawah ke Non Sawah dan Dampaknya di Pulau Jawa. Forum Penelit. Agro Ekon. 2016, 21, 83. [Google Scholar] [CrossRef] [Scilit]
- Achmad, M.; Labida, L.; Djuarsa, F.F. Valuasi Ekologis terhadap Alih Fungsi Lahan Sawah di Kabupaten Bandung, Jawa Barat. Mimb. Agribisnis J. Pemikir. Masy. Ilm. Berwawasan Agribisnis 2025, 11, 4099–4111. [Google Scholar] [CrossRef] [Scilit]
- Firman, T. Land Conversion and Urban Development in the Northern Region of West Java, Indonesia. Urban Stud. 1997, 34, 1027–1046. [Google Scholar] [CrossRef] [Scilit]
- Firman, T. The Continuity and Change in Mega-Urbanization in Indonesia: A Survey of Jakarta–Bandung Region (JBR) Development. Habitat Int. 2009, 33, 327–339. [Google Scholar] [CrossRef] [Scilit]
- Suriadikusumah, A.; Mulyono, A.; Maulana, M.H.R. Prediction of Bandung District Land Use Change Using Markov Chain Modeling. Int. J. Adv. Sci. Eng. Inf. Technol. 2022, 12, 237–243. [Google Scholar] [CrossRef] [Scilit]
- Rondhi, M.; Suherman, S.J.H.; Hensie, C.B.; Ulum, S.; Suwandari, A.; Rokhani; Mori, Y.; Kondo, T. Urbanization Impacts on Rice Farming Technical Efficiency: A Comparison of Irrigated and Non-Irrigated Areas in Indonesia. Water 2024, 16, 651. [Google Scholar] [CrossRef] [Scilit]
- Ciparay District Government. Ciparay District in Figures 2025; Ciparay District Government: Kecamatan Ciparay, Kabupaten Bandung, Indonesia, 2025.
- Baleendah District Government. Baleendah District in Figures 2025; Baleendah District Government: Kecamatan Baleendah, Kabupaten Bandung, Indonesia, 2025.
- Ibun District Government. Ibun District in Figures 2025; Ibun District Government: Kecamatan Ibun, Kabupaten Bandung, Indonesia, 2025.
- Pasirjambu District Government. Pasirjambu District in Figures 2025; Pasirjambu District Government: Kecamatan Pasirjambu, Kabupaten Bandung, Indonesia, 2025.
- Enoguanbhor, E.C.; Gollnow, F.; Walker, B.B.; Nielsen, J.O.; Lakes, T. Key Challenges for Land Use Planning and Its Environmental Assessments in the Abuja City-Region, Nigeria. Land 2021, 10, 443. [Google Scholar] [CrossRef] [Scilit]
- Rahmawati, D.; Samsura, D.A.A.; Krabben, E.V.D. From Policy to Practice: How Public Land Policies Shape Private-Sector Housing Development—An Indonesian Case. Land 2025, 14, 916. [Google Scholar] [CrossRef] [Scilit]
- Wang, Y.; Liao, J.; Ye, Y.; O’Byrne, D.; Scown, M.W. Implications of Policy Changes for Coastal Landscape Patterns and Sustainability in Eastern China. Landsc. Ecol. 2024, 39, 4. [Google Scholar] [CrossRef] [Scilit]
- Gustafson, E.J. Minireview: Quantifying Landscape Spatial Pattern: What Is the State of the Art? Ecosystems 1998, 1, 143–156. [Google Scholar] [CrossRef] [Scilit]
- Kupfer, J.A. Landscape Ecology and Biogeography: Rethinking Landscape Metrics in a Post-FRAGSTATS Landscape. Prog. Phys. Geogr. Earth Environ. 2012, 36, 400–420. [Google Scholar] [CrossRef] [Scilit]
- Turner, B.L.; Kasperson, R.E.; Matson, P.A.; McCarthy, J.J.; Corell, R.W.; Christensen, L.; Eckley, N.; Kasperson, J.X.; Luers, A.; Martello, M.L.; et al. A Framework for Vulnerability Analysis in Sustainability Science. Proc. Natl. Acad. Sci. USA 2003, 100, 8074–8079. [Google Scholar] [CrossRef] [Scilit]
- McGarigal, K.; Cushman, S.A.; Ene, E. FRAGSTATS v4: Spatial Pattern Analysis Program for Categorical and Continuous Maps; Computer Software Program Produced by the Authors at the University of Massachusetts, Amherst: Amherst, MA, USA, 2012. [Google Scholar]
- Li, H.; Wu, J. Use and Misuse of Landscape Indices. Landsc. Ecol. 2004, 19, 389–399. [Google Scholar] [CrossRef] [Scilit]
- Creswell, J.W. Research Design: Qualitative, Quantitative, and Mixed Methods Approaches, 3rd ed.; SAGE Publications: Los Angeles, CA, USA, 2014. [Google Scholar]
- Coletta, V.R.; Pagano, A.; Pluchinotta, I.; Fratino, U.; Scrieciu, A.; Nanu, F.; Giordano, R. Causal Loop Diagrams for Supporting Nature Based Solutions Participatory Design and Performance Assessment. J. Environ. Manag. 2021, 280, 111668. [Google Scholar] [CrossRef] [Scilit] [PubMed]
- Egerer, S.; Cotera, R.V.; Celliers, L.; Costa, M.M. A Leverage Points Analysis of a Qualitative System Dynamics Model for Climate Change Adaptation in Agriculture. Agric. Syst. 2021, 189, 103052. [Google Scholar] [CrossRef] [Scilit]
- Giordano, R.; Osann, A.; Henao, E.; López, M.L.; Piqueras, J.G.; Nikolaidis, N.P.; Lilli, M.; Coletta, V.R.; Pagano, A. Causal Loop Diagrams for Bridging the Gap between Water-Energy-Food-Ecosystem Nexus Thinking and Nexus Doing: Evidence from Two Case Studies. J. Hydrol. 2025, 650, 132571. [Google Scholar] [CrossRef] [Scilit]
- Blair, C.; Gralla, E.; Wetmore, F.; Goentzel, J.; Peters, M. A Systems Framework for International Development: The Data-Layered Causal Loop Diagram. Prod. Oper. Manag. 2021, 30, 4374–4395. [Google Scholar] [CrossRef] [Scilit]
- Dhirasasna, N.; Sahin, O. A Multi-Methodology Approach to Creating a Causal Loop Diagram. Systems 2019, 7, 42. [Google Scholar] [CrossRef] [Scilit]
- Alizadeh, P.; Mohammadi, H.; Shahnoushi, N.; Saghaian, S.; Pooya, A. Application of System Thinking Approach in Identifying the Challenges of Beef Value Chain. AGRIS-Line Pap. Econ. Inform. 2020, 12, 3–16. [Google Scholar] [CrossRef] [Scilit]
- Madani, K.; Shafiee-Jood, M. Socio-Hydrology: A New Understanding to Unite or a New Science to Divide? Water 2020, 12, 1941. [Google Scholar] [CrossRef] [Scilit]
- Senge, P.M. The Fifth Discipline: The Art and Practice of the Learning Organization, 18th ed.; Doubleday/Currency: New York, NY, USA, 1990. [Google Scholar]
- Khalil, C.A.; Conforti, P.; Ergin, I.; Gennari, P. Defining Small-Scale Food Producers to Monitor Target 2.3 of the 2030 Agenda for Sustainable Development; FAO: Rome, Italy, 2017. [Google Scholar]
- Lowder, S.K.; Skoet, J.; Raney, T. The Number, Size, and Distribution of Farms, Smallholder Farms, and Family Farms Worldwide. World Dev. 2016, 87, 16–29. [Google Scholar] [CrossRef] [Scilit]
- World Bank. Working with Smallholders; World Bank: Washington, DC, USA, 2023. [Google Scholar] [CrossRef] [Scilit]
- Herrera, H. From Metaphor to Practice: Operationalizing the Analysis of Resilience Using System Dynamics Modelling. Syst. Res. Behav. Sci. 2017, 34, 444–462. [Google Scholar] [CrossRef] [Scilit]
- Anisah, F.K.; Santoso, W.; Hidayat, S.I. Eksistensi Petani Gurem Di Kabupaten Gresik. J. Ilm. Mhs. Agroinfo Galuh 2021, 8, 724–736. [Google Scholar] [CrossRef] [Scilit]
- Nurfu’adah, I.; Kurniawati, A. Faktor Yang Mempengaruhi Eksistensi Petani Gurem di Bantaran Sungai Brantas Kecamatan Kesamben Kabupaten Jombang. Swara Bhumi 2013, 2, 129–135. [Google Scholar]
- Purnawan, E.; Brunori, G.; Prosperi, P. Small Family Farms, A Review in Indonesian Context. Int. J. Multidiscip. Appl. Bus. Educ. Res. 2022, 3, 2708–2725. [Google Scholar] [CrossRef] [Scilit]
- Syahyuti, N. Pemahaman terhadap Petani Kecil sebagai Landasan Kebijakan Pembangunan Pertanian. Forum Penelit. Agro Ekon. 2013, 31, 15. [Google Scholar] [CrossRef] [Scilit]
- Bahrin, B.; Sugihen, B.G.; Susanto, D.; Asngari, P.S. Luas Lahan dan Pemenuhan Kebutuhan Dasar (Kasus Rumah Tangga Petani Miskin di Daerah Dataran Rendah Kabupaten Seluma). J. Penyul. 2015, 6. [Google Scholar] [CrossRef] [Scilit]
- Susilowati, S.H.; Maulana, M. Luas Lahan Usahatani dan Kesejahteraan Petani: Eksistensi Petani Gurem dan Urgensi Kebijakan Reforma Agraria. Anal. Kebijak. Pertan. 2012, 10, 17–30. [Google Scholar] [CrossRef] [Scilit]
- Komalasari, W.B.; Sabarella; Manurung, M.; Sehusman; Supriyati, Y.; Rinawati; Seran, K.; Naruri, M.D. Analisis Kesejahteraan Petani; Pusat Data dan Sistem Informasi Pertanian Sekretariat Jenderal, Kementerian Pertanian: Jakarta, Indonesia, 2024.
- Gatzweiler, F.W.; Von Braun, J. (Eds.) Technological and Institutional Innovations for Marginalized Smallholders in Agricultural Development; Springer International Publishing: Cham, Switzerland, 2016. [Google Scholar] [CrossRef] [Scilit]
- Touch, V.; Tan, D.K.Y.; Cook, B.R.; Liu, D.L.; Cross, R.; Tran, T.A.; Utomo, A.; Yous, S.; Grunbuhel, C.; Cowie, A. Smallholder Farmers’ Challenges and Opportunities: Implications for Agricultural Production, Environment and Food Security. J. Environ. Manag. 2024, 370, 122536. [Google Scholar] [CrossRef] [Scilit] [PubMed]
- Ahmadzai, H.; Tutundjian, S.; Elouafi, I. Policies for Sustainable Agriculture and Livelihood in Marginal Lands: A Review. Sustainability 2021, 13, 8692. [Google Scholar] [CrossRef] [Scilit]
- Csikós, N.; Tóth, G. Concepts of Agricultural Marginal Lands and Their Utilisation: A Review. Agric. Syst. 2023, 204, 103560. [Google Scholar] [CrossRef] [Scilit]
- Kitano, S. Estimation of Determinants of Farmland Abandonment and Its Data Problems. Land 2021, 10, 596. [Google Scholar] [CrossRef] [Scilit]
- Chen, Q.; Wu, M.; Xie, H. Tillage Conditions or Social Economy? An Analysis of the Dominant Driving Force of Farmland Marginalization from the Farmers’ Perspective. Land Use Policy 2023, 133, 106870. [Google Scholar] [CrossRef] [Scilit]
- Napsiah, N.; Hanjarwati, A. Marginalization of Farmers in Sustaining Their Livelihoods Due to the Development of Yogyakarta International Airport, Indonesia. Society 2024, 12, 575–590. [Google Scholar] [CrossRef] [Scilit]
- Anang, S.A.; Otchere-Peprah, K.; Aidoo-Mensah, D.; Mensah, N.O.; Nakuja, T.; Boateng-Gyambiby, D. Livelihood Diversification and Coping Strategies: Evidence from Small-Scale Fish Farmers in Ghana. Cogent Soc. Sci. 2024, 10, 2433712. [Google Scholar] [CrossRef] [Scilit]
- Giller, K.E. The Food Security Conundrum of Sub-Saharan Africa. Glob. Food Secur. 2020, 26, 100431. [Google Scholar] [CrossRef] [Scilit]
- Lowder, S.K.; Bhalla, G.; Davis, B. Decreasing Farm Sizes and the Viability of Smallholder Farmers: Implications for Resilient and Inclusive Rural Transformation. Glob. Food Secur. 2025, 45, 100854. [Google Scholar] [CrossRef] [Scilit]

Disclaimer/Publisher’s Note: The statements, opinions and data contained in all publications are solely those of the individual author(s) and contributor(s) and not of MDPI and/or the editor(s). MDPI and/or the editor(s) disclaim responsibility for any injury to people or property resulting from any ideas, methods, instructions or products referred to in the content. |
© 2026 by the authors. Licensee MDPI, Basel, Switzerland. This article is an open access article distributed under the terms and conditions of the Creative Commons Attribution (CC BY) license.