


Abstract
This study develops an integrated vessel-level framework for assessing logistics performance and operational energy efficiency in container shipping. The novelty of the study lies in the development of a unified analytical approach that explicitly integrates logistics indicators with fuel consumption and emissions within a consistent system boundary, including auxiliary engine operation during both sea passages and port stays. The framework is applied to four medium-sized container vessels (6000–7500 TEU; 20-foot equivalent unit) under normalised operating conditions. The results show that higher capacity utilisation and economies of scale significantly improve both cost and energy performance, while emissions intensity varies by more than twofold across vessels. A deterministic sensitivity analysis is applied to evaluate the influence of key operational parameters. The analysis identifies service speed as the dominant driver, followed by vessel loading rate, while port-related parameters—such as auxiliary engine load and port productivity—have a lower yet still measurable influence, reducing emissions by up to 5% under improved conditions. The main contribution of the study is the development of a practical vessel-level benchmarking tool that captures logistics–energy interactions and supports operational decision-making under current regulatory frameworks, including EU ETS, FuelEU Maritime, and the IMO Carbon Intensity Indicator (CII).
1. Introduction
Maritime transport accounts for over 80% of global trade by volume and forms the backbone of international supply chains. The growth of containerised trade, combined with increasing vessel size and operational complexity, has intensified competition among shipping companies. In this context, operational efficiency and logistics performance have become key determinants of cost competitiveness and service reliability within container shipping networks [1,2].
Over recent decades, container shipping has undergone a significant structural transformation, characterised by vessel upscaling, network consolidation, and closer integration with logistics systems. Although larger vessels offer economies of scale, they also increase dependence on port performance, which leads to longer port stays and higher sensitivity to terminal productivity [3,4]. At the same time, growing regulatory pressure—particularly through IMO decarbonisation frameworks—has shifted attention towards vessel-level energy efficiency and emissions performance, commonly assessed using operational indicators such as fuel consumption per transported unit and the EEOI [5,6]. Despite these developments, existing research has largely focused on ultra-large container vessels or aggregated fleet-level analyses [7,8], leaving medium-size vessels comparatively underexplored in detailed vessel-level performance assessments.
Quantitatively, vessels in the 6000–7500 TEU range represent a substantial share of the global container fleet capacity, accounting for approximately 28% according to [9]. However, consistent with the literature discussed above [7,8], this vessel segment remains comparatively underrepresented in detailed vessel-level performance studies. This is particularly relevant given the operational flexibility of medium-sized container vessels, which are frequently deployed on routes serving ports with draft restrictions below 14 m, where ultra-large container ships cannot operate. As a result, their operational efficiency and environmental performance remain critical for maintaining flexible and resilient container shipping networks [2].
Against this background, this study develops an integrated vessel-level framework for jointly assessing logistics performance and energy efficiency in container shipping. The proposed approach accounts for fuel consumption associated with both main and auxiliary engine operation during sea passages and port stays, enabling a comprehensive evaluation of vessel performance under realistic operating conditions. By combining operational, economic, time-related, and environmental indicators, the framework provides a structured basis for analysing logistics–energy interactions in container shipping operations.
The specific objectives of this research are to:
- Assess logistics performance using key operational, cost, time, and reliability indicators.
- Evaluate energy efficiency through fuel consumption per transported unit (TEU) and the Energy Efficiency Operational Indicator (EEOI).
- Compare performance across vessels of similar capacity but different operational and technological characteristics.
- Identify operational trade-offs relevant to maritime logistics management.
- Identify the dominant operational drivers of logistics–energy interactions through structured sensitivity analysis.
In pursuit of these objectives, this study advances the following testable research hypothesis: port stay duration and auxiliary engine operation constitute dominant operational drivers of vessel-level emissions intensity (EEOI), with an impact comparable to that of vessel speed optimisation under otherwise similar operating conditions. This hypothesis is examined through a comparative vessel-level assessment and structured sensitivity analysis focusing on the relative influence of port-related parameters, vessel speed, and loading rate on normalised energy efficiency indicators.
The research contributes to the literature on sustainable maritime logistics in three main ways:
First, it develops an integrated vessel-level benchmarking framework that combines logistics performance indicators with IMO-based energy efficiency metrics within a unified system boundary, explicitly including auxiliary engine fuel consumption during both sea passages and port stays.
Second, it provides an empirical application focused on the medium-sized container ship segment (6000–7500 TEU), using real operational data from commercial voyages, addressing a segment that remains underrepresented compared to ultra-large container ships.
Third, through structured sensitivity analysis, it identifies dominant operational drivers and supports integrated ship–port decision-making.
The remainder of this article is structured as follows. Section 2 reviews the relevant literature on maritime logistics performance and energy efficiency in container shipping. Section 3 describes the research methodology and performance indicators employed. Section 4 presents the case study and operational context of the analysed vessels. Section 5 reports the empirical results, followed by a discussion of the findings in Section 6. Finally, Section 7 concludes the paper by summarising key contributions, managerial implications, and directions for future research.
2. Literature Review
Maritime logistics operates as an integrated system in which vessel operations, port performance, and logistics networks jointly determine the efficiency and reliability of container transport services [1,10,11]. Recent studies adopt a systems perspective, emphasising the interdependence between ship operations, port productivity, and logistics performance. As argued by Lopes (2025) [3], maritime logistics assessment requires multidimensional approaches capable of capturing operational efficiency, economic outcomes, and service reliability, as isolated indicators are insufficient to reflect trade-offs between cost, reliability, and environmental performance. From a broader logistics perspective, container shipping should therefore be evaluated within an integrated system linking shipping lines, ports, and hinterland transport networks [1].
Studies focusing on the port–ship interface further underline this operational interdependence. Empirical analyses show that berth productivity, crane allocation, yard organisation, and container-handling processes directly influence vessel port stay time, fleet utilisation, and overall logistics cycle duration [4,12,13]. As vessel sizes increase and operational margins tighten, systematic vessel-level benchmarking becomes an important analytical tool for both shipping companies and port authorities.
In parallel, a growing body of research links vessel operational characteristics with logistics and environmental performance. Studies on service speed management, fleet deployment strategies, and operational optimisation demonstrate that vessel-level decisions represent a key leverage point for improving both logistics efficiency and environmental sustainability [7,14]. Operational measures such as slow steaming, fleet scheduling, and port coordination can significantly influence both logistics outcomes and emission levels [15].
These developments indicate that vessel-level performance cannot be assessed through isolated indicators. Instead, an integrated analytical perspective that jointly considers logistics efficiency, operational costs, and environmental performance is increasingly required.
2.1. Logistics Performance Indicators in Container Shipping
The use of Key Performance Indicators (KPIs) has become a standard methodological approach for assessing logistics performance in container shipping. KPIs enable shipping companies and port operators to quantify efficiency, monitor service quality, identify operational bottlenecks, and support tactical and strategic decision-making. According to [3], effective maritime logistics performance measurement should encompass four main dimensions: capacity utilisation, cost efficiency, time performance, and service reliability.
The vessel capacity utilisation rate (VCUR) is widely recognised as a core indicator of commercial and operational performance. High utilisation improves cost efficiency and energy intensity per transported unit, but also increases exposure to congestion risks and operational disruptions if not supported by adequate port performance [2]. Cost-based indicators, particularly cost per TEU, remain central in container shipping analysis, consistently revealing the presence of economies of scale and technological learning effects [6,7].
Time-based indicators, such as vessel stationary time in port (port stay time) and logistics cycle time (LCT), are equally critical. Empirical studies show that reductions in port time significantly enhance fleet productivity and schedule reliability, often with a greater impact than marginal increases in service speed [13].
Reliability-related KPIs, including on-time arrival rate, have gained renewed importance due to increasing supply chain visibility requirements and the systemic disruptions observed in recent years. In this context, recent logistics research emphasises that performance monitoring in container shipping increasingly relies on integrated KPI frameworks capable of linking operational efficiency with service quality and environmental performance.
Despite the widespread use of logistics KPIs in container shipping analysis, relatively limited attention has been given to their integration with vessel-level energy efficiency metrics. Most KPI-based studies focus either on port-centric performance or on shipping company operations, without explicitly linking logistics indicators with energy consumption and emissions. This fragmentation constrains the ability to assess logistics and environmental performance within a unified analytical structure, motivating the development of more holistic vessel-level frameworks, whose mathematical formulations are presented in Section 3.
2.2. Energy Efficiency and Environmental Performance of Container Ships
Energy efficiency has become a central theme in maritime research following the introduction of international regulations aimed at limiting greenhouse gas emissions, including the Energy Efficiency Design Index (EEDI), the Energy Efficiency Existing Ship Index (EEXI), and operational indicators such as the Energy Efficiency Operational Indicator (EEOI) [16,17,18,19]. These regulatory instruments have stimulated extensive research on vessel energy performance, operational strategies, and decarbonisation pathways.
Recent research on decarbonisation pathways for maritime transport emphasises the need for integrated approaches combining operational measures, alternative fuels, and regulatory frameworks [20]. This is particularly relevant for emerging maritime regions and short-sea shipping segments. Larger and newer vessels generally exhibit lower emissions intensity per transported unit due to economies of scale, improved hydrodynamics, and enhanced propulsion efficiency [7,21]. However, real-world energy performance remains strongly influenced by operational parameters such as service speed, loading rate, and port waiting time. In this context, operational strategies, including slow steaming, fleet deployment optimisation, and digital voyage management, have been shown to significantly reduce fuel consumption and greenhouse gas emissions [15].
The EEOI has gained particular relevance as an operational metric reflecting actual voyage conditions. Empirical and modelling studies show that EEOI values are highly sensitive to slow steaming strategies, deployment patterns, and port congestion, making the EEOI a useful indicator for operational benchmarking and regulatory monitoring [19]. Nevertheless, EEOI-based analyses are still frequently conducted independently of logistics performance indicators, limiting their integration into broader maritime logistics decision frameworks.
Recent studies highlight that auxiliary engines and port-related energy demand account for a non-negligible share of total fuel consumption and CO2 emissions, particularly for container vessels with long port stays and high electrical loads. Hotelling and cargo-handling phases can significantly influence vessel-level emissions profiles [2,8,22]. Recent policy-oriented studies also emphasise the importance of including port-related energy demand in decarbonisation strategies, particularly in the context of shore power implementation and port electrification initiatives.
Overall, while the literature on container ship energy efficiency is extensive, explicit vessel-level frameworks integrating propulsion energy, auxiliary demand, and logistics performance indicators remain limited.
Despite its widespread use, the Energy Efficiency Operational Indicator (EEOI) presents several methodological limitations that must be considered in vessel-level assessments.
First, the EEOI is sensitive to cargo loading conditions, as it normalises emissions by transported cargo mass and distance. Variations in cargo load may therefore obscure underlying operational efficiency improvements [18].
Second, the EEOI does not explicitly reflect design-based efficiency improvements captured by the EEDI or EEXI, and the relationship between these indicators is not always straightforward [5].
Third, the EEOI results depend on methodological assumptions, including system boundaries, treatment of auxiliary engine consumption, and fuel type differentiation, which may affect cross-vessel comparability [22].
Fourth, the EEOI does not fully align with annual indicators such as AER used in the IMO Carbon Intensity Indicator (CII) framework [5].
Finally, its accuracy depends on the availability of detailed fuel consumption data, particularly for auxiliary engines during port stays [17].
2.3. Research Gaps and Contribution of the Present Study
Despite the extensive body of literature on maritime logistics, container shipping performance, and ship energy efficiency, an important research gap remains. Most existing studies analyse logistics performance indicators (such as cost efficiency, port time and capacity utilisation) and environmental performance metrics (such as fuel consumption and emissions) as separate analytical domains. Consequently, limited empirical research has examined how logistics performance and operational energy efficiency interact at the vessel level under real commercial operating conditions.
To address this limitation, the present study contributes to the literature in three main ways. First, it develops an integrated vessel-level framework that jointly evaluates logistics performance indicators and operational energy efficiency metrics. Second, the framework incorporates auxiliary engine fuel consumption during both sea passages and port stays within a consistent system boundary. Third, the framework is applied to a comparative case study of medium-sized container vessels operating under real commercial conditions, complemented by a structured sensitivity analysis examining the influence of vessel speed, port productivity and loading rate on logistics and environmental performance indicators [8].
By integrating logistics KPIs and IMO-based energy efficiency metrics within a unified vessel-level framework, this study contributes to a more comprehensive understanding of logistics–energy interactions in container shipping and provides a transferable methodological tool for vessel benchmarking and sustainability-oriented maritime logistics decision-making.
Table 1 presents the positioning of the present study relative to representative contributions in the existing literature.
Table 1.
Comparative positioning of the present study within the literature.
Table 1 highlights not only the scope of representative empirical studies, but also their limitations in relation to the integrated approach proposed in this paper.
Existing contributions tend to address vessel performance from a single analytical perspective. Energy-oriented studies (e.g., [14,23]) focus on fuel consumption and emissions, but do not incorporate logistics performance indicators. Conversely, logistics-oriented studies (e.g., [2]) analyse cost efficiency and capacity utilisation, without explicitly considering energy efficiency or emissions. Port-focused analyses (e.g., [24]) include auxiliary engine emissions, yet remain limited to port environments and do not extend to vessel-level logistics–energy interactions.
More recent decarbonisation studies (e.g., [15,25]) provide broader environmental assessments, but are typically conducted at fleet or policy level and do not offer an integrated empirical evaluation at vessel level under comparable operational conditions.
In this context, the present study extends the existing literature by integrating logistics performance indicators, vessel-level energy efficiency metrics, and auxiliary engine consumption—including port-related operations—within a unified analytical framework. This integrated approach enables a consistent vessel-level benchmarking and provides new empirical insight into the interaction between logistics efficiency and operational energy performance.
3. Methodology
3.1. Research Design and Methodological Approach
This study adopts a quantitative comparative case study to evaluate vessel-level logistics and energy performance under standardised conditions. The framework enables consistent comparison between vessels using a unified set of indicators within a defined system boundary. Quantitative performance assessment enables objective and reproducible comparison between vessels based on measurable operational, economic, and environmental indicators, and is therefore particularly suitable for benchmarking applications and operational performance analysis [2,3].
The methodological workflow consists of four sequential stages:
- Selection of representative container vessels;
- Definition of logistics and energy efficiency indicators;
- Data collection and normalisation;
- Comparative performance assessment.
This structured research workflow is consistent with methodological approaches commonly applied in vessel benchmarking and maritime logistics performance evaluation [13]. The overall methodological process is illustrated in Figure 1.
Figure 1.
Methodological framework for the integrated assessment of logistics and energy performance at container vessel level.
The diagram illustrates four sequential stages: (1) vessel selection, (2) definition of logistics and energy efficiency indicators, (3) data collection and normalisation, and (4) comparative performance assessment. Colour coding indicates as follows: data preparation procedures (grey), logistics-related variables (blue), energy-related variables (pink), integrated framework stages (green), and analytical procedures including sensitivity analysis (purple).
The energy and emissions modelling focuses exclusively on shipboard operational energy demand. All vessels analysed are assumed to operate using conventional marine fuels compliant with current International Maritime Organization (IMO) regulations. Main propulsion engines are assumed to operate on Heavy Fuel Oil (HFO) during sea passages, while auxiliary engines operate on Marine Gas Oil (MGO) during both navigation and port stays, reflecting common operational practice and emission inventory methodologies. For emissions calculations, fuel-specific CO2 conversion factors recommended by the IMO are applied.
The system boundary of the assessment is defined at vessel level and includes fuel consumption associated with main engine propulsion and auxiliary engine operation during both sea passages and port stays. Hinterland transport activities and terminal yard operations are intentionally excluded in order to maintain analytical focus on vessel operational performance and to avoid introducing exogenous logistics variability unrelated to ship operation.
The analysed vessels operate at high-capacity utilisation levels (VCUR ≈ 0.89–0.93), representative of economically efficient deployment in container shipping. Operational data were normalised using standardised assumptions (see Section 3.3). This normalisation isolates vessel-level performance differences from route and terminal variability.
3.2. Data Sources and Case Study Description
The empirical analysis is based on operational data collected from four medium-sized container vessels operating under comparable commercial conditions. The vessels represent a typical segment of the global container fleet used in regional and intercontinental liner services. Although the dataset is limited in size due to commercial data availability constraints, the selected vessels capture relevant variations in age, propulsion characteristics, and operational deployment within the medium-size container ship segment.
The dataset includes operational and performance parameters obtained from vessel operational records and voyage reports. The collected data comprise the following variables:
- Main engine fuel consumption during sea passages.
- Auxiliary engine fuel consumption during both navigation and port stays.
- Vessel cargo capacity and actual transported container units.
- Voyage distance and voyage duration.
- Port stay duration and cargo-handling periods.
These variables enable the calculation of both logistics performance indicators and vessel-level operational energy efficiency metrics.
To ensure meaningful comparison between vessels, operational data were normalised using consistent assumptions (see Section 3.3). This standardisation allows the analysis to isolate vessel-related performance differences while minimising the influence of route-specific operational variability.
Prior to analysis, the dataset was subjected to a structured data screening and quality control procedure to ensure internal consistency and reproducibility. Voyage records were filtered based on three operational criteria: (i) completeness of key variables (fuel consumption, voyage duration, cargo load, and port stay time); (ii) logical consistency between related variables (e.g., consistency between voyage distance, service speed, and reported duration); and (iii) plausibility checks against typical operational ranges reported in the literature for medium-size container vessels.
Records with missing or inconsistent values in any of the core variables were excluded from the analysis. Approximately 10–15% of the initial voyage records were removed during this screening process. The final dataset thus consists exclusively of internally consistent and operationally realistic observations, ensuring robustness and reproducibility of the subsequent analysis.
3.3. Voyage Modelling and Sea Transport Time
For comparability, a standardised voyage distance is considered. The sea transport time is calculated as:
where:
- is the sea passage time
- D [Nm] represents the voyage distance (nautical miles)
- V [kn] is the average service speed of the vessel (knots)
A reference voyage distance of 1000 nautical miles is used in the analysis. This normalisation allows fuel consumption and emissions intensity to be compared across vessels independently of route-specific characteristics such as port rotation or geographical deployment. Such normalisation practices are commonly applied in vessel benchmarking studies to isolate vessel-related performance differences from route-dependent operational variability.
3.4. Fuel Consumption Modelling
3.4.1. Main Engine Fuel Consumption
Fuel consumption during sea passage is calculated using main engine operational parameters:
where:
- [t] is the total fuel consumption of the main engine during the sea passage;
- [kW] is the main engine (ME) power;
- [−] is the main engine load factor;
- [g/kWh] is the specific fuel consumption.
3.4.2. Auxiliary Engine Fuel Consumption
Auxiliary engine fuel consumption is calculated separately for sea passage and port stay conditions.
Auxiliary engine consumption during sea passage:
Auxiliary engine consumption during port stay:
where:
- [t] is the auxiliary engine fuel consumption during sea passage;
- [t] is the auxiliary engine fuel consumption during port stay;
- is the number of auxiliary engines operating in parallel;
- [kW] is the rated power of one auxiliary engine (diesel generator);
- [g/kWh] is the auxiliary engine (AE) specific fuel consumption;
- is the auxiliary engine load factor during sea passages;
- is the auxiliary engine load factor during port stay;
- [h] is the sea passage time;
- [h] is the port stay time.
Two auxiliary engine sets are assumed to operate in parallel during both sea passage and port stay, consistent with typical container ship operational practice.
Auxiliary engine fuel consumption was estimated using representative load factors for sea passage and port stay conditions. Based on commonly applied ship emission inventory methodologies and empirical studies on container ship electrical demand, auxiliary engine load factors were set to 0.30 during sea passage and 0.40 during port stay operations [26].
These values fall within the typical ranges reported in port emission inventories and container ship operational studies. A sensitivity analysis was subsequently conducted to assess the influence of auxiliary engine loading assumptions on the resulting energy efficiency indicators. Detailed justification of load factor selection is provided in Appendix C.
3.5. Logistics Performance Indicators
3.5.1. Vessel Capacity Utilisation Rate (VCUR)
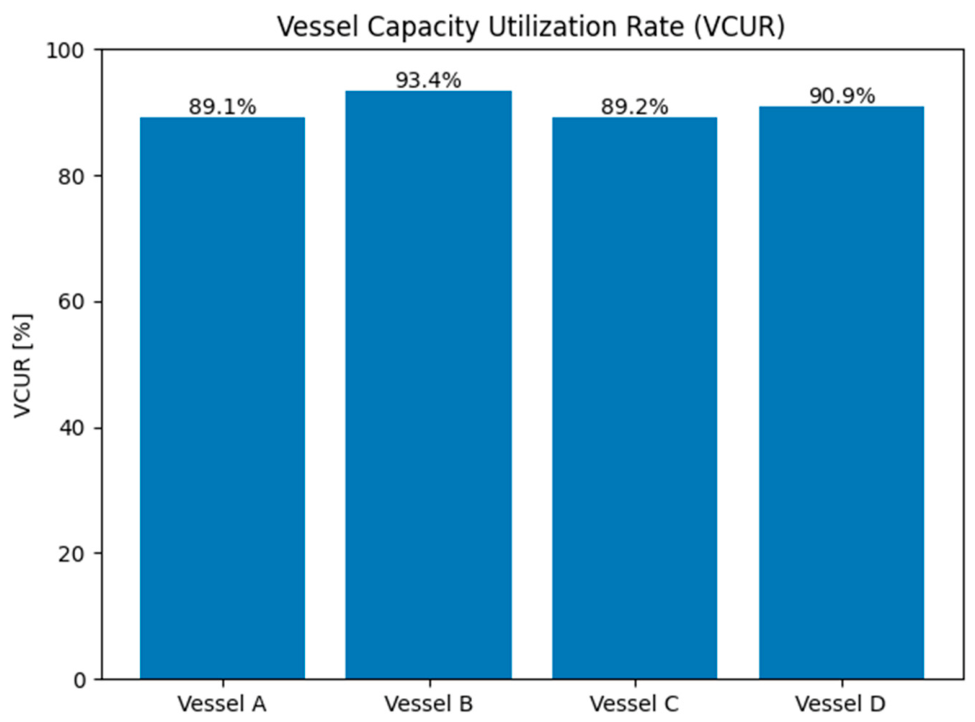
This indicator measures the efficiency of vessel capacity exploitation and represents a core metric in container shipping logistics (Figure 2).
where:
- [] is the vessel capacity utilisation rate;
- [−] is the number of containers transported;
- [−] is the total vessel container capacity.
Figure 2.
Bar chart of vessel capacity utilisation rate (VCUR) for each vessel.
3.5.2. Cost per TEU
Due to data confidentiality, non-fuel operating expenses (OPEX) are estimated using industry benchmarks. To account for age-related differences, baseline OPEX values were adjusted using factors derived from maritime economics literature. The complete methodology, including adjustment factors and references to [12,27,28], is detailed in Appendix B.
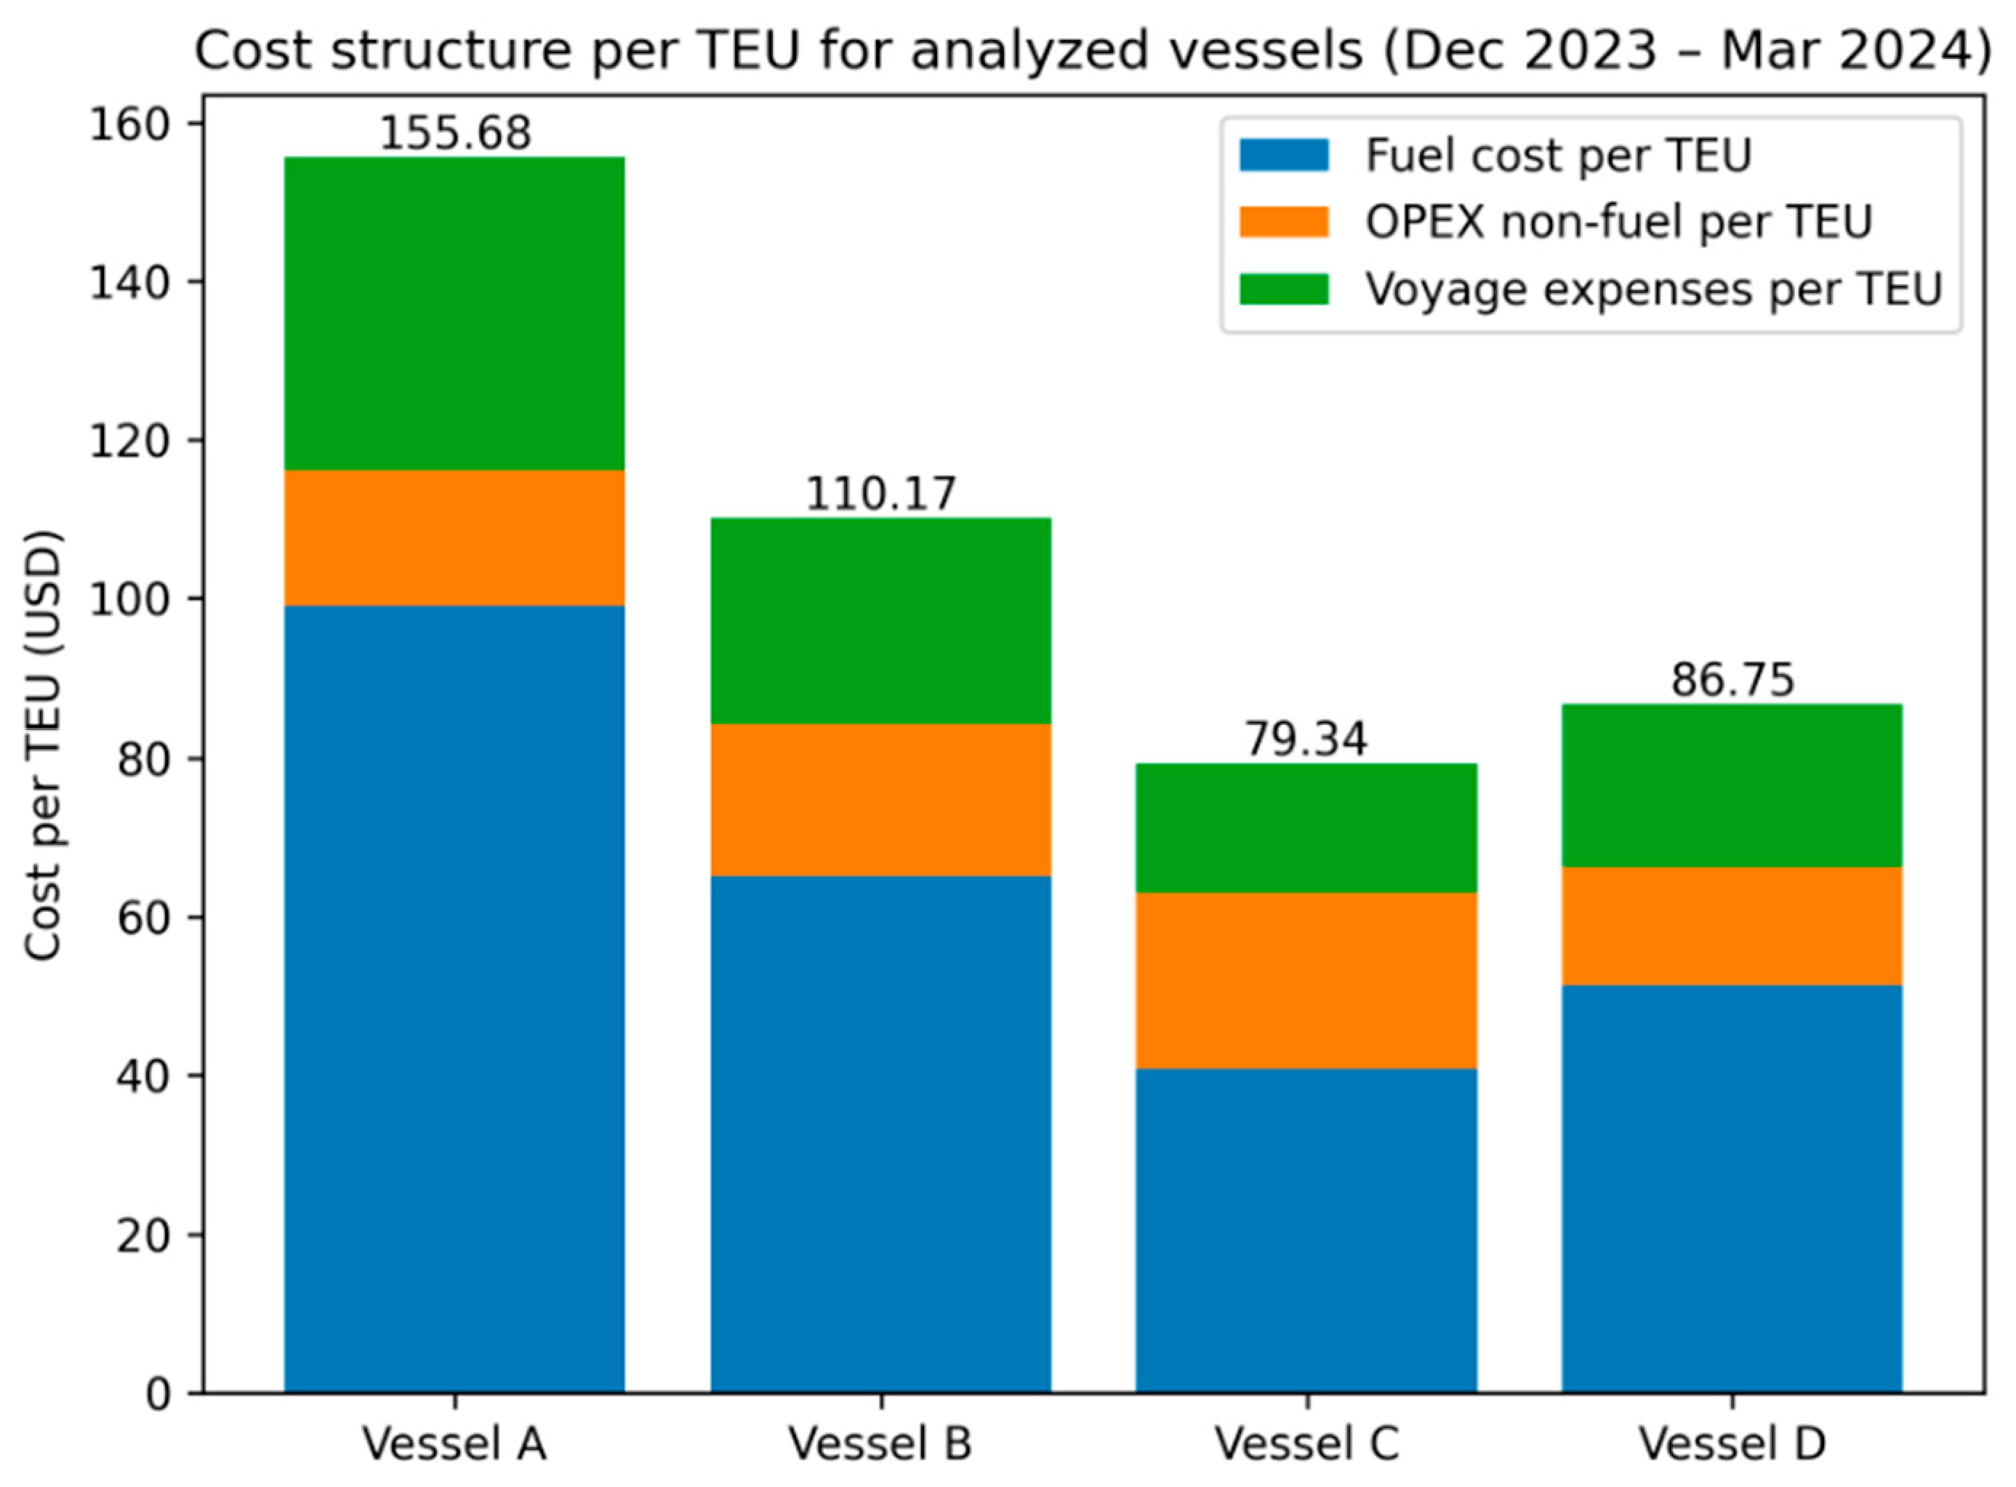
Sensitivity analysis (Section 5.8) confirms that even a ±20% variation in OPEX assumptions would not alter the main conclusions regarding vessel efficiency rankings, as fuel costs constitute the dominant share (50–65%) of total operating expenditures (see Figure 3).
where:
- [USD] is the transport cost per TEU;
- [USD] is the total voyage cost.
Figure 3.
Cost structure per transported TEU for the analysed vessels (Dec 2023–Mar 2024).
3.5.3. Vessel Stationary Time in Port (VST)
- [h] is the vessel stationary time in port;
- is the number of containers handled per port call;
- [TEU/h] is the crane productivity;
- [containers/h] is the crane handling rate;
- δ [−] is the operational delay factor.
The operational margin δ (0.10–0.30) accounts for non-productive time during port calls. A baseline value of δ = 0.20 is adopted in this study, representing typical conditions in semi-automated terminals. Detailed justification of this range, including references to [4,16], is provided in Appendix A.
Crane productivity expressed in moves per crane-hour represents a standard operational performance metric in container terminal analysis. International studies consistently report average crane productivity values for conventional terminals in the range of 20–30 moves per crane-hour, with a representative gross productivity of approximately 25 moves per crane-hour for non-automated and semi-automated terminals [28]. This formulation establishes a direct and transparent relationship between port productivity and vessel stationary time in port, which is a key determinant of logistics cycle time and auxiliary engine operating hours.
When vessel capacity is expressed in TEU, the number of handled containers is derived using an average conversion factor k, according to:
where:
- [−] is the number of handled containers;
- [−] is the number of containers expressed in TEU;
- k [TEU/container] is the TEU-to-container conversion factor.
A value of is adopted, corresponding to a representative container mix of approximately 60% 40-foot containers (2 TEU) and 40% 20-foot containers (1 TEU). This conversion factor is widely applied in port throughput analysis and logistics performance assessments, reflecting typical container size distributions observed in commercial liner shipping operations [4,29].
3.5.4. Logistics Cycle Time (LCT)
- [h] is the logistics cycle time;
- [h] is the sea passage time (as defined in Section 3.4.1);
- [h] is the vessel stationary time in port (as defined in Section 3.5.3).
3.5.5. Schedule Reliability Indicators
On-time arrival rate (OTAR):
where:
- [−] is the on-time arrival rate;
- [−] is the number of on-time voyages;
- [−] is the total number of voyages.
Additionally, fleet utilisation is evaluated through the fleet utilisation rate (FUR):
where:
- [%] is the fleet utilisation rate;
- [h] represents the vessel’s total operational time;
- [h] is the total available operating time.
These indicators quantify service quality and asset utilisation.
3.6. Energy Efficiency and Emissions Assessment
3.6.1. CO2 Emissions Calculation
CO2 emissions are calculated based on fuel-specific carbon emission factors, according to:
where:
- [tCO2] is total mass of CO2 emissions;
- and are the IMO-recommended carbon conversion factors for the fuels used by the main and auxiliary engines, respectively.
For conventional marine fuels, the conversion factors used are:
- HFO: CO2/t fuel;
- MDO/MGO: t CO2/t fuel.
The analysis adopts a tank-to-wake CO2 approach consistent with IMO operational indicators and current regulatory frameworks; CO2e metrics and well-to-wake boundaries are beyond the scope of the present study and are identified as directions for future research.
3.6.2. CO2 Energy Efficiency Operational Indicator (EEOI)
- [tCO2/(t·nm)] is the Energy Efficiency Operational Indicator;
- [t] is the fuel consumption of component i (as defined in Section 3.4);
- [−] is the fuel-specific carbon conversion factor;
- [t] is the transported cargo mass;
- [nm] is the voyage distance (as defined in Section 3.3).
3.6.3. Derived Normalised Indicators
Based on operational data, additional normalised indicators are computed:
- (A)
- Fuel consumption per TEU
- FC_TEU [kg/TEU] is the fuel consumption per transported TEU;
- [kg] is the total fuel consumption;
- [−] is the number of transported containers (in TEU);
- [tCO2/(t·nm)] is the Energy Efficiency Operational Indicator (as defined in Section 3.6.2).
- (B)
- CO2 emissions per TEU
- [kgCO2/TEU] is the CO2 emissions per transported TEU;
- [kgCO2] is the total CO2 emissions;
- [−] is the number of transported containers (in TEU).
- (C)
- Energy productivity
- [TEU·nm/t] is the energy productivity indicator;
- [−] is the number of transported containers;
- [nm] is the voyage distance;
- [t] is the total fuel consumption.
Auxiliary engine fuel consumption during both sea passages and port stays is explicitly included within the system boundary.
3.7. Methodological Applicability
The methodological framework is suitable for comparative analysis of vessels operating under similar conditions and can be extended to other ship types, operational profiles, or alternative fuel scenarios. All performance indicators can be recalculated using standard operational data available in typical vessel monitoring and reporting systems.
3.8. Model Validation and Data Consistency
To ensure the reliability and robustness of the calculated performance indicators, a structured validation procedure was incorporated into the methodological design. Given the nature of this study as a deterministic comparative vessel-level assessment based on operational data, validation was performed through three complementary steps.
First, the dataset was subjected to internal consistency checks. Data screening and quality control procedures are described in Section 3.2.
Second, normalisation procedures were verified to ensure comparability across vessels. Standardised assumptions regarding voyage distance, loading conditions, and port productivity were applied consistently across all vessels, allowing performance differences to be attributed to vessel-level characteristics rather than to route-specific or terminal-specific variability.
Third, the calculated performance indicators are benchmarked against empirical ranges reported in the literature for the medium-sized container vessel segment. Fuel consumption per TEU, the EEOI, the VCUR, and cost per TEU are compared against reference values documented in previous empirical and modelling studies [6,7,17]; adherence to these ranges is verified in the results (Section 5) and summarised in Section 6.7.
This multi-step validation approach ensures that the computed indicators provide a reliable and internally consistent basis for the subsequent sensitivity analysis (Section 5.8).
In addition, the sensitivity analysis is conducted within predefined operational variation ranges to ensure realism and consistency with typical vessel operations. The selected variation intervals (e.g., ±10% for service speed and loading rate, and ±20% for port-related parameters such as auxiliary engine load and port productivity) reflect plausible deviations observed in practice and are consistent with ranges commonly adopted in maritime energy efficiency and fuel consumption studies [30,31]. These bounded variations allow the model to capture realistic operational responses while avoiding extreme or non-representative conditions.
The limitations associated with the deterministic modelling approach and the selected parameter ranges are further discussed in Section 7.3.
3.9. Sensitivity Analysis Design
To assess the robustness of the proposed framework and to evaluate the influence of key operational uncertainties, a sensitivity analysis was incorporated into the methodology. Service speed (±10%), port productivity (±20%), and vessel loading rate (±10%) were varied individually following a ceteris paribus approach.
The sensitivity analysis was implemented by explicitly varying the selected operational parameters around their baseline values, according to:
where:
- [kn] is the baseline service speed;
- [kn] is the adjusted vessel service speed;
- [TEU/h] is the baseline port productivity;
- [TEU/h] is the adjusted port productivity;
- is the baseline transported container volume;
- is the adjusted transported container volume.
Each parameter was varied individually while all others were kept constant (ceteris paribus), and all dependent logistics and energy indicators were recalculated accordingly.
The resulting effects on logistics performance indicators and energy efficiency metrics are subsequently evaluated.
To quantify the relative importance of each input parameter on key output indicators, normalised sensitivity index (SI) was computed for each parameter–output pair, according to:
where:
- [–] is the normalised sensitivity index (dimensionless);
- [–] represents the change in the Energy Efficiency Operational Indicator relative to the baseline value;
- [tCO2/(t·nm)] is the baseline value of the Energy Efficiency Operational Indicator;
- [–] represents the variation of the input parameter relative to its baseline value;
- is the baseline value of the analysed input parameter (e.g., service speed [kn], port productivity [TEU/h], or transported volume [TEU]).
This formulation enables direct comparison of parameter influence across different ranges and units, providing a consistent basis for variable importance ranking. Sensitivity analysis is widely used to evaluate how variations in model inputs influence output variability and to identify dominant parameters affecting system performance [32].
Although probabilistic approaches such as Monte Carlo simulation would provide a more complete characterisation of output uncertainty—particularly by capturing parameter interactions and non-linear propagation effects—they require the definition of probability distributions for each input variable and sufficient datasets for statistical calibration [33]. In the present study, the dataset of four vessels does not provide a sufficient statistical basis for deriving such distributions from observed operational data.
Accordingly, the deterministic one-factor-at-a-time (OAT) approach, complemented by normalised sensitivity indices and a combined parameter scenario (Section 5.8.4), is adopted as a methodologically appropriate choice for the present study. The application of Monte Carlo-based uncertainty propagation to larger operational datasets represents a natural extension of the proposed framework and is identified as a direction for future research.
4. Case Study Description
4.1. Selection of the Reference Vessels
The case study focuses on four medium-sized container vessels selected to ensure internal comparability while capturing relevant variations in technological generation, propulsion characteristics, and operational profile within the target capacity segment. The vessels belong to the 6000–7500 TEU range, which remains highly relevant in global container shipping, particularly on routes constrained by port infrastructure, canal dimensions, or regional trade patterns [2].
Medium-sized container vessels in this segment combine relatively high transport capacity with operational flexibility. They typically have lengths of approximately 280–300 m, beam widths of 40–45 m, and design drafts of around 13–15 m, allowing access to a wide range of ports with moderate infrastructure constraints. From an operational perspective, they are commonly deployed on regional and intercontinental liner services, where they balance economies of scale with route flexibility and port accessibility. As highlighted in global maritime transport analyses, this vessel category continues to play a key role in maintaining connectivity across ports that cannot accommodate ultra-large container ships, thereby supporting resilient and adaptable container shipping networks [10].
The selection of these vessels was based on three criteria. First, data availability: the vessels were drawn from an anonymised dataset provided by a commercial operator, including complete and consistent records of fuel consumption, cargo load, port stay, and voyage duration for the reference period (December 2023–March 2024). Second, technological heterogeneity: the sample includes three vessels built between 2000 and 2002 (pre-EEDI) and one vessel built in 2012, allowing the assessment of differences between distinct design and regulatory generations. Third, propulsion system diversity: the vessels are equipped with engines from different manufacturers (B&W, Sulzer, MAN-B&W), representative of slow-speed diesel technologies used in this segment.
From a representativeness perspective, the selected vessels reflect the main structural characteristics of the 6000–7500 TEU segment. Their principal dimensions (LOA, beam, and draught) fall within the typical ranges reported in maritime fleet studies [34,35], while their capacity distribution covers both lower and upper bounds of the segment [10]. Although Vessel A (5762 TEU) is slightly below the nominal lower bound, its technical and operational profile is consistent with medium-size container vessels and enables inclusion of the pre-EEDI generation.
While the sample size does not allow statistical generalisation, it is appropriate for vessel-level benchmarking, where controlled heterogeneity supports meaningful comparative analysis without introducing excessive variability [3,13].
4.2. Description of the Reference Vessels
All ship-related data used in this study were anonymised and processed exclusively for academic research purposes. The analysis does not disclose commercially sensitive information, and no operational decisions or proprietary datasets can be identified from the results presented.
Table 2 summarises the main construction characteristics of the analysed vessels, while Table 3 presents their propulsion system characteristics.
Table 2.
The reference main construction characteristics.
Table 3.
The reference propulsion system characteristics.
The vessels were selected to represent different technological generations within the container fleet, enabling the assessment of how design and regulatory evolution influence operational and environmental performance. While Vessel D (2012) reflects a more recent generation developed under stricter IMO energy efficiency requirements (e.g., EEDI), the early-2000s vessels were not originally designed to meet such standards, requiring additional operational measures to comply with current regulations (EEXI, CII).
From an operational perspective, the vessels are characterised by: (i) a conventional hull form optimised for container transport; (ii) a fixed-pitch propeller configuration; and (iii) a main propulsion system designed for relatively high service speeds. These characteristics make the analysed vessels suitable reference cases for comparative assessments against newer container ships equipped with improved propulsion efficiency and optimised operational profiles, as highlighted in recent maritime transport studies [6].
4.3. Operational Profile and Voyage Characteristics
The operational data correspond to the reference period December 2023–March 2024. During this period, the analysed vessels performed between 7 and 11 commercial voyages each, as reported in Table 4 and Table 5. For details on data collection, normalisation assumptions, and system boundaries, see Section 3.2 and Section 4.4.
Table 4.
Vessel capacity utilisation rate.
Table 5.
Estimated total operating costs.
4.4. Logistics System Boundaries and Dynamic Interaction with the Energy Model
The logistics system considered in this study is defined at the vessel level and encompasses three operational phases: sea transport operations, port stay associated with loading and unloading activities, and fuel consumption attributable to both main propulsion during sea passages and auxiliary engine operation during both sea passages and port stays. Auxiliary logistics activities, such as hinterland transport and terminal yard operations, are not explicitly modelled, as the primary objective of the study is to assess vessel-related logistics and energy performance. This system boundary definition is consistent with previous vessel-centric logistics performance assessments [12].
Within this boundary, logistics and energy sub-systems are not independent; logistics indicators serve as direct inputs to the energy consumption model, creating a dynamic feed-forward structure that links operational decisions to energy and emissions outcomes. Figure 1 illustrates this interaction; the present section makes the underlying variable propagation explicit.
Specifically, the dynamic coupling between the logistics and energy domains operates through three principal pathways:
Pathway 1—Port productivity → VST → auxiliary fuel consumption and the EEOI. Terminal crane productivity (, ) and the operational margin (δ) determine the vessel stationary time in port (VST, Equation (7)). The VST directly controls the operating duration of auxiliary engines during port stay, entering Equation (4) through . Consequently, any change in port productivity propagates into auxiliary fuel consumption (), total CO2 emissions (Equation (11)), and ultimately the EEOI (Equation (12)). This pathway is quantified in the sensitivity analysis of Section 5.8.2.
Pathway 2—Service speed → → main engine fuel consumption, LCT, and the EEOI. Vessel service speed (V) determines sea transport time (, Equation (1)), which simultaneously enters the main engine fuel consumption model (Equation (2)) and the logistics cycle time formulation (, Equation (8)). A reduction in service speed therefore extends , increases main engine operating hours, but—given the cubic speed–power relationship—reduces fuel consumption per voyage in net terms. This non-linear propagation is examined in Section 5.8.1.
Pathway 3—Loading rate (VCUR) → → normalised energy indicators. The vessel capacity utilisation rate (VCUR, Equation (5)) determines the number of transported TEU, which enters the denominators of fuel consumption per TEU (Equation (13)), CO2 per TEU (Equation (14)), energy productivity (Equation (15)), and the EEOI (Equation (12)) as cargo mass. Variations in loading rate therefore affect all normalised sustainability indicators without altering absolute fuel consumption, as examined in Section 5.8.3.
The adopted system boundaries thus enable a focused yet dynamic evaluation of logistics–energy interactions, with logistics indicators acting as primary operational drivers of vessel-level energy consumption and emissions.
5. Results and Analysis
The results section presents the empirical evaluation of the integrated vessel-level framework introduced in Section 3.
5.1. Vessel Capacity Utilisation
All vessels operate at high-capacity utilisation levels (89–93%), with Vessel C and Vessel D showing similar values of 89.2% and 90.9%, respectively.
5.2. Cost Efficiency: Cost per TEU
Cost per transported container is reported in Table 5 and illustrated in Figure 3. Costs are estimated using industry benchmarks for daily OPEX and representative bunker price averages. Voyage expenses are approximated as a percentage of fuel costs due to the absence of disaggregated port and canal data. The results are intended for indicative benchmarking rather than accounting-grade reporting.
Figure 3 shows the estimated cost structure per transported TEU for the analysed vessels, with non-fuel operating expenses adjusted for vessel age as detailed in Appendix B. Vessel A records the highest unit cost (155.68 USD/TEU), while Vessel C exhibits the lowest value (79.34 USD/TEU). Vessel B and Vessel D present intermediate costs of 110.17 USD/TEU and 86.75 USD/TEU, respectively. The stacked bars indicate that fuel expenditures represent the dominant component of total operating costs (approximately 50–65%), followed by voyage-related expenses, confirming that even with age-adjusted OPEX, the relative ranking of vessels remains unchanged.
5.3. Port Time and Logistics Cycle Time
Vessel stationary time in port values are presented in Table 6. The analysis assumes three quay cranes per vessel, an average productivity of 25 container moves per hour per crane, and 20 effective working hours per day, corresponding to an average handling capacity of approximately 1500 containers per day.
Table 6.
Vessel stationary time in port.
Logistics cycle time values are presented in Table 7 and illustrated in Figure 4, reflecting the combined effects of sea passage time and vessel stationary time in port.
Table 7.
Logistics cycle time.
Figure 4.
Logistics cycle time for analysed vessels.
5.4. Fuel Consumption per TEU
Fuel consumption results for the standardised voyage are presented in Table 8, reflecting both main and auxiliary engine operation.
Table 8.
Total fuel consumption per voyage.
Fuel consumption per transported unit results are summarised in Table 9 and illustrated in Figure 5.
Table 9.
Detailed Fuel Consumption per TEU for Each Vessel.
Figure 5.
Bar chart of fuel consumption per TEU for each vessel.
Fuel consumption per TEU varies significantly across vessels, reflecting differences in design and operational efficiency. Vessel C demonstrates the lowest fuel consumption intensity (60.95 kg/TEU), indicating the most energy-efficient operation, while Vessel A records the highest value (135.45 kg/TEU). These differences highlight the significant influence of vessel design characteristics, propulsion efficiency, and cargo utilisation on fuel efficiency. Even within a relatively narrow vessel size range, operational and technological factors produce substantial variations in energy performance.
5.5. Schedule Reliability and Fleet Utilisation
Schedule reliability (on-time arrival rate) for the analysed vessels is presented in Table 10.
Table 10.
On-time arrival rate.
Fleet utilisation rate values for the analysed vessels are summarised in Table 11.
Table 11.
Fleet utilisation rate (%).
5.6. Energy Efficiency Operational Indicator (EEOI)
Energy Efficiency Operational Indicator (EEOI) values are presented in Table 12.
Table 12.
EEOI values.
EEOI values are reported in tCO2/(t·nm), in accordance with the IMO formulation. When expressed in commonly used units (gCO2/TEU·nm), the values fall within the benchmark ranges reported in [6].
Figure 6 illustrates the comparative emissions intensity of the analysed vessels.
Figure 6.
Bar chart of Energy Efficiency Operational Indicator (EEOI) for each vessel.
The results indicate noticeable differences in carbon emission intensity among the analysed vessels. Vessel A exhibits the highest EEOI value (3.77 × 10⁻⁵ tCO2/(t·nm)), suggesting lower transport efficiency, whereas Vessel C achieves the lowest emission intensity (1.59 × 10⁻⁵ tCO2/(t·nm)), followed closely by Vessel D (1.62 × 10⁻⁵ tCO2/(t·nm)). Vessel B shows intermediate performance (2.54 × 10⁻⁵ tCO2/(t·nm)). These findings emphasise the strong relationship between fuel consumption, operational efficiency, and emission intensity, underlining the importance of energy-efficient vessel operation in achieving maritime decarbonisation objectives.
5.7. Integrated Analysis of Logistics and Energy Performance Indicators
While Section 5.1, Section 5.2, Section 5.3, Section 5.4, Section 5.5 and Section 5.6 present individual performance indicators, their combined interpretation provides additional insight into the intrinsic relationships between logistics efficiency and energy performance at the vessel level.
The results indicate a strong interdependence between vessel capacity utilisation (VCUR), cost efficiency, fuel consumption, and emissions intensity (EEOI). For example, Vessel B achieves the highest utilisation rate (93.4%) and a relatively moderate cost per TEU (110.17 USD/TEU), compared to Vessel A, which operates at a lower utilisation level (89.1%) and records the highest cost (155.68 USD/TEU). This confirms that higher capacity utilisation contributes to reducing unit transport costs.
A similar pattern is observed when comparing cost and energy performance. Despite operating within a similar size range, Vessel C combines a high utilisation rate (89.2%) with the lowest cost per TEU (79.34 USD/TEU) and the lowest fuel consumption intensity (60.95 kg/TEU). In contrast, Vessel A records both the highest fuel consumption per TEU (135.45 kg/TEU) and the highest EEOI value (3.77 × 10⁻⁵ tCO2/(t·nm)), indicating significantly lower operational efficiency.
The relationship between fuel consumption and emissions is also clearly reflected in the results. Vessel C, with the lowest fuel consumption per TEU, achieves the lowest EEOI value (1.59 × 10⁻⁵ tCO2/(t·nm)), while Vessel D, despite a higher absolute auxiliary fuel consumption, maintains a relatively low EEOI (1.62 × 10⁻⁵ tCO2/(t·nm)) due to higher cargo capacity (7410 TEU). This highlights the importance of both fuel efficiency and cargo utilisation in determining emissions intensity.
Overall, the results confirm that logistics performance indicators and energy efficiency metrics are intrinsically linked. Improvements in capacity utilisation and operational efficiency simultaneously reduce cost per TEU, fuel consumption per TEU, and emissions intensity. These findings demonstrate the systemic nature of logistics–energy interactions and highlight the importance of integrated performance assessment at the vessel level.
5.8. Sensitivity Analysis Results
Sensitivity analysis was performed using a one-factor-at-a-time approach, varying one operational parameter while keeping all others constant.
5.8.1. Sensitivity to Vessel Speed
Service speed directly affects sea transport time, main engine fuel consumption, and consequently, CO2 emissions and the EEOI.
Given that:
- Sea transport time is inversely proportional to speed.
- Main engine fuel consumption is approximately proportional to delivered power and operating time.
- A ±10% variation in vessel speed produces non-linear impacts on energy efficiency indicators (see Table 13).
Table 13.
Sensitivity to vessel speed variation.
For each speed variation, sea transport time and main engine fuel consumption were adjusted according to the revised operating conditions, while auxiliary engine consumption remained proportional to voyage duration.
Table 14 illustrates the quantitative propagation of speed variation into logistics and environmental performance indicators for a representative vessel.
Table 14.
Example of quantitative sensitivity results for Vessel D.
Sea transport time was recalculated assuming a constant reference distance of 1000 nautical miles and proportional variation with service speed. Main engine fuel consumption was assumed to scale with the square of vessel speed, while auxiliary engine consumption during sea passages was assumed to scale with voyage duration. Auxiliary engine consumption during port stays was kept constant. Fuel per TEU and the EEOI were recomputed accordingly, while transported cargo mass and reference distance were maintained constant.
Figure 7 shows the strong sensitivity of the EEOI and logistics cycle time to vessel speed, highlighting the non-linear trade-off between environmental efficiency and service performance.
Figure 7.
Sensitivity of environmental and logistics performance to vessel speed variation.
5.8.2. Sensitivity to Port Productivity (±20%)
Port productivity directly affects vessel stationary time in port, auxiliary engine operating hours, and total logistics cycle time.
The analysis considered variations in crane productivity and terminal handling capacity of ±20%, consistent with differences observed between conventional and semi-automated terminals. The analysis results are presented in Table 15.
Table 15.
Sensitivity to port productivity variation.
For each productivity scenario, vessel stationary time in port and auxiliary engine fuel consumption during port stay were adjusted according to the revised operating conditions, while sea passage fuel consumption remained unchanged.
Figure 8 shows that variations in port productivity significantly affect both logistics cycle time and vessel-level emissions intensity, underlining the systemic role of terminal performance.
Figure 8.
Sensitivity of vessel-level performance to port productivity variation.
5.8.3. Sensitivity to Vessel Loading Rate (±10%)
The loading rate influences the normalisation of performance indicators rather than absolute fuel consumption. Variations in utilisation were introduced by modifying the transported TEU by ±10%, while keeping voyage fuel consumption constant.
Under this assumption, fuel consumption and CO2 emissions per TEU vary inversely with transported volume, while the EEOI reflects changes in cargo mass (Table 16).
Table 16.
Sensitivity to vessel loading rate variation.
Figure 9 confirms that even moderate variations in vessel loading rate substantially influence normalised sustainability indicators. The curves for fuel consumption per TEU and CO2 emissions per TEU coincide. This behaviour is expected, as CO2 emissions are directly proportional to fuel consumption through fixed fuel-specific carbon conversion factors (Equation (11)). Consequently, both indicators scale identically with variations in transported TEU, differing only by a constant proportionality factor.
Figure 9.
Sensitivity of normalised sustainability indicators to vessel loading rate.
5.8.4. Combined Sensitivity of Auxiliary Engine Load Factors and Port Productivity: Implications for the EEOI and EU ETS
While Section 5.8.1, Section 5.8.2 and Section 5.8.3 analyse the sensitivity of vessel performance to individual operational parameters, this subsection provides an integrated assessment of port-related operational levers, namely auxiliary engine load factors during port stay and terminal productivity, which are directly relevant for emissions occurring at berth and therefore for regulatory exposure under the EU Emissions Trading System (EU ETS) [36].
Auxiliary engine fuel consumption during port stay is proportional to both the auxiliary engine load factor () and the vessel stationary time in port (), as expressed in Equations (3), (4) and (7). Consequently, variations in and port productivity propagate directly into total fuel consumption, CO2 emissions, and the Energy Efficiency Operational Indicator (EEOI), while leaving transported cargo mass and voyage distance unchanged.
To illustrate the magnitude of these effects, a synthetic sensitivity analysis was performed for two representative vessels (Vessel B and Vessel D). Vessels B and D were selected as representative cases due to their contrasting auxiliary emission shares and port stay durations, allowing a clearer illustration of port-related sensitivity effects (Table 7 and Table 11).
The results demonstrate that port-related operational parameters exert a measurable influence on vessel-level environmental performance, particularly for vessels with a higher share of auxiliary engine emissions during port stays. For Vessel D, which exhibits longer port times and higher auxiliary emissions, improvements in port productivity or reductions in auxiliary load factors lead to EEOI reductions exceeding 4–5%, comparable in magnitude to moderate speed management measures (Table 17).
Table 17.
Synthetic sensitivity of port-related parameters and impact on the EEOI.
5.8.5. Normalised Sensitivity Indices and Variable Importance Ranking
To provide a synthetic assessment of the relative importance of the analysed operational parameters, normalised sensitivity index (SI) was computed for each parameter with respect to the Energy Efficiency Operational Indicator (EEOI), using the quantitative results derived in Section 5.8.1, Section 5.8.2, Section 5.8.3 and Section 5.8.4. The SI expresses the percentage change in the EEOI per unit percentage change in the input parameter, enabling direct comparison across variables varied at different scales.
The results, summarised in Table 18, indicate a clear hierarchy of parameter influence on vessel-level environmental performance.
Table 18.
Normalised sensitivity indices for EEOI—Vessel D (representative case).
Service speed emerges as the dominant operational driver, due to its non-linear influence on propulsion energy demand. Vessel loading rate also exhibits a strong effect on normalised indicators such as the EEOI, although this influence arises primarily from the normalisation of emissions by transported cargo mass rather than from changes in absolute fuel consumption.
Port-related parameters—auxiliary engine load factor and terminal productivity—exert a comparatively lower yet still measurable influence (SI ≈ 0.22–0.27), consistent with their indirect effect on the EEOI through auxiliary fuel consumption during port stays.
This ranking is consistent with the deterministic results presented in Section 5.8.1, Section 5.8.2 and Section 5.8.3 and provides a structured basis for prioritising operational interventions. A probabilistic sensitivity analysis using Monte Carlo simulation would capture parameter interaction effects and the full distribution of output uncertainty. However, the normalised SI approach applied here provides a transparent and tractable variable importance ranking directly derived from the analytical model. It does so without requiring empirically estimated input distributions, which are not available for the present four-vessel dataset.
5.8.6. Implications for EU ETS, FuelEU Maritime, and IMO CII Compliance
Under the EU ETS for maritime transport, CO2 emissions occurring during port stays and intra-EU voyages are fully subject to allowance surrender requirements. Because the EEOI is directly proportional to total CO2 emissions for a given transported cargo mass and distance (Equation (12)), reductions in auxiliary engine emissions achieved through improved port productivity or optimised onboard energy management translate directly into lower EU ETS compliance costs.
From an economic perspective, EU ETS exposure is directly linked to carbon pricing levels. Recent market data indicate that EU ETS carbon prices have typically ranged between 80 and 100 EUR/tCO2 in recent years [37].
The EU ETS cost per transported unit can be approximated as a function of CO2 emissions per TEU and the carbon price, where CO2 emissions per TEU are calculated according to Equation (14), and the carbon price reflects prevailing EU ETS market conditions. This formulation provides a direct link between vessel-level emissions and regulatory compliance costs, offering a first-order estimation of regulatory cost exposure at the vessel level.
To provide a quantitative illustration of regulatory cost exposure, Table 19 presents the estimated EU ETS cost per transported TEU for each vessel, based on the calculated CO2 emissions per TEU (Equation (14)) and representative carbon price levels.
Table 19.
Estimated EU ETS cost per transported TEU based on vessel-level CO2 emissions and representative carbon prices.
The results show that EU ETS costs per transported unit vary significantly across vessels, ranging from approximately 15 EUR/TEU (Vessel C) to over 40 EUR/TEU (Vessel A) under representative carbon price levels, confirming the strong economic relevance of vessel-level operational efficiency under carbon pricing mechanisms.
Under such conditions, a 2–5% reduction in vessel-level emissions—such as those identified in Section 5.8.4 for port-related operational improvements—would result in proportional reductions in compliance costs.
These results indicate that port efficiency improvements and auxiliary energy management represent key mitigation levers, simultaneously reducing logistics cycle time, the EEOI, and regulatory costs. This highlights the importance of coordinated ship–port operational strategies in the context of EU ETS implementation, particularly for container vessels operating under frequent port-call patterns.
In addition to the EU ETS, the results have direct implications for compliance with the FuelEU Maritime Regulation, which targets the greenhouse gas intensity of energy used on board. Unlike the EU ETS, which is based on absolute CO2 emissions, FuelEU Maritime introduces financial penalties when the energy used does not meet progressively stricter GHG intensity limits [38]. While the analysis captures these effects at a conceptual level, a detailed quantitative modelling of FuelEU penalty functions is beyond the scope of the present study.
In this context, auxiliary engine operation during port stays plays a critical role, as prolonged port times and increased onboard energy demand lead to higher overall energy intensity. Consequently, operational measures such as improved port productivity, reduced hotelling time, and optimised auxiliary engine loads not only contribute to lower emissions, but also to improved FuelEU compliance and reduced exposure to penalties.
These findings indicate that port-related operational efficiency represents a key mitigation lever under both the EU ETS and FuelEU Maritime frameworks.
Furthermore, the results are directly relevant to the IMO Carbon Intensity Indicator (CII), a key operational metric for assessing vessel efficiency [39]. As the CII is based on CO2 emissions normalised by transport work, improvements in operational parameters such as vessel speed, loading rate, and port turnaround time—identified in this study—contribute directly to improved CII ratings. In particular, optimised voyage profiles and improved operational efficiency help achieve lower carbon intensity.
Overall, the sensitivity analysis indicates that vessel speed represents the dominant operational driver affecting both environmental and logistics performance, with direct implications for regulatory compliance under EU ETS, FuelEU Maritime, and IMO CII frameworks. This highlights the central role of speed management strategies, such as slow steaming, as an effective operational lever for improving both energy efficiency and emissions performance in container shipping.
6. Discussion
The sensitivity analysis supports the research hypothesis, indicating that port stay duration and auxiliary engine operation significantly influence the vessel-level EEOI. Vessels with longer port stays exhibit higher auxiliary engine fuel consumption, leading to increased emissions intensity. These results demonstrate that port-related operational parameters can influence the EEOI to a degree comparable to moderate vessel speed variations under similar operating conditions.
Overall, the findings highlight the critical role of port-related operational factors in shaping the environmental performance of container ships. While previous studies have primarily emphasised speed optimisation as a key mechanism for reducing fuel consumption [14], the present analysis shows that port operations and auxiliary engine use represent equally important drivers of emissions intensity.
6.1. Capacity Utilisation and Operational Efficiency
The results show that high vessel capacity utilisation is a key determinant of operational efficiency in container shipping. This finding is consistent with maritime logistics studies, which identify capacity utilisation as a critical driver of cost efficiency and network performance [6]. From an operational perspective, maintaining high utilisation levels supports improved economic performance and enhances the overall competitiveness of shipping services.
6.2. Cost per TEU and Economies of Scale
The cost-per-TEU analysis indicates a systematic decreasing trend with increasing vessel size, confirming the persistence of economies of scale in container shipping.
The lower cost per TEU observed for newer and larger vessels—even after adjusting for age-related OPEX differences (see Appendix B)—is also consistent with studies indicating that technological advancements and improved propulsion efficiency contribute to lifecycle cost reductions. The findings support the role of vessel-level performance assessment in informing fleet renewal and deployment strategies.
6.3. Port Time, Logistics Cycle Time, and Service Performance
The relationship between port time and logistics cycle performance highlights the importance of terminal productivity in shaping vessel turnaround efficiency. Although larger vessels are associated with longer port stays, overall logistics cycle performance depends on the interaction between vessel characteristics and port efficiency. These findings are consistent with empirical studies emphasising the role of terminal productivity in determining vessel turnaround time and service performance [3,12,13].
6.4. Fuel Consumption per TEU and Energy Efficiency
The observed improvements in normalised fuel consumption reflect the combined effects of economies of scale, enhanced propulsion efficiency, and improved hydrodynamic performance in newer vessels. These findings are consistent with empirical evidence reported in [7,21], which demonstrates that larger vessels achieve superior energy efficiency despite higher absolute fuel consumption. This confirms the relevance of normalised energy performance indicators for vessel benchmarking and operational decision-making.
6.5. The EEOI and Environmental Performance Benchmarking
The EEOI results confirm its sensitivity to key operational parameters, including vessel speed, loading rate, and port-related factors. Consistent with previous studies [6,17], the EEOI effectively differentiates vessels according to technological and operational performance, supporting its use as a robust indicator for environmental benchmarking. These findings reinforce the importance of integrating operational and logistical parameters when evaluating emissions intensity.
6.6. Implications for EU ETS and FuelEU Maritime Compliance
The results of the integrated vessel-level assessment have direct relevance for emerging European regulatory frameworks, particularly the EU Emissions Trading System (EU ETS) and the FuelEU Maritime Regulation, both of which shift the focus from purely technical ship characteristics toward operational emissions and energy use under real operating conditions [38,40].
Within the EU ETS framework, shipping companies are required to monitor, report, and surrender allowances for verified CO2 emissions generated during both sea passages and port stays. Under prevailing carbon price levels, these emissions translate into measurable regulatory costs at the vessel level. As demonstrated in Section 5.6, Section 5.7 and Section 5.8, vessel-level emissions and EEOI values are not determined solely by main engine performance, but are significantly influenced by auxiliary engine operation during port stays, which is directly linked to vessel stationary time and terminal productivity. This finding is consistent with previous studies highlighting the contribution of hotelling and cargo-handling activities to total vessel emissions [2,41,42].
The sensitivity analysis further shows that operational improvements at the ship–port interface—such as enhanced port productivity and optimised auxiliary engine management—can lead to measurable reductions in emissions and emissions intensity, with corresponding reductions in regulatory cost exposure, as quantified in Section 5.8.6 [19,42]. As discussed in Section 5.8.4, these effects are particularly relevant for vessels with longer port stays and higher auxiliary energy demand, and can be comparable in magnitude to moderate speed optimisation measures. For example, the sensitivity analysis (Section 5.8.4) indicates that reductions in auxiliary engine load or improvements in port productivity lead to CO2 and EEOI reductions of approximately 2–3% for vessels with moderate auxiliary energy demand, and over 4–5% for vessels with longer port stays.
From a regulatory perspective, these results indicate that even moderate operational improvements can translate into measurable reductions in regulatory cost per transported unit, with significant variations in cost exposure observed across vessels [19,42].
FuelEU Maritime further reinforces the importance of an integrated operational perspective. Unlike the EU ETS, which targets absolute CO2 emissions, FuelEU Maritime regulates the greenhouse gas intensity of onboard energy use, including energy consumed during port stays. Consequently, prolonged port times and inefficient auxiliary energy use increase overall energy intensity, negatively affecting compliance margins [38]. This may also increase exposure to regulatory penalties under FuelEU Maritime. These effects are consistent with the operational patterns identified in the sensitivity analysis (Section 5.8).
The results suggest that vessels with higher auxiliary energy demand and longer port stays are structurally more exposed to regulatory constraints, even when main engine efficiency is relatively high. Therefore, operational measures such as improved port productivity, onboard energy management, and shore power integration emerge as key components of compliance strategies, complementing traditional approaches based on speed management and fuel switching [36].
Overall, the findings demonstrate that compliance with EU ETS and FuelEU Maritime cannot rely solely on vessel design or propulsion efficiency, but requires coordinated ship–port operational strategies. In this context, integrating speed management, port performance, and auxiliary energy optimisation within unified monitoring frameworks represents a key approach for simultaneously improving logistics efficiency, reducing regulatory costs, and enhancing compliance with EU ETS and FuelEU Maritime requirements.
6.7. Comparison with Existing Benchmarks
The results obtained in this study align well with benchmark ranges reported in recent maritime logistics and energy efficiency literature. The VCUR values (89.1–93.4%) fall within the optimal utilisation range of 85–95% reported in [2]. Similarly, fuel consumption per TEU (60.95–135.45 kg/TEU) is consistent with the range of 50–150 kg/TEU identified for medium-size container vessels, depending on vessel age and operating speed [6].
The calculated EEOI values (1.59 × 10⁻⁵ to 3.77 × 10⁻⁵ tCO2/(t·nm)) are comparable to those reported by [6] for similar vessel classes (1.4 × 10⁻⁵ to 4.0 × 10⁻⁵ tCO2/(t·nm)). In addition, the adjusted cost per TEU values (79.34–155.68 USD/TEU), accounting for vessel age as detailed in Appendix B, fall within the range reported by Sigalas (2022) [6] for operating costs in this segment.
Overall, this consistency with established benchmarks supports the validity of the applied methodology and the representativeness of the case study results. The vessel-level resolution of the analysis further provides additional granularity compared to fleet-level benchmarks, strengthening the applicability of the proposed framework for operational decision support.
7. Conclusions
This study presents and empirically applies an integrated vessel-level framework for jointly assessing logistics performance and operational energy efficiency in container shipping. By combining logistics indicators with fuel consumption and emissions metrics within a unified system boundary, the proposed approach captures the interdependence between operational efficiency and environmental performance under real operating conditions. The results confirm that vessel-level performance is shaped by multiple interacting operational parameters, including speed, port operations, and capacity utilisation. From a regulatory perspective, the findings highlight the importance of operational measures at the ship–port interface for supporting compliance with emerging frameworks such as EU ETS and FuelEU Maritime, complementing traditional strategies focused on propulsion efficiency and fuel choice.
The findings demonstrate that logistics and energy performance at the vessel level are intrinsically interconnected through a set of operational parameters that simultaneously influence cost efficiency, fuel consumption, and emissions intensity. In this context, port-related parameters—such as vessel stationary time and auxiliary engine operation—emerge as critical secondary drivers of environmental performance, directly affecting both total CO2 emissions and emissions intensity.
While service speed remains the dominant factor influencing propulsion-related energy demand, the analysis highlights that improvements in port productivity and auxiliary energy management can generate measurable environmental benefits. This underscores the importance of extending performance optimisation beyond traditional propulsion-focused strategies toward integrated ship–port operational management.
Overall, the results show that effective decarbonisation in container shipping requires coordinated optimisation of both navigation and port operations, particularly for vessels operating under frequent port-call patterns.
7.1. Theoretical Contributions
This study contributes to the literature on sustainable maritime logistics by:
- Developing an integrated vessel-level benchmarking framework that explicitly links logistics performance indicators with IMO-based energy efficiency metrics.
- Providing empirical evidence for medium-sized container ships, a segment that remains underrepresented compared to ultra-large container vessels.
- Demonstrating, through sensitivity analysis, how operational decisions propagate simultaneously into logistics efficiency and emissions intensity.
By operationalising logistics–energy interactions at the vessel level, the framework advances a more holistic understanding of performance trade-offs in container shipping.
7.2. Managerial and Practical Implications
The results of this study provide a set of actionable recommendations for shipping companies, port operators, and fleet managers aimed at improving both logistics performance and environmental efficiency.
Shipping companies should prioritise integrated operational management by combining speed optimisation with port performance monitoring and auxiliary energy control. In particular, the implementation of real-time performance monitoring systems, integrated with EU MRV reporting platforms and onboard energy management tools, can support continuous optimisation of fuel consumption and emissions. The development of digital shipping corridors [43] represents a promising avenue for modernising maritime logistics operations through integrated data platforms and smart port technologies.
Port authorities and terminal operators should focus on increasing crane productivity and reducing vessel turnaround time as key levers for improving both logistics efficiency and emissions performance. Achieving and maintaining crane productivity levels above industry benchmark values (e.g., 30 moves per crane-hour) can significantly reduce port stay duration and associated auxiliary energy demand.
Fleet managers should incorporate auxiliary engine performance into routine monitoring and optimisation practices, including load management during port stays and the adoption of shore power solutions where available. In addition, vessel deployment strategies should consider port efficiency conditions alongside traditional factors such as route structure and vessel size.
Overall, the findings support the adoption of coordinated ship–port operational strategies, in which logistics performance, energy efficiency, and regulatory compliance are managed within a unified decision-making framework.
7.3. Limitations and Future Research
The present study has several limitations that should be considered when interpreting the results. The analysis is based on a limited sample of four vessels, which constrains the statistical generalisability of the findings, although the selected cases are representative of the medium-size container segment. In addition, the emissions assessment adopts a tank-to-wake system boundary, focusing exclusively on onboard fuel combustion and excluding upstream (well-to-wake) emissions.
Furthermore, the sensitivity analysis is based on a deterministic one-factor-at-a-time approach, which enables the identification of dominant operational drivers but does not capture parameter interactions or uncertainty propagation.
Future research should address these limitations by extending the framework to larger operational datasets and incorporating probabilistic methods, such as Monte Carlo simulations and global sensitivity analysis. Further developments may include the integration of well-to-wake emissions and CO2-equivalent (CO2e) indicators, as well as the analysis of alternative fuel scenarios (e.g., LNG, methanol, and hydrogen) and advanced regulatory cost modelling under EU ETS and FuelEU Maritime frameworks, including allowance price dynamics, vessel-level cost optimisation, and penalty mechanisms.
In addition, future work will extend the framework to include explicit IMO Carbon Intensity Indicator (CII) calculations and rating classification based on annualised operational data. Moreover, emerging machine learning approaches for energy demand forecasting [44] could be integrated into the framework to enable predictive analytics and real-time operational optimisation in container ports.
Author Contributions
Conceptualisation, D.C. and O.-N.V.; methodology, D.C. and O.-N.V.; software, D.C. and R.-E.A.; validation, F.D., C.P. and R.-E.A.; formal analysis, O.-N.V.; investigation, D.C.; resources, D.C., O.-N.V., A.P., R.-E.A., F.D. and C.P.; data curation, D.C.; writing—original draft preparation, O.-N.V. and A.P.; writing—review and editing, O.-N.V.; visualisation, O.-N.V., F.D., C.P. and A.P.; supervision, D.C.; project administration, O.-N.V.; funding acquisition, D.C. All authors have read and agreed to the published version of the manuscript.
Funding
This research received no external funding.
Institutional Review Board Statement
Not applicable.
Informed Consent Statement
Not applicable.
Data Availability Statement
The data presented in this research are contained within the published article. Should further details be required, please reach out to the corresponding author.
Conflicts of Interest
The authors declare no conflicts of interest.
Abbreviations
The following abbreviations are used in this manuscript:
| AE | Auxiliary Engine |
| CF | Carbon Conversion Factor |
| CII | Carbon Intensity Indicator |
| CO2 | Carbon Dioxide |
| CO2e | Carbon Dioxide Equivalent |
| EEDI | Energy Efficiency Design Index |
| EEOI | Energy Efficiency Operational Indicator |
| EEXI | Energy Efficiency Existing Ship Index |
| EP | Energy Productivity |
| EU ETS | European Union Emissions Trading System |
| FC | Fuel Consumption |
| FUR | Fleet Utilisation Rate |
| GHG | Greenhouse Gas |
| HFO | Heavy Fuel Oil |
| IMO | International Maritime Organization |
| LCT | Logistics Cycle Time |
| LF | Load Factor |
| MDO | Marine Diesel Oil |
| ME | Main Engine |
| MGO | Marine Gas Oil |
| MRV | Monitoring, Reporting and Verification |
| OAT | One-Factor-at-a-Time |
| OPEX | Operating Expenditures |
| OTAR | On-Time Arrival Rate |
| PMS | Planned Maintenance System |
| SFOC | Specific Fuel Oil Consumption |
| SI | Sensitivity Index |
| TEU | Twenty-Foot Equivalent Unit |
| VCUR | Vessel Capacity Utilisation Rate |
| VST | Vessel Stationary Time |
Appendix A. Justification of Operational Margin δ in Port Stay Calculations
The operational margin δ in Equation (7) accounts for non-productive time during port calls, including:
- Vessel manoeuvring and positioning at berth.
- Pilot boarding and disembarkation.
- Line handling and mooring operations.
- Waiting times between crane cycles.
- Document handling and customs formalities.
- Unexpected delays (equipment failure, weather, etc.).
The range δ = 0.10–0.30 is derived from terminal performance literature.
The ref. [4] reports that productive container handling typically represents 70–90% of total port stay time across global terminals. This implies δ values of 0.11 to 0.43, calculated as:
δ = (1/productive time share) − 1
For example:
- −
- 90% productive time → δ = 1/0.9 − 1 = 0.11.
- −
- 80% productive time → δ = 1/0.8 − 1 = 0.25.
- −
- 70% productive time → δ = 1/0.7 − 1 = 0.43.
Operational inefficiencies can add 15–25% to theoretical handling time in conventional terminals, corresponding to δ values of 0.15–0.25 [13]. Similarly, in well-managed terminals, non-productive time accounts for approximately 15–20% of total port stay (δ = 0.18–0.25) [28].
A baseline value of δ = 0.20 is adopted in this study, representing typical conditions in semi-automated terminals with moderate operational efficiency.
This value is consistent with the mean of ranges reported in the literature and provides a realistic yet conservative estimate for vessel-level logistics performance modelling.
Appendix B. Estimation of Non-Fuel Operating Expenses (OPEX)
Due to data confidentiality, actual non-fuel operating expenses for the analysed vessels were not available. Instead, OPEX was estimated using industry benchmarks, with adjustments for vessel age based on the maritime economics literature.
Appendix B.1. Baseline OPEX Estimation
The daily operating expenses (OPEX) for medium-sized container vessels (6000–7500 TEU) are generally estimated within the range of $6500–8500 per day [9,22].
This range encompasses:
- Crew costs: $2000–2800/day.
- Maintenance and repairs: $1500–2500/day.
- Insurance (H&M and P&I): $800–1200/day.
- Stores and lubricants: $500–800/day.
- Administration and management: $700–1200/day.
A baseline value of $7500/day was selected, representing the midpoint of this range and corresponding to a vessel of average age and technical specifications.
Appendix B.2. Reference Period
The study covers a 120-day reference period (December 2023–March 2024), resulting in baseline OPEX of: $7500/day × 120 days = $900,000 per vessel.
Appendix B.3. Age Adjustment Factors
Vessel age significantly influences operating expenses, particularly maintenance, repairs, and insurance. Age adjustment factors were derived from [27] (see Table A1).
Table A1.
Age adjustment factors.
These ranges are consistent, and note that older vessels require more frequent dry-docking and have higher machinery breakdown risks, leading to increased maintenance expenditure.
Appendix B.4. Applied Adjustment Factors
Based on the specific ages of the analysed vessels, the adjustment factors in Table A2 were applied.
Table A2.
Adjustment factors and OPEX.
Appendix B.5. Validation and Sensitivity
The resulting OPEX values ($900,000–$1,080,000 for 120 days) correspond to daily rates of $7500–$9000, which fall within the upper range of industry benchmarks for vessels of this class [9]. Sensitivity analysis (Section 5.8) confirms that even a ±20% variation in these estimates would not alter the main conclusions, as fuel costs represent 50–65% of total operating expenditures.
Appendix C. Assumptions for Auxiliary Engine Load Factors
Auxiliary engine load factors used in Equations (3) and (4) were selected based on established ship emission inventory methodologies. In vessel energy and emission assessments, auxiliary fuel consumption is commonly estimated as the product of installed generator power, operating time, and a representative load factor reflecting the fraction of rated power effectively utilised [6].
Appendix C.1. Port Stay Load Factor ( = 0.40)
During port stay (hotelling), auxiliary engines supply:
- Hotel loads (accommodation lighting, HVAC, galley).
- Cargo-handling support systems (reefer containers).
- Ventilation and pumping systems.
- Navigation and communication equipment (standby mode).
Empirical studies based on onboard measurements report:
- Hulskotte et al. (2010) [42]: 0.35–0.45 for container ships at berth.
- Nicewicz and Tarnapowicz (2012) [41]: 0.38–0.42 based on electrical load measurements.
- Merk (2014) [24]: 0.40 as a representative value for port emission inventories.
- IMO (2020) [5]: 0.35–0.50 depending on reefer container share,
- OECD (2014) [40]: 0.30–0.50 reported for container vessels, depending on reefer container share.
Reported load factor values vary depending on vessel size, electrical system configuration and the proportion of refrigerated containers carried on board.
A baseline value of 0.40 is adopted, representing typical conditions with moderate reefer container demand.
Appendix C.2. Sea Passage Load Factor ( = 0.30)
During sea passage, auxiliary engines primarily supply:
- Navigation equipment and bridge systems.
- Accommodation hotel loads.
- Refrigeration (if applicable).
- Ballast and bilge systems.
Hulskotte (2010) [42] reports lower load factors at sea, typically in the range of 0.20–0.35, due to:
- Main engine providing propulsion, reducing auxiliary demand.
- Intermittent loading patterns.
- Installed generator overcapacity.
A baseline value of 0.30 is adopted, providing a conservative yet realistic estimate for comparative analysis.
Appendix C.3. Sensitivity Range
Based on the cited literature, a plausible sensitivity range of 0.25–0.45 is considered representative for auxiliary engine loading, which is explicitly explored in the sensitivity analysis presented in Section 5.
References
- Notteboom, T.; Pallis, T.; Rodrigue, J.-P. Disruptions and resilience in global container shipping and ports: The COVID-19 pandemic versus the 2008–2009 financial crisis. Marit. Econ. Logist. 2021, 23, 179–210. [Google Scholar] [CrossRef] [Scilit]
- Merk, O.; Teodoro, A. Alternative approaches to measuring concentration in liner shipping. Marit. Econ. Logist. 2022, 24, 723–746. [Google Scholar] [CrossRef] [Scilit]
- Lopes, L.S.; Nabais, J.L.; Pinto, C.; Caldeirinha, V.; Pinho, T. Essential Competencies in Maritime and Port Logistics: A Study on the Current Needs of the Sector. Sustainability 2025, 17, 2378. [Google Scholar] [CrossRef] [Scilit]
- World Bank Group. The Container Port Performance Index 2022: A Comparable Assessment of Performance Based on Vessel Time in Port. 2023. Available online: www.worldbank.org (accessed on 11 March 2026).
- IMO. Fourth Greenhouse Gas Study 2020. Available online: https://www.imo.org/en/ourwork/environment/pages/fourth-imo-greenhouse-gas-study-2020.aspx (accessed on 11 March 2026).
- Sigalas, C. Financial impact of the IMO 2020 regulation on dry bulk shipping. Marit. Transp. Res. 2022, 3, 100064. [Google Scholar] [CrossRef] [Scilit]
- Cariou, P. Is slow steaming a sustainable means of reducing CO2 emissions from container shipping? Transp. Res. Part D Transp. Environ. 2011, 16, 260–264. [Google Scholar] [CrossRef] [Scilit]
- Tran, N.K.; Haasis, H.D. An empirical study of fleet expansion and growth of ship size in container liner shipping. Int. J. Prod. Econ. 2015, 159, 241–253. [Google Scholar] [CrossRef] [Scilit]
- Clarksons Research. Container Intelligence Update May 2019 | PDF | Containerization | Port. Available online: https://ro.scribd.com/document/604759637/Cim (accessed on 11 March 2026).
- UNCTAD. Review of Maritime Transport 2023 | UN Trade and Development (UNCTAD). Available online: https://unctad.org/publication/review-maritime-transport-2023 (accessed on 11 March 2026).
- Doru, C. Managementul Logisticii Companiei de Transport Naval; Editura Academiei Navale Mircea cel Bătrân: Constanța, Romania, 2025; ISBN 978-606-642-304-5. [Google Scholar]
- Yang, B.; Xie, L. Dynamics Model and Simulation of Core Competence of Maritime Logistics Enterprises for Service Innovation. J. Coast. Res. 2019, 94, 891–896. [Google Scholar] [CrossRef] [Scilit]
- International Transport Forum. ITF Summit 2019 | Transport Connectivity for Regional Integration. Available online: https://2019.itf-oecd.org/event/global-maritime-logistics-dialogue (accessed on 11 March 2026).
- Psaraftis, H.N.; Kontovas, C.A. Speed Models for Energy-Efficient Maritime Transportation: A Taxonomy and Survey. Transp. Res. Part C Emerg. Technol. 2013, 26, 231–351. [Google Scholar] [CrossRef] [Scilit]
- Bouman, E.A.; Lindstad, E.; Rialland, A.I.; Strømman, A.H. State-of-the-art technologies, measures, and potential for reducing GHG emissions from shipping—A review. Transp. Res. D Transp. Environ. 2017, 52, 408–421. [Google Scholar] [CrossRef] [Scilit]
- Psaraftis, H.N.; Kontovas, C.A. Ship speed optimization: Concepts, models and combined speed-routing scenarios. Transp. Res. Part C Emerg. Technol. 2014, 44, 52–69. [Google Scholar] [CrossRef] [Scilit]
- Psaraftis, H.N.; Kontovas, C.A. Decarbonization of Maritime Transport: Is There Light at the End of the Tunnel? Sustainability 2021, 13, 237. [Google Scholar] [CrossRef] [Scilit]
- Psaraftis, H.N. Speed optimization for sustainable shipping. In Sustainable Shipping: A Cross-Disciplinary View; Springer: Berlin/Heidelberg, Germany, 2019; pp. 339–381. [Google Scholar] [CrossRef] [Scilit]
- European Commission. Decarbonising Maritime Transport—FuelEU Maritime. Mobility and Transport. Available online: https://transport.ec.europa.eu/transport-modes/maritime/decarbonising-maritime-transport-fueleu-maritime_en (accessed on 11 March 2026).
- Vakili, S.; Insel, M.; Singh, S.; Ölçer, A. Decarbonizing Domestic and Short-Sea Shipping: A Systematic Review and Transdisciplinary Pathway for Emerging Maritime Regions. Sustainability 2025, 17, 7294. [Google Scholar] [CrossRef] [Scilit]
- Zeng, F.; Chen, A.; Xu, S.; Chan, H.K.; Li, Y. Digitalization in the Maritime Logistics Industry: A Systematic Literature Review of Enablers and Barriers. J. Mar. Sci. Eng. 2025, 13, 797. [Google Scholar] [CrossRef] [Scilit]
- Det Norske Veritas. Maritime Forecast to 2050. Available online: https://maritimecyprus.com/wp-content/uploads/2023/09/DNV_Maritime_Forecast_2050_2023-report_c.pdf (accessed on 11 March 2026).
- Wang, S.; Meng, Q. Sailing speed optimization for container ships in a liner shipping network. Transp. Res. Part E Logist. Transp. Rev. 2012, 48, 701–714. [Google Scholar] [CrossRef] [Scilit]
- Merk, O. Shipping Emissions in Ports. In The International Transport Forum’s Discussion Paper; Scientific Research Publishing: Wuhan, China, 2014; Available online: https://www.scirp.org/reference/referencespapers?referenceid=2665364 (accessed on 20 March 2026).
- Cheaitou, A.; Cariou, P. Greening of maritime transportation: A multi-objective optimization approach. Ann. Oper. Res. 2019, 273, 501–525. [Google Scholar] [CrossRef] [Scilit]
- 2023 Shipping Review, Another Resilient Year | Clarksons. Available online: https://www.clarksons.com/home/news-and-insights/2024/2023-shipping-market-review/ (accessed on 26 March 2026).
- Stephens, M. Raport de Transparență 2023 Moore Stephens KSC. 2023. Available online: https://www.moore.ro/wp-content/uploads/sites/22/2025/12/Transparency-Report-2023_R-Moldova-30-04-2024_-semnat.pdf (accessed on 26 March 2026).
- Rankine, G. Benchmarking Container Terminal Performance. ContainerPort Conference—Rotterdam. Available online: https://www.cofastrans.com/wp-content/uploads/2023/10/benchmarking-container-terminal-performance.pdf (accessed on 11 March 2026).
- Sydney Intermodal Terminal Alliance—Part 3A Concept Plan Application Traffic and Transport. Appendix F Sketch Plan of the Proposed Upgrade. Available online: https://moorebankintermodalprecinct.com.au/wp-content/uploads/2023/04/18-AppF2-TransportAIAApps_Part3.pdf (accessed on 11 March 2026).
- Cepowski, T.; Drozd, A. Measurement-based relationships between container ship operating parameters and fuel consumption. Appl. Energy 2023, 347, 121315. [Google Scholar] [CrossRef] [Scilit]
- Schroten, A.; Nelissen, D.; van Santen, W.; Scholten, P.; de Vries, J. Impact of Fuel Prices on Energy Efficiency of Maritime Ships. 2024. Available online: www.cedelft.eu (accessed on 17 April 2026).
- Saltelli, A.; Ratto, M.; Andres, T.; Campolongo, F.; Cariboni, J.; Gatelli, D.; Saisana, M.; Tarantola, S. Global Sensitivity Analysis. The Primer; John Wiley & Sons, Ltd.: Chichester, UK, 2008; pp. 1–292. [Google Scholar]
- Helton, J.C.; Johnson, J.D.; Sallaberry, C.J.; Storlie, C.B. Survey of sampling-based methods for uncertainty and sensitivity analysis. Reliab. Eng. Syst. Saf. 2006, 91, 1175–1209. [Google Scholar] [CrossRef] [Scilit]
- Stopford, M. Maritime Economics, 3rd ed.; Routledge: London, UK, 2008; pp. 1–815. [Google Scholar] [CrossRef] [Scilit]
- Notteboom, T.; Pallis, A.; Rodrigue, J.-P. Port Economics, Management and Policy. Available online: https://porteconomicsmanagement.org/wp-content/uploads/10.4324_9780429318184_previewpdf.pdf (accessed on 17 April 2026).
- European Maritime Safety Agency. Calls for Tenders [Archived]—EMSA/OP/20/2021-EMSA—European Maritime Safety Agency. Available online: https://www.emsa.europa.eu/publications/reports/item/4625-annual-emissions-report-2022.html (accessed on 11 March 2026).
- EUR-Lex-Document 52024DC0538. Report from The Commission to The European Parliament and The Council on the Functioning of the European Carbon Market in 2023. Available online: https://eur-lex.europa.eu/legal-content/EN/TXT/?uri=celex:52024DC0538&utm (accessed on 17 April 2026).
- EUR-Lex-Document 32023R1805. Regulation (EU) 2023/1805 of the European Parliament and of the Council of 13 September 2023 on the Use of Renewable and Low-Carbon Fuels in Maritime Transport, and Amending Directive 2009/16/EC (Text with EEA Relevance). Available online: https://eur-lex.europa.eu/eli/reg/2023/1805/oj (accessed on 17 April 2026).
- MEPC (336) 76; Guidelines on Operational Carbon Intensity Indicators and the Calculation Methods. International Maritime Organization: London, UK, 2021.
- European Commission. Reducing Emissions from the Shipping Sector—Climate Action. Available online: https://climate.ec.europa.eu/eu-action/transport-decarbonisation/reducing-emissions-shipping-sector_en (accessed on 25 March 2026).
- Nicewicz, G.; Tarnapowicz, D. Assessment of Marine Auxiliary Engines Load Factor in Ports. Available online: https://www.researchgate.net/publication/298026922_Assessment_of_marine_auxiliary_engines_load_factor_in_ports (accessed on 11 March 2026).
- Hulskotte, J.; van der Gon, H.D. Fuel consumption and associated emissions from seagoing ships at berth derived from an on-board survey. Atmos. Environ. 2010, 44, 1229–1236. [Google Scholar] [CrossRef] [Scilit]
- Alavi-Borazjani, S.A.; Bengue, A.A.; Chkoniya, V.; Shafique, M.N. An Overview of Critical Success Factors for Digital Shipping Corridors: A Roadmap for Maritime Logistics Modernization. Sustainability 2025, 17, 5537. [Google Scholar] [CrossRef] [Scilit]
- Seyhan, A. A Novel Study for Machine-Learning-Based Ship Energy Demand Forecasting in Container Port. Sustainability 2025, 17, 5612. [Google Scholar] [CrossRef] [Scilit]
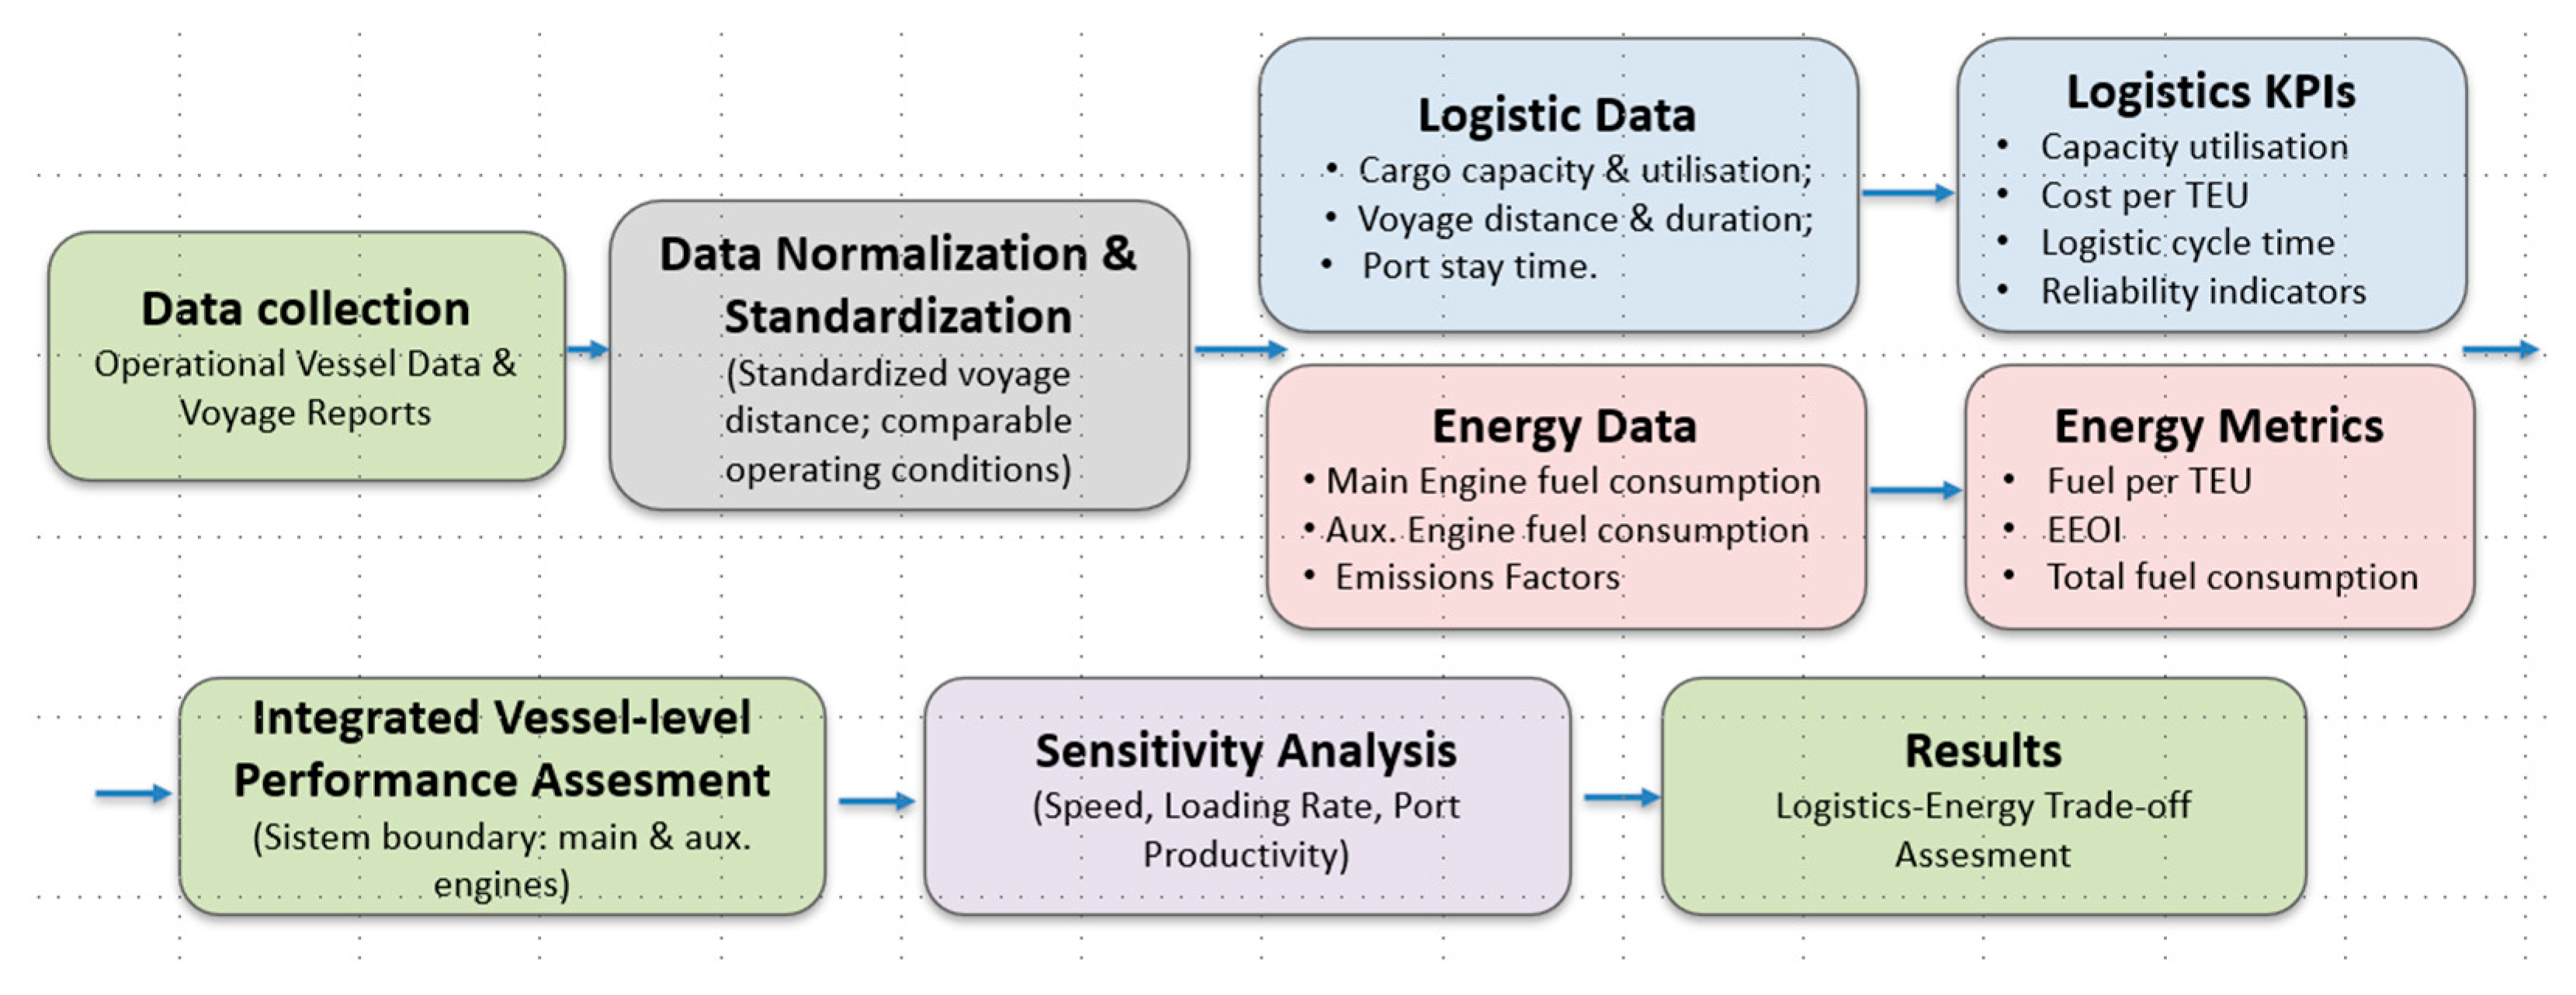
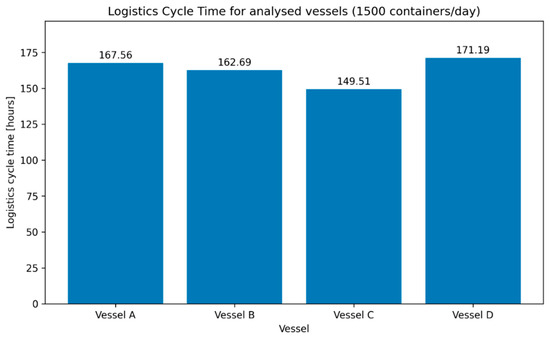
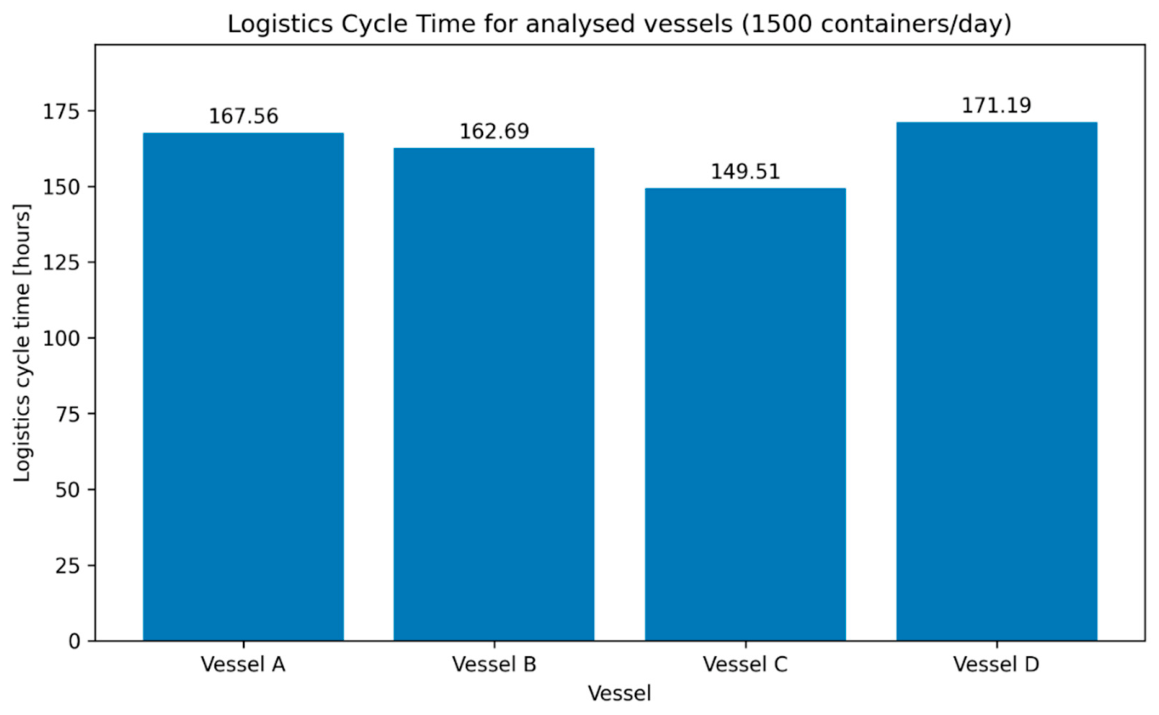
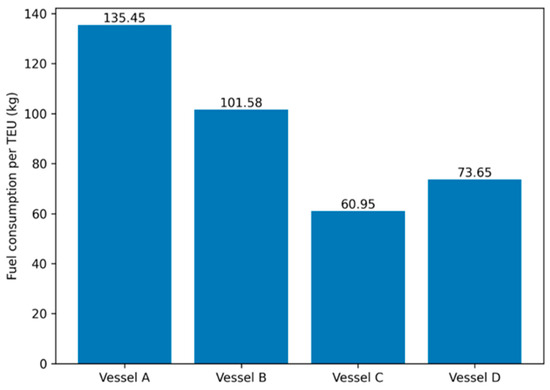
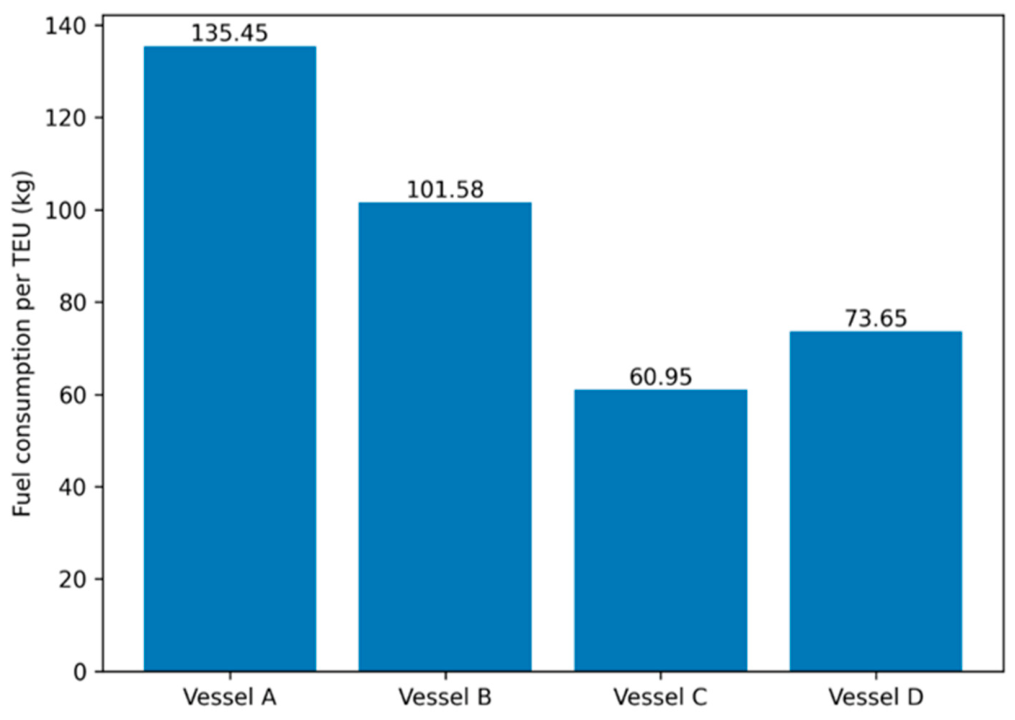
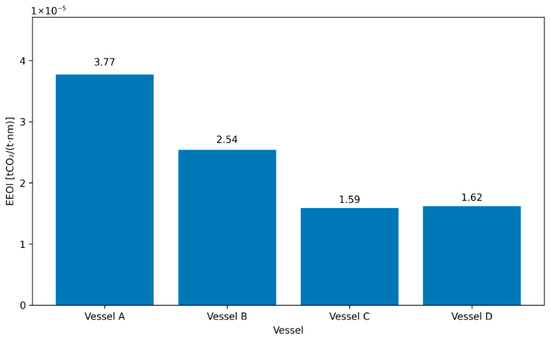
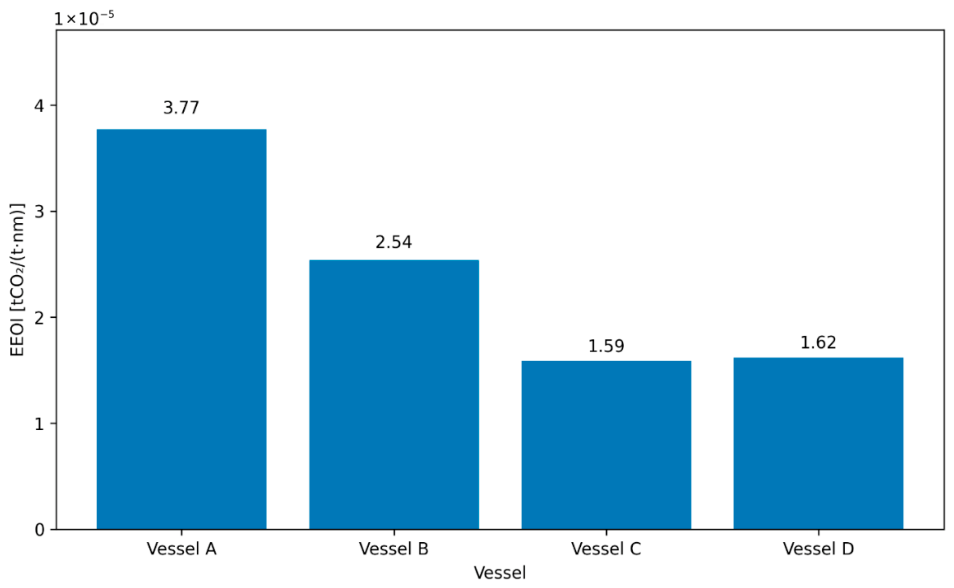
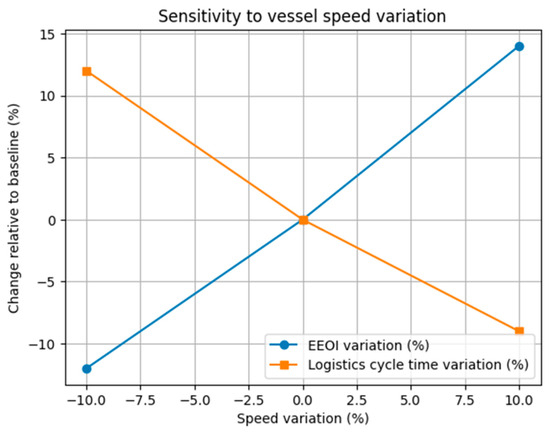
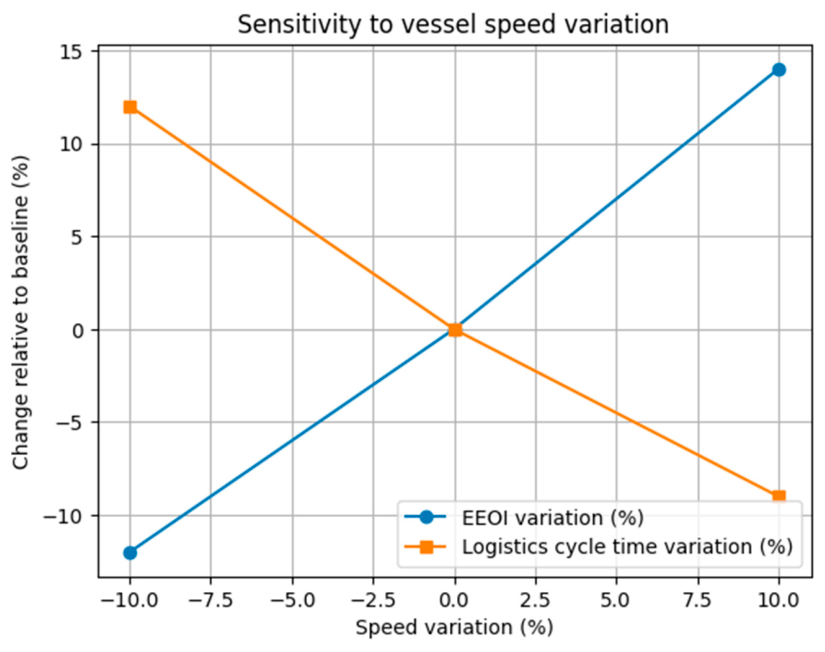
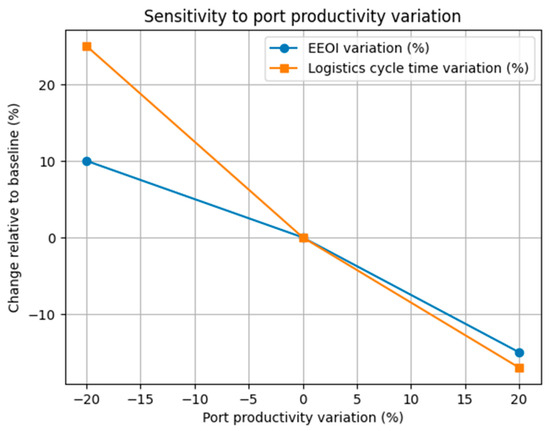
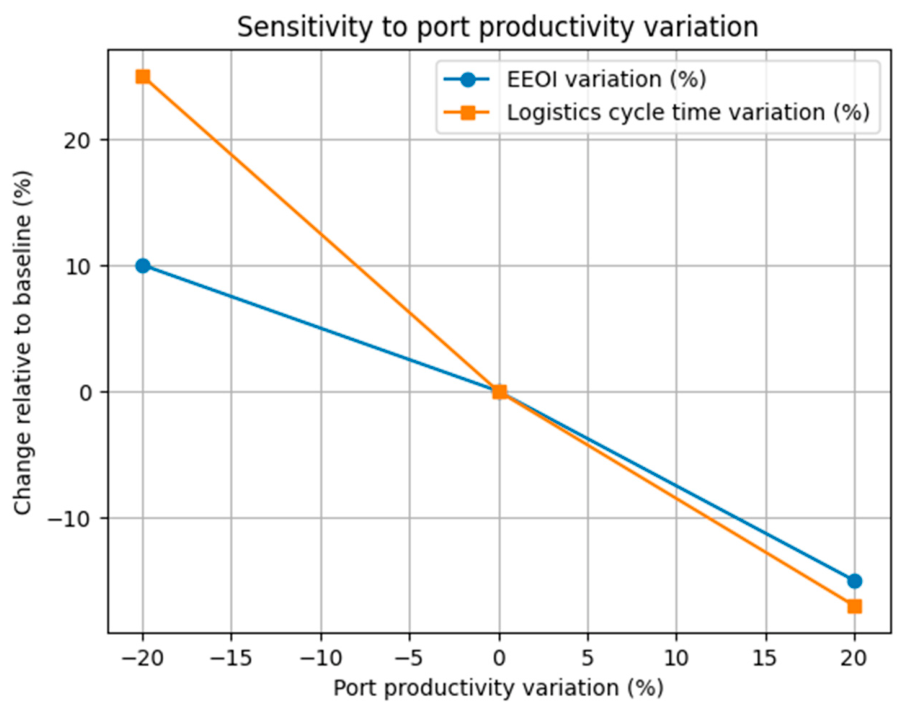
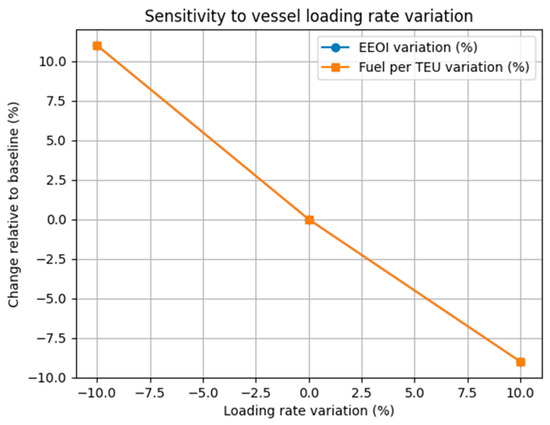
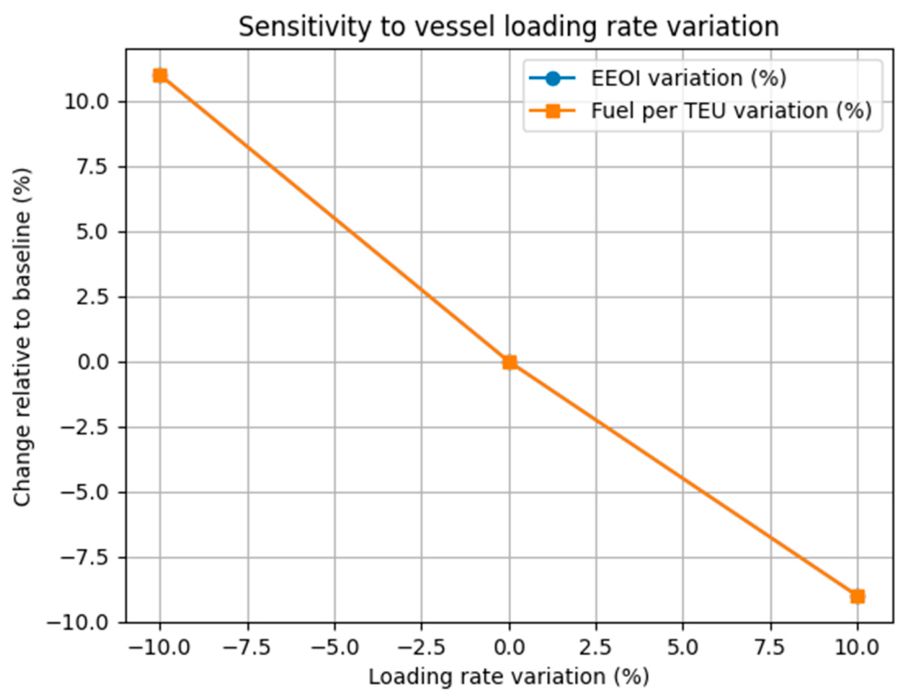

Disclaimer/Publisher’s Note: The statements, opinions and data contained in all publications are solely those of the individual author(s) and contributor(s) and not of MDPI and/or the editor(s). MDPI and/or the editor(s) disclaim responsibility for any injury to people or property resulting from any ideas, methods, instructions or products referred to in the content. |
© 2026 by the authors. Licensee MDPI, Basel, Switzerland. This article is an open access article distributed under the terms and conditions of the Creative Commons Attribution (CC BY) license.