


Abstract
For power-grid applications such as transmission corridor inspection, substation asset inspection, and post-disaster emergency repair, reliable UAV self-localization under GNSS-degraded or GNSS-denied conditions is critical to ensuring operational safety and accurate defect geotagging. Due to substantial discrepancies in viewpoint, scale, and geometric structure between oblique UAV images and nadir satellite images, conventional RGB-based cross-view retrieval methods often suffer from unstable alignment and insufficient geometric modeling, particularly in scenarios with repetitive textures and partial overlap. To address these challenges, we propose a cross-view visual geo-localization model that integrates RGBD multimodal inputs with multi-scale attention enhancement. Specifically, MiDaS is used to estimate relative depth from UAV imagery, which is concatenated with RGB to form a four-channel input, while satellite images are padded with an additional zero channel to maintain dimensional consistency. A shared-weight ViTAdapter is adopted to learn joint semantic–geometric representations, and a lightweight Efficient Multi-scale Attention (EMA) module is adopted on spatial feature maps to strengthen multi-scale spatial consistency. In addition, an IoU-weighted InfoNCE loss is employed to accommodate partial matching during training, thereby improving the robustness of feature alignment. Experiments on the GTA-UAV dataset under the cross-area protocol show stable performance across both retrieval and localization metrics. Specifically, Recall@1, Recall@5, and Recall@10 reach 18.12%, 38.83%, and 49.47%, respectively; AP is 28.01 and SDM@3 is 0.53; meanwhile, the top-1 geodesic distance error Dis@1 is 1052.73 m. These results indicate that explicit geometric priors combined with multi-scale spatial enhancement can effectively improve cross-view feature alignment, leading to enhanced robustness and accuracy for localization in challenging power inspection scenarios.
1. Introduction
In power-grid scenarios such as intelligent operation and maintenance, transmission corridor inspection, fine-grained distribution network management, and emergency repair support, unmanned aerial vehicles (UAVs) have become an important means of grid inspection due to their high mobility, rapid deployment, and high-resolution low-altitude imaging capability, with increasing adoption in routine inspections over complex terrains and long-distance transmission corridors [1,2,3,4]. However, when UAVs operate across mountainous canyons, densely forested areas, substation regions with extensive metallic structures, and strong electromagnetic environments, Global Navigation Satellite System (GNSS) signals are prone to blockage, multipath reflection, and electromagnetic interference. These effects can result in positioning drift or even signal loss, significantly degrading trajectory stability and defect geotagging accuracy, thereby directly affecting hazard verification efficiency and operational safety [5,6,7]. Consequently, developing visual geo-localization techniques that do not rely on external navigation signals and can infer accurate positions solely from onboard visual information has become a fundamental requirement for enhancing UAV autonomy and mission reliability under GNSS-degraded or GNSS-denied conditions. Such capability is of substantial theoretical and engineering significance for improving the safety, continuity, and efficiency of power-grid operation and maintenance [8,9,10].
From the perspective of power production and maintenance, accurate visual geo-localization provides essential support for defect discovery, location annotation, and subsequent maintenance handling during UAV-based inspections. By spatiotemporally aligning UAV-captured images of transmission towers, conductors, insulators, fittings, and corridor environments with existing GIS line inventories and satellite remote-sensing basemaps, this technology enables traceable geographic coordinates for defect logging, risk grading, and work-order dispatch, thereby improving the consistency of repeated inspections and the efficiency of defect reproduction [11,12]. In emergency scenarios, when events such as typhoons, icing, wildfires, or earthquakes damage transmission corridors and disrupt communication or navigation infrastructure, robust visual localization can enable UAVs to rapidly re-localize along the corridor and identify damaged segments under weak GNSS conditions, facilitating the optimization of inspection routes and repair scheduling and shortening outage restoration time [13]. From a technological evolution standpoint, visual geo-localization can be integrated with grid digital twins, 3D modeling of transmission corridors, and intelligent defect diagnosis systems. By leveraging global re-localization and loop-closure constraints to suppress inertial navigation drift, it can significantly enhance navigation stability and autonomy for long-endurance inspections and multi-UAV collaborative operations, supporting the scalable deployment of unmanned and reduced-manning power-grid maintenance [14].
Visual geo-localization has evolved from traditional handcrafted feature matching to early deep-learning-based retrieval paradigms. Early localization methods primarily relied on handcrafted local descriptors such as SIFT and SURF, which extract keypoints and perform geometric verification and matching. Although such methods offer good geometric interpretability, they are often computationally expensive and struggle to handle the large-scale differences and rotation variations between UAV and satellite viewpoints; moreover, their robustness is limited in scenarios with repetitive textures or drastic illumination changes [15]. With the rapid development of deep learning, the research paradigm has gradually shifted toward cross-view image retrieval, which aims to achieve feature alignment by learning nonlinear semantic mappings between UAV and satellite views. Nevertheless, because these two viewpoints differ fundamentally in imaging altitude, viewing angle, and coverage, cross-view image pairs frequently exhibit severe geometric deformation and scale inconsistency. This imposes considerable challenges on the matching robustness and generalization capability of existing models in complex environments [16].
To address these challenges, substantial efforts have been devoted to both dataset construction and model optimization. As a pioneering benchmark in this field, the University-1652 dataset released by Zheng et al. established a building-object-based cross-view retrieval setting using campus scenes [17]. Subsequently, SUES-200 proposed by Wang et al. and DenseUAV constructed by Dai et al. further extended the coverage to multiple altitudes and dense urban areas, significantly improving data diversity [18,19]. However, many early models were built upon an idealized one-to-one center-alignment assumption, which fails to capture viewpoint shifts and occlusions frequently encountered in real flights [20,21,22]. To overcome this limitation, Ji et al. proposed the representative Game4Loc framework [23], which first formalized a more realistic partial matching paradigm. By introducing an IoU-weighted InfoNCE loss, Game4Loc effectively suppresses training noise caused by non-strict field-of-view alignment and reduces reliance on idealized data [24,25,26]. Meanwhile, other frontier approaches have continued to advance: Zhu et al. employed polar transforms to mitigate geometric distortion; the FSRA architecture leverages spatial shuffle attention to extract rotation-invariant features; and TransVPR adopts a coarse-to-fine hierarchical retrieval strategy. Collectively, these studies constitute key steps toward transforming visual geo-localization from “ideal alignment” to “robustness in practice” [27].
Despite the notable progress achieved by advanced methods such as Game4Loc in terms of data paradigms and alignment strategies, three fundamental limitations remain and continue to hinder further breakthroughs in complex environments. First, explicit geometric structure modeling is still insufficient [28,29]. Most cross-view localization methods, including Game4Loc, largely rely on RGB appearance cues and neglect critical 3D spatial layout information [30,31,32]. Under repetitive textures (e.g., densely packed rooftops) or drastic illumination variations, 2D texture alone is often inadequate for discriminating regions with similar appearance but distinct spatial structures, leading to severe appearance ambiguity. Second, Transformer-based architectures have limited capability in capturing local structures and multi-scale features [33]. Although mainstream Vision Transformer (ViT) backbones are effective at modeling global context, their fixed patch-based attention mechanisms can be insensitive to fine-grained local geometric details and lack efficient multi-scale interactions. As a result, establishing accurate correspondences becomes challenging under severe scale variations and local misalignment across views [16]. Third, feature consistency and robustness under complex matching conditions remain to be improved [34]. In real UAV missions, extreme viewpoint differences are common and are often accompanied by partial occlusion and partial overlap. Existing methods struggle to maintain high consistency in the embedding space under a single modality or single scale, limiting localization reliability under highly dynamic and non-ideal observation conditions [35].
Motivated by the above observations, this paper proposes an improved model that integrates RGBD multimodal features with a multi-scale spatial enhancement mechanism to address the aforementioned challenges. Unlike prior cross-view localization frameworks such as Game4Loc or TransGeo, our proposed RGBD-EMA framework introduces three key innovations. First, the RGB → RGBD conversion injects structural priors through relative depth estimation (via MiDaS), enabling UAV images to capture stable 3D scene geometry despite severe viewpoint discrepancies. Second, the Efficient Multi-scale Attention (EMA) module dynamically emphasizes discriminative structural regions, addressing the Transformer’s inherent insensitivity to fine-grained local structures [36]. Third, the multimodal fusion mechanism is specifically designed to harmonize RGB textures and depth geometry, mitigating feature redundancy often observed in naive concatenation. Collectively, these enhancements establish a robust, scalable framework that significantly improves retrieval accuracy and localization robustness on standard Transformer architectures, while remaining compatible with cross-architecture adaptation. In summary, the main contributions of this work are as follows:
- Transition from RGB to RGBD via Geometric Prior Injection: To address the severe viewpoint discrepancies (oblique UAV vs. nadir satellite) and the lack of 3D structural awareness in pure RGB-based localization, we introduce relative depth estimation (via MiDaS) to inject crucial geometric spatial priors into the network. This enables the model to focus on stable 3D structures (e.g., building boundaries and road layouts) rather than being easily disturbed by superficial texture or illumination changes in GNSS-denied environments.
- Efficient Multi-Scale Attention (EMA) for Local Scale Adaptability: To overcome the inherent limitation of pure Transformer architectures (which often lack fine-grained local scale adaptability in complex scenes), we adopt an existing highly lightweight EMA module. It dynamically captures multi-scale structural features and significantly boosts localization accuracy while adding negligible computational burden (representing a mere ~0.4% FLOPS increase compared to the baseline), making it highly advantageous for computationally constrained UAV deployment.
- Principled Multimodal Expansion and Fusion: Rather than a trivial modal concatenation, we design a specifically tailored alignment mechanism to harmoniously fuse RGB textures with Depth geometry. This principled approach effectively mitigates the feature redundancy and conflict often observed in naive multi-modal insertions, establishing a robust and scalable framework for cross-view localization.
2. Overall Framework
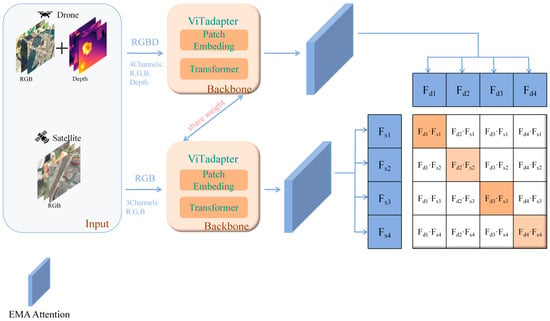
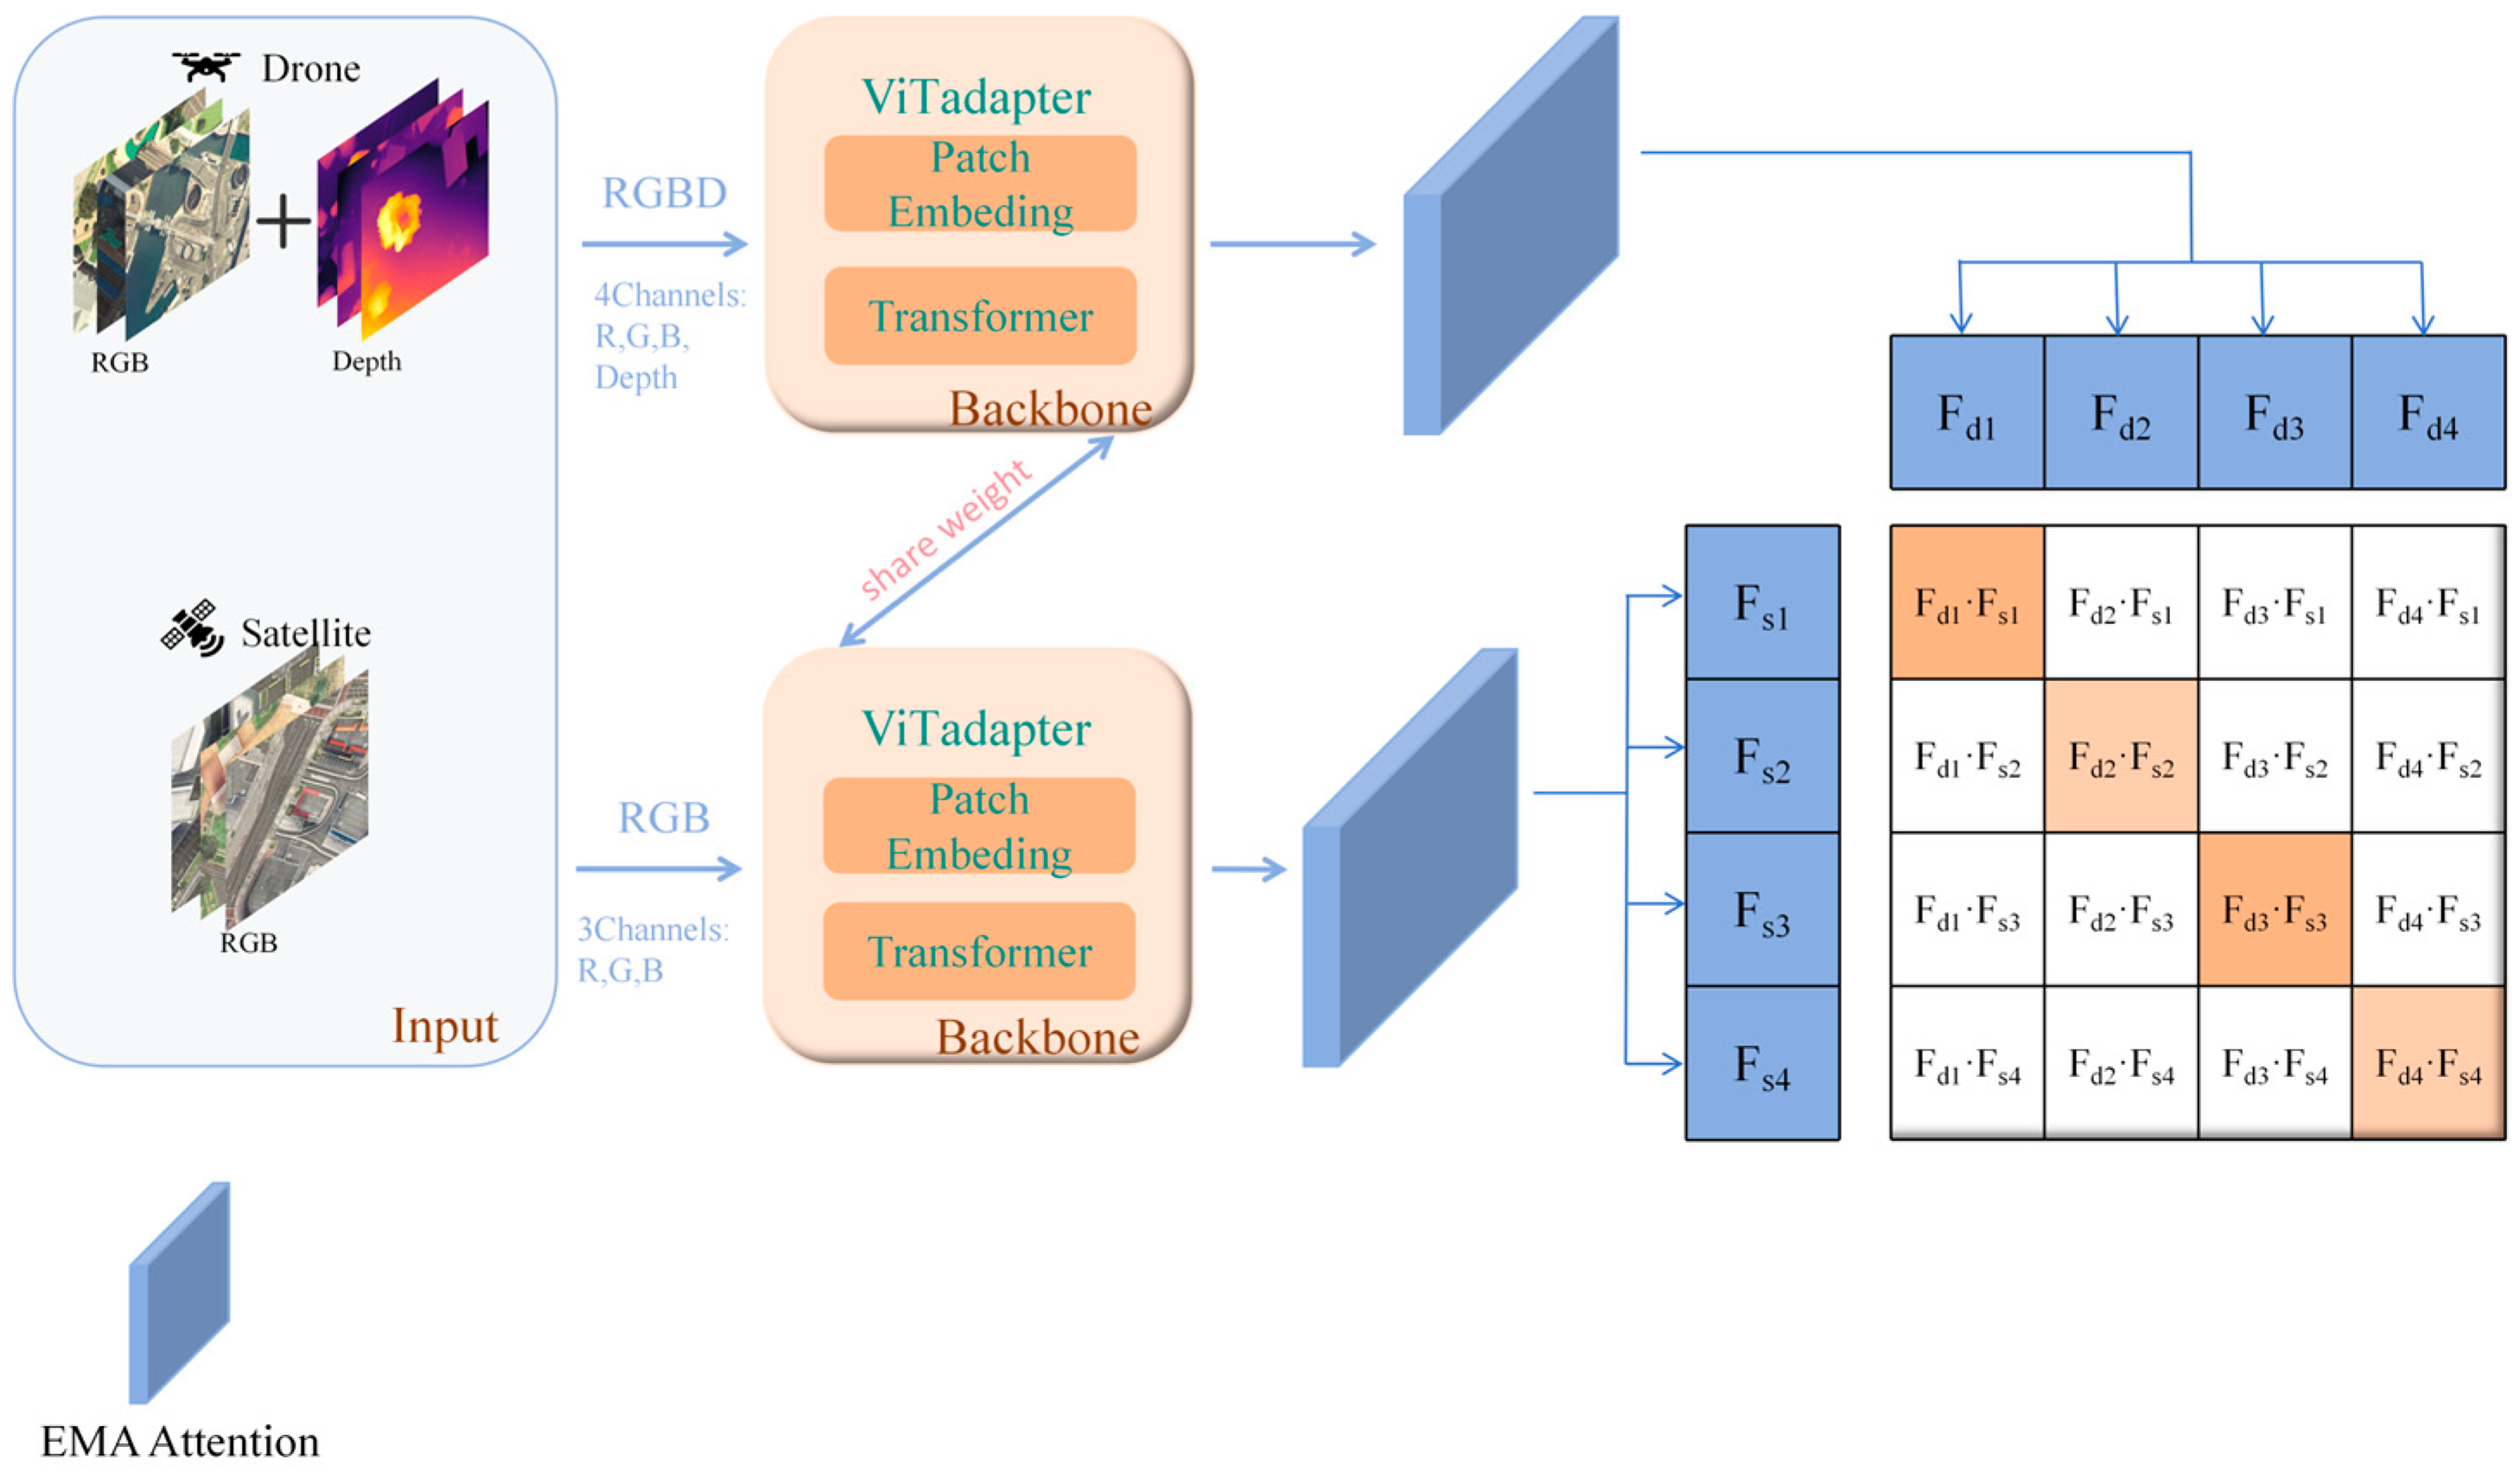
The proposed RGBD-EMA geo-localization model targets end-to-end retrieval, and the overall pipeline can be summarized into two stages: input and encoding, and enhancement and optimization, as illustrated in Figure 1. Specifically, RGBD-EMA is an end-to-end cross-view retrieval framework designed for partial matching scenarios, where the key idea is to strengthen structural representations by introducing explicit geometric priors.
Figure 1.
Overall pipeline of the proposed RGBD-EMA framework. In this diagram, the light orange blocks represent the shared-weight ViTAdapter modules, and the blue blocks denote the extracted spatial feature maps and the EMA attention module. In the similarity matrix on the right, the orange cells indicate positive matching pairs, while the white cells represent negative pairs.
At the input stage, considering that low-altitude UAV views contain rich vertical structural cues, a monocular depth estimation network is employed to generate depth maps for UAV images. The estimated depth is then fused with the corresponding RGB image to form a four-channel RGBD input, thereby complementing the missing 3D geometric constraints in conventional RGB-only settings.
For satellite imagery, a zero-padding strategy is adopted to expand the input to a four-channel tensor with consistent dimensionality. This asymmetric design is motivated by the intrinsic characteristics of each modality: UAV images capture oblique viewpoints with unstable 3D structures, whereas satellite images from a nadir perspective already provide reliable geometric layouts. Zero-padding ensures channel consistency without modifying the encoder architecture. Importantly, the shared-weight ViTAdapter encoder maps both UAV and satellite inputs into a unified embedding space, mitigating potential modality-specific bias. While we have not yet conducted dedicated ablation experiments isolating this asymmetry, the design is theoretically justified, and future work will systematically evaluate it through ablation and cross-dataset experiments.
Subsequently, inputs from both views are fed into a shared-weight ViTAdapter encoder, which maps images from different viewpoints into a unified feature space. This backbone not only captures high-level semantics but also preserves patch-level spatial layout information, providing a foundation for downstream feature alignment. Meanwhile, a lightweight Efficient Multi-scale Attention (EMA) module is introduced after the encoder. Through multi-scale spatial re-calibration, the EMA module adaptively strengthens responses in discriminative structural regions (e.g., building contours and road topology) while suppressing redundant background noise, producing more spatially consistent representations. The enhanced spatial features are further aggregated via global average pooling to obtain compact image-level embedding vectors.
Finally, during training optimization, an IoU-weighted InfoNCE loss is adopted to accommodate the complex correspondences induced by partial matching. By dynamically adjusting the weights of positive pairs according to their overlap ratios, the model achieves robust feature alignment and accurate localization under non-strict alignment and partially overlapped data distributions.
3. RGBD Data Construction and Input Preprocessing
3.1. Dataset
This study is conducted using the GTA-UAV dataset released with the Game4Loc framework. The dataset is generated in a large-scale virtual simulation environment and covers multiple flight regions (Areas), which can effectively emulate the imaging characteristics of UAV dynamic observations in realistic urban scenes. Each UAV-view image has a geographic correspondence with the satellite imagery of the same region, making the dataset directly applicable to cross-view image retrieval and geo-localization tasks. Therefore, it provides a solid data foundation for model training and validation in this work.
To evaluate the generalization capability of the proposed method in unseen environments, a cross-area splitting strategy is adopted, where the dataset is partitioned into training and testing sets according to regions: some Areas are used for training, while the remaining non-overlapping Areas are reserved exclusively for testing. The overall split ratio is approximately 8:2, ensuring that the training set contains sufficient diversity in terrain and building structures while the test distribution remains unseen during training. This protocol better reflects real-world deployment scenarios in which the system is applied to new regions, and thus provides a more representative assessment of model generalization performance.
3.2. UAV Depth Map Generation and RGBD Construction
Cross-view geo-localization is fundamentally challenged by the substantial geometric discrepancy between oblique UAV views and nadir satellite views. When only RGB inputs are used, models tend to rely heavily on appearance cues such as texture and color, while inadequately capturing 3D information related to terrain relief, building contours, and spatial structural relationships. To address this issue, we incorporate estimated depth information into the UAV RGB inputs. Specifically, we load UAV RGB images from the GTA-UAV dataset and feed the constructed inputs into the MiDaS monocular depth estimation model. Compared to alternative depth estimation approaches (e.g., AdaBins) that often focus on metric depth and are highly sensitive to scale variations in unseen aerial environments, MiDaS is explicitly designed for zero-shot cross-dataset transfer. It leverages mixed training datasets to provide highly stable and discriminative relative depth maps. This characteristic perfectly aligns with our cross-view geo-localization task, which prioritizes structural consistency over strict metric measurements, effectively bypassing the scale ambiguity associated with absolute depth estimation.
After obtaining the normalized depth map, the RGB image and the depth map are concatenated along the channel dimension to form a four-channel input. This representation jointly incorporates photometric cues and geometric structural information, enabling the encoder to account for both appearance consistency and structural consistency during cross-view matching. Meanwhile, satellite images are originally represented as three-channel RGB inputs. To maintain consistency with the UAV-side input format, a zero-valued channel is appended prior to the encoder, yielding the four-channel representation. It should be emphasized that the fourth channel of satellite images does not carry geometric information; rather, enforcing channel consistency ensures compatibility with the unified ViTAdapter encoding framework and avoids introducing additional architectural modifications caused by mismatched input dimensionality.
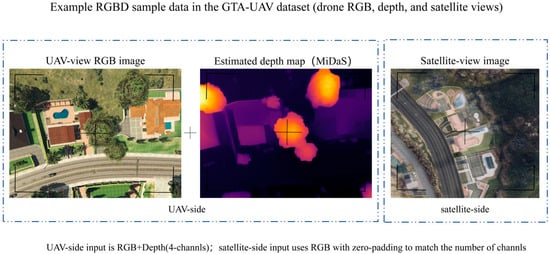
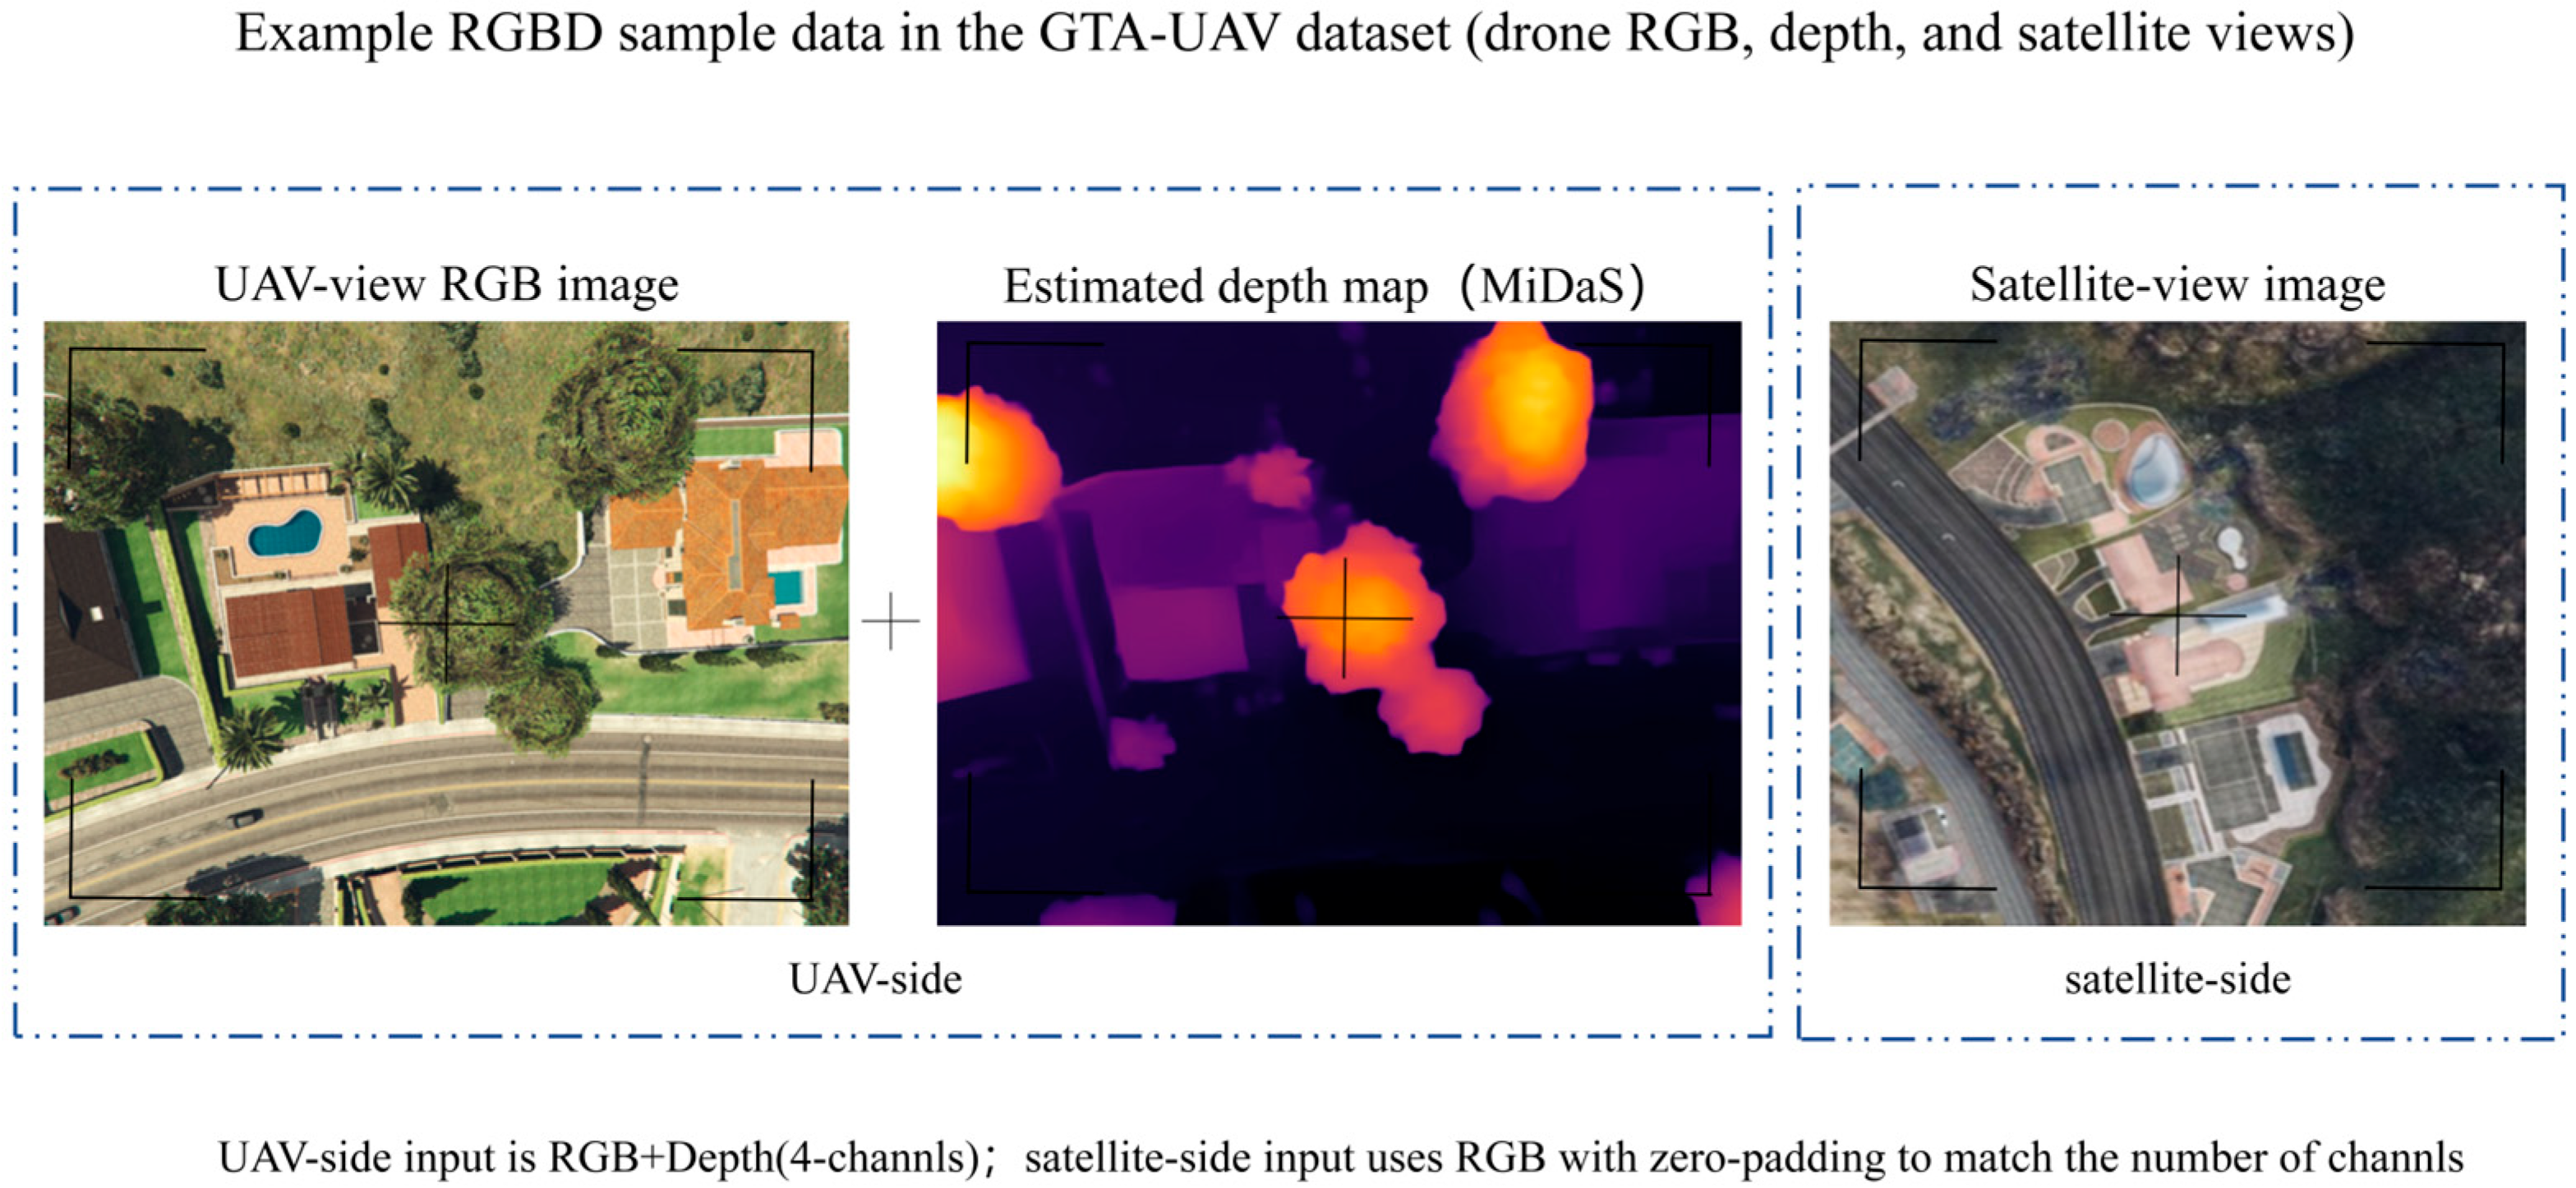
To visually illustrate the appearance differences among the UAV-side RGB modality, the corresponding depth modality, and the matched satellite-view image in the GTA-UAV dataset, Figure 2 presents a representative example. The UAV image captures a local, oblique observation, whereas the satellite image provides a nadir view with global coverage. Consequently, substantial discrepancies exist in scale, structural composition, and visible field-of-view. This dataset-level disparity indicates that relying solely on RGB appearance cues can easily introduce ambiguity, while the depth modality can provide complementary structural information to promote spatial consistency, thereby offering a more informative basis for subsequent cross-view feature alignment and geo-localization modeling.
Figure 2.
Representative RGBD samples in the GTA-UAV dataset and schematic illustration of the input modalities. In the estimated depth map, warmer colors (e.g., orange and yellow) indicate regions closer to the camera, while cooler colors (e.g., dark purple) represent regions further away.
Specifically, we first load UAV RGB images from the GTA-UAV dataset and feed the constructed inputs into the MiDaS monocular depth estimation model according to Equation (1). Compared to alternative depth estimation approaches (e.g., AdaBins) that often focus on metric depth and are highly sensitive to scale variations in unseen aerial environments, MiDaS is explicitly designed for zero-shot cross-dataset transfer. It leverages mixed training datasets to provide highly stable and discriminative relative depth maps. This characteristic perfectly aligns with our cross-view geo-localization task, which prioritizes structural consistency (e.g., building contours and spatial layouts) over strict metric measurements, effectively bypassing the scale ambiguity associated with absolute depth estimation. In our implementation, we adopt the MiDaS v3.1 model equipped with a DPT-BEiT-Large backbone. This specific configuration offers an optimal balance between preserving fine-grained structural details and capturing robust global context during the data preprocessing stage. As a result, it exhibits strong cross-scene generalization ability and can produce stable relative depth distributions, providing good discriminability for urban terrain and building structures. The predicted depth map can be formulated as in Equation (2) and is subsequently normalized to the range of [0, 1], which improves training stability and mitigates scale drift across different samples.
Building upon this, after obtaining the normalized depth map, the RGB image and the depth map are concatenated along the channel dimension to form a four-channel input, as shown in Equation (3). This representation jointly incorporates photometric cues and geometric structural information, enabling the encoder to account for both appearance consistency and structural consistency during cross-view matching. Moreover, the four-channel format provides a unified input interface that facilitates the subsequent design of a shared encoder.
Meanwhile, satellite images are originally represented as three-channel RGB inputs, as formulated in Equation (4). To maintain consistency with the UAV-side input format, a zero-valued channel is appended prior to the encoder, yielding the four-channel representation in Equation (5). It should be emphasized that the fourth channel of satellite images does not carry geometric information; rather, enforcing channel consistency ensures compatibility with the unified ViTAdapter encoding framework and avoids introducing additional architectural modifications caused by mismatched input dimensionality. This design also enables a fairer evaluation of the actual contribution brought by incorporating depth on the UAV side.
4. EMA-Based Multimodal Encoding Model
4.1. Multimodal Inputs and a Shared ViTAdapter Encoder
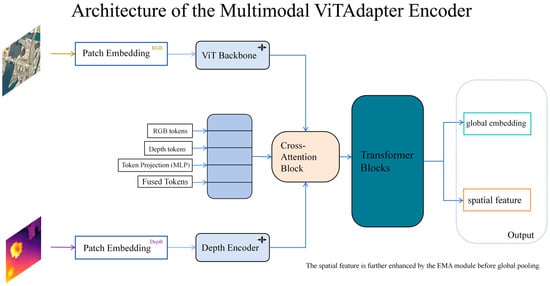
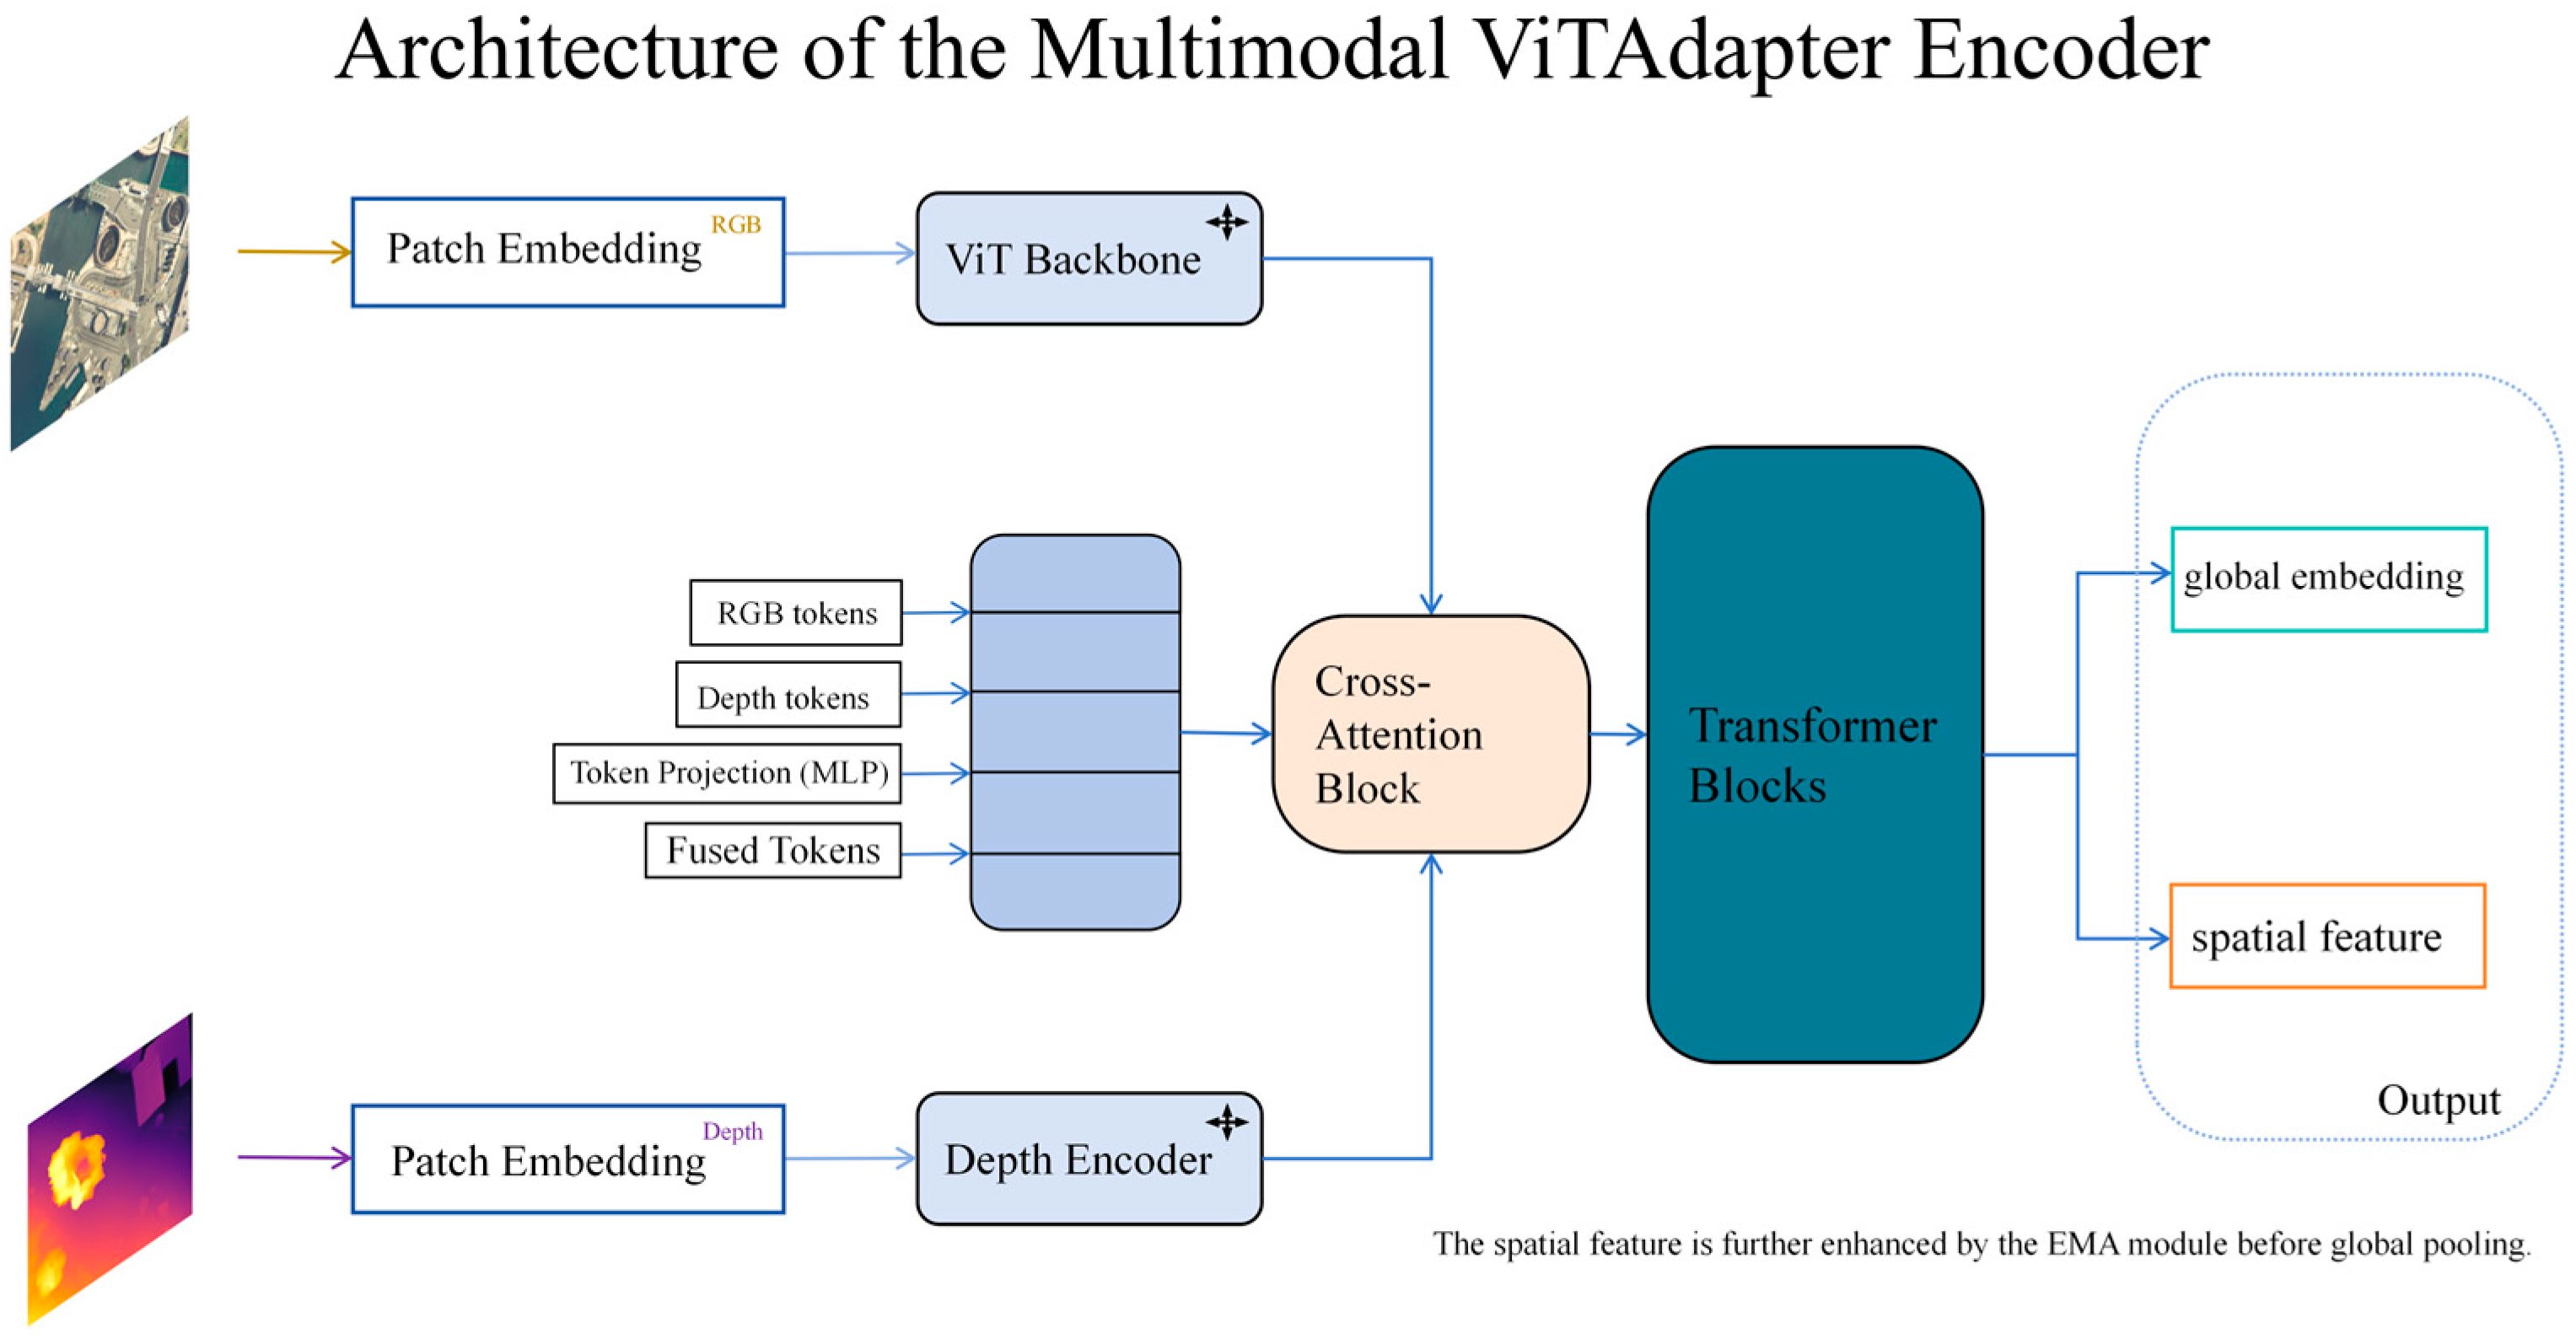
To address the challenges in UAV visual geo-localization, including substantial viewpoint discrepancies and insufficient utilization of geometric structural information, we propose an EMA-enhanced RGBD multimodal cross-view encoding model. Unlike conventional matching paradigms that rely solely on RGB appearance features, the proposed method adopts an end-to-end joint modeling strategy. By explicitly incorporating 3D geometric priors and a multi-scale attention mechanism, it enables efficient feature alignment between UAV and satellite-view images, as illustrated in Figure 3.
Figure 3.
Architecture of ViTAdapter. In this diagram, the light blue blocks represent the backbone encoders and token processing components, the peach block indicates the Cross-Attention Block, the dark cyan block represents the shared Transformer Blocks, and the boxes with green and orange outlines denote the global embedding and spatial feature outputs, respectively.
We adopt ViTAdapter as the backbone visual encoder to perform unified feature extraction for both UAV- and satellite-view images. By combining the global context modeling capability of Transformers with the spatial representation advantages brought by the adapter design, ViTAdapter can learn robust semantic representations in complex scenes and produce intermediate features that preserve spatial layout information, which matches the requirements of cross-view retrieval for jointly capturing global semantics and local structures.
To further reduce the feature distribution gap between UAV and satellite domains, a shared-weight strategy is employed, where inputs from both views are projected into a unified embedding space using the same set of parameters. This design not only strengthens the consistency of cross-view alignment constraints during training, but also avoids parameter inflation and potential training instability introduced by dual encoders, thereby improving reproducibility and facilitating subsequent ablation studies. The spatial feature map output by the ViTAdapter encoder is given by:
Here, denotes the batch size, is the number of channels, and and represent the spatial resolution. This spatial feature map can be regarded as a patch-level intermediate representation produced by the encoder, preserving spatial layout information and structural responses of local regions. Therefore, it is used as the input to the EMA module for spatial re-calibration. Compared with using only global embeddings, enhancing the spatial features prior to global average pooling (GAP) is more effective in highlighting discriminative structural regions, thereby improving the stability and consistency of cross-view matching.
4.2. EMA Spatial Feature Enhancement Module
To effectively exploit fine-grained local structural details, we integrate the EMA module between the ViTAdapter encoder and the global average pooling (GAP) layer. This placement is crucial because the feature map still retains its spatial resolution at this stage, allowing region-aware re-calibration across different locations. In contrast, inserting EMA after GAP would remove the spatial dimensions and thus discard local structural cues, which would inherently limit the effectiveness of feature enhancement.
Specifically, the EMA module jointly considers contextual information along different spatial directions as well as within local neighborhoods to generate an adaptive spatial weighting map. The weights are then normalized via a sigmoid activation function and applied to the original spatial feature map output by ViTAdapter through element-wise multiplication, yielding a re-calibrated representation. The above process can be formally expressed as:
This re-calibration mechanism essentially assigns spatially varying response strengths to different locations. By allocating higher weights to salient regions with stable geometric structures and consistent semantics, the model can emphasize discriminative areas while effectively suppressing redundant backgrounds and noise. As a result, the proposed enhancement significantly improves feature consistency and discriminability under challenging cross-view conditions.
4.3. Global Feature Generation
To convert the enhanced spatial features into compact representations suitable for cross-view retrieval and enable end-to-end training, we first apply global average pooling (GAP) to compress the EMA-recalibrated feature map along the spatial dimensions, yielding a unified image-level global embedding vector . This aggregation not only reduces feature dimensionality to improve the computational efficiency of large-scale retrieval, but also constructs a shared metric space for UAV and satellite images.
Building upon this representation, to address the widely observed partial matching issue in visual geo-localization, we adopt a weighted InfoNCE loss as the optimization objective, imposing constraints on the cross-view embeddings and . The overall feature generation and optimization process can be formally expressed as:
Here, denotes the final image-level feature representation, is the feature similarity function (typically cosine similarity), and is a weighting term defined according to the partial matching relationships. By introducing this weighting mechanism, the objective not only pulls positive pairs closer and pushes negative pairs apart, but also adaptively reduces the impact of weak-match noise while emphasizing the contributions of high-confidence samples. Consequently, it effectively alleviates alignment instability caused by large viewpoint discrepancies and incomplete regional overlap, providing a robust feature basis for improving Recall@K and localization accuracy.
5. Results
5.1. Experimental Setup
To validate the model performance under complex conditions that are close to those of real-world deployment, we adopt the GTA-UAV dataset constructed in a large-scale virtual simulation platform as the benchmark. This dataset not only provides a large number of paired UAV-view and satellite-view images, but also systematically emulates typical challenges in cross-view geo-localization, including viewpoint changes, scale variations, and partial visibility. Following the partial matching paradigm, UAV images are treated as queries, and the corresponding geographic targets are retrieved from a satellite image gallery by computing feature similarities, thereby enabling a comprehensive evaluation of robustness under severe cross-view discrepancies.
To ensure reproducibility and fair comparison, all models were implemented using Python 3.8.20 and PyTorch 2.4.1 (with CUDA 11.8). Both the UAV and satellite images were resized to an input resolution of . During the data augmentation phase, we applied random horizontal flipping with a probability of 0.5, alongside random rotation specifically for the satellite images. Crucially, to maintain strict spatial alignment, the UAV depth maps underwent the exact same synchronous geometric transformations as their corresponding RGB images. The models were optimized using the AdamW optimizer with a batch size of 4. The learning rate was governed by a cosine annealing schedule with a 0.1-epoch linear warmup, peaking at a maximum learning rate of . For the global feature representation, the embedding dimension was set to 768. In the objective function, the temperature parameter for the InfoNCE loss was empirically set to 0.07. Furthermore, to handle partial matching scenarios, the exact IoU (Intersection over Union) was defined as the geometric overlap ratio between the UAV’s observable field-of-view and the corresponding satellite image tile. This IoU value was utilized to dynamically compute the weighting factor for positive pairs, thereby adaptively reducing the impact of weak-match noise during optimization.
All experiments were conducted on a single NVIDIA RTX 4060 (8 GB) GPU. Under this hardware configuration, the training time for the pure RGB baseline was approximately 22 h, while our proposed RGBD + EMA framework required roughly 26 to 28 h to reach full convergence due to the multimodal fusion processes.
On this basis, to precisely quantify the performance gains brought by the proposed improvements, we design a strictly controlled comparison. The original ViTAdapter using RGB-only inputs is selected as the baseline and is compared against our enhanced model that incorporates four-channel RGBD inputs together with the EMA-based spatial enhancement module. Notably, except for the differences in input modality and enhancement components, the two models share identical training protocols, loss functions, learning-rate schedules, and other hyperparameter settings. This ensures that performance differences can be directly and fairly attributed to the introduced multimodal geometric priors and multi-scale spatial attention.
To evaluate the deployment feasibility on real-world UAV platforms, we comprehensively measured the computational complexity of the models. The pure RGB baseline contains 64.35 M parameters and requires 37.10 G FLOPS. Our proposed RGBD + EMA model increases the parameter count to 179.23 M, primarily due to the introduction of an additional network branch to process the explicit depth modality. However, it is crucial to note that the computational cost (FLOPS) only marginally increases to 37.25 G. This represents an increase of less than 0.5% in computing operations compared to the baseline. Since FLOPS is the primary theoretical determinant of inference latency, this negligible increase ensures that our highly accurate multimodal framework maintains almost the same fast inference speed as the lightweight baseline. This exceptionally high performance-to-computation ratio proves its significant deployment advantages for computationally constrained UAV applications.
5.2. Evaluation Metrics
Recall@K is a key metric for measuring retrieval accuracy. It represents the proportion of queries for which the correct match is contained within the top- retrieved candidates. For a test set with query samples, Recall@K is defined as:
Here, denotes the rank position of the ground-truth satellite image corresponding to the -th query in the retrieved list, and is an indicator function that equals 1 if the condition holds and 0 otherwise.
Average Precision (AP) reflects the overall ranking quality and stability of retrieval results. Unlike Recall@K, which only measures whether the correct match is retrieved within the top- candidates, AP emphasizes the relative position of the correct match in the ranked list, assigning higher importance to results that appear earlier. The AP is computed as:
Here, denotes the total number of ground-truth matches for the -th query, is the gallery size, is the precision computed up to rank, and is the relevance label of the -th retrieved item (1 for a correct match, and 0 otherwise).
SDM@K (Spatial Distance Metric) is used to measure the spatial consistency and concentration of the retrieved results in geographic space. This metric jointly considers the retrieval ranking and spatial neighborhood relationships by evaluating how well the spatial distribution of the top- retrieved candidates aligns with the ground-truth location. A higher SDM value (in %) indicates that the retrieved candidates are more tightly clustered around the true target in geographic space, reflecting better consistency in the model’s understanding of geo-semantic cues.
Dis@K (Distance Error) measures the physical deviation between the predicted location and the ground-truth location, serving as a direct indicator of localization accuracy. In this work, we focus on the localization error of the top-1 retrieved result (Dis@1), defined as the geodesic distance between the predicted coordinates and the ground-truth GPS coordinates. It is computed as follows:
Here, denotes the latitude–longitude coordinates of the top-1 retrieved result for the -th query, represents the ground-truth GPS coordinates of the UAV, and is the geodesic distance function on the Earth’s surface computed using the Haversine formula (in meters).
5.3. Training Strategy and Convergence
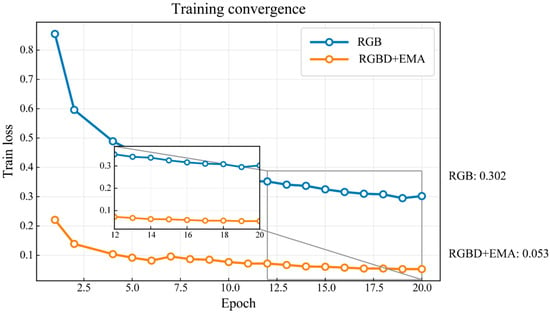
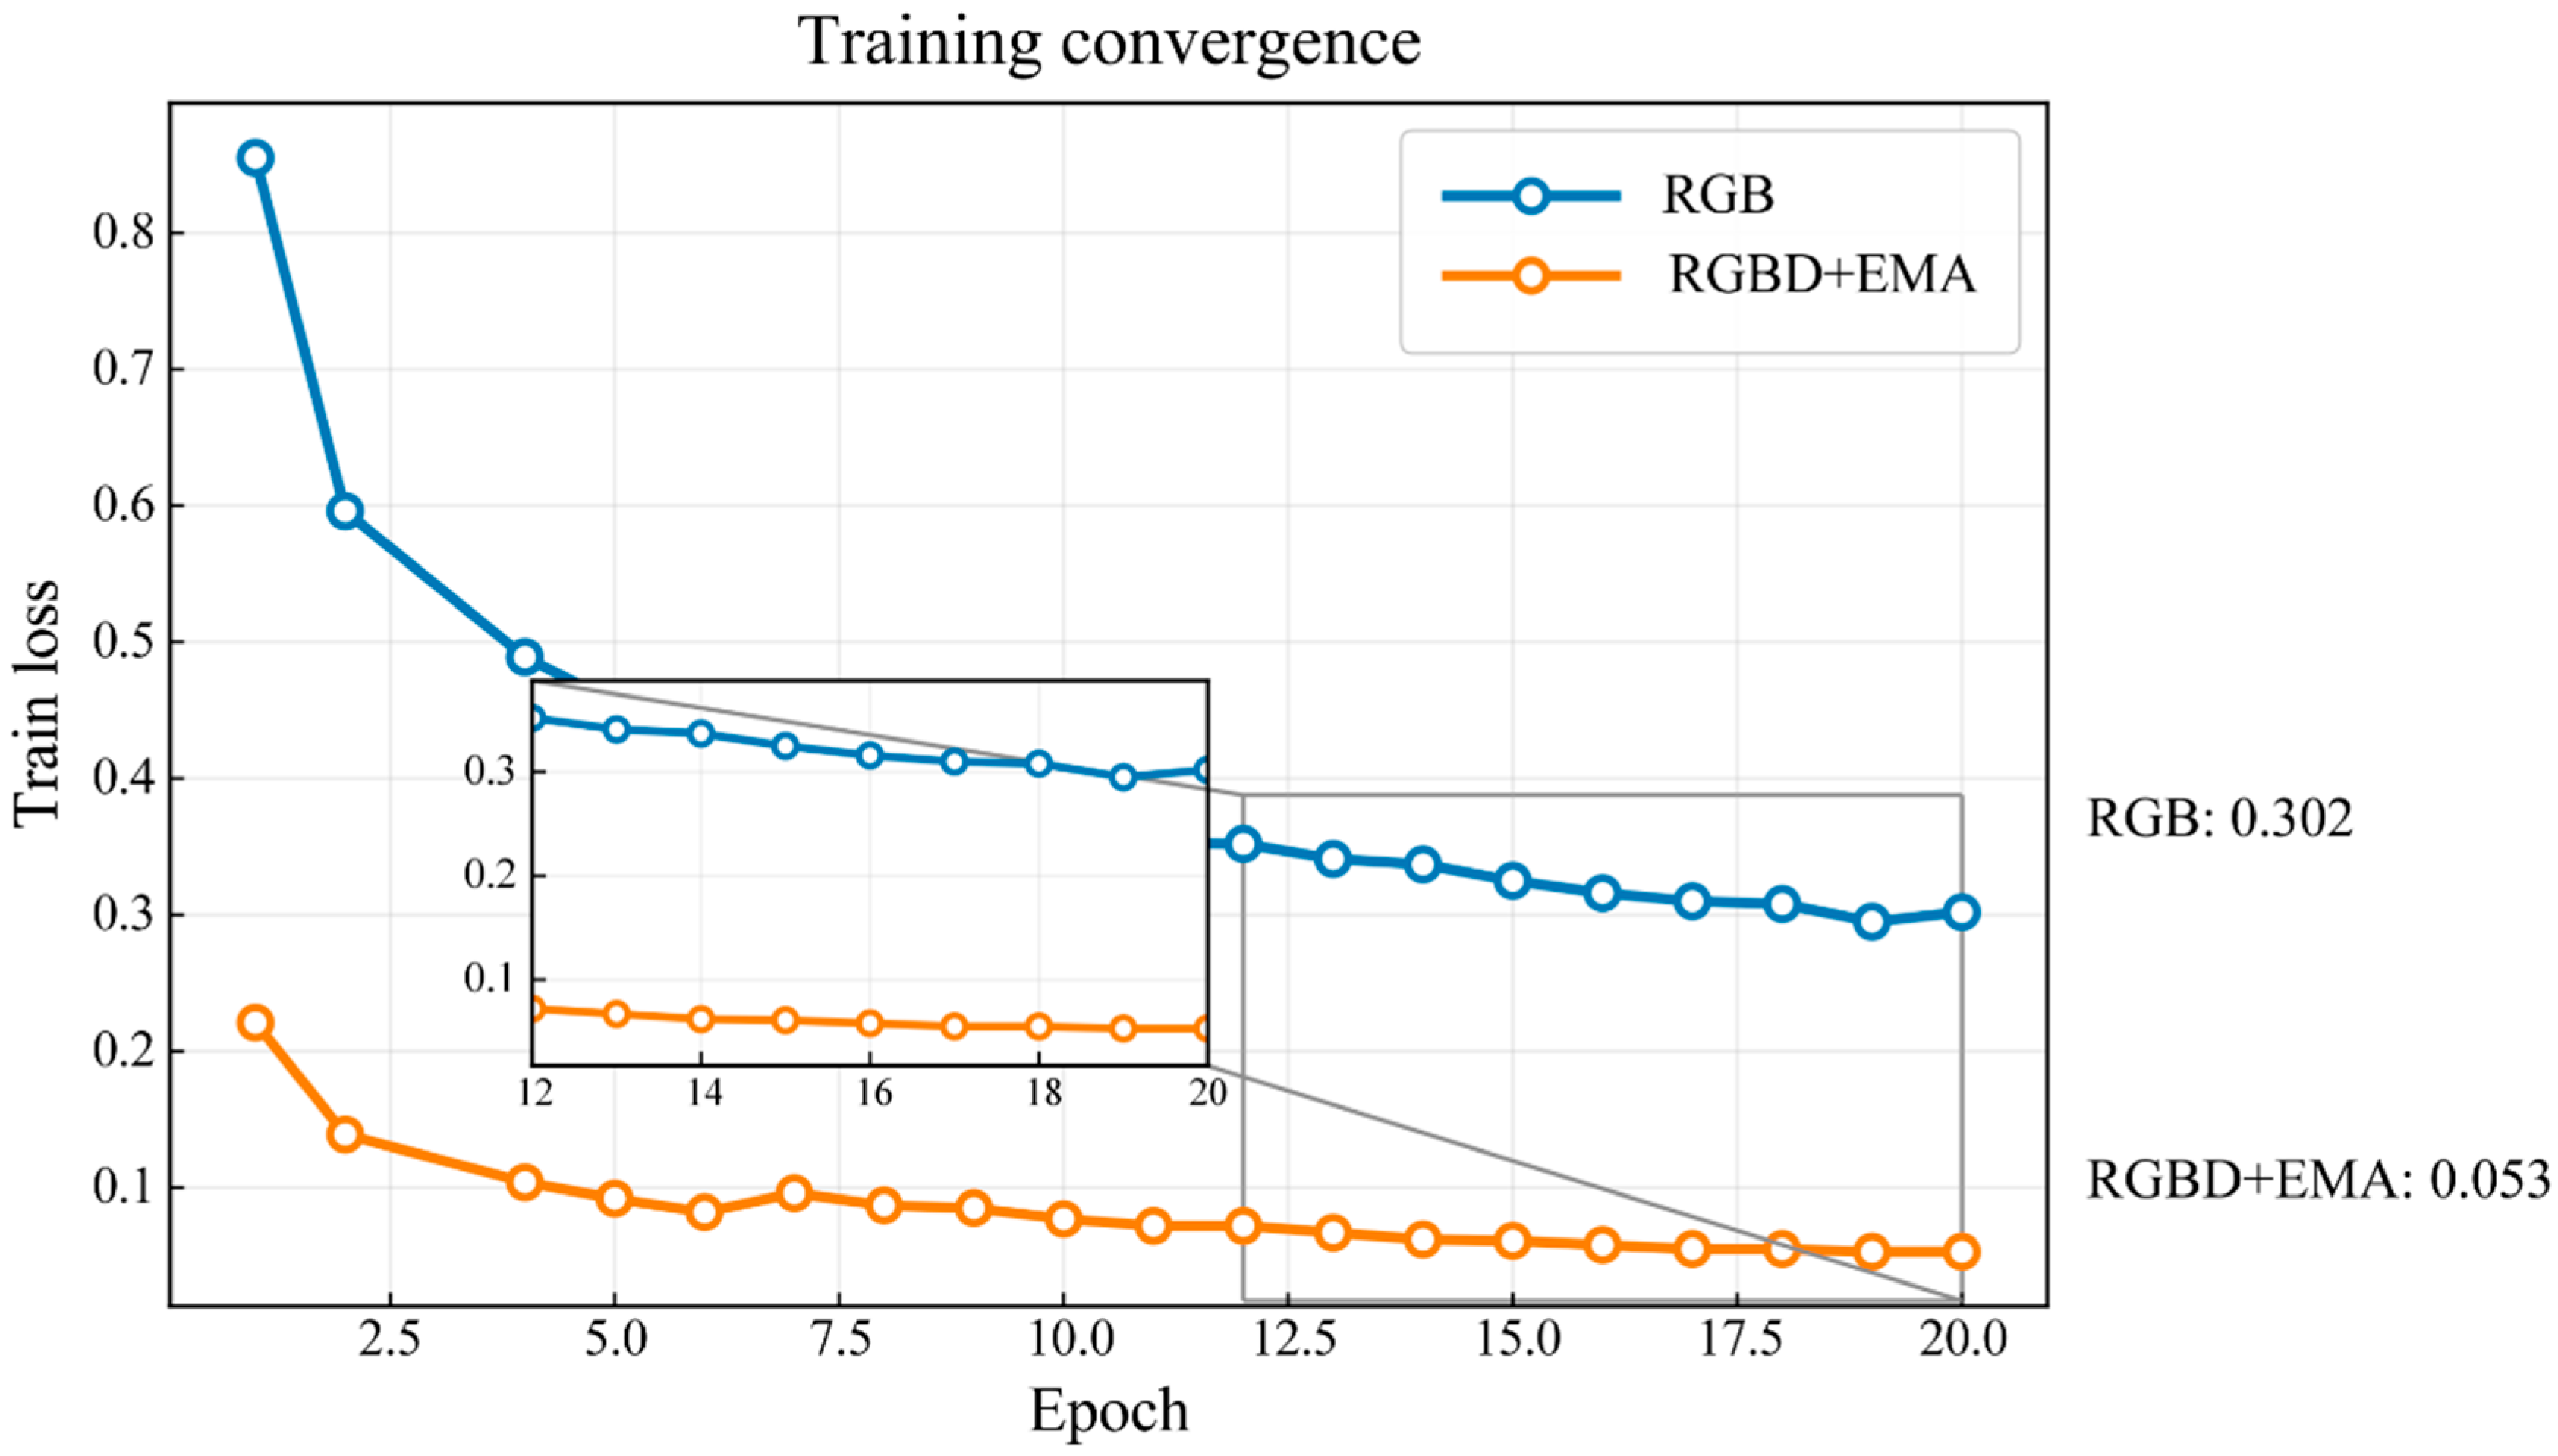
Both training schemes exhibit a monotonic decrease in loss as the number of epochs increases and eventually converge to stable values, indicating that the models can be effectively optimized and reach convergence under the current task setting and objective function, as shown in Figure 4. Compared with the RGB-only baseline, the RGBD + EMA model decreases more rapidly during the early training stage and maintains a lower loss plateau in the middle and late stages, suggesting that the introduced multimodal geometric priors and EMA-based spatial enhancement facilitate feature alignment learning.
Figure 4.
Training loss convergence curves of the two methods.
To more clearly compare the differences in the stable regime, Figure 4 also provides a zoomed-in view of Epochs 12–20. It can be observed that both curves become smooth in the later stage, while RGBD + EMA consistently retains a noticeable advantage. At the end of training, the final losses of the RGB baseline and RGBD + EMA are approximately 0.302 and 0.053, respectively (as annotated in the figure), demonstrating that the proposed model achieves more thorough optimization and more stable convergence within the same number of training epochs.
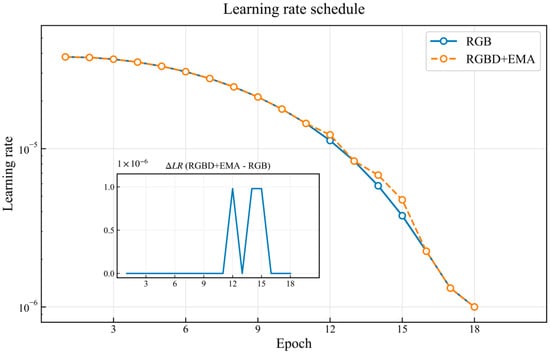
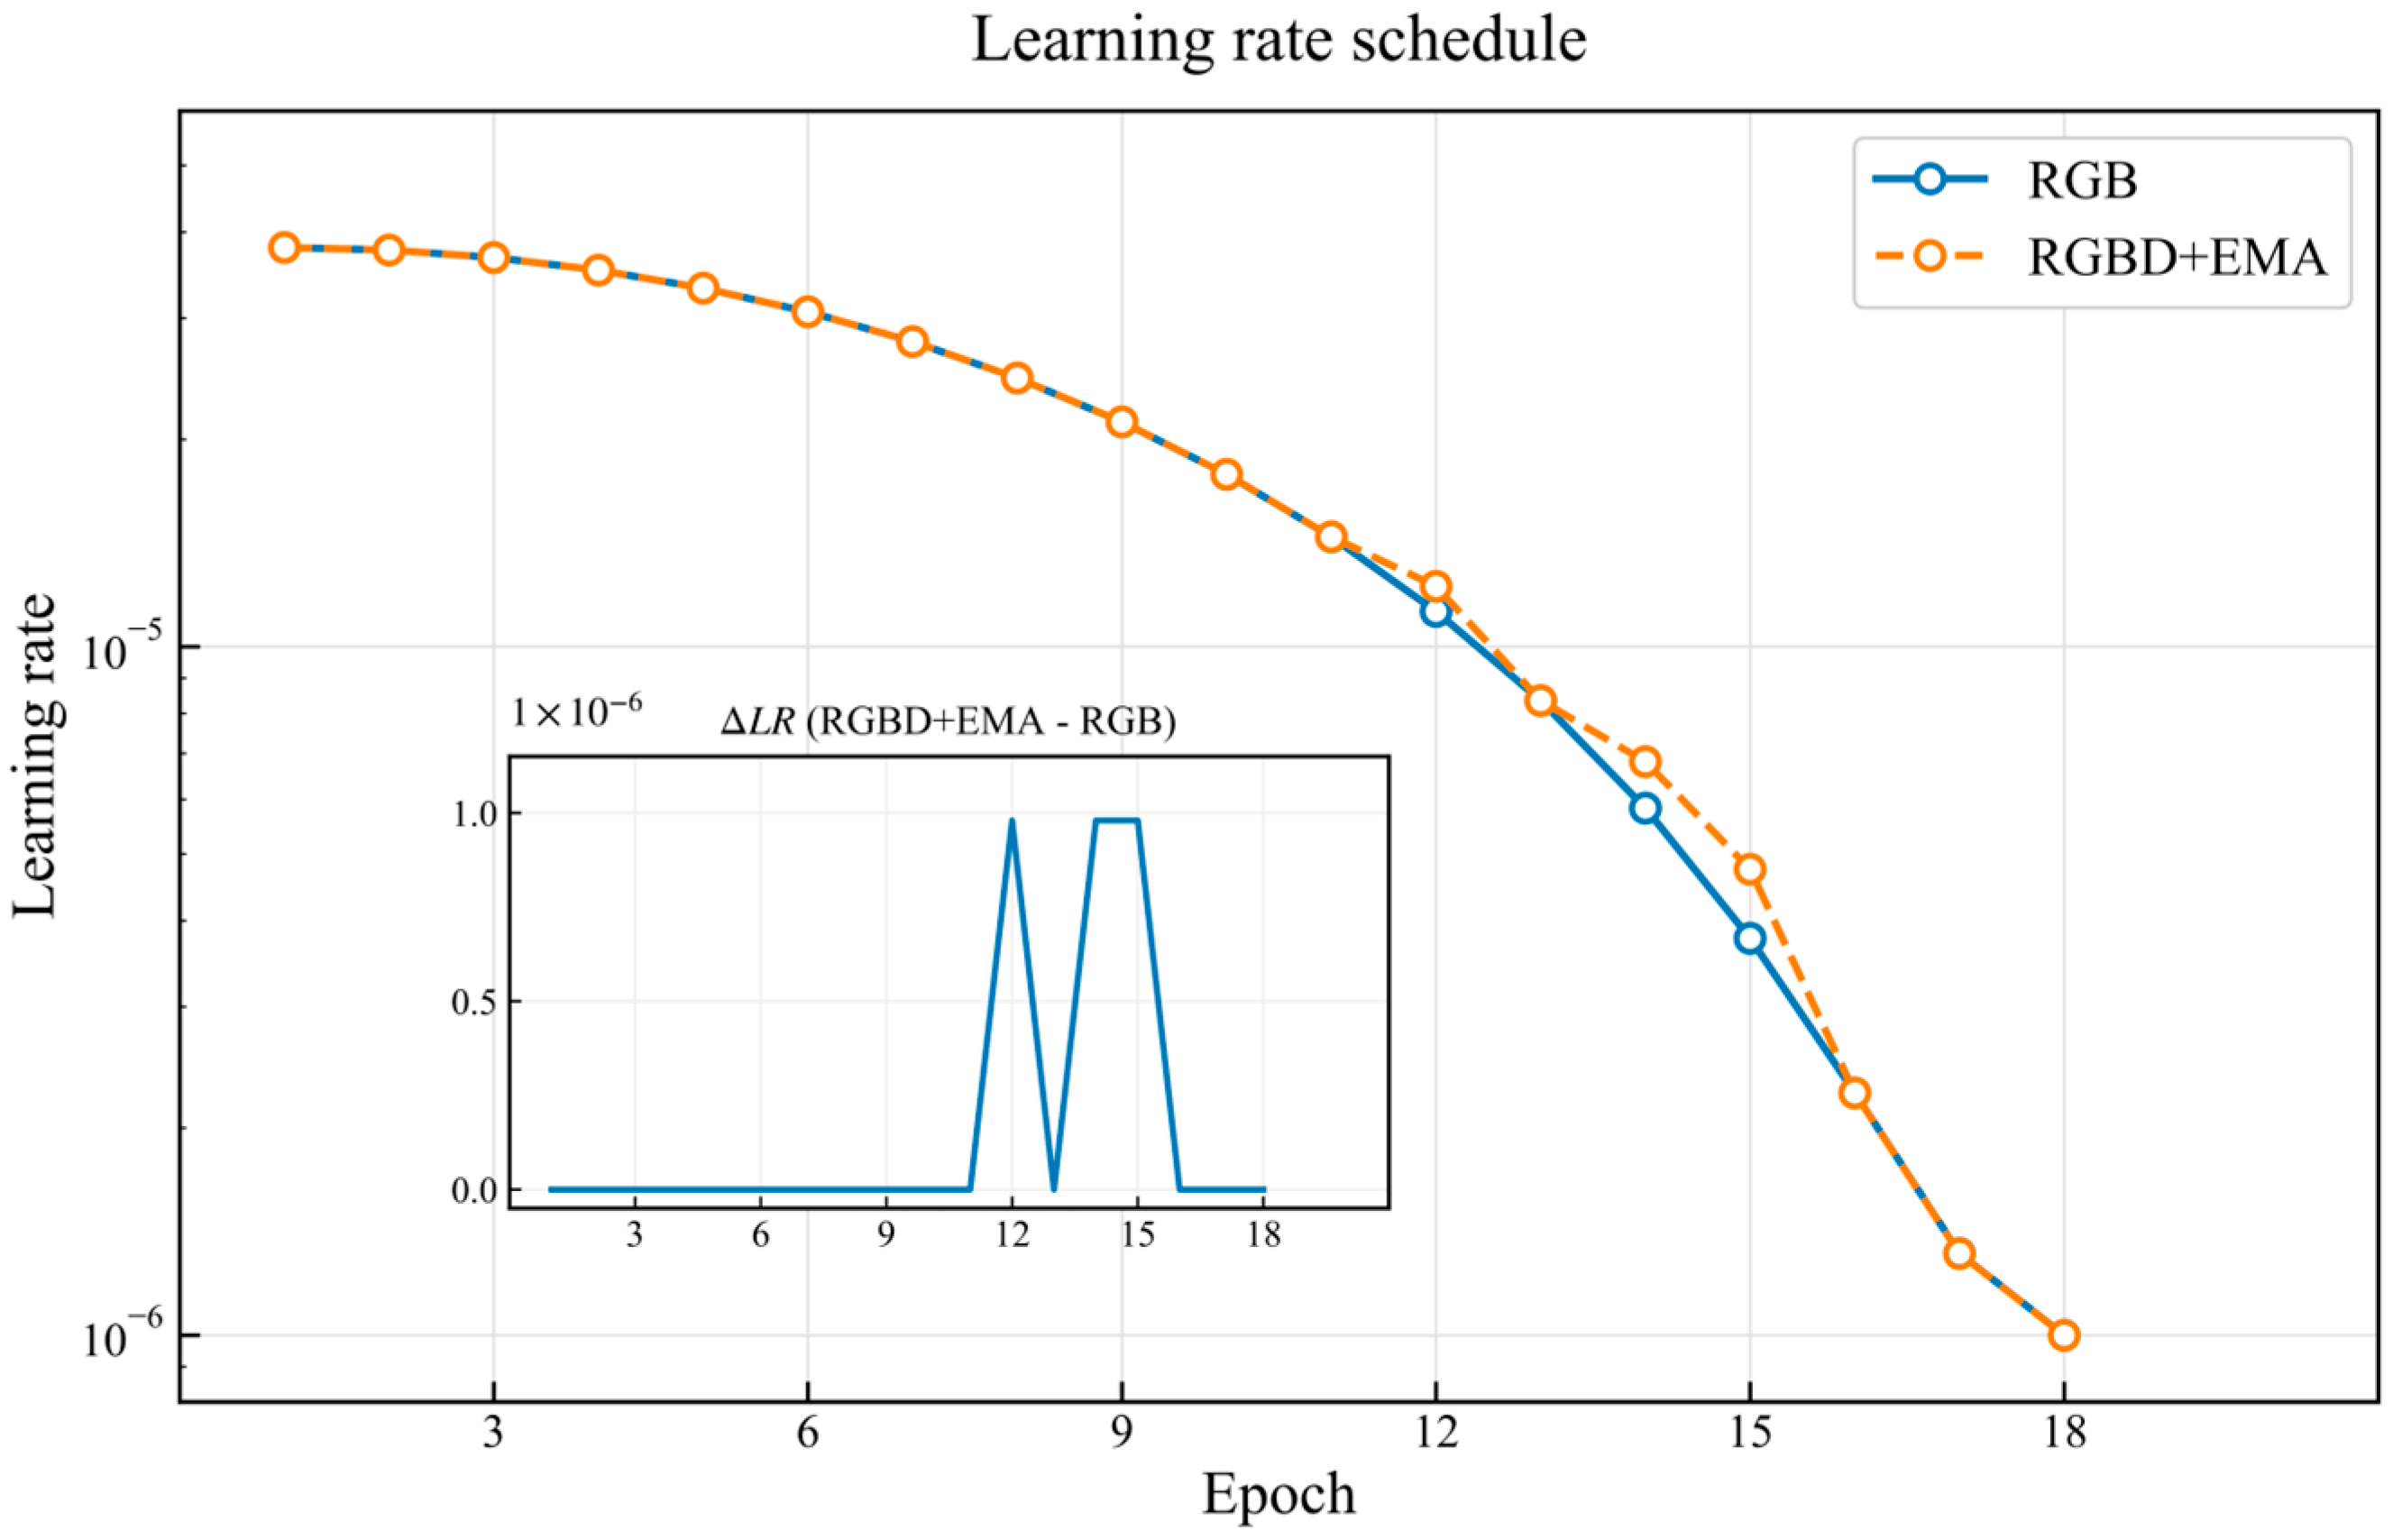
Both the RGB baseline and the RGBD + EMA model adopt the same learning-rate decay schedule during training. The learning rate is gradually reduced as epochs progress, enabling parameter refinement with smaller step sizes in the later stage and thus improving convergence stability, as shown in Figure 5. Overall, the two learning-rate curves almost completely overlap throughout most of the training process, indicating that the optimization dynamics are comparable between the two experiments. Therefore, the observed performance differences are primarily attributable to changes in model architecture and input modality rather than discrepancies in learning-rate settings.
Figure 5.
Learning-rate schedules of the two methods.
To further verify the consistency of learning-rate evolution, the inset in Figure 5 plots the difference . It can be seen that remains close to zero for the vast majority of epochs, with only minor fluctuations at a few epochs, which may arise from logging precision or the sampling strategy for step-wise updates. These variations do not affect the overall conclusion: both experiments follow an identical learning-rate schedule under a fair comparison protocol. Consequently, the subsequent performance improvements can be attributed to the enhanced feature representations enabled by RGBD inputs and the EMA strategy, rather than to biased training hyperparameters.
5.4. Overall Performance Comparison
To evaluate the overall performance of the proposed method on the cross-view visual geo-localization task, we conduct a comprehensive comparison from three aspects: retrieval accuracy measured by Recall@K (Table 1), spatial consistency and ranking quality measured by SDM@K and AP (Table 2), and localization error measured by Dis@K (Table 3).
Table 1.
Comparison of Recall@K under different methods.
Table 2.
Comparison of SDM@K and AP under different methods.
Table 3.
Comparison of Dis@K under different methods.
Retrieval accuracy is the most fundamental and critical evaluation criterion in cross-view visual geo-localization, as it reflects the model’s ability to retrieve the correct geographic target from a set of candidate results.
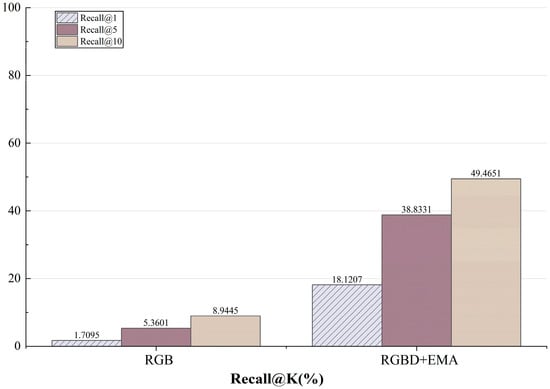
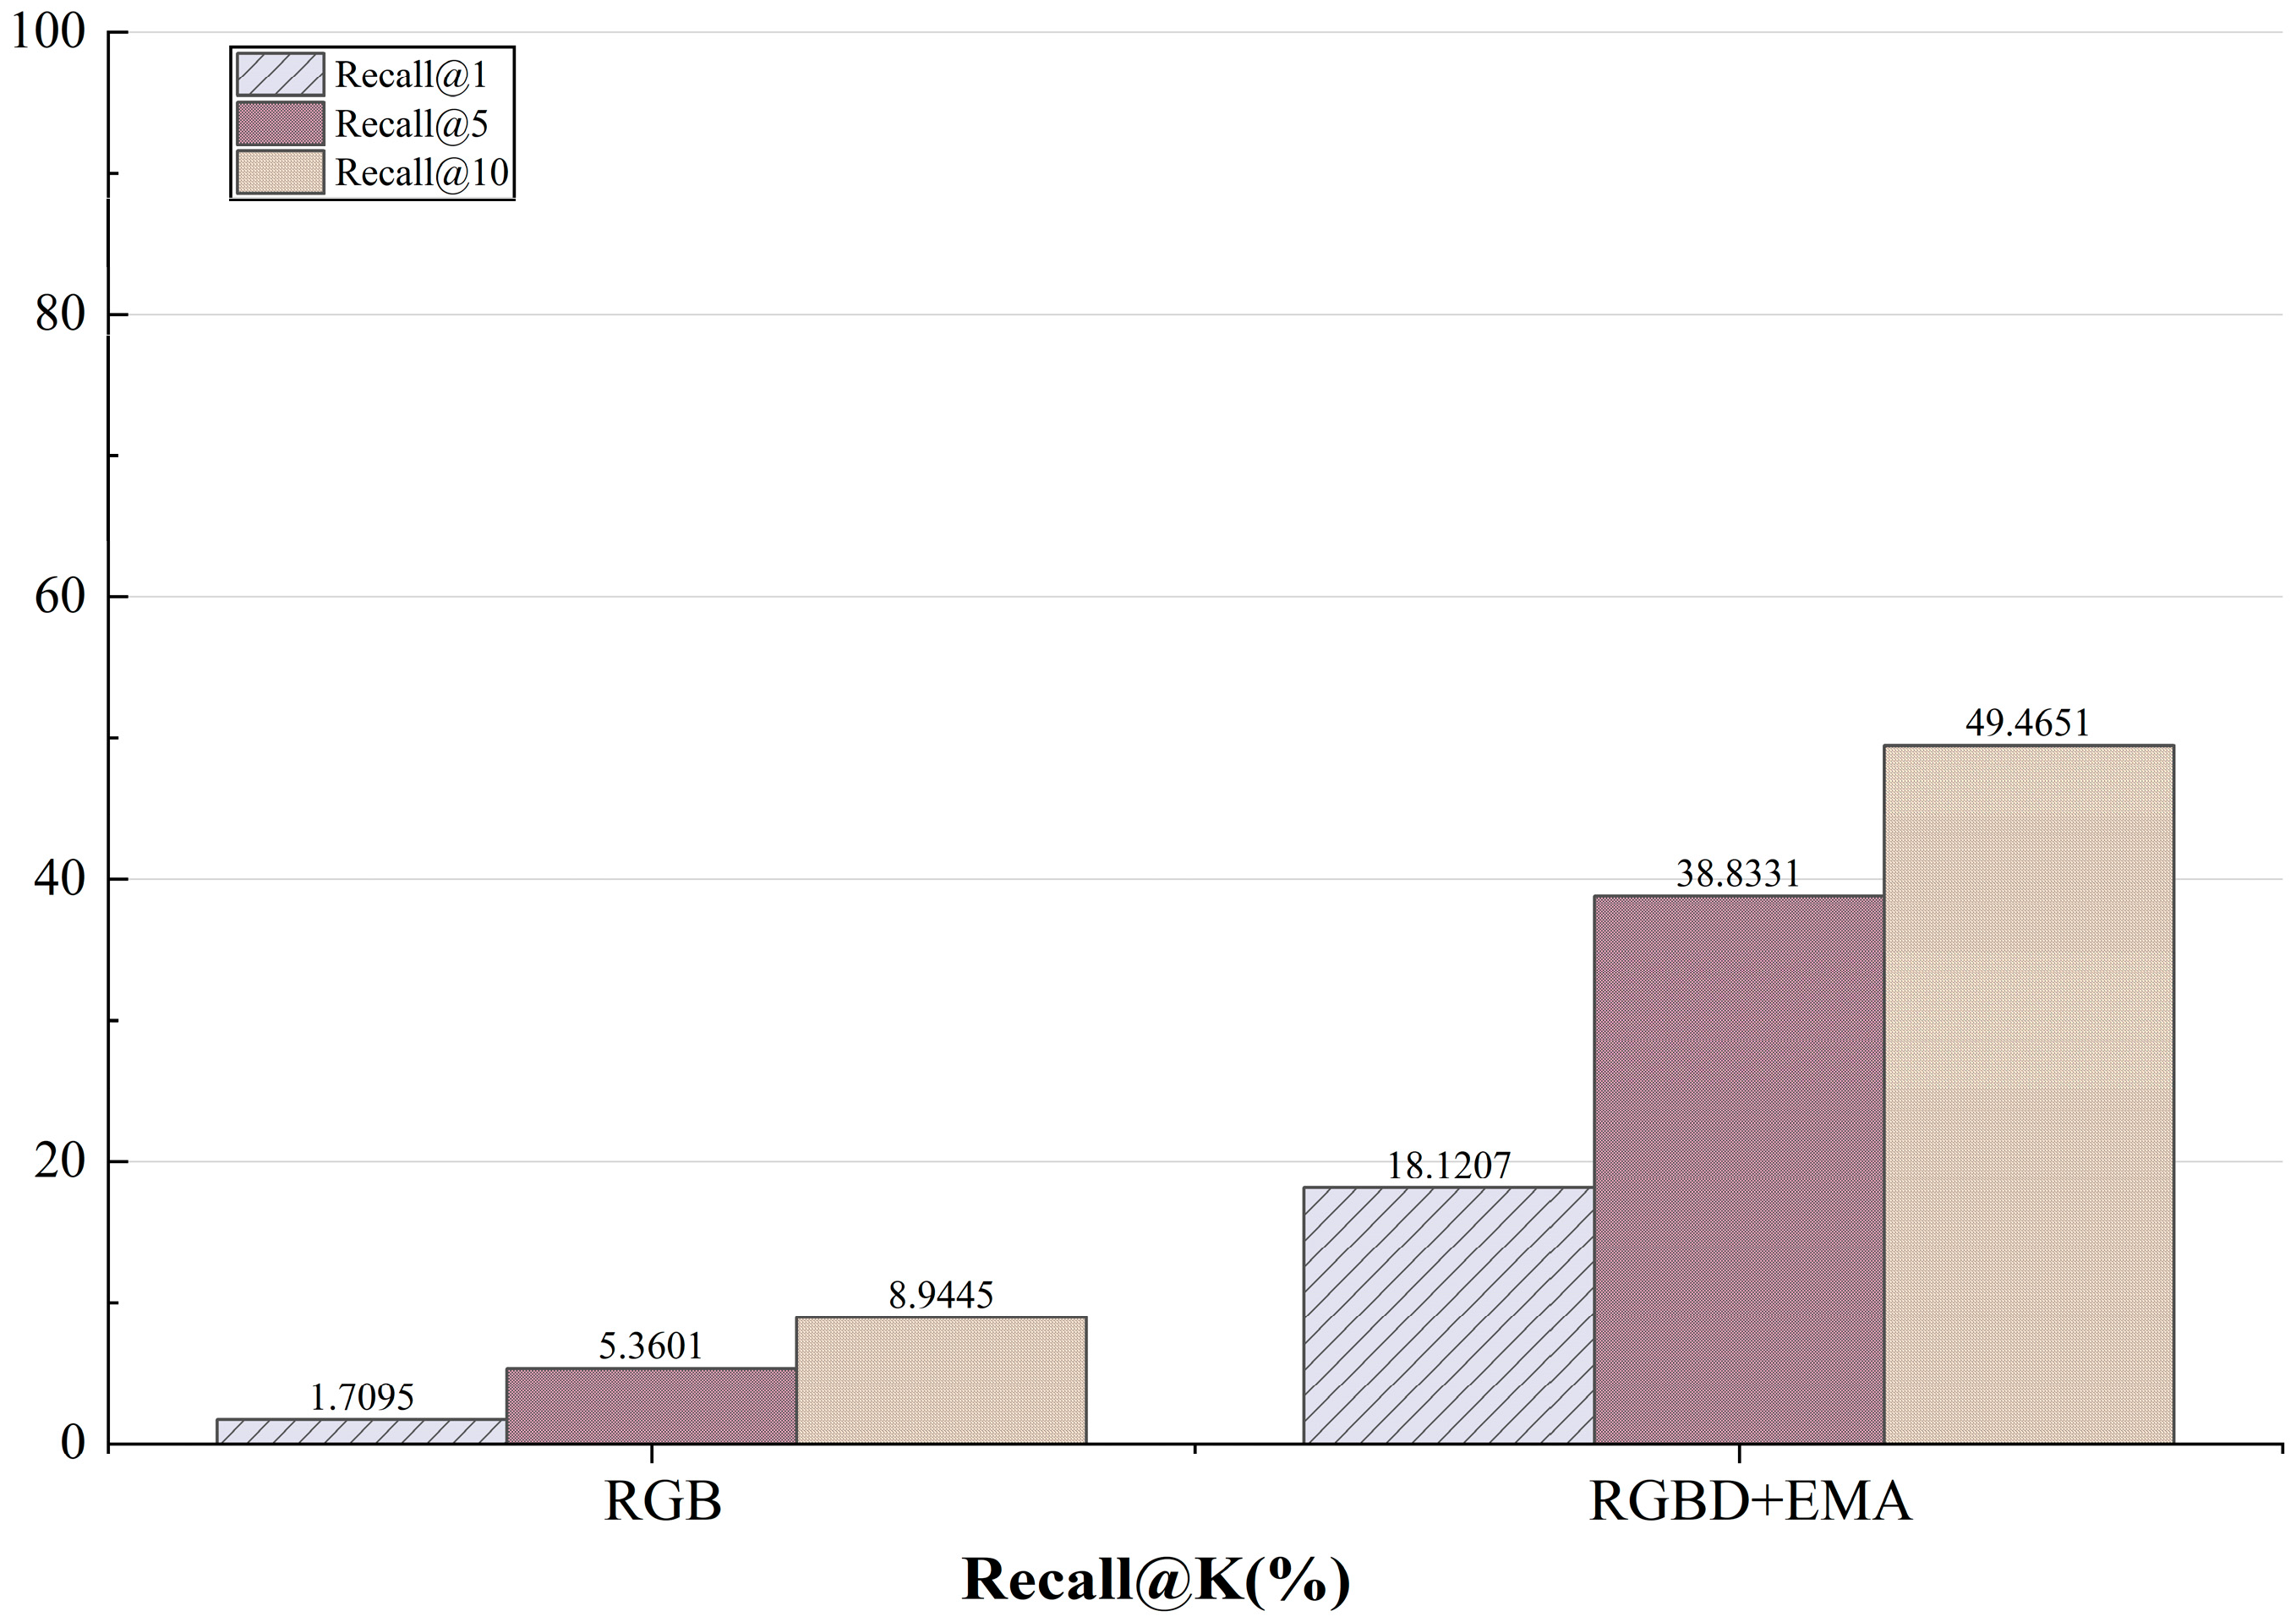
The comparison results of Recall@K are shown in Figure 6. Overall, RGBD + EMA consistently outperforms the RGB baseline across all values, indicating that the proposed method can more reliably rank the correct match among the top retrieved candidates. Taking the more stringent Recall@1 as an example, the RGB baseline achieves 1.71%, whereas RGBD + EMA reaches 18.12%, corresponding to an absolute gain of 16.41 percentage points (approximately a 10.6× improvement over the baseline). As increases, Recall@5 improves from 5.36% to 38.83% (about 7.2×), and Recall@10 increases from 8.94% to 49.47% (about 5.5×). These results suggest that the proposed method not only substantially enhances the top-1 hit capability, but also systematically improves the overall ranking quality, allowing the correct match to maintain a higher position within a larger candidate set. The observed gains indicate that incorporating depth information strengthens the model’s ability to distinguish geometric structures, while the EMA-based spatial enhancement further improves cross-scale consistency and local structural sensitivity, thereby alleviating matching difficulties caused by viewpoint changes, scale variations, and partial occlusions in cross-view scenarios.
Figure 6.
Comparison results of Recall@K.
However, Recall@K alone is insufficient to fully characterize the practical utility of a geo-localization method. For geo-localization tasks, the spatial concentration of retrieved candidates (SDM) and the geographic distance error between predictions and ground truth (Dis) are more direct engineering-oriented indicators.
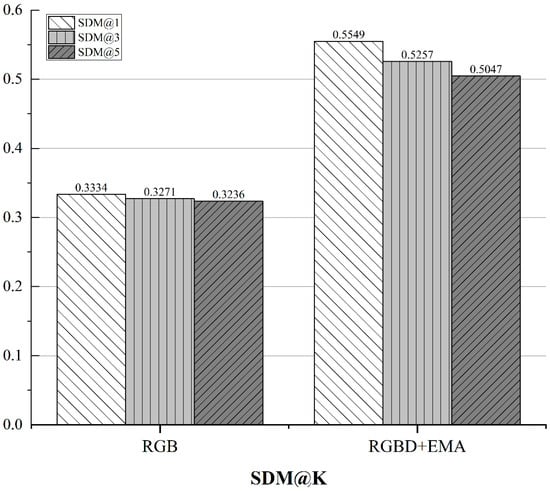
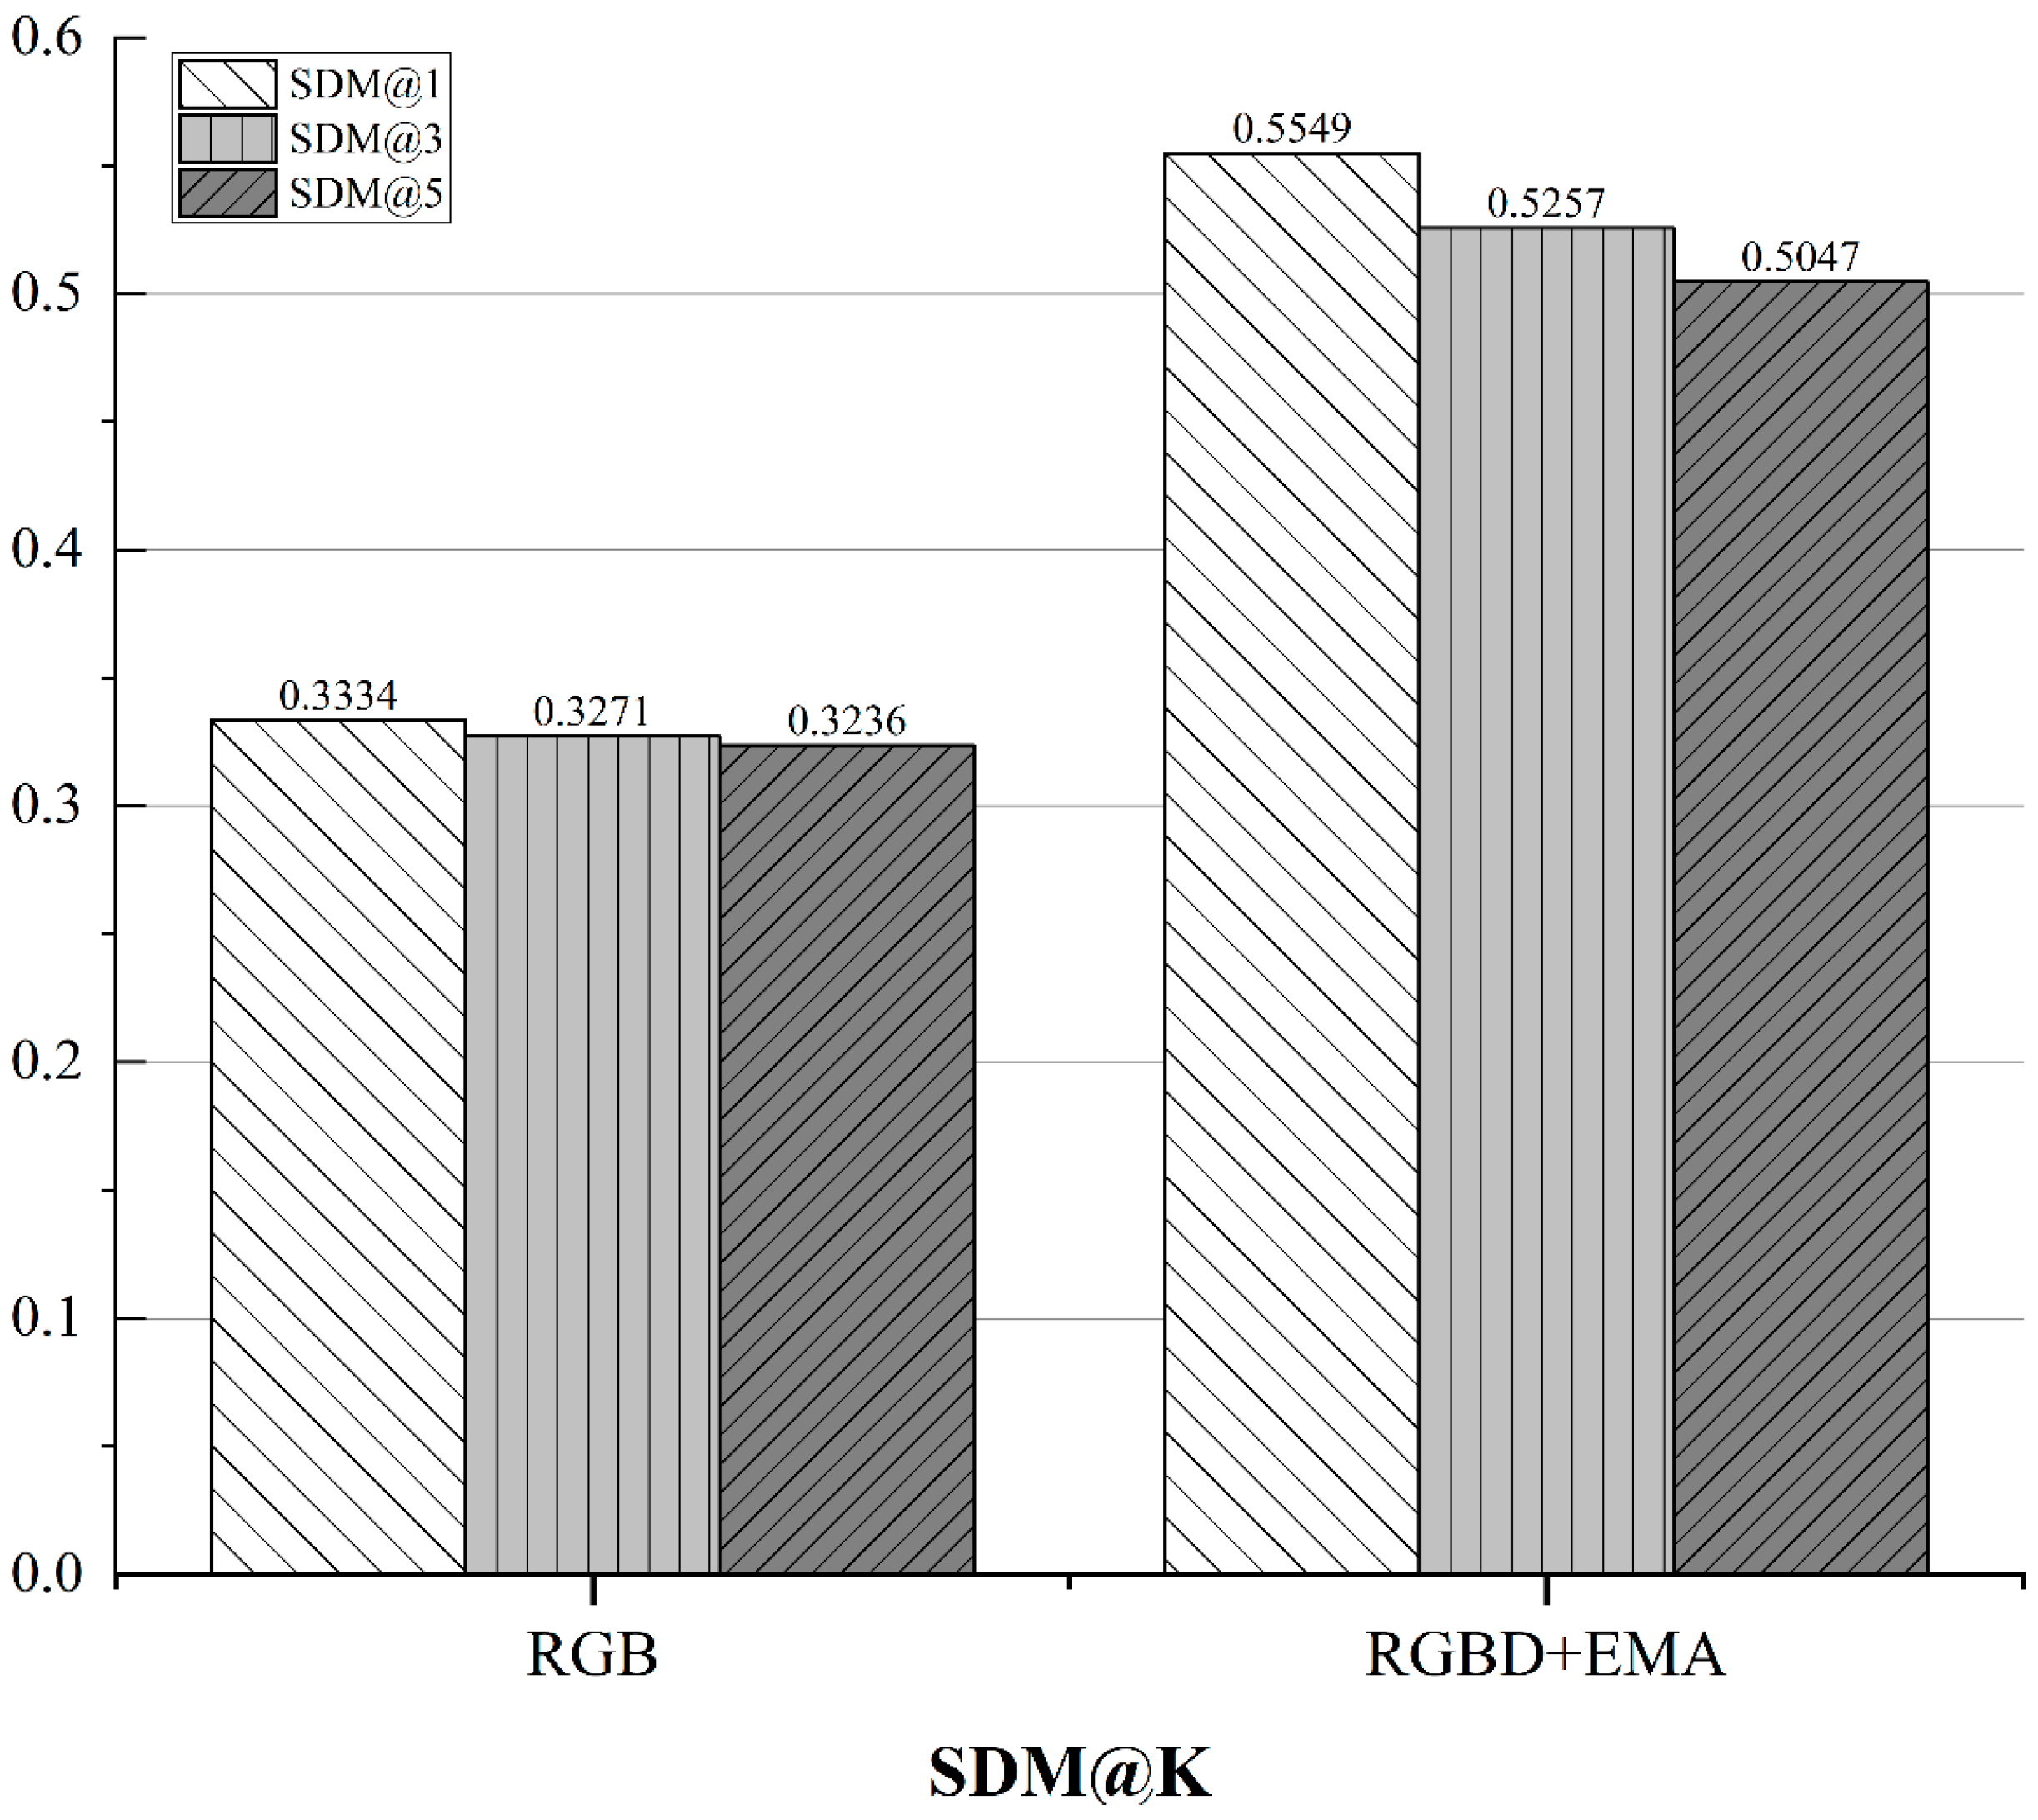
The comparison results of SDM@K are presented in Figure 7. RGBD + EMA consistently outperforms the RGB baseline on SDM@1, SDM@3, and SDM@5. In particular, SDM@1 increases from 0.3334 to 0.5549 (an absolute gain of 0.2215), indicating that the retrieved candidates produced by the proposed method are more geographically concentrated and spatially consistent. This suggests that the model not only retrieves relevant matches, but also tends to return candidates within the correct geographic neighborhood, which is more favorable for practical deployment.
Figure 7.
Comparison results of SDM@K.
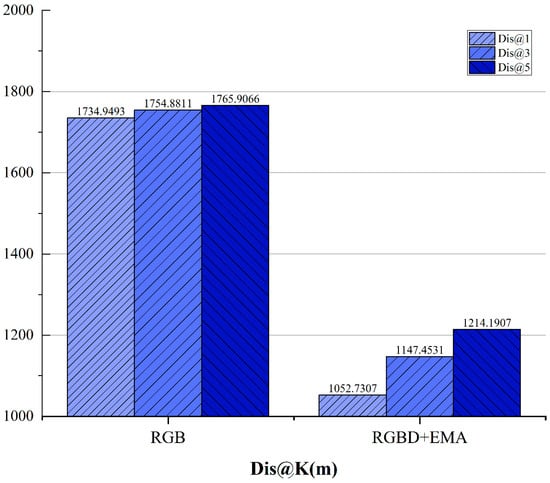
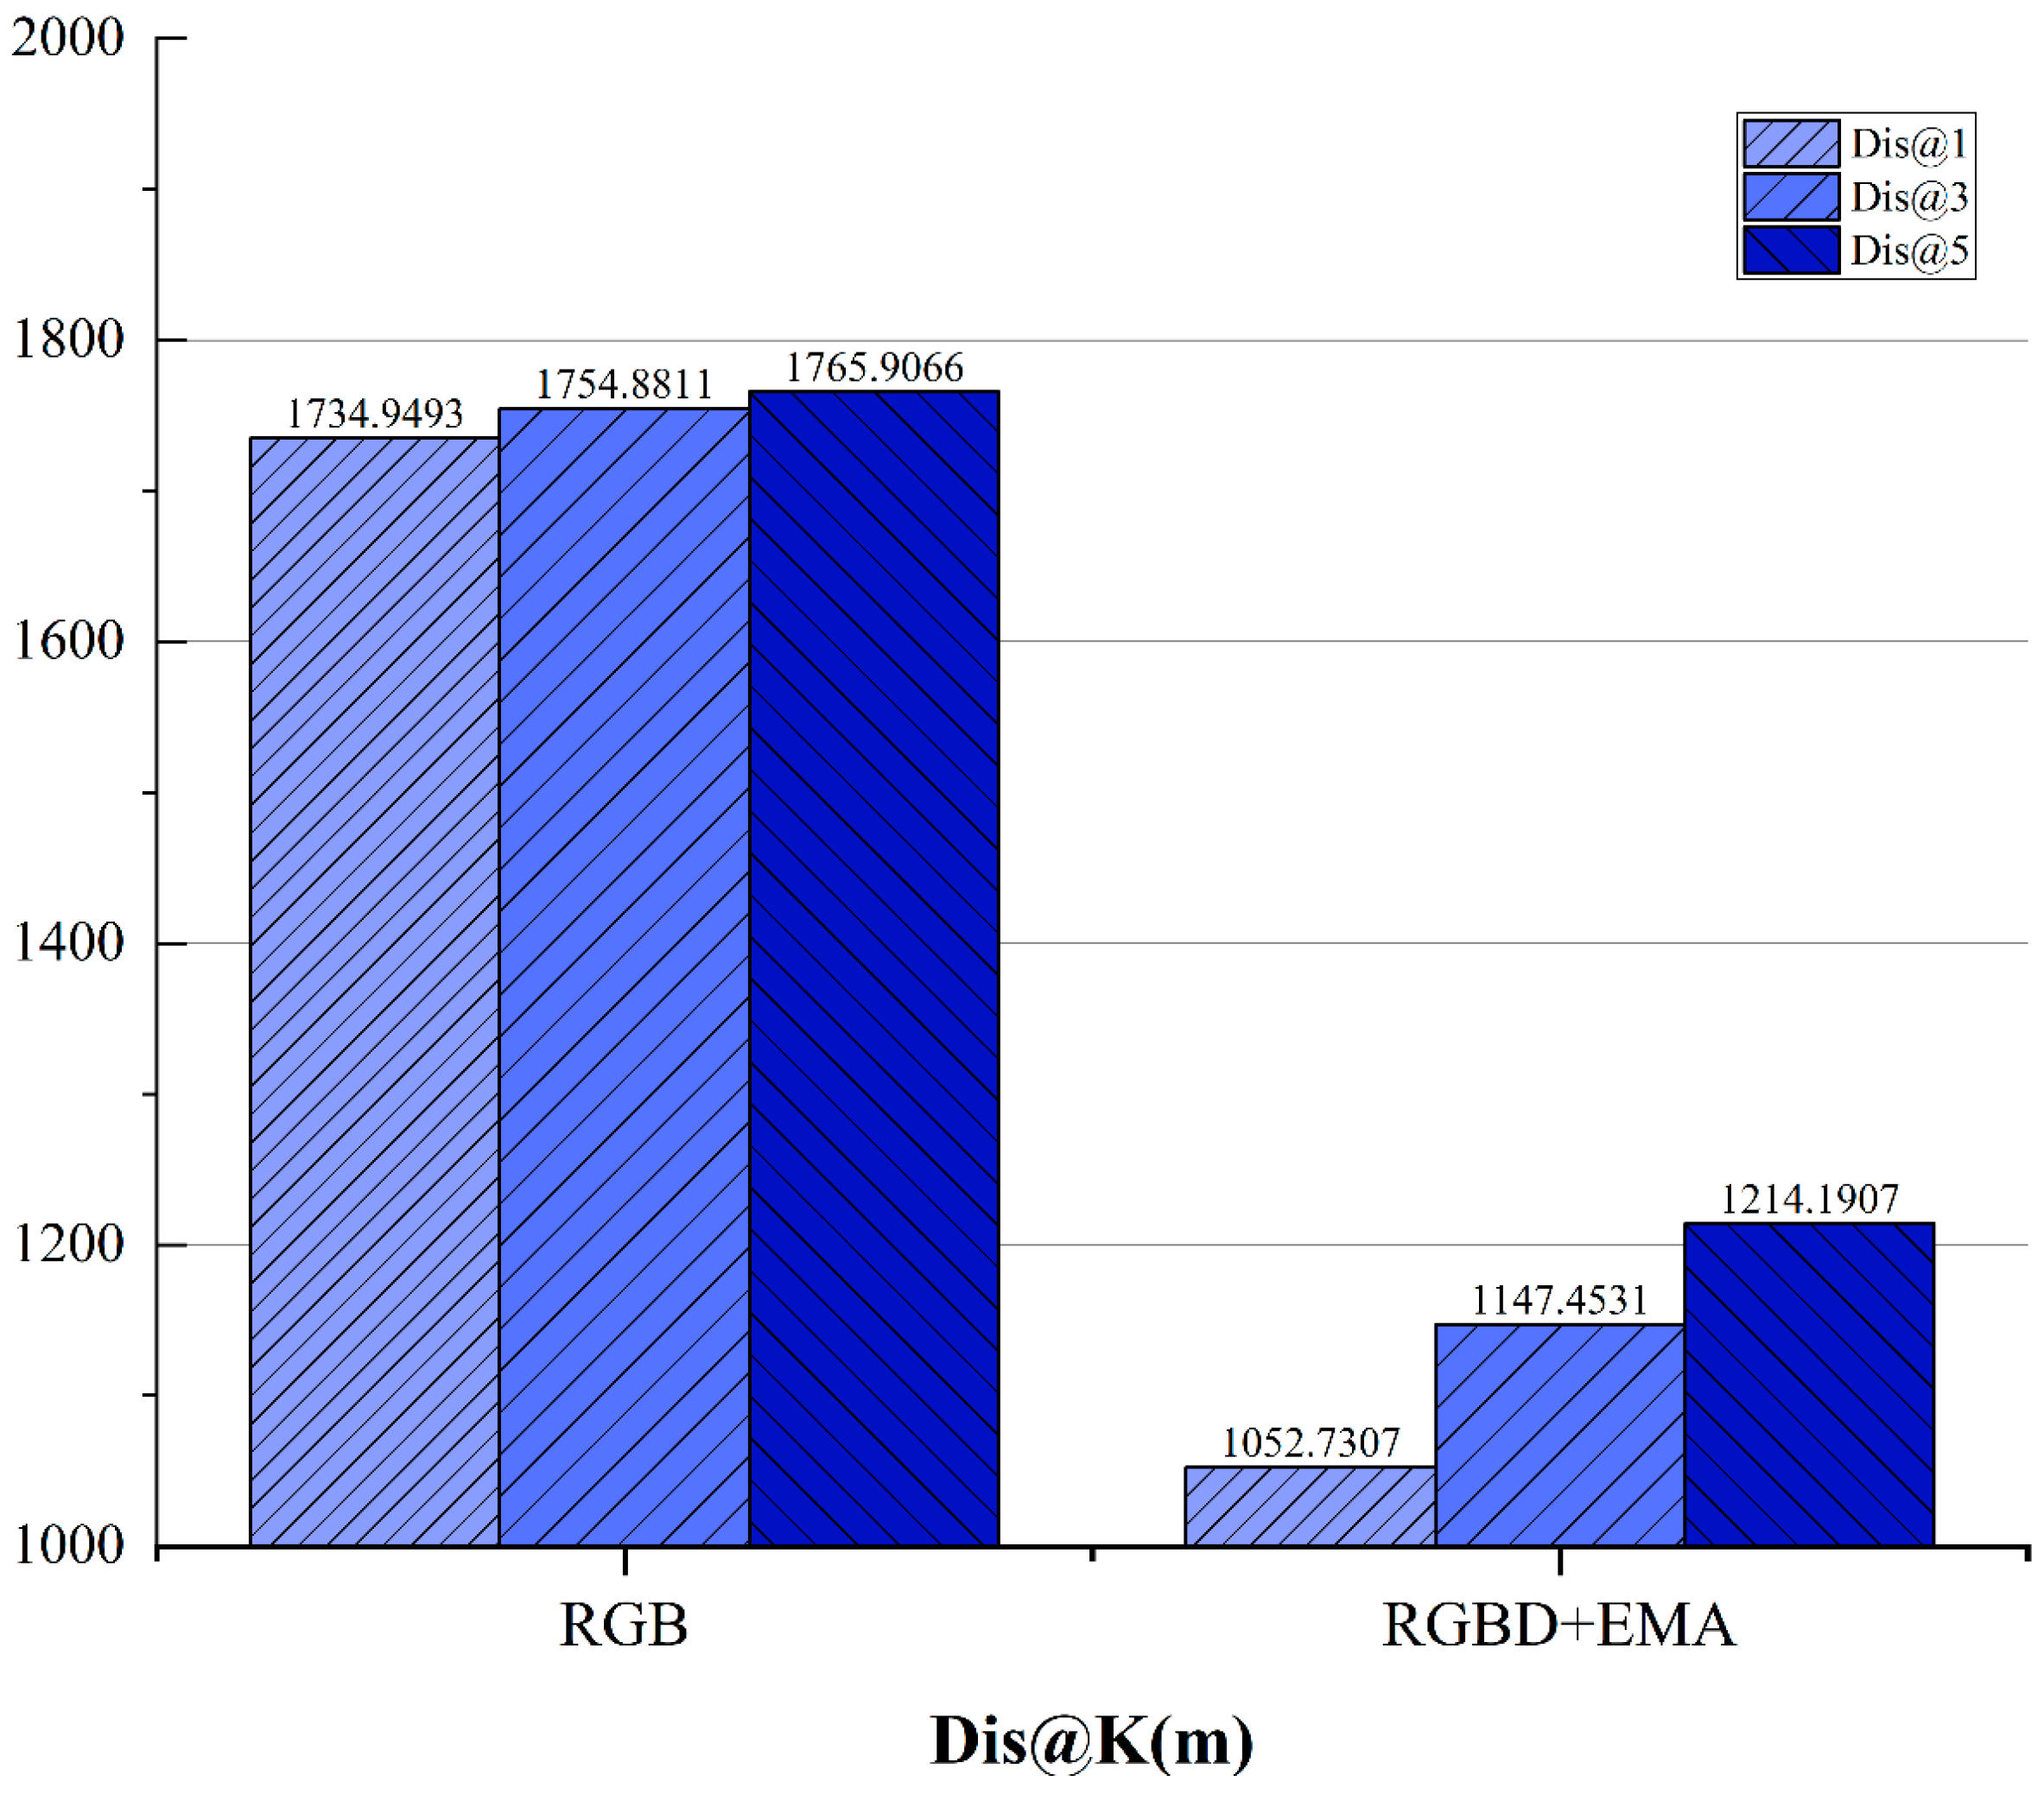
The comparison results of Dis@K are shown in Figure 8. RGBD + EMA achieves substantially lower localization errors across different values. Taking Dis@1 as an example, the mean error decreases from 1734.95 m to 1052.73 m, corresponding to a reduction of approximately 682.22 m (about 39.3%). Dis@3 and Dis@5 exhibit similarly clear downward trends. These results demonstrate that the proposed method improves localization accuracy in physical geographic space, rather than merely producing numerical gains on ranking-based metrics.
Figure 8.
Comparison results of Dis@K.
By jointly considering SDM and Dis, it can be concluded that RGBD + EMA not only increases retrieval hit rates, but also significantly enhances spatial stability and localization precision, validating the complementarity of multimodal fusion and spatial enhancement strategies.
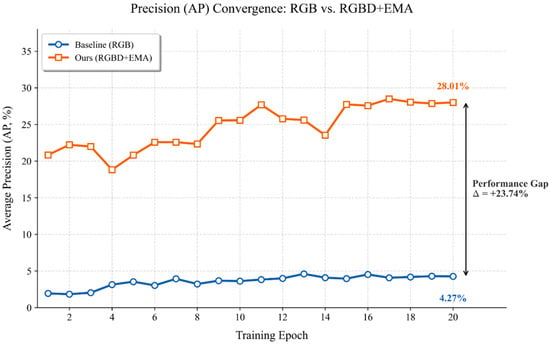
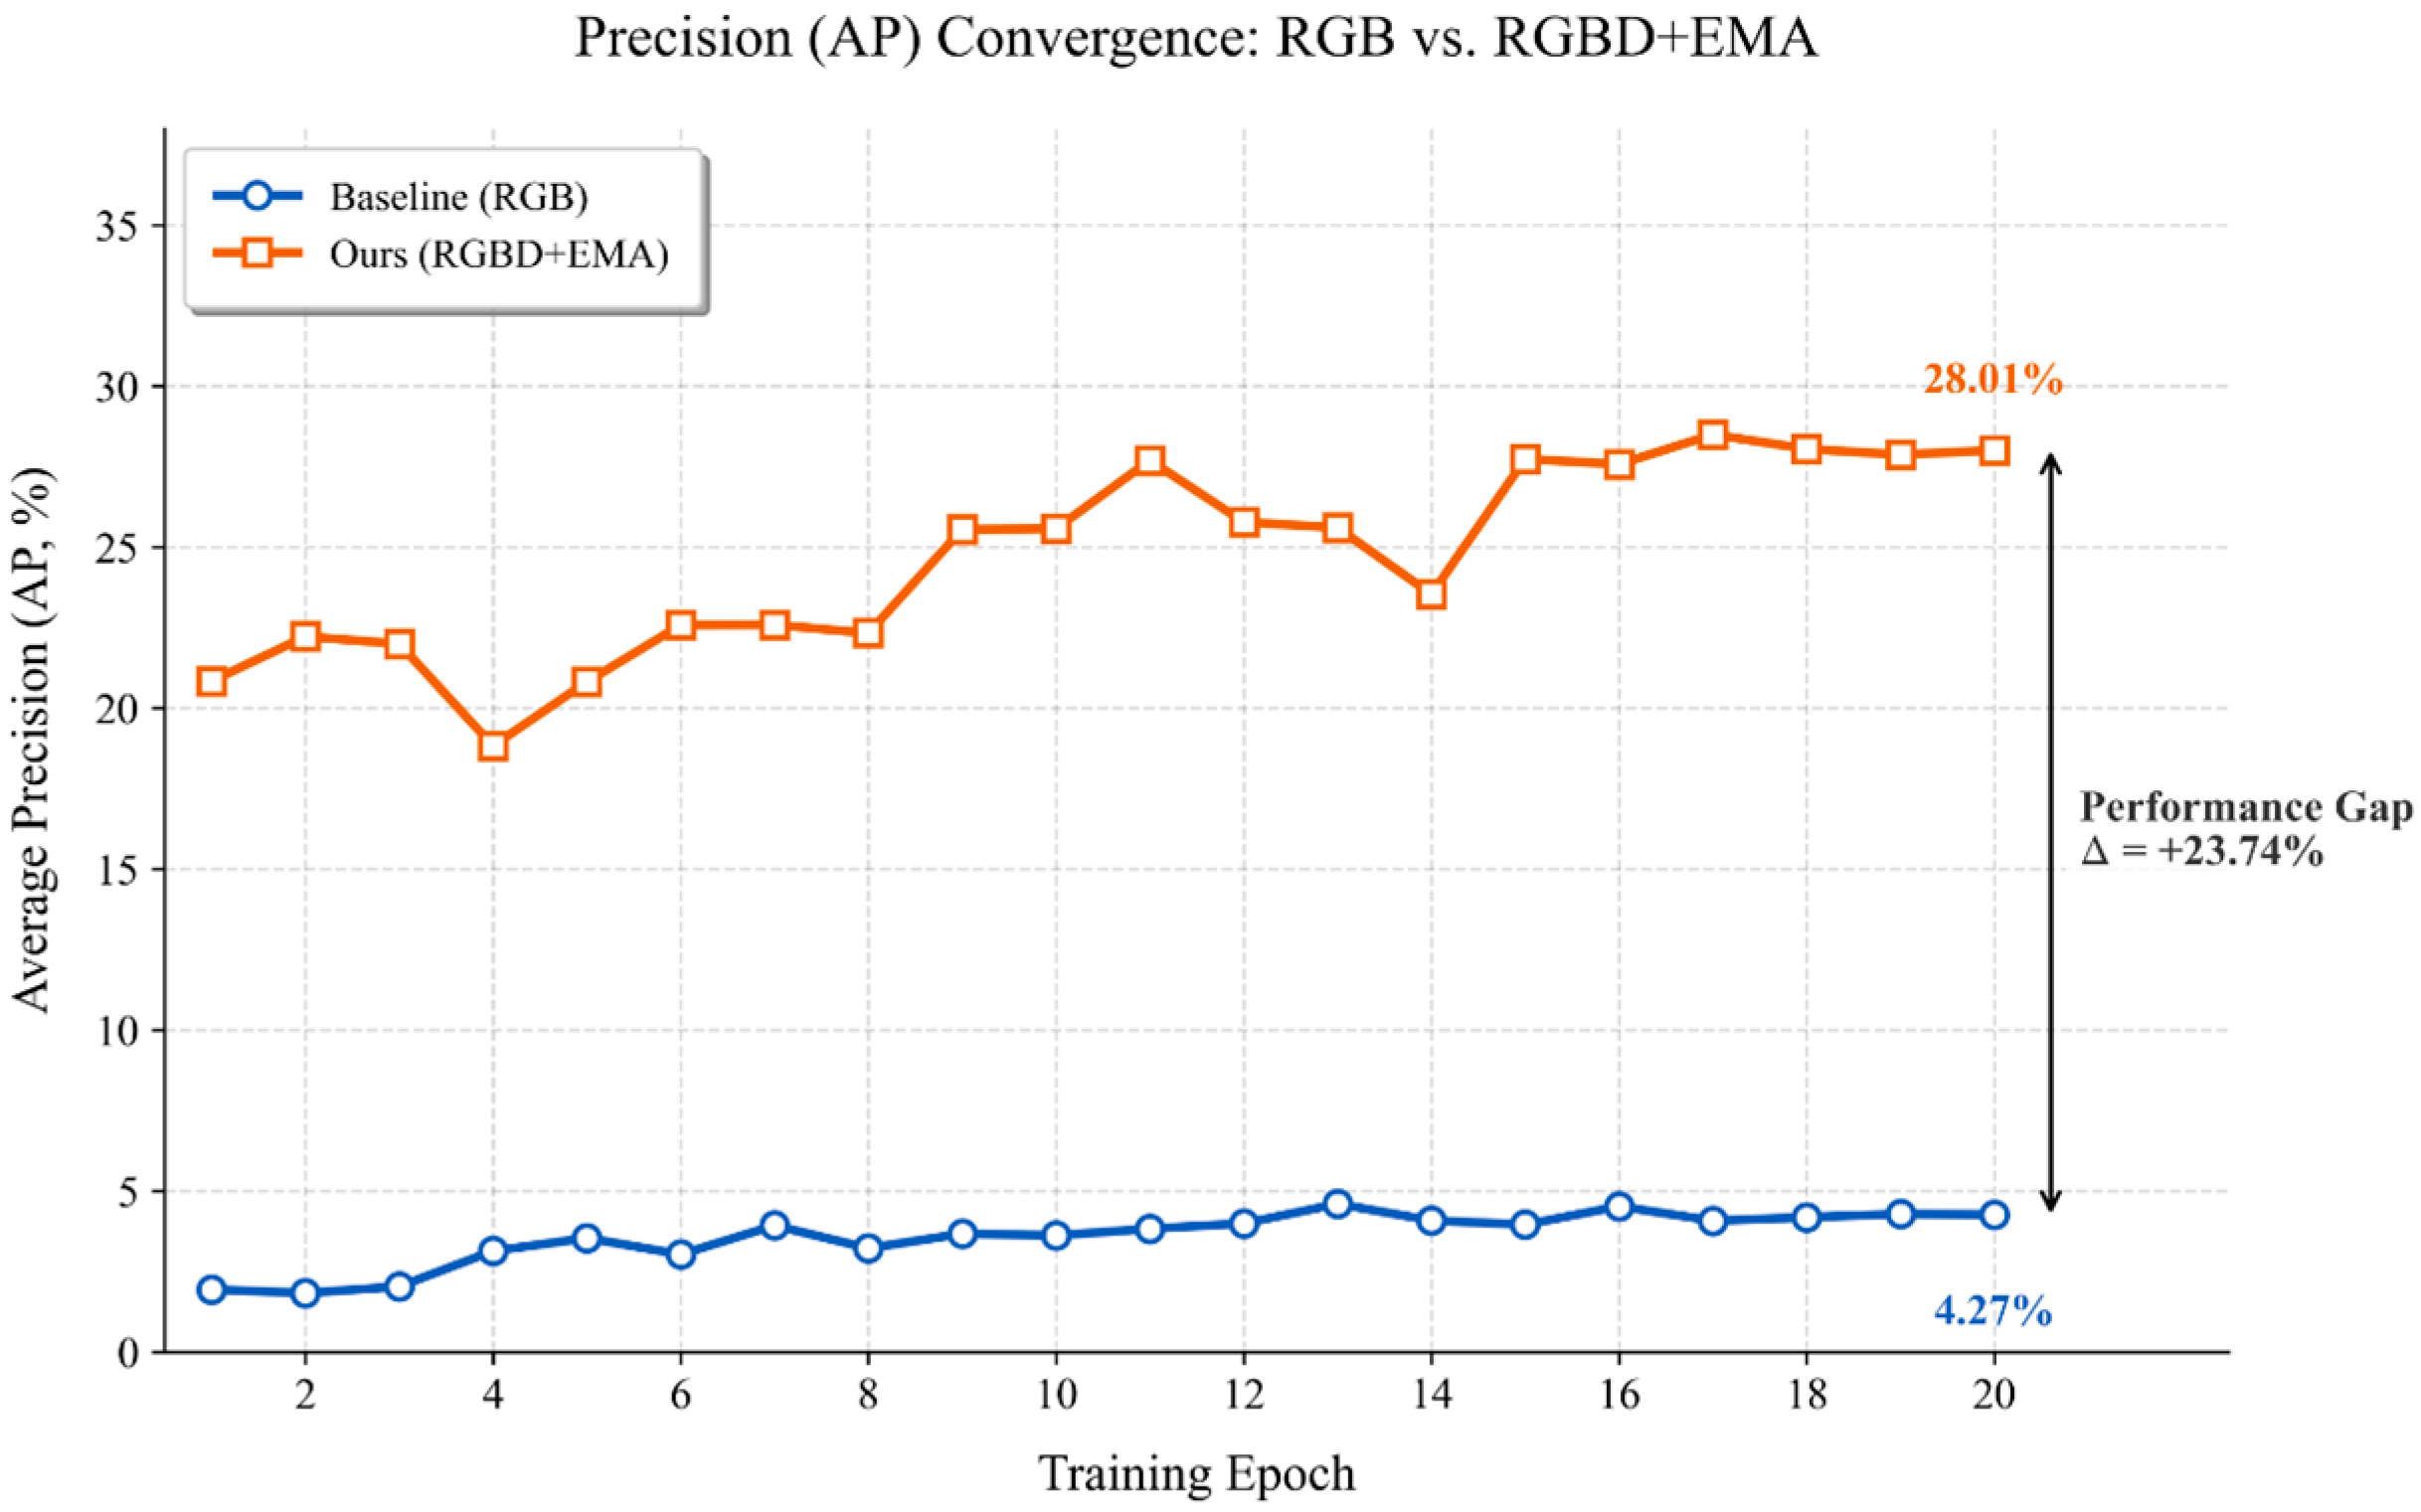
To further analyze the evolution of ranking capability during training, we report the validation AP curve as a function of training epochs in Figure 9. As can be observed, RGBD + EMA achieves a higher AP at an early stage and continues to improve throughout training before gradually converging, suggesting that multimodal fusion and EMA enhancement help the embedding space form a more effective ranking structure more quickly while also improving training stability.
Figure 9.
AP versus training epoch for the two methods on the GTA-UAV dataset.
In contrast, the RGB baseline maintains a substantially lower AP level throughout training with only marginal improvement, indicating that relying solely on RGB appearance cues is insufficient to learn a stable and discriminative ranking structure under severe cross-view discrepancies. Consistent with the final AP values reported in Table 2, RGBD + EMA increases AP from 4.27 to 28.01 (an absolute gain of 23.74, approximately 6.6× over the baseline). Moreover, the AP level observed at the final stage of Figure 9 aligns well with the quantitative results in Table 2, which helps avoid potential concerns about inconsistency between curves and tabulated evaluations and further strengthens the credibility of the reported findings.
5.5. Comparison with State-of-the-Art Methods and Cross-Architecture Generalizability
First of all, to comprehensively evaluate the effectiveness of our proposed modules and address the inherent challenges of the GTA-UAV dataset, we compared our pure RGB baseline and the full RGBD + EMA framework with state-of-the-art (SOTA) cross-view geo-localization models, including TransGeo and Game4Loc, as shown in Table 4. It is worth noting that the standard ViT baseline relying solely on RGB inputs exhibits a relatively low Recall@1 of 1.71%. This limited performance stems from the severe viewpoint discrepancies, scale variations, and lack of explicit 3D structural constraints in the GTA-UAV dataset, causing pure Vision Transformers to easily fall into appearance ambiguities without localized inductive biases. While heavily optimized models like Game4Loc achieve the highest absolute performance due to their highly specialized fine-grained dense matching mechanisms, our proposed fusion framework provides an extraordinary relative performance boost, improving the Recall@1 of the standard ViT baseline by over 10 times (from 1.71% to 18.12%), clearly demonstrating the crucial necessity of injecting geometric depth priors.
Table 4.
Quantitative comparison and cross-architecture generalization on the GTA-UAV dataset.
Furthermore, our proposed modules (Depth prior and EMA) exhibit strong cross-architecture generalizability for standard pure-Transformer models. Specifically, when our modules are seamlessly integrated into TransGeo (denoted as TransGeo + Depth + EMA), the model achieves further improvements, boosting Recall@1 from 26.93% to 28.10% and reducing the Dis@1 error from 788.54 m to 738.02 m. We also note that integrating these modules into Game4Loc resulted in a performance drop, which occurs because Game4Loc inherently relies on an extremely specialized feature alignment mechanism; imposing an explicit geometric prior causes structural feature conflict and redundancy. Collectively, these findings suggest that our lightweight multimodal enhancements are particularly highly suited for compensating the structural awareness deficiencies of standard Vision Transformers, offering a scalable and principled improvement for cross-view localization tasks.
5.6. Ablation Study on Multimodal Fusion Approaches
To thoroughly validate the necessity of our multimodal fusion strategy and isolate the individual contributions of each component, we decoupled the depth geometry prior and the EMA module. The comparative results of these different controlled combinations are summarized in Table 5.
Table 5.
Ablation study of different multimodal fusion approaches.
By introducing only the explicit Depth modality (RGB+Depth), the Recall@1 significantly improves to 14.99%, indicating the strong benefit of geometric priors. Similarly, integrating only the EMA module (RGB+EMA) yields 14.35%, effectively enhancing local scale adaptability. Ultimately, the optimal multimodal alignment is achieved by our full RGBD + EMA framework (18.12%). This clearly demonstrates that while isolated modalities bring substantial independent improvements, our tailored fusion mechanism successfully couples spatial geometry with multi-scale semantic textures to maximize localization performance.
5.7. Qualitative Results and Visualization
To further investigate how the proposed depth modality and EMA module enhance the model’s discriminative capability, we provide qualitative retrieval results and attention visualizations using Grad-CAM.
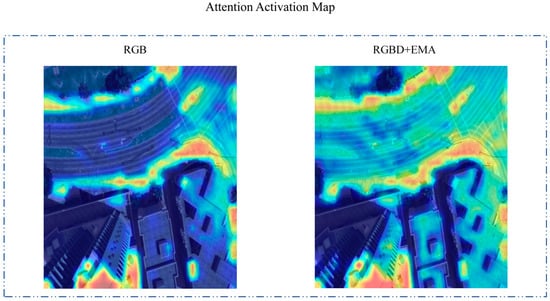
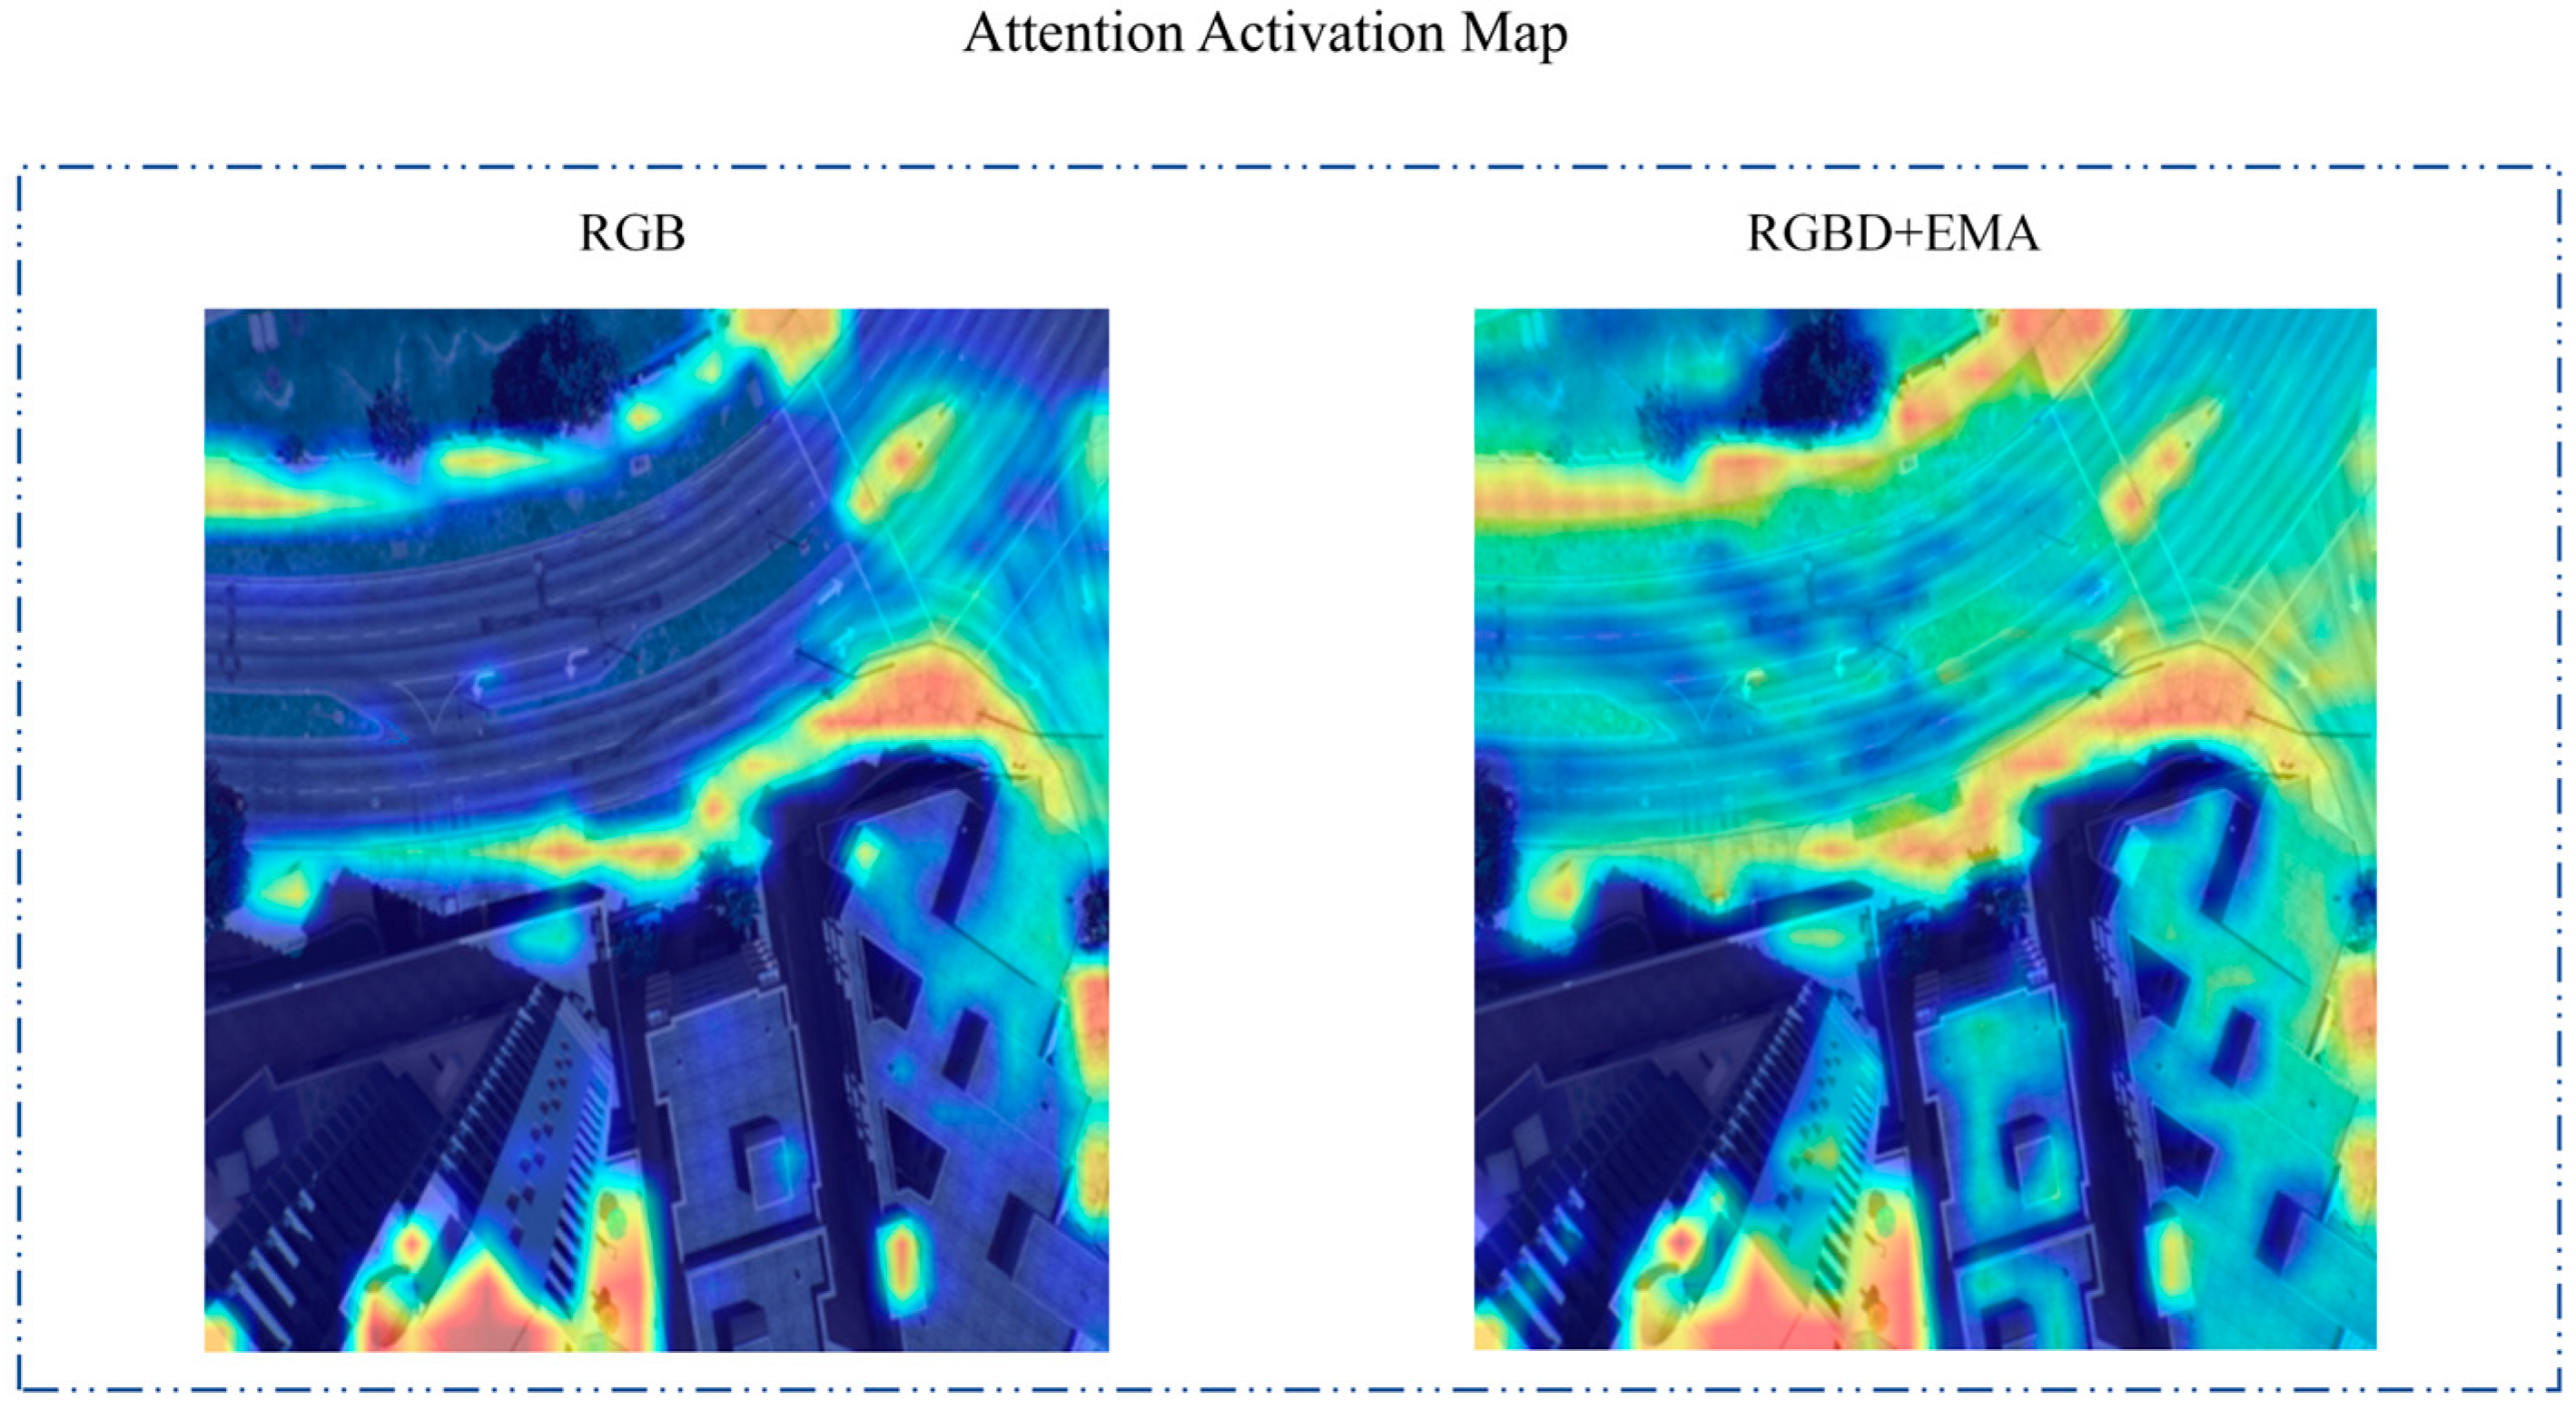
Attention activation maps are shown in Figure 10. Compared to the RGB-only baseline, our RGBD + EMA framework generates a much more focused activation map. In the baseline model, the attention is often scattered across irrelevant background textures or fluctuating lighting areas. In contrast, by incorporating depth-guided geometric priors and multi-scale attention, our model consistently prioritizes structurally salient regions, such as building silhouettes, roof ridges, and prominent road networks. These geometric features are significantly more stable than color and texture when dealing with severe viewpoint and scale changes between UAV and satellite views.
Figure 10.
Attention activation map. Warmer colors (e.g., red and yellow) indicate higher attention weights and stronger structural responses, while cooler colors (e.g., dark blue) represent lower attention weights.
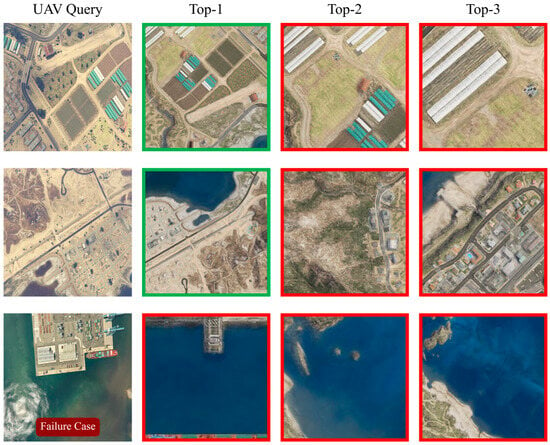
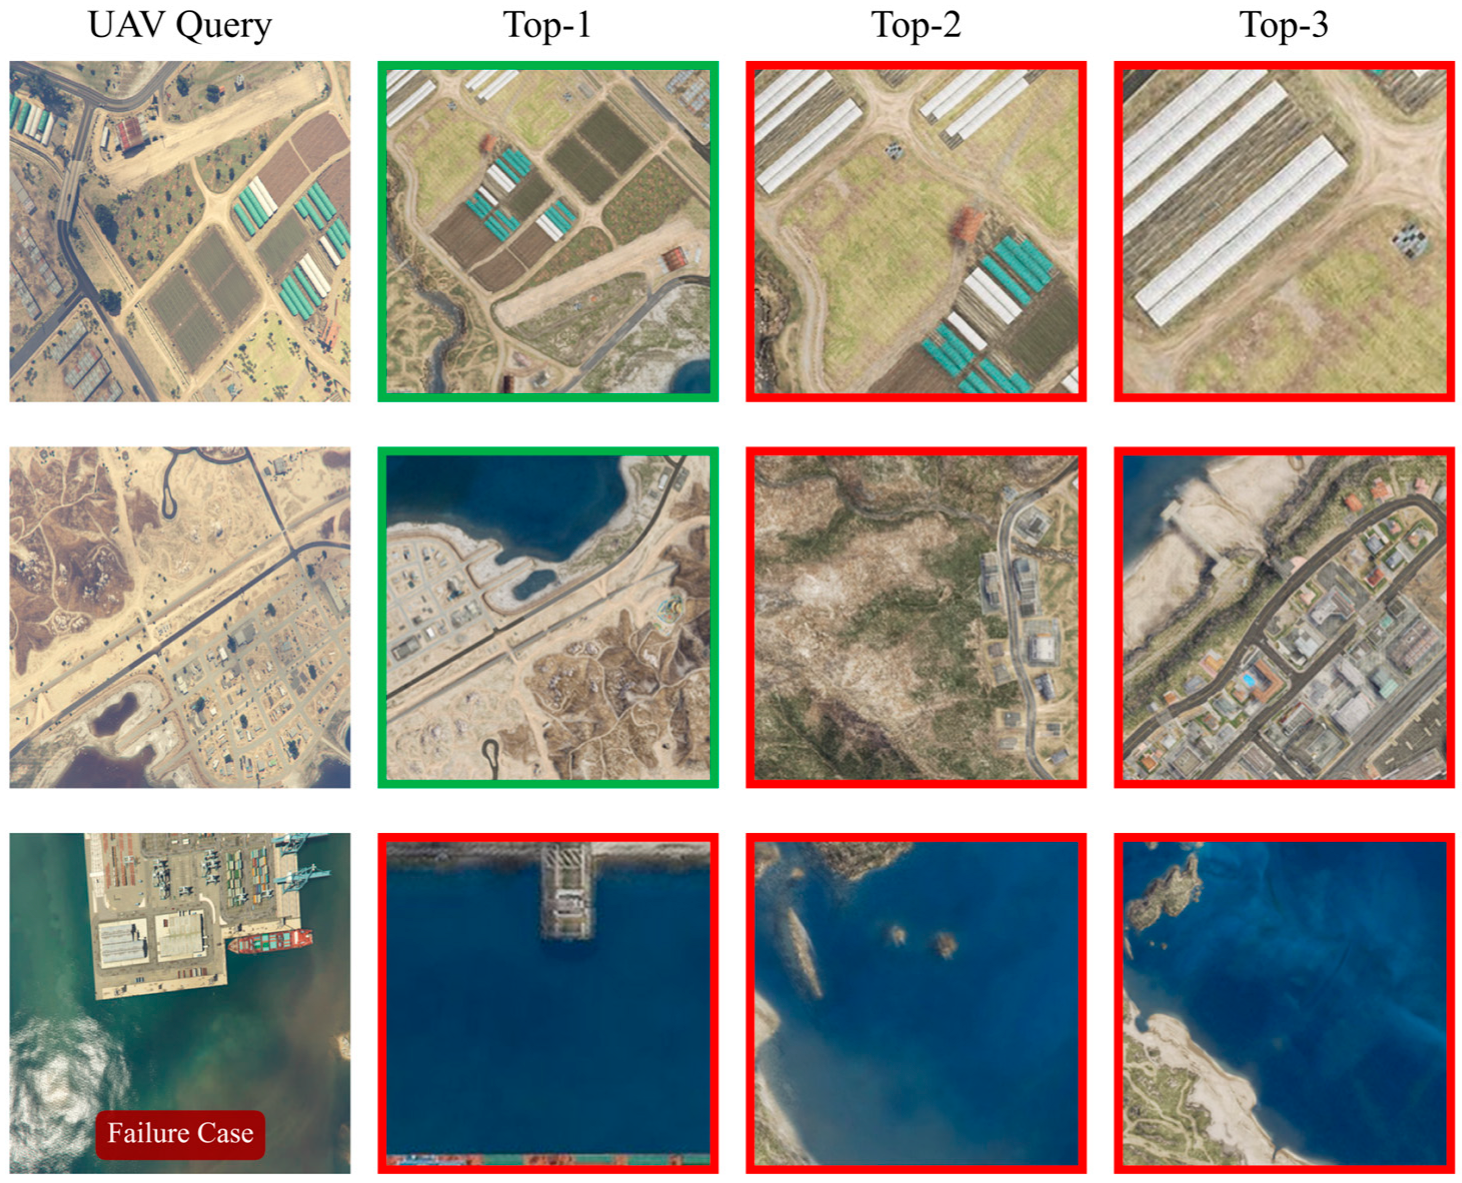
In Figure 11, representative retrieval examples are presented to evaluate the robustness of the proposed RGBD + EMA framework. The model demonstrates remarkable accuracy in complex urban scenes with dense structures, where the incorporated depth information provides clear vertical spatial cues that are often absent in RGB-only representations. However, certain retrieval failures are observed, typically occurring in regions characterized by highly repetitive or homogeneous textures, such as dense forest canopies or uniform agricultural fields. In these scenarios, the estimated depth maps tend to be smooth and lack distinctive geometric features, leading to feature aliasing. This analysis confirms that while the multimodal integration of depth significantly boosts localization performance in structured environments, addressing extreme textural ambiguity in natural scenes remains a significant challenge for future research.
Figure 11.
Retrieval examples. The green bounding boxes indicate correct matches, while the red bounding boxes indicate incorrect retrieved results.
6. Discussion
Regarding the absolute localization error (e.g., Dis@1 of 1052.73 m), it is essential to contextualize this metric within the practical engineering pipeline of UAV power-grid inspection. In real-world GNSS-denied conditions, UAV visual localization is inherently a two-stage “coarse-to-fine” process. The proposed cross-view retrieval framework serves as the global coarse localization stage. When a UAV completely loses its continuous trajectory and operates over a massive search space (tens of square kilometers), predicting the absolute location within a ~1km radius provides a crucial and reliable initial geographic prior. Compared to the baseline’s 1734.95m error, our method drastically shrinks the subsequent search area. Once the UAV is roughly localized to this specific satellite tile using our RGBD + EMA model, established fine-grained registration algorithms (e.g., local feature matching or visual odometry) can seamlessly take over to achieve meter-level precise defect geotagging. Therefore, our model significantly mitigates the risk of total mission failure in extreme environments, thereby substantially enhancing overall engineering reliability.
The experimental results demonstrate that the proposed RGBD + EMA method consistently outperforms the RGB-only baseline across multiple evaluation criteria, including retrieval accuracy, spatial consistency, and geodesic localization error. Importantly, the observed gains are not attributable to a single factor, but rather arise from the complementary effects of the RGBD-based geometric priors and the EMA-based spatial enhancement.
On the one hand, introducing the depth modality on the UAV side provides explicit geometric structural cues, reducing the model’s reliance on appearance information such as texture and color during cross-view matching. This helps mitigate ambiguous matches in regions that are visually similar but structurally different. Such an effect is particularly evident in the substantial improvements of Recall@K, suggesting that multimodal inputs markedly enhance representation discriminability. On the other hand, the EMA module performs multi-scale re-calibration on spatial feature maps, strengthening responses in key structural regions while suppressing redundant background activations. The overall increase in SDM@K together with the notable decrease in Dis@K indicates that EMA not only improves ranking-based metrics, but also enhances spatial consistency and physical localization accuracy. In summary, RGBD serves as the source of structural information, whereas EMA improves the efficiency of exploiting such information; their combination yields more robust cross-view alignment and consistent gains across metrics.
Although retrieval visualizations are not included due to space limitations, a case-by-case analysis of test-set results reveals clear patterns of performance differences. For the RGB baseline, failure cases are mainly concentrated in areas with highly repetitive textures (e.g., continuous vegetation coverage or visually similar rooftop clusters). In these scenarios, relying solely on RGB appearance cues makes it difficult to discriminate geographically different targets with similar textures, causing the top-1 retrieved satellite images to be highly similar in appearance but far away in geographic space, which also explains the large Dis@1 error.
In contrast, our RGBD + EMA model exhibits stronger discriminability under these challenging conditions. Benefiting from the geometric priors introduced by depth maps and the EMA-based enhancement of multi-scale structural cues, the model can attend to distinctive geometric signatures in the scene (e.g., characteristic building corner configurations or terrain elevation trends) rather than being misled by large regions of similar textures. This effective utilization of structural information enables accurate retrieval of satellite images with the correct geometric layout even under severe appearance ambiguity, leading to a substantial improvement in SDM@1 and a marked reduction in geodesic distance error.
Furthermore, we acknowledge certain limitations in our current work. At present, the proposed framework has only been validated on the GTA-UAV dataset. Due to the extreme scarcity of high-quality public datasets specifically tailored for UAV-to-satellite cross-view geo-localization that simultaneously capture extreme viewpoint variations and realistic GNSS-denied environments, comprehensive cross-dataset evaluation remains challenging. In our future work, we plan to construct a diverse, real-world dataset covering various geographic scenarios and power-grid infrastructures. We will conduct extensive cross-dataset evaluations to further verify and enhance the generalization capability of our multimodal fusion framework in practical, large-scale deployments.
7. Conclusions
Motivated by the urgent demand for high-precision UAV self-localization in GNSS-denied environments, this study systematically investigates multimodal data fusion, deep neural network modeling, and multi-scale feature enhancement. We develop an RGBD-EMA cross-view geo-localization framework tailored for partial matching scenarios, and clarify the complementary roles of appearance cues and geometric structures in feature alignment. The proposed approach provides a useful technical reference for UAV autonomous navigation and perception in complex urban environments. The main conclusions are summarized as follows:
- (1)
- Based on the GTA-UAV virtual simulation dataset, we formulate a processing scheme that combines monocular depth estimation with RGBD multimodal inputs. MiDaS is utilized to generate UAV-view depth maps, while satellite images are zero-padded to ensure channel consistency. This design reduces appearance ambiguity and strengthens structural constraints for cross-view feature alignment.
- (2)
- We propose an RGBD-enhanced model that integrates a shared-weight ViTAdapter with a lightweight EMA module, achieving stable advantages in complex scenarios. Compared with the RGB baseline, Recall@1 increases from 1.71% to 18.12%, AP improves from 4.27 to 28.01, and Dis@1 decreases from 1734.95 m to 1052.73 m. These results verify that the synergy between geometric priors and multi-scale attention can simultaneously improve retrieval and localization accuracy.
- (3)
- The results further indicate that multimodal fusion and multi-scale attention provide substantial complementary gains for cross-view localization. Depth contributes macro-level geometric cues that enhance robustness, while EMA strengthens local structural representations to improve discriminability. Their combination alleviates the limited sensitivity of Transformer-based encoders to fine-grained geometric details, thereby improving the stability of cross-view alignment.
Author Contributions
Methodology, Y.W. and J.G.; software, Y.W.; validation, Y.W., Y.Z. and D.L.; formal analysis, Y.W. and J.G.; investigation, Y.W., F.W., R.Z. and D.L.; data curation, Y.W.; writing—original draft preparation, Y.W.; writing—review and editing, Z.W., J.G., Y.Z., F.W., R.Z. and D.L.; visualization, Y.W.; supervision, Z.W. and J.G.; funding acquisition, J.G. All authors have read and agreed to the published version of the manuscript.
Funding
This work was supported by the Key Program of National Social Science Foundation of China (Grant No. 23AGL039); the Shaanxi Province Key Research and Development Program (Grant No. 2021GY-341); the Shaanxi Key Laboratory of Integrated and Intelligent Navigation (Grant No. SKLIIN-20190102); and the 2025 Fuzhou Municipal Science and Technology Major Project, Fuzhou Artificial Intelligence “Jiebang Guashuai” (Open Competition) Program (Grant No. 2025-ZD-043).
Institutional Review Board Statement
Not applicable.
Informed Consent Statement
Not applicable.
Data Availability Statement
The data that support the findings of this study are available from the corresponding author upon reasonable request.
Conflicts of Interest
The authors declare no conflicts of interest.
References
- Li, H.; Qin, B.; Wang, S.; Ding, T.; Liu, J.; Wang, H. Aggregate Power Flexibility of Multi-Energy Systems Supported by Dynamic Networks. Appl. Energy 2025, 377, 124565. [Google Scholar] [CrossRef] [Scilit]
- Zhang, Z.; Qin, B.; Ding, T.; Gao, X.; Zhang, Y. CBAM-CNN Based Transient Overvoltage Preventive Control Considering Piecewise Linear Control Sensitivity. IEEE Trans. Power Syst. 2025, 40, 3645–3656. [Google Scholar] [CrossRef] [Scilit]
- Qin, B.; Wang, H.; Liao, Y.; Li, H.; Ding, T.; Wang, Z.; Li, F.; Liu, D. Challenges and Opportunities for Long-Distance Renewable Energy Transmission in China. Sustain. Energy Technol. Assess. 2024, 69, 103925. [Google Scholar] [CrossRef] [Scilit]
- Wang, Z.; Lv, Z.; Xu, X.; Cong, L.; Huang, C. Vertical Switching Algorithm for Unmanned Aerial Vehicle in Power Grid Heterogeneous Communication Networks. Electronics 2024, 13, 2612. [Google Scholar] [CrossRef] [Scilit]
- Qin, B.; Chen, P.; Zhang, Z.; Wang, H.; Ding, T. Coordinated Preventive Control Strategy for Transient Overvoltage Suppression in Hybrid AC/DC Sending-Side Systems. Int. J. Electr. Power Energy Syst. 2025, 171, 111017. [Google Scholar] [CrossRef] [Scilit]
- Qin, B.; Liu, J.; Wang, H.; Wang, Z.; Xiong, Z.; Wang, M.; Qian, Q. Energy-Efficient and Reliable Urban Rail Transit: A New Framework Incorporating Underground Energy Storage Systems. iEnergy 2025, 4, 86–97. [Google Scholar] [CrossRef] [Scilit]
- Farooq Bhat, S.; Alhashim, I.; Wonka, P. AdaBins: Depth Estimation Using Adaptive Bins. In Proceedings of the 2021 IEEE/CVF Conference on Computer Vision and Pattern Recognition (CVPR), Nashville, TN, USA, 20–25 June 2021; pp. 4009–4018. [Google Scholar]
- Wang, H.; Qin, B.; Hong, S.; Xu, X.; Su, Y.; Lu, T.; Ding, T. Enhanced GAN-Based Joint Wind-Solar-Load Scenario Generation with Extreme Weather Labelling. IEEE Trans. Smart Grid 2025, 16, 4213–4224. [Google Scholar] [CrossRef] [Scilit]
- Wang, H.; Qin, B.; Su, Y.; Li, F.; Hong, S.; Ding, T. Coordinated Planning of Mobile Electric-hydrogen Energy Storage for Remote Power System Resilience Enhancement. J. Energy Storage 2026, 147, 120160. [Google Scholar] [CrossRef] [Scilit]
- Qin, B.; Li, H.; Wang, Z.; Jiang, Y.; Lu, D.; Du, X.; Qian, Q. New Framework of Low-Carbon City Development of China: Underground Space Based Integrated Energy Systems. Undergr. Space 2024, 14, 300–318. [Google Scholar] [CrossRef] [Scilit]
- Qin, B.; Hong, S.; Wang, H.; Zhao, J.; Li, H.; Chen, P.; Ding, T. Non-Isothermal Dynamic Model and Collaborative Optimization for Multi-Energy System Considering Pipeline Energy Storage. J. Energy Storage 2026, 141, 119083. [Google Scholar] [CrossRef] [Scilit]
- Wang, H.; Qin, B.; Hong, S.; Cai, Q.; Li, F.; Ding, T.; Li, H. Optimal Planning of Hybrid Hydrogen and Battery Energy Storage for Resilience Enhancement Using Bi-Layer Decomposition Algorithm. J. Energy Storage 2025, 110, 115367. [Google Scholar] [CrossRef] [Scilit]
- Qin, B.; Wang, H.; Li, F.; Liu, D.; Liao, Y.; Li, H. Towards Zero Carbon Hydrogen: Co-Production of Photovoltaic Electrolysis and Natural Gas Reforming with CCS. Int. J. Hydrogen Energy 2024, 78, 604–609. [Google Scholar] [CrossRef] [Scilit]
- Caballero, Á.; Roman-Escorza, F.; Maza, I.; Ollero, A. A Multi-UAV Approach for Fast Inspection of Overhead Power Lines: From Route Planning to Field Operation. J. Intell. Robot. Syst. 2025, 111, 67. [Google Scholar] [CrossRef] [Scilit]
- Al-Jarrah, O.Y.; Shatnawi, A.S.; Shurman, M.M.; Ramadan, O.A.; Muhaidat, S. Exploring Deep Learning-Based Visual Localization Techniques for UAVs in GPS-Denied Environments. IEEE Access 2024, 12, 113049–113071. [Google Scholar] [CrossRef] [Scilit]
- Liao, Y.; Su, J.; Ma, D.; Niu, C. UAV-Satellite Cross-View Image Matching Based on Adaptive Threshold-Guided Ring Partitioning Framework. Remote Sens. 2025, 17, 2448. [Google Scholar] [CrossRef] [Scilit]
- Zheng, Z.; Wei, Y.; Yang, Y. University-1652: A Multi-View Multi-Source Benchmark for Drone-Based Geo-Localization. In Proceedings of the 28th ACM International Conference on Multimedia, Seattle, WA, USA, 12 October 2020; pp. 1395–1403. [Google Scholar]
- Dai, M.; Zheng, E.; Feng, Z.; Qi, L.; Zhuang, J.; Yang, W. Vision-Based UAV Self-Positioning in Low-Altitude Urban Environments. IEEE Trans. Image Process. 2024, 33, 493–508. [Google Scholar] [CrossRef] [Scilit]
- Zhu, R.; Yin, L.; Yang, M.; Wu, F.; Yang, Y.; Hu, W. SUES-200: A Multi-Height Multi-Scene Cross-View Image Benchmark Across Drone and Satellite. IEEE Trans. Circuits Syst. Video Technol. 2023, 33, 4825–4839. [Google Scholar] [CrossRef] [Scilit]
- Turky, R.A.; Hasanien, H.M.; Alkuhayli, A. Dynamic Stability Improvement of AWS-Based Wave Energy Systems Using a Multiobjective Salp Swarm Algorithm-Based Optimal Control Scheme. IEEE Syst. J. 2022, 16, 79–87. [Google Scholar] [CrossRef] [Scilit]
- Durgam, A.; Paheding, S.; Dhiman, V.; Devabhaktuni, V. Cross-View Geo-Localization: A Survey. IEEE Access 2024, 12, 192028–192050. [Google Scholar] [CrossRef] [Scilit]
- Zhou, B.; Khosla, A.; Lapedriza, A.; Oliva, A.; Torralba, A. Learning Deep Features for Discriminative Localization. In Proceedings of the 2016 IEEE Conference on Computer Vision and Pattern Recognition (CVPR), Las Vegas, NV, USA, 27–30 June 2016; pp. 2921–2929. [Google Scholar]
- Ji, Y.; He, B.; Tan, Z.; Wu, L. Game4Loc: A UAV Geo-Localization Benchmark from Game Data. Proc. AAAI Conf. Artif. Intell. 2025, 39, 3913–3921. [Google Scholar] [CrossRef] [Scilit]
- He, K.; Chen, X.; Xie, S.; Li, Y.; Dollar, P.; Girshick, R. Masked Autoencoders Are Scalable Vision Learners. In Proceedings of the 2022 IEEE/CVF Conference on Computer Vision and Pattern Recognition (CVPR), New Orleans, LA, USA, 18–24 June 2022; pp. 16000–16009. [Google Scholar]
- He, Q.; Xu, A.; Zhang, Y.; Ye, Z.; Zhou, W.; Xi, R.; Lin, Q. A Contrastive Learning Based Multiview Scene Matching Method for UAV View Geo-Localization. Remote Sens. 2024, 16, 3039. [Google Scholar] [CrossRef] [Scilit]
- Hou, K.; Tong, Q.; Yan, N.; Liu, X.; Hou, S. MCFA: Multi-Scale Cascade and Feature Adaptive Alignment Network for Cross-View Geo-Localization. Sensors 2025, 25, 4519. [Google Scholar] [CrossRef] [Scilit]
- Zhang, W.; Zhong, Z.; Chen, H.; Jing, N. GeoViewMatch: A Multi-Scale Feature-Matching Network for Cross-View Geo-Localization Using Swin-Transformer and Contrastive Learning. Remote Sens. 2024, 16, 678. [Google Scholar] [CrossRef] [Scilit]
- Deuser, F.; Habel, K.; Oswald, N. Sample4Geo: Hard Negative Sampling for Cross-View Geo-Localisation. In Proceedings of the 2023 IEEE/CVF International Conference on Computer Vision (ICCV), Paris, France, 1 October 2023; pp. 16801–16810. [Google Scholar]
- Allca-Pekarovic, A.; Kollmeyer, P.J.; Forsyth, A.; Emadi, A. Experimental Characterization and Modeling of a YASA P400 Axial Flux PM Traction Machine for Performance Analysis of a Chevy Bolt EV. IEEE Trans. Ind. Appl. 2024, 60, 3108–3119. [Google Scholar] [CrossRef] [Scilit]
- Cheng, J.; Deng, C.; Su, Y.; An, Z.; Wang, Q. Methods and Datasets on Semantic Segmentation for Unmanned Aerial Vehicle Remote Sensing Images: A Review. ISPRS J. Photogramm. Remote Sens. 2024, 211, 1–34. [Google Scholar] [CrossRef] [Scilit]
- Li, D.; Wang, D.; Yan, D. Piston Error Automatic Correction for Segmented Mirrors via Deep Reinforcement Learning. Sensors 2024, 24, 4236. [Google Scholar] [CrossRef] [Scilit] [PubMed]
- Wang, T.; Zheng, Z.; Yan, C.; Zhang, J.; Sun, Y.; Zheng, B.; Yang, Y. Each Part Matters: Local Patterns Facilitate Cross-View Geo-Localization. IEEE Trans. Circuits Syst. Video Technol. 2022, 32, 867–879. [Google Scholar] [CrossRef] [Scilit]
- Zhu, S.; Shah, M.; Chen, C. TransGeo: Transformer Is All You Need for Cross-View Image Geo-Localization. In Proceedings of the 2022 IEEE/CVF Conference on Computer Vision and Pattern Recognition (CVPR), New Orleans, LA, USA, 18–24 June 2022; pp. 1162–1171. [Google Scholar]
- Zhu, S.; Yang, T.; Chen, C. VIGOR: Cross-View Image Geo-Localization beyond One-to-One Retrieval. In Proceedings of the 2021 IEEE/CVF Conference on Computer Vision and Pattern Recognition (CVPR), Nashville, TN, USA, 20–25 June 2021; pp. 5316–5325. [Google Scholar]
- Sun, B.; Li, M.; Sun, B.; Liu, G.; Bi, C.; Wang, W.; Feng, X.; Zhang, G.; Hu, B. Beyond Spatial Domain: Multi-View Geo-Localization with Frequency-Based Positive-Incentive Information Screening. Remote Sens. 2025, 18, 88. [Google Scholar] [CrossRef] [Scilit]
- Ouyang, D.; He, S.; Zhang, G.; Luo, M.; Guo, H.; Zhan, J.; Huang, Z. Efficient Multi-Scale Attention Module with Cross-Spatial Learning. In Proceedings of the ICASSP 2023–2023 IEEE International Conference on Acoustics, Speech and Signal Processing (ICASSP), Rhodes Island, Greece, 4–10 June 2023; pp. 1–5. [Google Scholar]

Disclaimer/Publisher’s Note: The statements, opinions and data contained in all publications are solely those of the individual author(s) and contributor(s) and not of MDPI and/or the editor(s). MDPI and/or the editor(s) disclaim responsibility for any injury to people or property resulting from any ideas, methods, instructions or products referred to in the content. |
© 2026 by the authors. Licensee MDPI, Basel, Switzerland. This article is an open access article distributed under the terms and conditions of the Creative Commons Attribution (CC BY) license.