


Abstract
Renewable energy sources, such as solar and biomass, represent sustainable alternatives to meet the growing energy demands of the residential sector. This study evaluated the energy, exergy, and environmental performance of two Brayton configurations using supercritical carbon dioxide: a recompression cycle (SRC) and a recompression cycle with intercooling in the main compression (SMC), both coupled to a dual-loop organic Rankine cycle (DORC) and powered by a hybrid solar-biomass thermal system. Mass, energy, and exergy balances were developed, and a life cycle assessment was performed to quantify the environmental impact. The systems were designed to cover a cooling load of 130 kW corresponding to 200 dwellings constructed with Asbestos cement in the Colombian Caribbean region. The results show that both configurations meet the required demand; the SMC-DORC cycle operates at 650 °C, while the SRC-DORC requires 750 °C. The SRC-DORC exhibits higher thermal efficiency (53.24%), while the SMC-DORC achieves a slightly higher exergy efficiency (28.15%). Environmental analysis shows that the construction phase accounts for the majority of the total impact, exceeding 95% of emissions. Overall, both configurations are technically feasible, with the SRC-DORC standing out for its balance between efficiency and environmental impact.
1. Introduction
Economic, technological, and social growth depends heavily on reliable access to energy; however, the global energy mix continues to be dominated by fossil fuels, which has generated significant environmental impacts, evidenced by the cumulative emission of more than 1200 gigatons of CO2 between 1965 and 2018 [1]. This dependence has intensified the challenges associated with climate change and reinforced the need to move towards more efficient and decarbonized energy systems.
In this energy transition scenario, the residential sector plays a decisive role in energy consumption and associated emissions. Globally, the residential and non-residential sectors account for between 30% and 34% of final energy consumption, with the residential sector having the largest share. A considerable proportion of this demand corresponds to thermal uses—such as heating, cooling, and domestic hot water production—which can exceed 50% of total consumption depending on climate and socioeconomic conditions [2]. Together, the commercial and residential sectors are responsible for approximately 37% of global energy emissions, highlighting the need to integrate high-efficiency, low-environmental-impact thermal technologies into residential applications [3].
Faced with this high thermal demand, renewable energies constitute a strategic alternative for the supply of clean energy in the residential sector [4]. In particular, the Colombian Caribbean region presents favorable conditions for the use of non-conventional sources, especially solar energy and biomass from agricultural waste. Previous studies have confirmed the high solar potential of cities such as Santa Marta, Cartagena, La Guajira, and Barranquilla, as well as the energy value of waste such as coconut husks, which supports their viability as sustainable thermal sources in the region [5,6].
For the efficient use of these sources, especially in applications requiring medium and high temperatures, advanced conversion technologies are needed. In this regard, supercritical carbon dioxide Brayton cycles (sCO2) have emerged as a promising alternative for power generation, due to their high thermal efficiency, compact size, and ability to operate above the CO2 critical point. These characteristics allow them to achieve superior performance compared to conventional technologies, particularly in operating ranges between 450 and 750 °C [7,8].
In terms of performance, several studies have shown that sCO2 Brayton cycles can achieve thermal efficiencies exceeding 40% when coupled to high-temperature renewable energy sources. Al-Sulaiman et al. [9] performed a thermodynamic comparison of five configurations—simple, regenerative, with recompression, with precompression, and split expansion—using concentrated solar thermal energy as the heat source, demonstrating that the configuration with recompression exhibited the best performance under nominal operating conditions.
In addition, Padilla et al. [10] analyzed the energy and exergy performance of four configurations driven by solar concentrating towers, including schemes with recompression and intercooling in the main compressor, and reported thermal efficiencies of up to 55.2%, with this configuration standing out as the highest performing. Likewise, Chacartegui et al. [11] evaluated supercritical and transcritical CO2 cycles powered by solar plants, confirming their thermal and economic competitiveness compared to conventional Brayton cycles, particularly in schemes with partial cooling.
However, despite the high yields reported, a significant fraction of the thermal energy supplied in these systems is rejected as waste heat, which limits overall energy utilization [12].
In response to this limitation, Organic Rankine cycles (ORCs) have been widely recognized as an effective solution for recovering low- and medium-temperature waste heat. Unlike conventional steam cycles, ORCs operate with organic working fluids that allow efficient energy conversion at temperatures as low as 120 °C [13,14]. This capability significantly extends the usable energy range in thermal systems, making ORC technology particularly suitable for integration with sCO2 Brayton cycles to enhance overall system efficiency.
From this perspective, several authors have studied the integration of sCO2 Brayton cycles with ORC as a background cycle. Besarati et al. [15] compared simple, recompression, and partial intercooling configurations, all powered by concentrated solar energy and integrated into an ORC, reporting overall efficiencies close to 50% and increases of 3 to 7% in total thermal efficiency due to waste heat recovery.
Similarly, Habibi et al. [16] optimized a regenerative supercritical Brayton cycle coupled to an ORC, demonstrating improvements of 2.16% in exergy performance and 2.75% in net power. Meanwhile, Liang et al. [17] analyzed a two-stage compression intercooled cycle coupled to an ORC, obtaining further increases in net power and confirming the relevance of intercooling and heat recovery for maximizing thermodynamic performance.
In the regional context, Meriño et al. [18] evaluated a hybrid system combining a Brayton cycle sCO2 with an ORC powered by both solar energy and coconut husk biomass. Their results showed an exergy efficiency of 26.60% and a significant improvement of 17.28% compared to systems operating solely with solar energy. This study demonstrates the potential of integrating locally available biomass resources with solar technologies, reinforcing the feasibility of hybrid configurations in regions such as the Colombian Caribbean. Complementarily, thermo-economic and hybrid studies applied to industrial and community contexts have shown improvements in energy efficiency, emission reduction, and economic viability [19,20].
Beyond energy performance, it is essential to consider the environmental implications of these configurations. Recent research has applied Life Cycle Assessment (LCA) methodologies to quantify the emissions associated with the construction, operation, and dismantling of Brayton sCO2 systems coupled to renewable sources [21]. In this regard, Alarcón et al. [22] carried out an integrated energy, exergy, and environmental analysis of hybrid power systems, identifying that the construction phase represents the largest contribution to the overall environmental impact. Their results highlight that components such as the solar field and structural materials significantly influence the life cycle performance, emphasizing the importance of including environmental criteria in the design and evaluation of these systems.
Similarly, Xiao et al. [23] analyzed solar thermal power plants coupled with supercritical CO2 cycles through a life cycle assessment approach. Their findings indicate that the solar field infrastructure is the dominant source of environmental impact, mainly due to the materials required for its construction. This reinforces the need for a comprehensive evaluation that considers not only thermodynamic performance but also environmental implications across the system life cycle.
Recent studies have also incorporated exergo-environmental and sustainability indicators to evaluate Brayton cycle configurations. For example, Abam et al. [24] integrated exergy efficiency, environmental impact, and economic performance, showing that indicators such as CO2 emissions and waste exergy are essential for selecting optimal system configurations.
Taken together, the aforementioned research demonstrates the need to diversify energy sources and optimize their conversion, highlighting the importance of exploring alternatives that not only improve energy efficiency in the residential sector but also minimize the environmental impact associated with power generation systems.
However, despite these advances, most existing studies focus primarily on thermodynamic optimization under predefined or steady-state operating conditions, without explicitly linking system design to the actual thermal demand of end users. In particular, the variability of residential cooling demand and its dependence on building characteristics are often neglected, which limits the applicability of these models under real operating conditions.
Furthermore, although hybrid solar–biomass configurations and waste heat recovery systems have been investigated, their integration with dual-loop ORC systems (DORC) within a demand-driven framework remains limited. Previous works typically evaluate system performance independently of user demand profiles, and the influence of building orientation on cooling loads has not been explicitly considered as a design parameter in the evaluation of sCO2 Brayton–ORC systems.
In this context, the present work introduces an orientation-based cooling load as a key design criterion, allowing the system to be sized according to the most demanding residential condition. This approach enables a more realistic representation of energy requirements and provides a comprehensive framework that integrates thermodynamic performance, environmental impact, and demand-driven system design. Consequently, this study advances the current state of the art by linking advanced energy system configurations with real residential operating conditions.
Within this framework, the objective of this research is to comparatively evaluate the energy, exergy and environmental performance of two configurations of the supercritical carbon dioxide Brayton cycle (sCO2), considering as a design condition the maximum thermal load demanded by a residential complex built with Asbestos cement and located in the Colombian Caribbean region, using an orientation-based cooling load as the main design criterion.
The configurations analyzed include two Brayton cycle arrangements. The first corresponds to a recompression cycle (SRC), and the second to a recompression cycle with intercooling in the main compressor (SMC). Both configurations are coupled to a dual-loop organic Rankine cycle (DORC), which operates as a waste heat recovery system. These systems are powered by a hybrid thermal supply system that integrates a solar concentrator tower and a coconut shell biomass furnace as complementary heat sources.
2. Methodology
This research analyzes two configurations of the supercritical carbon dioxide (sCO2) Brayton cycle, both coupled to a dual-loop organic Rankine cycle (DORC): a cycle with recompression (SRC–DORC) and a cycle with recompression and main compression intercooling (SMC–DORC). Both systems use a hybrid heat source consisting of a concentrating solar thermal (CSP) tower and a biomass furnace fueled by coconut husks, which provide 70% and 30% of the total thermal demand, respectively. The configurations were designed to supply energy to a residential complex of 200 dwellings constructed with Asbestos cement to meet the cooling and heat dissipation needs of each unit.
2.1. System Description
Figure 1 and Figure 2 show the two systems analyzed: a supercritical Brayton cycle with recompression (SRC) and a supercritical Brayton cycle with recompression and intercooling in the main compression (SMC), both using CO2 as the working fluid. To maximize the utilization of waste heat, each configuration is coupled to a dual-loop organic Rankine cycle (DORC), illustrated in Figure 3.
Figure 1.
Brayton cycle sCO2 with recompression (SRC).
Figure 2.
Brayton sCO2 cycle with recompression and main compression intercooling (SMC).
Figure 3.
Dual-loop Rankine organic cycle (DORC).
In the SRC cycle (Figure 1), CO2 enters turbine 1 at state 1 and expands to state 2. It is then reheated to state 3 before expanding again in Turbine 2 to state 4. The power generated drives the compressors and the electric generator that supplies the residential complex. At the outlet of Turbine 2, the fluid transfers heat in the high-temperature heat exchanger (HTR), transitioning from state 4 to state 5, while the cold stream from the low-temperature heat exchanger (LTR) enters the HTR at state 11 and exits at state 12 to the heater.
Next, the hot stream flows to the LTR (state 5 → 6), where it exchanges heat with the compressed stream (state 8 → 9). At the outlet of the LTR, the flow splits into two streams. One fraction (state 6a) is directed to Compressor 2, where it is compressed to state 10. The second fraction (state 6b) is sent to the DORC evaporators, passing first through the high- and low-pressure stages (state 6b → 6d → 6c). After heat exchange, this stream flows through the cooler (state 6c → 7) before entering the main compressor. From there, the CO2 enters the main compressor (state 7 → 8). Finally, the streams at states 9 and 10 mix, enter the HTR (state 11), and complete the cycle.
The SMC cycle (Figure 2) retains the expansion (state 1 → 2 → 3 → 4) and heat recovery stages but incorporates a two-stage compression with intercooling. After the intercooler, the fluid enters Compressor 1 (state 7 → 8), passes through the intercooler (state 8 → 9), and is then compressed again in Compressor 2 to state 10. Subsequently, after the LTR and mixing with the recompression stream (state 6a), the flow enters the HTR and continues to the heater, closing the cycle. The flow splitting to the DORC evaporators (state 6b → 6d → 6c) is maintained analogously to the SRC.
The DORC cycle (Figure 3) begins with the organic fluid in a saturated liquid state (state 19), which is pressurized by Pump 1 and divided into streams at states 21 and 22. The stream at state 22 is raised to high pressure by Pump 2 (state 23) and evaporates in the high-pressure evaporator to a superheated state (state 25), subsequently expanding in Turbine 3 (state 26). The stream at state 21 evaporates in the low-pressure evaporator to state 24. Both streams are mixed (state 27) before expanding in the low-pressure turbine (state 28). Finally, the fluid condenses (state 29 → 19), closing the cycle. Superheating in the evaporators ensures dry expansion and prevents moisture damage to the turbines.
The temperature-entropy (T-s) diagrams of the previously mentioned configurations allow visualization of the thermodynamic behavior of CO2 during the expansion, compression, reheating, and heat recovery processes (Figure 4). In the recompression cycle (SRC), flow splitting and partial recompression are observed before the CO2 enters the high-temperature recuperator, while in the intercooling cycle (SMC), the intermediate temperature reduction during compression, associated with the intercooler, is observed. Together, the T-s diagrams facilitate the comparison of heat utilization and the differences in irreversibilities between the two configurations.
Figure 4.
T-s diagram configurations: (a) Supercritical Brayton cycle SMC; (b) DORC cycle coupled to SMC; (c) Supercritical Brayton cycle SRC; (d) DORC cycle coupled to SRC.
On the other hand, the T-s diagram of the DORC cycle shows the pumping, dual-pressure evaporation, high- and low-pressure turbine expansion, and organic fluid condensation processes. The presence of two pressure levels allows for better adaptation to the thermal profile of the CO2 stream, evidenced by two distinct evaporation processes in the diagram. In this way, the T-s diagram allows visualization of the staged utilization of waste heat and the additional work output in the system.
2.2. Thermodynamic Modeling
This section presents the general thermodynamic analysis of the system components. A control volume is defined for each piece of equipment, assuming steady-state operating conditions. Based on these considerations, the corresponding mass and energy balances are formulated. The model was implemented in Matlab® R2018b, while the thermodynamic properties were obtained using the REFPROP 9.0 tool. The model was developed under the following considerations:
- Changes in kinetic and potential energy were neglected [25].
- Pressure drops in heat exchangers and pipes were neglected [25].
- There are no fluid losses in the proposed systems.
- Heat losses in the solar receiver and solar field are considered.
- In the main cycles (SRC and SMC), the cooling fluid is air.
- In the tail cycle (DORC), the cooling fluid is water.
- The effectiveness of the recovery systems (HTR and LTR) was assumed to be constant [26].
These assumptions are commonly adopted in thermodynamic analyses of advanced energy systems and are supported by previous studies [25,26]. Their use allows for a reduction in model complexity while maintaining an adequate level of accuracy for comparative evaluations. In particular, the neglect of pressure drops and fluid losses is consistent with prior works, where such effects are considered to have a secondary impact on the overall system performance when compared to the dominant thermodynamic processes.
Likewise, assuming constant effectiveness for the heat exchangers enables a stable and consistent comparison between different configurations, as variations in these parameters are typically limited within standard operating ranges. In addition, the fixed contribution ratio between solar energy and biomass was selected as a reference scenario to facilitate the evaluation of system performance under controlled conditions. Therefore, these assumptions do not compromise the validity of the comparative analysis carried out in this study.
The mass balance for open systems is expressed in Equation (1), where the inlet and outlet mass flow rates of each device are considered [27].
Σṁin − Σṁout = 0
The application of the first law of thermodynamics is presented in Equation (2), which represents the energy balance. In this formulation, Q corresponds to the rate of heat transfer, Ẇ to the power exchanged, and h to the specific enthalpy of the fluid in each thermodynamic state [27].
ΣQ − ΣẆ + Σṁ × hin − Σṁ × hout = 0
To evaluate internal irreversibilities and the quality of energy transformations, the exergy balance shown in Equation (3) was formulated. In this expression, the exergy associated with heat transfer is determined by the Carnot factor Q∙(1 − T0/T), while ĖD represents the exergy destroyed in each component due to irreversible processes [28].
ΣĖin −ΣĖout + Q × (1 − T0/T) − Ẇ − ĖD = 0
The specific physical exergy of each stream is calculated using Equation (4), based on the enthalpy and entropy of the considered state with respect to the environmental reference state (h0, T0, s0) [28].
Ėph = ṁ × [(h − h0) − T0 × (s − s0)]
The overall thermal efficiency of the integrated SRC-DORC and SMC-DORC systems is determined using Equations (5) and (6), as the ratio between the net power produced and the total heat supplied to the system [29]. Similarly, the thermal efficiency of the DORC cycle is calculated using Equation (7), considering the net power generated in its turbines relative to the heat absorbed in the evaporators [30].
where Ẇ represents the power produced by turbines T1, T2, T3, and T4, as well as the power consumed by compressors and pumps C1, C2, C3, P1, and P2, respectively. QHR corresponds to the heat supplied by the heater, while QRHR is the heat supplied by the reheater. Finally, QEva1 and QEva2 represent the heat recovered in evaporators 1 and 2, respectively.
ηth/SRC-DORC = (ẆT1 + ẆT2 + ẆT3 + ẆT4 − ẆC1 − Ẇc2 − ẆP1 − ẆP2)/(QHR + QRHR)
ηth/SMC-DORC = (ẆT1 + ẆT2 + ẆT3 + ẆT4 − ẆC1 − Ẇc2 − Ẇc3 − ẆP1 − ẆP2)/(QHR + QRHR)
ηth/DORC = (ẆT3 + ẆT4 − ẆP1 − ẆP2)/(QEva1 + QEva2)
On the other hand, the overall exergy efficiency of the system is defined in Equations (8) and (9) as the ratio between the net useful power and the exergy supplied by the thermal source, for the SRC-DORC and SMC-DORC configurations, respectively. [31]. Likewise, the Flue Depletion Ratio (FDR), presented in Equation (10), quantifies the fraction of exergy destroyed due to internal irreversibilities [32]. In this context, Ėin represents the rate of exergy contributed by the heat sources (solar and biomass).
ηex/SRC-DORC = (ẆT1 + ẆT2 + ẆT3 + ẆT4 − ẆC1 − Ẇc2 − ẆP1 −ẆP2)/(Ėin)
ηex/SMC-DORC = (ẆT1 + ẆT2 + ẆT3 + ẆT4 − ẆC1 − Ẇc2 − Ẇc3 − ẆP1 − ẆP2)/(Ėin)
FDR = (ĖD)/(Ėin)
2.3. Thermal Source Modeling
This scenario describes the system’s operation under a hybrid solar-biomass scheme, in which the solar energy supplied by the CSP covers approximately 70% of the thermal demand and biomass covers 30%, consistent with previous studies such as that by Pantaleo et al. [33]. Under conditions of low or no solar radiation (nighttime or early morning hours), biomass assumes 100% of the thermal requirement, ensuring continuous operation of the furnace and avoiding on/off cycles that could generate energy losses. As shown in Figure 5, the main heater is powered by solar energy at the receiver, while the reheater is supplied by biomass, allowing independent operation of both thermal sources to meet the demand of the SRC and SMC Brayton cycles.
Figure 5.
Hybrid scenario: (a) Concentrating solar tower; (b) Biomass furnace.
The input exergy supplied by the CSP to both systems is defined by Equation (11) [10,34], where Tse corresponds to the effective temperature of the sun, θ is the solar angle, ηsf represents the efficiency of the solar field, and ηsr represents the efficiency of the solar receiver, which is described in Equation (12) [35].
Ėin/solar = [1 − (4 × T0/3 × Tse) × (1 − cosθ)1/4 + (1/3) × (T0/Tse)4] × [(QHR)/(ηsfηsr)]
ηsr = φ − [λcon × βcon × (T1 + ΔTRec − Tair) + Ꞓ × σ × λview × T4Rec]/(ηsf × γ × CR)
From Equation (12), φ is defined as the Absorbance, ε is the Thermal emittance, λview is the View factor, and λcon is the Convective loss factor, while βcon corresponds to the Convective coefficient. In this expression, the symbol λ is used with different subscripts to represent distinct coefficients. Additionally, σ is the Stefan–Boltzmann constant, T1 is the Temperature at the turbine inlet, ΔTRec is the Receiver temperature approximation, Tair is the ambient temperature, TRec is the receiver temperature, ηsf represents the efficiency of the solar field, γ corresponds to the solar radiation, and CR is the Concentration ratio.
On the other hand, the exergy loss of the solar receiver can be estimated using Equation (13), the exergy loss of the solar field using Equation (14), and the exergy destroyed by the receiver using Equation (15), which are shown below [33].
ĖLoss/sr = (QHR) × [1 − (T0/(T1 + ΔTRec))] × ((φ/ηsr) − 1)
Ėsf = Ėin/solar × (1 − ηsr)
ĖD/sr = Ėin/solar × ηsf − ĖLoss/sr + (Ė14 − Ė1)
Table 1 presents the main design and operating parameters necessary to estimate the thermal efficiency of the central receiver [35]. The solar radiation value was selected based on the cooling load demanded by the residential complex, which varies throughout the day. This value was obtained using the NASA POWER tool, developed by NASA’s Langley Research Center [36].
Table 1.
Parameter values for estimating receiver efficiency [10,35].
Coconut husk biomass was selected due to its abundance in the Caribbean region, where it is widely reported as waste, and its suitable calorific value [37]. The heat released during combustion meets the thermal requirements of the reheater. The amount of biomass required is determined based on the reheater’s operating temperature, as established in Equation (16) [38].
where LHVBiomass is the calorific value of the coconut husk biomass. For exergy modeling, the chemical exergy of the biomass was calculated using Equation (17).
where β was estimated based on the results of the final analysis of the dry basis biomass of coconut husk, as shown in Equation (18) [38].
ṁBiomass = (QRHR)/(0.95 × LHVBiomass)
echx,Biomasa = β × LHVBiomass
β = [1.0414 + 0.0177 × (H/C) − 0.3328 ∙ (O/C) × (1 + 0.053) × (H/C)]/(1 − 0.4021 × (O/C))
Table 2 presents the values of the chemical composition of the biomass, determined from the proximate analysis on a dry basis.
Table 2.
Chemical composition of coconut shell biomass [18].
The terms H, C, and O in Equation (18) represent the mass percentages of hydrogen, carbon, and oxygen determined on a dry basis. Likewise, the exergy supplied by the biomass to the reheater and the exergy destroyed in these units are calculated using Equations (19) and (20), where ṁBiomass is the required amount of biomass and echx,Biomass is the chemical exergy of the same, estimated in Equations (16) and (17) [39].
Ėin/Biomass = ṁBiomass × echx,Biomass
ĖD/ft = Ėin/Biomass + (Ė2 − Ė3)
2.4. Life Cycle Assessment
This work employs Life Cycle Assessment (LCA) methodology to quantify the potential environmental impacts associated with the power block components and working fluids used in the SRC-DORC and SMC-DORC configurations throughout their service life. The assessment is performed using the Eco-indicator 99 method, which allows for the integration of different impact categories into a unified approach.
The Eco-indicator 99 method was selected due to its capability to integrate multiple environmental impact categories into a single aggregated indicator, facilitating the comparative evaluation of different system configurations. This method is widely used in energy systems analysis, particularly in studies involving thermodynamic cycles and renewable energy technologies, where a comprehensive assessment of environmental burdens is required [40].
Additionally, Eco-indicator 99 provides a damage-oriented approach, linking emissions to their effects on human health, ecosystem quality, and resource depletion. This feature allows for a more holistic interpretation of environmental impacts, which is particularly relevant for complex hybrid systems such as the one analyzed in this study. Therefore, its application is considered appropriate for capturing the overall environmental performance of the proposed configurations [41].
The study is conducted following the guidelines established in the ISO 14009 standard for environmental management, considering the stages of inventory definition, impact assessment, and results interpretation [21]. The scope of the analysis includes the manufacturing and assembly processes of materials, as well as the construction, operation and maintenance (O&M), and dismantling phases of the configurations, according to the scheme presented in Figure 6 [42].
Figure 6.
Life cycle assessment of the configurations studied.
The estimation of organic fluid losses throughout the different stages of the DORC cycle life cycle is based on the values reported by Michos et al. [43]. This study indicates that typical fluid losses in ORC systems range from 0 to 2% of the total volume. For a 20-year operating horizon, cumulative losses are projected to be less than 0.5%. However, losses of approximately 10% may occur during the operational phase, while values of around 3% are estimated for the dismantling phase.
On the other hand, the heat transfer area of the heat exchangers that make up the power block is determined using Equation (21) [30].
where U is the heat transfer coefficient, and Δt is the actual temperature difference. The mass of the heat exchangers is determined using Equation (22). For the rest of the system equipment, the mass is estimated using specific correlations, such as the one expressed in Equation (23), which is applied in the case of turbines, compressors, and pumps [44].
Aj = (1/U) × (Qj/Δt)
Mj = ρ × Aj × δ
Mj = α × Wj
In these equations, ρ represents the density of the constituent material of the components; in this case, steel, aluminum, and copper are considered. The parameter δ corresponds to the thickness of the material, adopted as 0.002 m, while α indicates the material quality. Wj represents the power generated or consumed by the equipment. The density and quality factor values are presented in Table 3 [45].
Table 3.
Quality and density of the material of each piece of equipment [44,45].
In this context, Equations (24) and (25) allow us to quantify, respectively, the total environmental impact associated with the system components and the contribution of the working fluid. Equation (26), for its part, expresses the overall carbon footprint considering the three stages of the life cycle analysis [42,44].
γj = ωj × Mj
γjTotal = γjLCA + γjωf
γjLCA = γjco + γjom + γjde
In these formulations, ωj represents the factor associated with the Eco-indicator 99 method, γjωf corresponds to the impact attributed to the working fluid, while γjco, γjom, and γjde reflect the environmental effects generated during the construction, operation, maintenance, and dismantling phases, respectively.
For the calculation of the solar system’s carbon footprint, the salts and fluids circulating within the concentrating solar power (CSP) tower are not included. Instead, only the impact associated with the solar field and the receiver is considered, modeled in the global warming potential (GWP) category following the approach proposed by Telsnig et al. [46].
It should be noted that the exclusion of certain elements of the solar field, such as the heat transfer fluids and molten salts circulating within the CSP system, represents a limitation of the present analysis. These components may contribute to the overall environmental impact, particularly in the construction and operation phases, due to their material composition and replacement requirements.
However, this simplification was adopted following the approach reported in the literature, where the main structural components of the solar field and receiver are considered the dominant contributors to environmental impact. Therefore, the results obtained provide a representative estimation of the system performance, although a more detailed assessment including these elements could be addressed in future work.
Regarding biomass, the furnace mass is estimated based on the methodology proposed by Guillén-Lambea et al. [47], which allows for the evaluation of the environmental impact linked to this heat source.
2.5. Model Validation
This section presents the validation of the thermodynamic models developed for the Brayton SMC-DORC and SRC-DORC configurations. Due to the limited availability of studies that directly integrate the Brayton SMC and SRC cycles with a dual-loop organic cycle (DORC), the verification is performed in a decoupled manner. Consequently, the models corresponding to the SMC, SRC, and DORC cycles are evaluated individually, and their results are compared with references reported in the literature. The operating conditions used in the energy simulations are shown in Table 4 and correspond to values similar to those used by other authors. All simulations were developed in Matlab 2018b.
Table 4.
Operating conditions for thermodynamic model validation.
It is important to note that the validation approach adopted in this study is based on the independent assessment of each subsystem, which is consistent with the availability of information reported in the literature. Although there are studies that integrate Brayton cycles with ORC systems, there are no references that consider configurations equivalent to the SMC-DORC and SRC-DORC systems analyzed in this work. Therefore, the validation is carried out in a decoupled manner, allowing each model to be evaluated using well-established benchmarks.
In addition, some of the reference data were obtained from graphical sources due to the lack of tabulated information in the literature. While this procedure may introduce minor uncertainties, the low relative errors and the agreement in trends indicate that the models present an adequate predictive capacity. It is also important to recognize that the absence of experimental or fully integrated validation constitutes a limitation of the study; however, this approach is widely used in theoretical thermodynamic analyses and is considered sufficient for the comparative evaluation carried out in this work.
Figure 7a,b show the variation in thermal efficiency as a function of the turbine inlet temperature, considering a range between 500 and 850 °C for the SMC and SRC configurations. In the case of the SMC Brayton cycle, the results show a trend consistent with those reported by Padilla et al. [10]. The lowest and highest relative errors are recorded at 700 and 800 °C, with values of 1.11% and 1.71%, respectively, demonstrating adequate predictive capacity of the model.
Figure 7.
Model validation: (a) Supercritical Brayton cycle SMC; (b) Supercritical Brayton cycle SRC; (c) Dual-Loop organic cycle (DORC).
The SRC configuration shows similar behavior, although with slightly higher deviations compared to the SMC case. At temperatures of 700 and 800 °C, relative errors of 1.82% and 2.43%, respectively, are obtained. It is important to note that the reference study presents the results only in graphical format, so it was necessary to estimate the numerical values from these curves. This procedure may introduce minor discrepancies; however, the overall agreement between both models can be considered satisfactory.
Figure 7c shows the heat recovery efficiency of the DORC cycle when the heat source temperature is varied between 130 and 200 °C. The results obtained show a trend comparable to that reported by Fontalvo [48], with relative errors of less than 1% and 3% for 130 °C and 200 °C, respectively.
Overall, the low magnitude of the errors and the similarity in the trends allow us to conclude that the developed models adequately reproduce the thermodynamic behavior of the SMC, SRC, and DORC cycles, thus supporting their application in the evaluation of the proposed hybrid configurations.
3. Results and Discussion
3.1. Hourly Simulation of Thermal Load
To determine the power required by the Brayton cycles to meet the energy demand of the residential complex, an hourly simulation of the cooling load was performed using eQUEST V 3.65 software (Energy QuickESTimate) [49]. The study was conducted for the city of Barranquilla, considering an average solar radiation of 930 W/m2 corresponding to a typical hot day in June 2025, a condition representative of the design climate scenario. The model included each of the complex’s dwellings with different orientations (North, South, East, and West), as shown in Figure 8, allowing for analysis of the influence of solar exposure on the cooling demand. Based on this configuration, the cooling load behavior was evaluated for each of the 24 h of the day, resulting in the hourly profile shown in Figure 9, which consolidates the simulation data under the established conditions.
Figure 8.
Orientation of the dwellings: (a) North; (b) South; (c) East; (d) West.
Figure 9.
Hourly simulation of thermal load demanded by the passenger compartments.
The comparative analysis revealed that the south-facing orientation presents the most demanding scenario from an energy perspective, as it registers the highest cooling load of the entire system. Specifically, a peak value of 2.15 kW was identified at 2:00 PM (see Table 5), the time when the greatest heat gains from radiation and ambient temperature coincide. This condition was adopted as the critical design scenario, given that it represents the point of highest demand that the generation system must be able to meet.
Table 5.
Maximum thermal load for each orientation.
Based on this maximum load and assuming a coefficient of performance (COP) of 3.5, a widely accepted value for commercial air conditioning systems, the electrical power required to meet the total cooling demand of the residential complex was estimated. Under these considerations, the Brayton cycles should supply approximately 130 kW, incorporating a 5% margin of error. This establishes the energy requirement that will serve as a reference for the thermodynamic sizing of the system.
3.2. Energy Analysis of Systems
This section evaluates the main energy indicators of the proposed configurations, including Net power, Thermal efficiency, Net power recovered through the DORC cycle, and the Absolute increase in efficiency due to the integration of the waste heat recovery system. The input variables used in the simulation generally correspond to those presented in Table 4 (Section 2.5), with the exception of some specific parameters such as the pressure ratios of the Brayton cycles and the condensation temperature of the DORC cycle, whose values are detailed in Table 6.
Table 6.
Input variables for simulation.
To ensure that the configurations could meet the energy demand of the residential complex (130 kW), a sensitivity analysis was performed by varying the turbine inlet temperature from 500 °C to 850 °C. Figure 10a shows the Net power output as a function of this variable. The results indicate that the required power is reached at approximately 650 °C for the SMC-DORC configuration and at 750 °C for the SRC-DORC system (see Table 7). These values were adopted as reference operating conditions for subsequent analyses. Furthermore, increasing the temperature within the evaluated range resulted in net power increases of 89.34% for the SMC-DORC configuration and 84.92% for the SRC-DORC configuration, demonstrating the strong dependence of system performance on the turbine inlet temperature.
Figure 10.
Effect of temperature on energy indicators: (a) Net power; (b) Thermal efficiency; (c) DORC net power; (d) Absolute efficiency increase.
Table 7.
Energy results obtained to supply the thermal load.
It is important to note that the SRC-DORC configuration requires approximately 100 °C more to generate the same power as the SMC-DORC system. This difference is explained by the intercooling effect present in the SMC cycle. In a cycle with intercooling, the working fluid (CO2) is cooled between compression stages, reducing its specific volume before entering the next compressor stage. Consequently, the total compression work required decreases. Since the net power of the cycle depends on the difference between the work produced by the turbine and the work consumed by the compressor, the reduction in compression work directly increases the net power of the system. Therefore, the SMC-DORC cycle achieves the required power at a lower temperature than the SRC-DORC cycle.
If both configurations operated at the same temperature (for example, 650 °C or 750 °C), the SMC-DORC system would deliver a greater Net power output. However, the objective of this study is not to make a comparison at a fixed temperature, but rather to evaluate each configuration under the conditions necessary to meet the thermal demand of the residential complex.
This approach ensures a fair comparison from a design perspective, where each configuration is evaluated based on its ability to meet the same energy demand under realistic operating conditions, rather than under identical thermodynamic constraints.
Figure 10b shows the Thermal efficiency behavior. At the selected design temperatures, the SMC-DORC configuration achieves an efficiency of 50.31% at 650 °C, while the SRC-DORC registers 53.24% at 750 °C. Furthermore, by increasing the turbine inlet temperature within the evaluated range, the thermal efficiency increases by 29.14% for the SMC-DORC system and by 25.47% for the SRC-DORC.
This behavior can be explained by fundamental thermodynamic principles. When the turbine inlet temperature increases, the enthalpy of the working fluid before expansion also increases. As a result, a greater amount of useful work can be extracted from the cycle. Additionally, the temperature difference between the hot and cold reservoirs increases, bringing the cycle’s efficiency closer to the theoretical limit established by the Carnot cycle. Consequently, both net power and thermal efficiency increase as the operating temperature rises [51].
Figure 10c shows the additional Net power generated by the DORC cycle through waste heat recovery. It can be seen that, for any evaluated inlet temperature, the SRC-DORC system produces more power in the background cycle. This is because the SRC cycle rejects a greater amount of heat compared to the SMC, providing a more abundant heat source for the DORC. Quantitatively, the configuration associated with the SRC recovers approximately 4 kW more than the SMC system.
Finally, Figure 10d shows the Absolute increase in thermal efficiency when integrating the DORC cycle. In both configurations, the addition of the waste heat recovery system improves overall performance. However, the increase is more significant in the SRC-DORC configuration, with an average increase of approximately 8%, while in the SMC-DORC system, the increase is around 4%.
This result explains why, in the 500–650 °C range, the SRC-DORC configuration exhibits higher efficiency than the SMC-DORC: the greater heat rejection of the SRC favors more effective recovery in the DORC. However, from approximately 700 °C upwards, the advantage of intercooling in the SMC cycle begins to dominate the system’s performance, significantly reducing the compression work and raising the net efficiency above that of the SRC-DORC configuration.
3.3. Exergetic Analysis of Systems
This section evaluates the main exergy indicators of the proposed configurations, including exergy efficiency, inlet exergy rate, exergy destroyed plus loss, and the Flue Depletion Ratio (FDR). Unlike conventional energy analysis, which only quantifies the amount of energy, exergy analysis allows for the evaluation of energy quality and the degree of irreversibility present in the processes. In this sense, exergy represents the maximum useful work that can be obtained when a system interacts with the reference environment. Therefore, exergy destruction is directly associated with internal irreversibilities of the system, such as friction, finite temperature gradients, non-ideal mixtures, and heat losses, providing a more accurate measure of actual thermodynamic performance.
Figure 11a shows the Exergy efficiency as a function of the turbine inlet temperature. For the selected operating conditions—650 °C in the SMC-DORC configuration and 750 °C in the SRC-DORC—exergy efficiencies of 28.15% and 27.52%, respectively, are obtained (see Table 8). Unlike the thermal efficiency, the SMC-DORC cycle exhibits slightly higher exergy performance at its design temperature. This indicates that, from the perspective of power quality and overall irreversibilities, the intercooled system makes better use of the supplied exergy.
Figure 11.
Effect of temperature on exergy indicators: (a) Exergy efficiency; (b) Input exergy; (c) Exergy destroyed + loss; (d) Flue Depletion Ratio.
Table 8.
Exergy results obtained to supply the thermal load.
It is also observed that Exergy efficiency increases with temperature, reaching a maximum around 650 °C. From this point, it begins to decrease. This behavior is explained by the fact that, in an initial range, the temperature increase raises the exergy available from the heat source, while radiation losses in the solar receiver remain relatively moderate. Consequently, the system converts a larger fraction of the supplied exergy into useful work (Figure 11b). However, at higher temperatures, although the input exergy continues to increase, radiation losses—proportional to the fourth power of the temperature—intensify significantly, increasing the irreversibilities of the solar block and reducing the overall exergy efficiency [10].
Figure 11b shows the Exergy input rate to the systems. It can be seen that the SMC-DORC configuration requires a higher exergy rate than the SRC-DORC. Although the SMC operates at a lower temperature, its heat requirements in the main heater and reheater are higher due to the cycle architecture and the intercooling effect. On average, the exergy input rate of the SMC-DORC system is approximately 21% higher than that of the SRC-DORC, which is equivalent to a difference of approximately 88 kW. Under the analyzed conditions, the SMC-DORC has an exergy input rate of 486 kW, while the SRC-DORC reports 474.83 kW (see Table 8).
Figure 11c shows the sum of Exergy destroyed and exergy lost to the environment. Consistent with the higher input exergy, the SMC-DORC cycle also exhibits a higher rate of exergy destroyed plus lost. The behavior of this indicator follows the same trend as the input exergy: it increases as the operating temperature increases. On average, the SMC-DORC system destroys approximately 20% more exergy than the SRC-DORC, which is consistent with its higher processed exergy flow rate (see Table 8).
Finally, Figure 11d presents the Flue Depletion Ratio (FDR), an indicator that expresses the fraction of exergy destroyed relative to the total exergy supplied to the system. Higher FDR values represent a greater degree of exergy degradation and, therefore, less utilization of the available energy quality [52]. For the operating conditions considered, the SRC-DORC cycle exhibits an FDR of 72.44%, while the SMC-DORC registers a slightly lower value of 71.85%, indicating a marginally more favorable exergy performance for the intercooled system (see Table 8).
Furthermore, it is observed that the FDR decreases as the temperature increases up to approximately 650 °C, and subsequently begins to increase. This behavior is directly related to exergy efficiency: initially, the increase in useful exergy generated by the power cycle compensates for the irreversibilities of the solar block; however, at higher temperatures, radiation losses become dominant, increasing exergy destruction and causing a progressive reduction in overall exergy performance.
From a physical perspective, the main sources of exergy destruction in the analyzed systems are associated with heat transfer processes in the solar receiver, heat exchangers (HTR and LTR), and the combustion process in the biomass furnace. In particular, the solar receiver represents a significant source of irreversibility due to high temperature gradients and radiative losses, which increase rapidly with operating temperature. Similarly, heat exchangers contribute to exergy destruction as a result of finite temperature differences during heat transfer between streams.
Additionally, differences between the SRC-DORC and SMC-DORC configurations can be partially explained by the compression process. In the SMC configuration, the inclusion of intercooling reduces the temperature of the working fluid between compression stages, decreasing compression work and improving the utilization of supplied exergy. However, this also leads to higher heat input requirements, which may increase exergy destruction in the thermal source. Therefore, the observed differences in exergy efficiency are the result of a trade-off between reduced compression irreversibilities and increased exergy input.
It should be noted that a detailed component-wise exergy destruction analysis was not included in this study, which represents a limitation. Such analysis would allow for a more precise identification of irreversibility sources and is proposed as future work.
3.4. Systems Life Cycle Assessment
This section evaluates the environmental impacts associated with the SRC-DORC and SMC-DORC configurations proposed in this study to meet the thermal demand of the residential complex. A system lifespan of 20 years and an annual operational availability of 7446 h for the equipment and working fluids are considered [53]. Under these conditions, the environmental impact of the power block components and the thermal sources used was determined, including the construction, operation, and dismantling phases.
In this context, Table 9 presents the power, heat, and heat transfer area values, parameters necessary to estimate the carbon footprint of each device, according to the methodology described in Section 2.4. Generally speaking, it can be observed that some equipment common to both configurations has higher power or heat exchange surface requirements depending on the operating scheme. For example, the main turbines of the SMC Brayton cycle reach a power of 207 kW, higher than the 180.29 kW obtained for the SRC Brayton cycle. Similarly, the sum of the compressor power in the SMC-DORC configuration is approximately 34% greater than in the SRC-DORC cycle, demonstrating higher energy consumption associated with the compression stage in that configuration.
Table 9.
Power, heat, and area values for the design condition of each configuration.
Table 10 shows the estimated masses of the working fluids (carbon dioxide and acetone) during the construction, operation, and dismantling phases. The total mass of fluids in the SMC-DORC cycle is approximately 14% greater than that of the SRC-DORC cycle. In both cases, carbon dioxide is the predominant fluid, representing approximately 95% and 98% of the total mass in the SRC-DORC and SMC-DORC cycles, respectively.
Table 10.
Mass of the working fluids in each of the LCA phases.
This predominance is explained by the fact that CO2 is used in significantly larger quantities than the organic fluid in the DORC cycle (acetone), which increases the system’s global warming potential [54]. Although supercritical CO2 offers advantages such as high thermal efficiency and the possibility of more compact designs, its implementation requires considerably larger mass inventories compared to the organic fluids used in conventional ORC cycles. Finally, it is determined that the construction phase accounts for approximately 89% of the total mass considered in the life cycle, while operation represents 9% and dismantling 2%.
Figure 12 presents the total environmental impact of each configuration based on the assumed construction material for the power block devices. Aluminum generates the greatest environmental impact in both configurations, with values of 265,497 and 281,037 kg CO2-equi for the SRC-DORC and SMC-DORC cycles, respectively. Copper follows with 262,836 and 278,006 kg CO2-equi, while steel has the lowest impact, with 256,731 and 270,888 kg CO2-equi for the SRC-DORC and SMC-DORC cycles. Regardless of the material selected, the SMC-DORC configuration has an environmental impact approximately 6% higher than that of the SRC-DORC system.
Figure 12.
Total environmental impact by type of material.
This difference is mainly attributed to the greater number of components and the higher power and heat transfer area requirements in the SMC-DORC configuration, which implies greater material consumption and, consequently, higher emissions associated with its manufacture and final disposal. These results agree with those reported by Alarcón et al. [22], who identified aluminum as the material with the largest carbon footprint in similar configurations.
On the other hand, Table 11 shows the percentage contribution of the thermal source to the total carbon footprint, considering the different materials of the power block. It is important to clarify that the contribution of the thermal source remains constant for the same system, regardless of the material used in the equipment, varying only between configurations. It can be observed that the solar-biomass system represents 93.45%, 91.28%, and 90.36% of the total in the SRC-DORC cycle, and 92.79%, 90.41%, and 89.44% in the SMC-DORC cycle, for steel, copper, and aluminum, respectively.
Table 11.
Percentage contribution of thermal sources to the total environmental impact.
These results are consistent with those reported by Xiao et al. [23], who indicate that the thermal source can account for approximately 92% of the total environmental impact of solar power plants. This high contribution is primarily due to the large quantity of materials required for the construction of the solar field, the extensive area needed for its installation, and the industrial processes associated with the manufacturing, transport, and assembly of its components. Furthermore, the production of elements such as mirrors, metal structures, and support systems demands significant energy consumption, which increases the emissions incorporated throughout their life cycle.
The incorporation of the coconut husk biomass kiln also increases the overall environmental impact due to the processes associated with its construction, operation, and maintenance. While biomass is considered a renewable resource, the kiln’s manufacture requires metallic materials, insulation, and coatings, the production of which generates emissions. Furthermore, the transport, conditioning, and preparation of the biomass involve the consumption of additional energy and resources, contributing to the system’s total environmental footprint [55].
Figure 13a,b show the carbon footprint of the power block components for the SRC-DORC and SMC-DORC cycles, respectively. In both configurations, turbines 1 and 2 make the largest contribution, accounting for between 70% and 79% of the total impact of the equipment, depending on the material selected.
Figure 13.
Environmental impact of components in the power block.
Compressors, for their part, contribute approximately between 10% and 13% of the total, while heat exchangers have variable contributions ranging from 3% to 13%, depending on the material and configuration analyzed.
These results are consistent with previous research [22,56], which indicates that turbines are the equipment that contributes most to the environmental impact within the Brayton cycle power block. This is because, as expansion devices subjected to high pressures and temperatures, they require robust designs and complex manufacturing processes, including precision machining and specialized heat treatments. Such processes increase the eco-indicator associated with their manufacture and, consequently, the emissions generated during the construction phase.
Figure 14 presents the total environmental impact broken down into the construction, operation, and dismantling phases for both configurations. In all cases evaluated, the construction phase dominates the life-cycle carbon footprint, exceeding 95% of the total impact, while dismantling represents approximately 4.53% and operation less than 1%.
Figure 14.
Total environmental impact by phase.
These results are consistent with the studies by Alarcón et al. [22] and Tovar et al. [56], who report that in Brayton sCO2 cycles coupled to ORC systems, the construction phase accounts for over 94% of the total environmental impact, also identifying aluminum as the material with the greatest contribution. Consequently, mitigation strategies should focus on optimizing structural design, reducing material use, and prioritizing those materials whose production has lower eco-indicators in order to decrease emissions incorporated during the construction stage.
Although the dominance of the construction phase is consistent with previous studies, this result should be interpreted with caution. The high contribution of this phase is strongly influenced by the assumptions adopted in the life cycle assessment, particularly the system lifespan, the allocation of impacts, and the exclusion of certain operational factors such as maintenance, component replacement, and potential performance degradation over time.
In this sense, the relatively low contribution of the operation phase (less than 1%) may be associated with the assumption of stable operating conditions and the use of renewable energy sources, which inherently reduce direct emissions during operation. However, in real applications, variations in operating conditions, maintenance requirements, and auxiliary energy consumption could increase the environmental impact associated with this phase. Therefore, while the results highlight the relevance of material selection and system design in reducing environmental impact, they should be understood within the context of the modeling assumptions adopted in this study.
The greater environmental impact of the SMC-DORC configuration compared to the SRC-DORC is related to its greater structural complexity. In particular, the presence of a third compressor and an additional intercooler implies greater material and heat exchange surface requirements, which increases emissions associated with the construction and dismantling phases for all the materials analyzed.
Finally, the larger carbon footprint associated with aluminum compared to copper and steel is explained by the high energy intensity required in its primary production. Although aluminum is a lightweight material, its manufacture demands large amounts of electrical energy, especially in the electrolysis process. Furthermore, due to its lower mechanical strength and thermal conductivity compared to copper, a larger volume of material may be required to meet the same structural or thermal requirements, thus increasing the total mass used and, consequently, the associated emissions [57].
Although the present study focuses on thermodynamic and environmental performance, it is important to briefly discuss the practical feasibility of the proposed configurations. From an economic perspective, systems based on sCO2 Brayton cycles coupled with ORC technologies are characterized by high initial investment costs, mainly associated with advanced materials, turbomachinery, and solar field infrastructure. However, their high efficiency and the possibility of integrating renewable energy sources such as solar energy and biomass can contribute to reducing operational costs over time, particularly in regions with high solar availability such as the Colombian Caribbean. Therefore, these systems present potential for long-term economic viability, especially when evaluated under a life cycle perspective [58].
From an operational standpoint, additional factors such as biomass supply and system maintenance should be considered. In the case of the proposed system, the use of coconut husk biomass represents a feasible option due to its local availability and low cost in the study region. Nevertheless, ensuring a stable and continuous biomass supply chain is essential for reliable operation, particularly during periods of low solar radiation. Furthermore, the integration of multiple subsystems (Brayton cycle, DORC, and hybrid heat sources) may increase maintenance requirements and system complexity. These aspects should be taken into account in future studies aimed at evaluating the techno-economic feasibility and real-world implementation of the proposed configurations [33].
3.5. Comparison of Results Under Homogeneous Operating Temperatures
In order to address the potential bias associated with comparing configurations at different operating temperatures, an additional analysis was conducted under homogeneous thermodynamic conditions. In this approach, both configurations (SRC-DORC and SMC-DORC) were evaluated at fixed turbine inlet temperatures of 650 °C and 750 °C, allowing the isolation of the effect of the cycle configuration from the influence of the operating point.
Table 12 presents the comparison of the main energy indicators under homogeneous temperature conditions. It is observed that, at both evaluated temperatures, the SMC-DORC configuration delivers a higher net power output compared to the SRC-DORC system. At 650 °C, the SMC-DORC reaches 136.56 kW, while the SRC-DORC generates 111.15 kW. This difference is maintained at 750 °C, where the SMC-DORC produces 161.48 kW compared to 130.69 kW in the SRC-DORC. This behavior is mainly attributed to the intercooling process present in the SMC cycle, which reduces the compression work and increases the net power output.
Table 12.
Comparison of energy results under homogeneous operating temperatures.
In terms of thermal efficiency, both configurations exhibit very similar values under homogeneous temperature conditions. At 650 °C, the SRC-DORC configuration shows a slightly higher thermal efficiency, reaching 50.35%, compared to 50.31% in the SMC-DORC. However, at 750 °C, the trend is reversed, and the SMC-DORC configuration achieves the highest value, with 53.58%, compared to 53.24% in the SRC-DORC. These results indicate that the relative thermal advantage between configurations depends on the operating temperature. Additionally, the SRC-DORC shows a higher contribution from the DORC cycle, as evidenced by the greater recovered net power and the higher increase in efficiency, which is associated with a larger amount of rejected heat available for recovery.
Table 13 shows the exergetic analysis under the same homogeneous conditions. The results indicate that the SMC-DORC configuration achieves slightly higher exergy efficiencies at both temperatures, with values of 28.15% at 650 °C and 28.24% at 750 °C, compared to 27.69% and 27.52% for the SRC-DORC. This suggests that the SMC cycle makes better use of the available exergy, mainly due to the reduction in irreversibilities in the compression process.
Table 13.
Comparison of exergy results under homogeneous operating temperatures.
However, it is also observed that the SMC-DORC configuration requires a higher exergy input and presents greater exergy destruction and losses compared to the SRC-DORC system. This behavior is consistent with the higher mass flow rates and energy processing capacity of the SMC configuration. Despite this, the Flue Depletion Ratio (FDR) remains slightly lower in the SMC-DORC system, indicating a marginally better utilization of the supplied exergy.
Finally, Table 14 presents the environmental assessment results under homogeneous temperature conditions. It is observed that the environmental impact associated with construction materials (steel, copper, and aluminum) is consistently higher in the SMC-DORC configuration. This is directly related to the greater size and complexity of the system components required to achieve higher power outputs. In particular, the contribution of materials increases with temperature in both configurations, reflecting the higher equipment requirements associated with more demanding operating conditions.
Table 14.
Comparison of LCA results under homogeneous operating temperatures.
Overall, the results obtained under homogeneous temperature conditions confirm that the differences observed between configurations are influenced not only by the cycle architecture but also by the selected operating point. While the SMC-DORC configuration shows advantages in terms of net power and exergy efficiency, the SRC-DORC system maintains competitive thermal performance and better utilization of waste heat. Therefore, both the thermodynamic conditions and the intrinsic characteristics of each configuration must be considered when evaluating their performance.
This complementary analysis strengthens the robustness of the comparative study and provides a more rigorous basis for interpreting the differences between configurations.
4. Conclusions
This study evaluated the energy, exergy, and environmental performance of two supercritical Brayton configurations: the Brayton cycle with recompression (SRC) and the Brayton cycle with recompression and intercooling in the main compression (SMC), both coupled to a dual-loop organic Rankine cycle (DORC) and powered by a hybrid solar-biomass system as the heat source. The configurations were sized to meet the cooling demand of a residential complex of 200 units, located in the Colombian Caribbean region and constructed with Asbestos cement.
From an energy perspective, it is concluded that both configurations are capable of meeting the total thermal load of the residential complex, estimated at 130 kW. The SMC-DORC system achieves this demand operating at a turbine inlet temperature of 650 °C, while the SRC-DORC system requires 750 °C to reach the same target. These conditions were established as design points for each configuration. Under these conditions, the SRC-DORC cycle exhibits greater thermal efficiency (53.24%) compared to the SMC-DORC cycle (50.31%), demonstrating better energy utilization when operating at higher temperatures.
In terms of exergy, the behavior is slightly different. The SMC-DORC cycle shows a higher exergy efficiency (28.15%) compared to the SRC-DORC (27.52%), because its operating point (650 °C) coincides with the region where both configurations exhibit the best performance in terms of exergy destruction. This indicates that, although the SRC-DORC is thermally more efficient at its design point, the SMC-DORC makes better use of the available power quality.
In environmental terms, the life cycle analysis revealed that the largest contribution to the total carbon footprint comes from the construction phase, representing over 95% of the overall impact in both configurations. This result is primarily associated with the energy intensity required for the production of structural materials and the manufacturing of the power block and hybrid thermal source components. Specifically, the solar-biomass system is the main contributor to the total environmental impact, exceeding 90% in most of the scenarios evaluated, due to the large quantity of materials required for the solar field and the industrial processes associated with their manufacturing, transport, and installation.
Additionally, it was identified that aluminum generates the largest carbon footprint compared to copper and steel, which is related to the high energy demand of its primary production. Meanwhile, the SMC-DORC configuration has a slightly higher environmental impact than the SRC-DORC due to the greater number of components—such as the additional compressor and intercooler—which increase material requirements and, therefore, the emissions associated with the construction and dismantling phases.
Based on the results obtained, it can be stated that both configurations are technically viable for supplying the energy demand of the proposed residential complex. However, considering the energy, exergy, and environmental indicators holistically, the SRC-DORC cycle emerges as the most suitable alternative for supplying the “small house,” as it offers greater thermal efficiency and a slightly lower environmental impact, although it requires operating at a higher temperature. Nevertheless, if exergy performance and a lower thermal requirement at the source are prioritized, the SMC-DORC cycle constitutes a competitive option.
Finally, it is concluded that integrating renewable energy sources with supercritical carbon dioxide Brayton cycles represents a promising strategy for addressing the challenges associated with growing energy demand and reducing environmental impact in the residential sector. Future research should focus on more comprehensive methodologies, such as exergo-environmental and exergo-economic analyses, as well as the application of multi-objective optimization techniques that allow for the simultaneous evaluation of thermodynamic, economic, and environmental variables. This would broaden the range of design parameters considered and strengthen decision-making in the early stages of technological planning.
Author Contributions
Conceptualization, G.V. and J.M.T.; methodology, J.M.T.; software, J.M.T.; validation, GV., J.M.T. and C.A.I.-R.; formal analysis, L.L.; investigation, J.M.T.; resources, C.A.I.-R.; data curation, G.V.; writing—original draft preparation, J.W.R.; writing—review and editing, G.V.; visualization, J.M.T.; supervision, C.A.I.-R.; project administration, J.W.R.; funding acquisition, G.V. All authors have read and agreed to the published version of the manuscript.
Funding
The authors thank Minciencias for funding the project entitled: Prototipo de sistema habitable modular en elementos constructivos no estructurales, as part of the Programa 938 Energía: Eficiencia Energética 2030: Transición hacia la construcción sostenible. This research is co-financed by the Universidad del Atlántico, Universidad Pontificia Bolivariana and Universidad EIA.
Institutional Review Board Statement
Not applicable.
Informed Consent Statement
Not applicable.
Data Availability Statement
The original contributions presented in this study are included in the article. Further inquiries can be directed to the corresponding author.
Acknowledgments
The authors express their gratitude to the Gestión Eficiente de la Energía research group, Kaí, at the Universidad del Atlántico for their academic and scientific support during the development of this work. They also thank the Universidad Pontifica Bolivariana and Universidad EIA for their institutional support and assistance in carrying out this research.
Conflicts of Interest
The authors declare that they have no conflicts of interest. The funders were not involved in the analysis and conduct of the study; in the collection, analysis, or interpretation of the data; in the writing of the manuscript; or in the decision to publish the results.
Abbreviations
The following abbreviations are used in this manuscript:
| ṁ | Mass flow [kg/s] |
| Ẇ | Power [kW] |
| Q | Heat [kW] |
| T | Temperature [°C] |
| h | Enthalpy [kJ/s] |
| s | Entropy [kJ/kgk] |
| Ė | Exergy [kJ/kg] |
| ĖD | Destroyed exergy [kW] |
| FDR | Flue depletion ratio [%] |
| A | Area [m2] |
| M | [kg] |
| ωj | Eco-indicator [kg CO2-equi/kg] |
| γjco | Environmental impact of construction [kg CO2-equi] |
| γjom | Environmental impact of operation [kg CO2-equi] |
| γjde | Environmental impact of dismantling [kg CO2-equi] |
| γjωf | Environmental impact of working fluid [kg CO2-equi] |
| γjLCA | Environmental impact total [kg CO2-equi] |
References
- Ghosh, S.K. Fossil Fuel Consumption Trend and Global Warming Scenario: Energy Overview. Glob. J. Eng. Sci. 2020, 5, 1–5. [Google Scholar] [CrossRef] [Scilit]
- International Energy Agency. Buildings—Energy Efficiency 2025 (IEA). Available online: https://www.iea.org/reports/energy-efficiency-2025/buildings? (accessed on 25 February 2026).
- United Nations Environment Programme. Global Status Report for Buildings and Construction 2024/2025. Available online: https://www.unep.org/resources/report/global-status-report-buildings-and-construction-20242025 (accessed on 25 February 2026).
- Moriarty, P.; Honnery, D. What is the global potential for renewable energy? Renew. Sustain. Energy Rev. 2012, 5, 244–252. [Google Scholar] [CrossRef] [Scilit]
- Blanco León, J.D. Potencial de Energía Solar Offshore en la Región del Caribe Colombiano. Master’s Thesis, Trabajo de Grado, Universidad Militar Nueva Granada, Bogotá, Colombia, June 2021. Available online: https://repository.unimilitar.edu.co/items/62de58f3-66b2-4937-bcbf-0e001ce55f38 (accessed on 26 September 2024).
- Banzon, J.A. The Coconut as a Renewable Energy Source. Available online: https://nast.dost.gov.ph (accessed on 26 September 2024).
- Anaya-Reyes, O.; Salgado-Transito, I.; Rodríguez-Alejandro, D.A.; Zaleta-Aguilar, A.; Martínez-Pérez, C.B.; Cano-Andrade, S. Analysis and Optimization of a s-CO2 Cycle Coupled to Solar, Biomass, and Geothermal Energy Technologies. Energies 2024, 17, 5077. [Google Scholar] [CrossRef] [Scilit]
- Liu, Y.; Wang, Y.; Huang, D. Supercritical CO2 Brayton cycle: A state-of-the-art review. Energy 2019, 189, 115900. [Google Scholar] [CrossRef] [Scilit]
- Al-Sulaiman, F.A.; Atif, M. Performance comparison of different supercritical carbon dioxide Brayton cycles integrated with a solar power tower. Energy 2015, 82, 61–71. [Google Scholar] [CrossRef] [Scilit]
- Padilla, R.V.; Soo Too, Y.C.; Benito, R.; Stein, W. Exergetic analysis of supercritical CO2 Brayton cycles integrated with solar central receivers. Appl. Energy 2015, 148, 348–365. [Google Scholar] [CrossRef] [Scilit]
- Chacartegui, R.; Muñoz De Escalona, J.M.; Sánchez, D.; Monje, B.; Sánchez, T. Alternative cycles based on carbon dioxide for central receiver solar power plants. Appl. Therm. Eng. 2011, 31, 872–879. [Google Scholar] [CrossRef] [Scilit]
- Campana, F.; Bianchi, M.; Branchini, L.; De Pascale, A.; Peretto, A.; Baresi, M.; Fermi, A.; Rossetti, N.; Vescovo, R. ORC waste heat recovery in European energy intensive industries: Energy and GHG savings. Energy Convers. Manag. 2013, 76, 244–252. [Google Scholar] [CrossRef] [Scilit]
- Lecompte, S.; Huisseune, H.; Van Den Broek, M.; Vanslambrouck, B.; De Paepe, M. Review of organic Rankine cycle (ORC) architectures for waste heat recovery. Renew. Sustain. Energy Rev. 2015, 47, 448–461. [Google Scholar] [CrossRef] [Scilit]
- Fan, G.; Song, J.; Zhang, J.; Fu, Z.; Gong, X.; Dai, Y.; Markides, C.N. Thermo-economic assessment and systematic comparison of combined supercritical CO2 and organic Rankine cycle (SCO2-ORC) systems for solar power tower plants. Appl. Therm. Eng. 2024, 236, 121715. [Google Scholar] [CrossRef] [Scilit]
- Besarati, S.M.; Goswami, D.Y. Analysis of Advanced Supercritical Carbon Dioxide Power Cycles with a Bottoming Cycle for Concentrating Solar Power Applications. J. Sol. Energy Eng. 2014, 136, 010904. [Google Scholar] [CrossRef] [Scilit]
- Habibi, H.; Zoghi, M.; Chitsaz, A.; Javaherdeh, K.; Ayazpour, M.; Bellos, E. Working fluid selection for regenerative supercritical Brayton cycle combined with bottoming ORC driven by molten salt solar power tower using energy–exergy analysis. Sustain. Energy Technol. Assess. 2020, 39, 100699. [Google Scholar] [CrossRef] [Scilit]
- Liang, Y.; Chen, J.; Luo, X.; Chen, J.; Yang, Z.; Chen, Y. Simultaneous optimization of combined supercritical CO2 Brayton cycle and organic Rankine cycle integrated with concentrated solar power system. J. Clean. Prod. 2020, 266, 121927. [Google Scholar] [CrossRef] [Scilit]
- Stand, L.M.; Ochoa, G.V.; Forero, J.D. Energy and exergy assessment of a combined supercritical Brayton cycle-orc hybrid system using solar radiation and coconut shell biomass as energy source. Renew. Energy 2021, 175, 119–142. [Google Scholar] [CrossRef] [Scilit]
- da Silva Morais, P.H.; Lodi, A.; Aoki, A.C.; Modesto, M. Energy, exergetic and economic analyses of a combined solar-biomass-ORC cooling cogeneration systems for a Brazilian small plant. Renew. Energy 2020, 157, 1131–1147. [Google Scholar] [CrossRef] [Scilit]
- Wang, X.; Liu, Q.; Bai, Z.; Lei, J.; Jin, H. Thermodynamic Analysis of the Cascaded Supercritical CO2 Cycle Integrated with Solar and Biomass Energy. Energy Procedia 2017, 105, 445–452. [Google Scholar] [CrossRef] [Scilit]
- ISO. Environmental Management the ISO 14000 Family of International Standards. 2009. Available online: https://www.iso.org/files/live/sites/isoorg/files/archive/pdf/en/theiso14000family_2009.pdf (accessed on 26 September 2024).
- Alarcón, V.M.; Ochoa, G.V.; Castilla, D.V. Energetic, exergetic, and carbon footprint performance assessment of a combined renewable simple and recompressed Brayton S-CO2/ORC system. Energy Rep. 2024, 12, 3114–3133. [Google Scholar] [CrossRef] [Scilit]
- Xiao, T.; Liu, C.; Wang, X.; Wang, S.; Xu, X.; Li, Q.; Li, X. Life cycle assessment of the solar thermal power plant integrated with air-cooled supercritical CO2 Brayton cycle. Renew. Energy 2022, 182, 119–133. [Google Scholar] [CrossRef] [Scilit]
- Abam, F.I.; Okon, B.B.; Edem, I.F.; Ndukwu, M.C.; Ekpo, E.B.; Diemuodeke, O.E. Environmental assessment and CO2 emissions of Brayton cycle configurations based on exergo-sustainability, economic and ecological efficiency using multi-criteria optimization technique. Future Technol. 2024, 3, 1–12. [Google Scholar] [CrossRef] [Scilit]
- Kim, Y.M.; Kim, C.G.; Favrat, D. Transcritical or supercritical CO2 cycles using both low- and high-temperature heat sources. Energy 2012, 43, 402–415. [Google Scholar] [CrossRef] [Scilit]
- Sarkar, J. Second law analysis of supercritical CO2 recompression Brayton cycle. Energy 2009, 34, 1172–1178. [Google Scholar] [CrossRef] [Scilit]
- Akroot, A.; Almaktar, M.; Alasali, F. The Integration of Renewable Energy into a Fossil Fuel Power Generation System in Oil-Producing Countries: A Case Study of an Integrated Solar Combined Cycle at the Sarir Power Plant. Sustainability 2024, 16, 4820. [Google Scholar] [CrossRef] [Scilit]
- Seyed Mahmoudi, S.M.; Sardroud, R.G.; Sadeghi, M.; Rosen, M.A. Integration of Supercritical CO2 Recompression Brayton Cycle with Organic Rankine/Flash and Kalina Cycles: Thermoeconomic Comparison. Sustainability 2022, 14, 8769. [Google Scholar] [CrossRef] [Scilit]
- Zare, V.; Hasanzadeh, M. Energy and exergy analysis of a closed Brayton cycle-based combined cycle for solar power tower plants. Energy Convers. Manag. 2016, 128, 227–237. [Google Scholar] [CrossRef] [Scilit]
- Ma, H.; Liu, Z. An Engine Exhaust Utilization System by Combining CO2 Brayton Cycle and Transcritical Organic Rankine Cycle. Sustainability 2022, 14, 1276. [Google Scholar] [CrossRef] [Scilit]
- Abdelghafar, M.M.; Hassan, M.A.; Kayed, H. Comprehensive analysis of combined power cycles driven by sCO2-based concentrated solar power: Energy, exergy, and exergoeconomic perspectives. Energy Convers. Manag. 2024, 301, 118046. [Google Scholar] [CrossRef] [Scilit]
- Kerme, E.D.; Chafidz, A.; Agboola, O.P.; Orfi, J.; Fakeeha, A.H.; Al-Fatesh, A.S. Energetic and exergetic analysis of solar-powered lithium bromide-water absorption cooling system. J. Clean. Prod. 2017, 151, 60–73. [Google Scholar] [CrossRef] [Scilit]
- Pantaleo, A.M.; Camporeale, S.M.; Sorrentino, A.; Miliozzi, A.; Shah, N.; Markides, C.N. Hybrid solar-biomass combined Brayton/organic Rankine-cycle plants integrated with thermal storage: Techno-economic feasibility in selected Mediterranean areas. Renew. Energy 2020, 147, 2913–2931. [Google Scholar] [CrossRef] [Scilit]
- Petela, R. Exergy of undiluted thermal radiation. Sol. Energy 2003, 74, 469–488. [Google Scholar] [CrossRef] [Scilit]
- Ho, C.K.; Iverson, B.D. Review of high-temperature central receiver designs for concentrating solar power. Renew. Sustain. Energy Rev. 2014, 29, 835–846. [Google Scholar] [CrossRef] [Scilit]
- NASA. Prediction Of Worldwide Energy Resource. Centro de Investigación Langley de la NASA. Available online: https://power.larc.nasa.gov/ (accessed on 9 August 2025).
- Forero-Nuñez, C.A.; Cediel-Ulloa, A.; Rivera-Gil, J.L.; Suaza-Montalvo, A.; Sierra-Vargas, F. Estudio preliminar del potencial energético de cuesco de palma y cáscara de coco en Colombia. Rev. Ing. Solidar. 2012, 8, 19–25. Available online: https://revistas.ucc.edu.co/index.php/in/article/view/340/347 (accessed on 17 April 2026).
- Wang, X.; Liu, Q.; Bai, Z.; Lei, J.; Jin, H. Thermodynamic investigations of the supercritical CO2 system with solar energy and biomass. Appl. Energy 2018, 227, 108–118. [Google Scholar] [CrossRef] [Scilit]
- Tovar, J.M.; Ochoa, G.V.; Molina, B. 3E Comparative Analysis of Brayton–ORC Cycle Using Two Thermal Sources: Solar Energy and Coconut Shell Biomass. Eng 2024, 5, 3335–3357. [Google Scholar] [CrossRef] [Scilit]
- Hauschild, M.Z.; Rosenbaum, R.K.; Olsen, S.I. (Eds.) Life Cycle Assessment Theory and Practice, 1st ed.; Springer International Publishing: Cham, Switzerland, 2018; Available online: https://link.springer.com/book/10.1007/978-3-319-56475-3#accessibility-information (accessed on 13 April 2026).
- Huijbregts, M.A.J.; Steinmann, Z.J.N.; Elshout, P.M.F.; Stam, G.; Verones, F.; Viera, M.; Zijp, M.; Hollander, A.; van Zelm, R. ReCiPe2016: A harmonised life cycle impact assessment method at midpoint and endpoint level. Int. J. Life Cycle Assess. 2017, 22, 138–147. [Google Scholar] [CrossRef] [Scilit]
- Liu, C.; He, C.; Gao, H.; Xie, H.; Li, Y.; Wu, S.; Xu, J. The environmental impact of organic Rankine cycle for waste heat recovery through life-cycle assessment. Energy 2013, 56, 144–154. [Google Scholar] [CrossRef] [Scilit]
- Michos, C.N.; Lion, S.; Vlaskos, I.; Taccani, R. Analysis of the backpressure effect of an Organic Rankine Cycle (ORC) evaporator on the exhaust line of a turbocharged heavy duty diesel power generator for marine applications. Energy Convers. Manag. 2017, 132, 347–360. [Google Scholar] [CrossRef] [Scilit]
- Ding, Y.; Liu, C.; Zhang, C.; Xu, X.; Li, Q.; Mao, L. Exergoenvironmental model of Organic Rankine Cycle system including the manufacture and leakage of working fluid. Energy 2018, 145, 52–64. [Google Scholar] [CrossRef] [Scilit]
- Thakar, R.; Bhosle, S.; Lahane, S. Design of Heat Exchanger for Waste Heat Recovery from Exhaust Gas of Diesel Engine. Procedia Manuf. 2018, 20, 372–376. [Google Scholar] [CrossRef] [Scilit]
- Telsnig, T.; Weinrebe, G.; Finkbeiner, J.; Eltrop, L. Life cycle assessment of a future central receiver solar power plant and autonomous operated heliostat concepts. Sol. Energy 2017, 157, 187–200. [Google Scholar] [CrossRef] [Scilit]
- Guillén-Lambea, S.; Pina, E.A.; Serra, L.M.; Lozano, M.A.; Lazaro, A. Environmental assessment of medium-size solar organic Rankine Cycle cogeneration plants. Appl. Therm. Eng. 2022, 213, 118692. [Google Scholar] [CrossRef] [Scilit]
- Fontalvo Lascano, A. Análisis Termoeconómico de la Aplicación de un Ciclo Rankine Orgánico para Aprovecha-Miento de Calor de Cesecho de Baja Temperatura. Master’s Thesis, Universidad del Norte, Barranquilla, Colombia, 2015. Available online: https://manglar.uninorte.edu.co/handle/10584/10728#page=6 (accessed on 10 June 2025).
- Hirsch, J. eQUEST the QUick Energy Simulation Tool. DOE. Available online: https://www.doe2.com/equest/ (accessed on 2 March 2026).
- Padilla, R.V.; Soo Too, Y.C.; Benito, R.; McNaughton, R.; Stein, W. Multi-objective thermodynamic optimisation of supercritical CO2 Brayton cycles integrated with solar central receivers. Int. J. Sustain. Energy 2018, 37, 1–20. [Google Scholar] [CrossRef] [Scilit]
- Zhai, H.; Wang, S.; An, B.; Dai, X. Performance and parameter sensitivity comparison of CSP power cycles under wide solar energy temperature ranges and multiple working conditions. Energy Convers. Manag. 2020, 218, 112996. [Google Scholar] [CrossRef] [Scilit]
- Kerme, E.D.; Orfi, J.; Fung, A.S.; Salilih, E.M.; Khan, S.U.-D.; Alshehri, H.; Ali, E.; Alrasheed, M. Energetic and exergetic performance analysis of a solar driven power, desalination and cooling poly-generation system. Energy 2020, 196, 117150. [Google Scholar] [CrossRef] [Scilit]
- Shengjun, Z.; Huaixin, W.; Tao, G. Performance comparison and parametric optimization of subcritical Organic Rankine Cycle (ORC) and transcritical power cycle system for low-temperature geothermal power generation. Appl. Energy 2011, 88, 2740–2754. [Google Scholar] [CrossRef] [Scilit]
- Dai, B.; Li, M.; Ma, Y. Thermodynamic analysis of carbon dioxide blends with low GWP (global warming potential) working fluids-based transcritical Rankine cycles for low-grade heat energy recovery. Energy 2014, 64, 942–952. [Google Scholar] [CrossRef] [Scilit]
- Longo, S.; Cellura, M.; Guarino, F.; La Rocca, V.; Maniscalco, G.; Morale, M. Embodied energy and environmental impacts of a biomass boiler: A life cycle approach. AIMS Energy 2015, 3, 214–226. [Google Scholar] [CrossRef] [Scilit]
- Tovar, J.M.; Ochoa, G.V.; Casseres, D.M. Thermodynamic and environmental comparative analysis of a dual loop ORC and Kalina as bottoming cycle of a solar Brayton sCO2. Int. J. Thermofluids 2024, 24, 100895. [Google Scholar] [CrossRef] [Scilit]
- Ashkenazi, D. How aluminum changed the world: A metallurgical revolution through technological and cultural perspectives. Technol. Forecast. Soc. Change 2019, 143, 101–113. [Google Scholar] [CrossRef] [Scilit]
- Ochoa, G.V.; Peñaloza, C.A.; Forero, J.D. Thermo-economic assessment of a gas microturbine-absorption chiller trigeneration system under different compressor inlet air temperatures. Energies 2019, 12, 4643. [Google Scholar] [CrossRef] [Scilit]
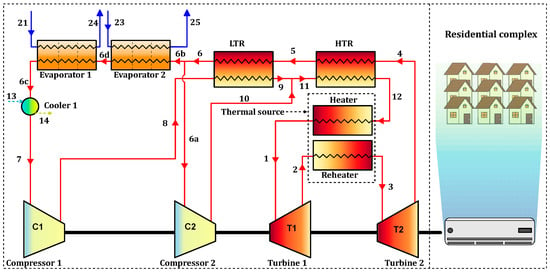
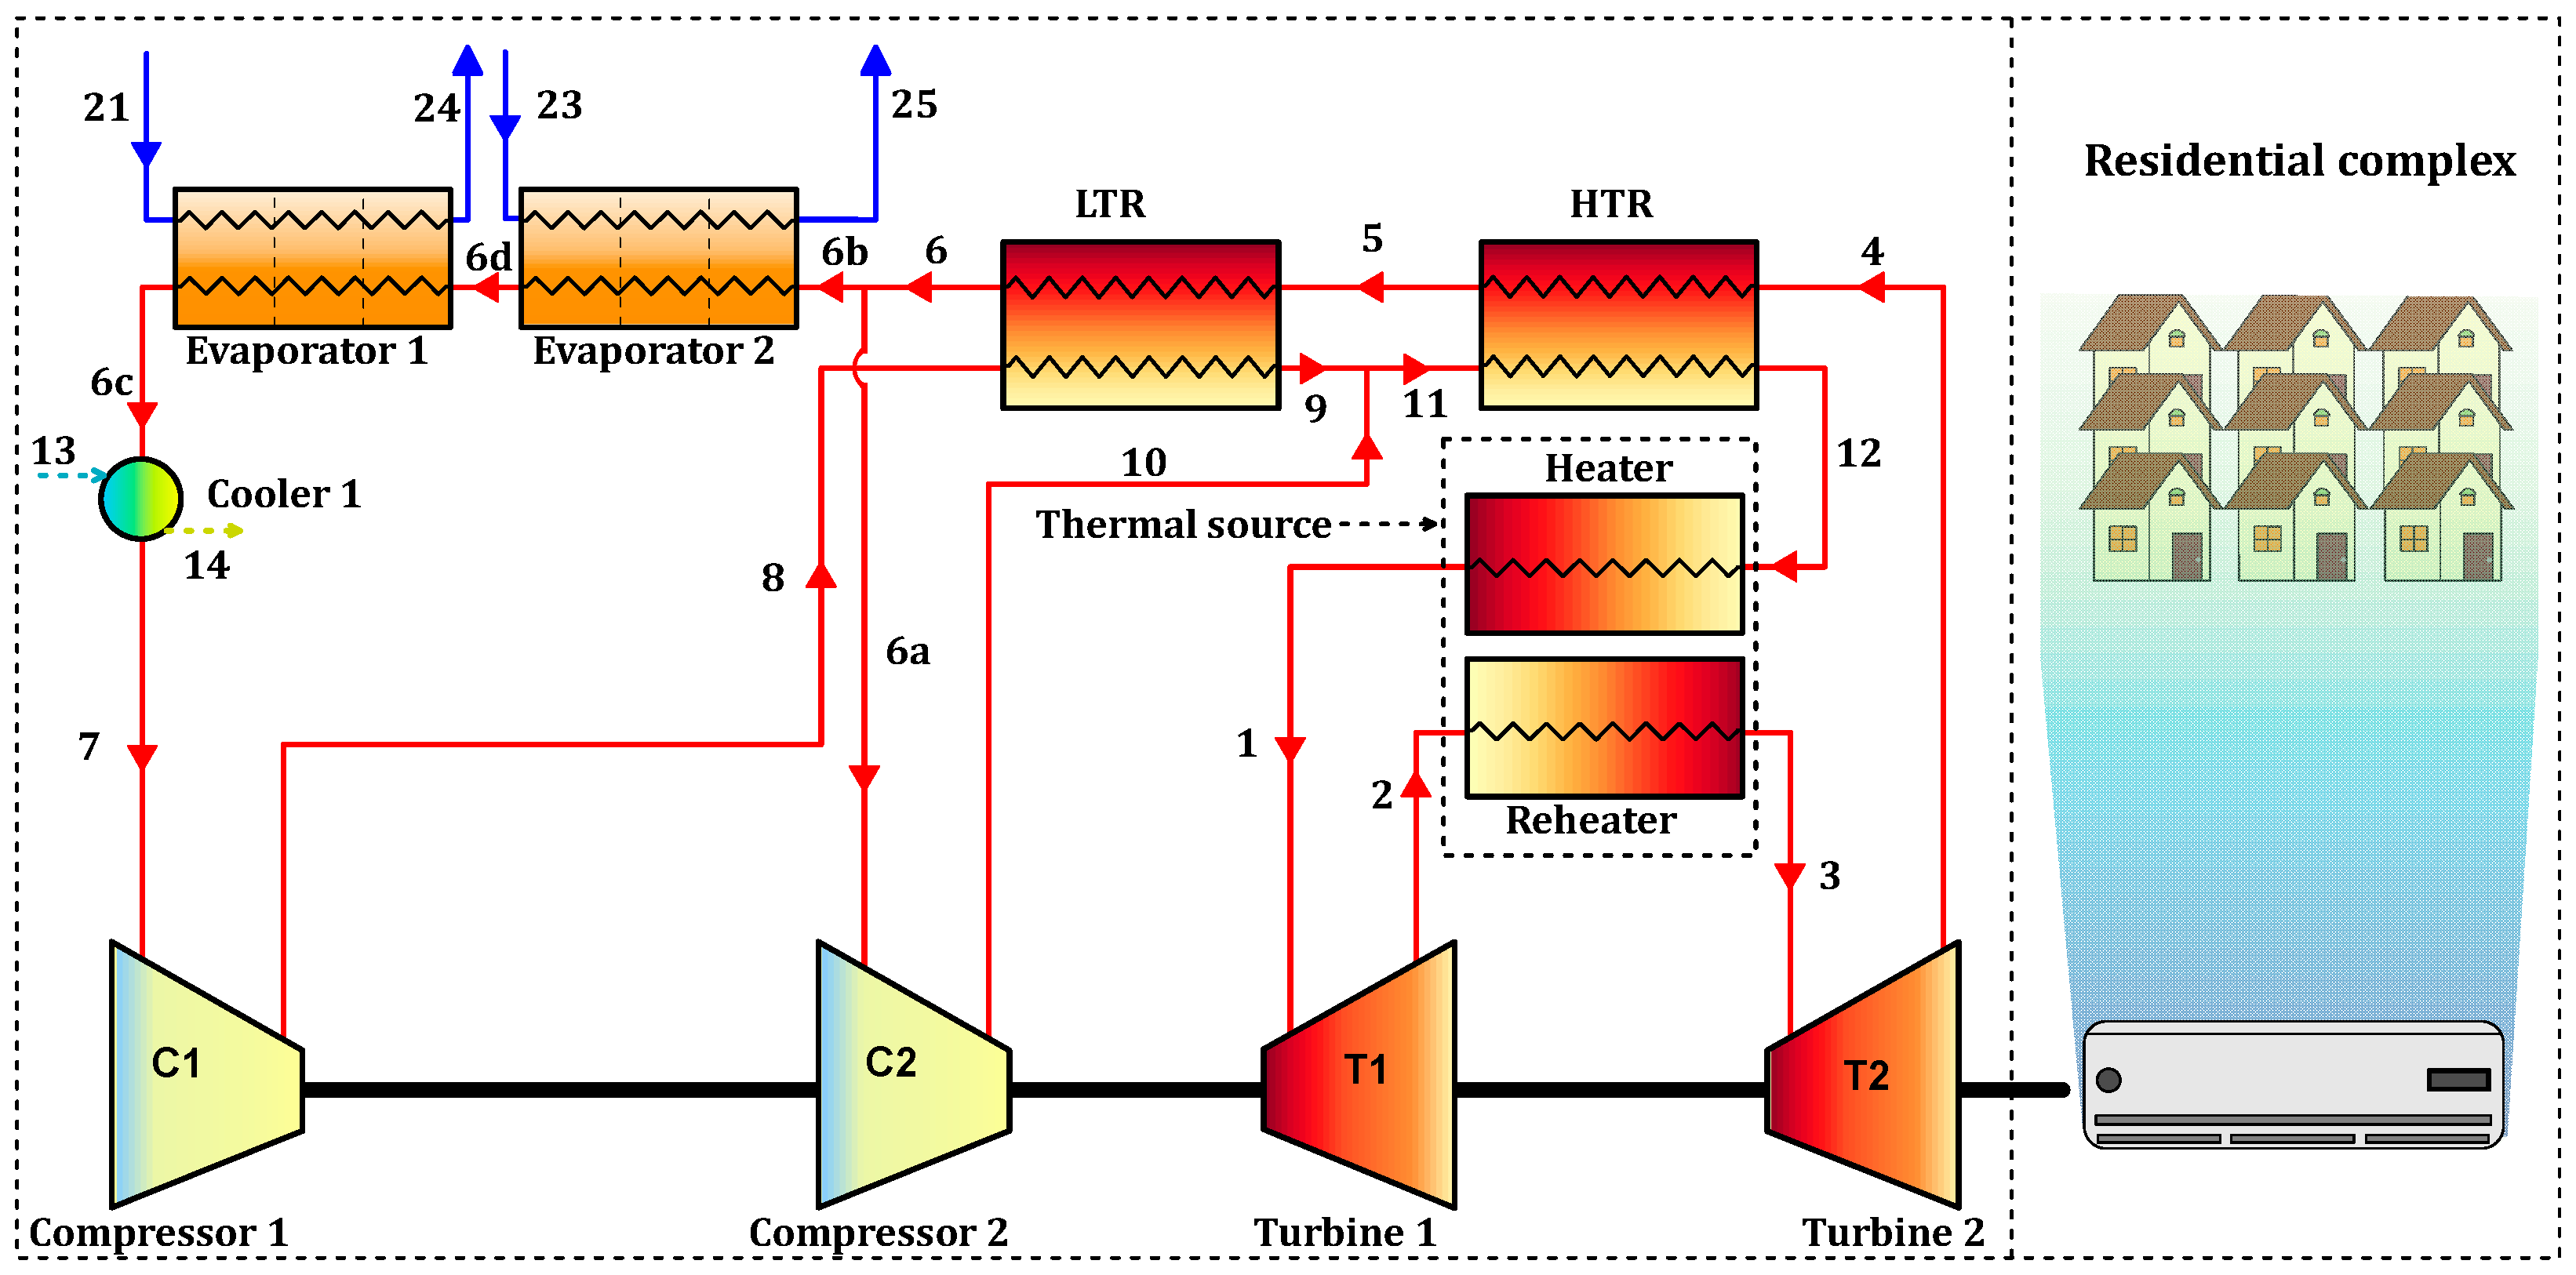
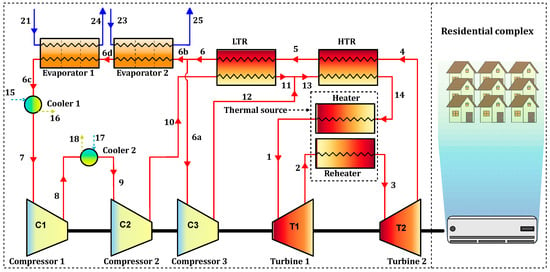
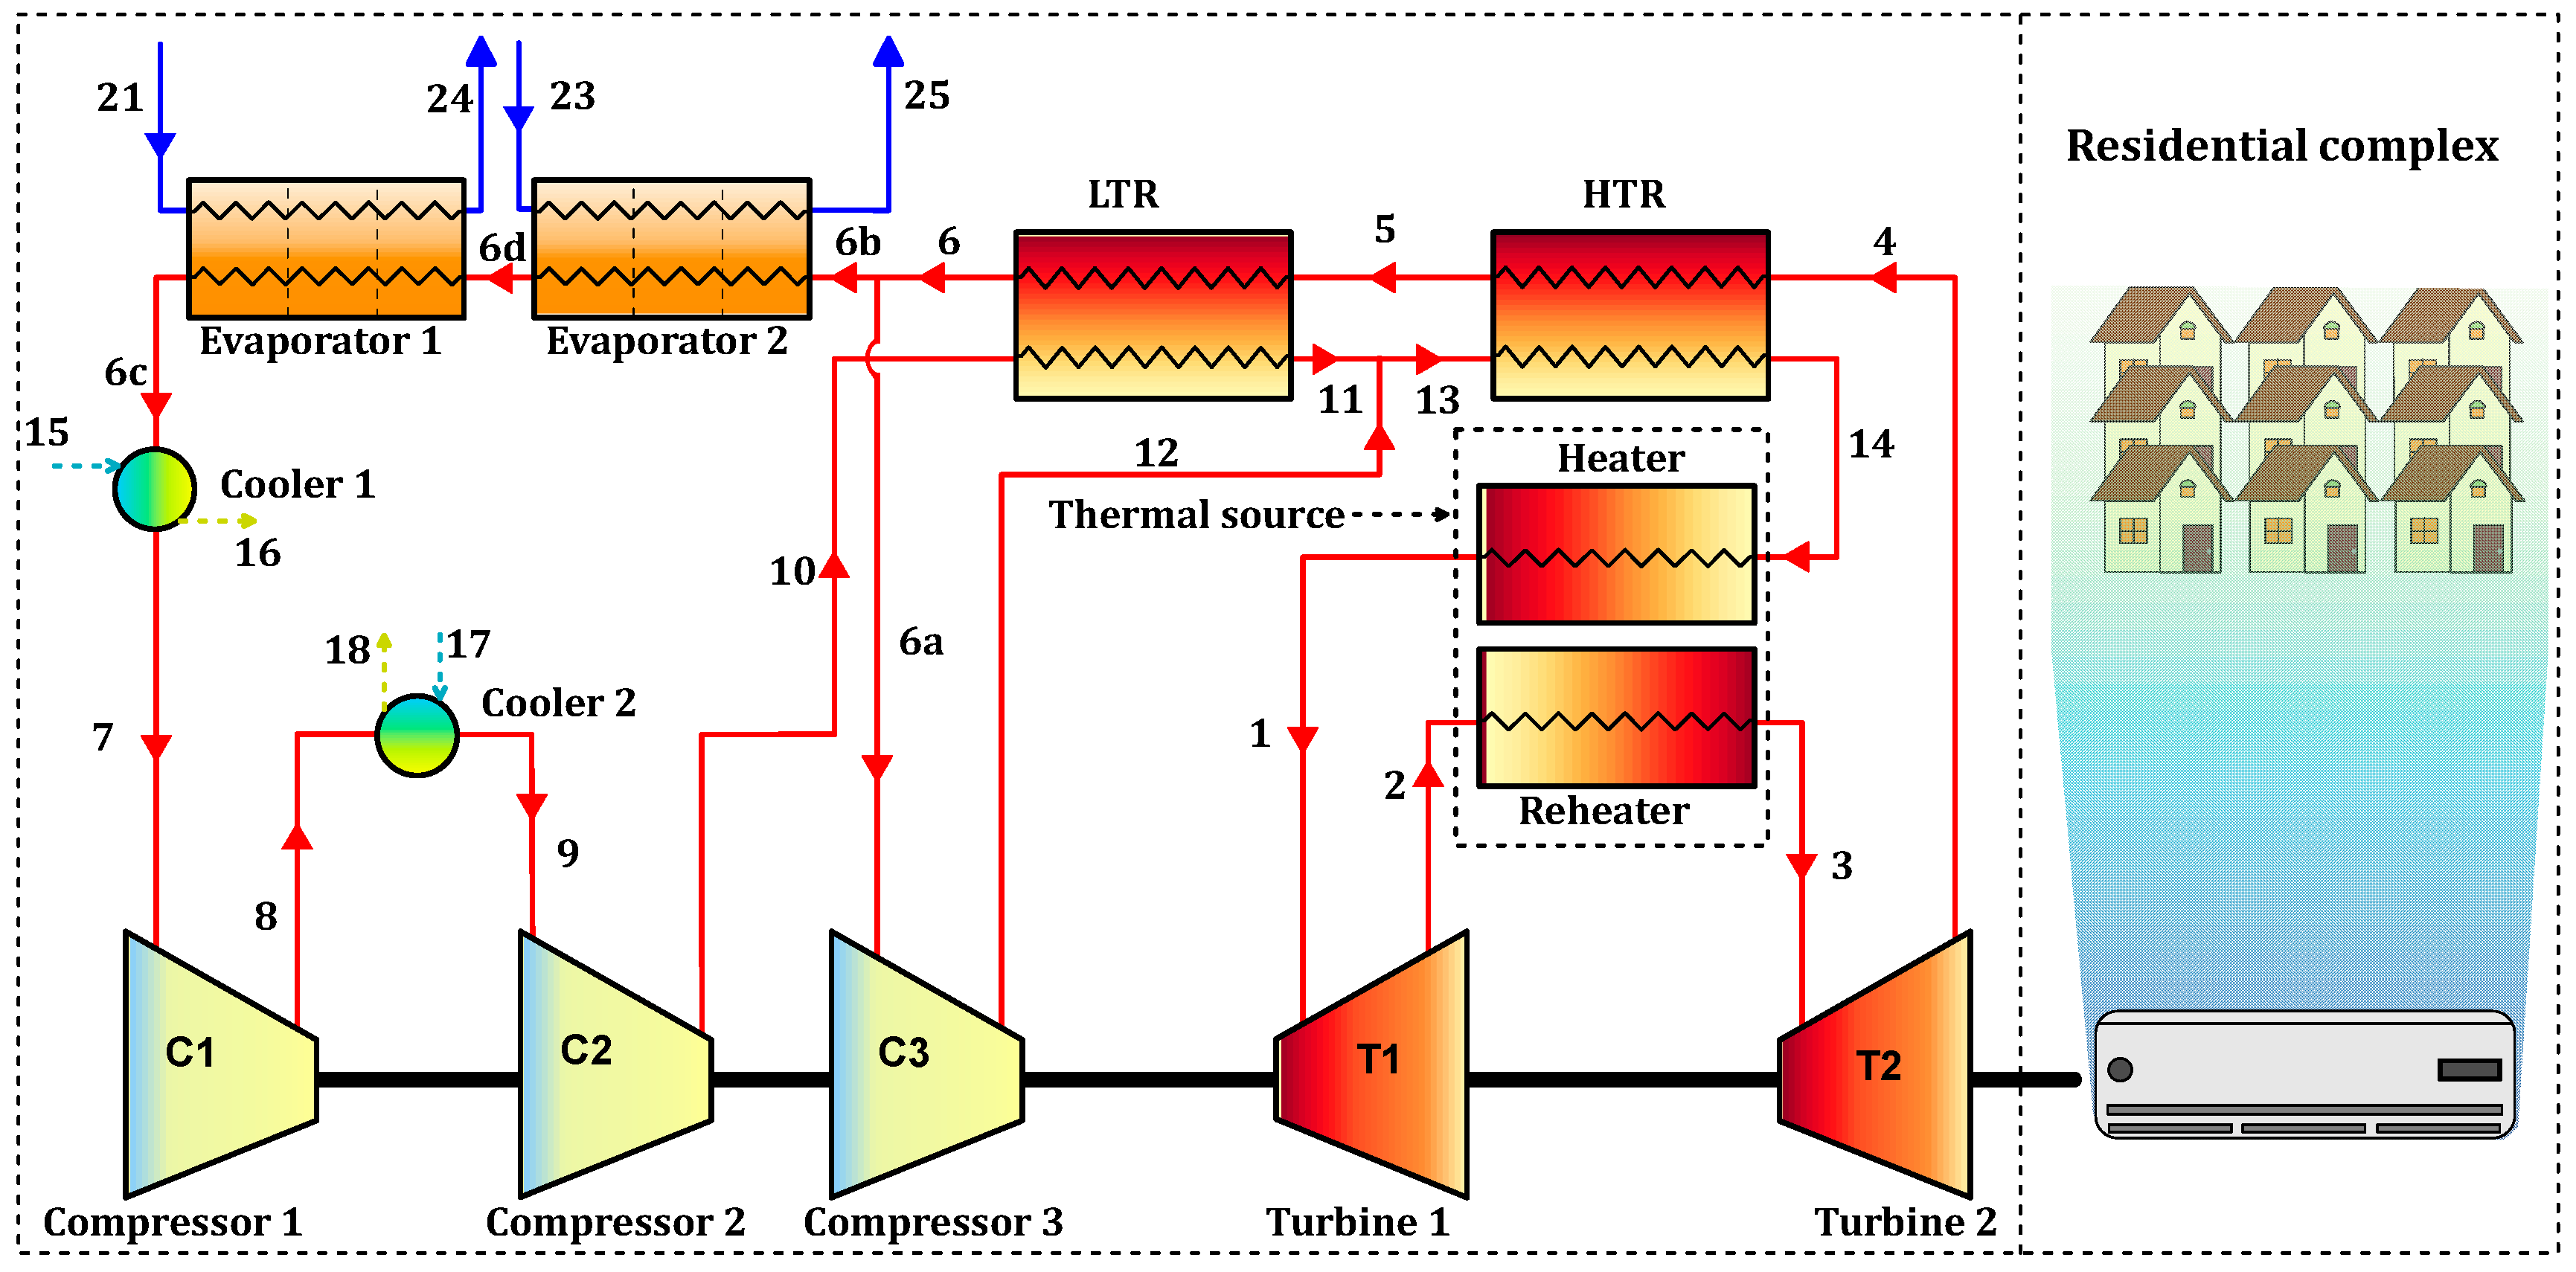
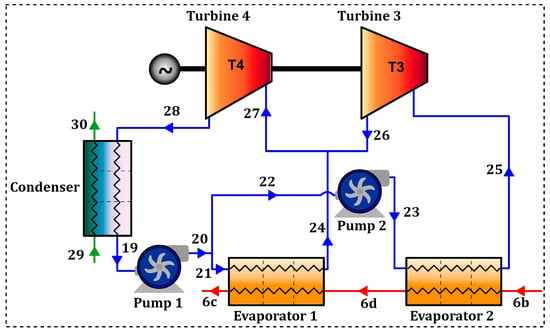
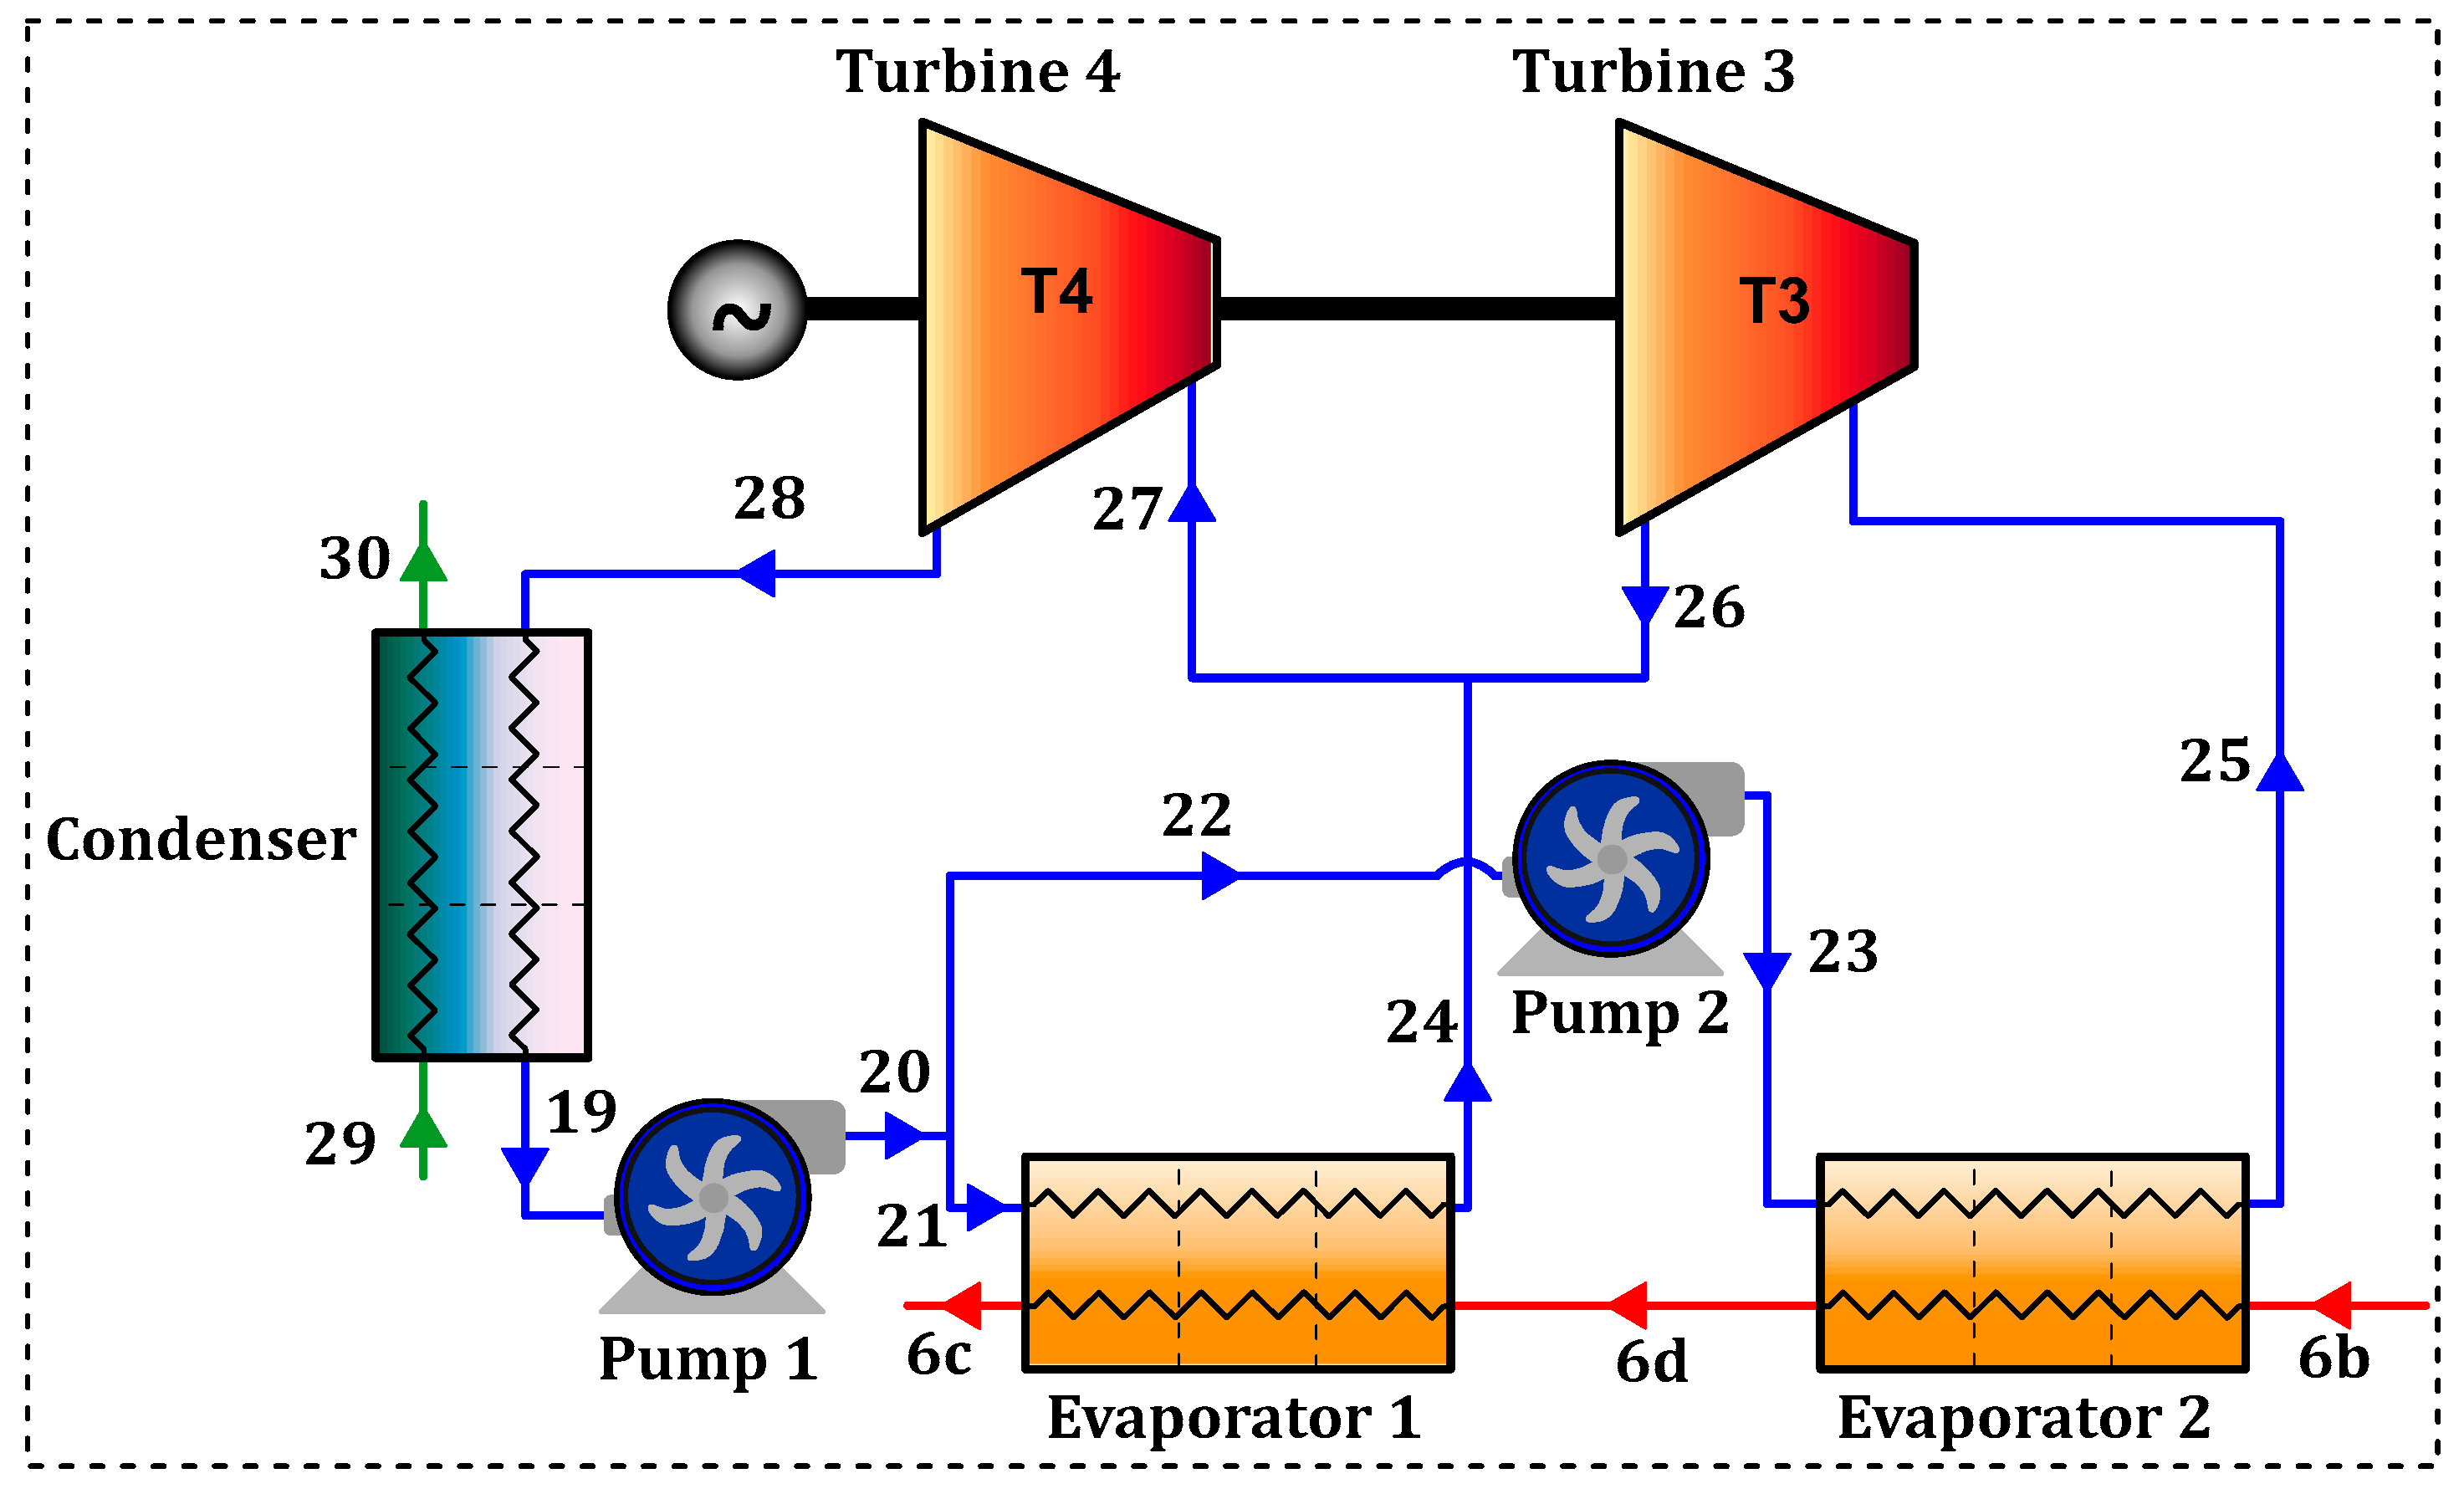
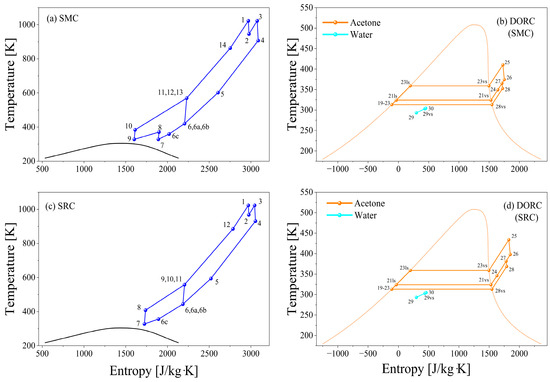
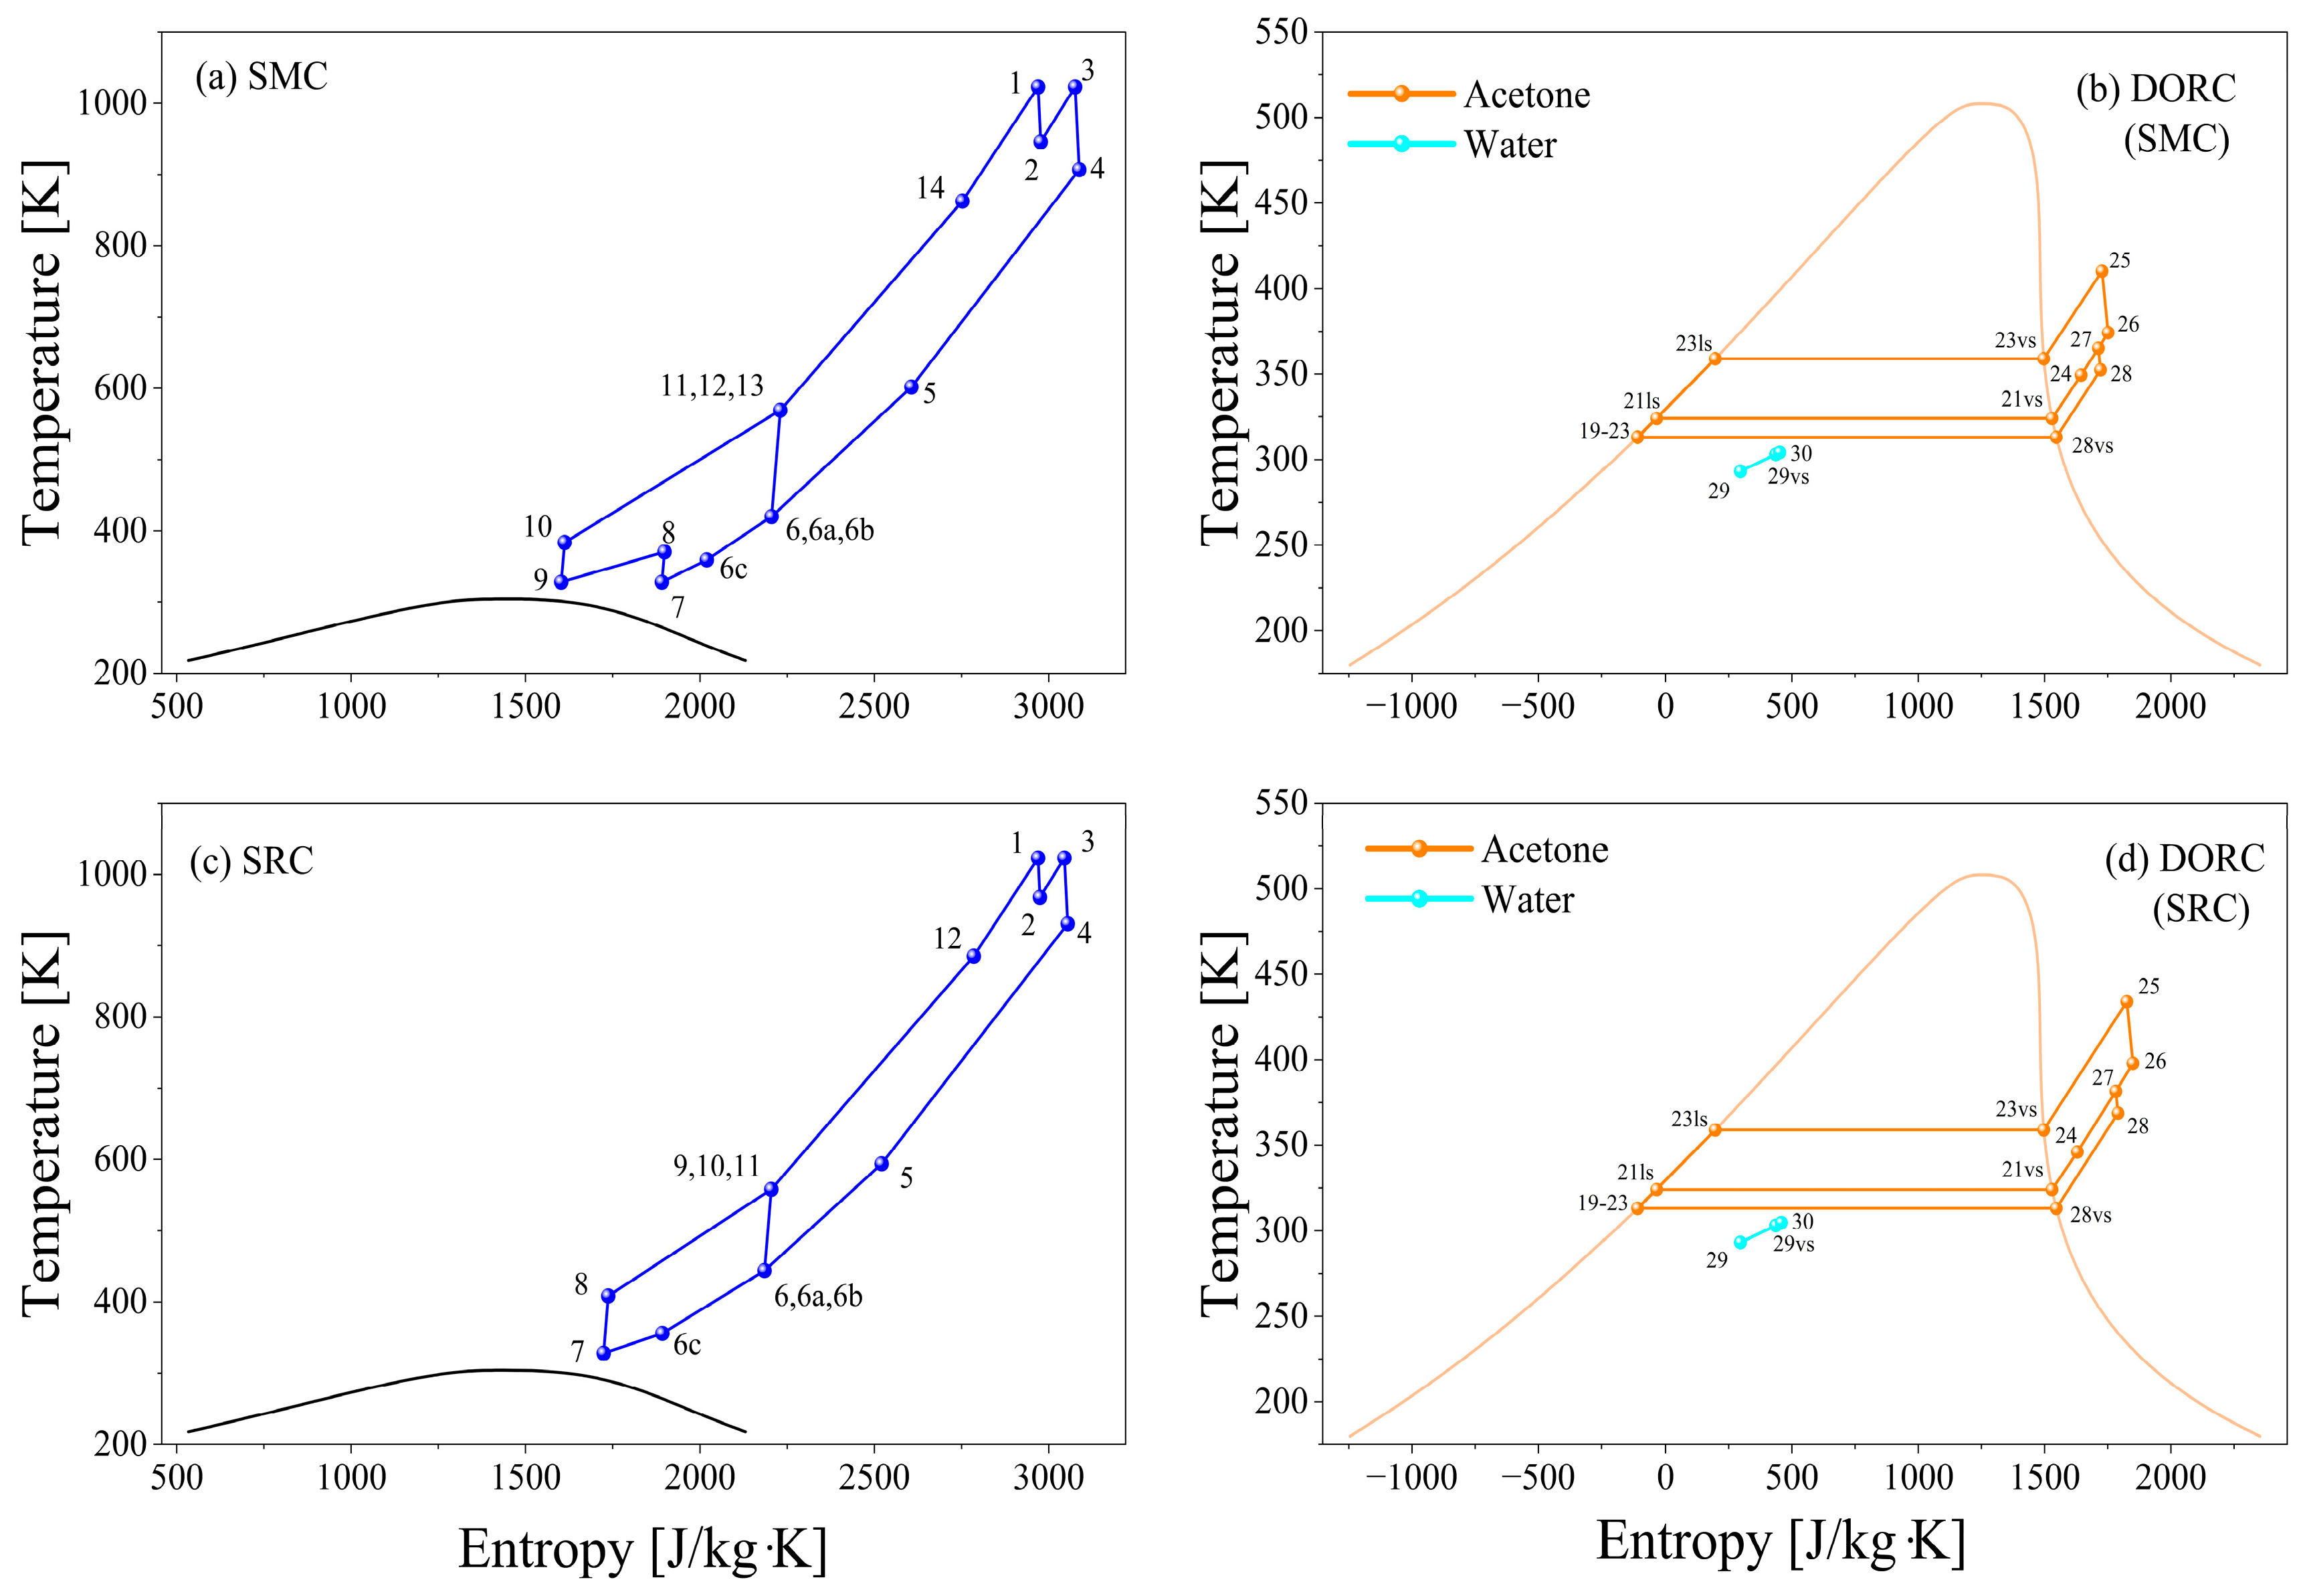
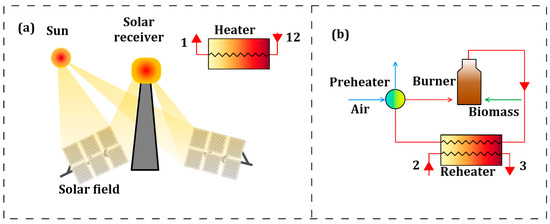
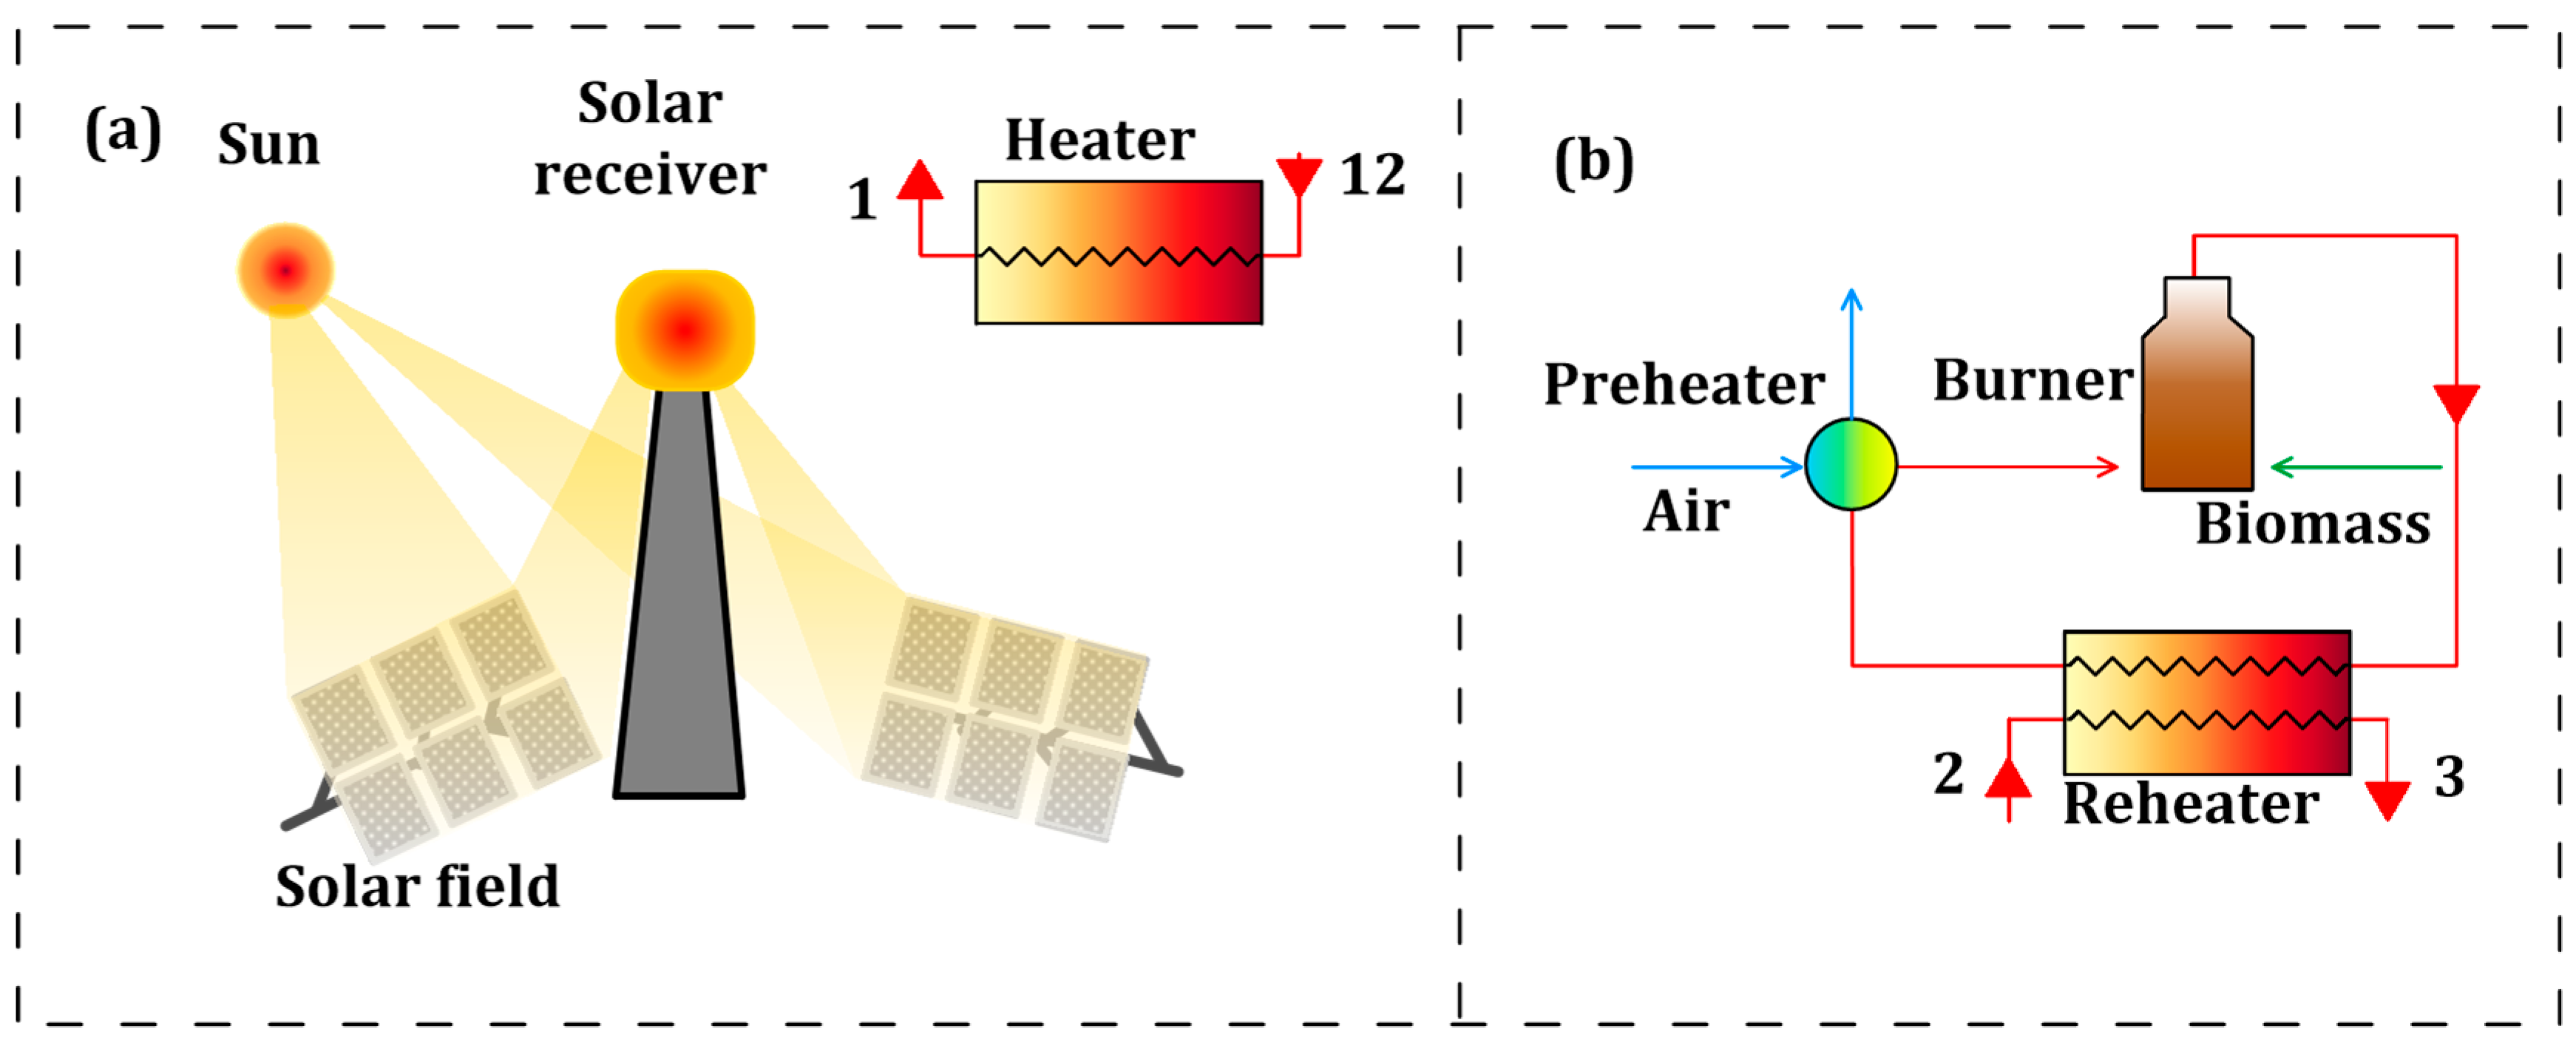
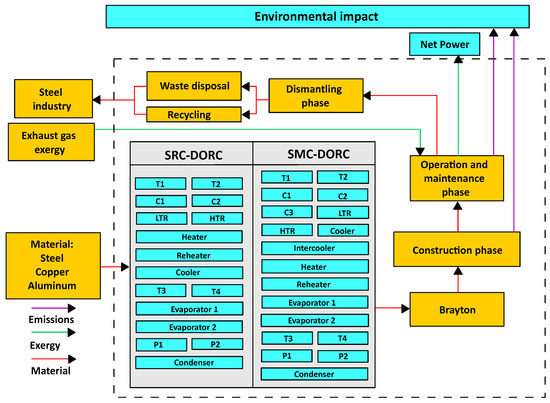
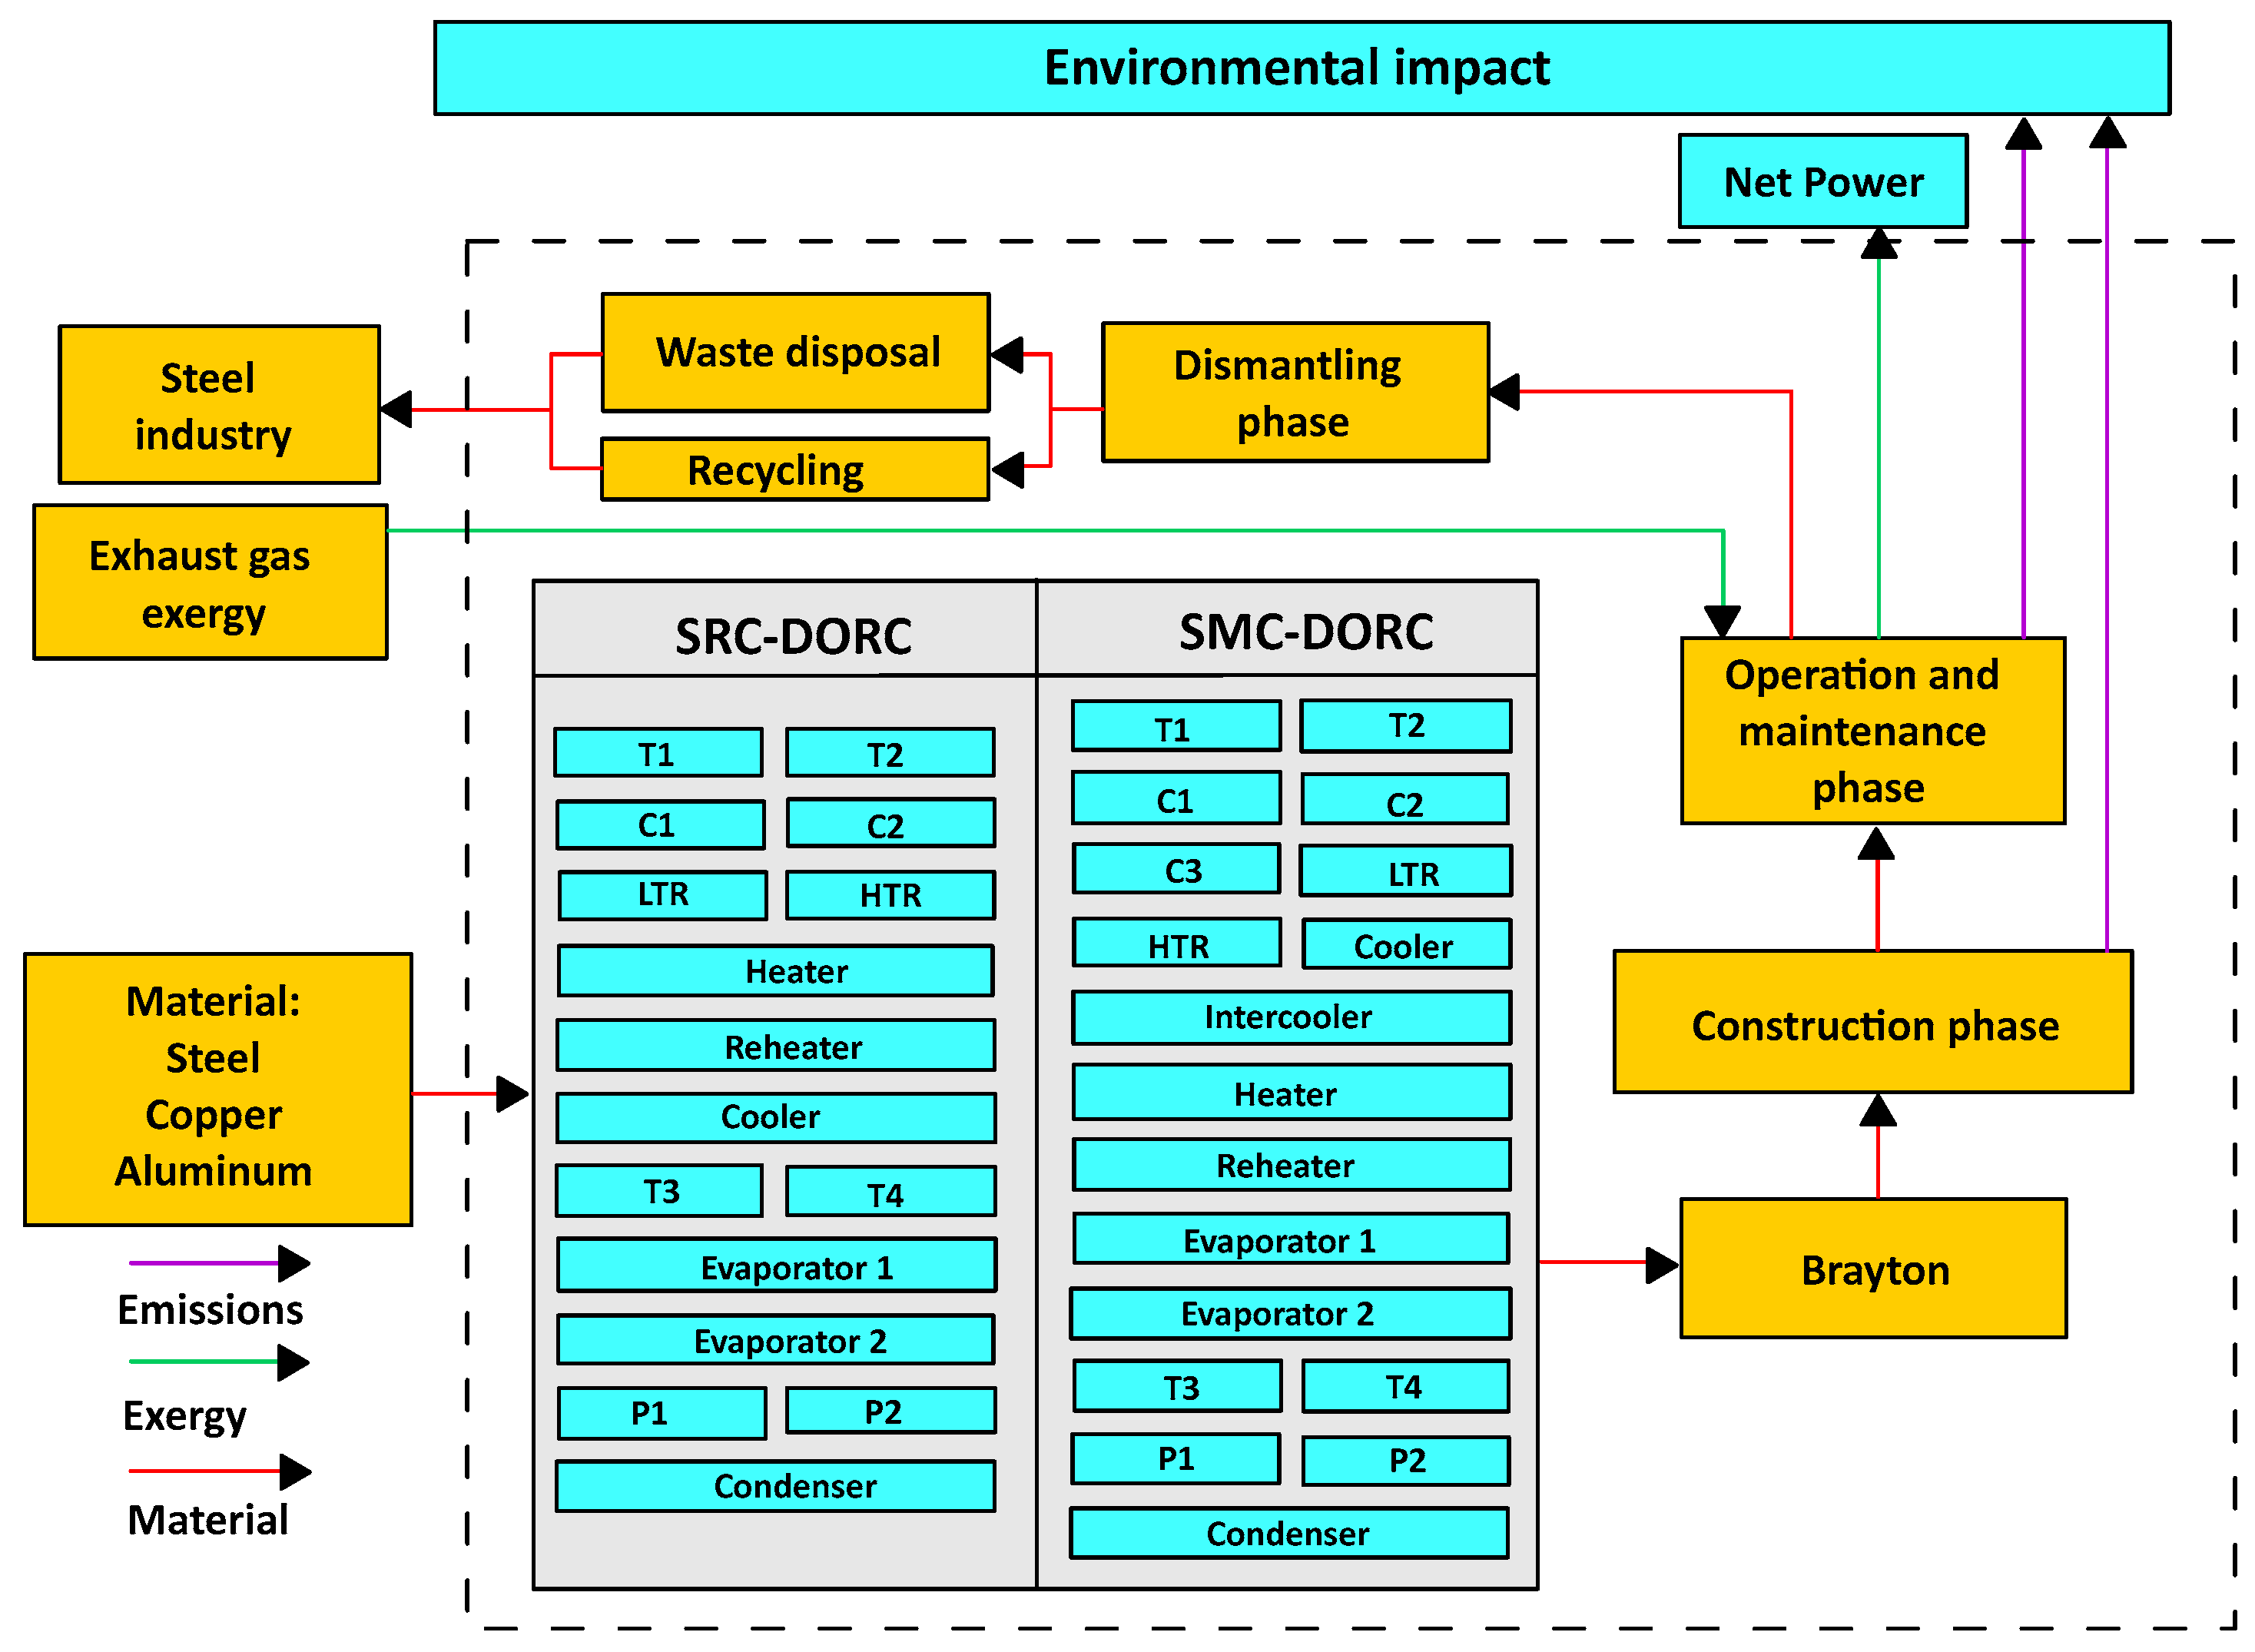
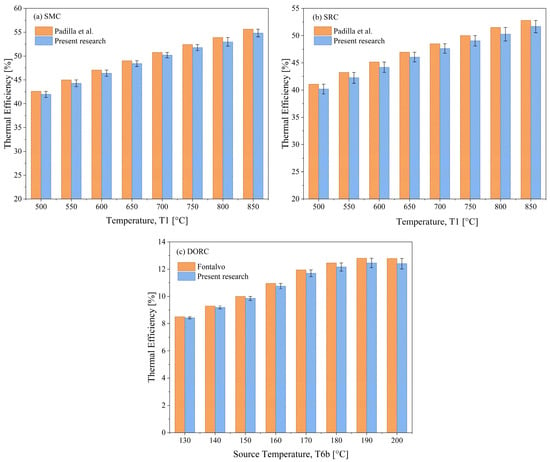
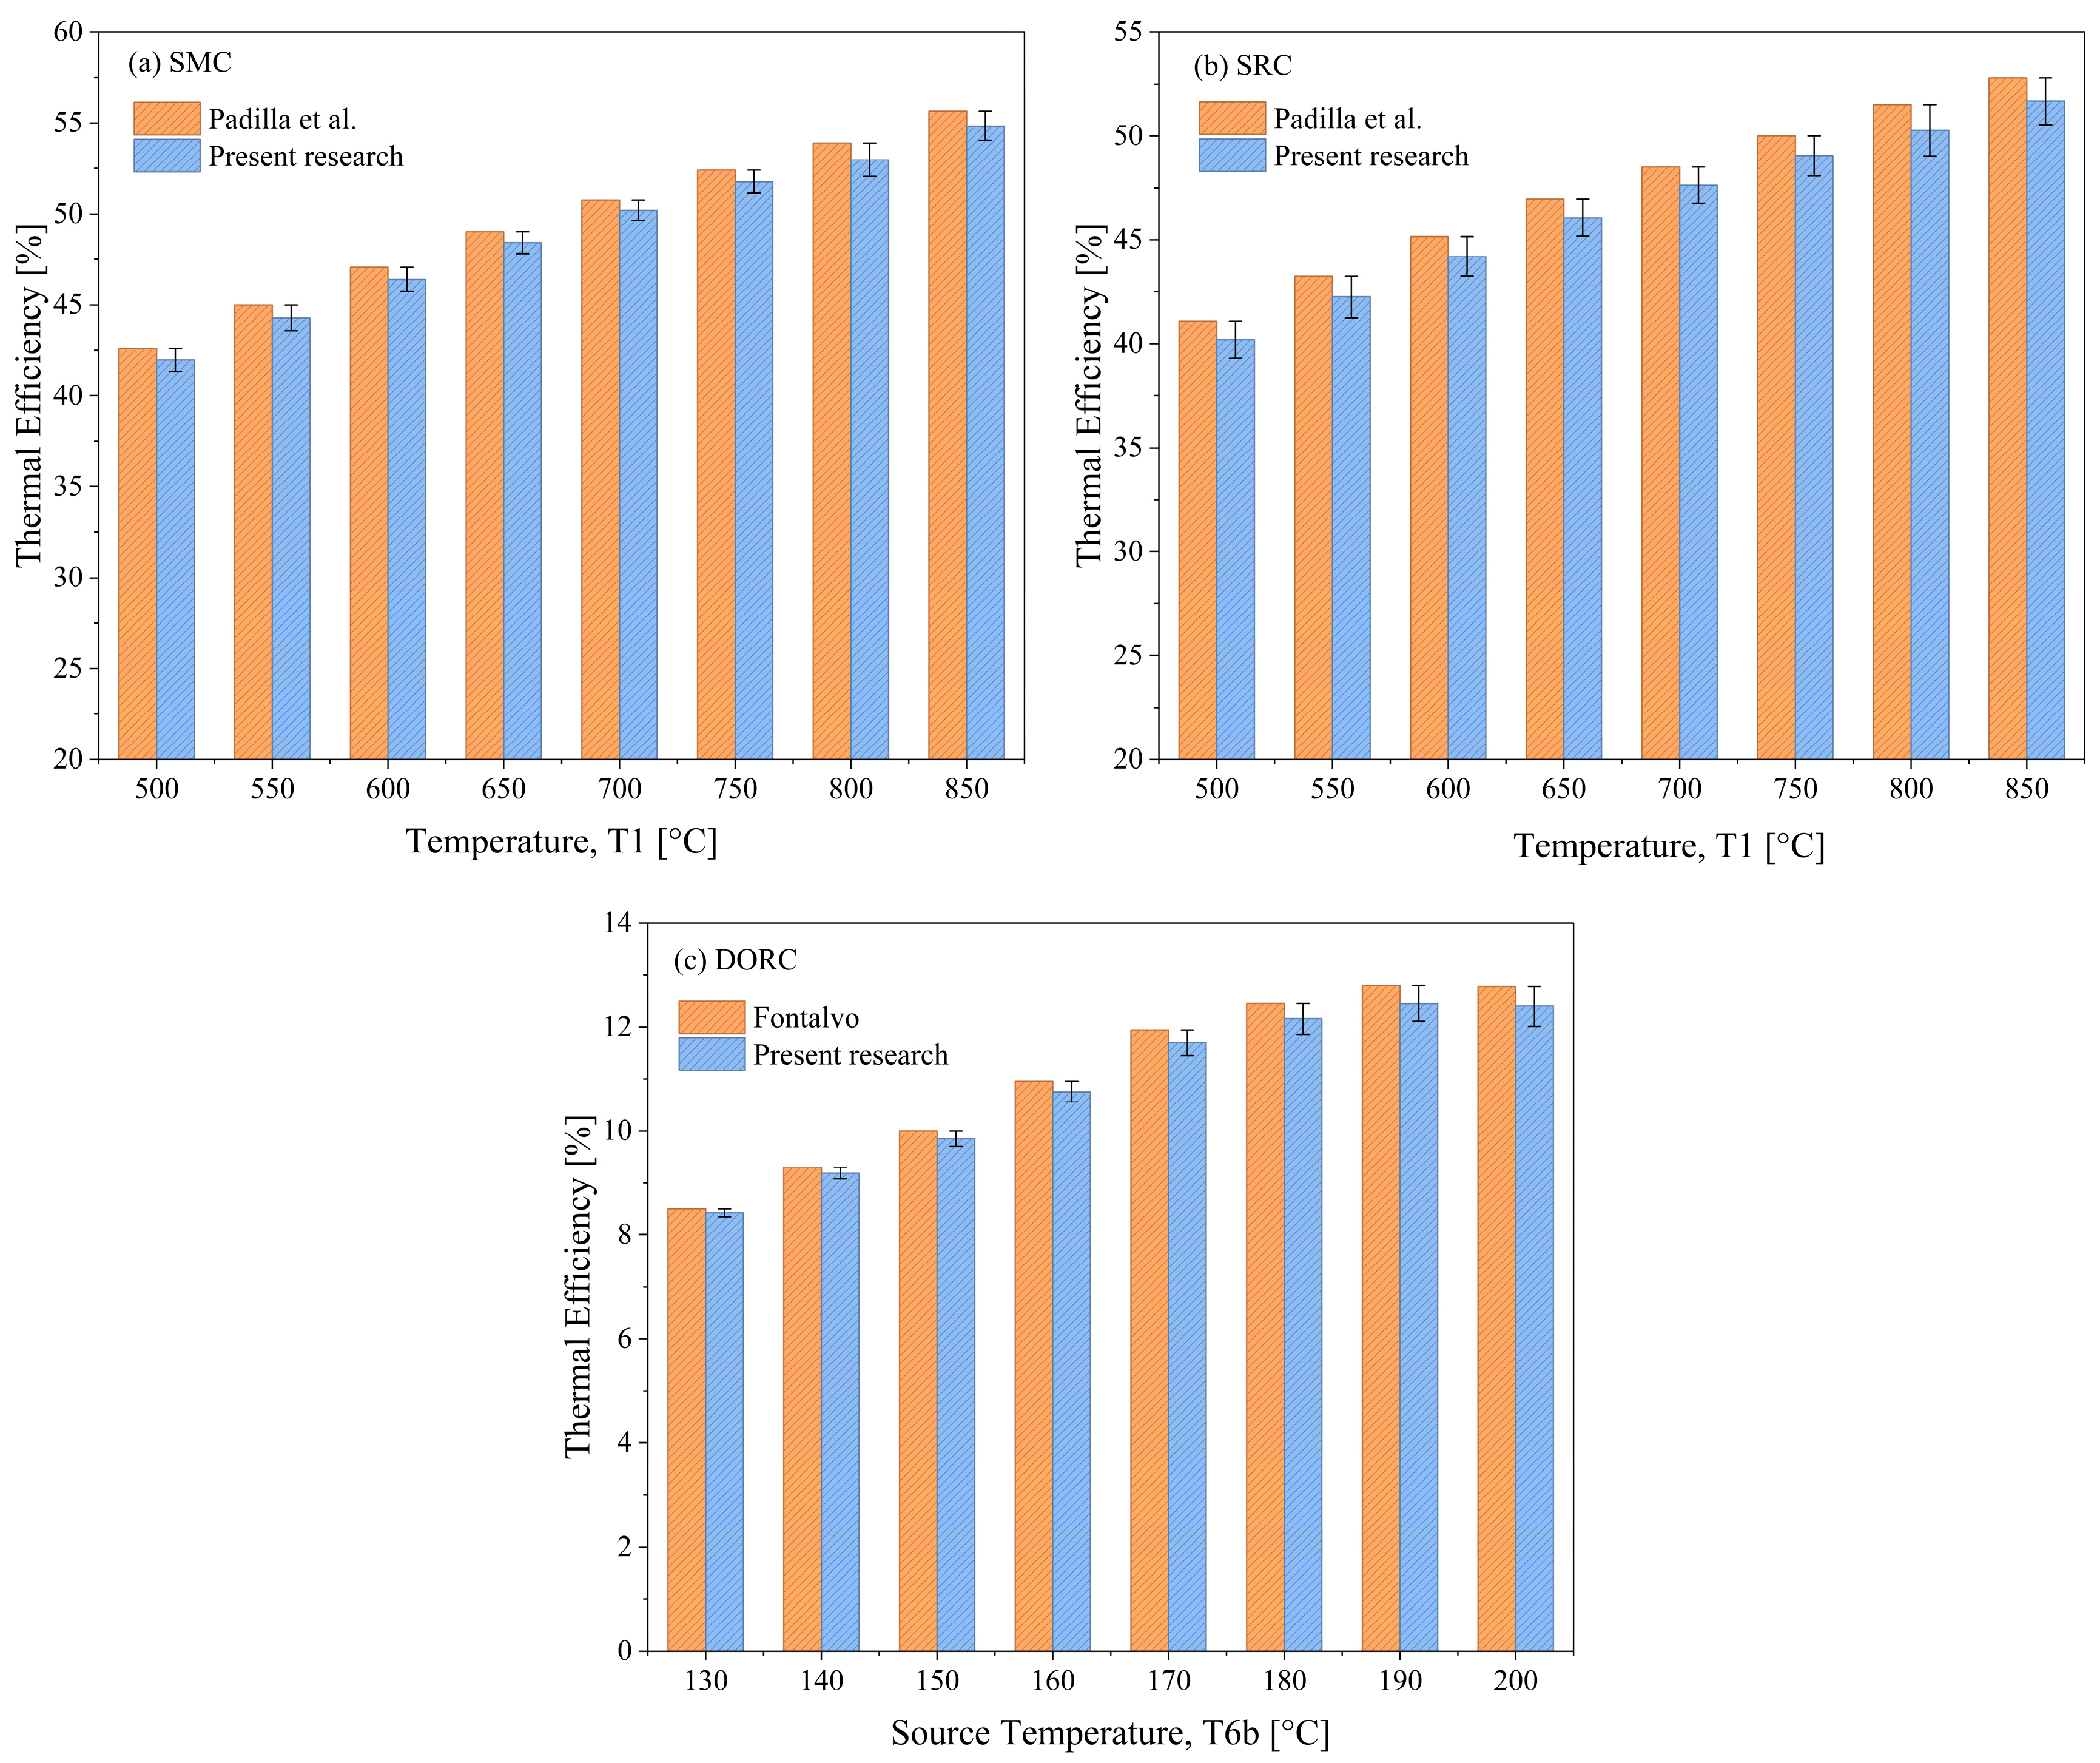
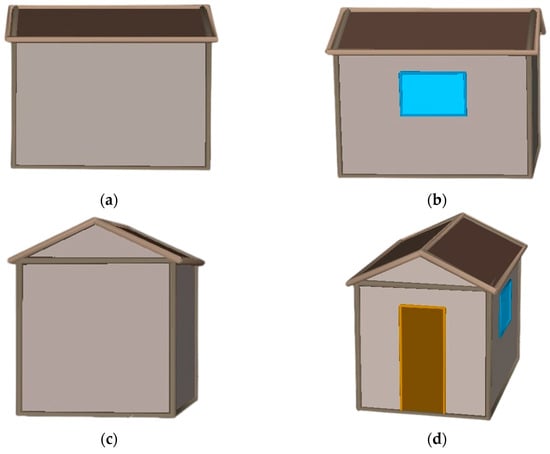
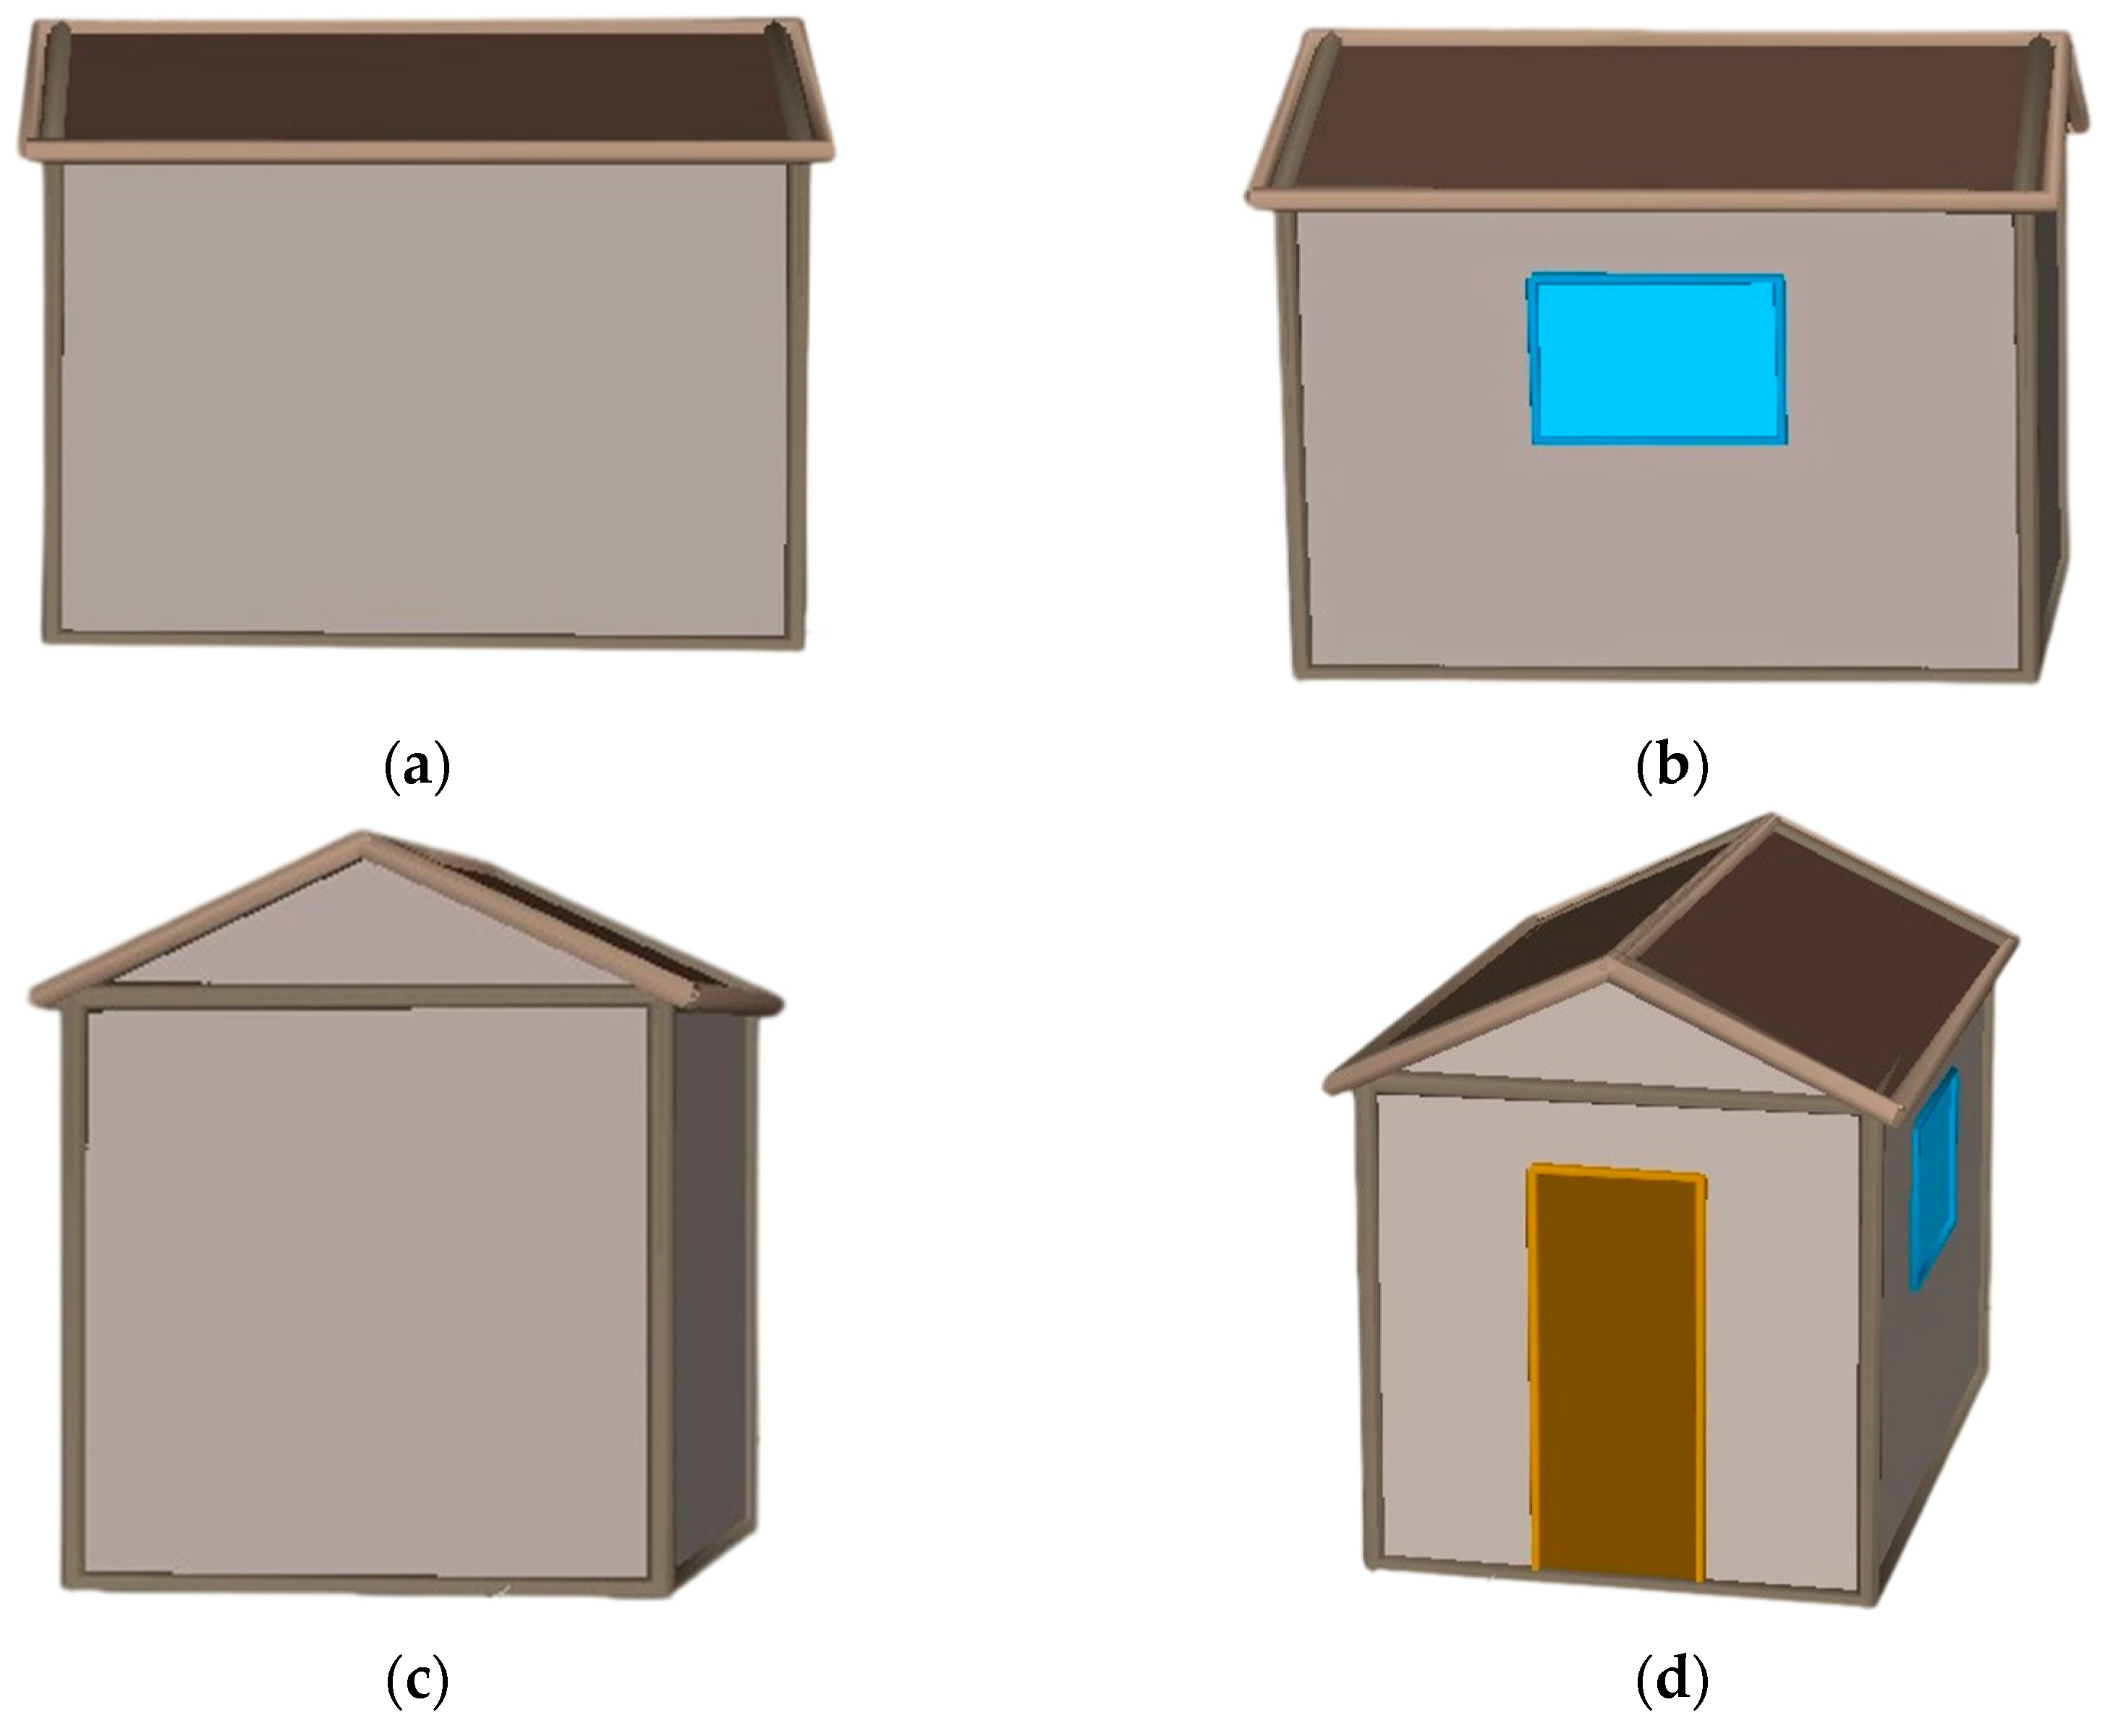
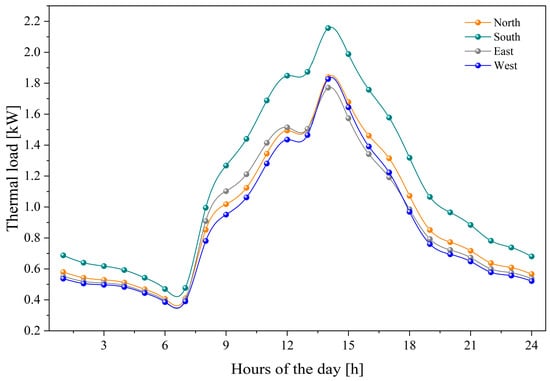
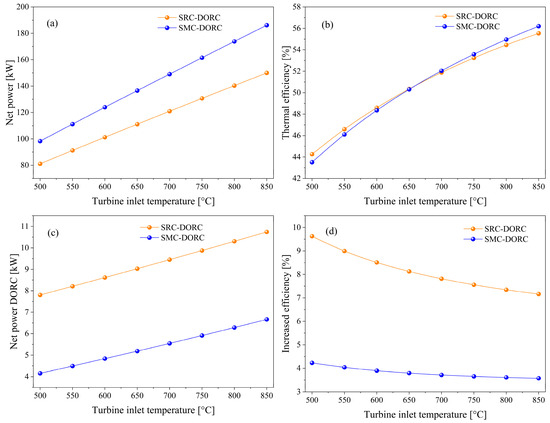
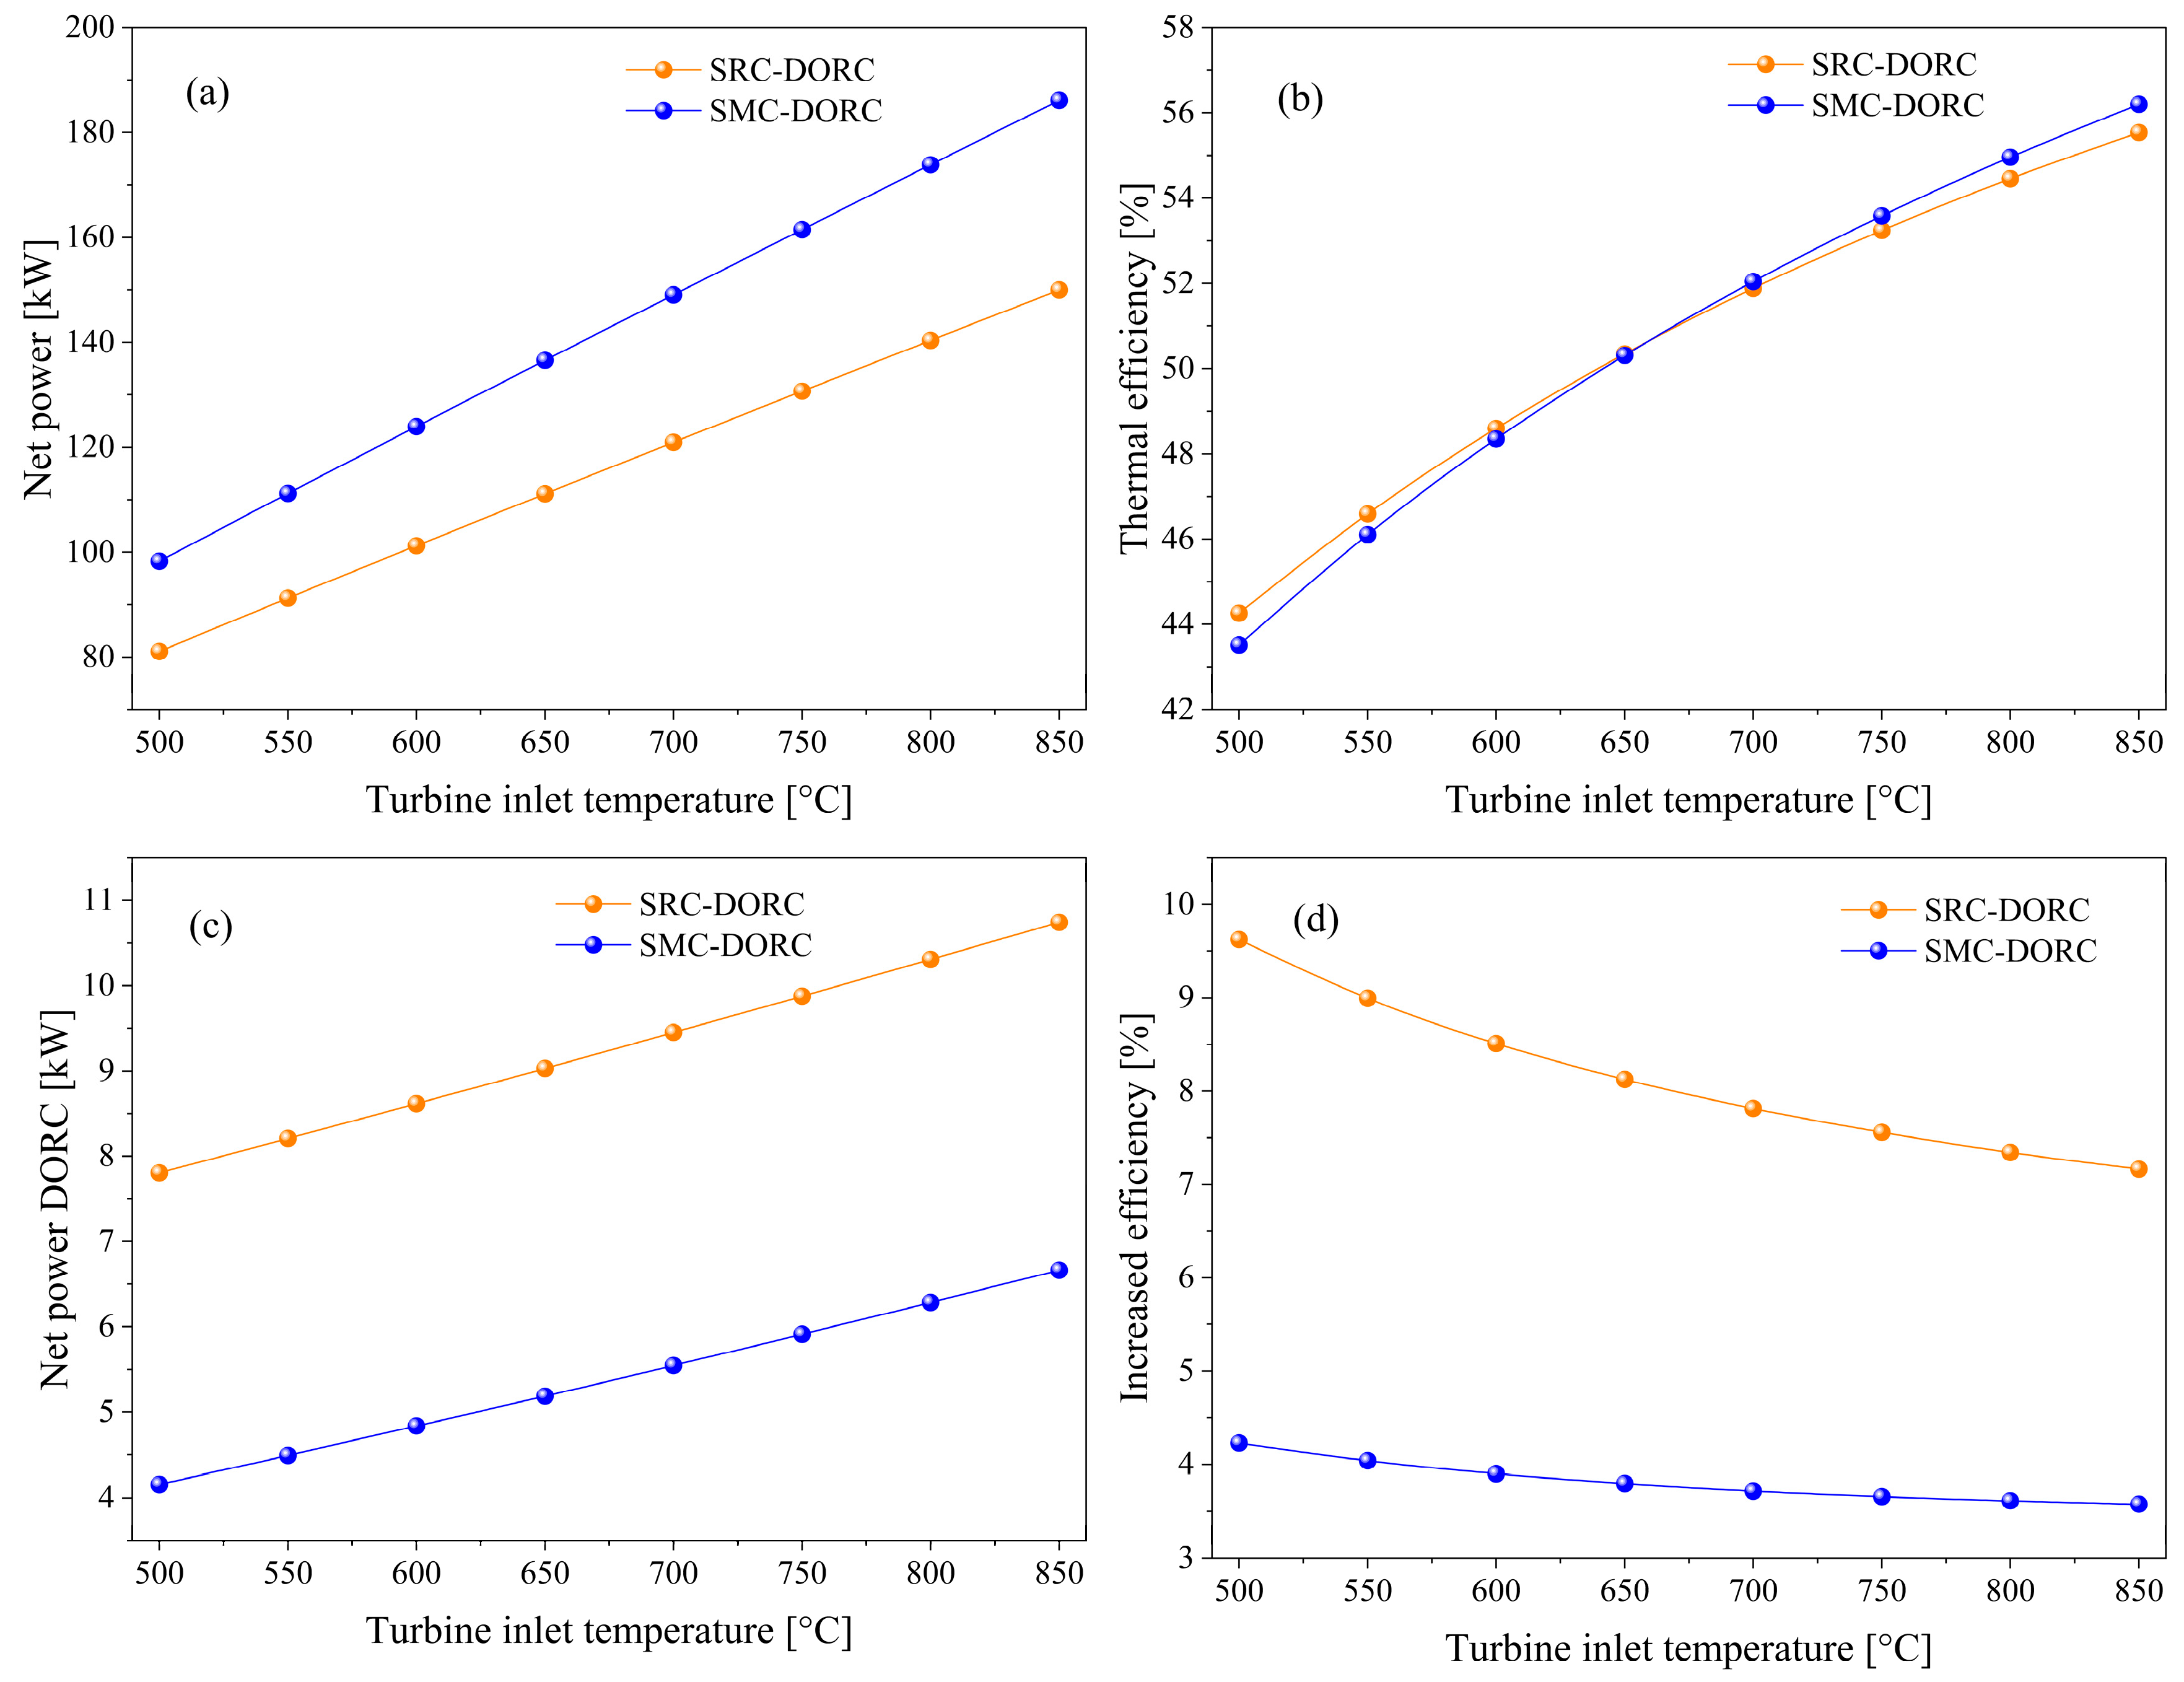
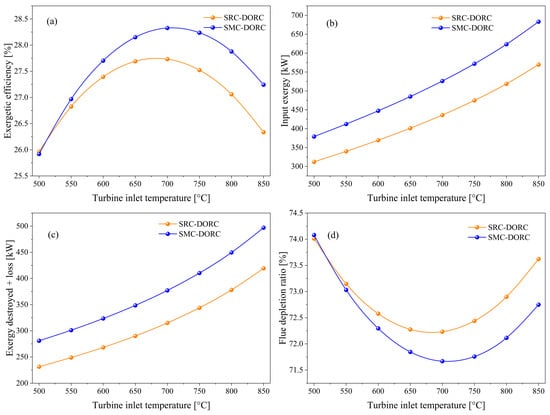
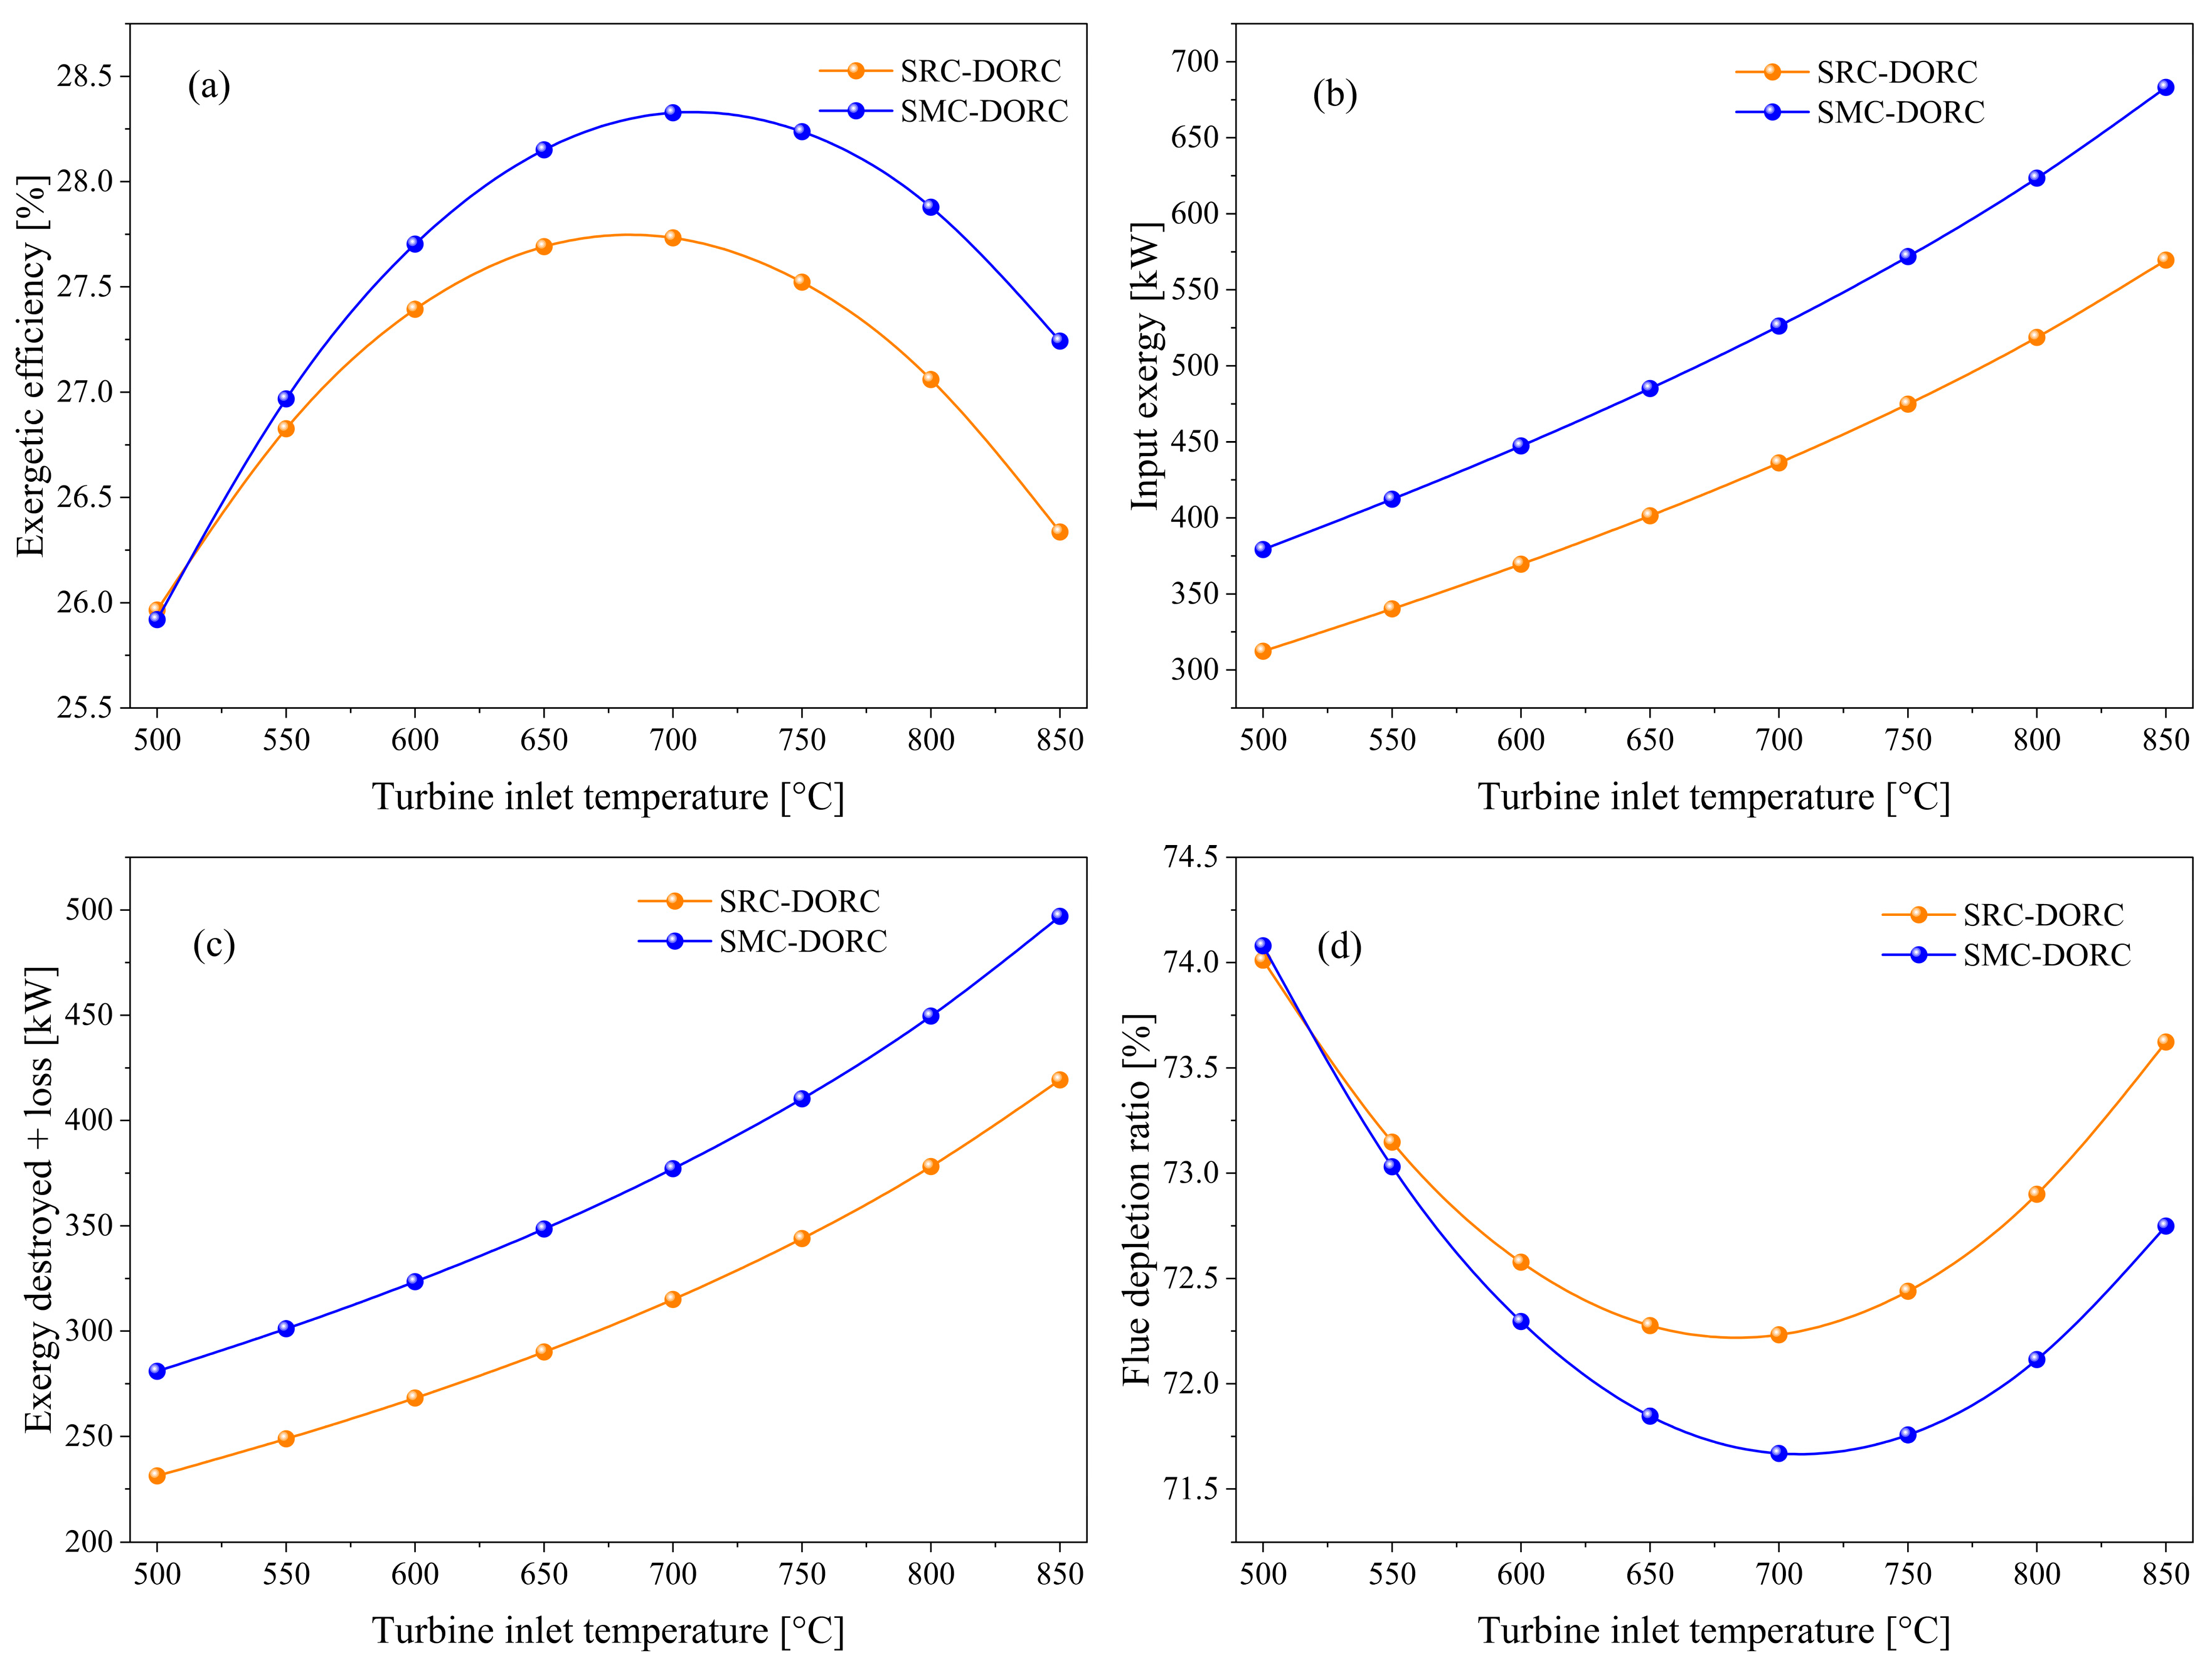
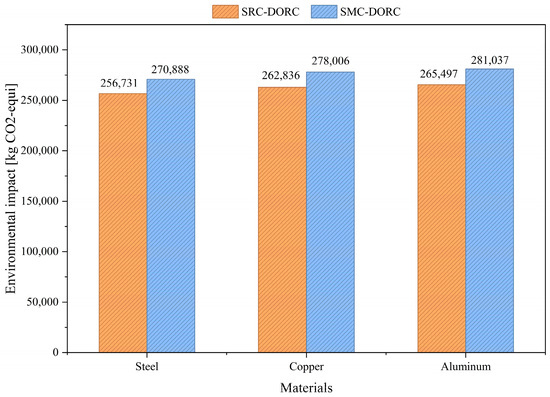
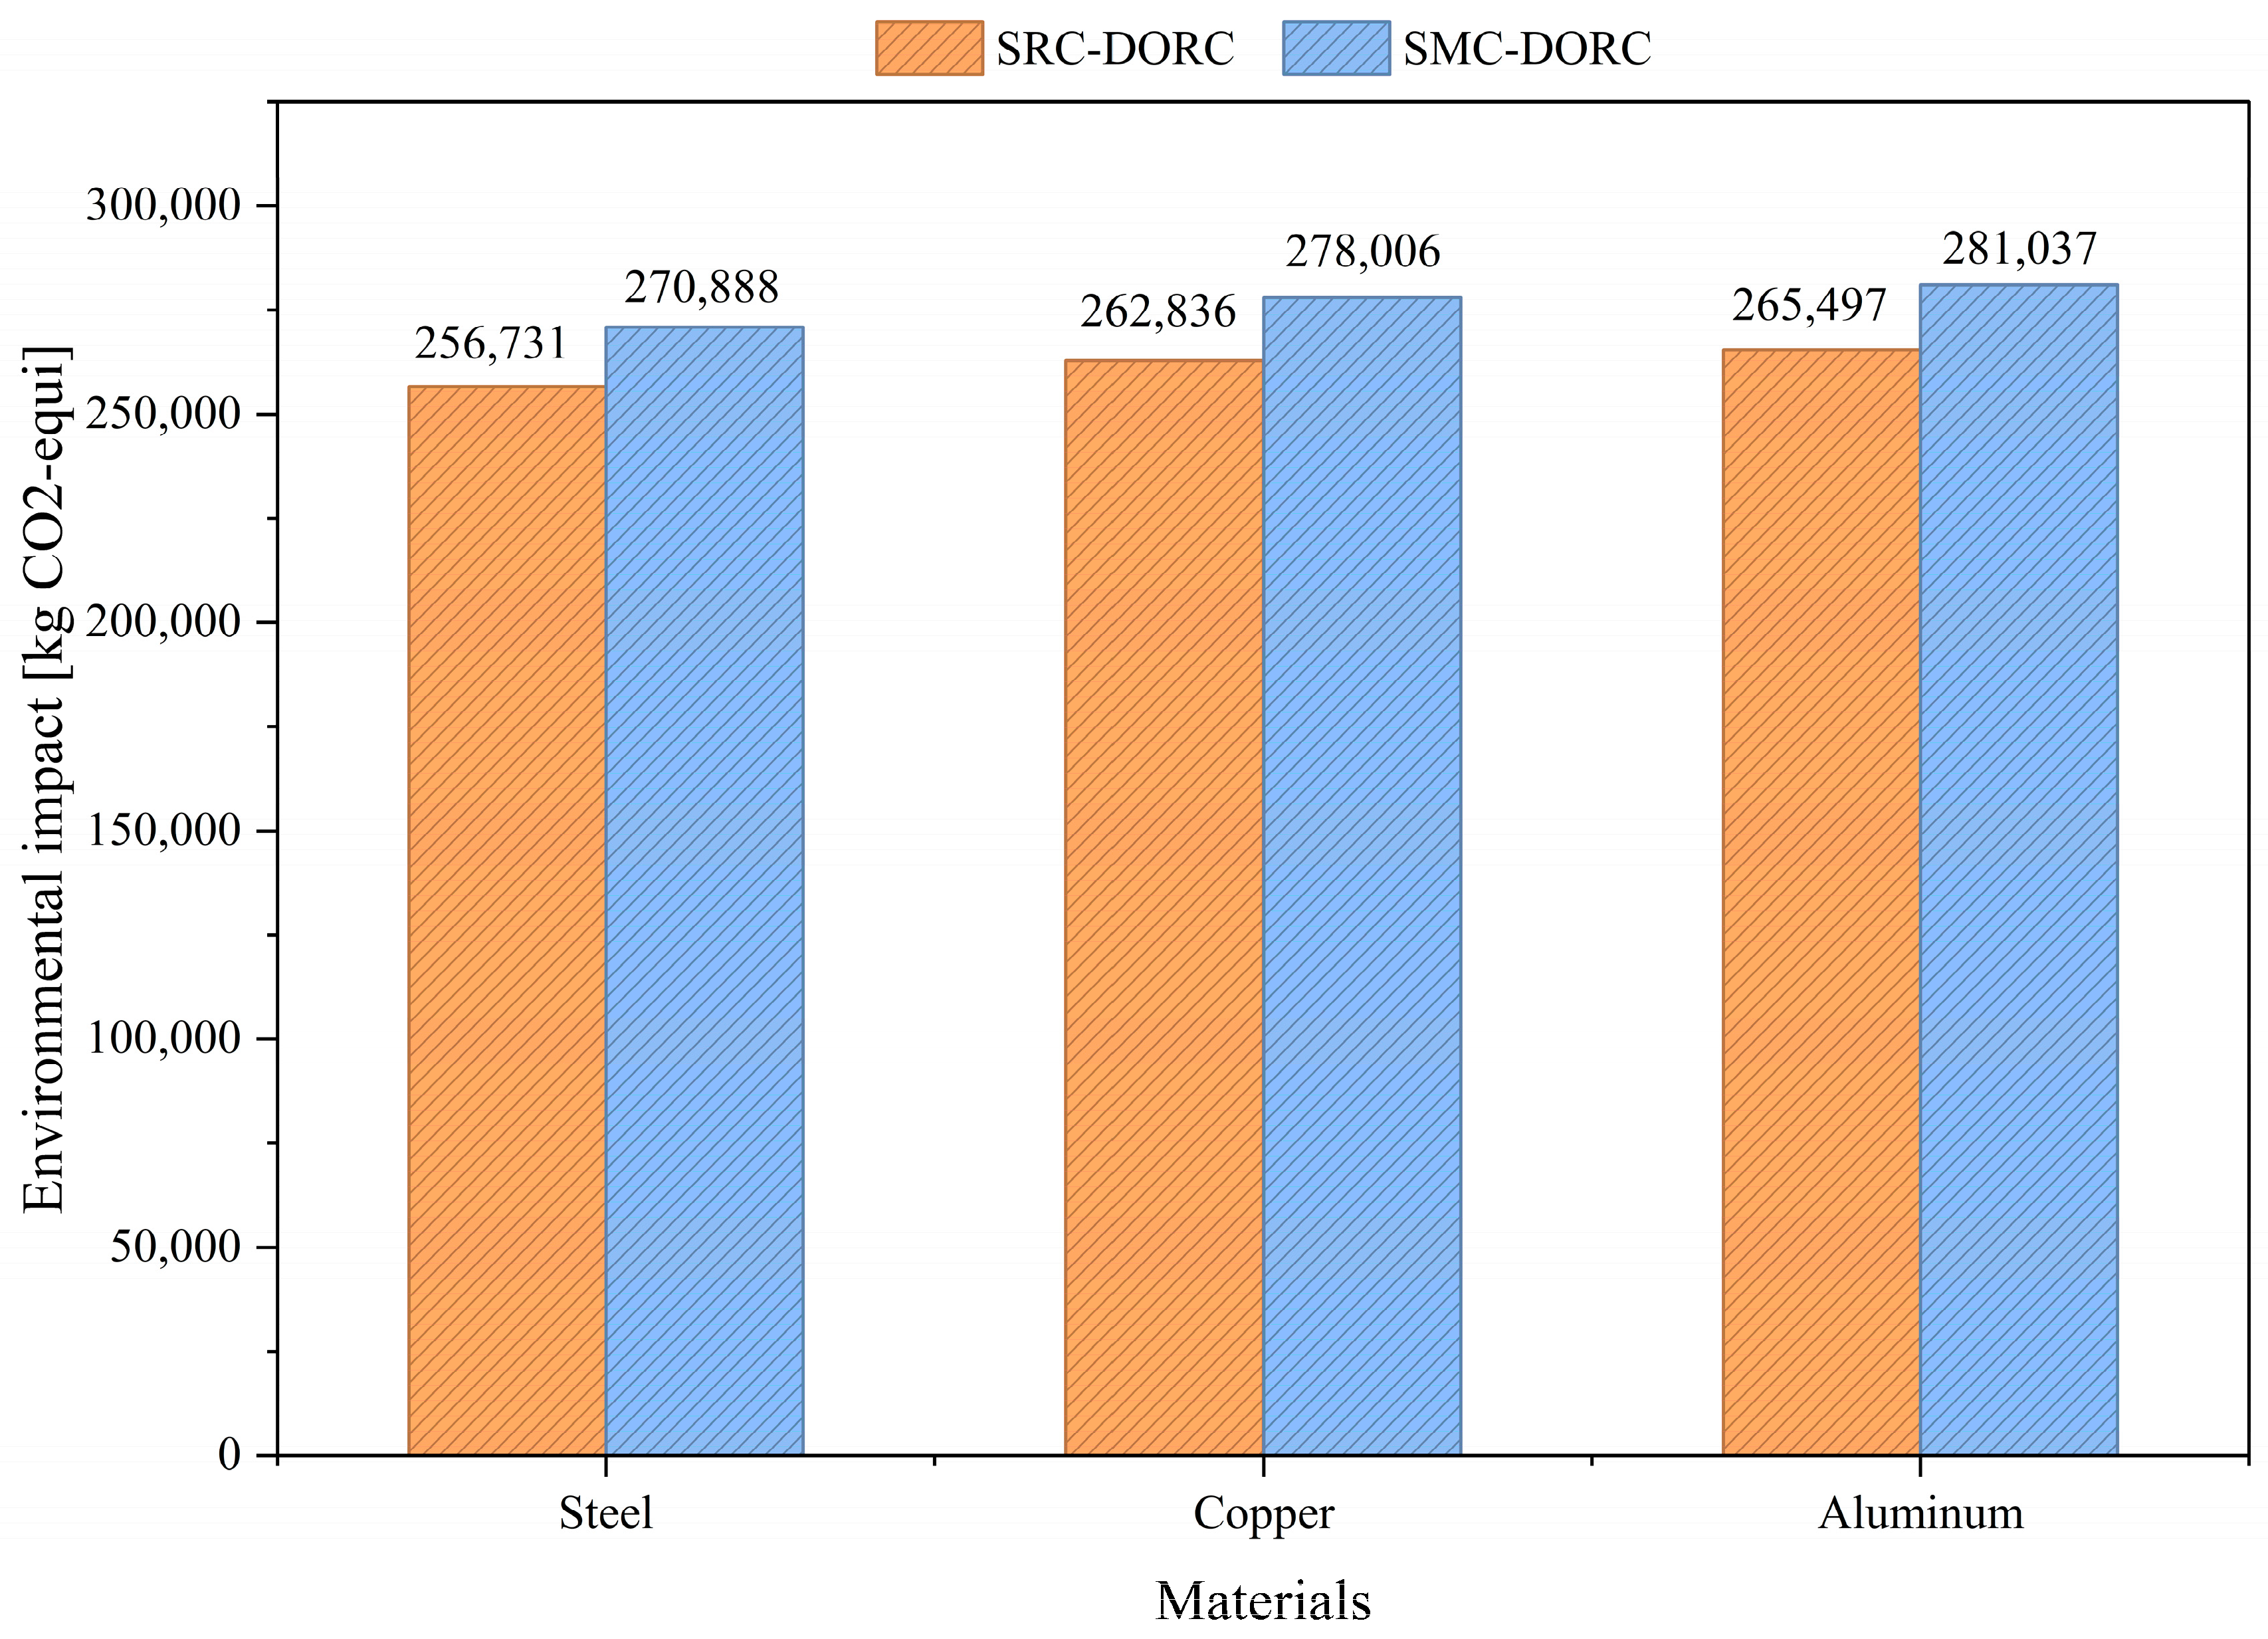
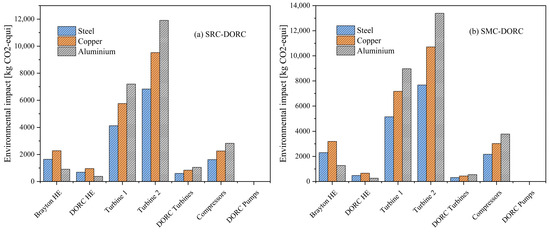
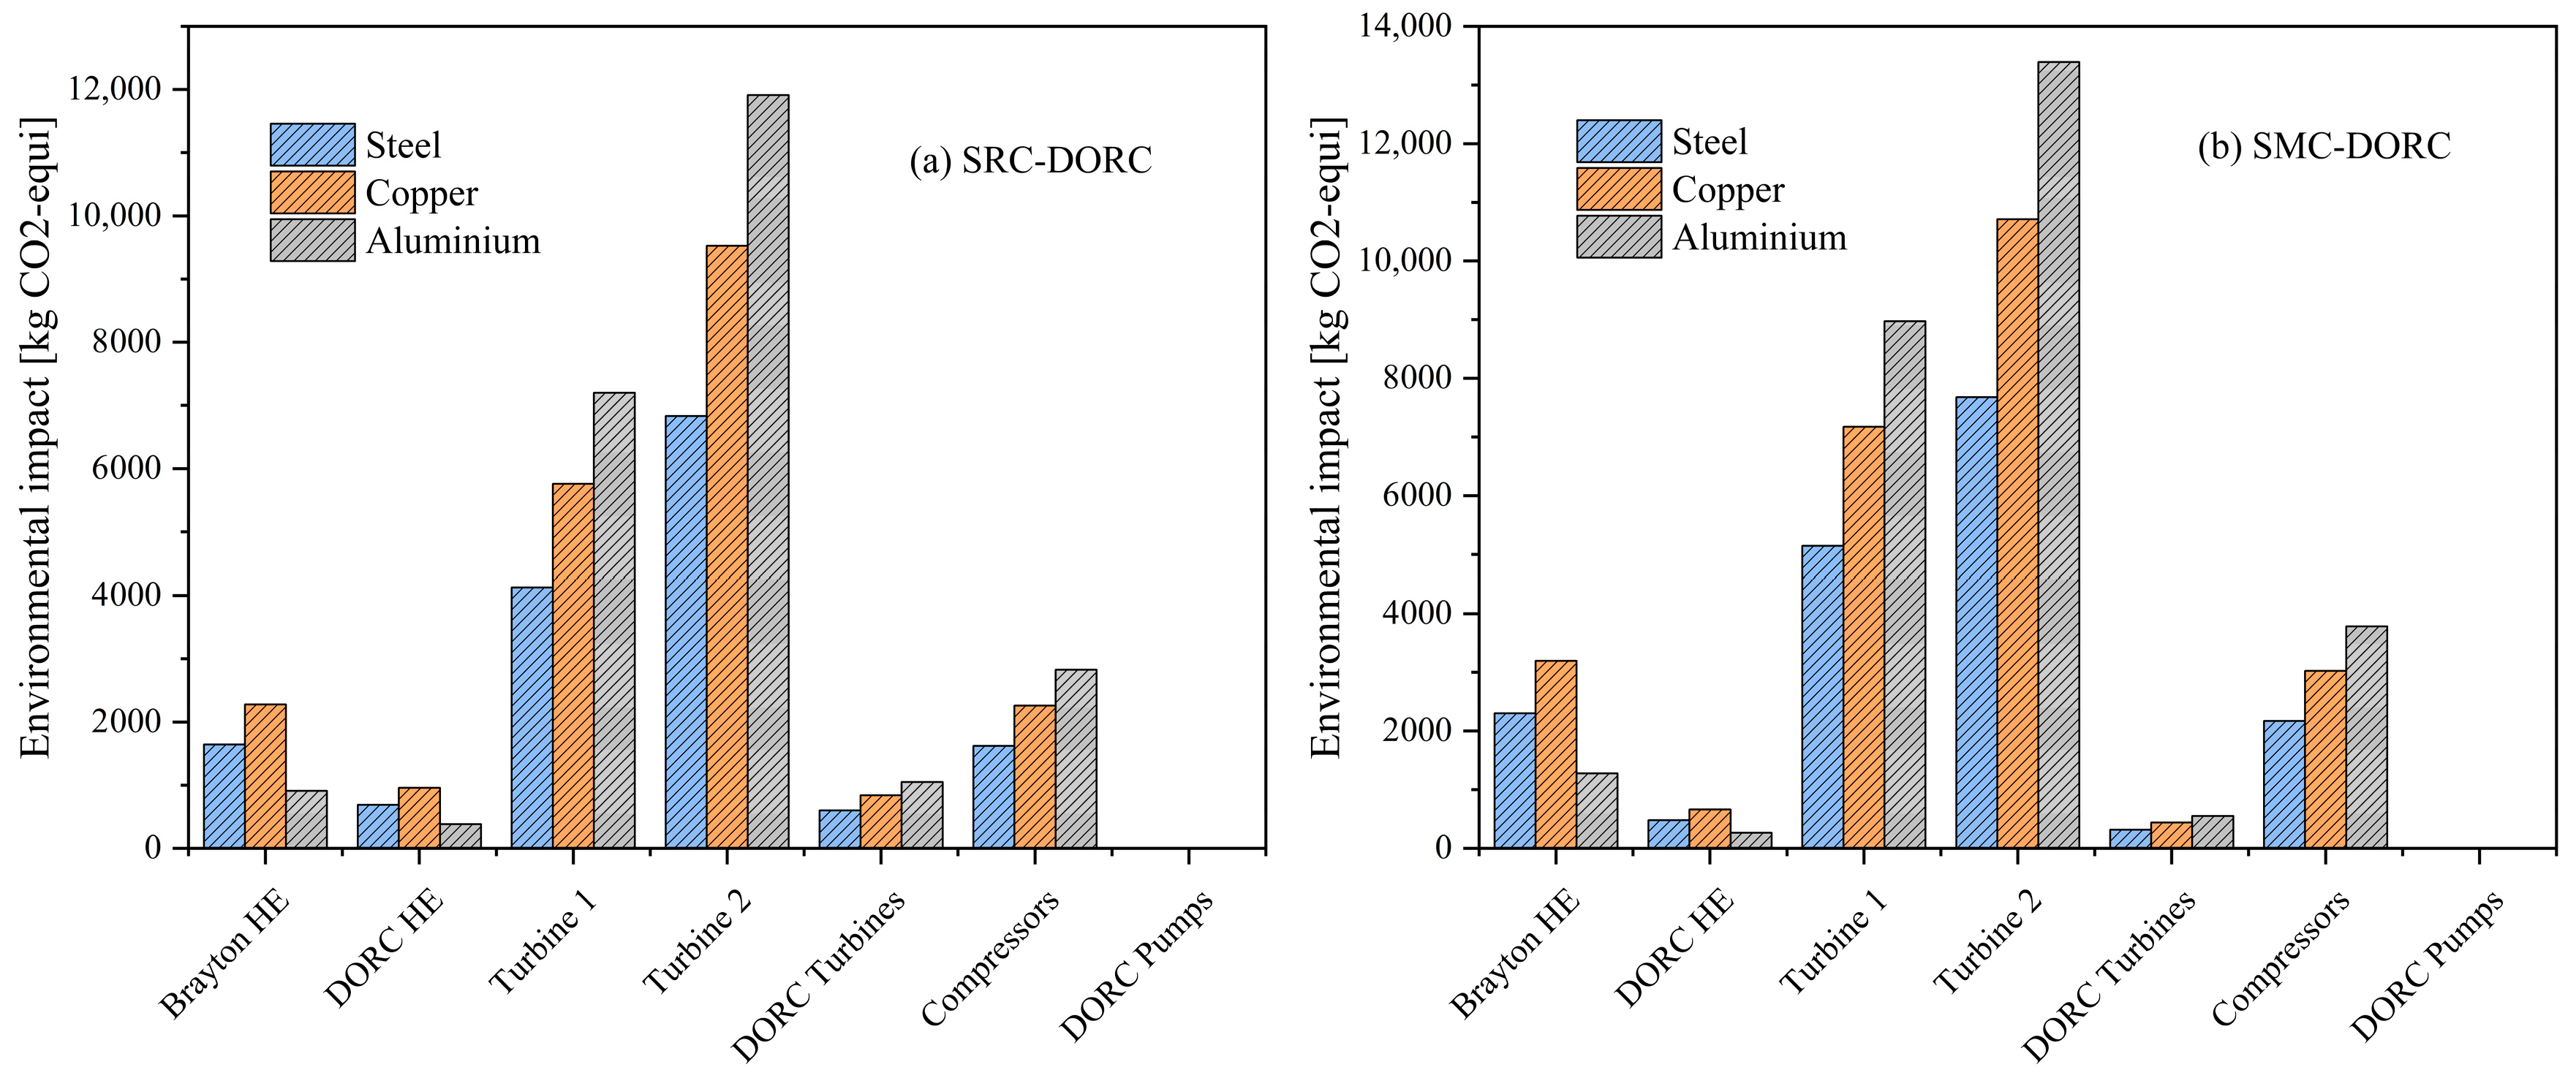
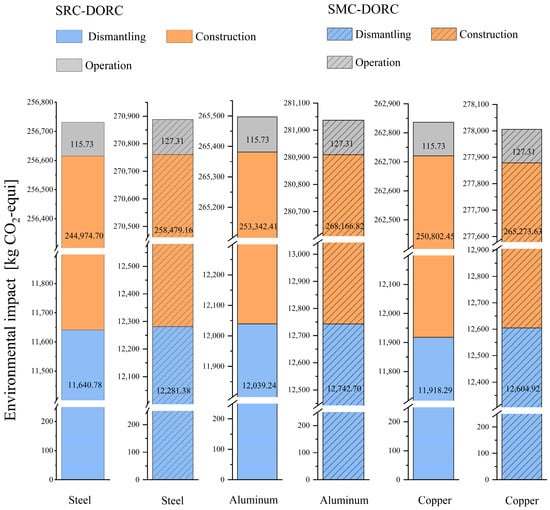
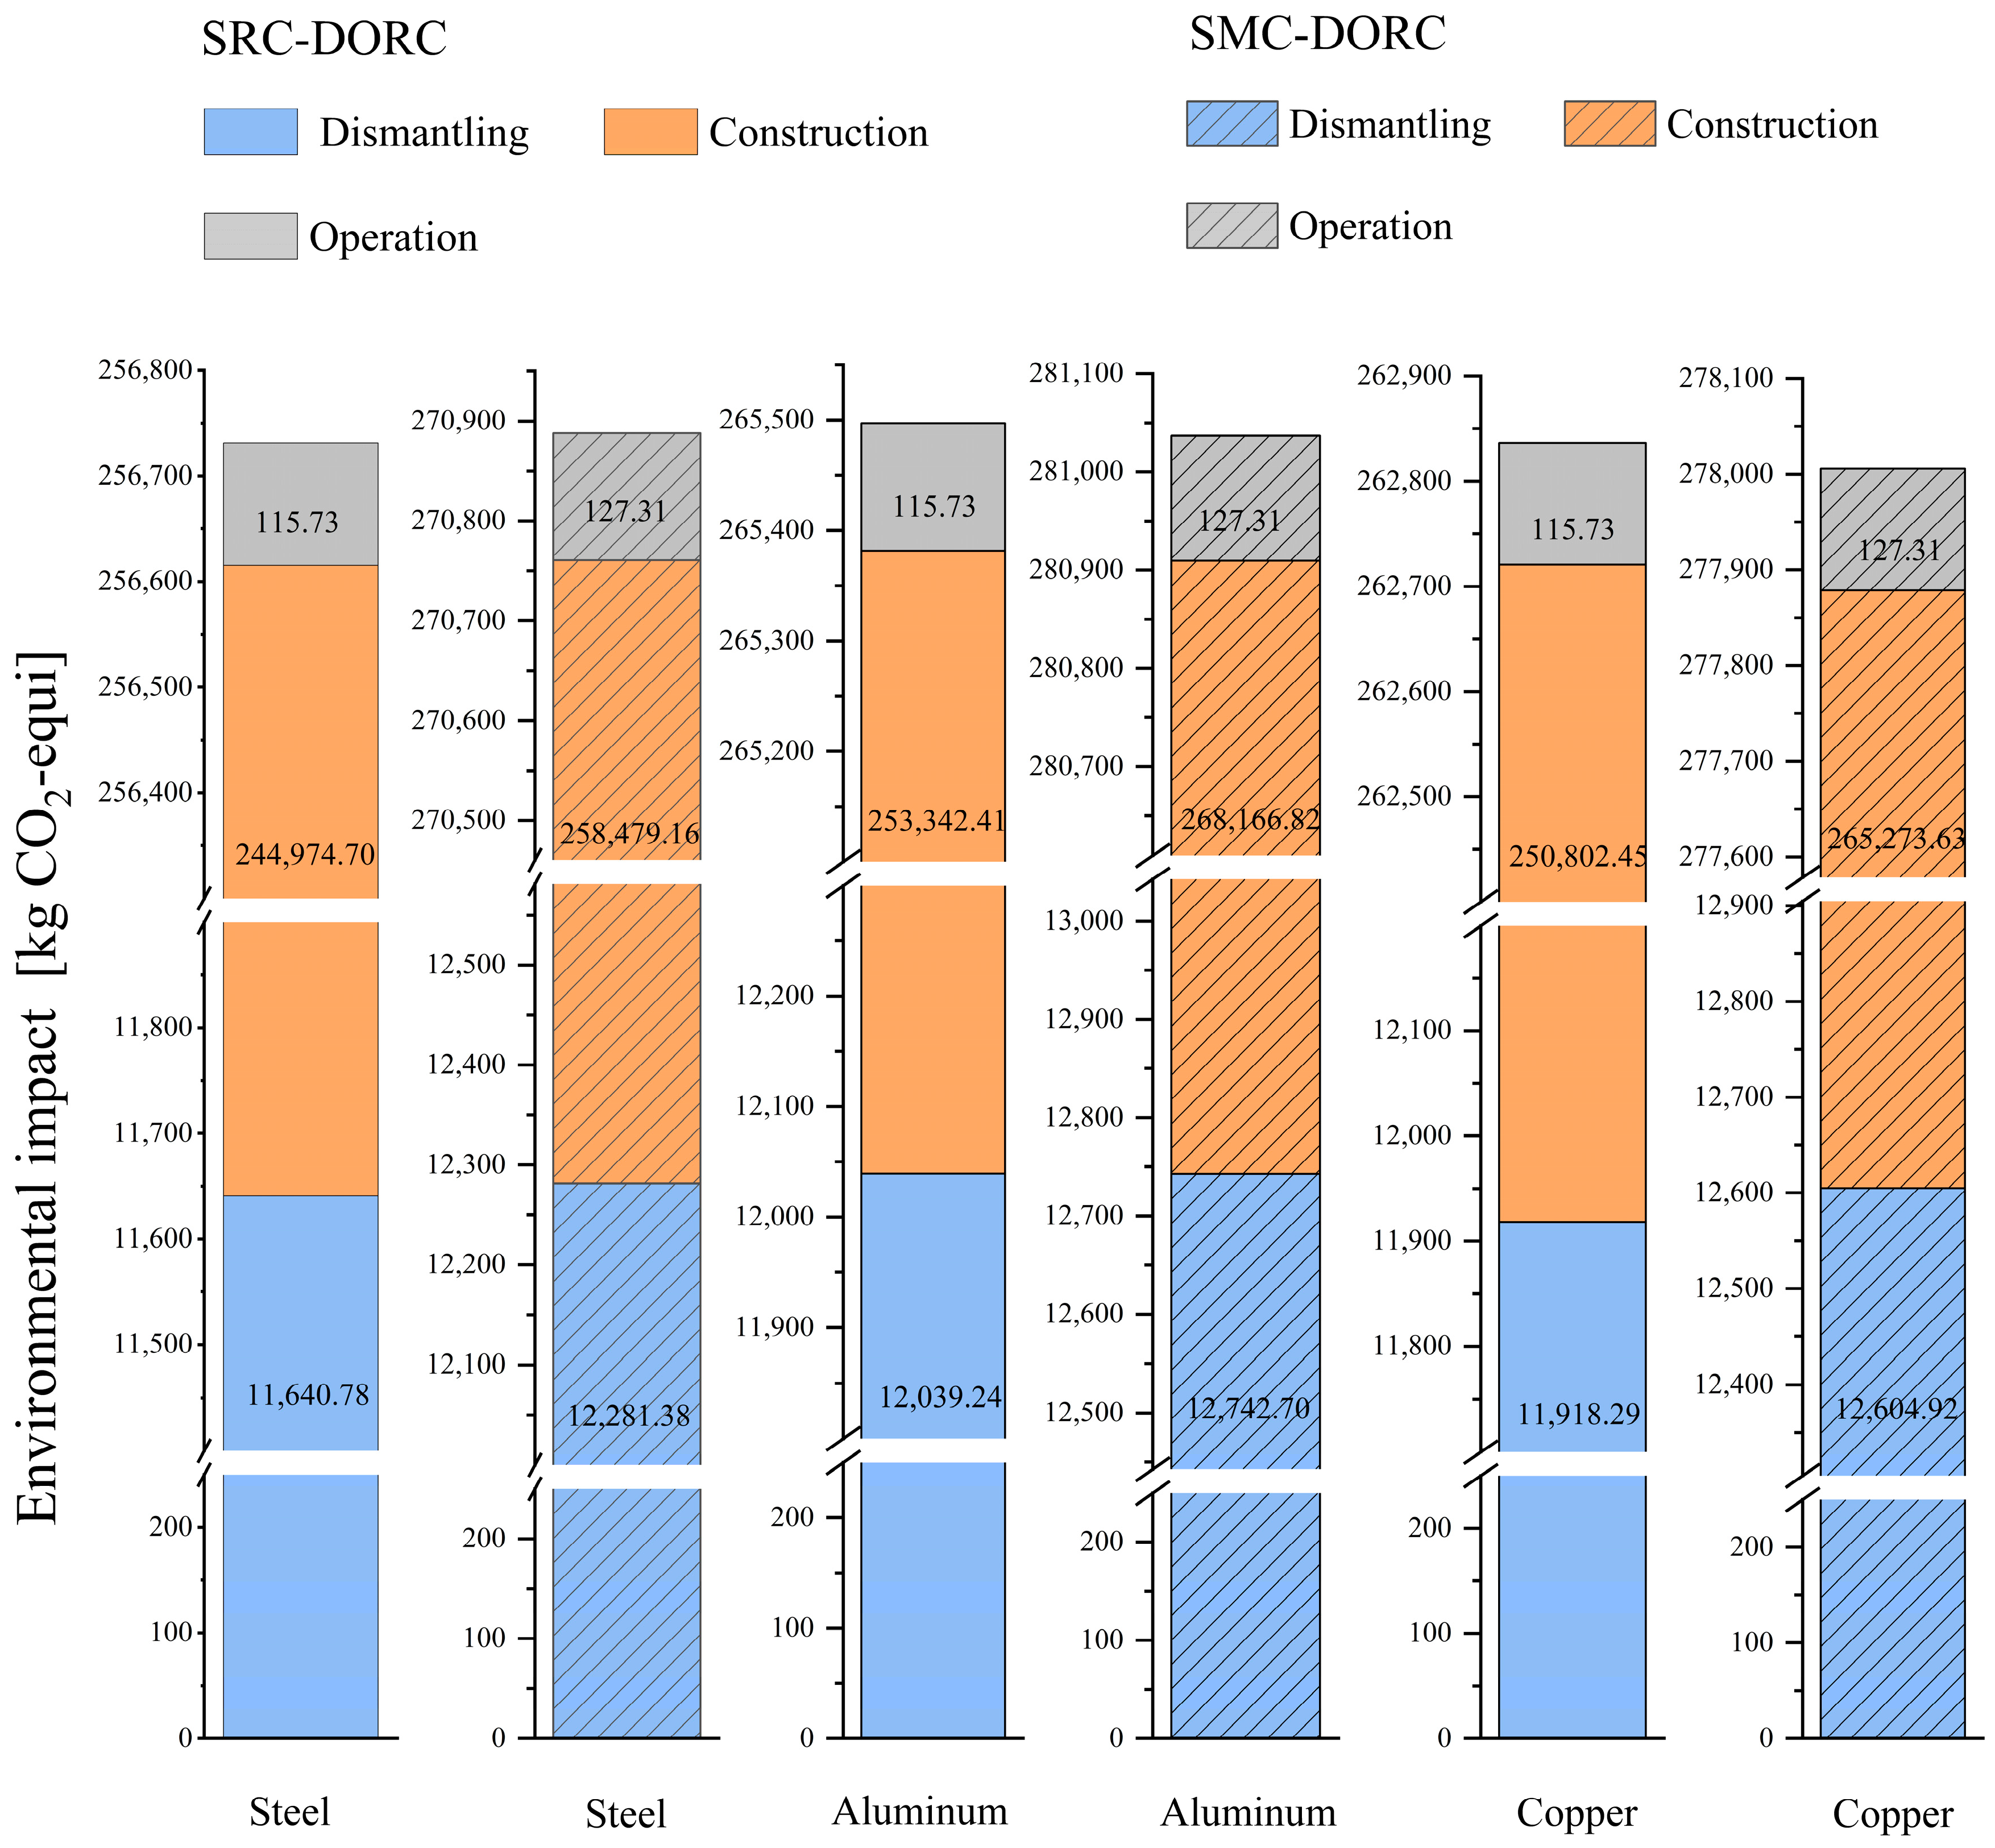

Disclaimer/Publisher’s Note: The statements, opinions and data contained in all publications are solely those of the individual author(s) and contributor(s) and not of MDPI and/or the editor(s). MDPI and/or the editor(s) disclaim responsibility for any injury to people or property resulting from any ideas, methods, instructions or products referred to in the content. |
© 2026 by the authors. Licensee MDPI, Basel, Switzerland. This article is an open access article distributed under the terms and conditions of the Creative Commons Attribution (CC BY) license.