


Abstract
Low-carbon energy transition (LET) has become an important global development strategy. However, in the contemporary industrial era, carbon emissions are intricately intertwined with economic growth based on the extensive use of fossil energy. To this end, the key to a more acceptable push for LET is to achieve carbon emissions decoupling (CED). The rapidly developing digital economy (DE) introduces novel possibilities for it. Using a Finite Mixture Model, this study aims to analyze how DE heterogeneously impacts CED across 66 countries from 2011 to 2022. As of 2022, 41% of countries attained strong decoupling status, 33% reached weak decoupling status. In terms of the effect of DE on CED, both chance and challenge are shown. DE exhibits dual effects: it enhances CED in high-education countries but hinders it in countries with rapid population growth. Government efficiency and gender equality amplify DE’s chance role, while natural gas or clean energy reliance weakens it. DE indirectly promotes CED via low-carbon behavior while raising risks through easier credit access. Meanwhile, the heterogeneity of institutional and economic characteristics in countries may influence the effect of DE on CED. These findings offer a theoretical foundation to reconcile economic sustainability with climate mitigation in digital transitions, providing actionable insights for policymakers to leverage DE’s potential in achieving SDG 13.
1. Introduction
Climate change (CC) has brought about a host of critical environmental problems such as the greenhouse effect, extreme weather, water scarcity and biodiversity loss [1,2], which is primarily attributed to the increased concentration of CO2 resulting from the extensive consumption of fossil fuels [3]. In the pursuit of mitigating the detrimental impacts of CC, LET has become one crucial development strategy for many countries, and has proposed limiting warming to 1.5 °C [4]. However, in the contemporary industrial era, carbon emissions are intricately intertwined with economic growth. Reducing carbon emissions may necessitate a partial sacrifice of economic advancement. This trade-off has instilled hesitancy in certain countries and regions towards embracing carbon emission reductions [5]. Therefore, in the context of promoting LET globally, it is indispensable to gradually diminish the reliance of economic growth on fossil fuel and carbon emissions [6], which is achieving carbon emission decoupling (CED). Meanwhile, the digital economy (DE), a new economic form underpinned by rapidly advancing digital technologies, has emerged as a prominent global focus. This prompts us to pose the following questions: Could DE serve as a new-era anchor for achieving CED? What impact does it exert on CED? Through what mechanisms does it influence CED? And do its impacts on CED vary across different countries?
CED is the process in which the relationship between economic growth and greenhouse gas emissions is weakening and even disappearing, that is, to gradually reduce carbon emissions on the basis of economic growth [7]. Great efforts have been made to analyze the CED by assessing the evolving dynamics between carbon emissions and economic advancement across countries [8]. Given the varying socio-economic development conditions of each country, the trajectories between their economies and carbon emissions also differ [9]. Specifically, in advanced economies such as the United States, the GDP has doubled from 1990 to 2022, while carbon emissions have been decreasing since 2007. In developing countries like China, GDP and carbon emissions have increased by 14 and 5 times from 1990 to 2022, respectively. Conversely, less developed countries (e.g., Vietnam and Thailand) experienced a more pronounced increase in carbon emissions compared to their GDP growth [10]. Hence, the CED status of countries with different socio-economic development conditions can be assessed by using GDP and carbon emission data.
There are many factors that can affect CED, such as industrial structure, energy efficiency, technological innovation and DE. Among them, whether DE can present a chance or a challenge for CED is of great concern. On the one hand, the data-centric and technologically driven DE, underpinned by big data, blockchain, and other emerging technologies, has the potential to establish a more advanced economic growth model by leveraging its intrinsic advantages in restructuring industrial collaboration, facilitating technological integration, and enhancing economies of scale [11]. This shift may enable countries to reduce their reliance on fossil fuel combustion for economic advancement within the confines of the traditional industrial economy, serving as a catalyst for CED and attaining carbon emission reduction goals [12]. On the other hand, the evolution of digital technologies and industries themselves necessitates significant electricity consumption and traditionally falls within the category of high-energy-consuming sectors [13]. Consequently, DE may concurrently introduce additional challenges for carbon emission reduction and the CED. It is imperative to elucidate the mechanisms through which DE influences CED and analyze its impact on CED across countries with varying characteristics, which is essential for addressing CC in the digital era, promoting CED, and ultimately realizing the global objective of limiting temperature increase to 1.5 °C.
Meanwhile, given the significant heterogeneity and distinct economic mechanisms widely observed across countries, it is necessary to adopt a model approach that can objectively address cross-country heterogeneity for empirical testing. The Finite Mixture Model (FMM) is a heterogeneity modeling approach rooted in probability distribution theory. Its core assumption is that observed data originate from multiple unobserved latent sub-populations, and the distribution of the overall sample is formed by weighted mixing of the distributions of these sub-populations according to specific probabilities [14]. Unlike traditional econometric methods that require pre-specified heterogeneity rules, FMM does not rely on manual sample grouping. Instead, it automatically identifies heterogeneity patterns in a data-driven manner and can separately estimate the relationships between variables for different sub-populations [15,16]. Its advantages in cross-country analysis scenarios are particularly prominent, and scholars have already applied the FMM method to cross-region empirical studies. For instance, Zallé analyzes cross-border natural resource rents and regime durability by using FMM [17], and DasGupta employed FMM to examine the relationship between national culture and ESG controversies [18].
Given the context outlined above, this study aims to address the following questions: Could DE serve as a new-era anchor for achieving CED? What impact does it exert on CED? Through what mechanisms does it influence CED? And do these impacts vary across different countries? Firstly, this study analyzes and clarifies the changing trend of CED in 66 countries from 2011 to 2022 and the heterogeneity in CED statuses across countries. Additionally, FMM is adopted to examine the differential chance and challenge effects of DE on CED based on the intrinsic characteristics of different countries, offering a comprehensive analytical perspective that integrates the bidirectional effects of chance and challenge on the basis of the existing studies. Finally, the study explains the impact of various objective factors on DE’s effect on CED levels and investigates the indirect mechanisms involved.
This paper makes three key marginal contributions to the existing literature. Firstly, it breaks the limitation of single-country or regional-focused studies by systematically analyzing the dynamic evolution trends and cross-country heterogeneity of CED, providing comprehensive empirical evidence from a global perspective. Secondly, it innovatively adopts FMM to examine the differentiated dual effects of DE on CED based on countries’ intrinsic characteristics. This integrates opposing impacts into a unified analytical framework, offering a more holistic understanding of the complex relationship between DE and CED compared to existing research. Thirdly, it deepens mechanistic exploration by clarifying how various objective factors moderate DE’s influence on CED and uncovering the underlying indirect transmission paths, which helps to provide targeted theoretical support for formulating differentiated global carbon reduction policies. The findings are expected to offer a theoretical foundation to reconcile economic sustainability with climate mitigation in digital transitions, providing actionable insights for policymakers to leverage DE’s potential in achieving SDG 13.
2. Literature Review and Research Hypothesis
2.1. Literature Review
Digital economy and carbon emission reduction (CR). Following the TOE framework model proposed by Tornatzky and Fleischer (1990), the adoption of new technologies is influenced by three key factors: technology, organization, and environment [19]. DE refers to the economic activities generated through the connection of individuals, businesses, devices, data, and operations via digital technologies [20]. As a typical concept encompassed within the TOE framework, it is crucial to examine its environmental impact effects, and CR serves as an extremely important entry point for such analysis [21]. With the rapid growth of DE and the increasing urgency of climate-related issues, the impact of DE on CR has become a focal point for many scholars. However, the current body of research is fragmented and marked by conflicting empirical findings, with no theoretical consensus on DE’s carbon impact. Proponents asserting DE’s emission reduction potential predominantly focus on segmented indicators such as total emission volume [22], carbon intensity [23], and emission efficiency [24], identifying mechanisms including production efficiency improvement [23], environmental governance optimization [7], and technological innovation [25]. However, these studies often overlook the dual nature of DE: the energy-intensive operation of digital infrastructure may generate significant incremental emissions, which is an effect frequently sidelined. From this perspective, some scholars argue that DE may lead to increased carbon emissions, in that digital infrastructure, such as data centers and servers, requires significant energy consumption; the rapid expansion of digital infrastructure may lead to increased energy use, thus contributing to higher carbon emissions [26].
Building upon these two fundamentally opposing foundational discussions, some scholars attempt to resolve this contradiction by proposing non-linear relationships. Cheng et al. (2023) examined the impact of the development of China’s digital economy on carbon emission intensity using city-level data and found that this impact exhibits a U-shaped pattern [27]. In addition, based on a provincial sample in China, Lu and Chen (2023) pointed out that DE has significant threshold characteristics on per capita carbon emissions, exhibiting a negative non-linear effect [28]. However, such frameworks remain descriptive rather than explanatory, failing to unpack the boundary conditions that determine whether DE delivers emission reductions or increases. To address this, it is essential to thoroughly explain why DE exhibits a dual impact on CR, and to analyze the conditions under which it either increases or decreases carbon emissions.
Meanwhile, most empirical analyses are concentrated on single countries or specific regional blocs, with cross-national comparative research remaining conspicuously short. [27,28]. This narrow focus disregards the fundamental reality that DE’s carbon impact is deeply embedded in heterogeneous national contexts, like institutional quality [29], economic development stages [30], and digital infrastructure endowment varying drastically across countries, leading to fundamentally different transmission channels between DE and CR [31]. By relying on specific constrained samples, existing research essentially assumes a universal effect of DE, which not only obscures context-specific causal mechanisms but also produces policy recommendations that are ill-suited for countries with different development trajectories.
Overall, while existing research has conducted in-depth analyses of DE’s impact on carbon emissions from diverse perspectives, there is no consensus on the findings. Furthermore, analyzing the mechanisms through which DE affects CR remains underexplored, and cross-national comparative studies are relatively scarce. It is necessary to focus on national-level heterogeneity in studies on the impact of DE on CR, uncover the heterogeneous effects and specific mechanisms across economies with different characteristics, and provide more generalizable empirical evidence and targeted policy implications for the global collaborative low-carbon transition.
Carbon emissions decoupling (CED). The concept of CED, originating from the physics notion of decoupling, which means breaking dynamic interdependence between correlated variables [32], was first introduced into environmental policy analysis by the Organisation for Economic Cooperation and Development (OECD) as a metric to assess the separation of economic growth from carbon emissions [33]. CED provides a new perspective for research in the field of environmental economics, which is used to measure the changing relationship between regional economic growth and carbon emissions [34]. Currently, scholars have applied two primary methods to assess CED levels across countries and regions. The first is the OECD method, which examines the change in the relationship between economic growth and carbon emissions over a specific sample period, using a base year as a comparative reference [33]. For instance, Rüstemoğlu (2019) used the OECD method to measure Germany’s CED level [35]. However, this method has the following shortcomings: First, it only adopts a static perspective and fails to capture the dynamic relative changes between economic growth and carbon emissions [36]. Second, the classification of decoupling types is relatively rough, lacking detailed mechanistic explanatory power [37]. Third, manual base year setting may lead to incomparable results due to differing research configurations [37]. In contrast, the second method, the Tapio approach, is more advantageous, which avoids selecting a base year, thus eliminating potential biases caused by the choice of reference year and providing a more comprehensive classification system for CED levels [38]. Numerous scholars have conducted research on CED based on the Tapio method; for instance, Huang and Guo (2023) employed the Tapio method to assess the CED status of 172 countries from 1995 to 2020, in addition to measuring CED levels [39].
Furthermore, many studies have analyzed various factors influencing CED, such as household income [40], urbanization [39], and foreign trade [41]. At the same time, some scholars have also engaged in discussions regarding the impact of DE on CED. For instance, Wu et al. (2023) analyze the spatial distribution and characteristics of the digital economy and carbon decoupling, and find that the digital economy contributes to the decoupling of urban carbon emissions, although the siphoning effect may hinder CED in surrounding cities [7]. However, the studies still focus on individual countries, particularly China, or specific regional blocs, and there remains a significant gap in cross-country comparative research.
In summary, CED provides a valuable measure of the trade-off between carbon reduction and economic growth. A deeper understanding of this relationship is crucial for guiding economies and regions striving to maintain economic growth while reducing carbon emissions. While existing studies have measured decoupling levels across different regions and examined various influencing factors, there is limited research on the impact mechanisms of DE—a profound socio-economic transformation—on CED. A previous study primarily focuses on the effect of DE on carbon emissions, emission efficiency, or CED within a single economy and often examines spatial distribution characteristics of these effects; few studies provide cross-country comparisons while investigating the mechanisms at play [39]. This study measures and analyzes the CED processes in 66 countries based on the Tapio CED method, and delves into the differential effects of DE on CED across countries with varying characteristics. This aims to expand the boundaries of existing research and provide theoretical and policy recommendations for achieving CED in the context of DE.
2.2. Research Hypothesis
2.2.1. The Effect of the DE on CED
This paper argues that DE can have two potential impacts on CED. First, DE may promote CED, bringing a chance for CED. Due to characteristics such as increasing marginal returns, non-scarcity of marginal resources, and zero marginal cost [42], digital technologies—such as artificial intelligence and big data—can simplify and optimize production processes, reduce unnecessary energy consumption, and significantly enhance energy efficiency [43]. From the perspective of micro-level firm production, DE can offer a new paradigm that helps reduce carbon emissions while achieving economic growth [44], thereby creating the chance for CED. Groups with higher educational attainment exhibit greater acceptance and proficiency in applying digital technologies, which can accelerate the implementation and penetration of DE [45]. Furthermore, their deeper awareness of low-carbon environmental protection facilitates the integration of digital technologies with green low-carbon technologies, thereby amplifying the positive facilitating effect of DE on CED [46]. Meanwhile, population expansion is accompanied by a younger demographic structure. Young people serve as core users and innovation entities of the digital economy, driving the iteration of digital technologies and the digital transformation of industries [47]. Additionally, the production and consumption patterns of young people are more oriented toward low-carbon development, which helps DE accelerate CED [48].
Second, DE may hinder CED, which poses a challenge to CED. DE relies heavily on large data centers, servers, and cloud computing facilities, all of which consume substantial amounts of energy [49]. As data processing demands increase, energy consumption also grows, and without effective energy-saving and carbon-reduction measures [50], these technologies will present a challenge to achieving CED. Notably, in economies facing high employment pressure, the development of DE may trigger the practical contradiction of “technology replacing employment” [51]. To stabilize employment, governments may slow down the promotion of highly automated digital technologies and maintain the production models of traditional high-carbon industries to preserve jobs [52]. Meanwhile, when weighing low labor costs against higher costs of promoting digital technologies, enterprises still opt for traditional production methods driven by profit maximization [53,54]. This directly undermines the driving effect of DE on CED.
Based on this analysis, the following competitive research hypotheses are proposed:
Hypothesis 1a.
In economies with higher resident education attainment and greater population expansion, DE promotes CED, bringing a chance to CED.
Hypothesis 1b.
In economies under greater employment pressure, DE hinders CED, bringing a challenge to CED.
2.2.2. Characteristics Influencing the Impact of DE on CED
Scholarly consensus identifies factors such as government efficiency [55], gender equality [56], natural gas utilization [57], and energy transitions based on renewable energy as influential in CED. This study hypothesizes that these factors also affect DE’s role in CED [58].
In many economies, governments play a pivotal role in developing DE and promoting CED [59]. Efficient governments can simultaneously formulate sustainable development policies and implement digital technological solutions for carbon reduction [60]. They can promote the construction of efficient digital network infrastructures and encourage the use of renewable energy in high-energy-consuming digital infrastructures, such as data centers, thereby reducing carbon emissions [61], which provides practical guidance and a conducive environment for DE to contribute to CED. Additionally, governments can offer policy subsidies and financial support for the research and development of digital solutions aimed at carbon emission reduction [62], thereby strengthening DE’s potential to facilitate decoupling.
High levels of gender equality contribute to a favorable social innovation atmosphere and a low-carbon development ethos, which are crucial for integrating DE with CED [63]. Studies have shown that in countries with higher gender equality, the coupling between economic growth and carbon emissions is significantly weaker [56]. Moreover, greater gender equality can bridge the “digital divide,” increasing women’s participation in digital technology research and DE and fostering a more inclusive digital economic environment [64]. This inclusivity can effectively enhance DE’s positive impact on CED. Furthermore, higher gender equality ensures that both men and women benefit equally from digital transformation and efforts to decouple carbon emissions, improving the effectiveness and fairness of decoupling outcomes [65].
Compared to coal and oil, natural gas is a cleaner fossil fuel and is often considered a “bridge fuel” in transitioning to a low-carbon economy. Existing research suggests that, compared to nuclear power, natural gas can more rapidly meet the increasing demand for low-carbon electricity in high-energy-consuming areas. Energy transitions primarily based on renewable energy usage are crucial for promoting CED. By replacing fossil fuels and improving energy efficiency, such transitions reduce carbon emissions, thereby advancing decoupling [66]. However, in the short term, DE promotes decoupling by enhancing energy efficiency and reducing energy consumption. This is similar to the mechanisms through which natural gas and renewable energy-based transitions influence decoupling [67]. Therefore, using natural gas and energy transitions centered on renewable energy may have a substitutive effect on DE’s role in promoting decoupling.
Based on the above analysis, the following research hypothesis is proposed:
Hypothesis 2.
High government efficiency and high levels of gender equality can strengthen DE’s chance role in CED, while natural gas utilization and renewable energy-based transitions may have a substitutive effect on it.
2.2.3. Mechanisms of DE’s Impact on CED
Low-carbon behavior: DE can embed low-carbon behaviors into the decision-making frameworks of enterprises, individuals, and governments through three dimensions: promoting technological innovation, guiding public behavior, and advancing system optimization [68,69]. This, in turn, indirectly fosters CED by increasing low-carbon behaviors. Firstly, digital platforms accelerate the dissemination of information related to green technology research and development, reducing corporate R&D costs and providing financial support for green technology R&D through tools like green finance [70]. Additionally, digital methods can monitor production processes, optimize energy allocation, and reduce energy waste, promoting technological innovation and strengthening enterprises’ low-carbon behaviors [71], indirectly facilitating CED. Secondly, DE leverages digital social media and online communities to promote low-carbon lifestyle concepts across regions [72]. Smart grids and digital demand response systems achieve refined management of energy consumption, improving end-use energy efficiency and encouraging residents to save energy and consume responsibly [73]. This guides public low-carbon behaviors, indirectly promoting CED. Thirdly, DE can utilize big data and remote sensing technologies to monitor regional carbon emission hot spots in real time [74], assisting governments in formulating differentiated carbon reduction policies. Advancing institutional optimization indirectly enhances low-carbon behaviors across society, thereby promoting CED.
Commercial bank loan breadth: The rapid development of DE enables loans to reach “long-tail” customers who are difficult to cover under traditional credit models, increasing loan accessibility for low-income groups and thereby boosting their demand for products and services [75]. Existing research indicates that low-income groups are more price-sensitive in their consumption, tending to choose lower-cost products and services [76]. However, due to additional investments in R&D, production, and certification, green products and services are usually more expensive than traditional ones [77]. Therefore, even if low-income individuals can obtain more loans through DE, these funds may be used to purchase lower-cost but less energy-efficient, higher carbon-emitting products and services, indirectly posing a challenge to CED.
Based on the above analysis, the following research hypothesis is proposed:
Hypothesis 3.
DE indirectly presents a “ chance” for CED by promoting low-carbon behaviors, while simultaneously posing a challenge to CED by increasing the breadth of commercial bank loans.
3. Methods and Data
3.1. CED Calculations and Classification of CED States
Drawing upon the extant literature [78], utilizing carbon emission and GDP data from 66 nations to ascertain the CED status within each country at various time intervals. The calculation formula is outlined as follows:
where signifies the CED status of country i. and denote the levels of carbon emissions in country i during the current period (t) and the previous period (t − 1), respectively. Additionally, and represent the GDP of country i in the current and preceding periods, respectively.
Subsequently, a more visually descriptive analysis of the CED status across various countries and periods is presented, utilizing the derived CED level metrics. Based on decoupling theory, the CED level metric is categorized into eight distinct states as illustrated in Figure 1 below.
Figure 1.
Eight CED states.
The classification of CED states is established by integrating economic growth conditions, carbon emission levels, and CED metrics. As depicted in Figure 1, numerical values ranging from 1 to 8 are employed to streamline the depiction of the eight distinct CED states. A positive GDP growth rate is observed within states 1, 2, 3, and 4. The closer the increase in carbon emissions approaches zero or even turns negative, the more optimal the CED state becomes. Among these states, state 1, characterized by a positive GDP growth rate and a negative growth rate of carbon emissions, emerges as the most optimal configuration among the eight states. A negative GDP growth rate is evident in states 5, 6, 7, and 8. When the growth rate of carbon emissions is positive, as seen in state 8, it signifies an uneconomic situation where the escalation in carbon emissions does not align with the anticipated economic gains. Conversely, when the growth rate of carbon emissions is negative, as observed in states 5, 6, and 7, it indicates a scenario where the economy’s scale and economic returns diminish concurrently with the reduction in carbon emissions, rendering it unsuitable for the carbon emissions state. Such circumstances are also deemed unfavorable for the long-term sustainable development of an economy.
3.2. Construction of DE Evaluation Indicators
Drawing upon the studies [79,80,81], this study employs the hierarchical analysis method and entropy weighting technique to establish evaluation indices for the multi-country DE development level. The detailed selection and weighting of the indicators are presented in Table 1.
Table 1.
National digital economy development level comprehensive evaluation index measurement system.
3.3. Finite Mixture Model (FMM)
Considering the cross-country heterogeneity and time influences, this study formulates a two-way fixed effects model firstly for benchmark analysis, with the fundamental structure of the model outlined as follows:
where is the explanatory variable, which in the regression underlying this paper is the CED status of each country (categorized based on the state of economic growth), is the core explanatory variable, which is defined as the degree of DE development, represents a set of control variables, k and t signify continent and time fixed effects, respectively, and represents the random error term. Further, to conduct a difference-in-differences analysis of the role of DE in influencing the CED, we construct a FMM based on (2). FMM is an extension of the latent class regression model, integrating continuous and categorical latent variables into a unified framework [14,82], endogenously grouping the samples according to their respective data characteristics, avoiding the problems of artificiality and subjectivity of exogenous grouping. Compared to traditional estimation methods, FMM offers several advantages in our analysis. First, the impact of DE on CED varies across different groups. Second, the group membership of samples is determined endogenously and expressed probabilistically. Third, there may be transitions between groups for countries over the sample period. Fourth, influences between group divisions can be considered. Referring to the existing studies, we consider constructing a generalized FMM with error rows following a normal distribution as follows:
where B is the number of groups, x is the matrix of variables consisting of core explanatory variables and control variables, corresponding to the matrix of coefficients to be estimated, z is the matrix of accompanying variables, corresponding to the matrix of coefficients to be estimated, represents the probability of the country’s affiliation with group b and denotes the conditional distribution of y in group b, and, when B = 1, Equation (3) is equivalent to Equation (2). The probability of each country belonging to group b can be expressed as Equation (4) below:
Subsequently, parameter estimation is performed using the maximum likelihood estimation method, and the corresponding logarithmic likelihood function is
3.4. Moderating Effects Test Model and Mechanism Analysis Model
The process of constructing the moderating effects test and mechanism analysis model is as follows:
where represents the moderating factor, denotes the interaction term between DE and the factor.
Secondly, this paper employs a combination of causal stepwise regression and bootstrap-based structural equation modeling for the pathway analysis. Following [83], the estimation equations for causal stepwise regression are provided in Equations (7)–(9).
where is the mechanism variable, are the parameters to be estimated, and the definition of other variable symbols is consistent with the previous formula.
3.5. Variable Selection
Explanatory variable. In this paper, the CED value is used as the explanatory variable, calculated in Equation (1). The computation of CO2 emissions encompasses the aggregation of carbon emissions from 42 distinct fossil energy sources categorized into four overarching classifications: coal, oil, natural gas, other fossil gases, and process stages.
Core independent variable. The level of DE development (Dig) is the core explanatory variable of this study, which is a comprehensive evaluation index based on 11 basic indicators, shown in Table 1.
Control variables. (1) Government consumption share (GC). The predominant tendency of CED in most countries is propelled by policy initiatives [84]. A significant GC signifies an elevated level of governmental authority and control within the national framework, thereby enhancing the likelihood of carbon emission mitigation, particularly when emphasizing environmental preservation and the implementation of carbon abatement strategies [85]. Furthermore, government subsidies are a pivotal catalyst in stimulating public demand for low-carbon commodities and fostering engagement in eco-friendly practices [86]. (2) Gross capital formation share (CF). CF serves as a reflection of a country’s economic growth structure [87]. A high CF indicates increased capital investment in the production process, thereby stimulating economic expansion [88], signifying the potential for the country to allocate capital towards low-carbon sectors, facilitating the energy transition and fostering the CED [89]. (3) Tertiary sector percentage (TS). A rise in TS signifies a transformation in the economic structure towards the service sector, which decreases the share of high carbon-emitting industries like manufacturing, reducing the overall economy’s carbon emissions [90]. Additionally, new energy and low-carbon technology industries are often more prevalent in the tertiary sector, and a high TS may promote the development of low-carbon industries [91]. (4) Urban population proportion (UP). UP is an indicator of a country’s level of urbanization. Typically, as UP rises, urbanization advances, potentially driving up demand for industry and transportation, thereby increasing carbon emissions [92]. (5) Women, Business and the Law Index (WB).
Conditioning variables. (1) Unemployed population proportion (UE). UE reflects the flexibility and allocation efficiency of the labor market, and its fluctuations directly impact overall economic activity. (2) Population growth rate (PG). PG is closely related to age structure. Regions with high population growth rates typically exhibit a higher proportion of young population, greater acceptance of digital technologies [47], and stronger low-carbon awareness [48]. (3) Tertiary education enrolment (TE). Increased enrollment in tertiary education can boost technological innovation and the accumulation of human capital, which aids in shifting the economic structure towards knowledge-intensive and low-carbon sectors [93]. Individuals with higher education levels in less developed areas often possess a stronger awareness of low-carbon practices and are more likely to decrease high-carbon emitting behaviors [94]. To avoid the effect of multicollinearity, this paper performs a logarithmic transformation of TE. The specific definitions of each variable are shown in Table 2.
Table 2.
Definition of variables.
3.6. Data Source and Data Description
This study is based on panel data for 66 countries from 2011 to 2022; the sample chosen countries account for more than 82% of the global GDP, while also aligning with the national distribution characteristics of various continents, possessing a certain degree of representativeness. Data indicators are obtained from the World Bank database, the United Nations E-Government Knowledgebase (UN-EgovKB), and MEIC, and all monetary indicators are adjusted to constant 2010 US dollar prices. The specific data description is shown in Table 3.
Table 3.
Variables description.
4. Results
4.1. CED Status Analysis
Figure 2 shows the CED status and conversion process in different countries (see Table A1 for full country name and country code correspondence). As shown in Figure 2a, there is an overall positive trend in the CED status of individual countries. By 2021, none of the countries in the sample had negative GDP growth. Among these, 30 countries had a carbon emission growth rate significantly lower than their GDP growth rate, indicating an initial CED. Notably, seven of these countries achieved a reduction in carbon emissions while maintaining positive GDP growth, demonstrating strong decoupling. As shown in Figure 2b, the United States typically represents developed countries [95]. Due to the long-term industrialization development, it has a high carbon emission base, and it has made a lot of innovation and investment in clean energy development and energy efficiency improvement, and is in the process of booming high-tech industry, which has brought impetus to CED [96]. From 2011 to 2022, CED status in the United States exhibited some fluctuations, but overall, it was relatively good.
Figure 2.
CED status and conversion process in different countries. (a) shows changes in CED status between 2011, 2016 and 2021 in 66 countries; (b) reports the evolution of CED from 2011 to 2022 for four typical countries: the United States, China, Morocco and Greece; distribution of decoupling status in 2022 for different countries is shown in (c).
As a typical developing country undergoing an economic growth model transition, China is shifting from high-speed growth to high-quality growth, with green and sustainable development being one of the key objectives of this high-quality economic transformation [97]. With the strengthening of policy support for low-carbon and green initiatives, advances in renewable energy technologies, and the growing demand for green consumption and services, China’s CED has shown positive progress, as reflected in Figure 2b. Morocco, a developing country dependent on agriculture and manufacturing, experienced overall positive development in its CED status from 2011 to 2022, though slightly lagging the United States and China. After experiencing a prolonged economic recession in the early 2010s, Greece is a typical country in economic recovery. As shown in Figure 2b, Greece gradually achieved economic growth while advancing CED, transitioning from a strong negative decoupling to a weak decoupling status by 2022. Additionally, all four countries experienced a sudden deterioration in their CED status during 2020–2021, possibly related to the COVID-19 pandemic.
As shown in Figure 2c, the majority of countries were in one of the three favorable CED states in 2022. The selected samples from most European, Asian, and African countries, along with all countries in Oceania and South America, as well as the United States and Canada in North America, were included in these positive CED states. The remaining samples, consisting of four countries from North America, one from Asia, and two from Africa, were in the expensive negative decoupling state, while one European country was in a recessive decoupling state and another in a weak negative decoupling state.
4.2. What Does DE Bring to CED?
To make the CED value itself represent the advantages and disadvantages of the CED level of the country, the whole sample is firstly divided into two major categories based on the positive and negative GDP increment, in which the smaller the CED value is, the better the CED level is when ∆GDP > 0; and the larger the CED value is, the better the CED level is when ∆GDP < 0. This paper then analyzes the samples of two categories with the help of FMM. Based on the results of AIC, AIC3, BIC and CAIC criteria (shown in Table A2), the samples of the ∆GDP > 0 categories can be divided into four regimes, and the samples of the ∆GDP < 0 categories can be divided into three regimes.
Table 4 below contains the estimated parameters for the regression equation with double fixed effects of time versus continent (top panel) and membership probability parameters (second panel) for each of the seven regimes we identify. As indicated by the FMM regime parameters, the impact of DE on the CED varies significantly across regimes. To assess whether the parameter estimates differ significantly between regimes, we conducted a Wald test (shown in Table A3). For the regimes with ∆GDP > 0, the regression coefficients for DE in Class A are significantly positive, while those for Classes C and D are significantly negative. This implies that in Class A, DE hinders CED, presenting a challenge. Conversely, in Classes C and D, DE represents a chance. The positive effect of DE is stronger in Class D. For the regimes with ∆GDP < 0, the regression coefficients for DE in Class F are significantly negative, while those in Class G are significantly positive. This indicates that DE serves as a chance for the samples, promoting CED in Class G, while serving as a challenge in Class F. The above proves both Hypotheses 1a and 1b.
Table 4.
FMM estimation results.
In addition, we analyze the factors influencing sample grouping based on the parameter estimates of the concomitant variables. As shown in the regime membership probability parameters in Table 4, for the regimes with ∆GDP > 0, using Class A as the base group, the probability of a sample belonging to Class B increases with rising unemployment rates, while the probabilities of samples belonging to Class C and D increase as the population’s education level rises. For the regimes with ∆GDP < 0, using Class E as the base group, the probability of a sample belonging to Class C and D increases with higher population growth rates. Moreover, for the same group (∆GDP < 0), the probability of a sample belonging to Class F rises as the population growth rate decreases. In contrast, samples are more likely to belong to Class G as the population growth rate continues to rise. The above results indicate that in economies experiencing growth, higher levels of education among residents amplify the chance effect of DE on CED, while rising unemployment rates negate this positive effect. In contractionary economies, population growth rates emerge as a critical moderator; that is, with population expansion, the promoting effect of DE on CED becomes increasingly prominent.
Furthermore, to more clearly reflect the differential impacts of DE on CED across various groups, we conducted marginal effect estimation, as illustrated in Figure 3. Based on the estimation results, for the group with ∆GDP > 0: in Class A, as the level of Dig increases, its marginal impact coefficient on CED shifts from negative to positive and gradually rises, indicating that higher DE development levels in this class’s sample increasingly hinder CED; the marginal impact in Class B is statistically insignificant; and in both Class C and Class D, the marginal impact coefficients on CED shift from positive to negative as Dig increase, yet the turning point in Class D occurs significantly earlier than in Class C, suggesting that elevated DE development promotes CED in both groups, with country-specific characteristics in Class D being more conducive to this facilitating effect. For the group with ∆GDP < 0: the marginal impact in Class E is statistically insignificant; in Class F, as Dig rises, the marginal impact coefficient on CED shifts from positive to negative, signifying that higher DE development in this group increasingly impedes CED; in Class G, increasing Dig levels drive the marginal impact coefficient on CED to shift from negative to positive and gradually grow, indicating that elevated DE development in this group promotes CED.
Figure 3.
The linear estimation plot of Dig’s marginal effect on CED. Groupings align with Table 4. In the four groups with ∆GDP > 0 (Class A, Class B, Class C, and Class D), Dig’s negative effect on CED indicates DE’s chance role on CED. Conversely, in the three groups with ∆GDP < 0 (Class E, Class F, and Class G), Dig’s positive effect on CED reflects DE’s chance role on CED. The confidence interval is set at 10%; if the interval includes 0 (represented by a dashed line), it signifies that the effect at that Dig value is not statistically significant.
4.3. Robust Tests
Robust tests of the results of the FMM analysis by five methods are identified as follows:
Add a concomitant variable. We introduce the variable “researchers in R&D per million people (RS)” as a concomitant variable, given that the level of higher education enrollment does not fully capture the talent needed for DE innovation. The results in Table A4(a1,a2) show that after adding this variable, the FMM grouping and parameter estimates remain largely unchanged, confirming the robustness of the sample classification.
Add a missing variable. This paper includes policy stability (as shown in Table A4b) and intellectual property fees (as shown in Table A4c) as additional control variables in the model. The results indicate that the inclusion of these variables does not significantly alter the estimates for DE, confirming the robustness of the model.
Delete samples during COVID-19. To account for potential disruptions caused by the COVID-19 pandemic on the relationship between DE and CED, we exclude the 2019–2020 data and re-estimate the FMM parameters. The results in Table A4(d1,d2) show that the sample grouping and parameter estimates remain consistent with the previous findings, confirming the robustness.
Adjust the weight setting in the process of generating the explanatory variable. Index synthesis using the entropy weight method integrates multi-dimensional basic indicators of the digital economy, effectively avoiding the one-sidedness of single indicators and subjectivity of artificial weight assignment, and can objectively and accurately construct the explanatory variable Dig that reflects a country’s digital economy development level. However, it should be noted that in the aforementioned Dig indicator generation process, individual indicators exert an abnormally strong influence on the overall index, which may suggest the index fails to fully capture the multidimensionality of the digital economy. To address this, we additionally conducted various weight sensitivity tests, reducing the multiple weight differences among different basic indicators while accounting for the varying impact effects between indicators. As shown in Table A5, under different settings of standard deviation of the weights, the regression coefficients of all groups are consistent with those in the benchmark regression, passing the weight sensitivity test.
IV method. Although the original model has controlled for as many potential factors affecting the empirical results as possible, it may still be influenced by certain unobservable factors. Additionally, a higher level of carbon emission decoupling may also lead to a higher degree of digital economy development, suggesting a potential reverse causality between the two. To mitigate the aforementioned issues, this study further employs the instrumental variable estimation method for robustness checks. Following the approach of Wen and Deng (2023), we use the charges for the use of intellectual property as the instrumental variable [98]. The test results are presented in Table 5. The results of the First-stage Regression show that the IV regression coefficients across all seven groups are significantly positive, verifying the relevance assumption of the instrumental variable. The IV (2SLS) Estimation results indicate that the regression coefficients and significance levels of the dependent variable in each group are consistent with those of the benchmark regression. This suggests that after mitigating potential endogeneity, the conclusions drawn earlier remain valid.
Table 5.
Robustness testing using IV.
4.4. Factors Influencing the Effect of DE on CED
Table 6 reports the results of the moderation effect tests for various economic and social factors, and tests Hypothesis 2. To address the small sample size issue in some regimes, we use the bootstrap sampling method for parameter estimation.
Table 6.
Factors influencing the effect of digital economy on CED.
Government effectiveness (Gov). Gov, reflecting the quality of governance, resource allocation, and service effectiveness, may moderate the impact of DE on CED. As shown in Table 6, the interaction term between DE and Gov in Class D is significantly negative, indicating that improved Gov enhances the positive impact of DE on CED, reinforcing the chance effect.
Natural gas use (NGU). As shown in Table 6, high NGU promotes CED. However, the positive interaction term with DE suggests a substitution effect, indicating that it has a substitution effect on the promoting effect of DE on CED, but it cannot be completely replaced.
Gender equality (GU). As shown in Table 6, the interaction term between gender equality and DE in Class D is significantly negative, indicating that GU plays a key moderating role in enhancing DE’s effect on CED, and higher GU strengthens the positive impact of DE on CED.
Renewable energy (RE). The parameter estimate for RE is significantly negative in Class D, as shown in Table 6, confirming its positive effect on CED. However, the interaction term with DE is significantly positive, indicating a substitutive effect on DE’s impact on CED. Additionally, in Class G, the parameter for RE is significantly negative, while the interaction term with DE is significantly positive. This suggests that in regions with negative economic growth, merely promoting energy transition does not directly foster CED, but it does have a positive moderating effect on DE’s role in CED.
4.5. Path Analysis of DE for CED
This study further analyzes the impact pathway of DE on CED and tests Hypothesis 3. Given that all sample countries had a GDP growth rate greater than 0 as of 2022, and in the DE era, leveraging DE as a chance to promote its role in CED has become a global goal. Considering the varying sample sizes across different groups and their analytical feasibility, this section focuses on Class D to examine the impact pathway of DE on CED in countries with positive GDP growth. Table 7 presents the parameter estimates from the path analysis.
Table 7.
Mechanisms analysis.
Path A: Low-carbon behavior (LB). From a macro perspective, low-carbon behavior is represented by the total carbon emissions of all residents in a country or region while meeting production and consumption needs [99]. Based on Niamir et al. (2020), we use per capita carbon emissions to measure the overall low-carbon behavior of residents in a country [99]. Per capita carbon emissions align with the logic of climate equity, cover behaviors in production and consumption ends, and serve as a practical core indicator for measuring countries’ low-carbon behavior—despite limitations, it remains of reference value [100,101]. As shown in Path A of Table 7, the coefficient for the direct impact of DE on CED is significantly negative, while its effect on low-carbon behavior is significantly positive, confirming the existence of the mediation pathway. Step 3 further reveals that both the DE development level and low-carbon behavior improvements contribute to CED. The above results indicate that DE promotes CED by increasing LB. Meanwhile, to verify the robustness of the mediation test conclusions, we conducted a mediation effect test using a 50-fold bootstrap procedure. As shown in Table 7, the mediation test conclusions are robust.
Path B: Commercial bank loan breadth (CLB). Path B of Table 7 shows that while DE’s direct effect on CED is significantly negative, its effect on CLB is significantly positive. In Step 3, DE’s direct effect on CED remains negative, while CLB’s effect is positive. These findings suggest that DE directly promotes CED, but indirectly hinders it by increasing CLB, presenting a “challenge”. Similarly, the robustness of the mediating effect conclusion was validated using a 50-fold bootstrap procedure. However, the direct effect is significantly stronger than the indirect effect, indicating that DE’s chance effect on CED outweighs its challenge effect.
4.6. Heterogeneity Analysis
This paper further explores the heterogeneous impacts of country-specific characteristics on the effect of DE on CED, with comprehensive consideration of institutional and economic factors. Consistent with the previous section, considering the varying sample sizes across different groups and their analytical feasibility, this section focuses on Class D.
Institutional factors. (1) Rule of Law (RL). RL is a core component of institutional quality. A high level of RL not only safeguards the definition of property rights and orderly circulation of digital factors but also provides institutional support for the strict implementation of environmental regulation policies related to carbon emissions, serving as a fundamental guarantee for the effective operation of the market economy. As shown in Table 8, the regression coefficient of Dig is significantly negative in the high RL group, while it is not significant in the low RL group. These results indicate that a high level of RL facilitates the positive effect of DE on CED, whereas a low level of RL hinders it. (2) Regulatory Quality (RQ). National RQ refers to the scientific soundness, fairness, and implementation efficiency of government regulatory policies, and is a core indicator for measuring government governance effectiveness. As shown in Table 8, the regression coefficient of Dig is significantly negative in the high RQ group, while it is not significant in the low RQ group. This suggests that low-quality regulation impedes the positive impact of DE on CED in such countries. (3) Political Stability (PS). Political stability is an institutional indicator reflecting the continuity of national policies and the security of the social environment. As shown in Table 8, the regression coefficient of Dig is significantly negative in the high PS group, while it is not significant in the low PS group. Based on these results, a stable political environment can guarantee the positive effect of DE on CED.
Table 8.
Heterogeneity analysis results.
Economic factors. (1) GDP per Capita (PGDP). PGDP measures the stage of economic development and the residents’ income level. As PGDP increases, the economy’s demand structure shifts from basic industrial products to high-end services and green products, while public preference for environmental quality gradually strengthens. As shown in Table 8, the regression coefficient of Dig is significantly negative in the high PGDP group, while it is not significant in the low PGDP group. This implies that in countries with lower residents’ income levels, the economy does not generate strong demand for digital products or preferences for environmental friendliness, which hinders the positive effect of DE on CED. (2) High-Tech Industry Development (HT). HT is a concentrated manifestation of technological innovation capability and serves as a core carrier for digital and low-carbon technology innovation. Improved HT can drive the growth of high-value-added knowledge-intensive industries, reducing carbon emission dependence. Meanwhile, technological spillovers from high-tech industries can promote the digital and green transformation of traditional high-energy-consuming sectors. As shown in Table 8, the regression coefficient of Dig is significantly negative in the high HT group, while it is not significant in the low HT group. This indicates that a high level of HT facilitates the positive effect of DE on CED.
5. Discussion
Scholars have mainly studied DE’s effect on carbon emissions, intensity, and efficiency. However, studies on its effect on CED are limited, with most studies focusing on individual economies [7,22]. Few have compared the impact across multiple countries or explored the mechanisms of this influence [39]. This study selects 66 countries from 2011 to 2022 that correspond to different levels of socioeconomic development as the empirical targets. By using FMM, this paper explores how DE influences CED differently in countries with varying economic characteristics, examining the effects of various objective factors and analyzing the mechanisms. The graphical representation of the main findings of the article is shown in Figure 4.
Figure 4.
Graphic representation of key findings.
The findings reveal an overall positive trend in CED across the 66 sampled countries, with the majority achieving favorable decoupling statuses by 2022. This aligns with a growing body of research documenting the advancement of global green development [58,77,91], driven by the widespread implementation of low-carbon strategies and international climate agreements, such as the Paris Agreement. However, a notable downturn in CED performance occurred across numerous economies between 2019 and 2020. Consistent with existing studies, this disruption is closely linked to the COVID-19 pandemic, which triggered temporary rollbacks in green investments, supply chain disruptions, and increased reliance on fossil fuels for economic recovery [102].
Against the backdrop of DE emerging as a dominant paradigm for global economic growth, this study employs the FMM to unpack its conditional effects on CED across countries with divergent economic trajectories. The analysis highlights that DE exerts dual impacts—both chance and challenge—on CED. In economies experiencing growth, higher levels of education among residents amplify the chance effect of DE on CED, consistent with previous research [7]. Conversely, rising unemployment rates negate this positive effect, likely due to reduced consumer demand for sustainable products and constrained corporate investment in low-carbon technologies during economic slack [51,52]. In contractionary economies, population growth rates emerge as a critical moderator. Faster population expansion appears to enhance the DE’s ability to drive decoupling; possibly, the younger demographic structure driven by population expansion facilitates the implementation of digital low-carbon technologies and green innovation, significantly amplifying DE’s role in promoting CED [47]. Policymakers can implement targeted DE development policies based on regional economic development trends and national characteristics to optimize the positive effects of DE on CED.
Additionally, institutional, economic and social factors further shape the DE’s impact on CED. In the analysis of institutional factors, our results indicate that higher government efficiency significantly amplifies the opportunity effect of the DE, while a stronger rule of law, regulatory quality, and political stability further enhance this positive impact. A robust rule of law clarifies property rights for digital data, safeguards patent revenues from digital technology innovations, and incentivizes enterprises to invest in digital low-carbon R&D [103]. A stable political environment ensures the consistent implementation of long-term strategies such as digital economy development and the “Dual Carbon” goals, prevents resource misallocation caused by policy reversals, and provides stable expectations for long-term investment in digital low-carbon sectors [104]. In this process, governments play dual pivotal roles: as architects of CED policies and as catalysts for DE development through infrastructure investment and system cultivation [59]. Turning to economic factors, our findings indicate that GDP per capita and high-tech industry development exert positive effects on the DE’s impact on CED. Xing and Ye (2022) point out that as GDP per capita rises, the economy’s demand structure shifts from basic industrial goods to high-end services and green products, while public preference for environmental quality gradually strengthens [105]. And our research expands the existing research conclusions from the perspective of CED [105]. Meanwhile, in the analysis of social factors, our study indicates that greater social gender equality promotes the chance effect of DE on CED. Gender equality fosters an inclusive innovation environment that accelerates green technology adoption and underpins sustainable socio-economic progress.
The energy system also interacts with the DE’s decoupling effects in meaningful ways. Our findings indicate that, as a cleaner fossil fuel, natural gas can displace high-carbon alternatives like coal in fossil fuel-dependent energy systems, curbing production-related emissions and advancing CED. Our research findings corroborate the discussion by Graus et al. (2007), who conducted a comparative analysis of fossil fuels such as natural gas and coal from the perspective of energy utilization [106]. Comparing with the existing literature, our analysis reveals that the increased use of natural gas and clean energy substitutes the chance effect, implying that the current chance effect of DE on CED often relies on improving energy efficiency and reducing fossil fuel consumption, which overlaps with the effects of natural gas and clean energy use.
Meanwhile, our exploration of indirect mechanisms uncovers pathways through which DE influences CED while exerting a chance effect. On the one hand, DE can indirectly promote CED by enhancing low-carbon performance across society, which is exactly the case Campana et al. (2025) point out, that smart grid optimization, such as digital supply chain transparency and data-driven industrial energy management, enhances low-carbon performance [107]. On the other hand, DE indirectly hinders CED by increasing the breadth of commercial bank loans. However, our analysis reveals that this indirect hindrance does not outweigh the direct promotion effect. Policymakers can address these two pathways by implementing targeted policies, such as strengthening green consumption subsidies and promoting the operation of the sharing economy alongside the development of DE, thereby mitigating the indirect challenge effect of DE on CED.
6. Conclusions and Policy Implications
This study examines the impact of DE on CED in 66 countries from 2011 to 2022, using FMM to analyze the heterogeneous effects in different economies, the influence of various factors, and the mechanisms through which DE promotes CED. Key findings include:
(1) CED is generally improving across economies, with 81% of the sample countries in favorable decoupling states by 2022, though disparities remain among countries; (2) DE has both chance and challenge effects on CED. In growing economies, higher education levels help DE shift from challenge to chance. However, rising unemployment negates this effect. In contracting economies, population growth impacts the effectiveness of DE in promoting CED. (3) Higher government efficiency and social gender equality enhance the chance effect of DE on CED. Moreover, using natural gas and clean energy can substitute for this effect. (4) DE directly fosters CED through its chance effect and indirectly promotes CED by improving overall low-carbon performance. However, increased commercial bank loans can hinder CED, though this effect does not outweigh the direct benefits. (5) The heterogeneity of institutional and economic characteristics in countries may influence the effect of DE on CED.
Based on the conclusion above, some policy implications can be revealed to promote:
(1) Economies already in positive CED states should strengthen DE policies and impose green low-carbon behavior constraints, while others should prioritize technology transformation and financial support to promote CED. (2) Policymakers should implement education–employment linkage policies, including investing in education and integrating low-carbon skills training, and establish a green employment guarantee fund to support those unemployed during the DE transition, creating green job opportunities, and controlling unemployment. (3) To enhance the chance effect of DE, governments should focus on improving efficiency and promoting gender equality. (4) Strengthen green credit support and consumption subsidies mediated by DE, while encouraging the development of the sharing economy to further support carbon peaking, carbon neutrality, and sustainable development. (5) Given the current substitutive effect of natural gas and renewable energy utilization on DE’s role in promoting CED, it is imperative to further leverage the distinctive advantages of DE in this process, such as harnessing digital technologies and platforms to foster synergy between digital innovations and low-carbon policies, facilitating continuous iterations of green technological advancements and fundamentally transforming consumption patterns.
The future work can be extended to similar issues on provincial-level administrative units. Meanwhile, due to challenges associated with the acquisition and updating of fundamental data, this study is unable to include up-to-date samples, which represents a key limitation of our research. Future studies may build on this work by conducting further analyses using more timely data. The study relies on secondary data sources and cross-country aggregates, which may obscure country-specific dynamics. In addition, cross-border trade dynamics or global supply chain inter-dependency may influence the effect of DE on CED, which could be integrated in subsequent investigations.
Author Contributions
Conceptualization, Y.T. and Z.D.; methodology, Z.D.; software, Y.T.; validation, Z.D.; formal analysis, Y.T. and Z.D.; investigation, Y.T.; resources, Y.T. and Z.D.; data curation, Y.T.; writing—original draft preparation, Y.T.; writing—review and editing, Z.D.; visualization, Y.T.; supervision, Z.D.; project administration, Z.D.; funding acquisition, Z.D. All authors have read and agreed to the published version of the manuscript.
Funding
This research was funded by the Major Program of the National Fund of Philosophy and Social Science of China (No. 22&ZD124).
Institutional Review Board Statement
Not applicable.
Informed Consent Statement
Not applicable.
Data Availability Statement
Data and materials are available from the corresponding author upon request.
Conflicts of Interest
The authors declare no conflicts of interest.
Abbreviations
The following abbreviations are used in this manuscript:
| CED | Carbon emissions decoupling |
| DE | Digital economy |
| FMM | Finite mixture modeling |
| CC | Climate change |
Appendix A
Table A1.
Full country name and country code correspondence.
Table A2.
Basis of sample grouping under FMM modeling.
Table A3.
Wald test.
Table A4.
Robust test.
Table A5.
Weight sensitivity test.
References
- Meinshausen, M.; Lewis, J.; McGlade, C.; Gütschow, J.; Nicholls, Z.; Burdon, R.; Cozzi, L.; Hackmann, B. Realization of Paris Agreement pledges may limit warming just below 2 °C. Nature 2022, 604, 304–309. [Google Scholar] [CrossRef] [Scilit]
- Saiz-Lopez, A.; Fernandez, R.P.; Li, Q.; Cuevas, C.A.; Fu, X.; Kinnison, D.E.; Tilmes, S.; Mahajan, A.S.; Gómez, M.; Iglesias-Suarez, F. Natural short-lived halogens exert an indirect cooling effect on climate. Nature 2023, 618, 967–973. [Google Scholar] [CrossRef] [Scilit]
- Grant, D.; Hansen, T.; Jorgenson, A.; Longhofer, W. A worldwide analysis of stranded fossil fuel assets’ impact on power plants’ CO2 emissions. Nat. Commun. 2024, 15, 7517. [Google Scholar] [CrossRef] [Scilit] [PubMed]
- What Are Long-Term Climate Strategies, and How Can They Help Us Tackle Climate Change? Available online: https://climatepromise.undp.org/news-and-stories/long-term-climate-strategies-LTS-LTLEDS-climate-change (accessed on 24 March 2026).
- Wang, Q.; Su, M. A Preliminary Assessment of the Impact of COVID-19 on Environment—A Case Study of China. Sci. Total Environ. 2020, 728, 138915. [Google Scholar] [CrossRef] [Scilit]
- Galeotti, M.; Lanza, A.; Pauli, F. Reassessing the environmental Kuznets curve for CO2 emissions: A robustness exercise. Ecol. Econ. 2006, 57, 152–163. [Google Scholar] [CrossRef] [Scilit]
- Wu, Y.A.; Duais, Z.; Peng, B.Y. Towards a low-carbon society: Spatial distribution, characteristics and implications of digital economy and carbon emissions decoupling. Humanit. Soc. Sci. Commun. 2023, 10, 761. [Google Scholar] [CrossRef] [Scilit]
- Wang, Q.; Zhang, F.Y. The effects of trade openness on decoupling carbon emissions from economic growth–evidence from 182 countries. J. Clean. Prod. 2021, 279, 123838. [Google Scholar] [CrossRef] [Scilit]
- Pretis, F.; Roser, M. Carbon dioxide emission-intensity in climate projections: Comparing the observational record to socio-economic scenarios. Energy 2017, 135, 718–725. [Google Scholar] [CrossRef] [Scilit] [PubMed]
- The Relationship Between Growth in GDP and CO2 has Loosened; It Needs to Be Cut Completely. Available online: https://www.iea.org/commentaries/the-relationship-between-growth-in-gdp-and-co2-has-loosened-it-needs-to-be-cut-completely (accessed on 24 March 2026).
- Xu, M.M.; Tan, R.P. Digital economy as a catalyst for low-carbon transformation in China: New analytical insights. Humanit. Soc. Sci. Commun. 2024, 11, 841. [Google Scholar] [CrossRef] [Scilit]
- Istrate, R.; Tulus, V.; Grass, R.N.; Stark, W.J.; Guillén-Gosálbez, G. The environmental sustainability of digital content consumption. Nat. Commun. 2024, 15, 3724. [Google Scholar] [CrossRef] [Scilit] [PubMed]
- Wang, W.; Xiao, D.; Wang, J.; Wu, H. The cost of pollution in the digital era: Impediments of air pollution on enterprise digital transformation. Energy Econ. 2024, 134, 107575. [Google Scholar] [CrossRef] [Scilit]
- McLachlan, G.J.; Lee, S.X.; Rathnayake, S.I. Finite mixture models. Annu. Rev. Stat. Appl. 2019, 6, 355–378. [Google Scholar] [CrossRef] [Scilit]
- Kasahara, H.; Shimotsu, K. Nonparametric identification of finite mixture models of dynamic discrete choices. Econometrica 2009, 77, 135–175. [Google Scholar] [CrossRef] [Scilit]
- Zou, Y.; Wang, C.; Najam, H. Energy consumption prediction for households in a society with an ageing population. Energy Strat. Rev. 2025, 57, 101622. [Google Scholar] [CrossRef] [Scilit]
- Zallé, O. Natural resource rents and regime durability: Identifying cross-country durability regimes. Resour. Policy 2023, 81, 103318. [Google Scholar] [CrossRef] [Scilit]
- DasGupta, R. National culture and environmental, social, governance controversies: A cross-country evidence. Appl. Econ. 2025, 57, 3642–3659. [Google Scholar] [CrossRef] [Scilit]
- Tornatzky, L.G.; Fleischer, M. The Processes of Technological Innovation; Lexington Books: Lexington, MA, USA, 1990. [Google Scholar]
- Tapscott, T. The Digital Economy: Promise and Peril in the Age of Networked Intelligence; McGraw Hill Publishing: New York, USA, 1996; ISBN 0070633428. [Google Scholar]
- Hafiz, M.I.; Komal, B.; Chen, S. Understanding the dynamics of natural resources rents, environmental sustainability, and sustainable economic growth: New insights from China. Environ. Sci. Pollut. Res. Int. 2022, 29, 58746–58761. [Google Scholar] [CrossRef] [Scilit]
- Hao, X.L.; Wen, S.F.; Li, Y.H.; Xu, Y.P.; Xue, Y. Can the digital economy development curb carbon emissions? Evidence from China. Front. Psychol. 2022, 13, 938918. [Google Scholar] [CrossRef] [Scilit]
- Wang, X.A.; Zhong, M. Can digital economy reduce carbon emission intensity? Empirical evidence from China’s smart city pilot policies. Environ. Sci. Pollut. Res. 2023, 30, 51749–51769. [Google Scholar] [CrossRef] [Scilit]
- Lyu, K.; Yang, S.W.; Zheng, K.; Zhang, Y. How does the digital economy affect carbon emission efficiency? Evidence from energy consumption and industrial value chain. Energies 2023, 16, 761. [Google Scholar] [CrossRef] [Scilit]
- Zhang, W.; Zhu, Z.R.; Liu, X.M.; Cheng, J. Can green finance improve carbon emission efficiency? Environ. Sci. Pollut. Res. 2022, 29, 68976–68989. [Google Scholar] [CrossRef] [Scilit] [PubMed]
- Ma, Q.; Khan, Z.; Tariq, M.; IŞik, H.; Rjoub, H. Sustainable digital economy and trade adjusted carbon emissions: Evidence from China’s provincial data. Ekon. Istraz. 2022, 35, 5469–5485. [Google Scholar] [CrossRef] [Scilit]
- Cheng, Y.; Zhang, Y.; Wang, J.J.; Jiang, J.X. The impact of the urban digital economy on China’s carbon intensity: Spatial spillover and mediating effect. Resour. Conserv. Recycl. 2023, 189, 106762. [Google Scholar] [CrossRef] [Scilit]
- Lu, Y.; Chen, X.P. Digital economy, new-type urbanization, and carbon emissions: Evidence from China. Environ. Prog. Sustain. Energy 2023, 42, e14045. [Google Scholar] [CrossRef] [Scilit]
- Salman, M.; Long, X.; Dauda, L. The impact of institutional quality on economic growth and carbon emissions: Evidence from Indonesia, South Korea and Thailand. J. Clean. Prod. 2019, 241, 118331. [Google Scholar] [CrossRef] [Scilit]
- Liu, C.; Sun, W.; Li, P. Differential characteristics of carbon emission efficiency and coordinated emission reduction pathways under different stages of economic development: Evidence from the Yangtze River Delta, China. J. Environ. Manag. 2023, 330, 117018. [Google Scholar] [CrossRef] [Scilit]
- Zhang, W.; Fan, H.; Zhao, Q. Seeing green: How does digital infrastructure affect carbon emission intensity? Energy Econ. 2023, 127, 107085. [Google Scholar] [CrossRef] [Scilit]
- Martin, P.C.; Schwinger, J.S. Theory of many-particle systems. I. Phys. Rev. 1959, 115, 1342. [Google Scholar] [CrossRef] [Scilit]
- Wu, Y.; Zhu, Q.W.; Zhu, B.Z. Decoupling analysis of world economic growth and CO2 emissions: A study comparing developed and developing countries. J. Clean. Prod. 2018, 190, 94–103. [Google Scholar] [CrossRef] [Scilit]
- Rao, G.M.; Liao, J.; Zhu, Y.P.; Guo, L. Decoupling of economic growth from CO2 emissions in Yangtze River Economic Belt sectors: A sectoral correlation effects perspective. Appl. Energy 2022, 307, 118223. [Google Scholar] [CrossRef] [Scilit]
- Rüstemoğlu, H. Factors affecting Germany’s green development over 1990–2015: A comprehensive environmental analysis. Environ. Sci. Pollut. Res. 2019, 26, 6636–6651. [Google Scholar] [CrossRef] [Scilit]
- Yuan, Y.; Lu, Y.; Xie, J. Decoupling and decomposition analysis of industrial carbon emissions and economic growth in China from a dynamic perspective. Environ. Dev. Sustain. 2025, 27, 5159–5181. [Google Scholar] [CrossRef] [Scilit]
- Chen, J.; Wang, P.; Cui, L. Decomposition and decoupling analysis of CO2 emissions in OECD. Appl. Energy 2018, 231, 937–950. [Google Scholar] [CrossRef] [Scilit]
- Tenaw, D.; Hawitibo, A.L. Carbon decoupling and economic growth in Africa: Evidence from production and consumption-based carbon emissions. Resour. Environ. Sust. 2021, 6, 100040. [Google Scholar] [CrossRef] [Scilit]
- Huang, J.M.; Guo, L.Y. Research on the impact of financial development in different regions on the decoupling of carbon emissions from economic growth. Energy Environ. 2023, 34, 2007–2030. [Google Scholar] [CrossRef] [Scilit]
- Wang, Q.; Han, X.Y. Is decoupling embodied carbon emissions from economic output in Sino-US trade possible? Technol. Forecast. Soc. Change 2021, 169, 120805. [Google Scholar] [CrossRef] [Scilit]
- Duan, X.L.; Li, X.; Tan, W.F.; Xiao, R. Decoupling relationship analysis between urbanization and carbon emissions in 33 African countries. Heliyon 2022, 8, e10423. [Google Scholar] [CrossRef] [Scilit] [PubMed]
- Goldfarb, A.; Greenstein, S.M.; Tucker, C.E. Economic Analysis of the Digital Economy; University of Chicago Press: Chicago, IL, USA, 2015. [Google Scholar] [CrossRef] [Scilit]
- Goldbach, K.; Rotaru, A.; Reichert, S.; Stiff, G.; Gölz, S. Which digital energy services improve energy efficiency? A multi-criteria investigation with European experts. Energy Policy 2018, 115, 239–248. [Google Scholar] [CrossRef] [Scilit]
- Bai, T.T.; Qi, Y.; Li, Z.H.; Xu, D. Digital economy, industrial transformation and upgrading, and spatial transfer of carbon emissions: The paths for low-carbon transformation of Chinese cities. J. Environ. Manag. 2023, 344, 118528. [Google Scholar] [CrossRef] [Scilit] [PubMed]
- Luo, L. Digital financial inclusion, educational attainment and household consumption. Financ. Res. Lett. 2024, 68, 105976. [Google Scholar] [CrossRef] [Scilit]
- Chen, W.; Li, J. Who are the low-carbon activists? Analysis of the influence mechanism and group characteristics of low-carbon behavior in Tianjin, China. Sci. Total Environ. 2019, 683, 729–736. [Google Scholar] [CrossRef] [Scilit] [PubMed]
- Hällgren, C.; Björk, Å. Young people’s identities in digital worlds. Int. J. Inf. Learn. Technol. 2023, 40, 49–61. [Google Scholar] [CrossRef] [Scilit]
- Mi, L.; Zhu, H.; Yang, J. A new perspective to promote low-carbon consumption: The influence of reference groups. Ecol. Econ. 2019, 161, 100–108. [Google Scholar] [CrossRef] [Scilit]
- Sun, H.S.; Lee, S.E. Case study of data centers’ energy performance. Energy Build. 2006, 38, 522–533. [Google Scholar] [CrossRef] [Scilit]
- Jahangir, M.H.; Mokhtari, R.; Mousavi, S.A. Performance evaluation and financial analysis of applying hybrid renewable systems in cooling unit of data centers—A case study. Sustain. Energy Technol. Assess. 2021, 46, 101220. [Google Scholar] [CrossRef] [Scilit]
- Bessen, J. Automation and jobs: When technology boosts employment. Econ. Policy 2019, 34, 589–626. [Google Scholar] [CrossRef] [Scilit]
- Pearson, P.; Foxon, T. A low carbon industrial revolution? Insights and challenges from past technological and economic transformations. Energy Policy 2012, 50, 117–127. [Google Scholar] [CrossRef] [Scilit]
- Bessen, J. Technology adoption costs and productivity growth: The transition to information technology. Rev. Econ. Dyn. 2002, 5, 443–469. [Google Scholar] [CrossRef] [Scilit]
- Ali, K.; Arslan, H.M.; Mubeen, M.; Azeem, H.; Zhen, Z.; Yushi, J.; Miao, M. From reporting to responsibility: Investigating the influence of sustainability disclosure on earnings management. Environ. Dev. Sustain. 2025, 27, 30431–30464. [Google Scholar] [CrossRef] [Scilit]
- Chu, X.; Yang, D.; Li, J. Sustainability assessment of combined cooling, heating, and power systems under carbon emission regulations. Sustainability 2019, 11, 5917. [Google Scholar] [CrossRef] [Scilit]
- McGee, J.A.; Greiner, P.T.; Christensen, M.; Ergas, C.; Clement, M.T. Gender inequality, reproductive justice, and decoupling economic growth and emissions: A panel analysis of the moderating association of gender equality on the relationship between economic growth and CO2 emissions. Environ. Sociol. 2020, 6, 254–267. [Google Scholar] [CrossRef] [Scilit]
- Wang, Y.H.; Xie, T.Y.; Yang, S.L. Carbon emission and its decoupling research of transportation in Jiangsu Province. J. Clean. Prod. 2017, 142, 907–914. [Google Scholar] [CrossRef] [Scilit]
- Wang, J.D.; Dong, X.C.; Dong, K.Y. How renewable energy reduces CO2 emissions? Decoupling and decomposition analysis for 25 countries along the Belt and Road. Appl. Econ. 2021, 53, 4597–4613. [Google Scholar] [CrossRef] [Scilit]
- Xie, P.J.; Gong, N.Y.; Sun, F.H.; Li, P.; Pan, X.Y. What factors contribute to the extent of decoupling economic growth and energy carbon emissions in China? Energy Policy 2023, 173, 113416. [Google Scholar] [CrossRef] [Scilit]
- Meng, C.Y.; Wang, L.C.; Lin, Y.S. Digital governance and carbon emission reduction: Evidence from “National Pilot Policy of Information Benefiting the People” in China. J. Environ. Manag. 2024, 368, 122179. [Google Scholar] [CrossRef] [Scilit]
- Klein, L.J.; Bermudez, S.; Wehle, H.; Barabasi, S.; Hamann, H.F. Sustainable data centers powered by renewable energy. In Proceedings of the Paper presented at the 2012 28th Annual IEEE Semiconductor Thermal Measurement and Management Symposium (SEMI-THERM), San Jose, CA, USA, 18–22 March 2012; pp. 362–367. [Google Scholar] [CrossRef] [Scilit]
- Duan, Y.; Xi, B.; Xu, X.; Xuan, S. The impact of government subsidies on green innovation performance in new energy enterprises: A digital transformation perspective. Int. Rev. Econ. Financ. 2024, 94, 103414. [Google Scholar] [CrossRef] [Scilit]
- Veckalne, R.; Tambovceva, T. The importance of gender equality in promoting entrepreneurship and innovation. Mark. Manag. Innov. 2023, 14, 158–168. [Google Scholar] [CrossRef] [Scilit]
- The Digital Revolution: Implications for Gender Equality and Women’s Rights 25 Years After Beijing. Available online: https://www.unwomen.org/sites/default/files/Headquarters/Attachments/Sections/Library/Publications/2020/The-digital-revolution-Implications-for-gender-equality-and-womens-rights-25-years-after-Beijing-en.pdf (accessed on 24 March 2026).
- Placing Gender Equality at the Heart of the Global Digital Compact. Available online: https://www.unwomen.org/sites/default/files/2024-03/placing-gender-equality-at-the-heart-of-the-global-digital-compact-en.pdf (accessed on 24 March 2026).
- Saidi, K.; Omri, A. The impact of renewable energy on carbon emissions and economic growth in 15 major renewable energy-consuming countries. Environ. Res. 2020, 186, 109567. [Google Scholar] [CrossRef] [Scilit] [PubMed]
- Xue, Y.; Tang, C.; Wu, H.T.; Liu, J.M.; Hao, Y. The emerging driving force of energy consumption in China: Does digital economy development matter? Energy Policy 2022, 165, 112997. [Google Scholar] [CrossRef] [Scilit]
- Pan, W.R.; Xie, T.; Wang, Z.W.; Ma, L.S. Digital economy: An innovation driver for total factor productivity. J. Bus. Res. 2022, 139, 303–311. [Google Scholar] [CrossRef] [Scilit]
- Zhang, C.; Liu, B.L.; Yang, Y.H. Digital economy and urban innovation level: A quasi-natural experiment from the strategy of “Digital China”. Humanit. Soc. Sci. Commun. 2024, 11, 574. [Google Scholar] [CrossRef] [Scilit]
- Yuan, S.; Pan, X.F. Inherent mechanism of digital technology application empowered corporate green innovation: Based on resource allocation perspective. J. Environ. Manag. 2023, 345, 118841. [Google Scholar] [CrossRef] [Scilit]
- Piras, G.; Muzi, F.; Tiburcio, V.A. Digital management methodology for building production optimization through digital twin and artificial intelligence integration. Buildings 2024, 14, 2110. [Google Scholar] [CrossRef] [Scilit]
- Xing, Z.Y.; Huang, J.; Wang, J. Unleashing the potential: Exploring the nexus between low-carbon digital economy and regional economic-social development in China. J. Clean. Prod. 2023, 413, 137552. [Google Scholar] [CrossRef] [Scilit]
- Dileep, G. A survey on smart grid technologies and applications. Renew. Energy 2020, 146, 2589–2625. [Google Scholar] [CrossRef] [Scilit]
- Amani, M.; Ghorbanian, A.; Ahmadi, S.A.; Kakooei, M.; Moghimi, A.; Mirmazloumi, S.M.; Moghaddam, S.H.A.; Mahdavi, S.; Ghahremanloo, M.; Parsian, S.; et al. Google earth engine cloud computing platform for remote sensing big data applications: A comprehensive review. IEEE J. Sel. Top. Appl. Earth Obs. Remote Sens. 2020, 13, 5326–5350. [Google Scholar] [CrossRef] [Scilit]
- Pazarbasioglu, C.; Mora, A.G.; Uttamchandani, M.; Natarajan, H.; Feyen, E.; Saal, M. Digital Financial Services. World Bank. 2020. Available online: https://www.worldbank.org/en/topic/financialsector/publication/digital-financial-services (accessed on 11 April 2026).
- Handbury, J. Are poor cities cheap for everyone? non-homotheticity and the cost of living across us cities. Econometrica 2021, 89, 2679–2715. [Google Scholar] [CrossRef] [Scilit]
- Barbarossa, C.; Pelsmacker, P. Positive and negative antecedents of purchasing eco-friendly products: A comparison between green and non-green consumers. J. Bus. Ethics 2016, 134, 229–247. [Google Scholar] [CrossRef] [Scilit]
- Tapio, P. Towards a theory of decoupling: Degrees of decoupling in the EU and the case of road traffic in Finland between 1970 and 2001. Transp. Policy 2005, 12, 137–151. [Google Scholar] [CrossRef] [Scilit]
- Oloyede, A.; Faruk, N.; Noma, N.; Tebepah, E.; Nwaulune, A.K. Measuring the impact of the digital economy in developing countries: A systematic review and meta-analysis. Heliyon 2023, 9, e17654. [Google Scholar] [CrossRef] [Scilit]
- Adler, D. Measuring Social Welfare: An Introduction; Oxford University Press: Oxford, UK, 2019. [Google Scholar]
- Liu, J.; Wang, B.; Xue, J. Evaluation of China’s digital economy: A case study using entropy and TOPSIS. Procedia Comput. Sci. 2024, 242, 1256–1262. [Google Scholar] [CrossRef] [Scilit]
- Muthén, B.; Shedden, K. Finite mixture modeling with mixture outcomes using the EM algorithm. Biometrics 1999, 55, 463–469. [Google Scholar] [CrossRef] [Scilit]
- Baron, R.M.; Kenny, D.A. The moderator–mediator variable distinction in social psychological research: Conceptual, strategic, and statistical considerations. J. Pers. Soc. Psychol. 1986, 51, 1173–1182. [Google Scholar] [CrossRef]
- Jin, J.; Wang, F. Impact of government support on firm carbon emission efficiency: The transmission channel of green innovation. Financ. Res. Lett. 2024, 68, 105980. [Google Scholar] [CrossRef] [Scilit]
- Raghutla, C.; Malik, M.N.; Hameed, A.; Chittedi, K.R. Impact of public-private partnerships investment and FDI on CO2 emissions: A study of six global investment countries. J. Environ. Manag. 2024, 360, 121213. [Google Scholar] [CrossRef] [Scilit]
- Ma, C.; Yang, H.; Zhang, W.; Huang, S. Low-carbon consumption with government subsidy under asymmetric carbon emission information. J. Clean. Prod. 2021, 318, 128423. [Google Scholar] [CrossRef] [Scilit]
- Kuznets, S. Quantitative aspects of the economic growth of nations. 5. capital formation proportions: International comparisons for recent years. Econ. Dev. Cult. Change 1960, 8, 1–96. [Google Scholar] [CrossRef] [Scilit] [PubMed]
- Hertwich, E.G. Increased carbon footprint of materials production driven by rise in investments. Nat. Geosci. 2021, 14, 151–155. [Google Scholar] [CrossRef] [Scilit]
- Paloheimo, E.; Salmi, O. Evaluating the carbon emissions of the low carbon city: A novel approach for consumer based allocation. Cities 2013, 30, 233–239. [Google Scholar] [CrossRef] [Scilit]
- Yu, S.W.; Zheng, S.H.; Li, X.; Li, L.X. China can peak its energy-related carbon emissions before 2025: Evidence from industry restructuring. Energy Econ. 2018, 73, 91–107. [Google Scholar] [CrossRef] [Scilit]
- Albino, V.; Ardito, L.; Dangelico, R.M.; Petruzzelli, A.M. Understanding the development trends of low-carbon energy technologies: A patent analysis. Appl. Energy 2014, 135, 836–854. [Google Scholar] [CrossRef] [Scilit]
- Madlener, R.; Sunak, Y. Impacts of urbanization on urban structures and energy demand: What can we learn for urban energy planning and urbanization management? Sust. Cities Soc. 2011, 1, 45–53. [Google Scholar] [CrossRef] [Scilit]
- Çakar, N.D.; Gedikli, A.; Erdogan, S.; Yıldırım, D.Ç. Exploring the nexus between human capital and environmental degradation: The case of EU countries. J. Environ. Manag. 2021, 295, 113057. [Google Scholar] [CrossRef] [Scilit]
- Duan, H.Y.; He, B.L.; Song, J.N.; Li, W.; Liu, Z.Y. Preference of consumers for higher-grade energy-saving appliances in hierarchical Chinese cities. J. Environ. Manag. 2023, 345, 118806. [Google Scholar] [CrossRef] [Scilit]
- Tan, Z.; Wu, Y.F.; Gu, Y.F.; Liu, T.T.; Wang, W.; Liu, X.M. An overview on implementation of environmental tax and related economic instruments in typical countries. J. Clean. Prod. 2022, 330, 129688. [Google Scholar] [CrossRef] [Scilit]
- Wang, Q.; Wang, S.S. Decoupling economic growth from carbon emissions growth in the United States: The role of research and development. J. Clean. Prod. 2019, 234, 702–713. [Google Scholar] [CrossRef] [Scilit]
- Zhang, P.D.; Yuan, H.M.; Tian, X. Sustainable development in China: Trends, patterns, and determinants of the “Five Modernizations” in Chinese cities. J. Clean. Prod. 2019, 214, 685–695. [Google Scholar] [CrossRef] [Scilit]
- Wen, J.; Deng, Y. How does intellectual property protection contribute to the digital transformation of enterprises? Financ. Res. Lett. 2023, 58, 104340. [Google Scholar] [CrossRef] [Scilit]
- Niamir, L.; Kiesewetter, G.; Wagner, F.; Schöpp, W.; Filatova, T.; Voinov, A.; Bressers, H. Assessing the macroeconomic impacts of individual behavioral changes on carbon emissions. Clim. Change 2020, 158, 141–160. [Google Scholar] [CrossRef] [Scilit]
- Broekhoff, D.; Ghosh, E. Closing the Emissions Gap: Addressing Consumption at a Systemic Level. In Technical Report on Opportunities to Reduce Greenhouse Gas Emissions Caused by Oregon’s Consumption; Stockholm Environment Institute: Stockholm, Sweden, 2024; Available online: https://sei.org/projects/consumption-based-emissions-oregon/ (accessed on 24 March 2026).
- Sovacool, B.K.; Newell, P.; Carley, S. Equity, technological innovation and sustainable behaviour in a low-carbon future. Nat. Hum. Behav. 2022, 6, 326–337. [Google Scholar] [CrossRef] [Scilit] [PubMed]
- Billon, P.; Lujala, P.; Singh, D. Fossil fuels, climate change, and the COVID-19 crisis: Pathways for a just and green post-pandemic recovery. Clim. Policy 2021, 21, 1347–1356. [Google Scholar] [CrossRef] [Scilit]
- Liu, Y.; Li, J.; Deng, N. Can intellectual property protection promote high-quality development of manufacturing? From the perspective of entrepreneurship. Appl. Econ. 2026. [Google Scholar] [CrossRef] [Scilit]
- Lu, H.; Huang, C.; Mirza, S.S. Corporate sustainability and CO2 emissions control efficeincy: Unveiling the impact of economic policy uncertainty and policy shocks. Econ. Change Restruct. 2026, 59, 28. [Google Scholar] [CrossRef] [Scilit]
- Xing, X.; Ye, A. Consumption upgrading and industrial structural change: A general equilibrium analysis and empirical test with low-carbon green transition constraints. Sustainability 2022, 14, 13645. [Google Scholar] [CrossRef] [Scilit]
- Graus, W.; Voogt, M.; Worrell, E. International comparison of energy efficiency of fossil power generation. Energy Policy 2007, 35, 3936–3951. [Google Scholar] [CrossRef] [Scilit]
- Campana, P.; Censi, R.; Ruggieri, R. Smart grids and sustainability: The impact of digital technologies on the energy transition. Energies 2025, 18, 2149. [Google Scholar] [CrossRef] [Scilit]
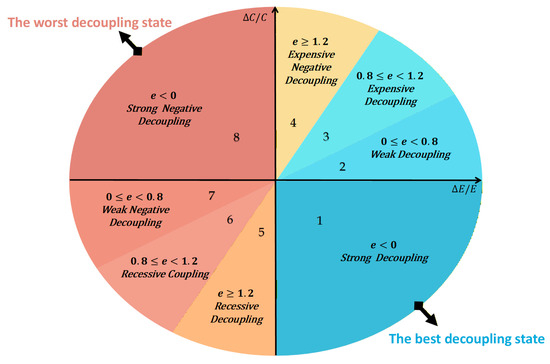
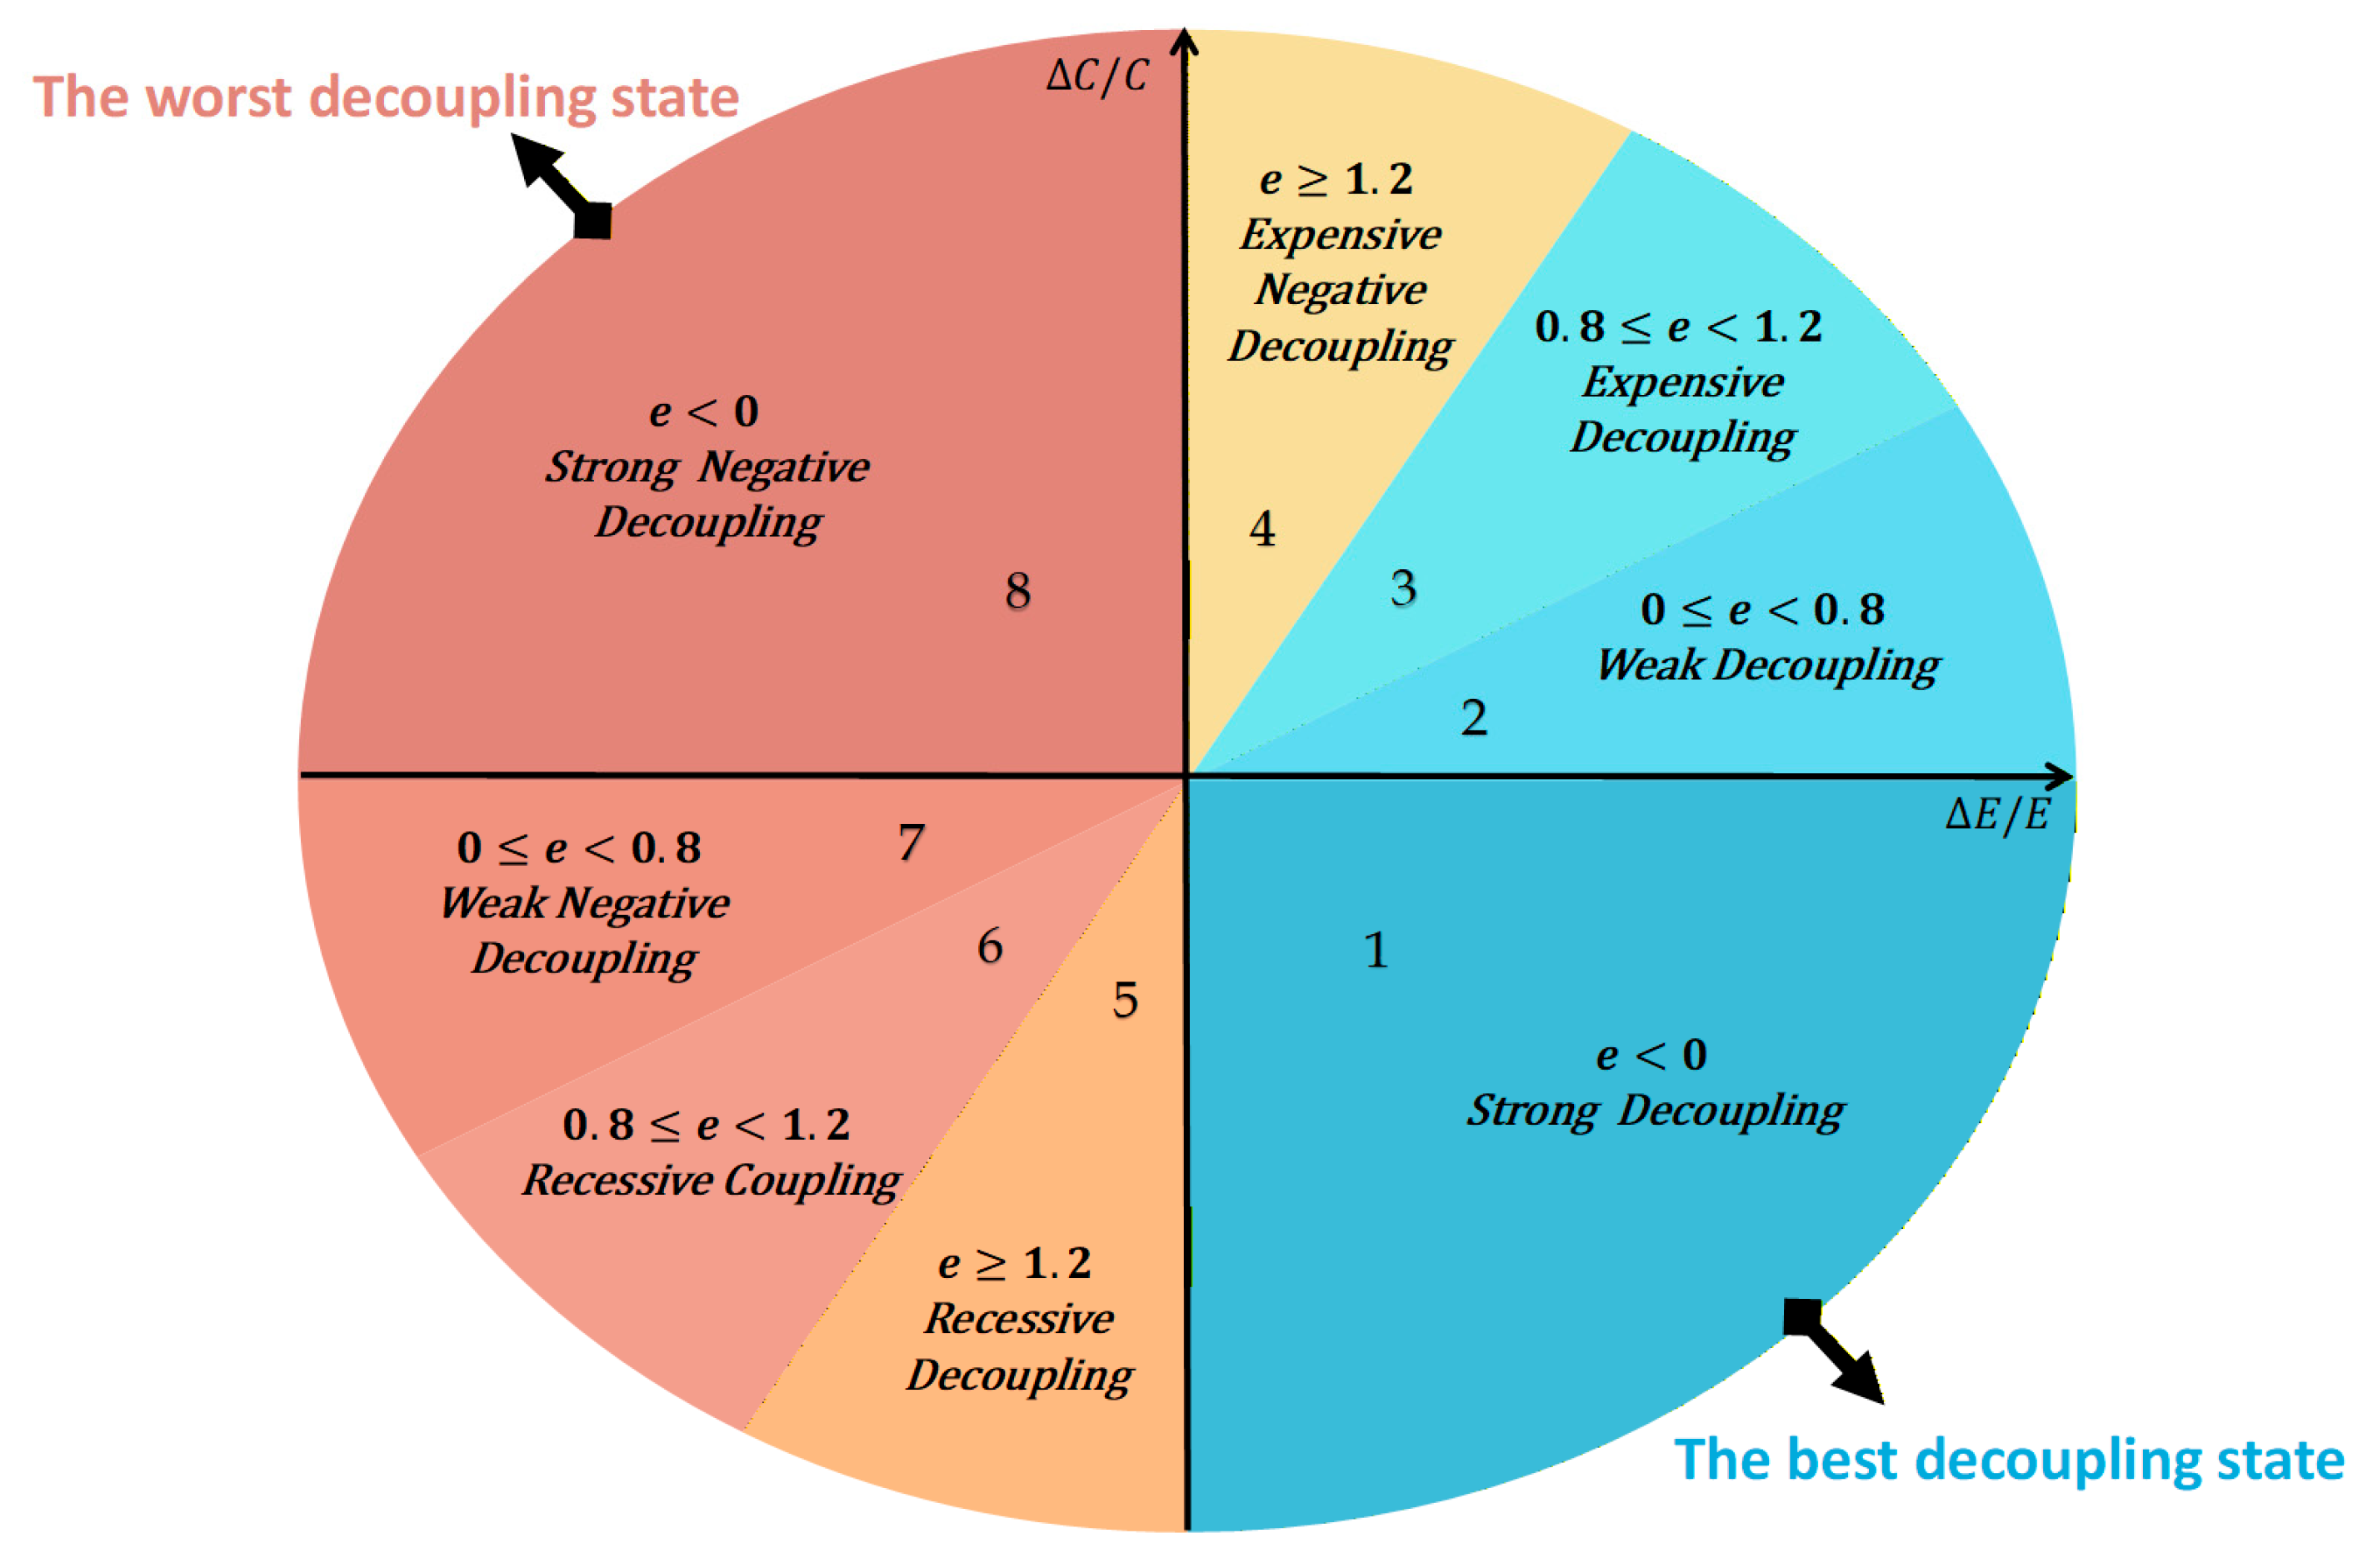
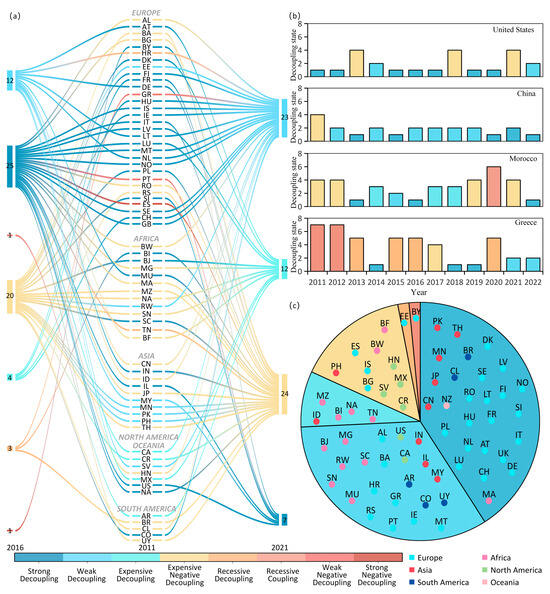
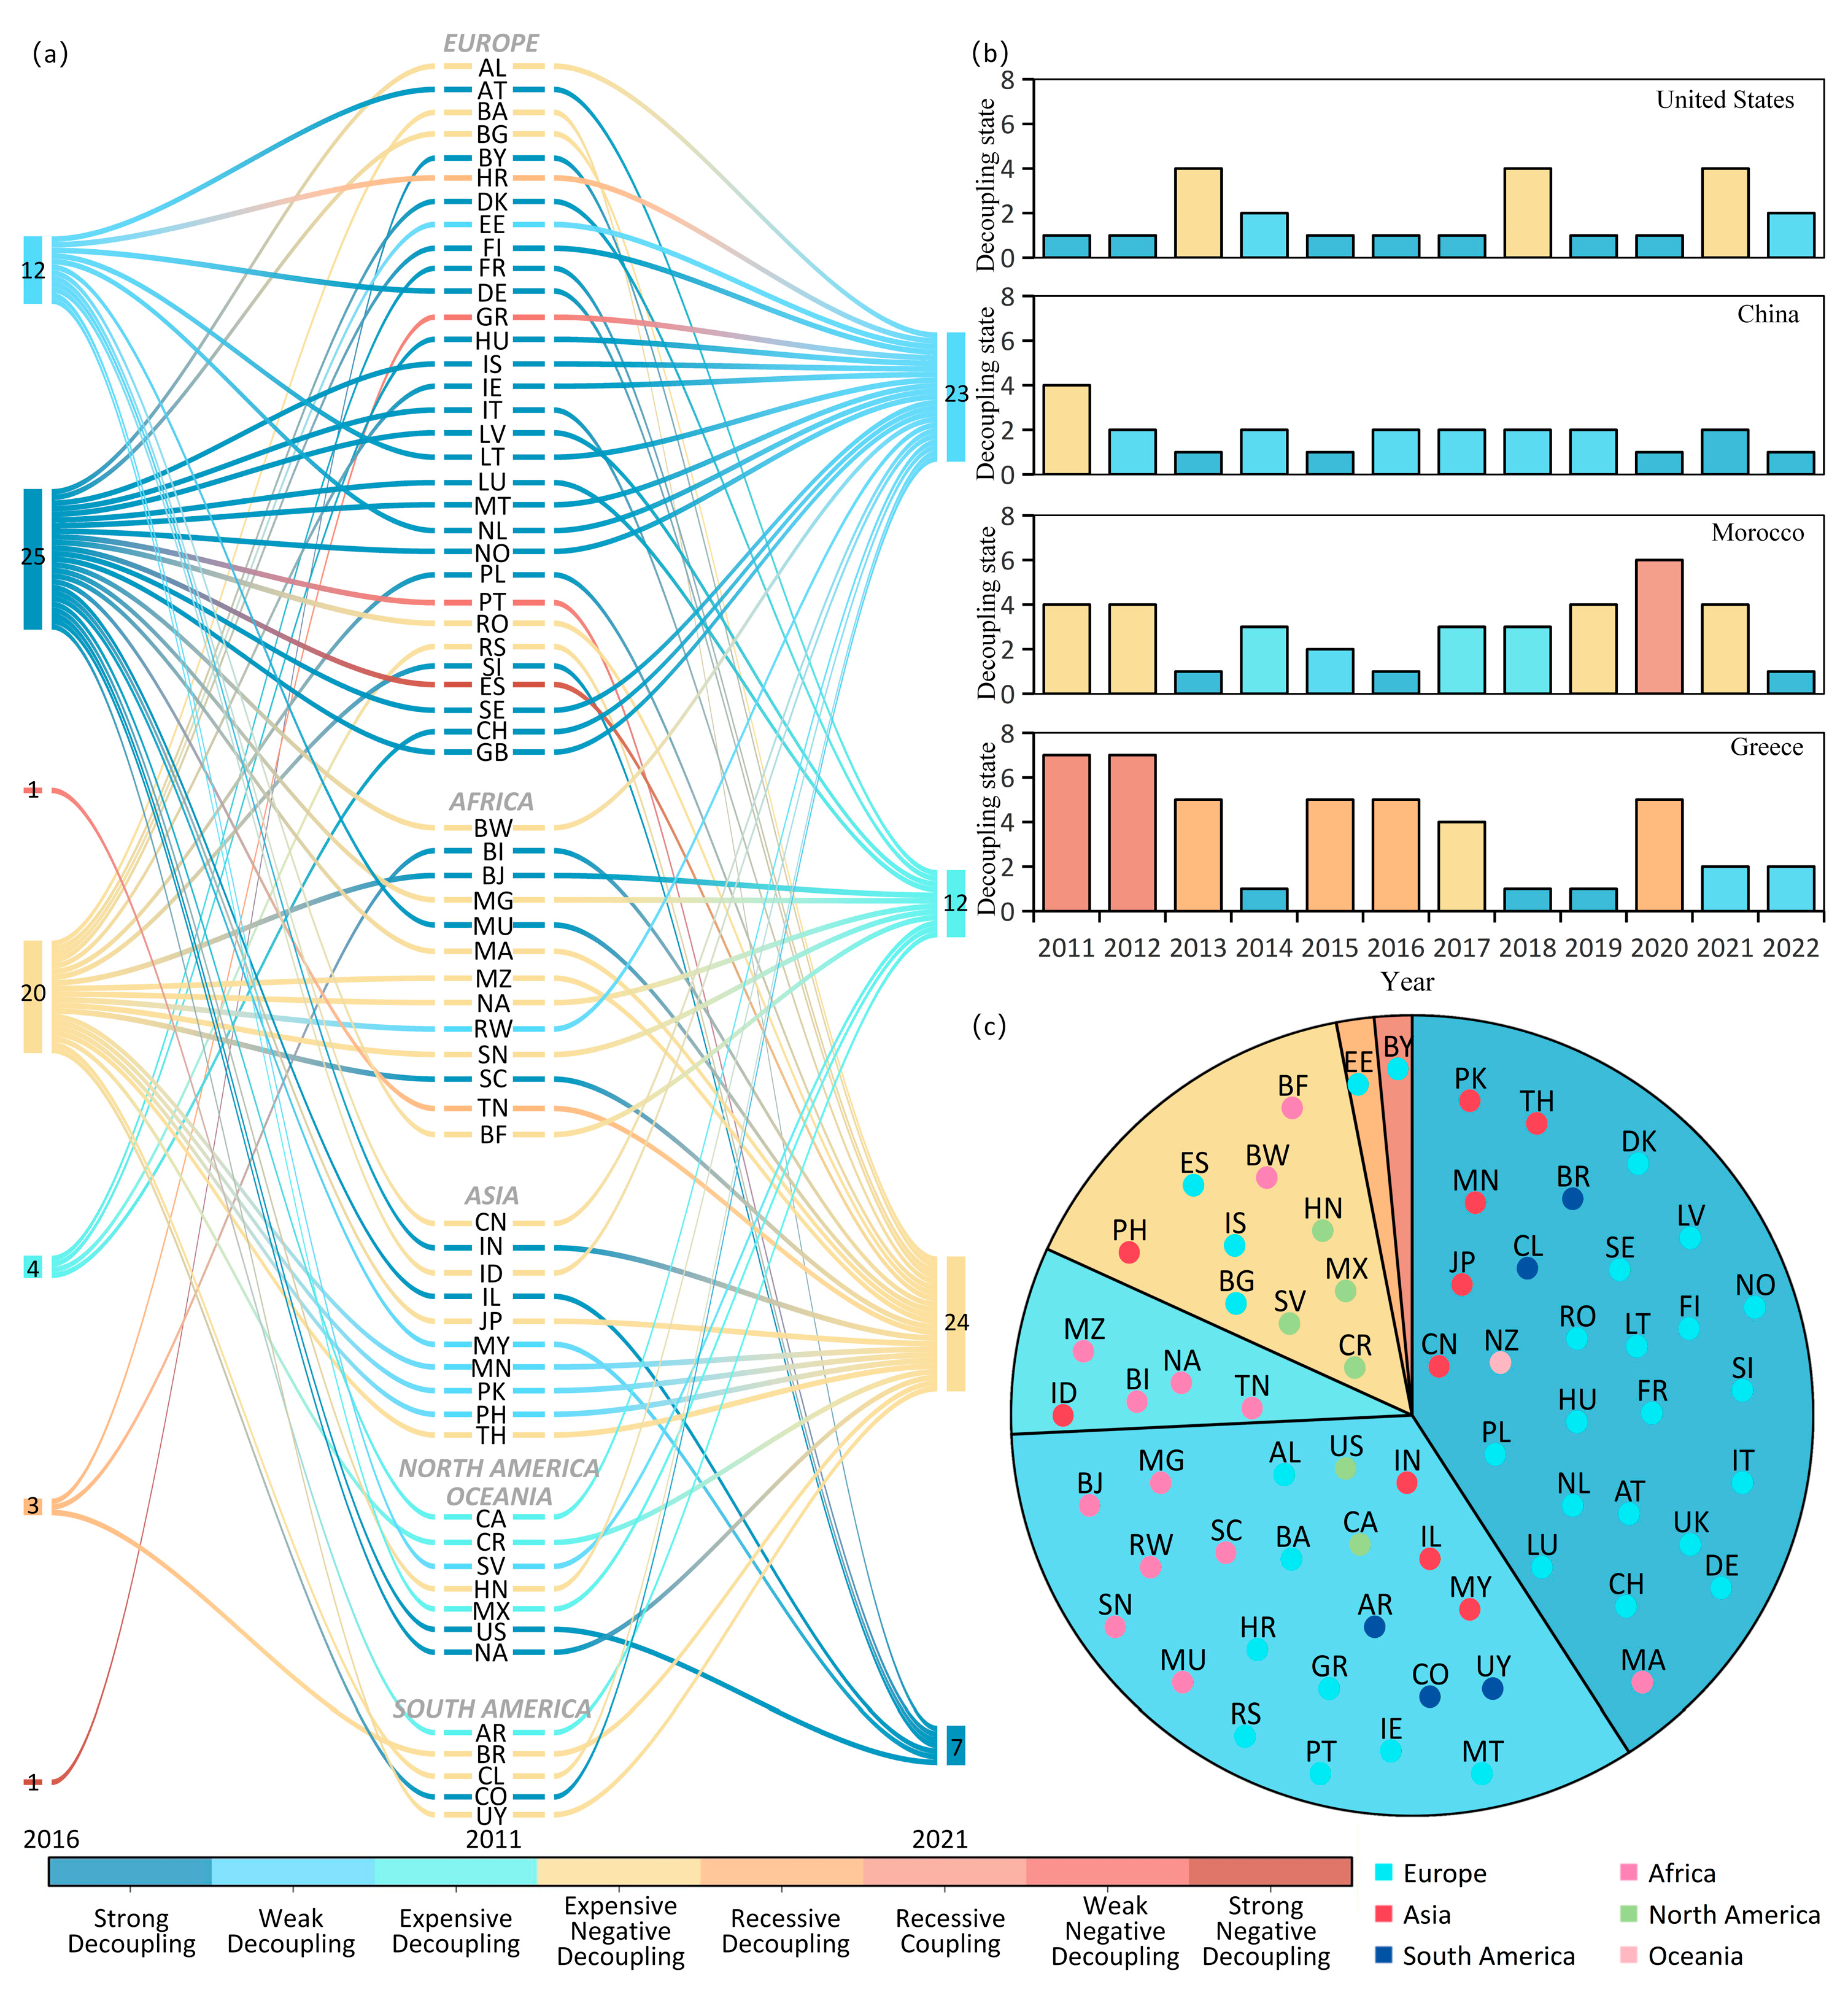
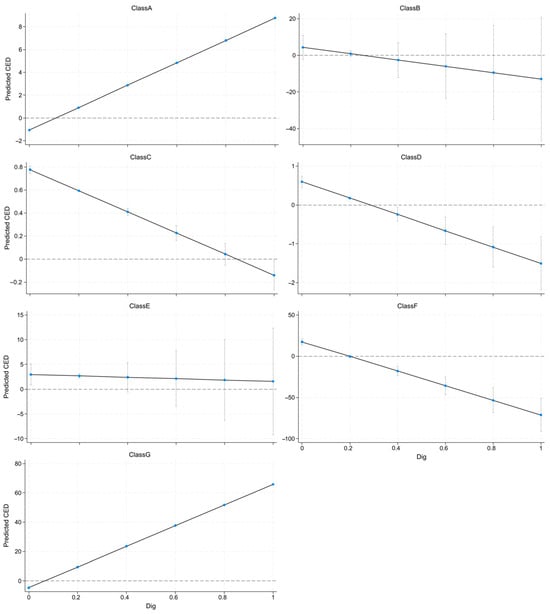
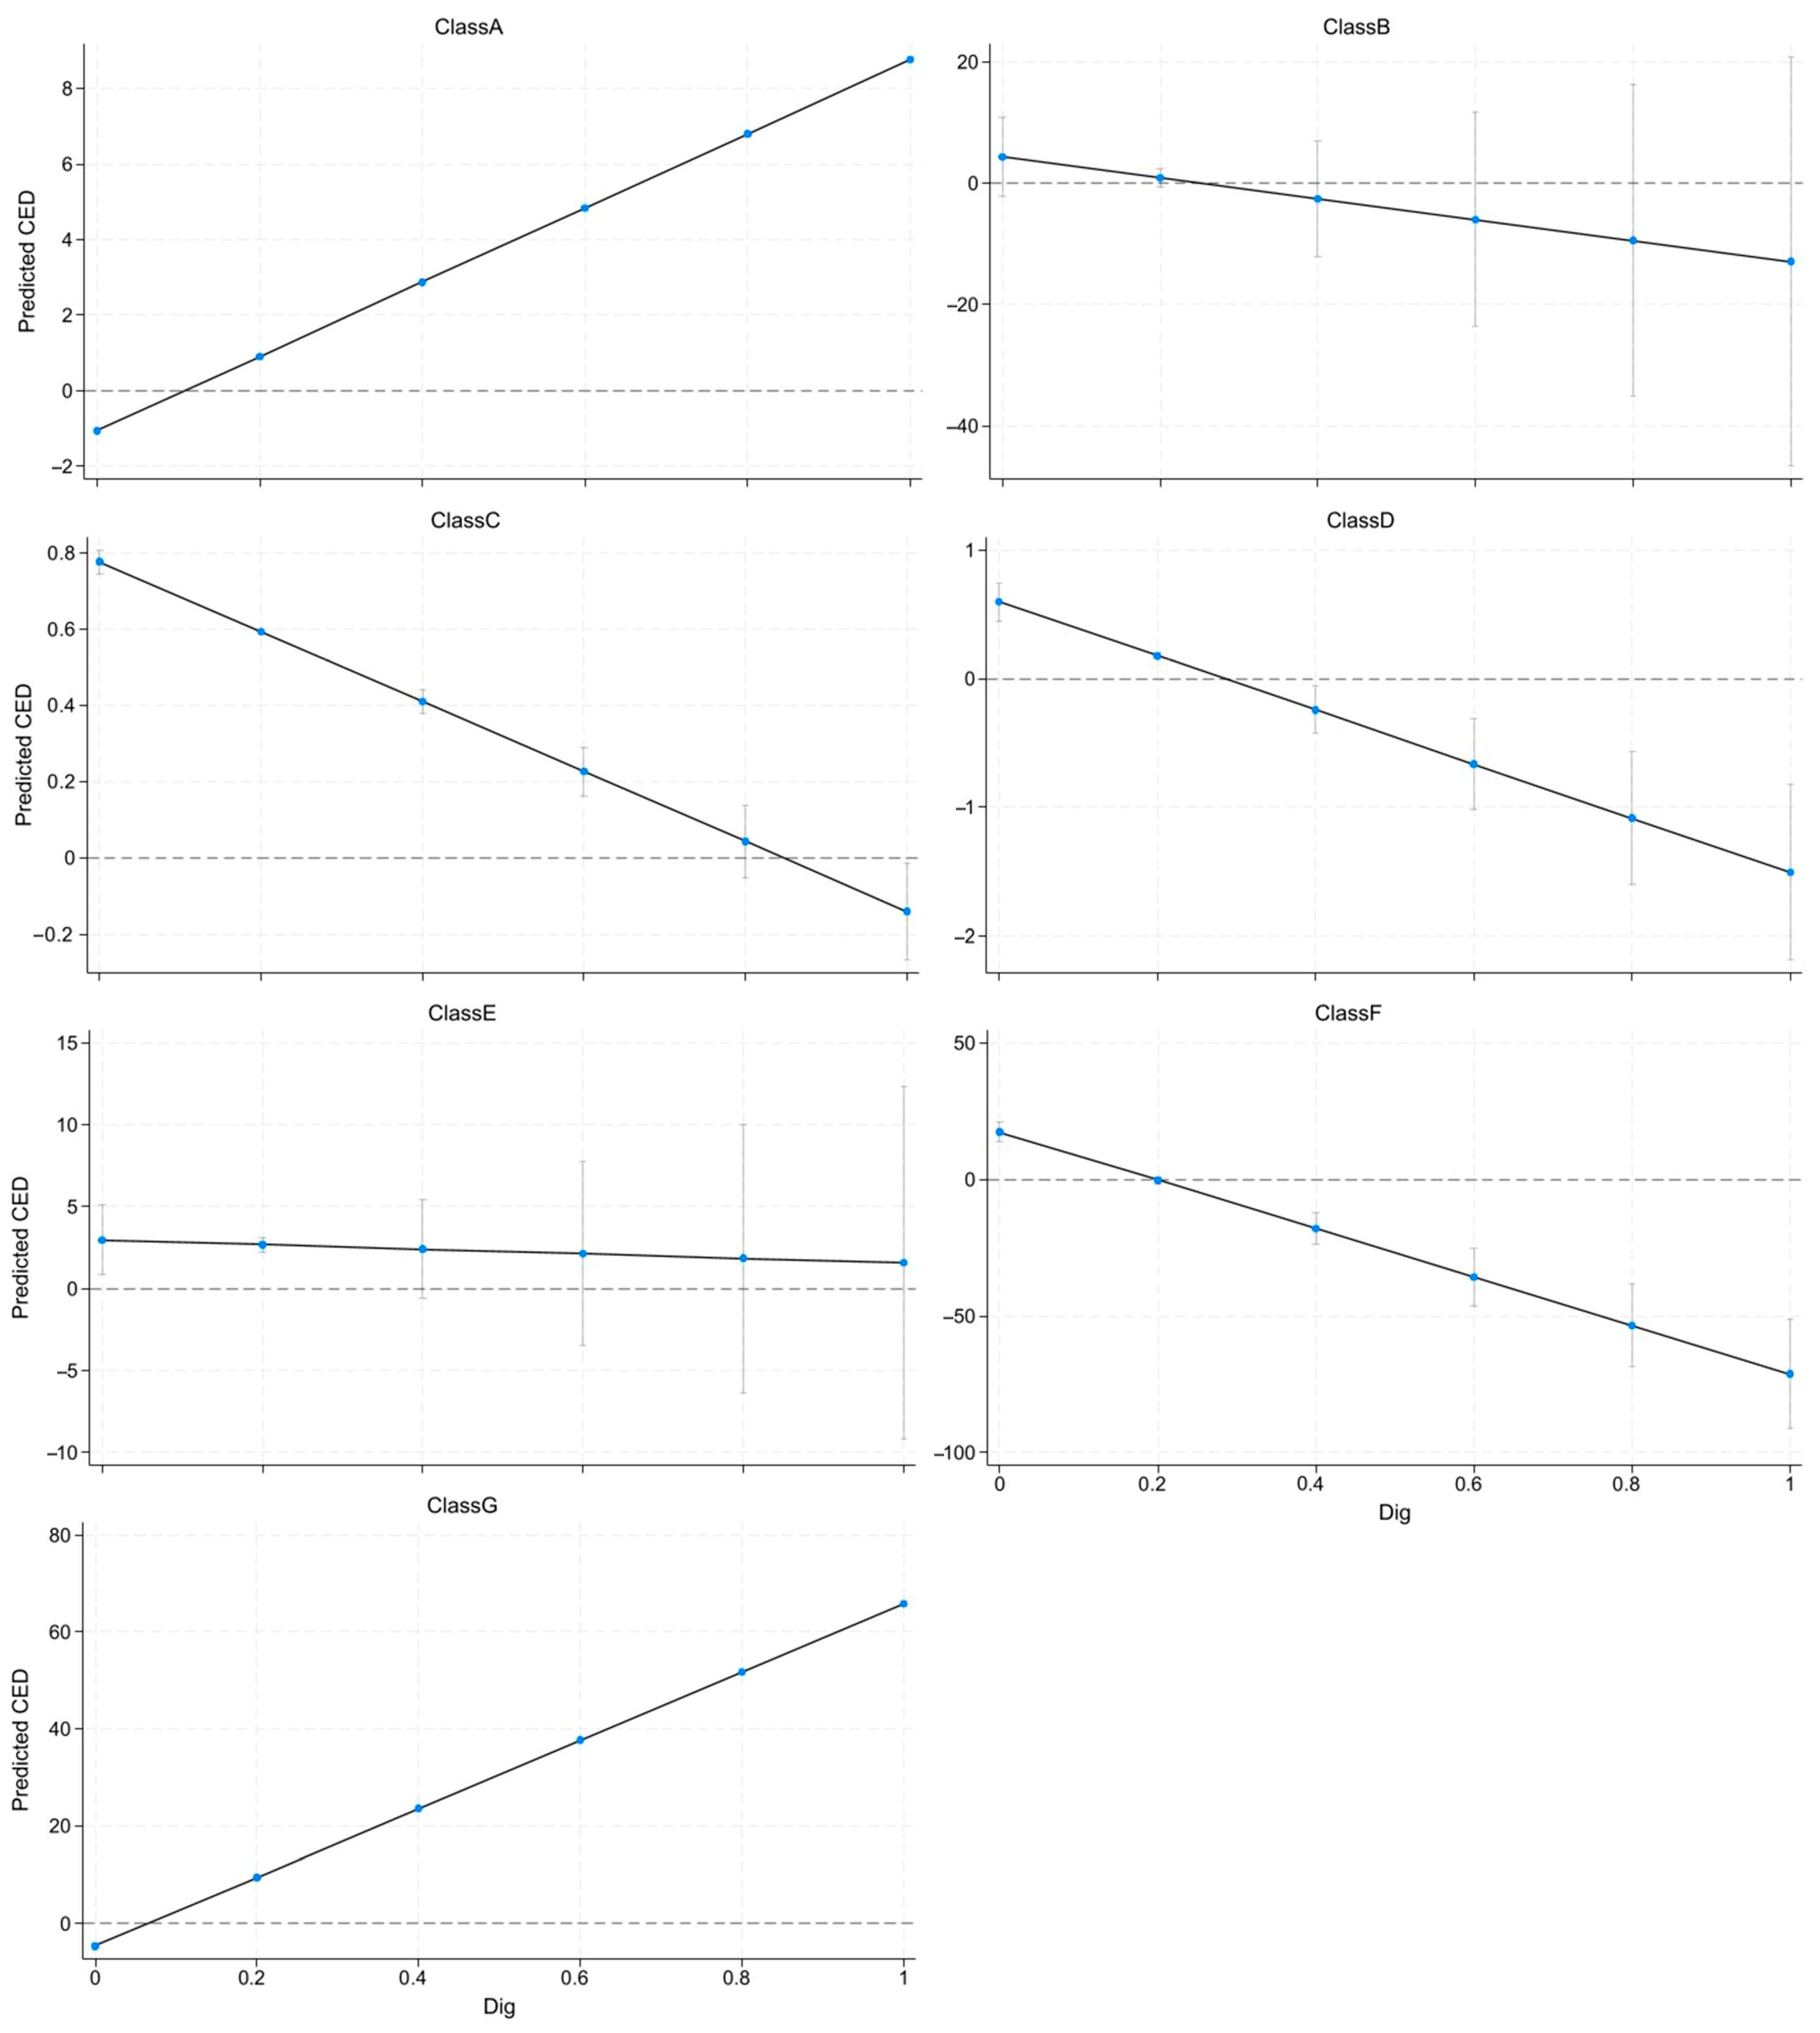
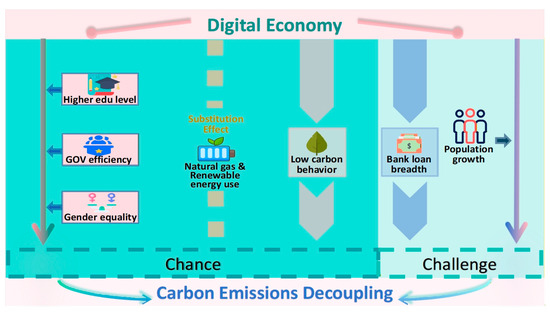
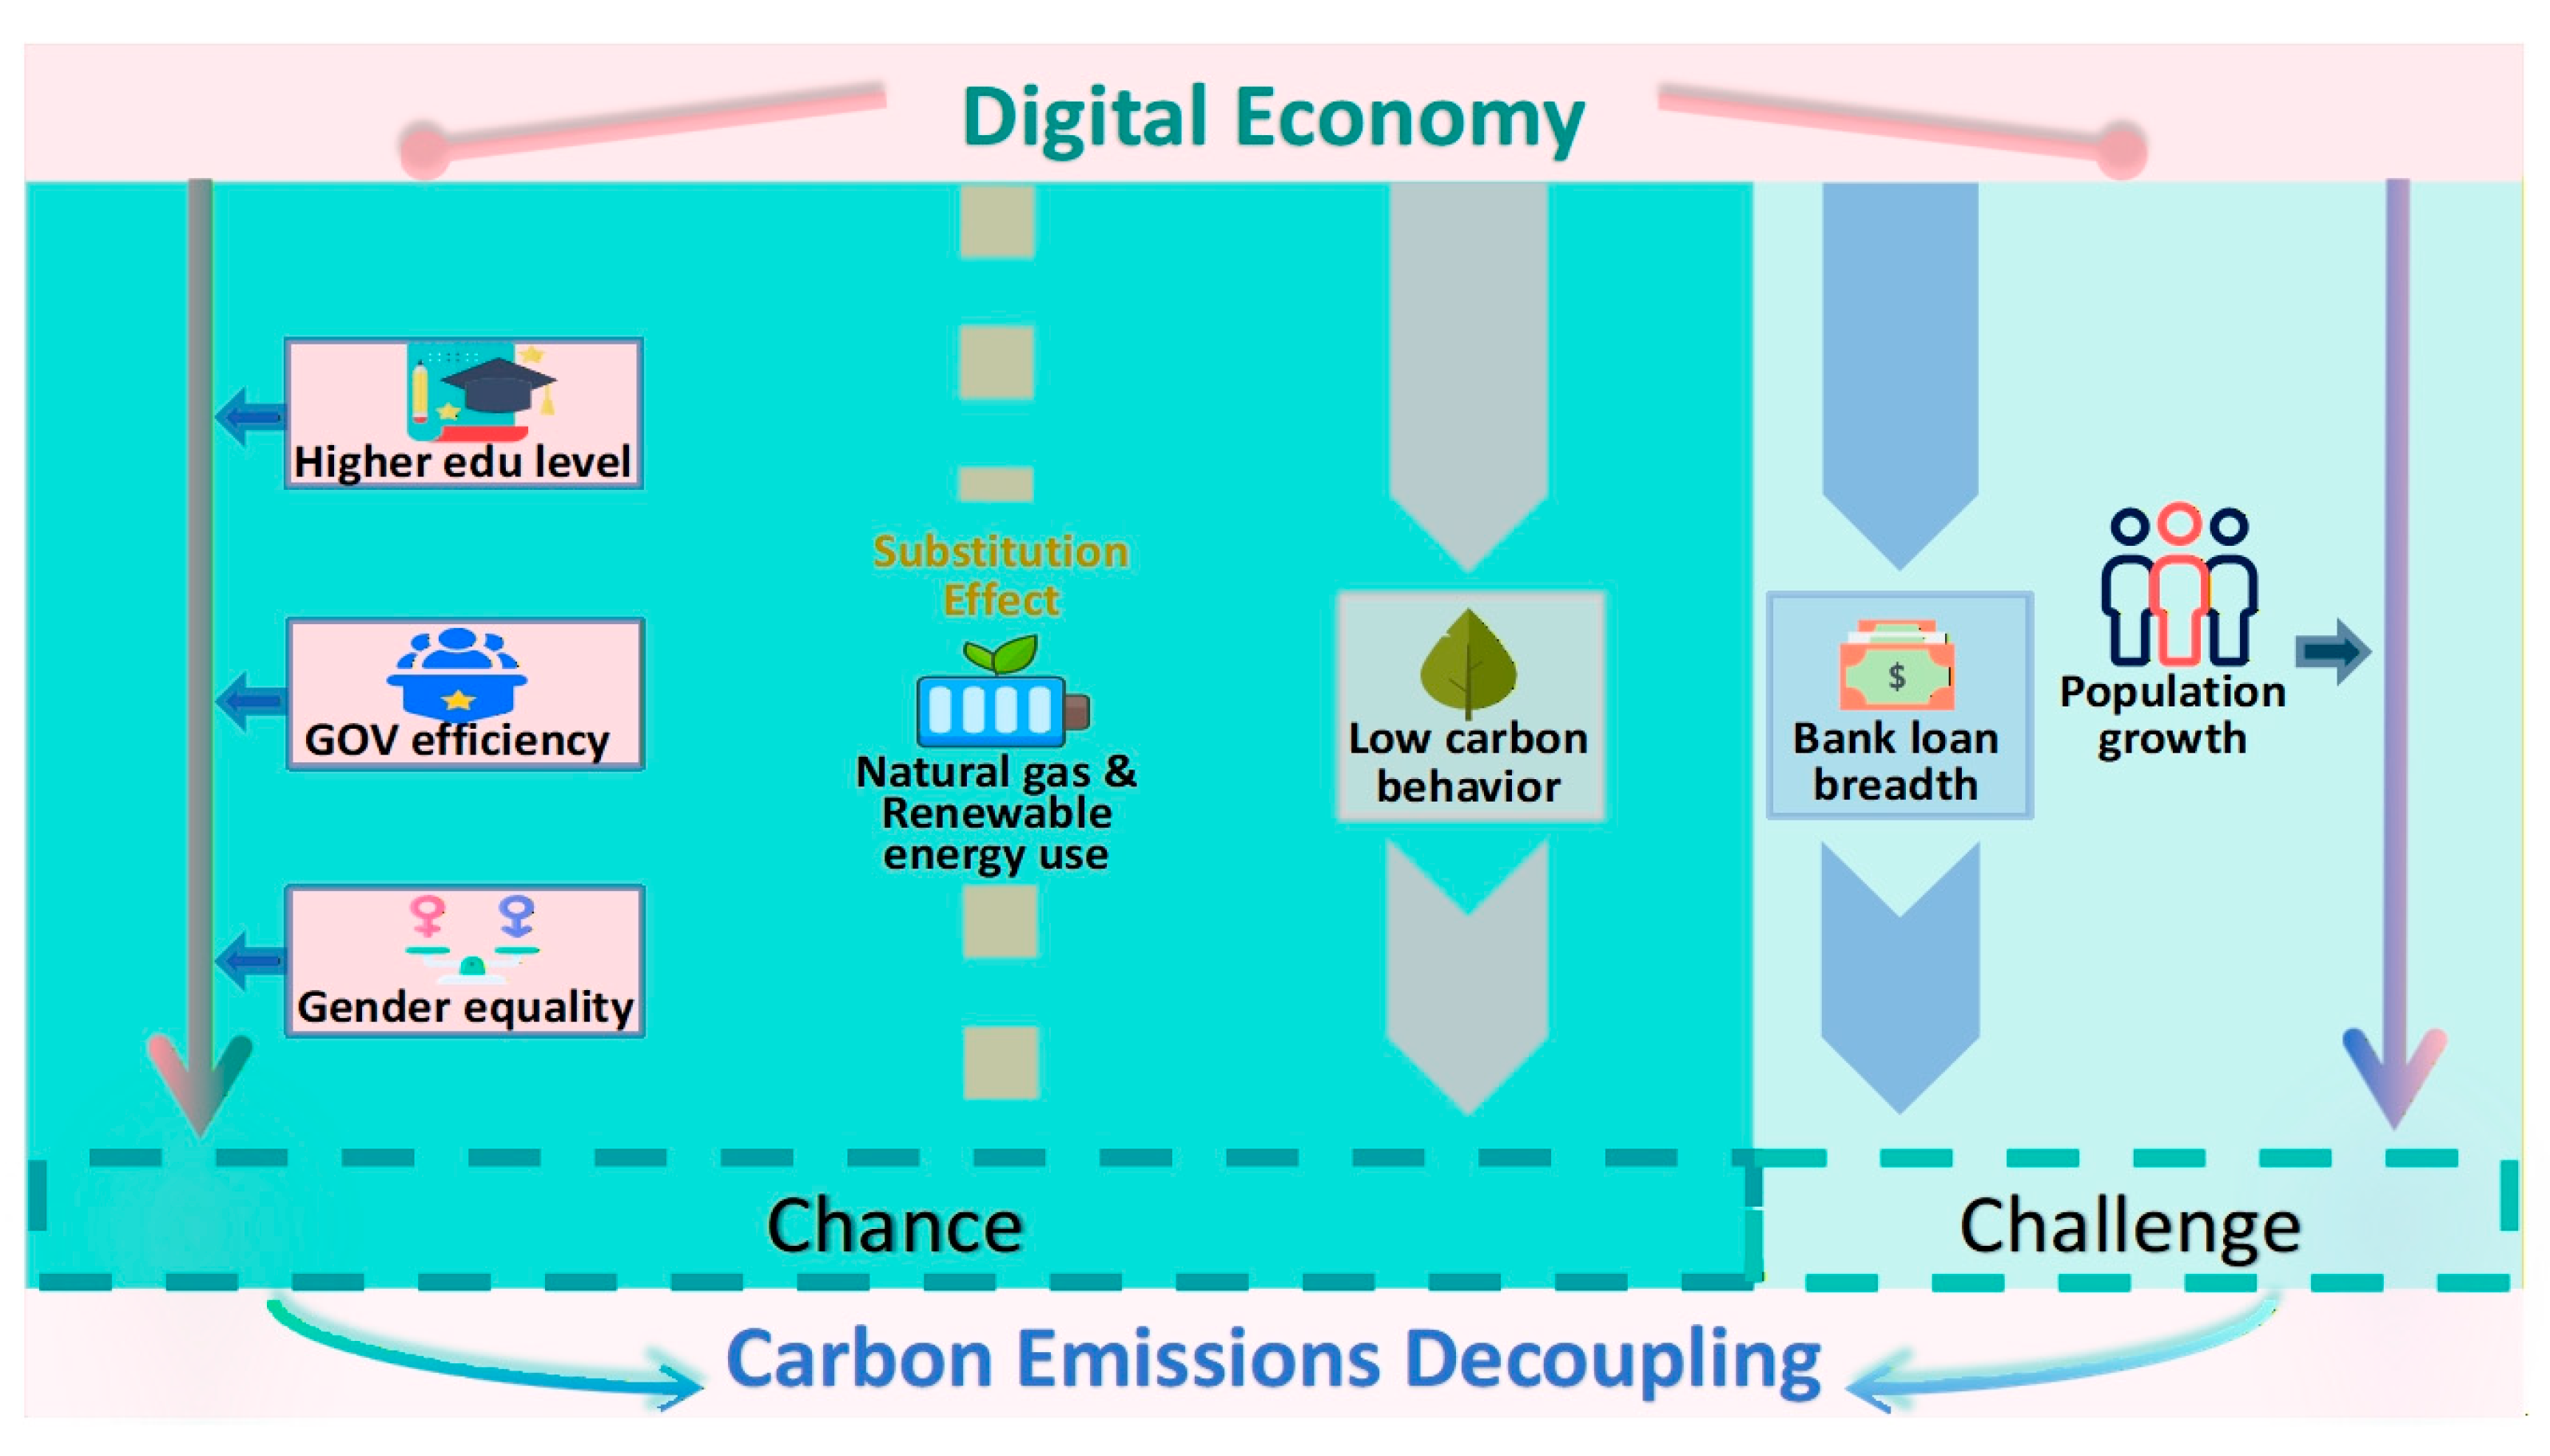

Disclaimer/Publisher’s Note: The statements, opinions and data contained in all publications are solely those of the individual author(s) and contributor(s) and not of MDPI and/or the editor(s). MDPI and/or the editor(s) disclaim responsibility for any injury to people or property resulting from any ideas, methods, instructions or products referred to in the content. |
© 2026 by the authors. Licensee MDPI, Basel, Switzerland. This article is an open access article distributed under the terms and conditions of the Creative Commons Attribution (CC BY) license.