


Abstract
Manufacturing SMEs in Ecuador operate under macroeconomic volatility and limited financing; improvements in processes and management are key mechanisms for sustaining productivity and competitiveness. In contexts where conventional innovation indicators are unavailable, financial ratios constitute replicable signals that close a measurement gap in emerging economies. This study constructs the Structure-Based Innovation Index (SBII) as the mean of within-sample percentile ranks of capital efficiency (EBIT/Assets) and sales per employee, using financial statements from the SCVS, sectoral indicators from ENESEM, and size classification from REEM. The sample includes 58 formal manufacturing SMEs in Ecuador in 2023, stratified by province and size. Performance is measured through labor productivity and operating profitability (EBIT/Sales). Tercile comparisons reveal clear performance differentiation: the high-SBII group exhibits substantially higher median sales per employee (USD 129,552 vs. USD 40,176 in the low group) and higher operating profitability. Signals are more strongly reflected in productivity than in margins, indicating that operational gains materialize earlier. A robustness check using SBIIalt confirms that gradients are not index artifacts. High-performing SMEs are distinguished by institutionalized operational discipline: asset utilization, throughput stability, and cost control. The SBII is a replicable proxy for structure-based innovation in data-constrained environments. The findings align with SDGs 8, 9, and 12.
1. Introduction
The recent dynamics of Ecuador’s productive structure have placed small and medium-sized manufacturing enterprises (SMEs) at the center of the debate on competitiveness, productivity, and innovation [1,2]. In an environment marked by successive shocks of sanitary, political, financial, and climatic nature [3], these firms face the dual challenge of sustaining employment and income while incorporating technological and organizational capabilities that enable them to compete in increasingly demanding and open markets [4,5]. Manufacturing, although not the largest activity in aggregate terms, concentrates value chains that are intensive in knowledge, talent, and fixed capital; therefore, investment decisions, technology adoption, and quality management decisively shape medium- and long-term growth trajectories [2,6].
In the Ecuadorian case, these trajectories unfold within a business ecosystem dominated by smaller-scale units, with limited margins for research and development (R&D), equipment renewal, and effective articulation with markets, financing, and advanced productive development services [3,4]. According to Ecuador’s Registro Estadístico de Empresas y Establecimientos (REEM; Statistical Register of Enterprises and Establishments), in 2022, the country recorded 1,239,822 firms and 2,816,116 registered jobs, reflecting a post-pandemic rebound that increased the number of productive units relative to 2021 [4]. Most of these firms are concentrated in micro and small segments, defined by combinations of sales and the number of employees affiliated with the social security system [7]. Within this universe, manufacturing constitutes one of the main sectoral blocks: it articulates intermediate input activities, logistics, and distribution, and its productivity exerts a multiplier effect on the rest of the economy [7,8].
At the regional level, the Economic Commission for Latin America and the Caribbean (ECLAC) notes that, after the economic rebound observed in 2021–2022, Latin American economies entered a phase characterized by inflationary pressures, high interest rates, and low potential growth [9]. This macroeconomic combination increased financing costs, heightened uncertainty, and constrained firms’ ability to sustain investment and technological transformation, with particularly adverse effects on smaller units [7,8]. International evidence compiled by the Organisation for Economic Cooperation and Development (OECD) shows that, under prolonged uncertainty, small firms that adopt organizational and technological innovations, even incremental ones, are better able to cushion shocks and resume growth earlier; by contrast, those that postpone critical investment decisions tend to lose market share [5].
This study examines whether structure-based signals of process and management innovation captured through a composite index constructed from observable financial ratios are associated with the performance of Ecuadorian manufacturing SMEs in 2023. The primary research question is: to what extent is the Structure-Based Innovation Index (SBII), constructed from the within-sample percentile ranks of EBIT/Assets (capital efficiency) and Sales/Employee (sales per employee) [10], associated with labor productivity and operating profitability among formal manufacturing SMEs in Ecuador?
The study makes three original contributions to the literature on innovation measurement and SME performance [11,12]. First, it proposes and operationalizes a replicable, percentile-based proxy for process and management innovation that is implementable using administrative data available in most countries, addressing a key measurement gap in emerging economy research [13,14,15]. Second, it provides the first tercile-based benchmarking of structure-based innovation signals and firm performance for Ecuadorian manufacturing SMEs using matched administrative sources [8,16,17]. Third, it clarifies the differential dynamics of the innovation–productivity and innovation–profitability associations in volatile macroeconomic environments [3,9], generating testable propositions for future panel-based causal analysis.
The focus on Ecuadorian manufacturing SMEs is motivated by five intersecting considerations. First, these firms concentrate a significant share of formal employment and value-added production, so any productivity improvement generates distributive and macroeconomic spillovers [7,8]. Second, successive shocks of sanitary, political, financial, and climatic origin have intensified volatility, reinforcing the value of proximity innovations focused on operational excellence [3,9]. Third, Ecuador’s low patent application density and modest R&D intensity [13,15] suggest that feasible innovation for local manufacturing SMEs is primarily incremental: process standardization, waste control, layout redesign, and quality management, rather than novel technological invention [14,18]. Fourth, comparative evidence indicates that SMEs that systematize processes and data are more likely to access demanding markets, creating a virtuous cycle of continuous improvement [5,19]. Fifth, the reconfiguration of regional supply chains and the declining cost of horizontal digital technologies open a window of opportunity for SMEs that design realistic productive transformation plans [4,6].
Methodologically, the study follows a non-experimental, cross-sectional design. Annual financial statements from the Superintendencia de Compañías, Valores y Seguros (SCVS; Superintendency of Companies, Securities, and Insurance) are combined with sectoral benchmarks from the Encuesta Estructural Empresarial (ENESEM; Structural Business Survey) and firm-size classifications from REEM to construct the SBII and firm-level performance indicators for 58 manufacturing SMEs in 2023. The empirical strategy uses descriptive statistics, tercile comparisons, and linear regression with robust standard errors, controlling for firm size and province. Because the design is cross-sectional, all findings are interpreted as contemporaneous associations, rather than causal effects. The remainder of the manuscript is organized as follows. Section 2 presents the theoretical framework and research propositions. Section 3 describes the study design, data sources, variables, and empirical strategy. Section 4 reports descriptive results and tercile contrasts. Section 5 discusses the findings in light of the literature. Section 6 summarizes the main conclusions and policy implications.
2. Theoretical Framework
2.1. Process and Management Innovation in Manufacturing SMEs
Innovation in manufacturing SMEs encompasses a broader range of activities than the patent-centric or R&D-intensive perspectives prevalent in large-firm research [12]. The Oslo Manual framework distinguishes product, process, marketing, and organizational innovation [12]; for smaller firms operating in emerging economies, process and management innovations encompassing workflow improvements, quality management, production scheduling, and organizational routine formalization often represent the most feasible and high-return investment [5,18]. These innovations rarely generate formal intellectual property assets [13,14] but can meaningfully improve capital utilization and labor productivity by reducing waste, stabilizing throughput, and shortening delivery cycles [2,20].
Recent research in developing contexts has shown that SME-level innovation is deeply shaped by institutional environments, access to productive extension services, and the availability of technology suppliers and testing infrastructure [21]. In countries such as Ecuador, where macroeconomic volatility constrains investment horizons [3,9] and formal R&D capacity is limited [15], firms that adopt incremental technological and organizational changes, even without generating original knowledge can sustain competitiveness through improved operational execution [5,11]. This perspective aligns with the concept of technological absorption capacity: the ability to identify, adapt, and implement existing technologies, rather than develop novel ones [11].
In the Ecuadorian context, the Industry 4.0 sustainability outlook emphasizes that digital transformation in manufacturing SMEs must combine technological upgrading with organizational adaptation to generate durable productivity gains [6]. Recent evidence from Ecuadorian SMEs further underscores the importance of digital channel integration and omnichannel strategies as mechanisms to strengthen competitiveness and market positioning at the local level [22].
2.2. Measurement Challenges, Research Gap, and Structural–Financial Proxies
Measuring innovation types in heterogeneous SME populations poses significant methodological challenges [12,23]. Conventional indicators patent counts [13], R&D expenditure ratios [15], innovative product sales, and the number of researchers carry substantial limitations in contexts characterized by low patenting propensity, infrequent surveys, and small management teams lacking the resources to comply with detailed questionnaires [12,14]. As a result, researchers have increasingly explored structural and financial proxies observable in administrative data as alternatives that allow within-sample benchmarking while reducing measurement costs and non-response bias [10,12,23].
The research gap this study addresses is precisely this measurement vacuum: Ecuador exhibits low patent application density [13], no systematic firm-level innovation survey comparable to the OECD Community Innovation Survey [5], and no published panel of innovative product sales for manufacturing SMEs [8,16]. In this setting, administrative financial records from the SCVS [17], combined with REEM employment registers [8] and ENESEM sectoral benchmarks [16], constitute the most reliable and comprehensive source of comparable firm-level data available for systematic benchmarking [12]. Financial structure ratios, such as EBIT-to-assets and sales per employee, reflect the cumulative result of management and operational decisions: a firm with disciplined capital utilization and a high sales per employee ratio has typically implemented routines consistent with process and management innovation, even if those practices are not formally recorded as innovation outputs [10,12].
This structural–financial approach responds to the broader challenge of measuring heterogeneous innovation types in SMEs when patent-based or survey-based indicators are limited or inconsistent [12]. It is consistent with prior research emphasizing valuation-based and ratio-driven methodologies for assessing firm capabilities in emerging market contexts [10,21] and with the growing strand of literature using operational performance signals as proxies for managerial and process capabilities when direct measures are unavailable [11,12].
2.3. Innovation, Sustainability, and SME Performance: Research Propositions
The relationship between innovation and sustainability in SME contexts has received growing attention. Recent evidence suggests that sustainability-oriented innovation capabilities integrating environmental and social considerations into product and process decisions are associated with improved long-run performance and resilience [24], particularly when firms align innovation efforts with stakeholder expectations and regulatory frameworks. For manufacturing SMEs in Ecuador, this sustainability dimension is most directly expressed through efficiency improvements that reduce resource waste (Sustainable Development Goal 12, SDG 12) and through the productivity and employment resilience gains that contribute to SDG 8 (Decent Work and Economic Growth) and SDG 9 (Industry, Innovation and Infrastructure) [5,6].
Empirical evidence indicates that innovation capability enhances SME performance through the mediating role of technology adoption [25], reinforcing the argument that operational improvements materialize when firms effectively translate innovation potential into concrete technological and managerial practices [19,20]. The relationship between profitability, competitiveness, and broader economic growth have also been documented in the Ecuadorian context [26], reinforcing the importance of structural efficiency improvements for sustained performance.
Taken together, the theoretical framework supports two research propositions:
- P1:
- Firms exhibiting higher structure-based innovation signals (higher SBII) will show higher labor productivity (sales per employee) than firms with lower SBII values [2,25].
- P2:
- Firms exhibiting higher structure-based innovation signals will show higher operating profitability (EBIT/Sales), though the gradient will be weaker than for productivity, given that margins are simultaneously shaped by external factors, including input-price volatility, bargaining power, and demand conditions [3,5,9].
These propositions are consistent with the index logic and with the theoretical mechanisms described above. Given the cross-sectional, non-experimental design, they are stated as directional propositions, rather than causal hypotheses [12], and the evidence is interpreted as a contemporaneous association.
3. Materials and Methods
3.1. Study Design
This study follows a non-experimental, cross-sectional design [12], as all variables correspond to a single period (2023) and are observed without manipulation. Data organization and preliminary processing were conducted in Microsoft Excel for Mac, Version 16.107.4 (Microsoft Corporation, Redmond, WA, USA). Subsequent scripting, data processing, and analysis were performed in Visual Studio Code, Version 1.115 (Microsoft Corporation, Redmond, WA, USA), and Python, Version 3.14.4 (Python Software Foundation, Wilmington, DE, USA). The empirical strategy is correlational and examines the association between firm performance and a proxy of structure-based innovation while controlling for firm size and territorial location [10]. Because the design is cross-sectional, estimates are interpreted as contemporaneous associations, rather than causal effects.
3.2. Data Sources
The analysis combines administrative records and official statistics for 2023 from three main sources: (i) the National Survey of Business Structure (ENESEM) [16]; (ii) the Business and Establishments Statistical Register (REEM) produced by the National Institute of Statistics and Censuses (INEC) [8]; and (iii) annual financial statements reported to the Superintendence of Companies, Securities and Insurance (SCVS) [17]. These sources allow the construction of comparable firm-level indicators of productivity and capital structure and support contextual benchmarking with sector-level references for Manufacturing (Section C of the CIIU classification system).
3.3. Population and Sample
The study population is defined as formal manufacturing SMEs classified under Section C of the Clasificación Industrial Internacional Uniforme (CIIU; International Standard Industrial Classification), registered in the SCVS, with complete 2023 financial statements and REEM employment classification records [8,17]. The final analytical sample includes 58 firms. Table 1 reports the distribution by province and official REEM size category.
Table 1.
Sample design summarized by province and firm size.
Provincial stratification was applied for three reasons. First, manufacturing activity in Ecuador is geographically concentrated [7,8], and a non-stratified draw from the SCVS database would over-represent Pichincha and Guayas while underrepresenting mid-tier manufacturing provinces. Second, the provincial variable serves as a key control in the regression (province fixed effects) and in the territorial analysis, so geographic diversity in the sample is necessary to ensure the analytical validity of those components [4]. Third, REEM-based classification data is organized by province [8], making provincial stratification the natural alignment with official size classification records.
The sample covers the five provinces with the highest concentration of manufacturing SMEs in Ecuador (Pichincha, Guayas, Azuay, Tungurahua, and Manabí), which together account for the majority of formal manufacturing activity according to REEM 2022 [8]. In the same year, Ecuador recorded approximately 2800 formal manufacturing SMEs in CIIU Section C with complete employment records [8]. The analytical sample of 58 firms represents approximately 2.1% of this reference population. While this coverage rate is modest, it is typical for administrative-data-based studies that require complete multisource records [10,12]. Firms with incomplete financial records, typically the most informal or micro-scale units, are not represented, a common constraint of administrative-data-based approaches [11,21]; generalization beyond the observed population should therefore be made cautiously.
3.4. Variables and Operational Definitions
Firm performance in 2023 is operationalized through two observable dimensions: labor productivity and operating profitability [2,25]. Labor productivity is measured as sales per employee [11,16]. Operating profitability is measured as EBIT to sales (equivalent to UAII/Ventas Utilidad Antes de Intereses e Impuestos in the Ecuadorian accounting context) [17]. The independent construct represents process and management innovation, proxied through structural signals observable in financial and operational ratios, rather than self-reported innovation measures [10,12].
Table 2 summarizes the definition, construction, and data sources of the dependent variables, the SBII proxy, sectoral benchmarks, and controls.
Table 2.
Operationalization of variables.
3.5. Construction of the Structure-Based Innovation Index (SBII)
The SBII is designed to capture structure-based innovation through two observable dimensions: capital efficiency and sales per employee [10,12]. Each component is transformed into an internal percentile rank within the manufacturing SME sample. The index is formalized in Equation (1):
where denotes the internal percentile-rank transformation computed over the 2023 manufacturing SME sample.
The coefficient reflects equal weighting of the two components. This choice is grounded in three considerations: (a) parsimony, no prior theoretical basis favors capital efficiency over sales per employee; (b) symmetry, both components represent empirically distinct dimensions and should, therefore, contribute equally to the composite signal; and (c) consistency with the composite indicator literature, for which an equal weighting is the standard default when component importance is undetermined. We acknowledge that alternative weighting schemes could be explored in future research to test the sensitivity of results to this assumption (see Section 5.6).
It is important to note that the SBII is not a measure of R&D investment [15], patent output [13], innovative product sales, or the number of researchers the conventional innovation indicators used in OECD-aligned frameworks [5,12]. Rather, it is a structural–financial proxy for structure-based innovation. It may reflect the cumulative result of process and management improvements, but it should not be interpreted as a direct measure of R&D, patents, or innovation outputs [10]. This distinction is fundamental to the interpretation of the index and to the scope of the study’s conclusions, which refer to structure-based innovation capabilities and not to technological innovation outputs [12].
Robustness: Alternative Index (SBIIalt)
Because Sales/Employee is included in the baseline SBII (Equation (1)) and is also used as the dependent variable for labor productivity [11], a naïve regression of Sales/Employee on SBII would create an arithmetic overlap that inflates the apparent association, a form of tautological construction that undermines the credibility of the coefficient [12]. To address this concern, we constructed SBIIalt using only the within-sample percentile rank of EBIT/Assets:
This formulation preserves the capital-efficiency dimension [10] while eliminating the direct reuse of Sales/Employee within the index when that ratio is analyzed as an outcome. In the regression analysis (Section 3.6), SBIIalt replaces SBII as the independent variable whenever Sales/Employee is the dependent variable [12].
This robustness strategy constructs an alternative version of the index by excluding the component that mechanically overlaps with the dependent variable. Such reduced-form specifications are consistent with established practices in the composite indicator literature. The OECD–JRC Handbook on Constructing Composite Indicators [27] recommends assessing robustness by varying the composition of the index and examining whether the resulting rankings remain stable. Similarly, Saisana et al. [28] showed, through an uncertainty and sensitivity analysis applied to the UNDP Human Development Index, that the selective inclusion or exclusion of components is a rigorous tool for evaluating composite-indicator quality. From an econometric perspective, Lu and White [29] provide a general framework for robustness checks based on alternative specifications, in which variables are added or removed to verify whether the main empirical results remain substantively unchanged. In the same vein, Greco et al. [30] review how weighting, aggregation, and component selection affect composite-index outcomes, emphasizing that alternative specifications are a standard step in validating multidimensional measures. Following this logic, SBIIalt retains only the EBIT/Assets component, thereby removing the arithmetic dependency between the independent variable and the labor-productivity outcome while preserving the capital-efficiency dimension that is theoretically distinct from the dependent variable [10,12].
3.6. Empirical Strategy
The empirical analysis proceeds in two complementary steps [12]. First, descriptive statistics characterize the sample and compare central tendencies (medians) across SBII terciles for labor productivity and operating profitability. Second, the association between structure-based innovation and firm performance is estimated using linear regression with robust standard errors [10], controlling for firm size and province to absorb systematic heterogeneity in productive structure and territorial context [4]. The baseline specification is:
where denotes each performance outcome (sales per employee; operating profitability), and includes firm size indicators and province fixed effects. When Sales/Employee, the independent variable is assigned to SBIIalt (Equation (2)), rather than to the baseline SBII (Equation (1)), to eliminate the mechanical arithmetic overlap [12]. When Operating Profitability, the baseline SBII is used. All estimates are interpreted as contemporaneous associations, given the cross-sectional design.
3.7. Ethics and Limitations
The study uses administrative firm records and official tabulations [8,16,17] and does not process sensitive personal data. Because the design is cross-sectional (2023) [12], the findings are interpreted as contemporaneous associations, rather than causal effects; the discussion, therefore, emphasizes empirical relationships and plausible mechanisms consistent with the literature.
4. Results
This section reports results for the 58 manufacturing SMEs observed in 2023. The aim is to assess whether structure-based innovation, as proxied by the SBII [10], is associated with firm performance measured through labor productivity and operating profitability [2,25].
4.1. Performance Gradients by SBII Terciles
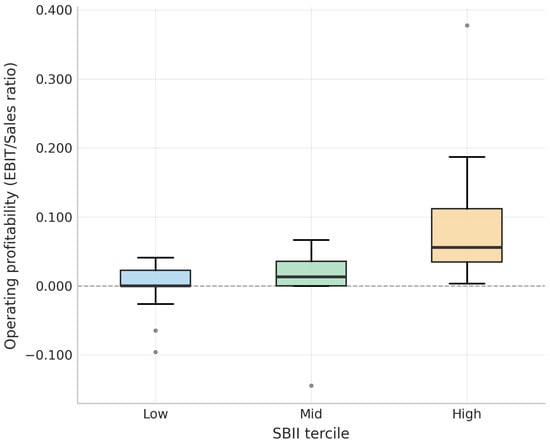
Firms were grouped into terciles of the SBII (low, mid, high), and Table 3 reports the corresponding median values. The results indicate strong performance differentiation across terciles, consistent with Propositions P1 and P2 [2,25]. Median differences are larger for labor productivity than for operating profitability [1,5], suggesting that structure-based improvements in capital efficiency and sales per employee are reflected more strongly in operational efficiency than in margins, which tend to be more sensitive to market and pricing conditions [3,9].
Table 3.
Firm performance by SBII terciles (medians, 2023).
As an additional robustness assessment, the tercile-based comparisons were replicated using SBIIalt, which excludes Sales/Employee from the index construction [12], thereby eliminating the risk of tautological associations with labor productivity. The persistence of profitability and relative-performance gradients under SBIIalt confirms that the observed associations reflect genuine structural efficiency mechanisms [10], rather than artifacts of index construction.
4.2. Bivariate Association Between SBII and Relative Performance
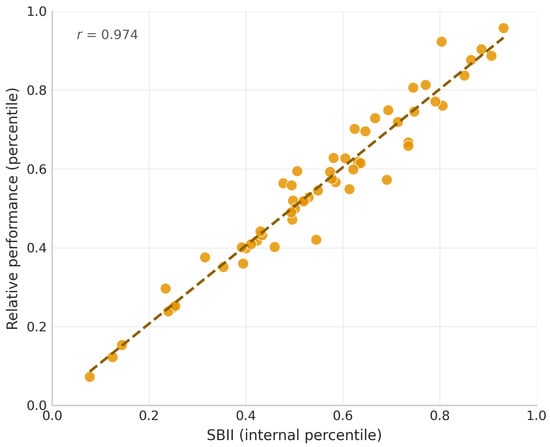
Figure 1 plots SBII against relative performance with a linear trend line. The point cloud shows a positive slope, consistent with the index logic: firms combining higher capital efficiency and higher sales per employee tend to occupy higher positions in the relative performance distribution.
Figure 1.
Association between SBII and relative performance (percentile-based).
4.3. Distributional Contrasts by Tercile
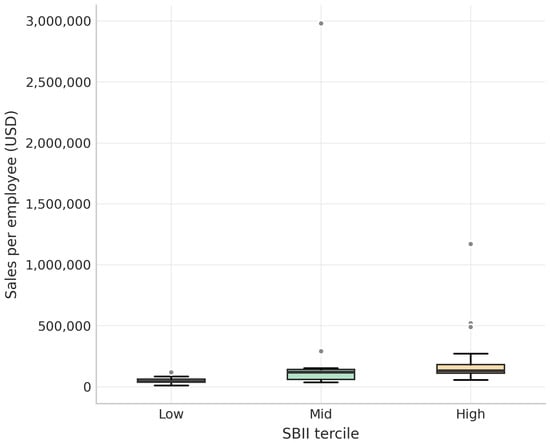
Figure 2 and Figure 3 show boxplots by SBII terciles. The distribution of sales per employee shifts upward as the tercile increases, consistent with P1. A similar pattern is observed for operating profitability, although with greater overlap across terciles, consistent with P2.
Figure 2.
Distribution of sales per employee (USD) by SBII tercile.
Figure 3.
Distribution of operating profitability (EBIT/Sales ratio) by SBII tercile.
4.4. Differences by Firm Size
Table 4 compares small and medium firms (REEM classification [8]) in terms of median performance metrics. The descriptive evidence shows higher median sales per employee among small firms than among medium firms, indicating that labor productivity in the sample does not increase monotonically with firm size. These results suggest that performance heterogeneity is not solely explained by scale and may reflect differences in operational practices and managerial efficiency.
Table 4.
Comparison by firm size (medians, 2023).
4.5. Territorial Variation
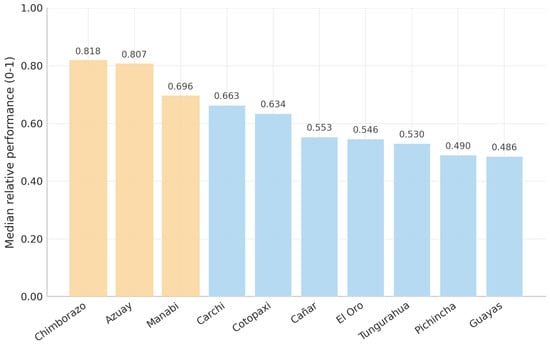
Table 5 summarizes provincial medians. The results show meaningful territorial differences, suggesting heterogeneous local environments in terms of market access, input availability, and management capabilities. Provinces with higher manufacturing density tend to display competitive productivity medians; however, there is no one-to-one correspondence between concentration and outcomes, consistent with intra- and inter-provincial heterogeneity in process-innovation trajectories (Figure 4).
Table 5.
Provincial summary (top 10 by sample size; medians, 2023).
Figure 4.
Median relative performance by province (Top provinces by sample size).
4.6. Correlation Structure
Table 6 presents the correlation matrix. SBII is strongly correlated with relative performance (0.974), reflecting the percentile-based construction of both indicators. The association between SBII and operating profitability is strong (0.610), indicating that capital efficiency and operating margins move together across the sample; this does not contradict Proposition P2, which anticipated a weaker tercile gradient for profitability than for productivity, a pattern confirmed in Table 3. The strong correlation between operating profitability and EBIT/Assets (0.808) underscores that capital efficiency is the primary driver of profitability variation in the sample. The EBIT/Assets component shows a strong correlation with SBII (0.645), underscoring the relevance of capital efficiency within the index.
Table 6.
Correlation matrix.
5. Discussion
5.1. Summary of Main Findings
Before presenting the substantive discussion, it is important to reiterate the role of the SBIIalt robustness exercise [12]. Because the baseline SBII includes Sales/Employee as one of its two components, using SBII as the independent variable in a regression where Sales/Employee is the dependent variable would create an arithmetic overlap that could inflate the coefficient—mechanically, a form of tautological construction [12]. By retaining only EBIT/Assets as the index component, SBIIalt eliminates this overlap entirely [10]. The persistence of profitability and relative-performance gradients under SBIIalt, supports the interpretation that the observed associations reflect structural efficiency mechanisms, rather than mere artifacts of index construction [10,12]. This interpretation is consistent with the composite indicator quality framework, which recommends robustness checks based on alternative component specifications and sensitivity analysis [27,28]. It is also aligned with the econometric robustness literature, in which alternative specifications obtained by removing potentially overlapping variables are regarded as a valid diagnostic strategy when theoretically justified [29].
The results reveal a clear performance differentiation across SBII terciles [10], consistent with Propositions P1 and P2. The high-SBII group exhibits higher median sales per employee (USD 129,552 vs. USD 40,176 in the low group [16]), higher operating profitability (EBIT/Sales [17]), and higher relative performance than firms in the middle and low terciles (Table 3).
5.2. Interpretation: Why the Gradient Is Stronger for Productivity than Profitability
At the organizational level, this asymmetry is plausible and informative [1,2]. High-SBII firms are likely firms that have institutionalized basic operational routines: stable production scheduling that minimizes idle time [31], regular preventive maintenance that reduces equipment failures [20], systematic quality checks that prevent batch variability [18], and disciplined cost-tracking routines that identify waste early [5]. These routines generate consistent throughput improvements visible in Sales/Employee and disciplined capital deployment visible in EBIT/Assets [10]. They represent the kind of operational discipline that is manageable without large capital outlays [5,19] and that differentiates firms that have systematized their operations from those that react ad hoc [25].
By contrast, operating profitability (EBIT/Sales) is simultaneously shaped by internal efficiency and by external constraints: input-price volatility [3], customer bargaining power, competitive pricing in product markets, and demand fluctuations [9]. Even when firms improve operational execution, profitability may exhibit higher overlap across groups because external shocks compress margins across the board [3,9], particularly in environments characterized by macroeconomic and financial volatility [5,9]. This is consistent with Proposition P2.
These findings are broadly consistent with prior evidence from comparable contexts. Hwang and Kim [1] found that technology adoption in Korean manufacturing SMEs improved technical efficiency, but the profitability effects were contingent on market and competitive conditions. Surya et al. [2] similarly documented that productivity gains from open innovation were more robust and faster to materialize than margin improvements. Reference [25] specifically modeled the mediating role of technology adoption between innovation capability and SME performance, finding that the productivity channel was consistently stronger than the profitability channel, directly supporting the asymmetry documented here. In the Ecuadorian context, Salazar-Mera et al. [26] showed that profitability improvements in Ecuadorian companies translate into GDP growth, suggesting that even the modest profitability gradients observed here carry macroeconomic relevance. OECD [5] evidence on SMEs under macroeconomic uncertainty corroborates our finding that process and management improvements yield more immediate productivity returns than profitability gains.
5.3. Implications of the Index Construction
The SBII is constructed from two structural ratios transformed into internal percentile ranks [10]. Percentile transformation reduces the influence of scale and extreme values and facilitates within-sample comparability across heterogeneous firms. Combining capital efficiency with sales per employee yields an index aligned with operational improvement dynamics since disciplined asset utilization and labor productivity are common pathways through which process and management innovations manifest in administrative data [10,12,24].
5.4. Heterogeneity by Firm Size and Territorial Context
Reference [4] documented substantial regional heterogeneity in the adoption of Industry 4.0 technologies among Latin American manufacturing SMEs, finding that local ecosystems supplier density, logistics infrastructure, the availability of technical assistance modulate the returns to firm-level innovation efforts. Our provincial results are consistent with this finding [4]: Azuay and Chimborazo show higher median SBII and relative performance than Pichincha and Guayas, suggesting that the quality of local productive ecosystems may matter as much as concentration per se [6,22].
5.5. Managerial and Policy Implications
From a managerial perspective, the clear performance differentiation across SBII terciles has a direct organizational message: high-performing manufacturing SMEs in Ecuador are distinguished not primarily by their access to advanced technology [6,19] but by the degree to which they have institutionalized operational discipline [5,18]. The implication for SME managers is that significant productivity gains are accessible through systematic process improvement before any major capital investment in automation or digital transformation [5,31].
From a policy perspective [5], the results motivate support schemes that (i) facilitate access to technical assistance and operational diagnostics [11,18]; (ii) promote feasible upgrading pathways with measurable metrics [19,25]; and (iii) align financing instruments with staged implementation and deferred returns [3,9]. In settings where formal R&D intensity and patenting are structurally limited [13,15], these targeted levers can be particularly relevant for productivity-oriented transformation [5,21,24,26].
5.6. Limitations
Several limitations should be acknowledged. First, the analysis is cross-sectional (2023) [12], so results should be interpreted as contemporaneous associations, rather than causal effects [10]. Second, the SBII is a proxy constructed from administrative ratios [10,12]; it does not identify the specific managerial practices or technologies adopted by each firm [25,31]. Third, profitability measures may be affected by accounting heterogeneity [17] and short-run shocks [3,9], which can attenuate the relationship with innovation signals. Fourth, the sample size (58 firms, ≈2.1% of the formal manufacturing SME population [8]) constrains external validity [11]. Fifth, the equal-weighting assumption of the SBII is a simplifying design choice; future research could test alternative weighting schemes to assess the sensitivity of the gradients to this assumption.
5.7. Future Research
Future work can strengthen inference and expand the scope in at least three directions [12]. First, panel data across multiple years would enable dynamic analyses and support stronger causal designs [25,26]. Second, integrating survey-based measures or qualitative evidence [18,23,31] could validate which specific practices underpin high SBII signals. Third, extending benchmarking to finer industry segments [11,16] and incorporating additional controls (export status, supply-chain integration) would refine the interpretation of profitability and productivity differentials [4,22].
6. Conclusions
This study makes three contributions to the literature on innovation measurement and SME performance [11,12]. First, it proposes and validates a replicable, percentile-based proxy for process and management innovation, the SBII [10], which is implementable using administrative financial data available in most countries, addressing a key measurement gap in emerging economy research [13,14,15]. Second, it has provided the first tercile-based benchmarking of structure-based innovation signals and firm performance for Ecuadorian manufacturing SMEs using matched administrative sources [8,16,17], documenting performance gradients that are consistent and economically meaningful. Third, it clarifies the differential dynamics of the innovation-productivity [2,25] and innovation-profitability associations in volatile macroeconomic environments [3,9], showing that operational efficiency gains materialize more robustly and earlier than margin improvements, a finding with testable implications for future panel-based causal analysis [26].
The evidence supports a clear performance differentiation across SBII terciles: firms in the high-SBII group exhibit higher median sales per employee (USD 129,552 vs. USD 40,176 in the low group [16]), higher operating profitability (EBIT/Sales [17]), and higher relative performance. The robustness check using SBIIalt [12] confirms that these gradients are not driven by the mechanical construction of the index.
At the organizational level, high-performing manufacturing SMEs in Ecuador are distinguished not by their access to advanced technology [6,19] but by the degree to which they have institutionalized operational discipline: regular preventive maintenance [20], waste reduction [18], throughput monitoring, production scheduling, and cost control routines [5,31]. These practices are measurable, manageable, and improvable without large capital outlays [5,19], and they are associated with structurally superior performance outcomes [2,25]. For SME managers, a significant productivity improvement pathway exists through systematic process and management innovation prior to any major capital investment [5,18].
From a sustainability perspective, this productivity-oriented upgrading pattern supports the resilience of manufacturing SMEs under volatility [3,9,24], contributing to the continuity of formal employment (SDG 8 [7,8]) and innovation-related capability building in manufacturing (SDG 9 [6]). Efficiency gains implied by stronger capital utilization and operational discipline are directionally aligned with SDG 12 [6], insofar as they can reduce waste and improve resource use in production processes.
For policy design [5], the results motivate support instruments that emphasize feasible, staged upgrading pathways [18,19] with measurable metrics, complemented by technical assistance [11] and financing aligned with deferred innovation returns [3,9]. The study involved limitations: the cross-sectional design restricts inference to contemporaneous associations [12]; the SBII is a proxy that cannot identify specific practices [10,12]; and the sample size constrains external validity [11]. Future research should expand the analysis using multi-year panel data [25,26], incorporate survey or qualitative validation of underlying practices [18,31], and refine benchmarking by industry segment and market positioning [4,22].
Author Contributions
Conceptualization, E.P.G.H. and G.V.-O.; methodology, E.P.G.H. and G.V.-O.; software, E.P.G.H. and G.V.-O.; validation, E.P.G.H., G.V.-O. and J.C.S.-P.; formal analysis, E.P.G.H. and G.V.-O.; investigation, E.P.G.H.; resources, G.V.-O.; data curation, E.P.G.H.; writing original draft preparation, E.P.G.H.; writing review and editing, G.V.-O. and J.C.S.-P.; visualization, E.P.G.H. and G.V.-O.; supervision, G.V.-O.; project administration, G.V.-O.; funding acquisition, G.V.-O. All authors have read and agreed to the published version of the manuscript.
Funding
This research was funded by Universidad Tecnológica Indoamérica, Centro de Investigación Empresa, Sociedad y Tecnología (ESTEC), under project IIDI-043-25, “La Transformación Digital en la Industria Ecuatoriana: Estrategias de Gestión y Viabilidad Financiera”. The APC was also funded by Universidad Tecnológica Indoamérica.
Institutional Review Board Statement
Not applicable.
Informed Consent Statement
Not applicable.
Data Availability Statement
The data used in this study were obtained from official Ecuadorian sources, including REEM and ENESEM (INEC), and annual financial statements reported to the Superintendencia de Compañías, Valores y Seguros (SCVS). The analysis focused on manufacturing SMEs classified under Section C of the CIIU. The dataset analyzed in this work was compiled and curated by the authors from these sources. Aggregated results and derived indicators supporting the findings are included within the article. Where permitted by the data providers’ terms of use, the curated dataset is available from the corresponding author upon reasonable request.
Acknowledgments
The authors thank the reviewers and the editorial team for their valuable comments and suggestions, which helped improve the manuscript.
Conflicts of Interest
The authors declare no conflicts of interest. The funders played no role in the design of the study, in the collection, analyses, or interpretation of data, in the writing of the manuscript, or in the decision to publish the results.
References
- Hwang, W.; Kim, H. Does the Adoption of Emerging Technologies Improve Technical Efficiency? Evidence from Korean Manufacturing SMEs. Small Bus. Econ. 2022, 59, 627–643. [Google Scholar] [CrossRef] [Scilit] [PubMed]
- Surya, B.; Menne, F.; Sabhan, H.; Suriani, S.; Abubakar, H.; Idris, M. Economic Growth, Increasing Productivity of SMEs, and Open Innovation. J. Open Innov. Technol. Mark. Complex. 2021, 7, 20. [Google Scholar] [CrossRef] [Scilit]
- Banco Central del Ecuador. Informe de Resultados: Cuentas Nacionales Trimestrales (Publicación No. 129, III Trimestre de 2024); Banco Central del Ecuador: Quito, Ecuador, 2024. [Google Scholar]
- Rojas, S.; Rincon, J.; Sánchez, M.; Ascúa, R.; Montoya, L. Factors Influencing 4.0 Technology Adoption in Manufacturing SMEs in an Emerging Country. J. Small Bus. Strategy 2022, 32, 67–83. [Google Scholar]
- Organisation for Economic Cooperation and Development. OECD SME and Entrepreneurship Outlook 2023; Organisation for Economic Cooperation and Development: Paris, France, 2023. [Google Scholar]
- Onu, P.; Mbohwa, C. Industry 4.0 Opportunities in Manufacturing SMEs: Sustainability Outlook. Mater. Today Proc. 2021, 44, 1925–1930. [Google Scholar] [CrossRef] [Scilit]
- Instituto Nacional de Estadística y Censos. Boletín REEM 2023; Instituto Nacional de Estadística y Censos: Quito, Ecuador, 2023. [Google Scholar]
- Instituto Nacional de Estadística y Censos. Registro Estadístico de Empresas y Establecimientos (REEM) 2022: Boletín Técnico y Principales Resultados; Instituto Nacional de Estadística y Censos: Quito, Ecuador, 2022. [Google Scholar]
- Comisión Económica para América Latina y el Caribe. Balance Preliminar de las Economías de América Latina y el Caribe 2022; Comisión Económica para América Latina y el Caribe: Santiago, Chile, 2022. [Google Scholar]
- Vayas-Ortega, G.; Soguero-Ruiz, C.; Rodríguez-Ibáñez, M.; Rojo-Álvarez, J.L.; Gimeno-Blanes, F.J. On the Differential Analysis of Enterprise Valuation Methods as a Guideline for Unlisted Companies Assessment (II): Applying Machine-Learning Techniques for Unbiased Enterprise Value Assessment. Appl. Sci. 2020, 10, 5334. [Google Scholar] [CrossRef] [Scilit]
- Owalla, B.; Gherhes, C.; Vorley, T.; Brooks, C. Mapping SME Productivity Research: A Systematic Review of Empirical Evidence and Future Research Agenda. Small Bus. Econ. 2022, 58, 1285–1307. [Google Scholar] [CrossRef] [Scilit]
- Stundziene, A.; Pilinkiene, V.; Vilkas, M.; Grybauskas, A.; Lukauskas, M. The Challenge of Measuring Innovation Types: A Systematic Literature Review. J. Innov. Knowl. 2024, 9, 100620. [Google Scholar] [CrossRef] [Scilit]
- World Intellectual Property Organization. Intellectual Property Statistics: Country Profile—Ecuador (Last Updated May 2025); World Intellectual Property Organization: Geneva, Switzerland, 2025. [Google Scholar]
- Indrawati, H.; Caska, A.; Suarman, B. Barriers to Technological Innovations of SMEs: How to Solve Them? Int. J. Innov. Sci. 2020, 12, 545–564. [Google Scholar] [CrossRef] [Scilit]
- World Bank; UNESCO Institute for Statistics. Research and Development Expenditure (% of GDP) (WDI Indicator GB.XPD.RSDV.GD.ZS); World Bank: Washington, DC, USA, 2024. [Google Scholar]
- Instituto Nacional de Estadística y Censos. Guía de Uso de Bases de ENESEM 2023; Instituto Nacional de Estadística y Censos: Quito, Ecuador, 2024. [Google Scholar]
- Superintendencia de Compañías, Valores y Seguros. Presentación Anual de Estados Financieros y Anexos; Superintendencia de Compañías, Valores y Seguros: Guayaquil, Ecuador, 2025. [Google Scholar]
- Fanelli, R. Barriers to Adopting New Technologies within Rural Small and Medium Enterprises (SMEs). Soc. Sci. 2021, 10, 430. [Google Scholar] [CrossRef] [Scilit]
- Agostini, L.; Nosella, A. The Adoption of Industry 4.0 Technologies in SMEs: Results of an International Study. Manag. Decis. 2020, 58, 625–643. [Google Scholar] [CrossRef] [Scilit]
- Dastane, D. The Impact of Technology Adoption on Organizational Productivity. J. Ind. Distrib. Bus. 2020, 11, 7–18. [Google Scholar] [CrossRef] [Scilit]
- Scandurra, G.; Thomas, A.; Appolloni, A. Supporting the diffusion of innovative SMEs: The Italian experience. Int. J. Entrep. Small Bus. 2025, 55, 439–463. [Google Scholar] [CrossRef] [Scilit]
- Suárez Pérez, J.C. Omnichannel Marketing in Ambato’s SMEs. In Marketing and Smart Technologies; Smart Innovation, Systems and Technologies; Springer: Singapore, 2023; Volume 337, pp. 331–343. [Google Scholar] [CrossRef] [Scilit]
- Ferraro, G.; Scandurra, G.; Thomas, A. The Emergence of Innovation Capabilities Supporting Technological Shifts Among SMEs: A Mediated Moderated Model. J. Innov. Knowl. 2025, 11, 100868. [Google Scholar] [CrossRef] [Scilit]
- Ceptureanu, S.I.; Ceptureanu, E.G.; Ferraro, G.; Thomas, A. Investigating the Link Between Eco-Innovation Ambidexterity and Performances in Low-End Markets: Does Frugal Innovation Matter? Bus. Strategy Environ. 2026, 35, 1022–1038. [Google Scholar] [CrossRef] [Scilit]
- Jalil, M.; Ali, A.; Kamarulzaman, R. Does Innovation Capability Improve SME Performance in Malaysia? The Mediating Effect of Technology Adoption. Int. J. Entrep. Innov. 2022, 23, 253–267. [Google Scholar] [CrossRef] [Scilit]
- Salazar-Mera, J.; Silva-Ordóñez, C.; Morales-Molina, T. Relationship Between the Profitability of Ecuadorian Companies Versus the Growth of Ecuador’s GDP. In New Perspectives and Paradigms in Applied Economics and Business; Gartner, W., Ed.; Springer Proceedings in Business and Economics; Springer: Cham, Switzerland, 2025; pp. 749–760. [Google Scholar] [CrossRef] [Scilit]
- OECD; JRC. Handbook on Constructing Composite Indicators: Methodology and User Guide; OECD Publishing: Paris, France, 2008. [Google Scholar] [CrossRef] [Scilit]
- Saisana, M.; Saltelli, A.; Tarantola, S. Uncertainty and Sensitivity Analysis Techniques as Tools for the Quality Assessment of Composite Indicators. J. R. Stat. Soc. Ser. A (Stat. Soc.) 2005, 168, 307–323. [Google Scholar] [CrossRef] [Scilit]
- Lu, X.; White, H. Robustness Checks and Robustness Tests in Applied Economics. J. Econom. 2014, 178, 194–206. [Google Scholar] [CrossRef] [Scilit]
- Greco, S.; Ishizaka, A.; Tasiou, M.; Torrisi, G. On the Methodological Framework of Composite Indices: A Review of the Issues of Weighting, Aggregation, and Robustness. Soc. Indic. Res. 2019, 141, 61–94. [Google Scholar] [CrossRef] [Scilit]
- Bhatia, P.; Diaz, N. Facilitating Decision-Making for the Adoption of Smart Manufacturing Technologies by SMEs via Fuzzy TOPSIS. Int. J. Prod. Econ. 2023, 257, 108762. [Google Scholar] [CrossRef] [Scilit]

Disclaimer/Publisher’s Note: The statements, opinions and data contained in all publications are solely those of the individual author(s) and contributor(s) and not of MDPI and/or the editor(s). MDPI and/or the editor(s) disclaim responsibility for any injury to people or property resulting from any ideas, methods, instructions or products referred to in the content. |
© 2026 by the authors. Licensee MDPI, Basel, Switzerland. This article is an open access article distributed under the terms and conditions of the Creative Commons Attribution (CC BY) license.