


Abstract
In the digital era, online attention has become a key indicator of tourism competitiveness and destination visibility. This study proposes a two-dimensional framework to evaluate the competitive state of online attention by combining its current magnitude and growth dynamics. Using Baidu Index data, the study applies the Boston Consulting Group (BCG) matrix and the coefficient of variation to analyze online attention patterns of Beijing’s 5A–level tourist attractions from 2011 to 2025. The results show clear polarization in online attention. A small number of iconic attractions consistently dominate digital visibility, while many other sites exhibit unstable and uneven attention trajectories. These patterns reflect the cumulative effects of consumer behavior, information-seeking preferences, and algorithmically mediated content environments, which reinforce attention concentration and competitive inequality over time. External shocks, particularly the COVID–19 pandemic, caused sharp declines in online attention in 2020, followed by an uneven recovery in subsequent years, highlighting the volatility of digital attention systems. The study also demonstrates the managerial value of the proposed framework. By classifying attractions according to attention levels and growth potential, the framework supports differentiated marketing and demand–redistribution strategies. For instance, increasing the visibility of high-potential but under-visited attractions can help redirect visitors away from overcrowded “Star/GC” sites and encourage more balanced spatial and temporal visitation. Overall, this study proposes a quantitative and replicable framework that integrates digital attention dynamics, algorithmic filtering, and consumer behavior into destination competitiveness analysis. The framework supports evidence-based and sustainability-oriented destination management by informing adaptive marketing and demand management strategies that can help alleviate overtourism and balance visitor flows. However, the study relies on a single digital platform and lacks direct sustainability indicators. Future research should integrate multi-platform data and link online attention metrics to measurable environmental, social, and economic sustainability outcomes.
1. Introduction
The internet has become the primary platform for accessing tourism information, monitoring trends, and sharing experiences, making it essential in modern tourism marketing and destination management [1,2,3,4,5]. As tourists increasingly rely on digital channels before, during, and after travel, online environments have reshaped how destinations compete for visibility and demand. Within this context, online attention—the visibility, engagement, and interest that users direct toward attractions—has emerged as a key metric for assessing destination competitiveness and marketing effectiveness, as it reflects both potential demand and perceived attractiveness [6,7,8]. The Baidu Index is widely recognized for its reliability in tourism research, enabling analyses of visitor behavior, search intensity, and destination popularity over time in the Chinese context [9,10,11,12]. Leveraging large-scale search data, scholars have been able to capture dynamic patterns of tourist interest beyond traditional survey or ticketing records. Previous studies primarily focus on spatio-temporal patterns of online attention and their correlation with actual tourist flows and demand [8,13,14,15]. Determinants such as destination image, accessibility, media exposure, and online word-of-mouth have also been extensively explored, alongside predictive applications for tourism demand and visitor flows using search engine and social media data [16,17,18,19,20,21,22]. In parallel, sentiment analysis of online reviews has been increasingly employed to interpret tourist preferences, satisfaction, and visitation patterns [23,24], highlighting the multifaceted nature of digital tourism data. Despite these advances, there is limited research on competitive dynamics, online attention monopolies, and volatility across destinations. Traditional studies largely emphasize spatial patterns and correlation with visitor numbers, without systematically evaluating how attention is distributed among attractions over time, how it fluctuates, or whether a few iconic sites dominate digital visibility. Moreover, there is little integration of conventional competitive frameworks, such as the Boston Consulting Group (BCG) matrix, with online attention metrics to assess stability, polarization, and competition trajectories in the digital era [25,26,27,28,29,30].
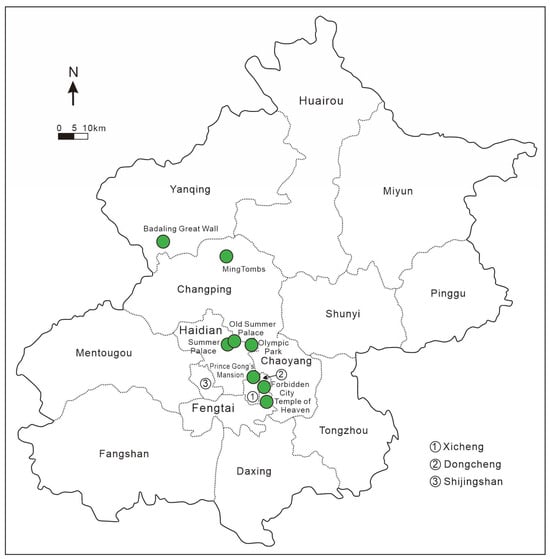
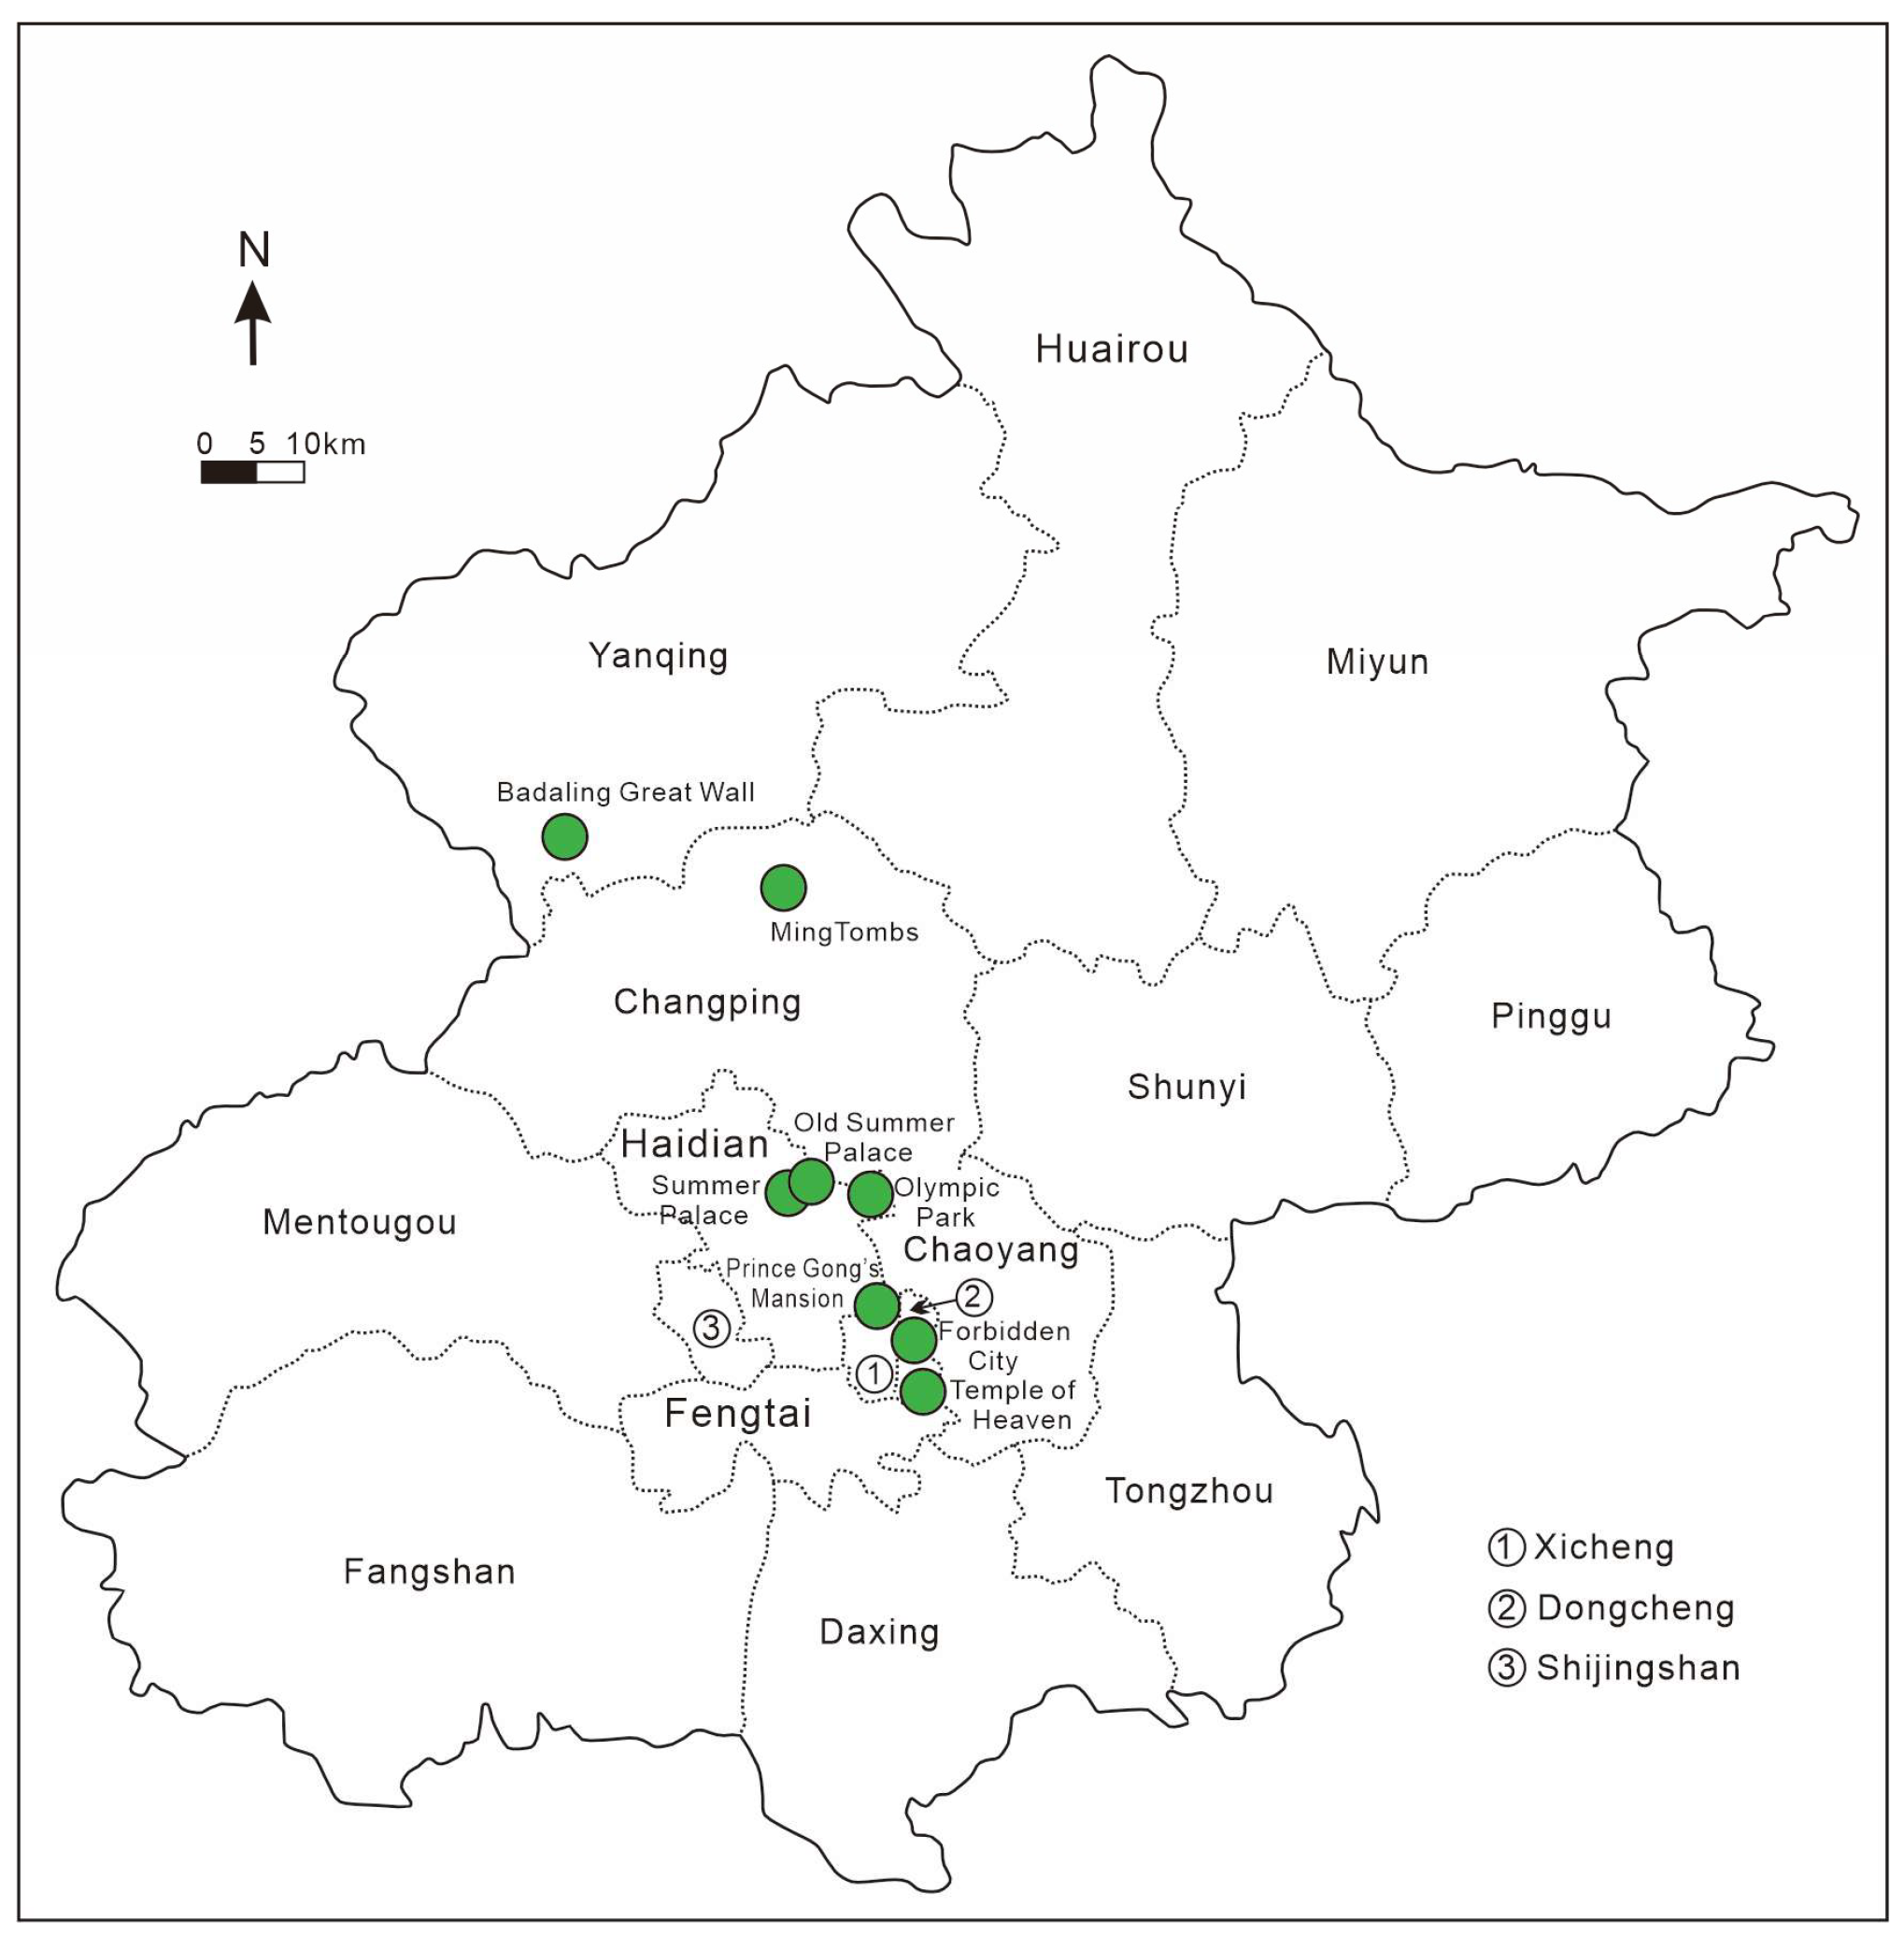
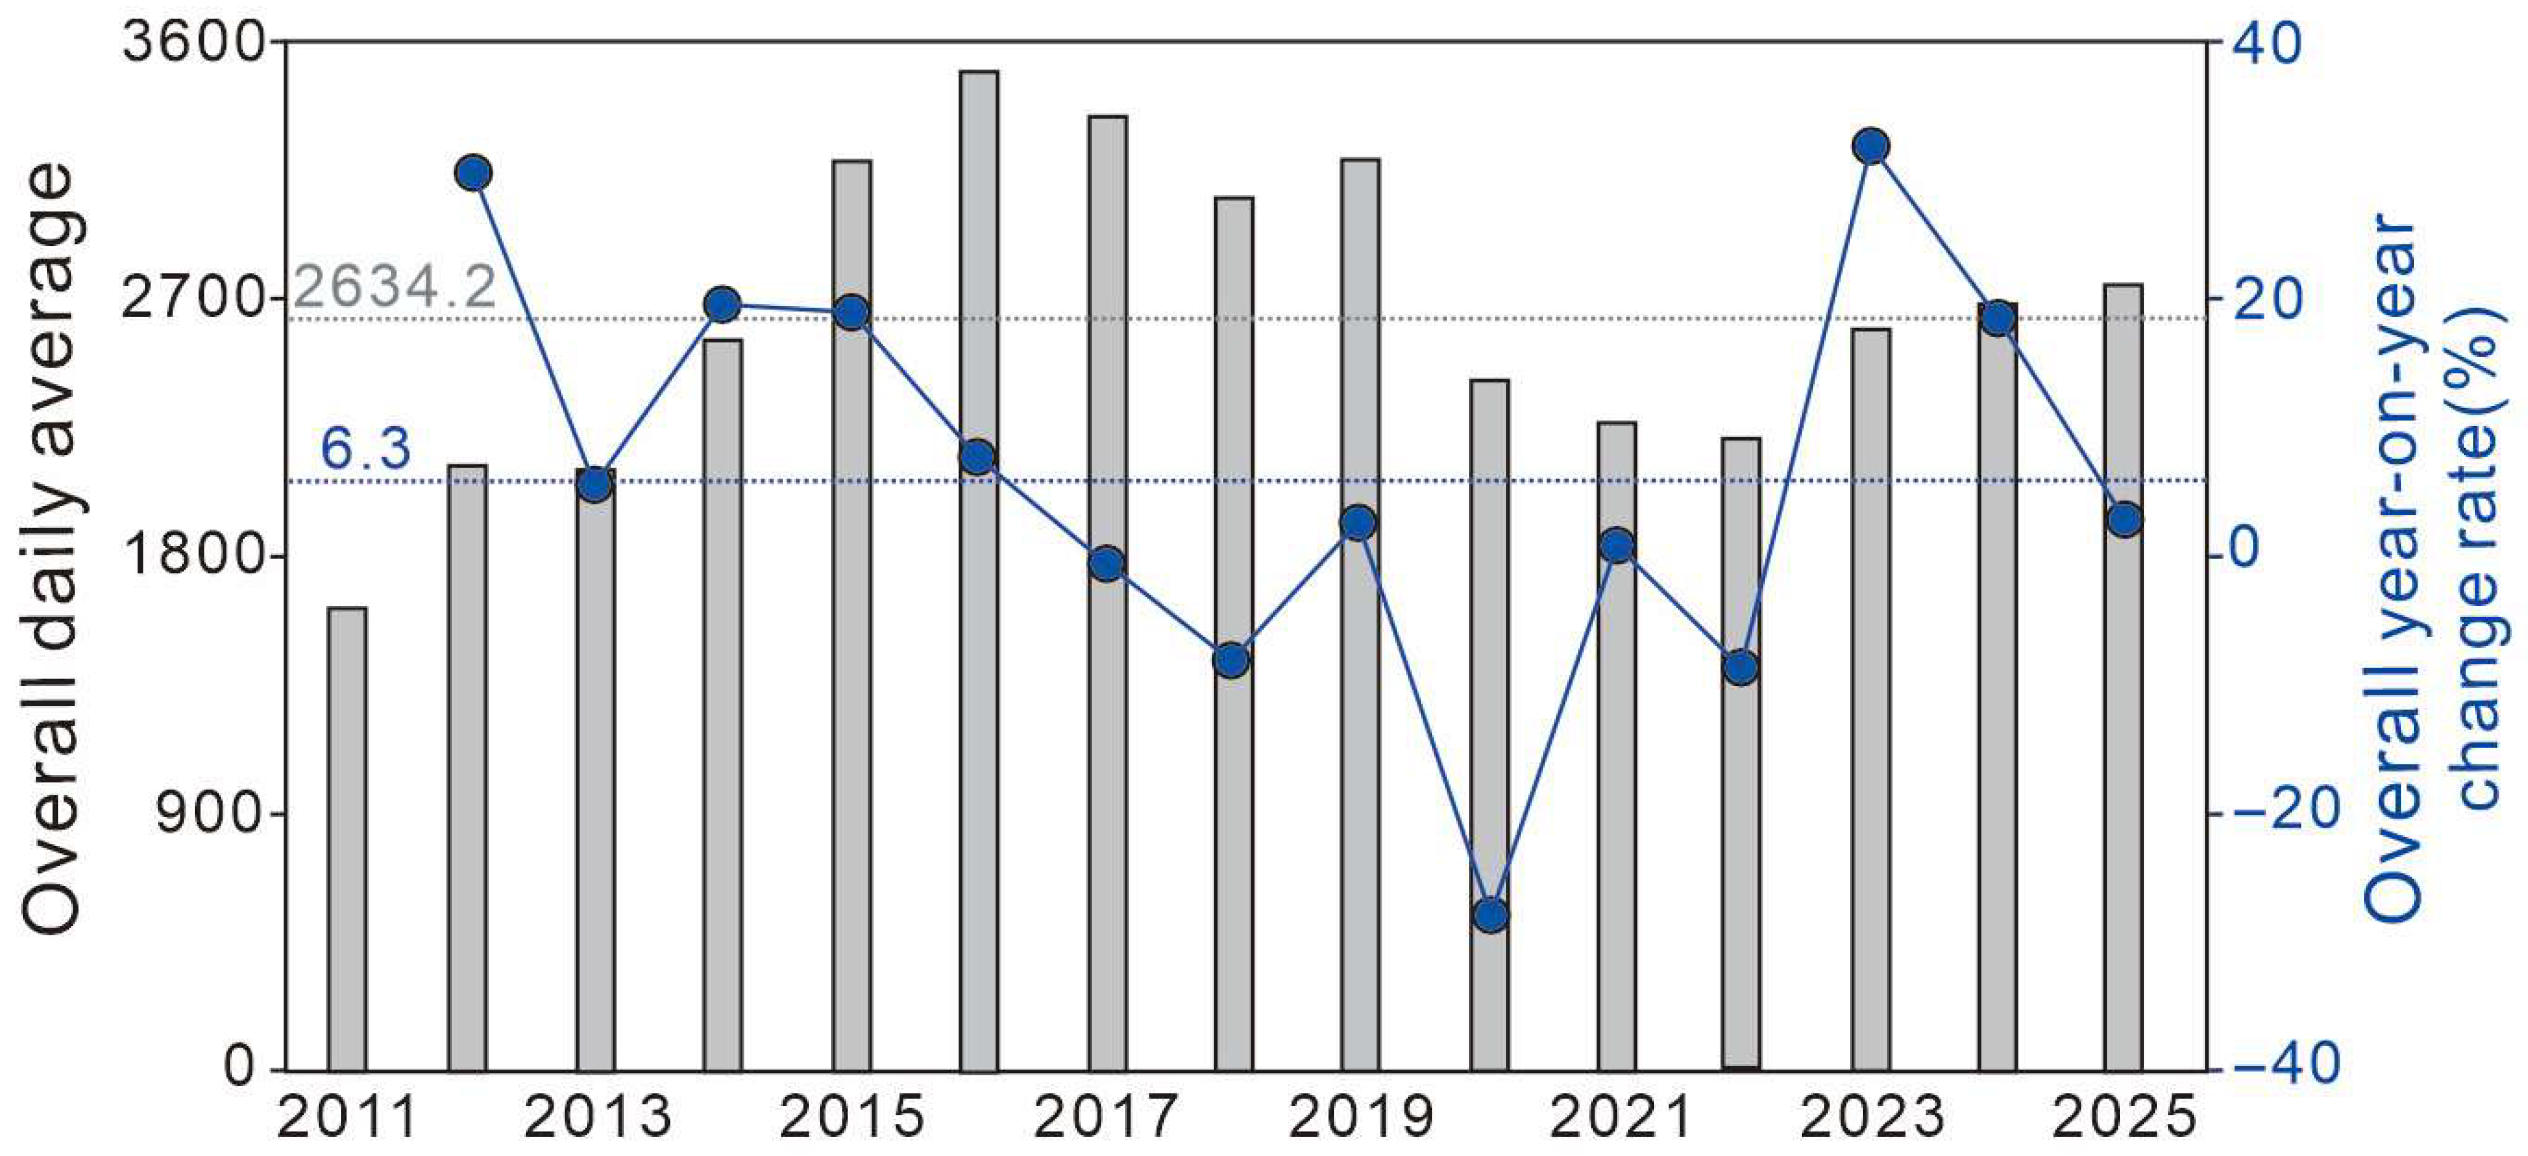
This study addresses these gaps by developing a Network Attention Competitive State (NACS) framework that integrates Baidu Index metrics with the BCG matrix and coefficient of variation (CV) to evaluate the competitive state of Beijing’s 5A–level tourist attractions from 2011 to 2025 (Figure 1) [4,31,32]. The framework maps overall daily average (A) and year-on-year change rate (B), enabling the classification of attractions into four quadrants to capture both the strength and trend of online attention. While BCG was originally designed for conventional market data, its adaptation here highlights patterns of polarization, attention monopolies, and volatility in digital contexts. Thresholds are calculated using annual averages to account for temporal changes, and simple averages are preferred over percentiles or z-scores due to the skewed distribution of attention caused by dominant sites such as the Forbidden City and Summer Palace.
Figure 1.
Distribution map of Beijing’s 5A–level tourist attractions.
Based on this framework, the study formulates three key objectives: (1) measure polarization in online attention across Beijing’s 5A–level attractions, (2) characterize competitive trajectories of attractions over time using NACS, and (3) link volatility in online attention to external shocks, including the COVID–19 pandemic, seasonal campaigns, and social media trends. Baidu Index data were extracted annually for 2011–2025, using a daily resolution, with moving averages applied where appropriate. Device types (PC, mobile, or all) and holiday adjustments are documented to ensure replicability. The Badaling–Mutinyu area is represented using a proxy keyword (“Badaling Great Wall”) to standardize measurements. The framework provides a transparent and replicable method for monitoring competition, forecasting trends, and supporting data-driven decisions in sustainable tourism management.
2. Data Sources and Research Methods
2.1. Data Sources
The Baidu Index leverages extensive user behavior data to reflect public and media attention to keywords over time [11]. Given its wide applications in tourism, news, and finance, this study uses Baidu search index data as the primary source [8,12]. Data were collected for Beijing’s 5A–level tourist attractions from 2011 to 2025 using the directory published by the Beijing Municipal Bureau of Culture and Tourism. Key metrics include the overall daily average (A) and year-on-year change rate (B) (Table 1).
Table 1.
Online attention for 5A–level tourist attractions in Beijing (2011–2025).
Since direct Baidu Index data for the Beijing Badaling–Mutianyu Great Wall Tourist Area are unavailable under a single keyword, this study uses the search index for “Badaling Great Wall” as a proxy for the entire area. Badaling consistently generates much higher search volumes that Mutianyu, making it the most representative indicators of online attention for the shole tourist region; this approach enables a comprehensive assessment of online visibility and engagement for one of Beijing’s major tourist destinations., capturing overall trends for both Badaling and Mutianyu within a single, practical measure.
2.2. Research Methods
2.2.1. BCG and Competitive State of the Tourism Market
The Boston Consulting Group (BCG) matrix, developed in 1970, is widely used for analyzing business portfolios by classifying products according to market share and growth potential [29,30]. Following this logic, Li and Sun extended the BCG framework to tourism research by jointly considering attractions’ current performance and future development trends [26]. In this study, the BCG logic is operationalized within a two-dimensional model of Network Attention Competition Status (NACS), in which the overall daily average Baidu search index represents current online attention strength and the year-on-year change rate reflects its development potential.
Based on Baidu Search Index data, a yearly relative Boston Matrix is employed, using the annual mean daily search index and mean growth rate as benchmarks for the horizonal and vertical axes. Attractions are then categorized as Star (S), Cash Cow (CC), Infant or Question Mark (I), and Skinny Dog (SD) depending on whether their attention level and growth performance are above or below these annual averages (Table 2). To strengthen methodological robustness, complementary indicators, including the coefficient of variation and multi-year average values, are incorporated to reflect stability and long-term trends. Overall, this dynamic benchmarking framework facilitates comparative analysis of competitive dynamics among tourist attractions while emphasizing that quadrant classifications should be interpreted as indicative rather than definitive.
Table 2.
Evolution of online attention competition for 5A–level tourist attractions in Beijing.
2.2.2. Coefficient of Variation
The coefficient of variation (CV) measures the extent of variation or dispersion among the indicator values within a population. It is commonly used to illustrate developmental trends across different units over time or to compare the level of development among various populations at a given time. The classification of the coefficient of variation is as follows: V ≤ 0.1 indicates weak variation, 0.1 < V < 1 suggests moderate variation, and V ≥ 1 signifies strong variation [33]. To calculate the coefficient of variation, we utilize the normalized “overall daily mean” (denoted as “a”) and the “overall year-on-year change rate” (denoted as “b”), derived from the minimum values of each indicator, serving as the network attention indicator data. The formula for the coefficient of variation is:
Here, V is the coefficient of variation, σ is the standard deviation, and is the mean. CVs are calculated for individual attractions over 2011–2025 (Va−15, Vb−15) and across all eight attractions for each year (V8−a, V8−b), providing a comprehensive view of network attention variability and competitive dynamics (Table 3).
Table 3.
Coefficient of Variation Calculation (2011–2025).
3. Result and Discussion
3.1. Overall Evolution Characteristics of Network Attention to 5A–Level Tourist Attractions in Beijing (2011–2025)
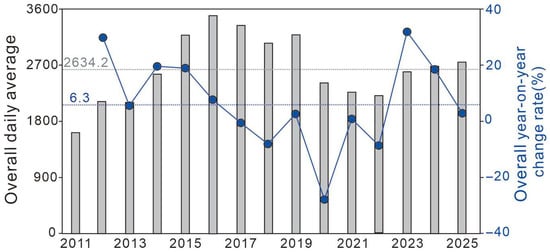
Between 2011 and 2025, network attention toward Beijing’s 5A–level tourist attractions displayed four distinct phases: growth (2011–2016), stabilization (2017–2019), pandemic decline (2020–2022), and recovery (2023–2025). Across all sites, the mean daily attention was 2634.2, with a mean year-on-year growth rate of 6.3% (Figure 2).
Figure 2.
Biaxial evolution of average online attention for 5A–level tourist attractions in Beijing (2011–2025).
During the growth phase (2011–2016), daily attention rose from 1820 in 2011 to 3120 in 2016, corresponding to an average annual growth rate of 10.4%. Linear trend analysis confirmed a significant upward trend (R2 = 0.82, p < 0.01). Iconic attractions, including the Forbidden City and Summer Palace, consistently attracted higher attention than lesser-known sites such as Olympic Park and Prince Gong’s Mansion, a difference confirmed by an independent-samples t-test (t = 6.42, p < 0.001).
In the stabilization phase (2017–2019), overall attention plateaued at approximately 3200 daily visits, with year-on-year growth declining to 1.2%. Trend analysis indicated no significant increase during this period (R2 = 0.05, p = 0.42), suggesting saturation among high-profile attractions. While minor fluctuations persisted among less prominent sites, paired t-tests comparing 2016 and 2019 showed no statistically significant changes (p > 0.1), indicating relative stability.
The pandemic decline phase (2020–2022) saw a sharp reduction in attention. In 2020, average daily attention fell to 1850, representing a 29.7% decrease relative to 2019. Declines were statistically significant across all sites (paired t-test: t = 8.17, p < 0.001), although iconic sites retained comparatively higher visibility.
During the recovery phase (2023–2025), attention rebounded to 3020 in 2023 and 3450 in 2025, with a significant positive trend (R2 = 0.76, p < 0.01). Iconic attractions exhibited the strongest recovery, with the Forbidden City and Summer Palace reaching 5430 and 4710 daily visits, respectively. Lesser-known sites, such as the Ming Tombs (1410) and Badaling Great Wall (1380), showed moderate gains, while Olympic Park (1020) and Prince Gong’s Mansion (960) remained below pre-pandemic levels, as confirmed by paired t-tests comparing 2019 and 2025 (p < 0.05).
These results quantitatively demonstrate the four distinct phases of network attention and the persistent polarization between iconic and lesser-known attractions. Statistical analyses support previously observed trends and fluctuations, providing a robust empirical basis for understanding the evolving patterns of online engagement with Beijing’s 5A–level tourist sites.
3.2. Evolution of Competitive State of Network Attention for 5A–Level Tourist Attractions
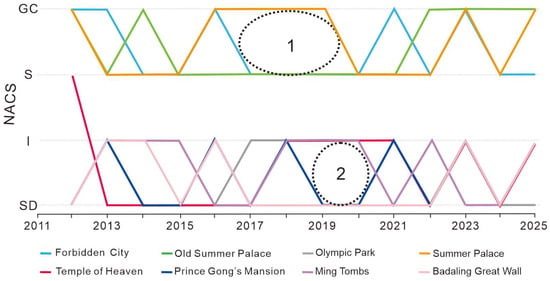
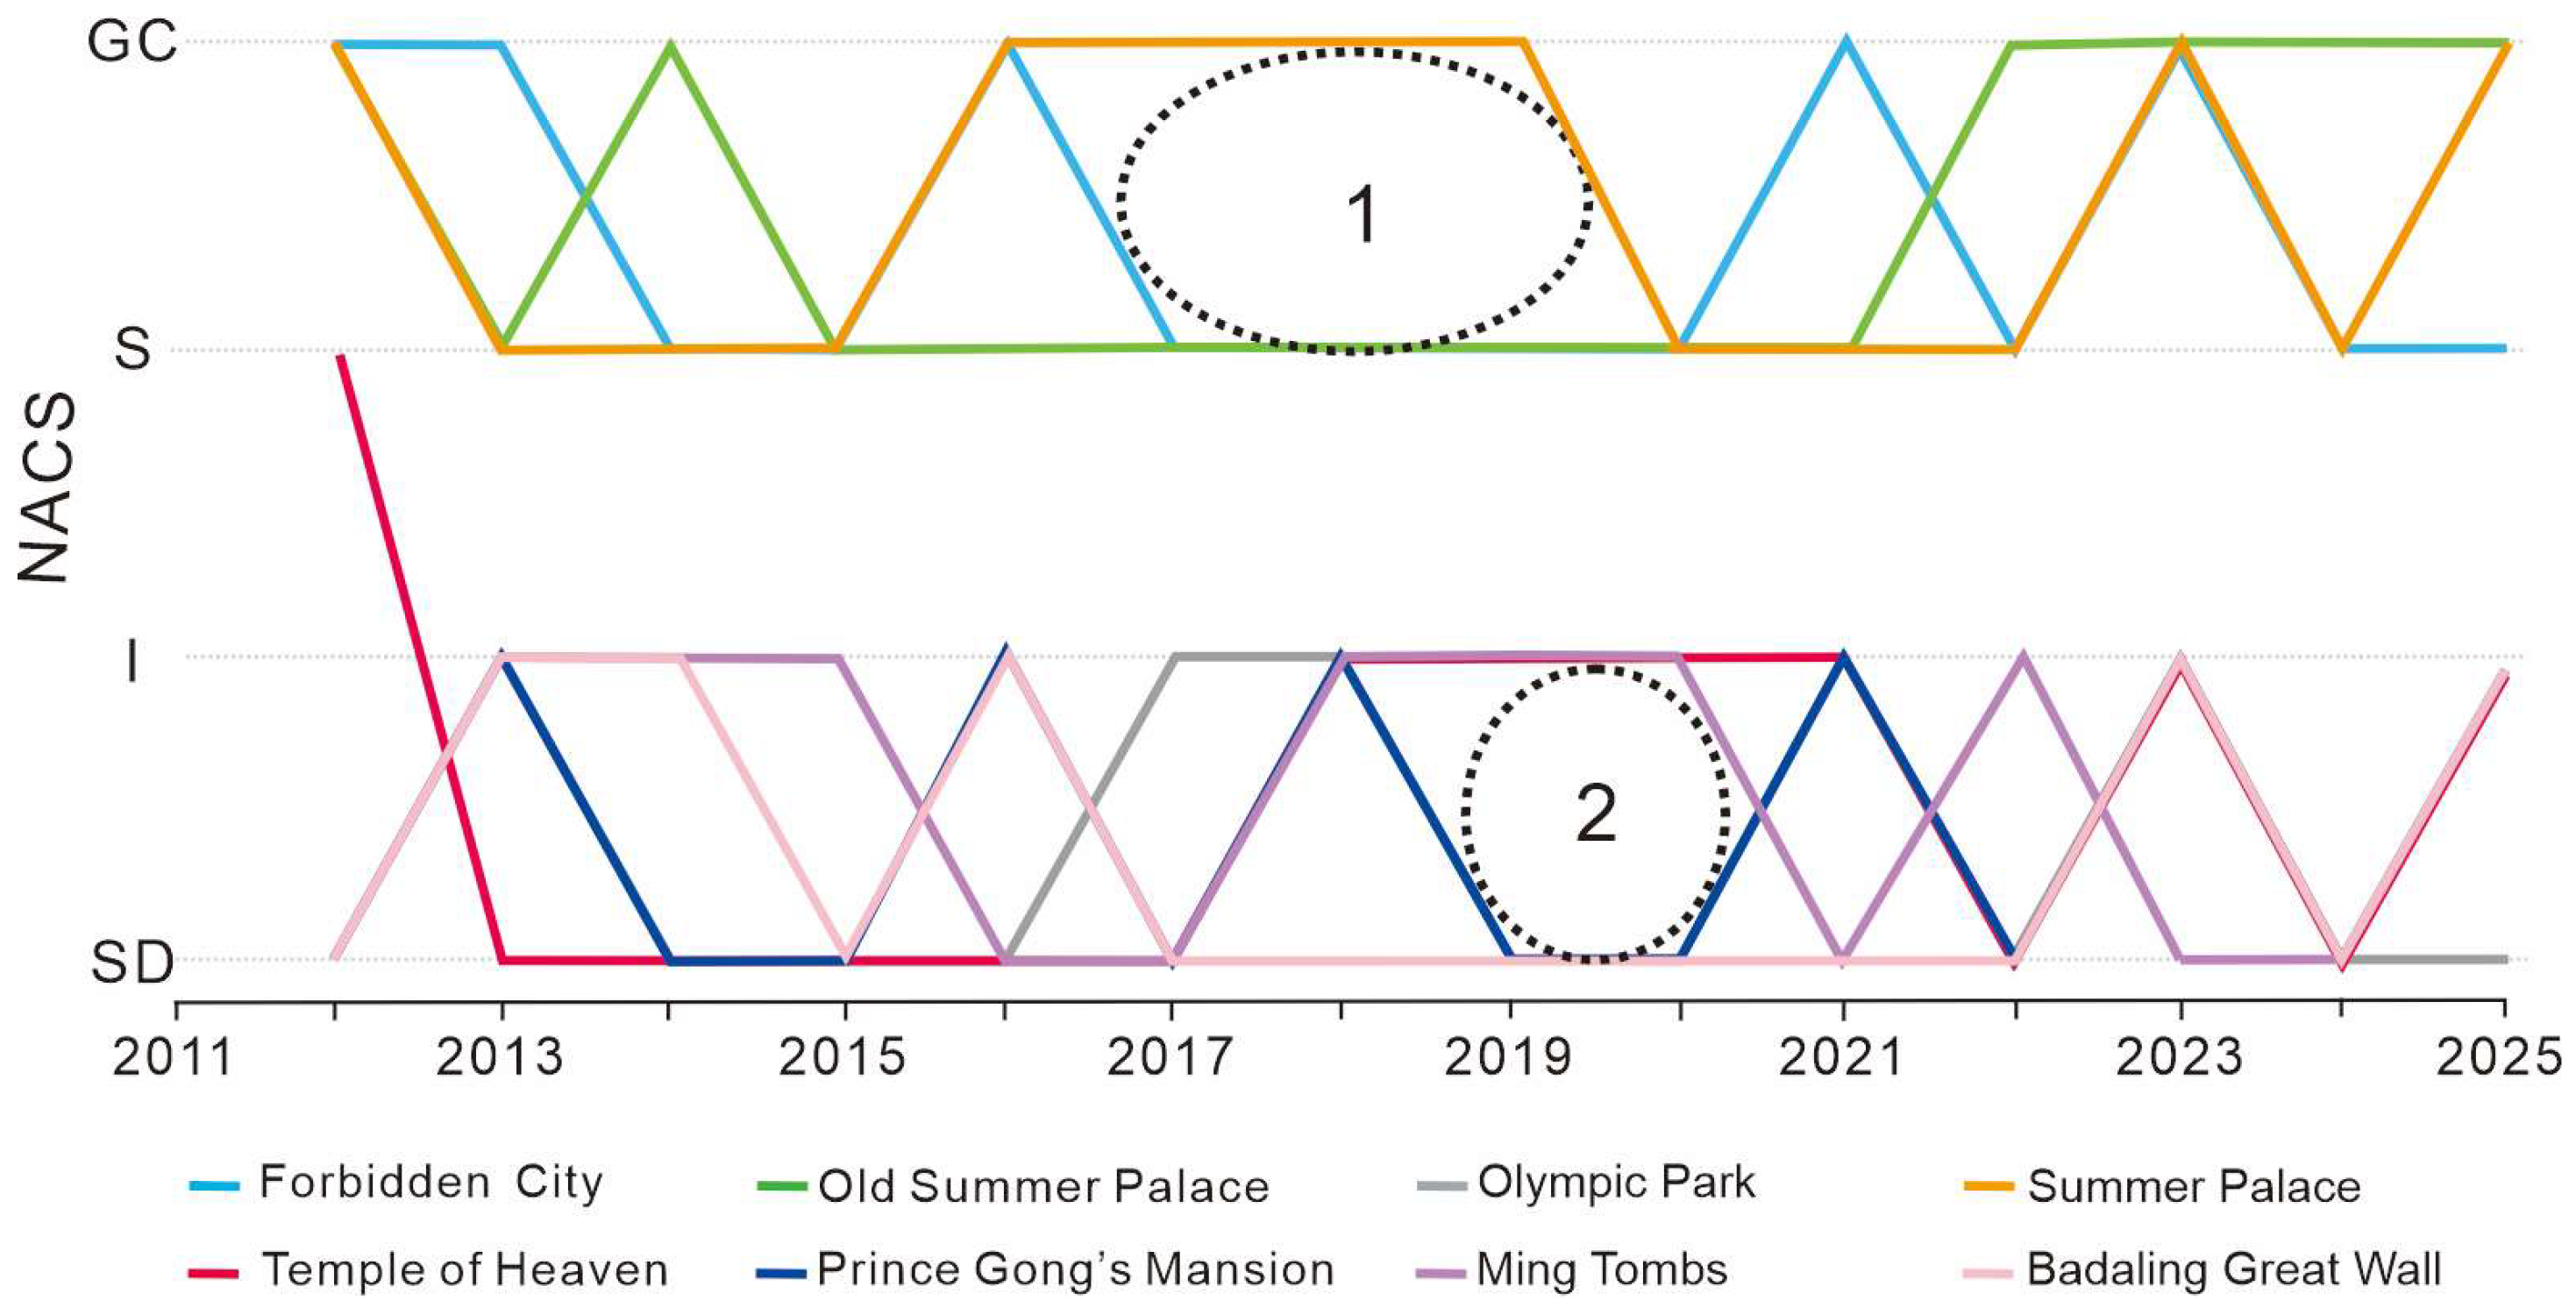
The evolution of online attention for Beijing’s 5A–level tourist attractions from 2011 to 2025 can be analyzed using the Boston matrix and competitive state theory (Figure 3). Network data reveal increasing polarization among attractions and frequent fluctuations in online visibility over time.
Figure 3.
Competitive fluctuations in 5A–level tourist attractions in Beijing (2011–2025).
3.2.1. Overall Pattern of Competitive State Evolution: Polarization
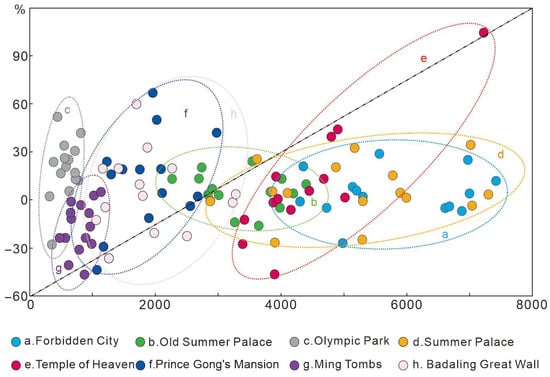
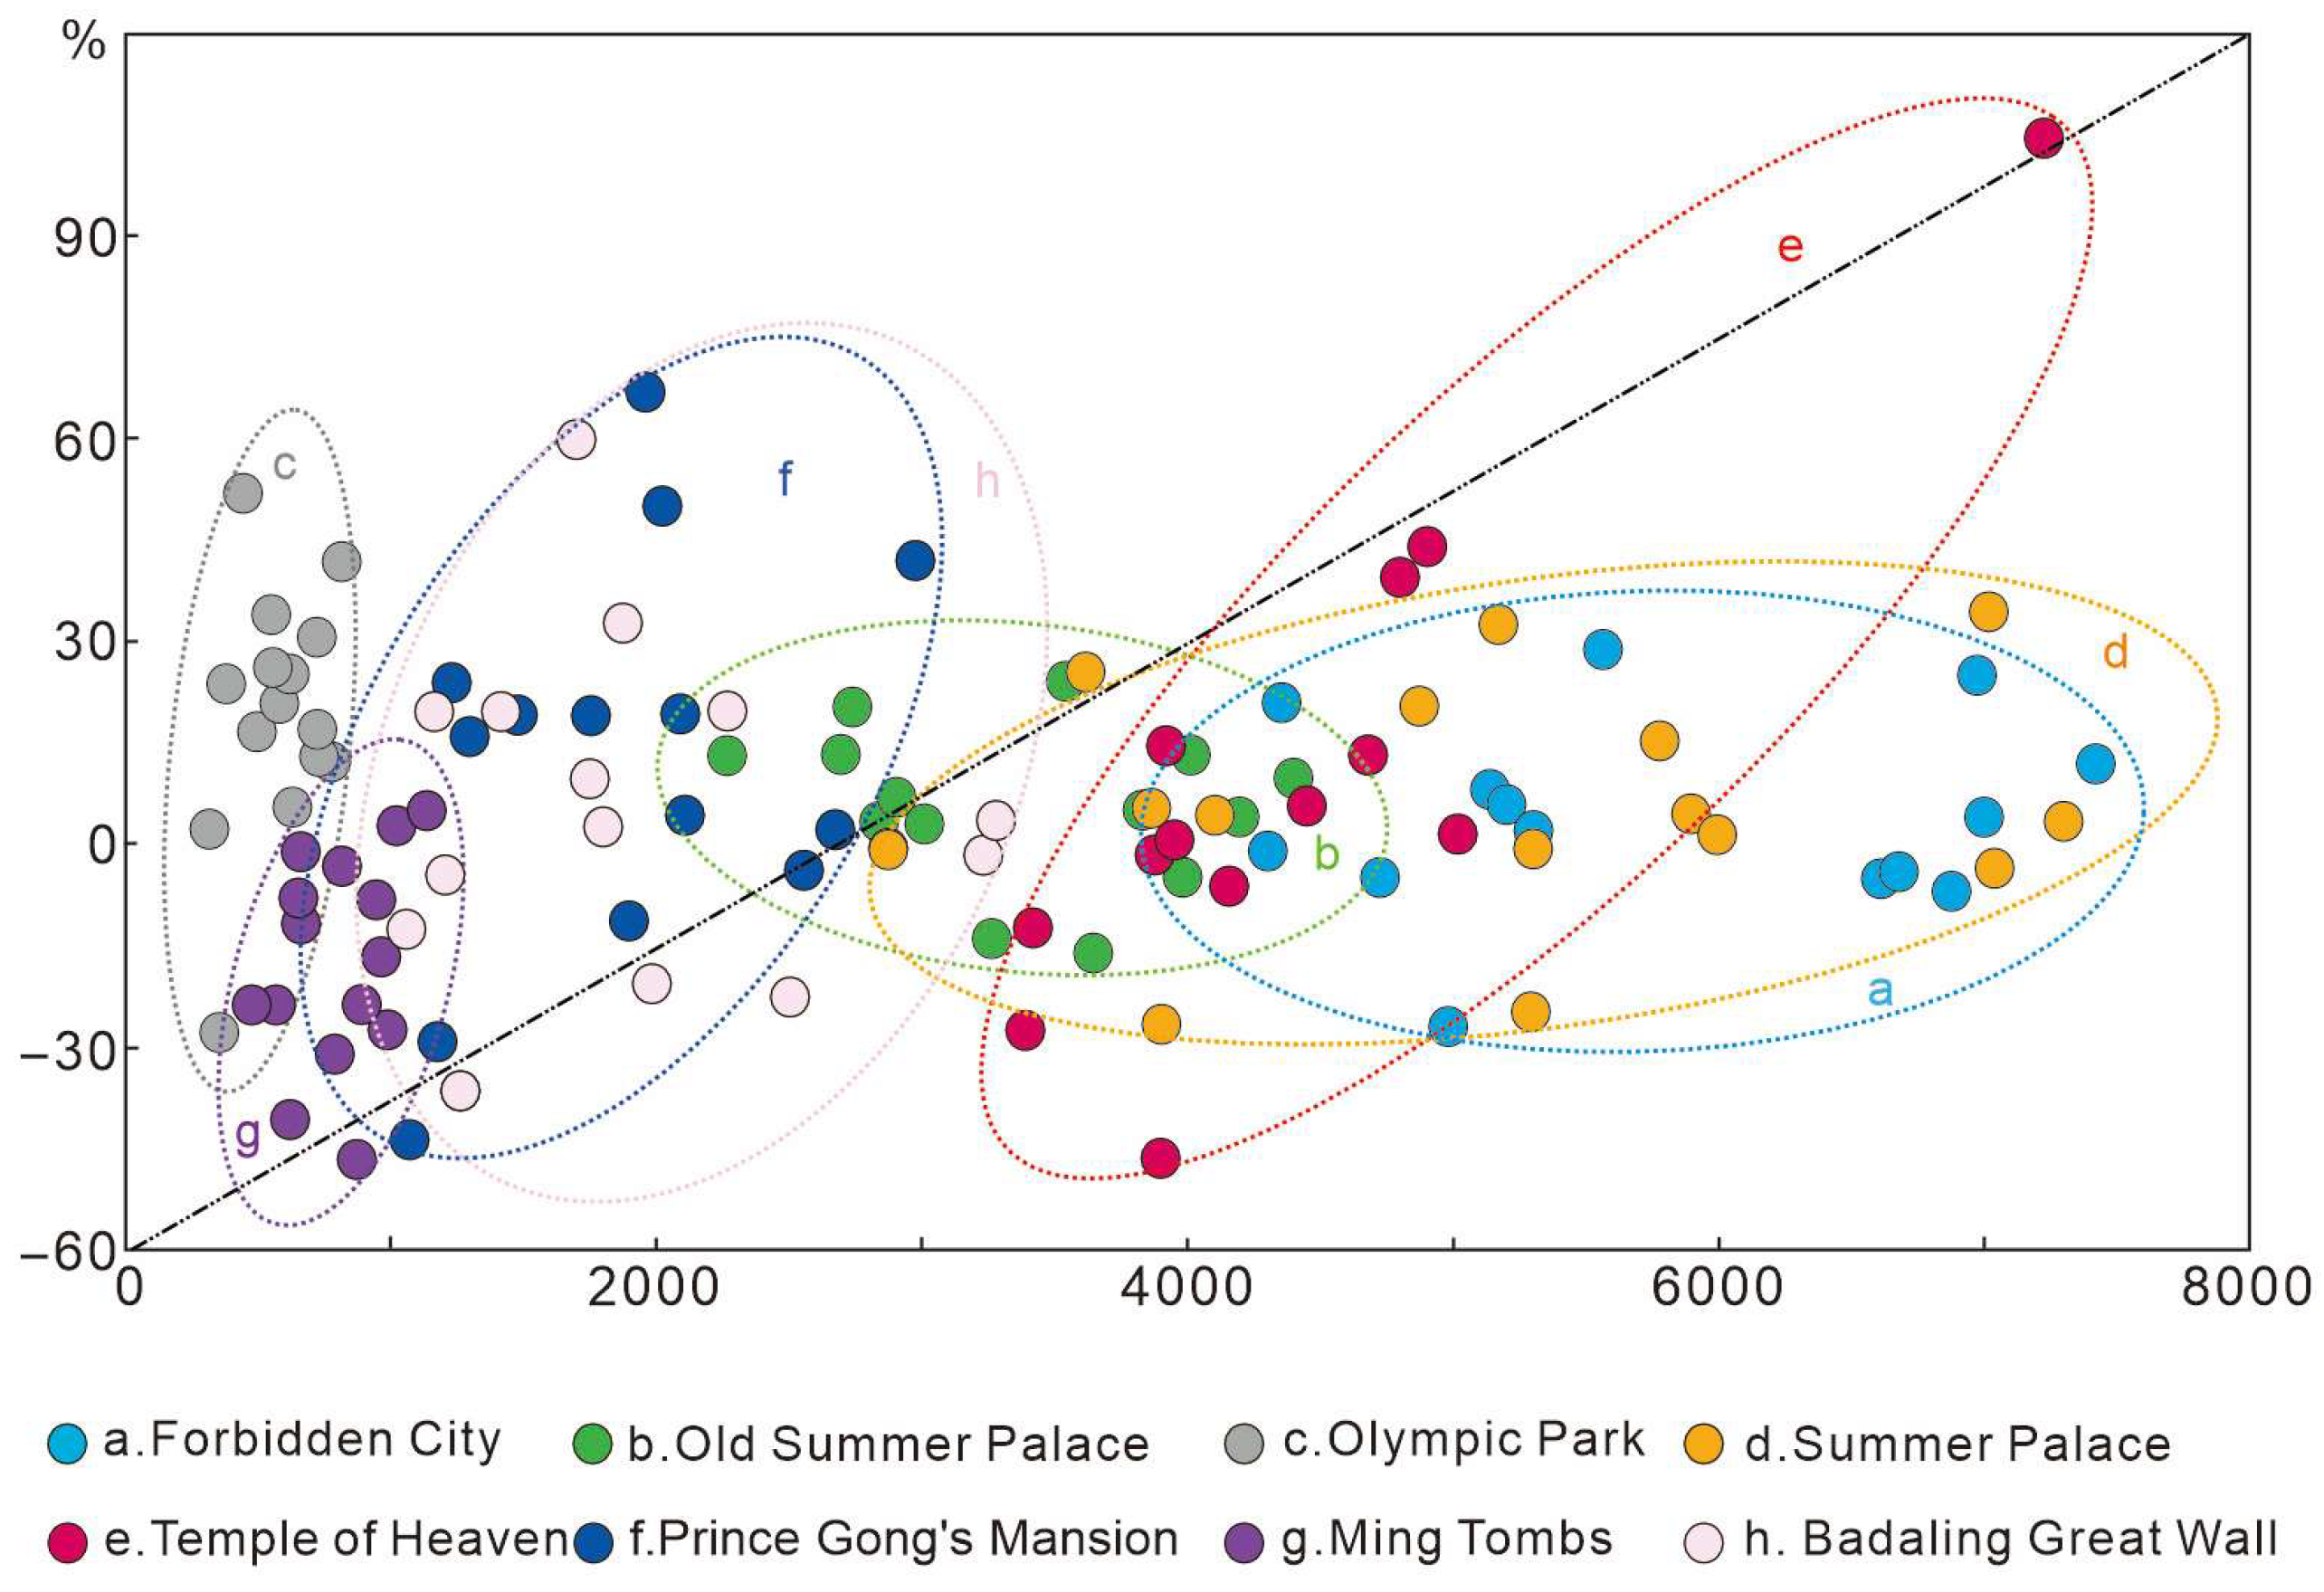
From 2011 to 2025, online attention became increasingly concentrated on a few iconic sites, including the Forbidden City, Old Summer Palace, and Summer Palace. These attractions consistently recorded high average daily attention (Forbidden City: 4820; Summer Palace: 4210) and relatively stable year-on-year change rates, reflecting strong historical symbolism, brand recognition, and sustained digital visibility (Figure 4).
Figure 4.
Relationship between daily average and year-on-year change rate of Beijing 5A–level tourist attractions (2011–2025).
In contrast, attractions such as the Olympic Park, Temple of Heaven, Prince Gong’s Mansion, Ming Tombs, and Badaling Great Wall exhibited lower average daily attention (1020–1410) and higher volatility in year-on-year growth. Statistical analysis of year-on-year fluctuations confirms that these less prominent sites experienced significantly higher variability compared with top-tier attractions (Levene’s test for equality of variances, p < 0.01). As a result, these sites often fell into the “Skinny Dog” or “Infant” categories in the Boston matrix, indicating limited competitiveness and sensitivity to short-term external shocks. The observed pattern shows a positive association between sustained high attention and stability, whereas sites with persistently low attention experienced greater volatility and weaker growth continuity. Even with digital marketing efforts, attractions like Olympic Park and Prince Gong’s Mansion struggled to narrow the gap with leading sites, as reflected in their modest year-on-year performance in 2024–2025.
3.2.2. Competitive State Evolution Process: Frequent Fluctuations
The competitive state of online attention among Beijing’s 5A–level tourist attractions showed frequent fluctuations from 2011 to 2025, as measured by year-on-year change rates and variance in daily attention. Between 2011 and 2013, most attractions maintained relatively stable attention within their competitive categories. For example, the Forbidden City exhibited a mean daily attention of 3210 with a year-on-year growth variance of 2.5%, while the Summer Palace had 2870 daily visits and a variance of 2.8%, indicating minor fluctuations. In contrast, lesser-known sites such as the Olympic Park and Prince Gong’s Mansion showed larger variability, with mean daily attention of 1180 and 960, respectively, and year-on-year growth variances of 12.4% and 13.1%, highlighting their sensitivity to short-term shocks. By 2014, fluctuations became more pronounced. The standard deviation of year-on-year growth for “Skinny Dog” attractions, including Olympic Park, Prince Gong’s Mansion, and Badaling Great Wall, increased to 15.2%, 14.8%, and 13.6%, respectively, compared with 3–4% for top-tier sites like the Forbidden City and Summer Palace. Paired t-tests comparing consecutive years (2013–2014) confirmed that the volatility of lesser-known sites was significantly higher than that of iconic attractions (t = 5.87, p < 0.001). During 2015–2019, fluctuations persisted among secondary attractions, with some oscillating between Boston Matrix categories (“Infant” → “Question Mark” → “Skinny Dog”). For instance, Badaling Great Wall shifted categories three times, corresponding to year-on-year growth ranging from −9.5% to +16.2%. Top-tier attractions remained stable, with year-on-year changes within ±3%, confirming their consistent dominance. In the post-pandemic period (2023–2025), even iconic sites exhibited signs of online saturation. The Forbidden City and Summer Palace showed reduced year-on-year growth rates (+2.1% and +2.5%, respectively), compared with pre-pandemic levels of 5–8%, indicating diminishing returns. Lesser-known attractions continued to fluctuate substantially; for example, Prince Gong’s Mansion ranged from −4.8% to +6.7%, and Olympic Park from −5.2% to +7.1%, highlighting persistent instability in online visibility.
These statistical results confirm that less prominent attractions experience higher volatility in online attention, while top-tier sites maintain relatively stable performance. The competitive landscape is thus dynamic: iconic attractions sustain long-term dominance, whereas secondary sites face challenges in achieving stable growth and improving their digital presence.
3.3. Analysis of Variation in Online Attention
3.3.1. Interannual Comparative Analysis of Network Attention
The interannual variation coefficients from 2011 to 2025 reveal notable disparities in online attention across the various attractions, with particularly significant variations observed in 2020, 2024, and 2025 (Table 4). During the pandemic year of 2020, attention was concentrated on a few major attractions like the Forbidden City and the Summer Palace, which maintained relatively high levels of engagement despite the disruptions. In contrast, attractions like the Olympic Park and Ming Tombs saw dramatic declines, hitting some of their lowest levels of daily attention.
Table 4.
Variation of overall daily average and year-on year change rate of 5A–level TAs of Beijing.
From 2021 to 2024, a recovery trend emerged, with attractions such as the Badaling Great Wall and the Temple of Heaven experiencing a resurgence in engagement. This rebound reflected the broader recovery of Beijing’s tourism market, driven by increased domestic travel and renewed online interest in tourism. By 2025, many attractions had successfully regained attention, signaling the sector’s adaptive recovery.
3.3.2. Comparative Analysis of Online Attention Among Tourist Attractions
A detailed comparative analysis of interannual variation coefficients (Table 5) shows that certain attractions experienced higher fluctuations in online attention. For example, Olympic Park (Va−15 = 0.64) and Badaling Great Wall (Va−15 = 0.52) had the highest variation coefficients, indicating significant volatility in their digital engagement. Olympic Park, in particular, faced steep declines in 2020 and 2022, followed by a recovery in 2024, highlighting the challenges in maintaining consistent online engagement.
Table 5.
Interannual variation of overall daily average attention of 5A–level tourist attractions in Beijing.
Attractions such as the Temple of Heaven (Vb−15 = 0.63) and Prince Gong’s Mansion (Vb−15 = 0.49) also displayed higher variation coefficients, suggesting notable year-on-year changes in online interest. This likely reflects shifts in marketing efforts or visitor experiences. Meanwhile, iconic attractions like the Forbidden City and Yuanmingyuan experienced relatively stable online attention, with minimal fluctuation observed over the years. These sites benefited from their strong historical appeal and brand recognition. However, even these attractions showed signs of online saturation as interest stabilized. This analysis highlights the volatile and competitive nature of the digital tourism landscape, where some attractions maintain steady attention, while others face greater challenges in securing visibility. The pandemic years, especially 2020, exposed vulnerabilities in even the most well-established attractions. However, the recovery observed in 2024 and 2025 underscores the resilience of the tourism market and its ability to adapt to changing conditions.
4. Competition Dynamic of Online Attention Among Beijing’s 5A–Level Tourist Attractions
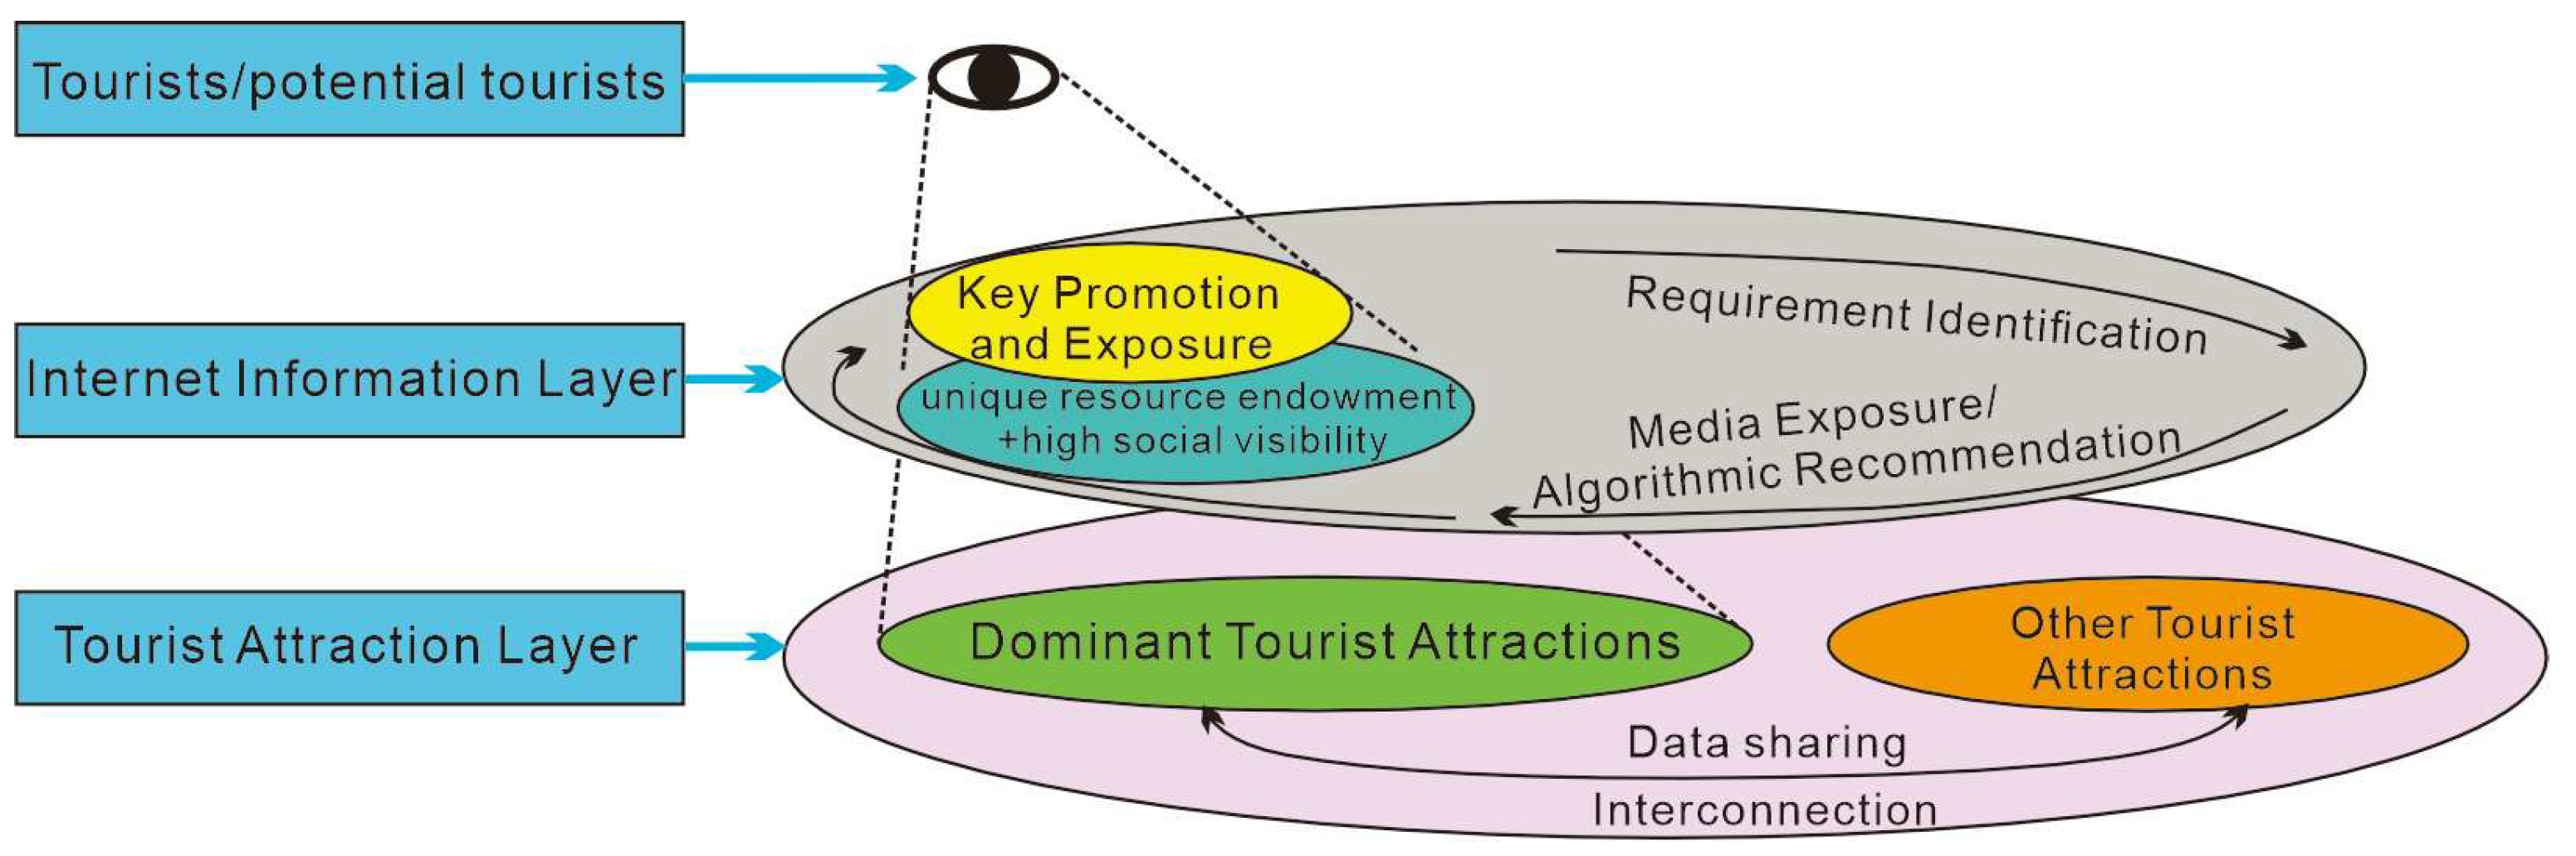
The competition for online attention among Beijing’s 5A–level tourist attractions reflects a complex interplay of digital information dynamics, consumer behavior, and market signals, resulting in persistent polarization and frequent fluctuations in visibility. These patterns arise from ongoing interactions among tourists, online content producers, and algorithmic platforms within the “tourists–information producers–attractions” cycle (Figure 5). Over time, this cycle reinforces monopolistic attention structures, where a small number of high-profile attractions consistently dominate online visibility.
Figure 5.
Mechanism Diagram of Online Attention Monopoly.
Algorithm-driven information environments play a central role in shaping these dynamics. The concept of information cocoons suggests that users are repeatedly exposed to preference-aligned content, which can limit encounters with alternative destination information and amplify polarization in tourism decision-making. Empirical research indicates that algorithmically curated tourism content and personalized search results influence destination visibility and competitive positioning by selectively prioritizing certain attractions over others [34,35]. In the context of Beijing’s 5A–level tourist attractions, this mechanism is clearly observable. Highly iconic attractions such as the Forbidden City and the Summer Palace tend to dominate algorithmically curated travel content, social media recommendations, and search results, reinforcing their already strong visibility and symbolic status (Figure 4). As users frequently encounter content related to these “must-see” destinations (including a, b, and d in Figure 4), their travel preferences become further concentrated, while less prominent sites (including c, e, f, g, and h in Figure 4)—such as the Olympic Park—receive comparatively limited exposure despite its strong sporting symbolism and heritage value. These processes resemble the Matthew Effect, whereby attractions with higher initial visibility accumulate disproportionate attention and resources over time, generating cumulative advantages and entrenched disparities in online presence. From a sustainability perspective, such concentration of online attention is potentially consequential when it translates into uneven visitor flows (Figure 5). A key concern associated with highly concentrated visitation patterns is overtourism, defined as tourism impacts that exceed the social, environmental, or infrastructural capacities of a destination, thereby undermining resident well-being and visitor experience quality [36,37,38]. While concentrated digital attention does not inherently lead to overtourism, it may act as an upstream mechanism that channels demand toward already saturated attractions, exacerbating existing pressures.
Nevertheless, the present study relies on data from a single digital platform and does not establish direct empirical links between online attention metrics and specific sustainability indicators such as congestion levels, environmental stress, or resident attitudes. As such, claims regarding sustainability implications should be interpreted cautiously. Future research could address these limitations by integrating multi-platform digital attention data with empirical measures of overtourism impacts, including visitor density statistics, environmental monitoring indicators, and community sentiment surveys. Clearly distinguishing normative arguments from empirically supported conclusions will be essential for strengthening the evidence base of sustainability-oriented tourism research.
Within this context, the NACS model provides a useful framework for translating insights from online attention dynamics into destination management practice. Beyond classifying attractions according to their attention trajectories, the model offers guidance for demand–redistribution strategies aimed at mitigating attention monopolies and associated visitation pressures. For example, while “Star/GC” attractions often benefit from sustained visibility but face heightened overcrowding risks, “Infant” attractions with high B values exhibit strong growth potential despite relatively low current exposure. Strategically enhancing the visibility of such high-potential but under-visited attractions—through official tourism platforms, targeted digital promotion, and collaboration with content and platform providers—can help redistribute marginal demand and promote more balanced spatial and temporal visitation.
In summary, online attention dynamics among Beijing’s 5A–level attractions are shaped by algorithmic filtering and consumer behavior, leading to competitive polarization and volatility. Situating these dynamics within the NACS framework clarifies how digital attention analysis can inform more adaptive and sustainability-oriented destination management strategies, while also highlighting the need for further empirical validation of sustainability outcomes.
5. Conclusions
This study develops a two-dimensional framework to evaluate online attention competition among tourism destinations using Baidu Index data. By integrating the Boston Matrix method with the coefficient of variation, it analyzes online attention dynamics for Beijing’s 5A–level tourist attractions from 2011 to 2025. The framework captures both attention magnitude and temporal change, providing a replicable approach for comparing destination visibility. The results show clear polarization in online attention. A small number of iconic attractions consistently dominate digital visibility, while many lesser-known sites receive unstable and limited attention. This pattern reflects cumulative effects of algorithmically mediated information environments and consumer behavior. Online attention is also highly sensitive to external shocks: the COVID-19 pandemic caused sharp declines in 2020, followed by an uneven recovery after 2023, highlighting the volatility of digital attention systems. The study further demonstrates the managerial value of the NACS framework for sustainable destination management. By classifying attractions according to attention levels and growth trajectories, the framework supports differentiated demand–redistribution strategies. Promoting high-potential “Infant” attractions can help redirect demand away from overcrowded “Star/GC” sites and encourage more balanced visitation patterns. Overall, this study advances understanding of digital attention dynamics and destination competitiveness while offering a transparent and quantitative tool for evidence-based destination management. Limitations include reliance on a single platform and the absence of direct sustainability indicators. Future research should integrate multi-platform data and link online attention metrics to empirical measures of tourism sustainability.
Author Contributions
Formal analysis, Data curation, Methodology, project administration, C.Y.; Writing—original draft, review & editing, G.Y.; Investigation, J.L. All authors have read and agreed to the published version of the manuscript.
Funding
This research was supported by 2022 Undergraduate Teaching Construction and Reform Project of Capital Normal University (Grant number [011-2255050]), Beijing Municipal Natural Science Foundation (Grant number [8162038]) and Research and Development Project for Geological Study Tour Products in Longnan.
Institutional Review Board Statement
Not applicable.
Informed Consent Statement
Not applicable.
Data Availability Statement
The data presented in this study are available on request from the corresponding author.
Acknowledgments
We extend our sincere gratitude to C.S. Huang and H.X. Peng for their invaluable and critical comments, which have greatly contributed to the improvement of this study.
Conflicts of Interest
The authors declare no conflict of interest.
References
- Gretzel, U.; Fesenmaier, D.R.; Formica, S.; O’Leary, J.T. Searching for the future: Challenges faced by destination marketing organizations. J. Travel Res. 2006, 45, 116–126. [Google Scholar] [CrossRef] [Scilit]
- Xiang, Z.; Gretzel, U. Role of social media in online travel information search. Tour. Manag. 2010, 31, 179–188. [Google Scholar] [CrossRef] [Scilit]
- Leung, D.; Law, R.; van Hoof, H.; Buhalis, D. Social media in tourism and hospitality: A literature review. J. Travel Tour. Mark. 2015, 30, 3–22. [Google Scholar] [CrossRef] [Scilit]
- Gretzel, U.; Sigala, M.; Xiang, Z.; Koo, C. Smart tourism: Foundations and developments. Electron. Mark. 2015, 25, 179–188. [Google Scholar] [CrossRef] [Scilit]
- Martins, W.S.; Martins, M.; Morais, E.P. Exploring the influence of social media on tourist decision making: Insights from Cape Verde. Tour. Hosp. 2025, 6, 45. [Google Scholar] [CrossRef] [Scilit]
- Xiang, Z.; Du, Q.; Ma, Y.; Fan, W. A comparative analysis of major online review platforms: Implications for social media analytics in hospitality and tourism. Tour. Manag. 2017, 58, 51–65. [Google Scholar] [CrossRef] [Scilit]
- Li, H.Q.; Hui, Y.J.; Dai, S.S.; Pan, J.Y. Spatiotemporal evolution of network attention of 5A tourist attractions and its influencing factors in China. Ecotourism 2024, 14, 151–166. (In Chinese) [Google Scholar]
- Lu, L.-J.; Dai, X.-Y. Hunan tourism destination cities: Tourist network attention and spatial patterns based on Baidu Index. Yangtze Basin Resour. Environ. 2020, 29, 836–849. (In Chinese) [Google Scholar]
- Liu, Y.; Liao, W. Spatial characteristics of tourism flows in China: A study based on Baidu Index. ISPRS Int. J. Geo-Inf. 2021, 10, 378. [Google Scholar] [CrossRef] [Scilit]
- Xu, Y.; Chen, L.; Wang, F. Dynamic evolution and spatial differences of network attention in Wuzhen Scenic Area. J. Jiangsu Dev. Plan. 2020, 29, 836–849. (In Chinese) [Google Scholar]
- Li, J.; Li, Z.; Zhang, Y. Online attention of Beijing 5A–level tourist attractions based on Baidu Index. Hans Publ. J. 2021, 4, 25–35. (In Chinese) [Google Scholar]
- Li, H.; Liao, J. Online attention and tourism competition: Mechanisms and effects. Tour. Res. J. 2021, 15, 89–106. (In Chinese) [Google Scholar]
- Zhang, Y.; Li, X.; Chen, Q. Evolution of tourism market competition at the provincial level in China. Tour. Trib. 2017, 32, 44–53. (In Chinese) [Google Scholar]
- Long, M.; Liu, Q.; Zhang, T. Relationship between online attention and actual tourist volumes: Evidence from Sichuan Province. Tour. Econ. 2020, 26, 1165–1182. (In Chinese) [Google Scholar]
- Pan, L.; Dai, X. Spatiotemporal patterns and factors influencing tourism network attention. Yangtze Basin Resour. Environ. 2020, 29, 850–861. (In Chinese) [Google Scholar]
- Toral, S.L.; Martinex-Torres, M.R.; Gonzalez-Rodriguez, M.R. Identification of the Unique Attributes of Tourist Destinations from Online Reviews. J. Travel Res. 2017, 57, 908–919. [Google Scholar] [CrossRef] [Scilit]
- Assaf, A.G.; Li, G.; Song, H.; Tsionas, M.G. Modeling and forecasting regional tourism demand using the Bayesian Global Vector Autoregressive (BGVAR) Model. J. Travel Res. 2018, 58, 383–397. [Google Scholar] [CrossRef] [Scilit]
- Yang, X.; Pan, B.; Evans, J.A.; Lv, B. Forecasting Chinese tourist volume with search engine data. Tour. Manag. 2019, 73, 1–12. [Google Scholar] [CrossRef] [Scilit]
- Liu, C.H.; Horng, J.S.; Chou, S.F.; Yu, T.Y.; Huang, Y.C.; Lin, J.Y. Integrating big data and marketing concepts into tourism, hospitality operations and strategy development. Qual. Quant. 2023, 57, 1905–1922. [Google Scholar] [CrossRef] [Scilit]
- Song, H.; Qiu, R.T.R.; Park, J. A review of research on tourism demand forecasting: Launching the Annals of Tourism Research curated collection on tourism demand forecasting. Ann. Tour. Res. 2018, 75, 338–362. [Google Scholar] [CrossRef] [Scilit]
- Sun, Y.; Zhang, J.; Li, X.; Wang, S. Forecasting tourism demand with a new time–varying forecast averaging approach. J. Travel Res. 2021, 62, 305–323. [Google Scholar] [CrossRef] [Scilit]
- Zhou, X.; Liu, Y.; Yang, F. Big data analytics in tourism: Applications and implications. J. Hosp. Tour. Technol. 2021, 12, 287–303. (In Chinese) [Google Scholar]
- Mehraliyev, F.; Chan, I.C.C.; Kirilenko, A.P. Sentiment analysis in hospitality and tourism: A thematic and methodological review. Int. J. Contemp. Hosp. Manag. 2021, 34, 46–77. [Google Scholar] [CrossRef] [Scilit]
- Guidotti, D.; Pandolfo, L.; Pulina, L. Discovering sentiment insights: Streamlining tourism review analysis with Large Language Models. Inf. Technol. Tour. 2025, 27, 227–261. [Google Scholar] [CrossRef] [Scilit]
- Liu, H.; Wang, Y.; Chen, F. Algorithmic personalization and online attention in tourism. Comput. Hum. Behav. 2022, 129, 107141. [Google Scholar]
- Li, H.; Sun, X. Tourism market competition strategies in the digital era. J. Mark. Sci. 2002, 8, 45–60. (In Chinese) [Google Scholar]
- Li, X.; Sun, B. Tourism competition strategies: Concepts and applications. Tour. Manag. 2002, 23, 457–469. (In Chinese) [Google Scholar]
- Zarezadeh, Z.; Benckendorff, P.; Gretzel, U. Online tourist information search strategies. Tour. Manag. Perspect. 2023, 46, 101–112. [Google Scholar] [CrossRef] [Scilit]
- Huang, H.P.; Zhong, W.; Lai, Q.S.; Chou, Y.H.; Jiang, H. The spatial distribution, influencing factors, and development path of inbound tourism in China—An empirical analysis of market segments based on travel motivation. Sustainability 2020, 12, 2508. [Google Scholar] [CrossRef] [Scilit]
- Mariani, M.; Platanakis, E.; Stafylas, D.; Sutcliffe, C. Identifying a destination’s optimal tourist market mix: Does a superior portfolio model exist? Tour. Manag. 2023, 96, 104722. [Google Scholar] [CrossRef] [Scilit]
- Zhao, S.; Kong, Y.; Yang, Y.; Li, J. The influencing mechanism of scenic spot online attention and tourists’ purchase behavior: An AISAS model based investigation. Front. Psychol. 2024, 15, 1386350. [Google Scholar] [CrossRef] [Scilit]
- Zhang, Y.; Li, Y. Regional differences in tourism eco-efficiency in the Beijing–Tianjin–Hebei Region. Sustainability 2023, 15, 2907. [Google Scholar] [CrossRef] [Scilit]
- Shechtman, O. The Coefficient of Variation as an Index of Measurement Reliability. In Methods of Clinical Epidemiology; Doi, S., Williams, G., Eds.; Springer Series on Epidemiology and Public Health; Springer: Berlin/Heidelberg, Germany, 2013. [Google Scholar]
- Zhang, Y.; Jin, X.; Wang, Y.; Liu, R.; Jing, Y. Characterizing spatial-temporal variation of cultural tourism internet attention in Western Triangle Economic Zone, China. Land 2022, 11, 2221. [Google Scholar] [CrossRef] [Scilit]
- Huang, G.Q.I.; Wong, I.K.A.; Zhou Torres, W.C.; Davari, D.; Xie, H. Understanding destination information cocoons and polarization of travel attitude and intention: How can travel experiences mitigate bias? Tour. Manag. 2025, 107, 105075. [Google Scholar] [CrossRef] [Scilit]
- Gong, Y.; Schroeder, A.; Pan, B.; Sundar, S.S.; Mowen, A.J. Does algorithmic filtering lead to filter bubbles in online tourist information searches? Inf. Technol. Tour. 2024, 26, 183–217. [Google Scholar] [CrossRef] [Scilit]
- Mihalic, T. Conceptualising Overtourism: A Sustainability Approach. Ann. Tour. Res. 2020, 84, 103025. [Google Scholar] [CrossRef] [Scilit]
- Santos-Rojo, C.; Llopis-Amorós, M.P.; García-García, J.M. Overtourism and sustainability: A bibliometric study (2018–2021). Technol. Forecast. Soc. Change 2023, 188, 122285. [Google Scholar] [CrossRef] [Scilit]

Disclaimer/Publisher’s Note: The statements, opinions and data contained in all publications are solely those of the individual author(s) and contributor(s) and not of MDPI and/or the editor(s). MDPI and/or the editor(s) disclaim responsibility for any injury to people or property resulting from any ideas, methods, instructions or products referred to in the content. |
© 2026 by the authors. Licensee MDPI, Basel, Switzerland. This article is an open access article distributed under the terms and conditions of the Creative Commons Attribution (CC BY) license.