


Abstract
Qinghai Province shoulders the heavy responsibility of serving as China’s ecological security barrier. In the process of implementing the “ecological priority” strategy, the green development of grassland animal husbandry in Qinghai Province plays an especially important driving role. To systematically reveal the temporal and spatial evolution characteristics and core driving mechanism of Green Total Factor Productivity (GTFP) and provide a decision-making basis for the green transformation and high-quality development of regional animal husbandry, this paper, based on relevant data from 2010 to 2024 in Qinghai Province, constructs a measurement and influencing factor index system for the GTFP of grassland animal husbandry. Then, it conducts a systematic analysis of the temporal evolution and spatial differentiation characteristics of the GTFP of grassland animal husbandry in Qinghai Province using methods such as trend surface analysis and standard deviation ellipse. Subsequently, the influencing factors are discussed through the geographic detector model. The research findings are as follows: (1) During the study period, the GTFP of grassland animal husbandry in Qinghai Province shows an overall upward trend. Spatially, it presents a regional pattern of “strong in the north and stable in the south,” with the migration center moving towards the northeast and the distribution becoming more concentrated. (2) The level of fiscal support for agriculture, accessibility of transportation, the degree of environmental governance and the degree of digitalization play core driving roles in the process of GTFP climbing in grassland animal husbandry. (3) Interaction analysis shows that the explanatory power of any two influencing factors in the study area is higher than that of a single factor, and the interaction between the level of fiscal support for agriculture and the degree of environmental governance is the most significant. Therefore, the key to improving the GTFP of grassland animal husbandry in Qinghai Province lies in the coordinated allocation and linkage of financial support for agriculture and environmental governance. At the same time, this study can provide reference value for the green transformation and high-quality development of plateau grassland animal husbandry.
1. Introduction
The Third Plenary Session of the 20th Central Committee of the Communist Party of China positioned Chinese-style modernization as modernization that is harmonious with nature, emphasizing the necessity to improve the system of ecological civilization construction and to coordinate the advancement of carbon emission control, environmental pollution prevention, ecosystem protection, and green and low-carbon growth. Against this backdrop, the high-quality development of the grassland animal husbandry industry in Qinghai Province is not only related to the prosperity of regional industries and the improvement of people’s livelihoods but is also a key link in consolidating the national ecological security barrier and achieving green transformation. As one of China’s five major pastoral areas, Qinghai Province is rich in grassland resources with great development potential. The area of grasslands accounts for more than 56% of the total land area of the province, and its ecological conditions determine the overall ecological environment of the province. In 2024, Qinghai Province continued to implement the third round of the grassland ecological protection subsidy and reward policy, with over 4.7 billion yuan invested throughout the year, covering a wide area, mainly including tens of millions of mu of grasslands in places such as Hainan Prefecture and Golmud City. This differentiated grazing subsidy and grass–herb balance reward policy effectively promoted the coverage of comprehensive grassland vegetation, thereby alleviating the grazing pressure on natural pastures, initially curbing the overall trend of grassland degradation, improving biodiversity, and gradually restoring the ecological functions of grasslands. By the end of 2020, a total of 961 ecological animal husbandry cooperatives had been established in the province, absorbing 115,000 households of pastoralists, with the membership rate and grassland intensification rate both exceeding 66%, significantly enhancing the organizational configuration of resources and production efficiency. By the end of October 2025, the number of cattle and sheep in the province had reached 22,006,200, with a slaughter of 8,653,000, up 8.2% year-on-year. However, while the scale of grassland animal husbandry continues to expand, issues such as soil eutrophication and water pollution caused by concentrated discharge of animal waste and residual feed, especially in areas with overgrazing and inadequate supporting facilities, have emerged one after another, and the pressure on environmental carrying capacity is more prominent. In addition, heavy grazing will reduce the total carbon and nitrogen content in the soil, increase soil bulk density, and further weaken the self-repair capacity of grassland ecosystems. Therefore, Qinghai Province has implemented projects such as “Grain-to-Silage Conversion” and “High-quality and High-yield Alfalfa,” conducted in-depth research on the development of saline–alkali land for grass planting, and maintained a stable area of 153,300 hectares for forage planting throughout the province, effectively alleviating the grazing pressure on natural pastures and curbing the ecological deterioration of natural pastures. Therefore, evaluating the status of green development in grassland animal husbandry, advancing the transformation of economic development patterns within this sector, and fostering regional coordinated development have emerged as essential challenges in the pursuit of high-quality development in Qinghai Province.
In 1957, Robert Solow introduced Total Factor Productivity (TFP), also known as Solow Residual Value, which quantitatively constructed the accounting framework for output growth rate, factor input growth rate, and TFP growth rate, marking a significant milestone [1]. Since then, the understanding of the connotation of TFP has been continuously deepened, recognizing that it encompasses not only a narrow sense of technological progress but also a comprehensive reflection of various factors, such as resource allocation, efficiency improvement, organizational innovation, and scale effects [2]. With the deepening of the concept of sustainable development, GTFP incorporates resource consumption and environmental pollution as undesirable outputs into its accounting framework on this basis, becoming a key indicator for measuring green development and sustainability [3]. To sum up, the TFP measures the overall technical level or efficiency, represented by the ratio of total output to total factor input, which is derived from the frontier theory of production [4]. In contrast, the GTFP considers the conversion efficiency under the constraints of resources and the environment. Therefore, to accurately measure the GTFP with unexpected output, this study combines the EBM model proposed by Tone and Tsutsui [5] and the global Malmquist–Luenberger index proposed by Oh [6] and calculates the GML index based on measuring the directional distance function of decision-making units relative to the global common frontier. This index can effectively measure the dynamic change of GTFP, decompose it into technical efficiency change and technical progress, and ensure the intertemporal results.
The research on the green development of animal husbandry abroad can be divided into quantitative research and qualitative research from the perspective of research methods. Quantitative research is the mainstream approach for evaluating the green production efficiency of animal husbandry. Its core lies in defining and estimating a production frontier representing best practices, which can be mainly classified into parametric and nonparametric methods according to different methods. The core difference between the two is that the parameter method needs to set the specific production function form in advance, but this may lead to setting errors; The nonparametric method does not need to be set in advance and directly constructs the production frontier through the data itself and has the flexibility to handle multiple inputs and outputs at the same time. In the application of parametric methods, stochastic frontier analysis is the core, and the commonly used production functions are the Cobb–Douglas production function (C-D function) and its extended form, the translog production function. For example, Asante [7] used the classic C-D function to measure the production efficiency of different agricultural systems, such as livestock and integrated crop-livestock systems of Ghanaian small farmers. In contrast, Alem [8] made a significant contribution by applying a stochastic input distance function and a translog model to evaluate the GTFP of Norwegian dairy farms. This model relaxes the strong assumption of the C-D function regarding fixed substitution elasticity and can better fit complex production technology. Subsequently, Alem further applied a dynamic model to measure ecological efficiency, revealing that ignoring dynamic characteristics may lead to a biased evaluation of the ecological efficiency of dairy farms [9]. In the application of nonparametric methods, the DEA model and its extended form are mainly used. For example, a study on the Brazilian beef cattle production system uses two different DEA BCC models to evaluate the economic, social, and environmental performance of the production system. Madau et al. [10] used the DEA–Malmquist index to decompose the TFP change of European dairy farms into technical efficiency change and technical progress, while Asante et al. [11] used the Färe–Primont index method to evaluate and decompose the farming system’s efficiency of Ghana’s small farmers’ crops, which provided a reference for understanding the source of productivity growth. In addition, the Fisher index is used to measure the TFP of dairy farms in Northern Ireland, and a fixed-effects econometric model is further employed to explore the factors influencing TFP. Beyond the quantitative frontier analyses discussed above, qualitative approaches—such as case studies and systematic reviews—also offer crucial, multidimensional support for understanding the green development of animal husbandry. For example, through case studies of several typical systems worldwide, Ickowicz [12] evaluates animal husbandry systems across production, social, environmental, and local development dimensions, summarizing key insights and experiences. Chase [13] summarized that accurate feed management can reduce pollution emissions and improve the environmental and economic benefits of feed utilization in dairy farming. Ni [14] discusses the specific practices and strategies of decarbonization in the dairy industry’s supply chain. These studies provide a solid practical basis and strategic thinking for discussing the green development of animal husbandry.
Under the current background, academic discussions on the GTFP of animal husbandry are mainly conducted at the national macro-level or within the framework of general regional analysis, focusing on two dimensions: development trends and influencing factors. In terms of development trends, some studies use the non-expected output SBM–Malmquist index model to measure and decompose the GTFP of animal husbandry, aiming to describe the temporal characteristics of GTFP in animal husbandry [15]. This research finds that the GTFP of animal husbandry shows an overall upward trend [16], and further in-depth analysis of its composition finds that most studies believe that pure technological progress is the core driving force for the improvement of GTFP in animal husbandry [17,18]. Another segment of the research, grounded in the measurement, conducts an analysis of the regional disparities and agglomeration effects of GTFP in animal husbandry from the perspective of spatial economics, thus delineating the spatial characteristics of green development in animal husbandry [19,20]. Most studies find that the green development efficiency of animal husbandry in the eastern region of China is generally better than that in the western region [21]. In addition, spatial autocorrelation analysis shows that the GTFP of animal husbandry exhibits a significant agglomeration effect. Moreover, under the influence of spatial effects, this agglomeration effect is enhanced [22]. In terms of discussing the influencing factors of GTFP in animal husbandry, existing research is mostly based on theoretical and empirical analysis to form a relatively systematic cognitive framework, mainly from four aspects: policy intervention [23], technological progress [24], structural characteristics [25], and system synergy [26]. Policy intervention is considered a key exogenous driver. Still, it encourages technological innovation and behavior adjustment through means such as cost internalization and ecological compensation, but the effectiveness of policies is highly dependent on the matching degree between regulation intensity and regional resource endowments [27,28]. Technological progress is the intrinsic core for the improvement of GTFP, so when green technological progress is relatively lagging, it can optimize the coupling effect of the production system through technological innovation and the application of digital technology [29]. At the structural level, the impact of scale management and industrial agglomeration on GTFP shows a dual nature, and its effect is constrained by the level of pollution control and shows significant spatiotemporal heterogeneity, highlighting the necessity of formulating differentiated regional strategies [30]. Therefore, the fundamental way to continuously improve the GTFP lies in alleviating the contradictions between grass and animal husbandry, promoting the coordinated progress of the ecological economy through circular agricultural models such as grass-roots and animal husbandry balance management and a combination of planting and breeding, and thus building a systemic and long-term green growth mechanism.
However, the existing empirical analysis is generally based on national macro-level or provincial panel data [31,32] and mostly adopts the division of main producing areas or non-main producing areas [33,34], aiming to reveal the overall trend and regional differences. This macro perspective is very important for understanding the universal law. Still, it is difficult to fully reflect some specific areas facing special situations, so the research on grassland animal husbandry in Qinghai Province may be limited: on the one hand, as a high-altitude pastoral area, the development of grassland animal husbandry in Qinghai has unique geographical environment, resource endowment, and ecological constraint characteristics, and the existing general studies at the national level are difficult to fully reflect the particularity of Qinghai Province; on the other hand, there are significant differences in the development level of grassland animal husbandry among various regions within Qinghai Province, but systematic research on the internal differences of this region is relatively lacking. Therefore, scientifically measuring the GTFP of grassland animal husbandry in Qinghai Province, deeply analyzing its spatiotemporal evolution characteristics and regional differences, and identifying key influencing factors is of great theoretical and practical significance for promoting the green high-quality development of grassland animal husbandry in Qinghai Province and achieving the coordinated advancement of ecological protection and animal husbandry development.
Therefore, this paper, based on relevant data of Qinghai Province’s grassland animal husbandry industry from 2010 to 2024, constructs a GTFP measurement model including unintended outputs, systematically analyzes the spatiotemporal evolution laws of Qinghai Province’s grassland animal husbandry industry’s GTFP, reveals typical facts of regional development differences, and deeply discusses the key factors affecting the GTFP of grassland animal husbandry. The aim is to provide a scientific basis for Qinghai Province to formulate differentiated grassland animal husbandry green development strategies, promote regional coordinated development, and provide decision-making references for achieving the high-quality development goal of ecological, production, and living “three wins”.
2. Research Area and Data Sources
2.1. Research Area
The Qinghai Province is located in the western part of China, in the northeast of the Qinghai–Tibet Plateau, with its geographical position ranging from 89°24′3″ to 103°04′10″ east longitude and 31°36′2″ to 39°12′45″ north latitude. The total length from east to west of the province is over 1200 km, and the total width from north to south is over 800 km. The overall area reaches 722,300 square kilometers, accounting for one thirteenth of China’s total area. The northern and eastern parts of Qinghai Province border Gansu Province; the northwestern part is adjacent to the Xinjiang Uyghur Autonomous Region; the southern and southwestern parts are contiguous to the Tibet Autonomous Region; and the southeastern part borders Sichuan Province, serving as a link between Tibet, Xinjiang, and the interior. Qinghai Province is one of China’s five major pastoral areas. As of 2024, the grassland area in Qinghai Province has reached 5.92 billion mu, accounting for 56.67% of the province’s land area and 14.92% of the national grassland area. The pastoral livestock industry in Qinghai Province is mainly distributed in the six ethnic autonomous prefectures of Haibei Tibetan Autonomous Prefecture, Huangnan Tibetan Autonomous Prefecture, Hainan Tibetan Autonomous Prefecture, Golog Tibetan Autonomous Prefecture, Yushu Tibetan Autonomous Prefecture, and Haixi Mongolian and Tibetan Autonomous Prefecture, abbreviated as Haibei Prefecture, Huangnan Prefecture, Hainan Prefecture, Golog Prefecture, Yushu Prefecture, and Haixi Prefecture in this study. The above six ethnic autonomous prefectures are used as the study area, and their spatial location and specific distribution range are shown in Figure 1.
Figure 1.
Geographical location of the study area.
2.2. Index Selection
Based on existing research [16,18], this paper constructs the input–output indicators of GTFP in the grassland animal husbandry industry in Qinghai Province. The input indicators include labor, intermediate consumption, capital investment, and natural resources, while the output indicators include expected output and unexpected output. The details are shown in Table 1. In addition, based on existing research [35,36] and the current development status of the grassland animal husbandry industry in Qinghai Province, this paper takes the GTFP of the grassland animal husbandry industry in Qinghai Province from 2010 to 2024 as the dependent variable. It follows the principles of systematics, multidimensionality, and dynamics to construct an indicator system covering four dimensions of “industry, economy, society, technology and environment”. This system includes 11 specific indicators. The purpose of this system is to explain the pathways and mechanisms by which various factors affect the transformation of the grassland animal husbandry industry. In the industry dimension (X1–X3), this study selects three indicators: the degree of agglomeration of the animal husbandry industry, industrial structure, and breeding scale, to depict the guiding role of the organizational form, composition, and intensive production level of the grassland animal husbandry industry in Qinghai Province in the low-carbon emission transformation. The economic dimension (X4–X6) focuses on the level of fiscal support for agriculture, the level of economic development, and the living standards of rural residents to analyze the driving mechanism of the support strength of the grassland animal husbandry policy in Qinghai Province, the economic foundation level of the research area, and the demand for the improvement of the people’s livelihood of pastoralists to promote the sustainable development of the grassland animal husbandry industry. The social dimension (X7–X8) covers the level of urbanization and the degree of transportation accessibility, revealing the key impact of the evolution of the urban–rural structure and the connectivity of infrastructure in the research area of Qinghai Province on the production layout of the grassland animal husbandry industry and the efficiency of resource circulation. The science and technology and environment dimension (X9–X11) uses three indicators: the degree of environmental governance, the intensity of scientific and technological investment, and the degree of digitalization to clarify the systematic empowerment role of the pollution control capacity, technological innovation support, and intelligent transformation in the research area of Qinghai Province for the green and low-carbon development of the grassland animal husbandry industry. Detailed statistical descriptions are shown in Table 2.
Table 1.
GTFP input–output index system of grassland animal husbandry in Qinghai Province.
Table 2.
Explanation and description of factors affecting GTFP in Qinghai Province pastoralism.
2.3. Data Sources and Processing Process
This paper selects the relevant data of six ethnic autonomous prefectures of grassland animal husbandry in Qinghai Province from 2010 to 2024 as the research sample. The sample data mainly come from the Statistical Yearbook of Qinghai, the Statistical Yearbook of Golog Tibetan Autonomous Prefecture, the Statistical Yearbook of Haibei, the Statistical Yearbook of Hainan, the Statistical Yearbook of Haixi, the Statistical Yearbook of Huangnan, the Statistical Yearbook of Yushu Prefecture, the Qinghai Survey Yearbook, and the statistical bulletins of national economic and social development of Qinghai Province and the six prefectures. Unregistered indicators are supplemented by professional platforms such as the EPS database, and individual missing years are estimated by the linear interpolation method (the interpolation ratio of observed values is about 5%). The loss rate used by the perpetual inventory system in this paper refers to the research of Xu et al. [18], and the depreciation rate of equity is 5.42%.
The NDVI and NPP data of grasslands in six pastoral autonomous prefectures in Qinghai Province from 2010 to 2024 are used in this study, and the core remote sensing data are all from the National Aeronautics and Space Administration (NASA) data center (https://www.earthdata.nasa.gov/, accessed on 24 August 2025). Among them, NDVI data come from the MODIS product MOD13Q1 V061 dataset, which has a spatial resolution of 250 m and a temporal resolution of 16 days. NPP data, on the other hand, come from the MOD17A3HGF V061 dataset, which has a spatial resolution of 500 m and is interannual synthetic data. In addition, the annual land cover dataset of China (CLCD) with a spatial resolution of 30 m was proposed by Yang et al. [37]. The specific data processing flow is as follows: First, the original HDF data is processed using the Modern Resolution Imaging Spectro Radiometer (MODIS) (Nasa, Greenbelt, MD, USA) Projection Tools (MRTs) (Nasa, Greenbelt, MD, USA), which includes extracting scientific datasets, converting SIN into the WGS84 geographic coordinate system, and converting it into Geo TIFF format. To obtain the annual NDVI data, this study uses the maximum synthesis method to process the annual image data, which effectively reduces the noise interference caused by clouds and atmospheric conditions. Secondly, the grassland type data are extracted based on CLCD, and an annual binary mask is generated and resampled to a spatial resolution matching the NDVI and NPP data. Then, the annual NDVI and NPP data are superimposed with the grassland mask of the same year in ArcGIS software to extract the grassland pixel value. Finally, based on the state-level administrative boundary, the annual average value of all effective grassland pixels in each region is calculated to obtain the panel data of NDVI and NPP (unit: gC m−2 a−1) for each state, year by year.
3. Research Methods
3.1. Super-EBM Model
The Super-EBM model is an integrated method for calculating efficiency with both radial and non-radial characteristics. It achieves a relatively flexible and precise measurement of decision-making units (DMUs) by introducing key parameters ε and slack variables for input, expected output, and non-expected output into the objective function. An important feature of this model is its flexibility: when the parameter ε is 0, the model is equivalent to a radial model; when both θ and ε are 1, the model becomes a non-radial EBM model, allowing for flexible switching between radial and non-radial based on actual needs. This can better fit the actual production frontier and correct the shortcomings of traditional DEA models that ignore slack variables. At the same time, the Super-EBM model can achieve efficiency values exceeding 1 for effective DMUs, further distinguishing and ranking efficient units on the efficiency frontier [5,38]. The specific formula is as follows:
In this formula, k represents the total number of decision-making units, γ is the optimal efficiency value obtained by solving the model, and its numerical size directly reflects the efficiency level of the DMU. When γ ≥ 1, it is considered that the DMU is efficient, and the larger the γ* value, the higher the efficiency. The variables involved in the model include the input xik of the kth DMU, the expected output yrk, and the non-expected output btk, as well as the slack variables , , and corresponding to these three types of indicators, and , , and respectively represent the weights of input, expected output and unexpected output indicators. θ and φ are the planning parameters of the radial part.
The weights of input, expected output, and unexpected output variables in the super-efficient EBM-GML model used in this study need to be set in advance. The details are as follows: Eliminate the influence of dimension; the original data is dimensionless due to the normalization method. Then, to ensure the objectivity of weighting, the entropy weight method is used to calculate the intra-group weights of the processed input indicators and unexpected output indicators. The weights of each indicator should meet the constraints that the intra-group sum is 1, while the expected output is only a single variable, so its weight can be directly set to 1. Finally, the calculated weights are substituted into the super-efficient EBM-GML model for calculation.
3.2. GML Index
The GML (Global Malmquist–Luenberger) index is mainly used to measure the growth of TFP in the presence of unexpected output. In the actual measurement process, the traditional ML index often faces the problem of no solution, while the GML index effectively solves this problem by constructing a global production possibility set covering all periods, ensuring the continuity and cross-period comparability of the measurement results. Referring to the research results of Oh [6], this paper constructs a GML index based on the EBM (Epsilon-Based Measure) directional distance function, which can realize the intertemporal comparison of efficiency levels in different periods. Under environmental constraints, the index can further identify the respective contributions of output growth and pollution reduction, comprehensively clarify the growth drivers of GTFP, formulate relevant policies for evaluating the quality of economic development in the background of sustainable development, and provide reliable methodological support. The specific formula is as follows:
The GML productivity index is the index of GTFP, which indicates whether the GTFP of decision-making units has improved in the t + 1 period compared with the T period; that is, it reflects the growth rate of GTFP.
3.3. Trend Surface Analysis
Trend surface analysis is a multivariate regression analysis method based on spatial coordinates, with the core idea of using mathematical surfaces to simulate the distribution laws and changing trends of geographical elements in space. This method converts discrete sampling points into a continuous and smooth three-dimensional surface through global polynomial fitting, thereby effectively separating the overall trend and local residual characteristics of spatial data [39]. The application formula is usually expressed as:
where Z is the dependent variable, represented by the GTFP of Qinghai Province’s grassland animal husbandry; x and y are the spatial coordinate independent variables; f(x, y) is the fitted trend surface function; and ε is the residual term, representing local variation and random fluctuations. Through this analysis, not only can the macrospatial differentiation pattern of the GTFP of Qinghai Province’s grassland animal husbandry be intuitively revealed, but local abnormal areas can also be identified through residual analysis.
3.4. Standard Deviation Ellipse
Standard Deviational Ellipse (SDE) is a classic spatial statistical method proposed by the American sociologist Lefever in 1926. It quantifies the overall characteristics and evolutionary trends of the spatial distribution of geographic elements by constructing an elliptical model. This elliptical model is based on the assumption of spatial normal distribution and forms a distribution range that covers a specified proportion of elements by calculating the standard deviation of point data around the mean center, thereby intuitively revealing the multidimensional characteristics of its spatial pattern. The key parameters of the ellipse include the centroid coordinates, which reflect the distribution center position. The semi-major axis represents the degree of dispersion in the main trend direction, the semi-minor axis depicts the range of aggregation in the vertical direction, and the azimuth quantifies the distribution deviation. In addition, the flattening ratio, defined as the ratio of the semi-major to the semi-minor axis, can further measure the directionality and significance; the greater the flattening ratio, the more obvious the directionality of the data distribution [40,41]. The formula is:
where, and represent the original spatial coordinates of the ith geographic element, is the weight of the ith spatial unit, is the central coordinate of the spatial distribution of the GTFP of grassland animal husbandry in Qinghai Province, respectively represent the coordinate deviation from the average center to the location of each prefecture, is the rotation angle of the major axis of the ellipse. is the standard deviation in the direction of the major axis of the ellipse, representing the degree of dispersion of the element along the dominant direction. is the standard deviation in the direction of the minor axis of the ellipse, which represents the degree of dispersion of the element along the vertical direction, and represents the main trend direction of the spatial distribution of geographic elements.
3.5. Geographical Detector
A geographical detector is a statistical method that quantifies the driving forces of spatial heterogeneity by comparing the within-layer variance with the total variance. It mainly includes factor detectors for measuring the independent explanatory power of a single factor and interaction detectors for analyzing the synergistic or antagonistic relationships between multiple factors. This study applies it to the analysis of the GTFP driving mechanism of the grassland animal husbandry industry in Qinghai Province, unifying the dependent and independent variables to a grid scale and determining the best discretization method of independent variables by quantile classification; then, through factor detectors, it identifies the dominant influencing factors and, further, with the help of interaction detectors, reveals the synergistic or antagonistic relationships among the factors, thus systematically analyzing the intrinsic driving forces of its spatial heterogeneity [42,43]. The specific formula is as follows:
Among them, q is the explanatory degree of each influencing factor to the spatial difference of coupling coordination, and its value is between 0 and 1. The closer to 1, the stronger the explanatory power of this factor to the spatial difference of coupling coordination. L indicates the type of each factor; N is the total number of samples; Nh is the sample size of the h layer; σ2 is the sample variance; is the sample variance of the h layer.
3.6. Method Flow Chart
In order to visually present the application logic and function of the above research methods, this paper constructs a method flow chart, as shown in Figure 2.
Figure 2.
Flow chart of research method.
4. Results and Analysis
4.1. Spatial and Temporal Differentiation of GTFP in Qinghai Province Grassland Animal Husbandry
To analyze the temporal and spatial distribution characteristics of the GTFP of grassland animal husbandry in Qinghai Province from 2010 to 2024, this study divided it into four grade intervals and visually displayed it in ArcMap 10.8.1, as shown in Figure 3. The overall characteristics of the temporal evolution of GTFP in Qinghai Province’s grassland animal husbandry show a significant upward trend, indicating that significant achievements have been made in the green transformation and sustainable development of Qinghai Province’s grassland animal husbandry. This is attributed to China’s emphasis on ecological protection as the core premise for the development of grassland animal husbandry. Through the implementation of policies such as the grassland–livestock balance and determining livestock based on grassland, grazing pressure on natural grasslands has been effectively alleviated. In 2010, the GTFP of grassland animal husbandry in all prefectures of Qinghai Province was almost within the range of 0.721999 to 0.950786, with a low GTFP. With the advancement of various policies and the efforts of the Qinghai Provincial Government, by 2024, the GTFP of grassland animal husbandry in all prefectures of Qinghai Province had been improved. Yushu Prefecture, located in a high-altitude, ecologically fragile area, had a smaller increase. At the same time, the GTFP of grassland animal husbandry in the other prefectures was all greater than 1, achieving rapid growth.
Figure 3.
Spatial evolution characteristics of GTFP in Qinghai Province’s grassland animal husbandry from 2010 to 2024.
From the perspective of spatial distribution patterns, the GTFP of the grassland animal husbandry in Qinghai Province shows significant regional differentiation characteristics. Firstly, grassland animal husbandry GTFP in Haixi, Haibei, and Huangnan Prefectures has grown most rapidly, with significant growth potential. This phenomenon is mainly due to the three prefectures leading the reform of the cooperative system in the Qinghai Province ecological animal husbandry experimental area through the methods of “pasture tenancy rights and livestock valuation for shares”, organizing scattered pastoral households, and achieving large-scale and intensive management. Secondly, the GTFP of grassland animal husbandry in Hainan Prefecture has remained relatively stable, remaining around 0.91 from 2010 to 2024. This is mainly due to Hainan Prefecture’s smooth transition from traditional extensive animal husbandry to intensive and intelligent ecological animal husbandry under the rigid constraint of ecological protection through systematic institutional innovation, technological empowerment, and industrial integration. Although the GTFP of grassland animal husbandry in each prefecture of Qinghai Province is developing well, Yushu Prefecture has developed relatively slowly. This may be due to Yushu Prefecture, as the core area of the Sanjiangyuan National Park and a key ecological protection area, facing more severe ecological red line constraints and the difficulty of balancing industrial development. Therefore, the path for improving its GTFP is more complex.
4.2. Analysis of the Spatiotemporal Dynamic Evolution of GTFP in Qinghai Province’s Grassland Animal Husbandry
Based on the ArcGIS 10.8 software, a spatial–temporal dynamic evolution analysis of the GTFP of the grassland animal husbandry industry in Qinghai Province from 2010 to 2024 was conducted using the trend surface analysis method. In Figure 4, the positive direction of the x-axis is set as the eastward direction, the positive direction of the y-axis corresponds to the northward direction, and the z-axis represents the high and low levels of the GTFP of the grassland animal husbandry industry in Qinghai Province. The curves obtained through trend surface fitting are represented by blue lines in the north–south direction and green lines in the east–west direction. The results show that the GTFP of the grassland animal husbandry industry in Qinghai Province generally increases from west to east and from south to north.
Figure 4.
Trend surface of GTFP in Qinghai Province grassland animal husbandry from 2010 to 2024.
Specifically, from 2010 to 2013, the GTFP of grassland animal husbandry in Qinghai Province exhibited an obvious inverted “U” distribution pattern in the north–south direction, a pattern of high in the middle and low in the south–north. With the gradual implementation of ecological protection policies and the adjustment of pastoral management methods, by 2016, the spatial pattern of GTFP in the north–south direction had changed. The northern region began to exceed the southern region, highlighting the preliminary advantages of the northern pastoral areas in resource optimization and technology application. In 2019, the north–south pattern further evolved into a positive “U” distribution, with both sides of the north and south rising and the middle relatively lower, reflecting the improvement in the sustainable pastoral practice of the north–south marginal areas. From 2022 to 2024, the indicator reappeared with a north-high–south-low distribution, indicating that the northern region continued to accumulate momentum in the process of green transformation, while the southern region, affected by natural conditions and changes in land use patterns, slowed its growth momentum, showing a regional gradient characteristic of “north strong and south stable”. In the east–west direction, in 2010 and 2013, a positive “U” distribution was presented, with both sides of the east and west high and the middle low, possibly due to the eastern region relying on the agricultural production foundation, promoting the three-element structure of grain, economy, and feed, supporting the increase in animal husbandry efficiency; the western Altun Mountain–Qaidam region was driven by ecological governance projects such as returning grazing land to grassland, with faster grassland recovery, reflecting the preliminary differentiation between traditional pastoral areas and emerging development regions. In 2016, the east–west pattern reversed to an inverted “U” distribution, with the GTFP of the central region significantly improving and the two wings relatively falling, possibly affected by the integration of pastoral resources and differences in regional support policies. With the Haibei Prefecture of Gangcha County becoming the core of the ecological animal husbandry experimental area through “grazing in pens + efficient breeding” technology, production efficiency jumped, while the east may be affected by market risks and the west, due to the strengthening of the national park system pilot, the short-term benefits declined. From 2019 to 2022, the high-value area in the east–west direction obviously moves westward, forming a west-high–east-low distribution, possibly due to the construction of the Sanjiangyuan National Park driving the tilt of ecological compensation funds and cooperatives integrating resources through “stock cooperation”, effectively improving the GTFP of grassland animal husbandry, making the western ecological pastoral area have significant effects under the promotion of green production technology and the ecological compensation mechanism. By 2024, the spatial pattern changed again, presenting an east-high–west-low distribution. This indicates that the eastern region gradually unleashed its potential in industrial upgrading and intensive management, and the regional center showed a trend of shifting from west to east, demonstrating a dynamic process of alternation between “westward advance” and “eastward prosperity”.
4.3. Spatial Changes in the GTFP of Pastoralism in Qinghai Province
In this study, with the help of ArcMap 10.8.1, the change characteristics of the center of gravity of GTFP of grassland animal husbandry in Qinghai Province were described through the standard deviation ellipse. Specifically, it can generate an ellipse graph by calculating the mean and standard deviation of data point sets and display the geographical spatial distribution pattern of GTFP of grassland animal husbandry in Qinghai Province in an intuitive ellipse shape to more clearly understand the concentration degree, dispersion degree and main distribution direction of GTFP of grassland animal husbandry in Qinghai and to grasp its spatial characteristics from a macro perspective. The long axis of the ellipse represents the degree of dispersion in the main distribution direction, with a longer long axis indicating greater differences in the region in that direction; the short axis represents the degree of dispersion in the secondary direction, with a shorter short axis indicating greater concentration of data in that direction; the azimuth angle reflects the rotation angle of the ellipse’s main axis relative to the true north direction, reflecting the main extension direction of the spatial distribution of the GTFP of the grassland animal husbandry industry in Qinghai Province; the centroid point represents the spatial center of the GTFP distribution of the grassland animal husbandry industry in each prefecture and can reveal the evolution trajectory of the overall GTFP pattern of the grassland animal husbandry industry. Figure 5 draws the standard deviation ellipses and center positions of the GTFP of the grassland animal husbandry industry in Qinghai Province in different periods, describing the spatial distribution pattern of the GTFP of the grassland animal husbandry industry in the six prefectures of Qinghai Province and further clarifying its spatial evolution trend with the help of the centroid migration trajectory and standard deviation ellipse methods. Relevant information is shown in Table 3.
Figure 5.
Standard deviation ellipse and centroid shift of GTFP in Qinghai Province grassland animal husbandry.
Table 3.
GTFP center of gravity shift and standard deviation ellipse parameter changes in Qinghai Province pastoralism.
It can be seen from Figure 5 that the spatial pattern of the standard deviation ellipse of the GTFP of the grassland animal husbandry in Qinghai Province from 2010 to 2024 exhibits relatively small changes and a stable trend overall. Specifically, the center of the standard deviation ellipse of the GTFP of the grassland animal husbandry in Qinghai Province moved to the northwest from 2010 to 2013, slightly to the southeast from 2013 to 2016, to the southwest from 2016 to 2019, and to the northeast from 2019 to 2024, with the overall migration trend showing a northeast–southwest orientation. The range of movement of the center of the GTFP of the grassland animal husbandry in Qinghai Province from 2010 to 2024 is mainly concentrated in Dulan County, Haixi Prefecture, indicating that Haixi Prefecture is the core area for the green transformation and efficiency improvement of the grassland animal husbandry in Qinghai Province. The relatively superior resource endowment, the scaled industrial foundation, and the targeted ecological protection policies have jointly contributed to the leading advantage of green production efficiency.
Between 2010 and 2024, the center of gravity of the GTFP of Qinghai Province’s grassland animal husbandry shifted from 98.51° E, 35.65° N to the northeast direction to 98.53° E, 35.71° N. This spatial trajectory not only reflects the change in geographical location but also deeply reveals the dynamic process of green development and regional structural optimization of Qinghai Province’s grassland animal husbandry. The shift in the center of gravity is highly consistent with the policy layout of the construction of ecological grassland animal husbandry cooperatives and pilot transformation and upgrading across the province, indicating that areas such as Haixi Prefecture in the northeast have promoted the improvement of green production efficiency across the province by integrating resources, promoting efficient breeding technologies, and improving the forage and feed system. Among them, there were significant shifts of 9.23 km towards the northwest at 161.01° in 2013 and 17.40 km towards the southwest at 214.33° in 2019, respectively. In 2024, it continued to move 17.51 km towards the northeast, indicating that after experiencing periodic fluctuations under policy intervention, the development hotspots ultimately concentrated in the northeast. This migration trajectory is the result of the combined action of resource endowment and functional area planning. Yushu Prefecture, Golog Prefecture, and other areas in the southern part of Qinghai, as the core area of the “Chinese Water Tower,” play a crucial role in ecological functions. However, natural constraints such as high altitude, oxygen deficiency, and low grassland carrying capacity have positioned their development in ecological protection and restoration, mainly implementing strategies of determining animal husbandry based on grassland and moderate operation, and they do not have the conditions for large-scale intensive expansion. In contrast, the northeastern region has better water and heat conditions and higher grassland productivity, which can support the construction of artificial forage bases and projects such as “Grain-to-Silage” transformation, providing a spatial foundation for industrial chain upgrading and “reducing livestock without reducing income,” thus pulling the center of gravity towards the northeast.
From the perspective of spatial distribution patterns, the area of the standard deviation ellipse shows a trend of first expanding and then contracting. It increased from 355,509.78 km2 in 2010 to a peak of 369,558.83 km2 in 2019 and then fell back to 356,188.26 km2 in 2024, indicating that the spatial range has experienced expansion and then again tends to become compact. At the same time, the shape index has always been between 0.54 and 0.57. It has shown an overall upward trend, indicating that the spatial distribution maintains a flat pattern extending east–west, and the degree of differentiation in the east–west direction has increased, confirming the regional differences of “strong in the east and weak in the west”. This regional difference may be due to the eastern Hehuang Valley, Qinghai Lake and other areas relying on better natural and policy advantages, promoting the construction of ecological grassland pastoral cooperative societies, the implementation of grass and animal balance systems, and achieving significant results; while the cold and high-altitude areas in the west are restricted by nature and transportation, and their development is relatively lagging. The azimuth of the ellipse increased from 84.46° to 87.91°, further stabilizing the east–west spatial orientation, and is consistent with the main functional zoning of Qinghai’s “Three Rivers Source” and “Qilian Mountains”, the “ecological province” strategy. The changes in the semi-major and semi-minor axes show that the semi-major axis has shortened from 457.35 km to 448.14 km, and the semi-minor axis has increased from 247.45 km to 253.02 km, indicating that spatial agglomeration has increased. The distribution pattern tends to become more compact.
This spatial pattern evolution is closely related to the policy-driven mechanism. The comprehensive vegetation coverage of Qinghai Province’s grasslands reached 58.56% in 2024, and the ecological environment shows a continuous improvement trend. This achievement mainly originates from the full implementation of the grassland ecological protection subsidy and reward policy, the strict enforcement of the grazing ban and pasture rotation system, and the introduction of relevant supporting management measures. At the same time, relying on projects such as “determining animal husbandry based on grassland”, construction of forage bases, and “grain-to-forage” transformation, Qinghai Province has developed forage planting on 153,300 hectares, producing 4.75 million tons of fresh grass annually, effectively alleviating the grazing pressure. With the support of the system and industry, the scale and organizational level of grassland animal husbandry have been improved, promoting the spatial reconstruction and optimal agglomeration of production factors. Therefore, the spatial migration and morphological changes in the GTFP of Qinghai Province’s grassland animal husbandry are essentially the result of the joint action of ecological protection policies, innovation in animal husbandry organizations, and measures for industrial upgrading, reflecting the dynamic adjustment and spatial reconstruction of regional productivity layout under the guidance of green development.
4.4. Analysis of Influencing Factors
Based on the concept of temporal stratification using independent variables [42], as well as China’s policies and implementation timelines related to grassland ecological protection, this paper divides the period from 2010 to 2024 into three time periods: 2010–2015, 2016–2020, and 2021–2024. On this basis, single-factor analysis using a geographic detector (Excel macro) was employed to examine the impact of 11 driving factors across all periods and the three stages on the GTFP of grassland animal husbandry in Qinghai Province. The q-value indicates the explanatory power of each driving factor; a higher q-value signifies greater explanatory capacity. As can be seen from Table 4, the driving factors ranked from highest to lowest for the period 2010–2024 are: rural residents’ living standards (X6) > economic development level (X5) > degree of digitalization (X11) > level of financial support for agriculture (X4) > degree of environmental governance (X9) > accessibility of transportation (X8) > urbanization level (X7) > breeding scale (X3) > degree of agglomeration of animal husbandry industry (X1) > industrial structure (X2) > science and technology investment intensity (X10). It can be seen that during the period from 2010 to 2024, the factors influencing GTFP in grassland animal husbandry in Qinghai Province were diverse. Among these, rural residents’ living standards (X6), economic development level (X5), degree of digitalization (X11), level of financial support for agriculture (X4), degree of environmental governance (X9), and accessibility of transportation (X8) had a significant impact and remained at a relatively high level. Therefore, over the entire study period, these factors had a significant long-term impact on the GTFP of grassland livestock farming. Based on the research results of key factors across all periods, and with the criterion that a factor must rank in the top six in at least two out of three time periods, the q-values for the periods 2010–2015, 2016–2020, and 2021–2024 in Table 4 were analyzed separately. It was found that level of financial support for agriculture (X4), accessibility of transportation (X8), degree of environmental governance (X9), and degree of digitalization (X11) met the aforementioned criteria. Therefore, these four factors were identified as the persistent core determinants affecting the GTFP of grassland animal husbandry in Qinghai Province. The remaining factors were considered to be important only within specific time periods.
Table 4.
Geographical detector single factor driving force, 2010–2024.
Based on single-factor detection across the entire period and in sub-periods, this paper further analyzes the core persistent factors. As can be seen from Table 5, the core persistent factors are ranked in descending order of their q-values as follows: degree of digitalization (X11) > level of fiscal support for agriculture (X4) > accessibility of transportation (X8) > degree of environmental governance (X9). Further interactive factor analysis was conducted on the core persistent factors to determine whether the explanatory power of these interactive factors on changes in GTFP in grassland animal husbandry in Qinghai Province has increased or decreased. As shown in Figure 6, the explanatory power of any two influencing factors together in the study area for the GTFP of grassland animal husbandry in Qinghai Province is significantly higher than that of a single factor. This indicates a synergistic effect of multiple factors, showing that the two factors are enhanced, and there is no weakening or independence, indicating that the GTFP of grassland animal husbandry in Qinghai Province has the characteristics of multi-factor synergistic driving. The explanatory power of each core persistent factor significantly increases when it interacts with other factors. Among them, in terms of the core interaction mechanisms, the intersection value between fiscal support for agriculture (X4) and the level of environmental governance (X9) is the highest, reaching 0.1400. This combination represents the most effective synergistic factor. This is likely because fiscal resources are directly invested in livestock production, such as through subsidies for breeding and support for modern livestock housing and feed production facilities, thereby enhancing environmental sustainability and resource efficiency. This creates an “economic foundation” for green transformation. Meanwhile, environmental governance efforts include implementing measures like ecological incentives for grasslands, banning grazing in certain areas, and restoring degraded grasslands, all with the aim of maintaining the health and stability of grassland ecosystems. The two complement each other and work together to promote the simultaneous improvement of ecological and economic benefits in grassland animal husbandry. This enables Qinghai Province to protect its grassland ecology while facilitating the green transformation of animal husbandry and ensuring sustainable income growth for herders.
Table 5.
Core single-factor drivers of geographic detectors.
Figure 6.
Driving forces of core interactive factors for geographic detectors from 2010 to 2024.
The interactive values of the level of financial support for agriculture (X4) ∩ degree of digitalization (X11) and degree of environmental governance (X9) ∩ degree of digitalization (X11) are the second and third highest, respectively, both exceeding 0.12, indicating that the degree of digitalization (X11), as an important empowerment factor, can significantly strengthen the policy effects of financial support for agriculture and environmental governance. Specifically, fiscal support for agriculture provides critical funding for the development of digital infrastructure such as smart ranches and IoT monitoring systems, enabling the implementation and expansion of digital applications. Meanwhile, digital technologies enhance the management of fiscal funds by using data collection, analysis, and intelligent decision-making to transform traditional, extensive subsidies into targeted allocations based on actual production needs, resource availability, and ecological indicators. At the same time, in the practice of environmental governance, such as grass and livestock balance control and disaster warning, relying on digital technologies such as satellite remote sensing and Internet of Things monitoring networks, we can realize real-time and accurate monitoring of grassland degradation and livestock breeding scale; promote environmental governance from experience-led to data-driven; significantly improve the regulatory effectiveness of grazing prohibition and ecological restoration measures; and realize the quantification and traceability of environmental governance effects.
From the perspective of sub-strong interaction networks, the interaction values for “accessibility of transportation (X8) ∩ degree of environmental governance (X9)”, “accessibility of transportation (X8) ∩ degree of digitalization (X11)”, and “level of financial support for agriculture (X4) ∩ accessibility of transportation (X8)” are all above 0.066. This indicates that accessibility of transportation (X8), as a key infrastructure factor, when combined with these core drivers, can significantly enhance their positive impact on the GTFP of grassland animal husbandry, creating a synergistic effect. Specifically, Qinghai Province continues to promote the construction of transportation infrastructure such as rural roads, cold chain logistics of livestock products, and disaster prevention and communication lines, which not only significantly improves the spatial accessibility and implementation timeliness of ecological management work such as restoration of degraded grassland but also provides necessary physical conditions for the construction of digital facilities such as communication base stations and Internet of Things terminals, and at the same time ensures that materials, equipment, services and personnel related to financial support for agriculture can reach the production line in pastoral areas efficiently. On the other hand, the promotion of environmental governance in key ecological areas has given birth to special traffic needs, such as ecological management patrol roads. Digital applications such as car networking and logistics platforms optimize the efficiency of traffic scheduling and management in pastoral areas. Financial funds continue to provide direct investment for the construction and maintenance of transportation infrastructure. This interactive effect reduces the cost and loss of the flow and allocation of various production factors in the vast pastoral space, thus promoting the feasibility and depth of the application of environment-friendly technology, the recycling of resources, and the efficiency improvement of grassland animal husbandry as a whole and jointly driving the sustained growth of grassland animal husbandry GTFP.
5. Discussion
5.1. Evolution of the Spatiotemporal Pattern of GTFP
Under the dual goals of ecological protection and high-quality development, the GTFP of grassland animal husbandry in Qinghai Province shows a continuous improvement trend, which is consistent with relevant research on regional sustainable development [44]. On this basis, this study further reveals that the GTFP of grassland animal husbandry in Qinghai Province has a significant spatial differentiation pattern of “strong in the north and stable in the south”, and the center of gravity shows a trend of migration towards the northeast. This spatial phenomenon reflects the complex process of reconstruction and redistribution of regional development factors under the constraint of the ecological red line.
From the perspective of spatial patterns, the grassland animal husbandry GTFP in the northern areas such as Haixi and Hainbei has shown significant growth, forming “strong growth poles.” In contrast, the southern region, especially the Sanjiangyuan National Park area, is relatively stable, showing the characteristics of “stable with quality improvement.” This pattern is highly consistent with the policy orientation of ecological protection priority in the main functional area division. It is also consistent with the “protection and development” balance challenge faced in the development of similar ecological regions [45,46]. However, compared with previous studies [47], the spatial differentiation of grassland animal husbandry GTFP in Qinghai Province more prominently reflects the unbalanced path under the triple coordination of “policy–institution–resource.” The formation of this path originates from the differentiated coordination of different regions in the three dimensions: in terms of policy orientation, the north focuses on the development of policies such as intensive and modern breeding and the forage industry, directly driving efficiency improvement, while the south takes protection-oriented policies as the core, encouraging grazing bans, forage–grazing balance incentives, and ecological restoration, focusing on reducing the burden on the ecosystem. In terms of institutional innovation, the north focuses on efficiency orientation, promoting the reorganization of production factors and large-scale operation through cooperative stock system reforms such as the Lagri model. In contrast, the south focuses on guarantee and constraint, striving to improve the ecological compensation and reward mechanism and “determine animal husbandry by forage” supervision, balancing protection and people’s livelihood under strict constraints. In terms of resource basis, the north has the conditions for resource empowerment, is suitable for large-scale planting of high-quality forage, and provides support for industrial upgrading. At the same time, the south faces significant resource constraints, with the primary function of the cold and fragile meadow being ecological security and resource investment mainly used for ecological restoration rather than production expansion. These three dimensions do not exist independently, but rather, under the overall constraints of the ecological security pattern, they have formed a strong regional synergy effect. Therefore, in the northern part of Qinghai Province, development-oriented policies, efficiency-oriented institutional innovation, and relatively superior resource bases reinforce each other, jointly promoting the concentration of production factors in high-efficiency fields and shaping a “strong growth pole.” In the south, protection-oriented policies, guarantee-oriented institutions, and fragile resource conditions that primarily bear ecological functions are closely linked, jointly restricting the expansion of traditional production factors, paving the way for a “stable with quality improvement” path in the pursuit of development under protection. This biased, unbalanced synergy path is a concentrated manifestation of the reorganization of production factors in the spatial pattern under the constraints of ecological security and the pursuit of overall efficiency optimization.
From the perspective of the evolution process, the center of gravity of Qinghai Province’s grassland animal husbandry GTFP has continuously shifted to the northeast, reflecting the transfer of internal growth momentum within the region. This direction is closely related to the advantages of better water and heat conditions, relatively complete infrastructure, and concentrated artificial forage bases, indicating that under ecological constraints, production factors will still be aggregated to regions with higher utilization efficiency and better green development conditions [48]. At the same time, the standard deviation ellipse has shifted from a “multi-point dispersed” pattern to a “spatial aggregation” pattern, further confirming that under the framework of ecological security, the grassland animal husbandry industry is improving overall efficiency through spatial optimization. This process has similarities with the trajectory of ecological economic zones, such as Poyang Lake, in pursuing development while protecting the environment [49,50]. However, the path of “ecological constraints–element reorganization–efficiency aggregation” in the Qinghai case is prominently reflected in three aspects: First, the absolute rigidity of ecological constraints in Qinghai Province, as the “Chinese Water Tower” and the national ecological security barrier, gives overriding priority to ecological protection, which determines that grassland animal husbandry must strictly comply with the ecological red line; second, in the way of element reorganization, under strong policy guidance, the core production resources are structurally integrated through the cooperative shareholding system reform, achieving the fundamental transformation of “resource to equity, herders to shareholders”; third, in the northern part of Qinghai Province, a concentrated “strong growth pole” has been formed, while in the southern ecological protection area, the strict implementation of the grass and animal balance policy is carried out. This path distinctly highlights the unique mechanism of coordinated promotion of ecological protection and production development under the absolute rigidity constraint of ecological priority in alpine areas, and its theoretical logic and empirical basis resonate with the core essence of Xi Jinping’s ecological civilization thought, “Green mountains and clear waters are as valuable as mountains of gold and silver” and “harmony between man and nature.” It reflects the profound dialectical unity between ecological environmental protection and economic and social development; it has also been effectively verified at the scientific level. Academicians such as Fu Bojie [51,52] emphasized the function of the ecological security barrier of the Qinghai–Tibet Plateau, supporting the development orientation of the Sanjiangyuan area with protection as a priority and “stable quality improvement”; the research team of Professor Yuan Zhiyun on the accounting of the total value of ecological products (GEP) provides a methodological perspective for understanding the value transformation of ecological inputs in the region [53,54]; Guo and others’ research further confirmed that the high-quality development of Qinghai Province cannot be separated from ecological protection [55].
5.2. Analysis of Influencing Factors and Mechanisms
This study reveals the complex driving mechanism for the improvement of GTFP in the grassland animal husbandry industry in Qinghai Province, emphasizing the synergistic and interactive effects of multidimensional factors such as “industry–economy–society–science and technology–environment,” providing a framework for different perspectives on the green transformation of plateau grassland animal husbandry. Compared with previous studies that focused on single-factor analysis [17,56], this paper particularly pays attention to the synergistic and enhancing effects among various driving factors, thus providing a more profound mechanistic explanation. According to the analysis of geographical detectors, although the single factor detection identified the level of fiscal support for agriculture, accessibility of transportation, the degree of environmental governance and the degree of digitalization as the main driving forces, the interactive detection finds that the explanatory power of any two factors interacting is significantly higher than their independent effects. There is no weakening or independent phenomenon [57,58]. This strongly confirms that the evolution of GTFP in Qinghai Province’s grassland animal husbandry is the result of the synergistic driving of various driving factors, which is mutually verified with the research on the human–land system synergy mechanism in the Qinghai–Tibet Plateau region [59,60]. The core advantage of the geographic detector model lies in its ability to effectively identify the interactive relationships among multiple factors, especially quantifying the effects of the joint action of two factors on the dependent variable (such as GTFP) as “enhancing,” “independent,” or “weakening.” This study finds that “the explanatory power of any two factors interacting is significantly higher than their independent effects,” which is a typical manifestation of the “double-factor enhancement” or “nonlinear enhancement” interaction type defined by the geographic detector.
The conclusion that the optimization of industrial structure in the human–land system synergy mechanism in the Qinghai–Tibet Plateau region has a high-intensity interaction mechanism with other factors is similar to the research of related scholars [61,62], who believe that under the premise of protecting the ecological carrying capacity of grasslands, production efficiency can be significantly improved. Gou et al. [63] emphasize that the grazing land in the Qinghai–Tibet Plateau is a typical “social–economic–natural composite ecosystem”, and its sustainable management requires comprehensive consideration of natural condition changes, social and economic activities, and their complex interactions. Huntsinger [64] and Ren [65] and others pointed out in their research that the productivity of alpine grasslands is affected by multiple natural and human factors such as grazing intensity, temperature, precipitation, and species diversity, and its sustainable management requires comprehensive consideration of these interactions. In contrast, this study found that the interaction between the level of financial support for agriculture and the degree of environmental governance (X4 ∩ X9) is the most explanatory factor in the study of GTFP of grassland animal husbandry in Qinghai Province, indicating that the harsh ecological threshold makes any productive investment that is out of the constraint of environmental carrying capacity unsustainable or even counterproductive; at the same time, the rigid environmental regulation that lacks continuous financial support and alternative livelihood schemes is also unsustainable.
5.3. Research Limitations and Future Directions
This study deepened the understanding of the evolution of GTFP of grassland animal husbandry in Qinghai Province from the aspects of space–time pattern and driving mechanism, especially highlighting the role of spatial reorganization of production factors and multi-factor synergy under ecological constraints. However, as the pastoral areas in Qinghai Province are relatively backward, the data statistics are imperfect or lack electronic data, so there are still some limitations in this study. First, Qinghai Province, as an important ecological and animal husbandry region in western China, is still gradually improving its socio-economic statistical system at the county level and below. Due to this objective condition, the spatial analysis adopts state-level data, which fails to reveal the heterogeneity of micro-units such as counties and towns, which limits the applicability of the conclusions in refined governance. Secondly, the analysis of driving mechanisms is mainly based on static or time-series data, and it is still insufficient to capture the dynamic processes, such as the lag effect of policy implementation, market fluctuation, and climate variation, and fails to fully describe the nonlinear influence of each factor over time. Underwood et al. [66] also pointed out in the study of similar areas that higher-resolution data is helpful to reveal the cooperative mechanism of small-scale ecology–production–life.
Future research can be further deepened in the following directions: First, introduce dynamic panel models or system simulation methods to quantify the dynamic impact and lag effects of policy interventions, market fluctuations, and climate change; second, integrate higher-resolution natural and socio-economic data, supplemented by field research, to reveal the refined collaborative mechanisms of the ecology–production–life systems at the county and even town level, which is consistent with the multi-scale integration analysis approach advocated by Shang and Fei et al. [67,68]. Through these improvements, it is expected to further improve the research system of green efficiency in theory and methodology and also provide more scientific and operational decision-making support for the sustainable development of grassland animal husbandry and ecological protection in the Qinghai–Tibet Plateau and similar ecologically fragile areas.
6. Conclusions and Recommendations
6.1. Conclusions
Based on the panel data of Qinghai Province from 2010 to 2024, a comprehensive application of trend surface analysis, standard deviation ellipse, and geographic detector methods was used to systematically explore the spatiotemporal differentiation and driving mechanisms of the GTFP of the grassland animal husbandry industry in Qinghai Province. The main conclusions are as follows: (1) During the study period, the GTFP showed a steady upward trend. Spatially, it showed a distinct “north strong, south stable” pattern, with the center of gravity generally migrating to the northeast, and the distribution form shifting from diffusion to aggregation. This reconstruction process is highly consistent with the ecological functional zoning and the carrying capacity of resources and the environment. (2) The level of fiscal support for agriculture (X4), accessibility of transportation (X8), degree of environmental governance (X9), and degree of digitalization (X11) are the core driving forces to enhance GTFP. (3) The interaction between any two factors showed a dual-factor enhancement effect. In particular, the interaction between fiscal support for agriculture and the level of environmental governance had the strongest explanatory power, reaching 0.14. This reveals a positive feedback mechanism where “increasing fiscal investment in agriculture improves environmental governance efficiency while optimizing capital allocation based on ecological carrying capacity”.
6.2. Suggestion
The above conclusion provides intrinsic motivation and feasible paths for promoting the green transformation of animal husbandry in China’s ecologically fragile areas, in the background of ecological civilization construction. The systematic restoration of ecologically fragile areas is long-term and complex, and the process of green transformation needs to balance ecological constraints and development needs. The specific implementation paths can focus on the following three aspects: First, implement differentiated regional governance strategies. Policy design must fully consider the positioning of the main functions of the region, focusing on promoting industrial chain integration and digital upgrading in high-value areas of GTFP and improving the ecological compensation mechanism for ecological protection core areas, actively exploring the transformation model of ecological product value in animal husbandry. Second, strengthen the two-way empowerment of science and technology and the industry. Actively build a collaborative platform for industry, universities, and research; carry out key technology research and development around the particularities of alpine and other ecologically fragile areas; promote digital technology throughout the entire process of production, management, and marketing; and systematically enhance the intelligence level of the industry. Third, the government should build a multi-dimensional coordinated policy support system; coordinate ecological protection, industrial development, scientific and technological support, people’s livelihood security and other dimensions; form a systematic and integrated policy synergy; and break through the structural bottleneck in industrial green transformation.
Author Contributions
Conceptualization, A.Z. and Y.W.; methodology, Y.W.; software, J.Z.; validation, Y.W., A.Z. and J.Z.; formal analysis, Y.W.; investigation, J.Z.; resources, A.Z.; data curation, J.Z.; writing—original draft preparation, Y.W.; writing—review and editing, Y.W.; visualization, J.Z.; supervision, A.Z.; project administration, Y.W.; funding acquisition, A.Z. All authors have read and agreed to the published version of the manuscript.
Funding
This research was funded by the Qinghai Province Philosophy and Social Sciences Major “Revealing the List” Planning Project (25JB002) and the Qinghai Province “Kunlun Talents High-end Innovative and Entrepreneurial Talents” Training Outstanding Talents Project (k9924063).
Institutional Review Board Statement
Not applicable.
Informed Consent Statement
Not applicable.
Data Availability Statement
The data presented in this study are available on request from the corresponding author.
Conflicts of Interest
The authors declare no conflicts of interest.
Abbreviations
The following abbreviations are used in this manuscript:
| GTFP | Green Total Factor Productivity |
| TFP | Total Factor Productivity |
| NDVI | Normalized Difference Vegetation Index |
| CASA | Carnegie–Ames–Stanford Approach |
| NPP | Net Primary Productivity |
| GDP | Gross Domestic Product |
| EBM | Energy-Based Model |
| DMUs | Decision-Making Units |
| SDE | Standard Deviational Ellipse |
References
- Solow, R.M. Technical change and the aggregate production function. Rev. Econ. Stat. 1957, 39, 312–320. [Google Scholar] [CrossRef] [Scilit]
- Li, C. The Development Logic and Theoretical Paradigm of Total Factor Productivity. Financ. Dev. 2025, 1, 81–96. [Google Scholar]
- Sun, R.; Zhang, J. Exploring a comprehensive environmental efficiency evaluation of pig production sector in China: Combination of LCA and undesirable output SBM model. Environ. Impact Assess. Rev. 2025, 112, 107779. [Google Scholar] [CrossRef] [Scilit]
- Farrell, M.J. The Measurement of Productive Efficiency. J. R. Stat. Soc. 1957, 120, 253–290. [Google Scholar] [CrossRef] [Scilit]
- Tone, K.; Tsutsui, M. An epsilon-based measure of efficiency in DEA—A third pole of technical efficiency. Eur. J. Oper. Res. 2010, 207, 1554–1563. [Google Scholar] [CrossRef] [Scilit]
- Oh, D. A global Malmquist-Luenberger productivity index. J. Product. Anal. 2010, 34, 183–197. [Google Scholar] [CrossRef] [Scilit]
- Asante, B.O. Farming systems and productivity gaps: Opportunities for improving smallholder performance in the Forest-Savannah transition zone of Ghana. Land Use Policy 2019, 84, 260–268. [Google Scholar]
- Alem, H. The Role of Technical Efficiency Achieving Sustainable Development: A Dynamic Analysis of Norwegian Dairy Farms. Sustainability 2021, 13, 1841. [Google Scholar] [CrossRef] [Scilit]
- Alem, H. Measuring dynamic and static eco-efficiency in Norwegian dairy farms: A parametric approach. Front. Environ. Econ. 2023, 2, 1182236. [Google Scholar] [CrossRef] [Scilit]
- Madau, F.A.; Furesi, R.; Pulina, P. Technical efficiency and total factor productivity changes in European dairy farm sectors. Agric. Food Econ. 2017, 5, 17. [Google Scholar] [CrossRef] [Scilit]
- Asante, B.O.; Villano, R.A.; Temoso, O. Drivers of integrated crop-livestock farming system’s efficiency for smallholder farmers in the forest-savanna transition agro-ecological zone of Ghana. Environ. Dev. Sustain. 2024, 26, 29429–29451. [Google Scholar] [CrossRef] [Scilit]
- Ickowicz, A.; Hubert, B.; Blanchard, M.; Blanfort, V.; Cesaro, J.-D.; Diaw, A.; Lasseur, J.; Huyen, L.T.T.; Li, L.; Mauricio, R.M.; et al. Multifunctionality and diversity of livestock grazing systems for sustainable food systems throughout the world: Are there learning opportunities for Europe? Grass Forage Sci. 2022, 77, 235–253. [Google Scholar] [CrossRef] [Scilit]
- Chase, L.E.; Fortina, R. Environmental and Economic Responses to Precision Feed Management in Dairy Cattle Diets. Agriculture 2023, 13, 1032. [Google Scholar] [CrossRef] [Scilit]
- Ni, H.; Zeng, H.; Liu, Z.; Li, W.; Miao, S.; Yang, A.; Wang, Y. Towards decarbonizing the supply chain of dairy industry: Current practice and emerging strategies. Carbon Neutrality 2025, 4, 8. [Google Scholar] [CrossRef] [Scilit]
- Zhang, F.; Yu, Z.; Dong, X.; Peng, H.; Wang, H. Regional Differences and Convergence of Green Total Factor Productivity in China’s Animal Husbandry. J. Agric. Sci. Technol. 2025, 27, 11. [Google Scholar]
- Liu, D.; Zhu, X.; Wang, Y. China’s agricultural green total factor productivity based on carbon emission: An analysis of evolution trend and influencing factors. J. Clean. Prod. 2021, 278, 123692. [Google Scholar] [CrossRef] [Scilit]
- Sun, Y. Environmental regulation, agricultural green technology innovation, and agricultural green total factor productivity. Front. Environ. Sci. 2022, 10, 955954. [Google Scholar] [CrossRef] [Scilit]
- Xu, B.; Shen, Z.; Lin, G. Evolution of green total factor productivity and regional disparity in China’s husbandry. Chin. J. Eco-Agric. 2019, 27, 613–622. [Google Scholar]
- Guo, J.; Fu, Y. Green total factor productivity of dairy cows in China: Essential facts from the perspective of regional heterogeneity. Front. Environ. Sci. 2023, 11, 1164770. [Google Scholar] [CrossRef] [Scilit]
- Lin, Z.; Zhang, Y. Temporal and spatial differences and influencing factors of green Total factor productivity of animal husbandry in China. J. Ecol. Rural Environ. 2023, 39, 1144–1157. [Google Scholar]
- Zhong, S.; Li, J.; Zhang, D. Measurement of green total factor productivity on Chinese pig breeding: From the perspective of regional differences. Environ. Sci. Pollut. Res. 2022, 29, 27479–27495. [Google Scholar] [CrossRef] [Scilit] [PubMed]
- Wen, H.; Li, H.; Li, J.; Zhong, S. Green total factor productivity of dairy farming in China: Based on the perspective of scale heterogeneity. Front. Environ. Sci. 2022, 10, 961178. [Google Scholar] [CrossRef] [Scilit]
- Wu, D.; He, S.; Qin, L.; Feng, J.; Gao, Y. Role of policy-supported hog Insurance in Promoting Green Total Factor Productivity: The case of China during 2005–2021. Agriculture 2024, 14, 1051. [Google Scholar] [CrossRef] [Scilit]
- Yan, Z.; Wang, M.; Sun, Y.; Nan, Z. The impact of research and development investment on total factor productivity of animal husbandry enterprises: Evidence from listed companies in China. Agriculture 2023, 13, 1846. [Google Scholar] [CrossRef] [Scilit]
- Wang, L.; Wang, C. An empirical study on the measurement of green total factor productivity and its influencing factors in the dairy farming industry in China. Pak. J. Agric. Sci. 2023, 60, 9–23. [Google Scholar] [CrossRef] [Scilit]
- Wang, L.; Chang, Q.; Kong, R. Regional differences and convergence of green total factor productivity in pig breeding: Evidence from China. Front. Environ. Sci. 2023, 11, 1162502. [Google Scholar] [CrossRef] [Scilit]
- Li, J.; Han, Z.; Wang, M.; Li, J. Path to sustainable development of livestock: Does environmental protection tax matter in livestock green total factor productivity? China Agric. Econ. Rev. 2025, 17, 736–756. [Google Scholar] [CrossRef] [Scilit]
- Zhong, S.; Li, J.; Qu, Y. Green total factor productivity of dairy cow in China: Key facts from scale and regional sector. Technol. Forecast. Soc. Change 2022, 183, 121949. [Google Scholar] [CrossRef] [Scilit]
- Alem, H. The role of green total factor productivity to farm-level performance: Evidence from Norwegian dairy farms. Agric. Food Econ. 2023, 11, 2. [Google Scholar] [CrossRef] [Scilit]
- Wang, X.; Wu, X.; Yan, P.; Gao, W.; Chen, Y.; Sui, P. Integrated analysis on economic and environmental consequences of livestock husbandry on different scale in China. J. Clean. Prod. 2016, 119, 1–12. [Google Scholar] [CrossRef] [Scilit]
- Zhong, S.; Chen, X.; Li, J.; Jiang, S. A perspective of scale differences for studying the green total factor productivity of Chinese laying hens. Sci. Rep. 2022, 12, 6847. [Google Scholar] [CrossRef] [Scilit]
- Xu, X.; Huang, X.; Huang, J.; Gao, X.; Chen, L. Spatial-temporal characteristics of agriculture green total factor productivity in China, 1998–2016: Based on more sophisticated calculations of carbon emissions. Int. J. Environ. Res. Public Health 2019, 16, 3932. [Google Scholar] [CrossRef] [Scilit] [PubMed]
- Li, L.; Tsunekawa, A.; Tsubo, M.; Koike, A.; Wang, J. Assessing total factor productivity and efficiency change for farms participating in Grain for Green program in China: A case study from Ansai, Loess Plateau. J. Food Agric. Environ. 2010, 8, 1185–1192. [Google Scholar]
- Zhang, Y.; Zhang, H.; Liao, H.; Sun, X.; Jiang, L.; Wang, Y.; Wang, Y. Heterogeneous porter effect or crowded-out effect: Nonlinear impact of environmental regulation on county-level green total factor productivity of pigs in the Yangtze River Basin of China. Agriculture 2024, 14, 1513. [Google Scholar] [CrossRef] [Scilit]
- Li, B.; Mei, Q. Study on Carbon Behavior Mode and Influencing Factors in Agricultural Production-Investigation of Farmers Based on Typical Rural Areas in Hubei Province. J. Huazhong Agric. Univ. (Soc. Sci. Ed.) 2017, 6, 51–58+150. [Google Scholar]
- Zhou, R.; Liao, B.; Wu, S. Spatiotemporal Evolution and Driving Factors of Net Carbon Sink in Rice Production under the Context of ‘Dual Carbon’ Goals: A Case Study of Prefecture-level Cities in Hubei Province. Chin. J. Agric. Resour. Reg. Plan. 2025, 43, 1–14. [Google Scholar]
- Yang, J.; Huang, X. The 30 m annual land cover dataset and its dynamics in China from 1990 to 2021. Earth Syst. Sci. Data 2022, 13, 3907–3925. [Google Scholar] [CrossRef] [Scilit]
- Andersen, P.; Petersen, N.C. A procedure for ranking efficient units in data envelopment analysis. Manag. Sci. 1993, 39, 1261–1264. [Google Scholar] [CrossRef] [Scilit]
- Liu, Z.; Han, L.; Liu, M. Spatiotemporal characteristics of carbon emissions in Shaanxi, China, during 2012–2019: A machine learning method with multiple variables. Environ. Sci. Pollut. Res. 2023, 30, 87535–87548. [Google Scholar] [CrossRef] [Scilit]
- Yuill, R.S. The Standard Deviational Ellipse; An Updated Tool for Spatial Description. Geogr. Annaler. Ser. B Hum. Geogr. 1971, 53, 28–39. [Google Scholar] [CrossRef]
- Gong, J. Clarifying the standard deviational ellipse. Geogr. Anal. 2002, 34, 155–167. [Google Scholar] [CrossRef]
- Wang, J.F.; Xu, C.D. Geodetector: Principle and prospective. Acta Geogr. Sin. 2017, 72, 116–134. [Google Scholar]
- Qiao, P.; Yang, S.; Lei, M.; Chen, T.; Dong, N. Quantitative analysis of the factors influencing spatial distribution of soil heavy metals based on geographical detector. Sci. Total Environ. 2019, 664, 392–413. [Google Scholar] [CrossRef] [Scilit] [PubMed]
- Wang, X.; Yang, C.; Qiao, C. Agricultural service trade and green development: A perspective based on China’s agricultural total factor productivity. Sustainability 2024, 16, 7963. [Google Scholar] [CrossRef] [Scilit]
- Ye, W.; Li, Z. The impact of food production comparative advantage on green total factor productivity: The moderating role of environmental regulation. Agriculture 2023, 13, 2058. [Google Scholar] [CrossRef] [Scilit]
- Song, Y.; Zhu, W.; Yang, Y.; Su, E. Agriculture-service integration and agricultural green total factor productivity: A case study of China. Socio-Econ. Plan. Sci. 2025, 8, 102326. [Google Scholar] [CrossRef] [Scilit]
- Zhang, M.; Yu, C. Assessing Sustainable Growth: Evolution and Convergence of Green Total Factor Productivity in Tibetan Plateau Agriculture. Sustainability 2025, 17, 6963. [Google Scholar] [CrossRef] [Scilit]
- Luo, Z.; Yang, X.; Luo, S. Land use simulation and ecological network construction around Poyang Lake Area in China under the goal of sustainable development. Sustainability 2024, 16, 8146. [Google Scholar] [CrossRef] [Scilit]
- Liu, M.; Zhang, P.; Cai, Y.; Chu, J.; Li, Y.; Wang, X.; Li, C.; Liu, Q. Spatial-temporal heterogeneity analysis of blue and green water resources for Poyang Lake basin, China. J. Hydrol. 2023, 617, 128983. [Google Scholar] [CrossRef] [Scilit]
- Fu, B.; Liu, Y.; Feng, X.; Liu, S.; Miao, C.; Wang, X.; He, C.; Li, C.; Ye, A.; Hu, Z.; et al. Optimization for Qinghai-Xizang Plateau ecological security barrier system. Bull. Chin. Acad. Sci. 2024, 39, 1882–1893. [Google Scholar] [CrossRef]
- Wang, J.; Fu, B.; Zhang, X.; Liu, Y.; Zhao, W. Learning from “Nature-based Solutions” to promote optimal management of integrated ecological conservation and restoration in Qinghai-Xizang Plateau. Acta Ecol. Sin. 2024, 39, 1123–1130. [Google Scholar] [CrossRef]
- Ouyang, Z.; Zhu, C.; Yang, G.; Xu, W.; Zheng, H.; Zhang, Y.; Xiao, Y. Gross ecosystem product: Concept, accounting framework and case study. Acta Ecol. Sin. 2013, 33, 6747–6761. [Google Scholar] [CrossRef] [Scilit]
- Ouyang, Z.; Kong, L.; Huang, B.; Xu, W.; Fu, B. Science and technology support the protection and restoration of the western ecosystem to ensure national ecological security. Bull. Chin. Acad. Sci. 2025, 4, 991–999. [Google Scholar] [CrossRef] [Scilit]
- Huang, C.; Sun, F.; Guo, J. Beautiful Qinghai: Create a model of nature reserves with national representation and global influence-theory and practice of Xi Jinping’s Thought on Ecological Civilization in Qinghai. Qinghai Soc. Sci. 2024, 2, 5–15. [Google Scholar]
- Guo, J.; Wei, Z.; Xie, X.; Ren, J.; Zhou, H. Dynamic change and driving force of natural capital in Qinghai Province based on the three-dimensional ecological footprint, China. Ecol. Indic. 2022, 145, 109673. [Google Scholar] [CrossRef] [Scilit]
- Ma, G.; Qin, R.; Lei, S.; Tang, Y. Influence of data elements on China’s agricultural green total factor productivity. Sci. Rep. 2025, 26, 31358. [Google Scholar] [CrossRef] [Scilit]
- Ding, Y.; Zhang, M.; Qian, X.; Li, C.; Chen, S.; Wang, W. Using the geographical detector technique to explore the impact of socioeconomic factors on PM2. 5 concentrations in China. J. Clean. Prod. 2019, 211, 1480–1490. [Google Scholar] [CrossRef] [Scilit]
- Zhang, M.; Kafy, A.A.; Ren, B.; Zhang, Y.; Tan, S.; Li, J. Application of the optimal parameter geographic detector model in the identification of influencing factors of ecological quality in Guangzhou, China. Land 2022, 11, 1303. [Google Scholar] [CrossRef] [Scilit]
- Gao, Y.; Yu, Y. Justice in coexistence: Pastoralism and large carnivores on the Qinghai-Tibet Plateau. People Nat. 2025, 2, 26. [Google Scholar] [CrossRef] [Scilit]
- Wei, H.; Gao, Y.; Han, Q.; Li, L.; Dong, X.; Liu, M.; Meng, Q. Quality evaluation and obstacle identification of human settlements in the Qinghai–Tibet plateau based on multi-source data. Land 2022, 11, 1479. [Google Scholar] [CrossRef] [Scilit]
- Zhang, H.; Chen, W.; Liu, W.; Liu, Z.; Liu, H. The evolution of settlement system and the paths of rural revitalization in alpine pastoral areas of the Qinghai-Tibet Plateau: A case study of Nagqu County. Ecol. Indic. 2023, 150, 110274. [Google Scholar] [CrossRef] [Scilit]
- Han, S.; Dai, L.; Liu, Q.; Wei, Y.; Niu, Y.; Xu, K. Investigating the environmental capacity of soil heavy metals and its determinants in agro-pastoral regions of the Qinghai-Tibetan plateau. Environ. Geochem. Health 2024, 46, 407. [Google Scholar] [CrossRef] [Scilit]
- Gou, Y.; Hao, L.; Huang, Y.; Jin, X.; Zhang, A.; Ma, H. The Changes in Grassland Animal Husbandry and Herdsmen’s Life in the Qinghai Pastoral Area of China Based on the Perspective of Changes in the Grassland Property Rights System. Sustainability 2025, 17, 1262. [Google Scholar] [CrossRef] [Scilit]
- Huntsinger, L.; Li, W. Rebuilding pastoral social-ecological resilience on the Qinghai-Tibetan Plateau in response to changes in policy, economics, and climate. Ecol. Soc. 2018, 1, 23. [Google Scholar]
- Ren, S.; Jing, H.; Qian, X.; Liu, Y. Spatial and temporal coordinated development research on ecosystem services and human well-being in the typical pastoral area of the Qinghai-Tibet Plateau. J. Geogr. Sci. 2024, 34, 252–288. [Google Scholar] [CrossRef] [Scilit]
- Underwood, N.; Hambäck, P.; Inouye, B.D. Large-scale questions and small-scale data: Empirical and theoretical methods for scaling up in ecology. Oecologia 2005, 145, 176–177. [Google Scholar] [CrossRef] [Scilit] [PubMed]
- Shang, Y.; Chen, Y.; Zhai, Y.; Wang, L. Spatiotemporal Relationship Between Carbon Metabolism and Ecosystem Service Value in the Rural Production–Living–Ecological Space of Northeast China’s Black Soil Region: A Case Study of Bin County. Land 2025, 14, 199. [Google Scholar] [CrossRef] [Scilit]
- Fei, W.; Gao, Z.; Gao, W. Development of a protocol to identify land function based on multifunctionality and suitability analysis: A case study of the Nanyuntai Forest Farm, China. Ecol. Inform. 2023, 75, 102081. [Google Scholar] [CrossRef] [Scilit]
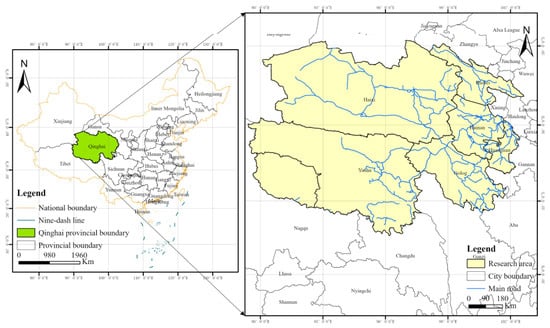
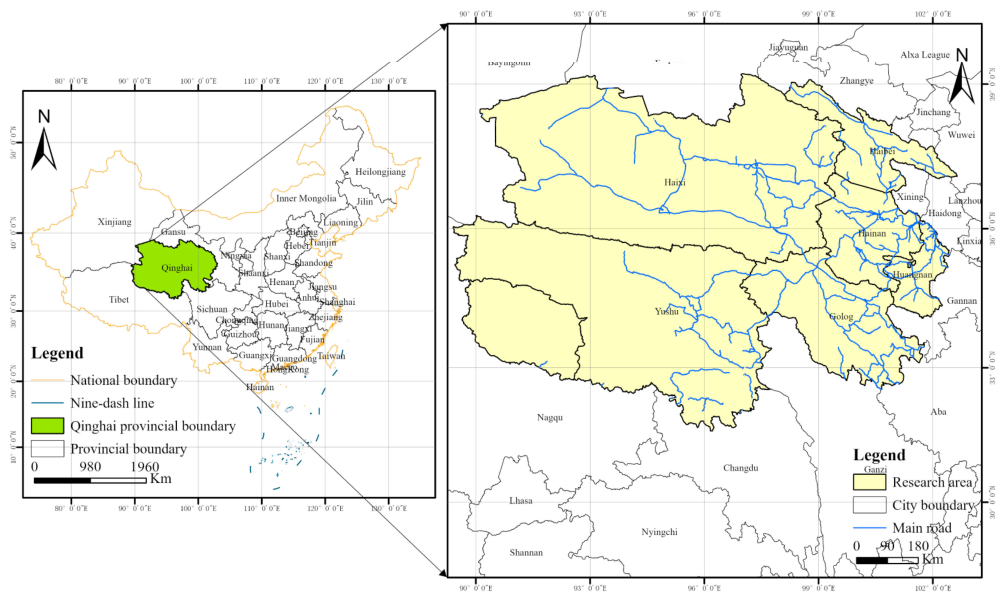
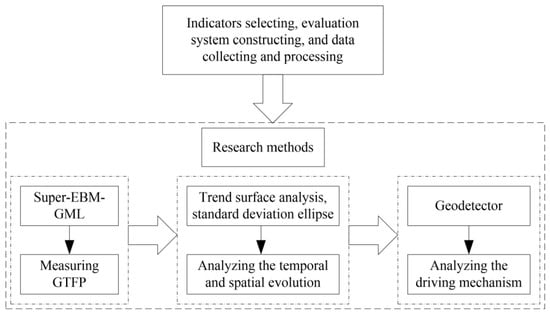
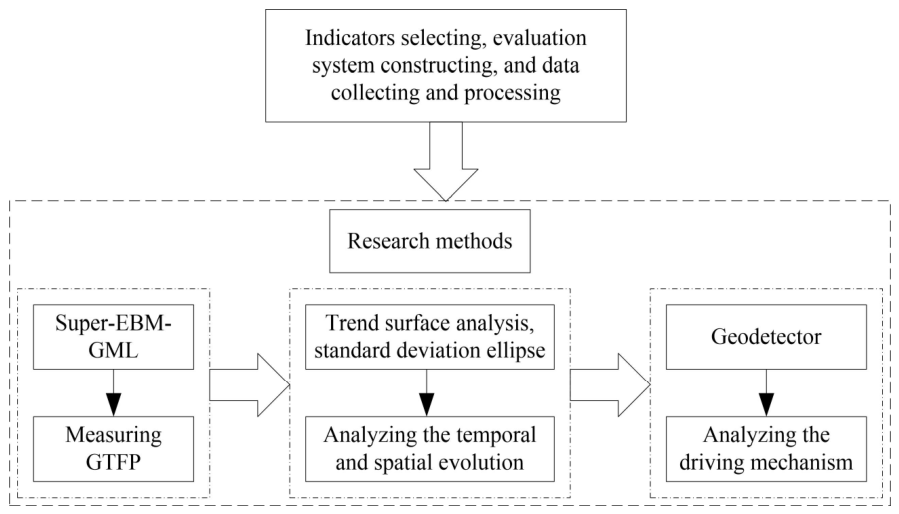
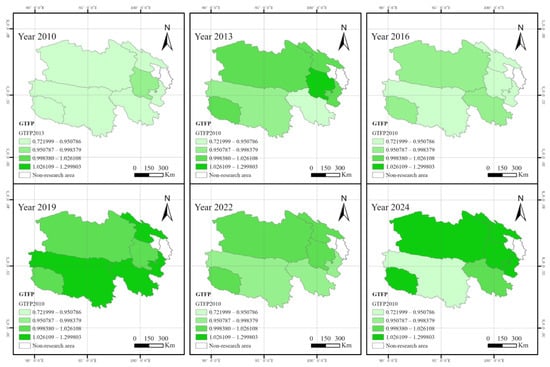
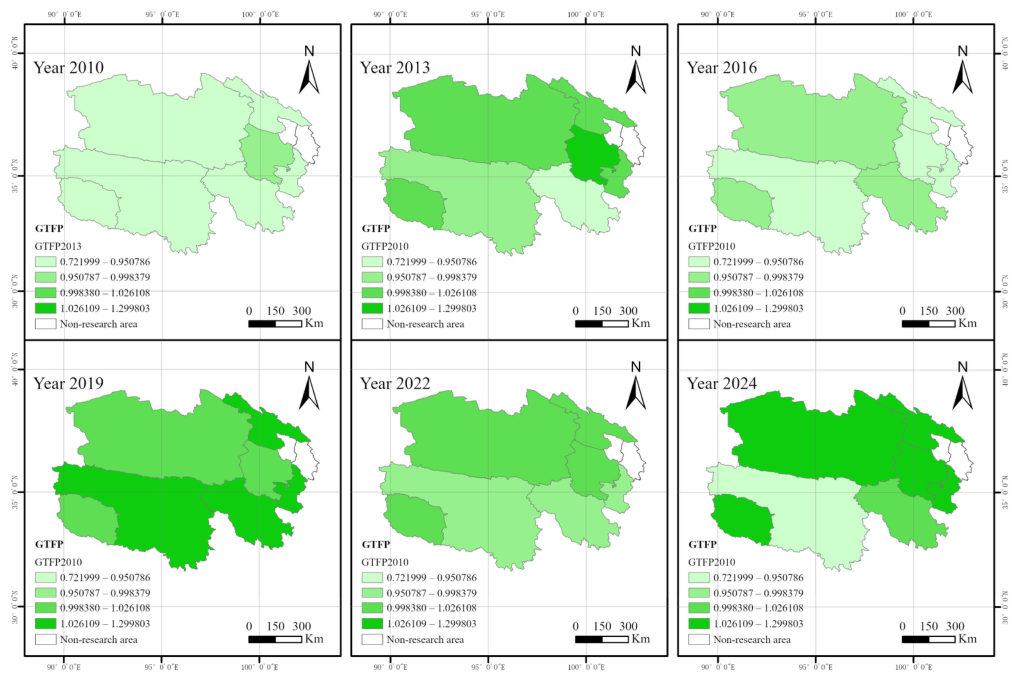
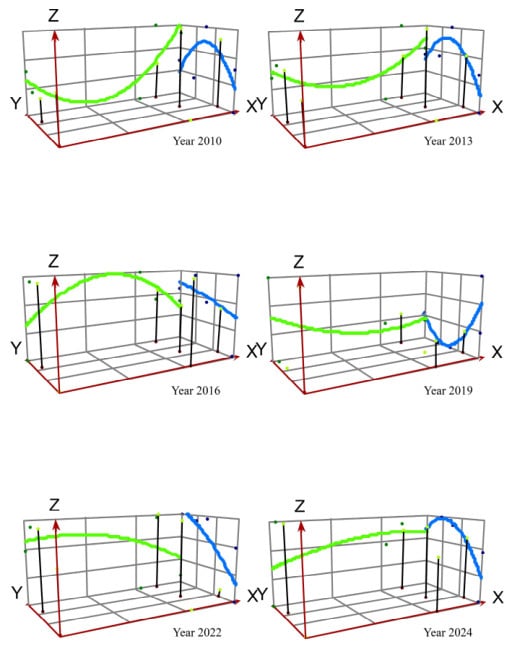
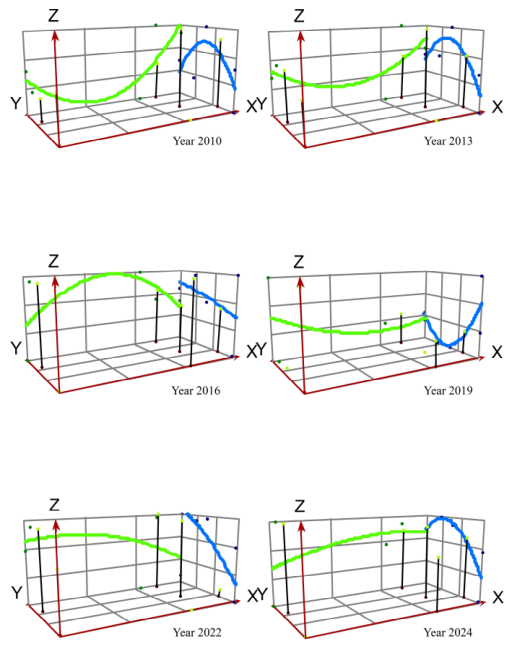
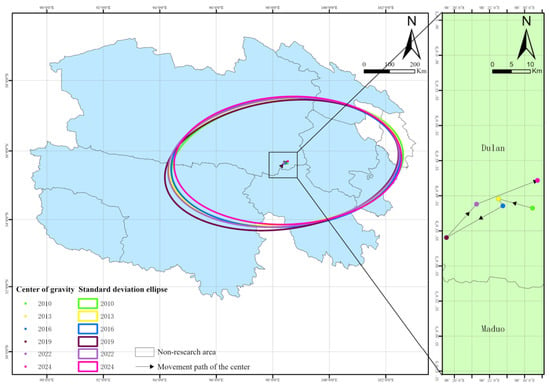
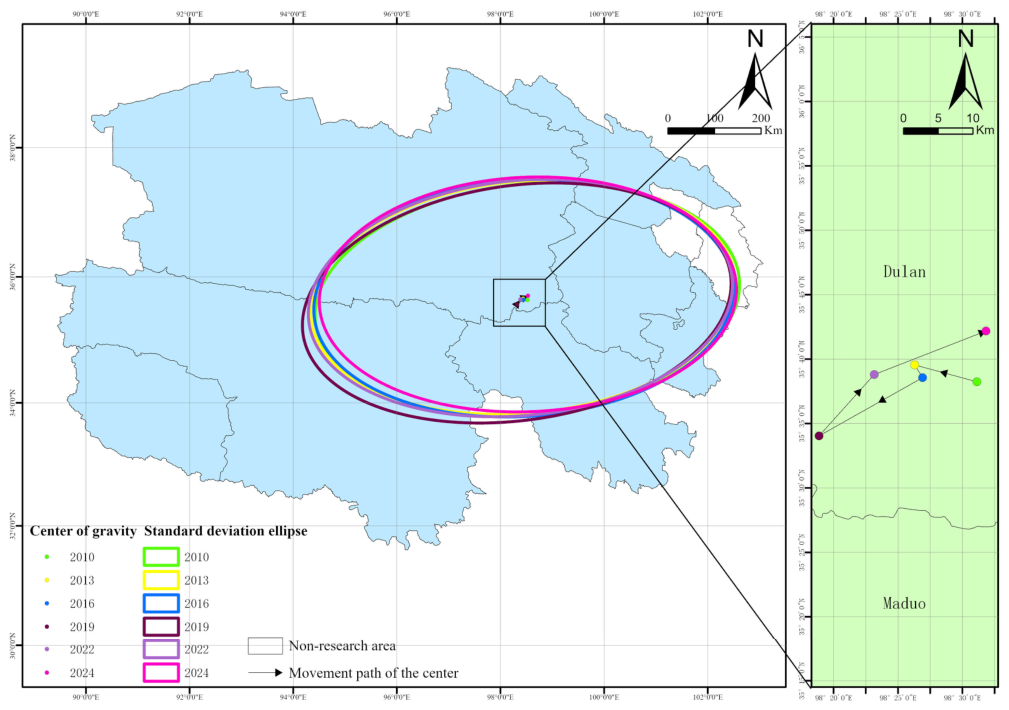
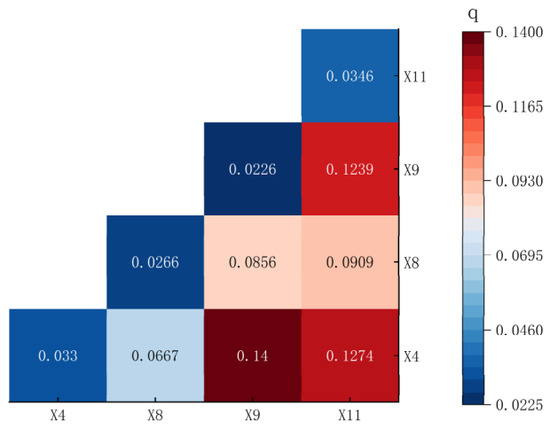
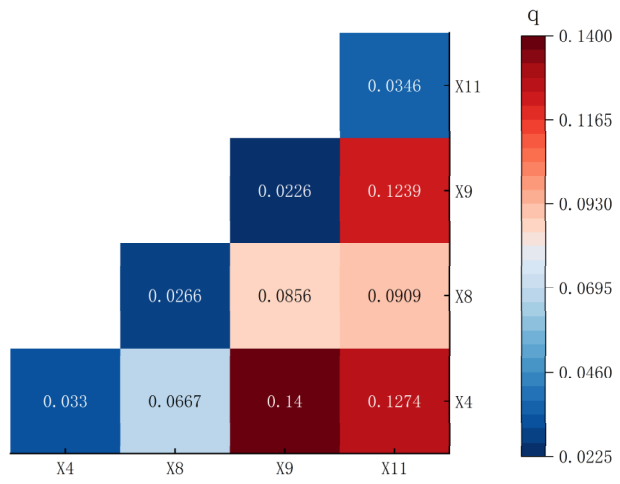

Disclaimer/Publisher’s Note: The statements, opinions and data contained in all publications are solely those of the individual author(s) and contributor(s) and not of MDPI and/or the editor(s). MDPI and/or the editor(s) disclaim responsibility for any injury to people or property resulting from any ideas, methods, instructions or products referred to in the content. |
© 2026 by the authors. Licensee MDPI, Basel, Switzerland. This article is an open access article distributed under the terms and conditions of the Creative Commons Attribution (CC BY) license.