


Abstract
Due to climate change, the frequency and intensity of extreme rainfall events have increased in South Korea, resulting in recurrent urban flooding that exceeds the design capacity of conventional drainage systems. In the Dangjin Traditional Market area, comparable rainfall conditions in 2024 and 2025 caused repeated flooding, suggesting that structural improvements implemented without quantitative verification do not necessarily guarantee effective flood prevention. This study aims to support sustainable urban flood management by assessing the pre-implementation effectiveness of structural flood mitigation measures using a spatially explicit simulation approach. An ArcGIS-based rainfall–inundation simulation was conducted by integrating a 1 m LiDAR-derived digital elevation model, land cover data classified using a pixel-based Support Vector Machine, detailed building and channel datasets, and observed hourly rainfall from the July 2025 extreme event. Scenarios with and without the application of levee heightening and drainage capacity expansion were compared under identical rainfall conditions. The results indicate that the application of structural measures leads to a clear reduction in inundation extent and water depth. The proposed framework provides a practical simulation-based decision-support tool for verifying flood mitigation measures in advance and for promoting sustainable flood risk management in urban areas prone to recurrent flooding.
1. Introduction
Due to climate change, the frequency and intensity of extreme rainfall events have increased worldwide, including in South Korea, leading to a growing risk of urban flooding [1]. Changes in rainfall characteristics, such as short-duration and high-intensity precipitation, often exceed the design capacity of conventional urban drainage systems and river management infrastructure, increasing the spatial extent and severity of floods in urban areas [2,3,4,5]. As a result, urban flooding has become a critical challenge to sustainable urban development and the long-term resilience of cities under changing climatic conditions.
In response to increasing flood risk, various structural flood mitigation measures, including improving drainage systems and improving rivers, have been proposed and implemented in many urban areas [6]. However, the effectiveness of such measures strongly depends on their location, scale, and interaction with local topography and drainage networks [7,8]. When flood mitigation strategies are formulated without quantitative, pre-implementation evaluation under realistic rainfall conditions, their actual effectiveness in reducing inundation remains uncertain. Previous studies have pointed out that mitigation measures designed or implemented without sufficient numerical verification may fail to prevent flooding in extreme events, potentially resulting in the recurrence of similar flood damage in the same areas [9].
Therefore, recent research has emphasized the importance of numerical flood simulation as a tool for evaluating the performance of structural mitigation measures prior to implementation [10]. By integrating observed rainfall data with detailed information on terrain, land use, and drainage structures, simulation-based approaches enable the evaluation of inundation mechanisms and the comparison of mitigation scenarios under consistent conditions [11]. Nevertheless, many existing studies have focused primarily on flood risk mapping or the spatial distribution of hazards using techniques such as multi-criteria spatial evaluation (SMCE) or hydraulic modeling based on HEC-RAS [12,13]. Although these approaches are effective for identifying flood-prone areas or improving hydraulic representation, they are often limited in their ability to quantitatively compare flood changes before and after the application of specific structural measures or to verify their relative effectiveness under identical rainfall conditions.
Against this background, this study aims to quantitatively evaluate the effectiveness of structural flood mitigation measures prior to implementation using a spatially explicit GIS-based rainfall–inundation simulation framework. The extreme rainfall event that occurred in July 2025 in Dangjin City, South Korea, which caused repeated flooding in the Dangjin Traditional Market district under conditions similar to those observed in the previous year, was selected as a representative case study. By conducting simulations that incorporate observed rainfall data and high-resolution spatial datasets, this study compares changes in the depth and spatial extent of the flood between scenarios with and without the application of measures such as lowering the channel bed, expansion of the drainage capacity, and levee heightening.
Unlike conventional urban flood studies that focus primarily on hazard mapping or improving hydraulic accuracy alone, this study develops a simulation-based decision-support framework for pre-implementation verification of structural flood mitigation strategies. The proposed framework integrates high-resolution LiDAR-derived topography, building-scale flow obstruction representation, spatially distributed infiltration scenarios, and hydraulic interaction between urban drainage systems and river channels within a unified GIS-based rainfall–inundation modeling environment. Furthermore, by employing an observed extreme rainfall event rather than hypothetical design storms, the study enables a more realistic assessment of mitigation performance under recurrent flood conditions. This approach supports threshold-oriented mitigation planning by linking hydraulic indicators such as inundation depth reductions and overtopping risk to resilience-based decision-making for vulnerable urban commercial districts.
2. Materials and Methods
2.1. Study Area
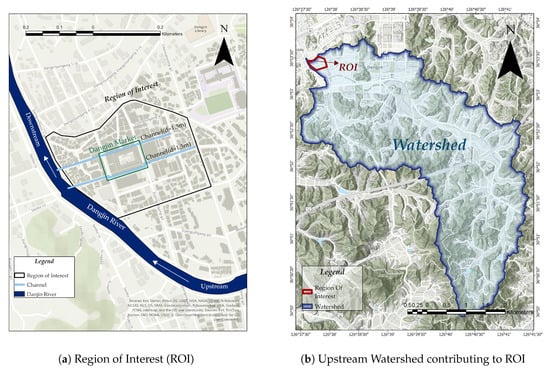
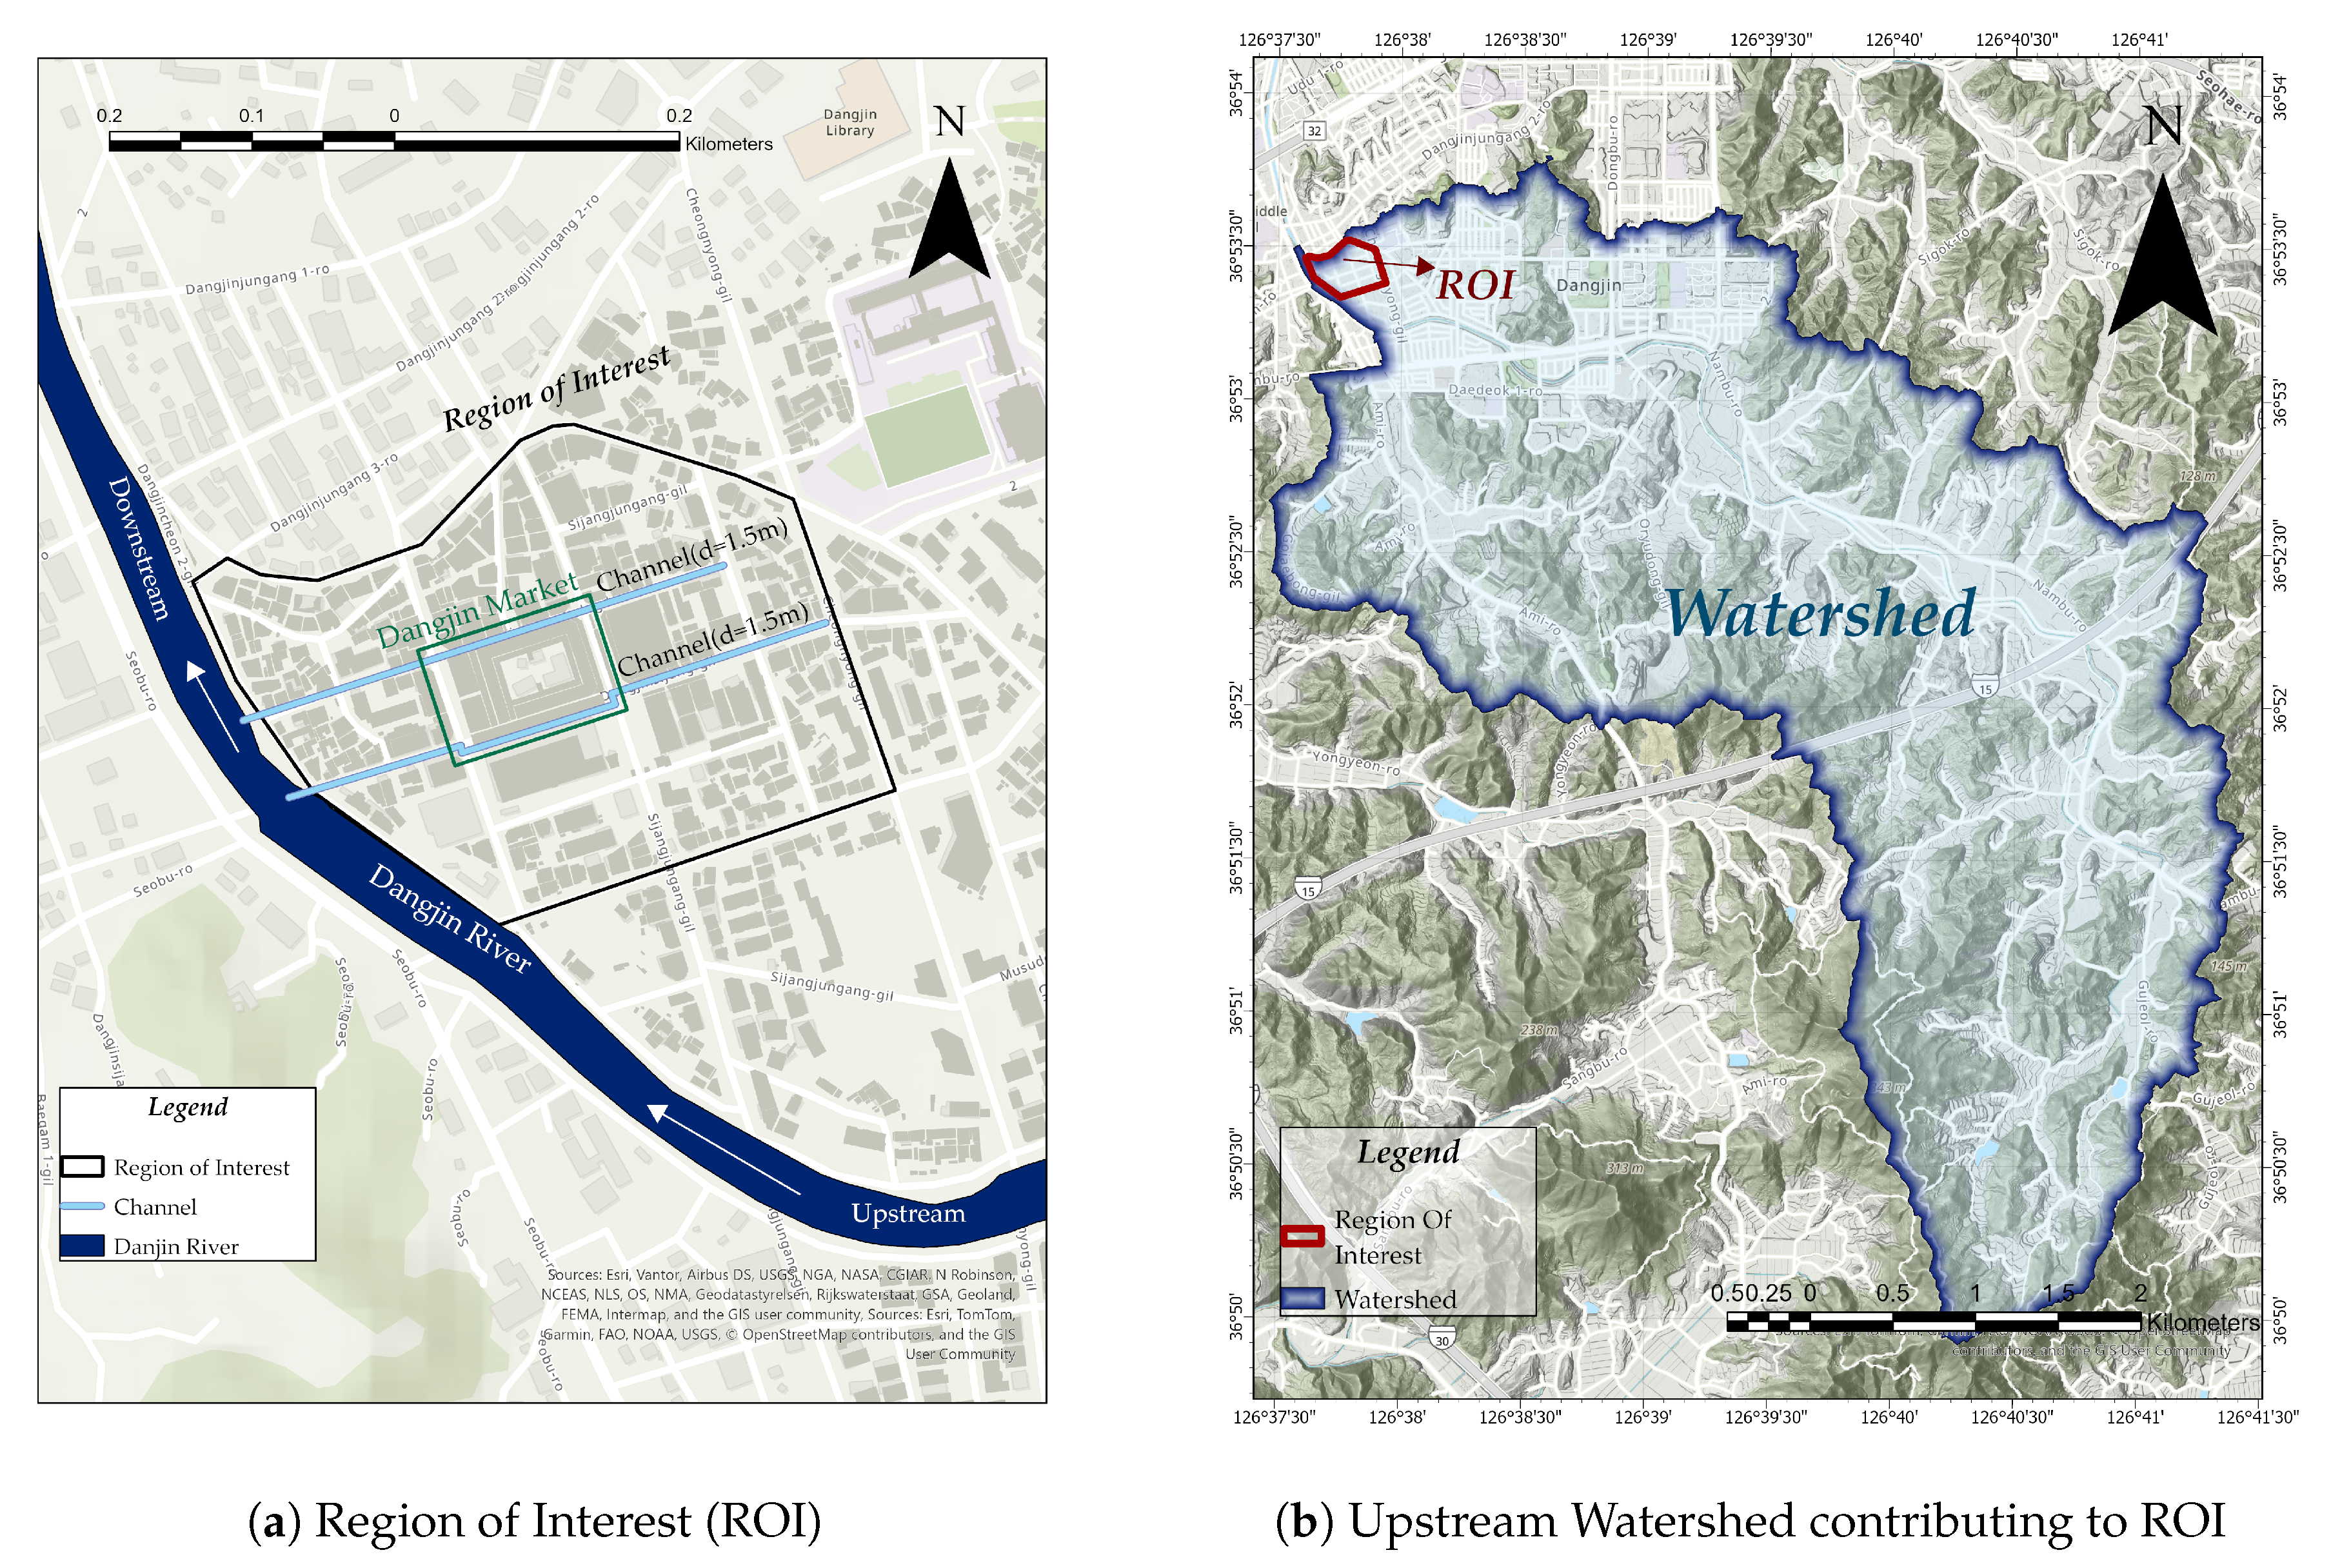
This study focuses on the Dangjin Traditional Market and its adjacent commercial district, located in Dangjin City, South Chungcheong Province, South Korea (Figure 1). The area is characterized by dense infrastructure development along the Dangjin River and is topographically low-lying, making it highly susceptible to pluvial flooding during high-intensity, short-duration rainfall events [14]. In particular, during the extreme rainfall event in July 2025, the area experienced widespread inundation, leading to the suspension of market activities and human casualties in nearby neighborhoods. These repeated flood events highlight the area as a critical urban flood hotspot, requiring detailed hydrological investigation and targeted mitigation strategies.
Figure 1.
Study area and watershed delineation. (a) presents the detailed ROI including the Dangjin Traditional Market and surrounding urban infrastructure. (b) shows the upstream watershed that drains toward the Region of Interest (ROI), with the pour point and channel networks.
To comprehensively assess the hydrological processes that contribute to flooding in the market area, the study delineated not only the immediate surroundings but also the entire upstream watershed, which generates runoff toward the site [15,16]. This approach ensures a more complete understanding of surface runoff generation and flow concentration patterns that influence the flood-prone zone.
The LiDAR-based digital elevation model (DEM) with a 1-m resolution was used to accurately capture the micro-topographic characteristics of the urban terrain [17,18]. The DEM preprocessing and delimitation of the watershed were conducted in ArcGIS following a standard hydrological analysis workflow: Fill → Flow Direction → Flow Accumulation → Pour Point → Watershed [19]. The D8 algorithm (eight-directional) was used in the Flow Direction step to route the flow based on the steepest descent from each cell. The drain points were identified near areas where concentrated flooding was observed during the 2025 event, aligned with the maximum flow accumulation and the downstream outlet.
The delineated watershed and ROI form the spatial foundation for the flood simulation and mitigation assessment. As shown in Figure 1, panel (a) highlights the ROI focused on the Dangjin Traditional Market area, and panel (b) presents the entire upstream watershed that contributes to flood inflow.
2.2. Overall Research Workflow
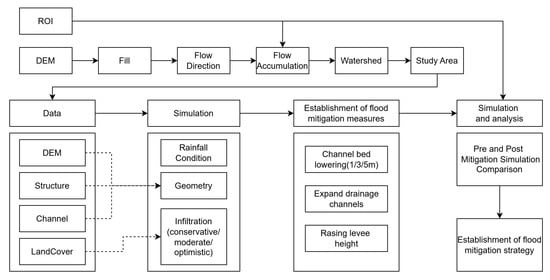
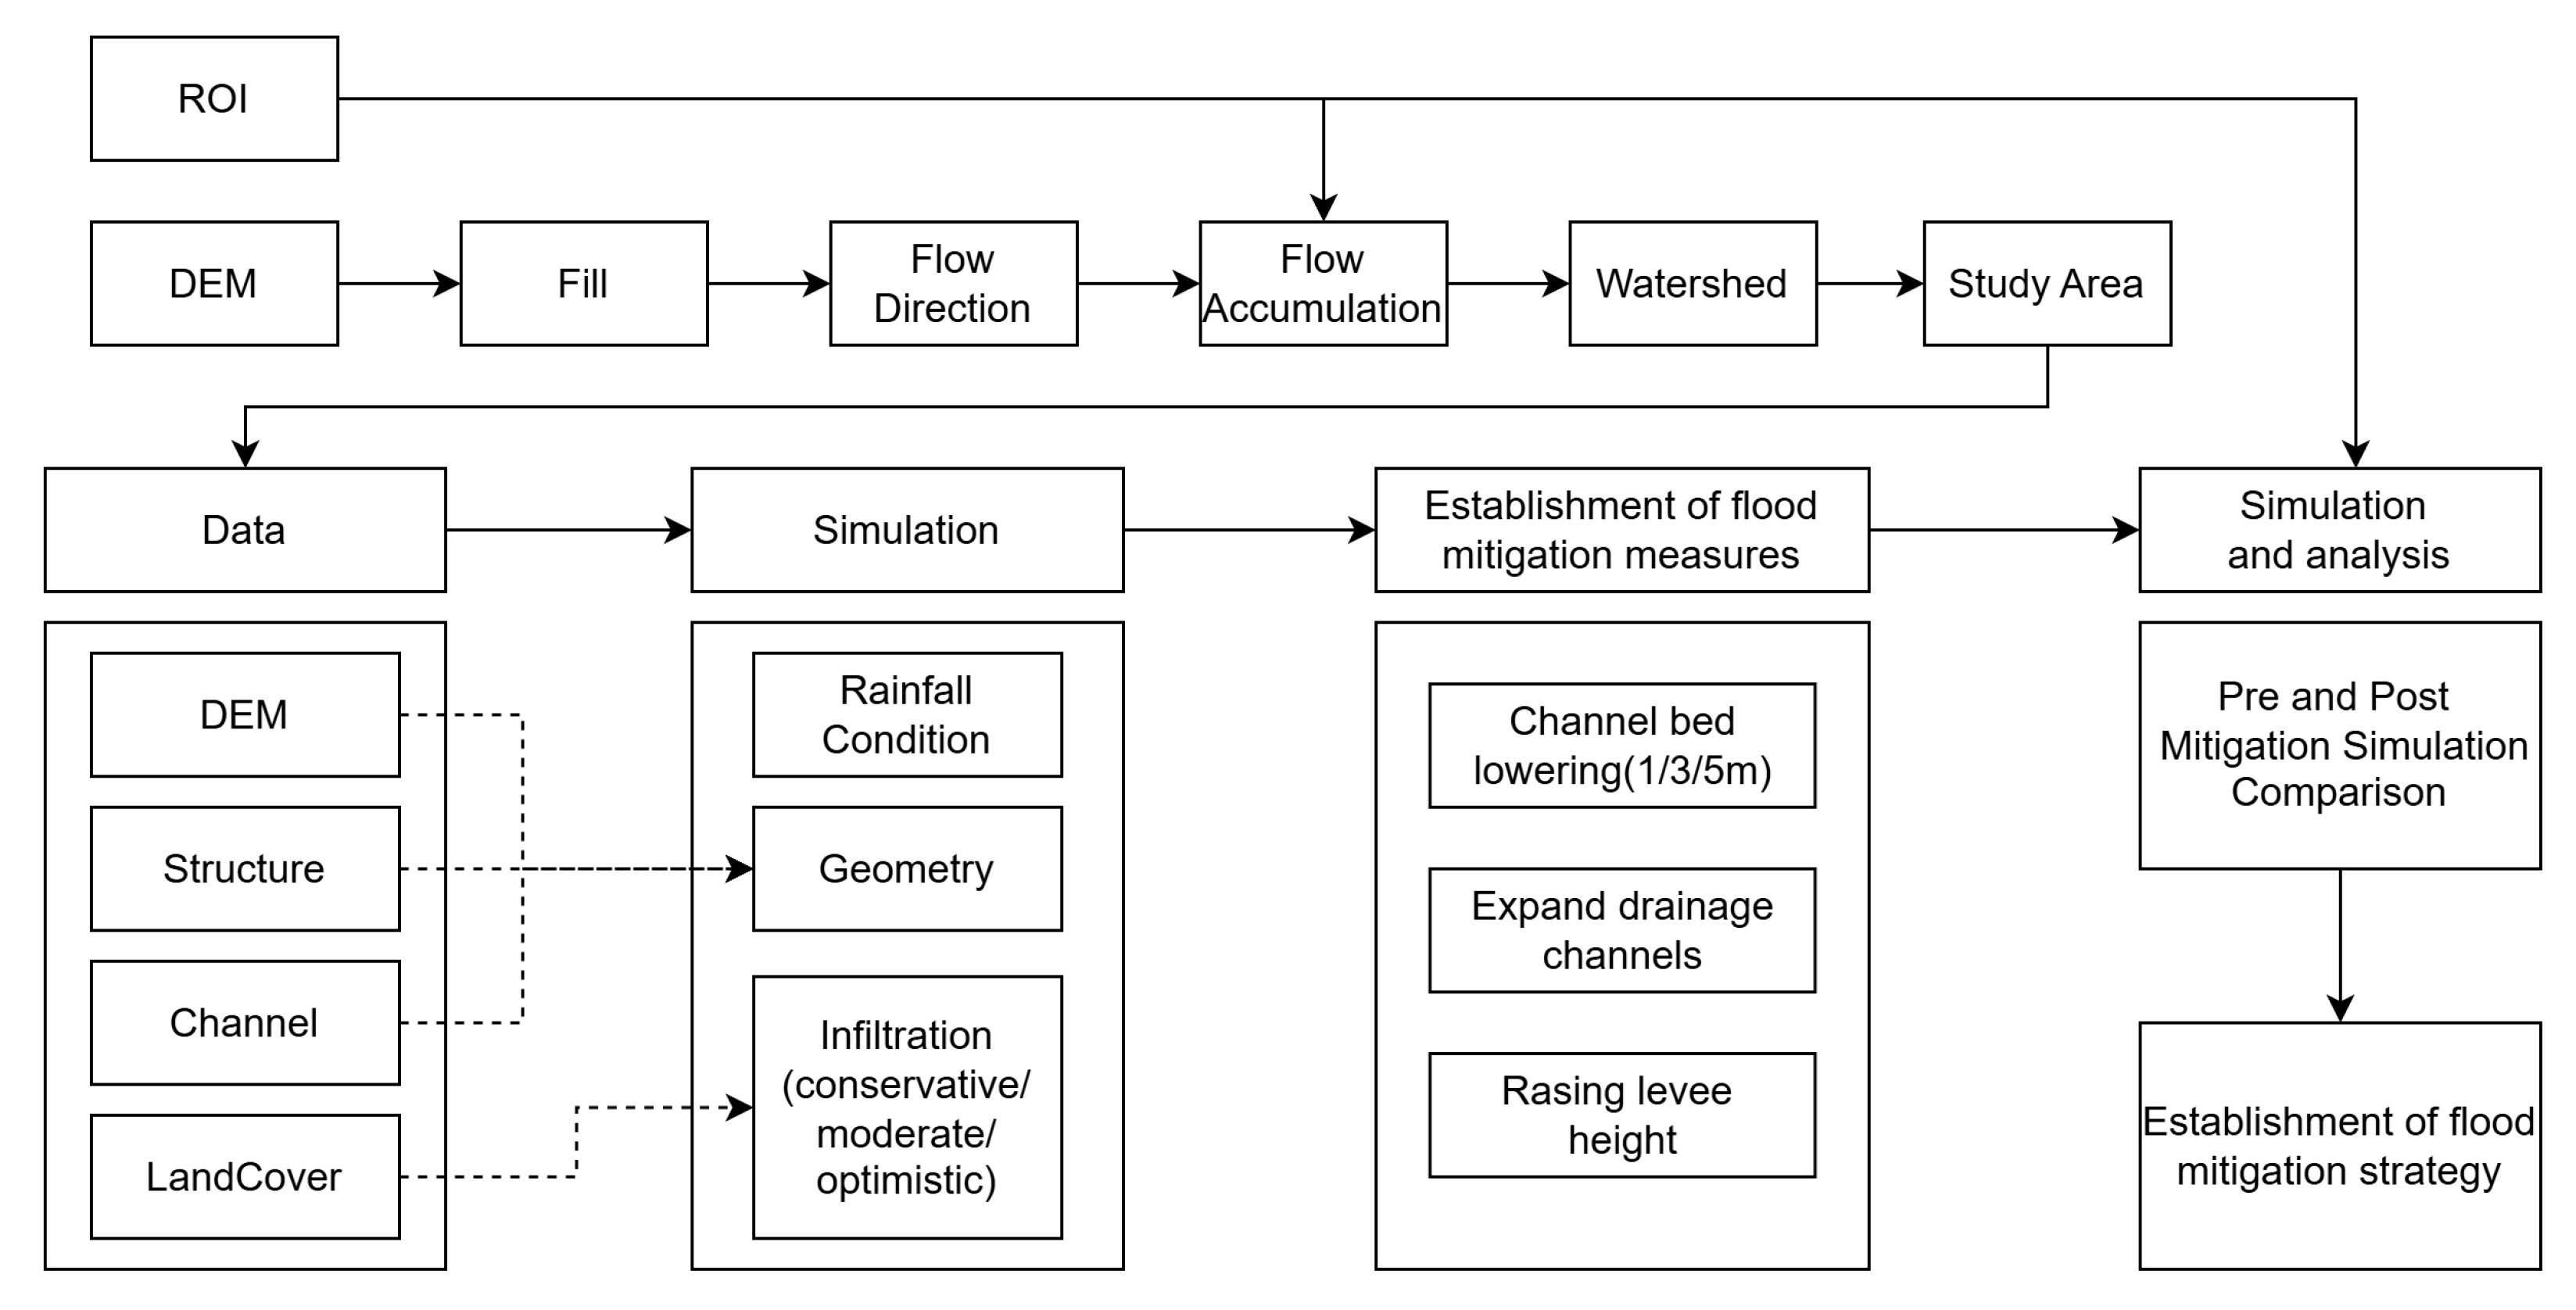
Figure 2 summarizes the overall workflow of this study. First, the Dangjin Traditional Market and the adjacent commercial area, which experienced consecutive flooding events over two years, were defined as the region of interest (ROI). To account for the hydrological influence of upstream inflow into the ROI, a 1 m resolution LiDAR-derived DEM was used to delineate the contributing watershed, which was subsequently defined as the study area.
Figure 2.
Overall workflow of the study: (i) watershed delineation and ROI definition from DEM-based hydrologic preprocessing; (ii) rainfall–runoff and inundation simulation using ArcGIS Pro; and (iii) establishment of structural mitigation scenarios and pre-/post-mitigation comparison.
Then, various spatial datasets, including topography, land cover, hydraulic structures, and channel geometry, were collected and integrated within the defined study area. Based on these datasets, the rainfall-runoff and flooding processes were simulated using the Flood Simulation (Rainfall Simulation) framework in ArcGIS Pro 3.5 under observed rainfall conditions.
Following the initial simulation, the results were analyzed to identify the primary mechanisms driving inundation, with particular attention to the contribution of upstream inflow, the increase in river stage, and the limitations of drainage capacity. Based on this analysis, structural mitigation measures were established, including lowering the channel bed (1 m, 3 m, and 5 m), expanding the drainage channels, and improving the height of the levee.
Finally, flood simulations were performed for each mitigation scenario under identical hydrological forcing and loss conditions, and the pre- and post-mitigation results were quantitatively compared using flood extent and depth-related indicators. This stepwise approach enables a systematic evaluation of mitigation effectiveness and supports the development of an optimal flood mitigation strategy.
The workflow was designed not merely as a modeling procedure but as a transferable planning-oriented framework that enables quantitative comparison of alternative mitigation strategies under consistent hydrological forcing and spatial boundary conditions.
2.3. Input Data Preparation
Accurate flood inundation modeling in urbanized environments is highly sensitive to the spatial resolution, vertical fidelity, and physical consistency of input datasets. To represent flow paths driven by topography, spatially heterogeneous runoff generation and urban obstructions, this study integrated high-resolution topography (LiDAR-derived DEM), high-resolution aerial orthophotographs-based land cover classification and structure/channel datasets into a unified geospatial framework.
2.3.1. Topographic Data (DEM)
DEM of 1 m-resolution was generated by interpolating drone LiDAR point-cloud data. High-resolution DEMs are essential for urban flood analysis because micro-topographic controls can significantly alter overland routing and pond patterns. The DEM was hydrologically conditioned using sink filling and flow-route preprocessing to ensure consistent drainage connectivity prior to the definition of the watershed and ROI [17].
2.3.2. Land Cover and Infiltration Rate
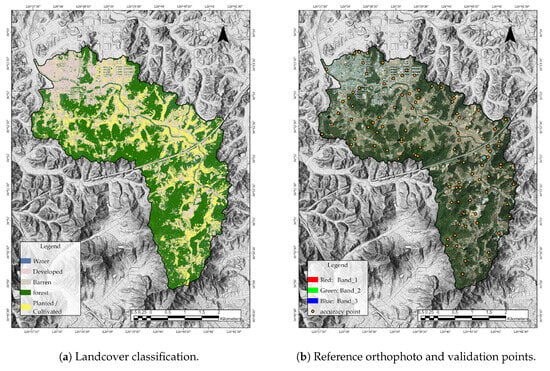
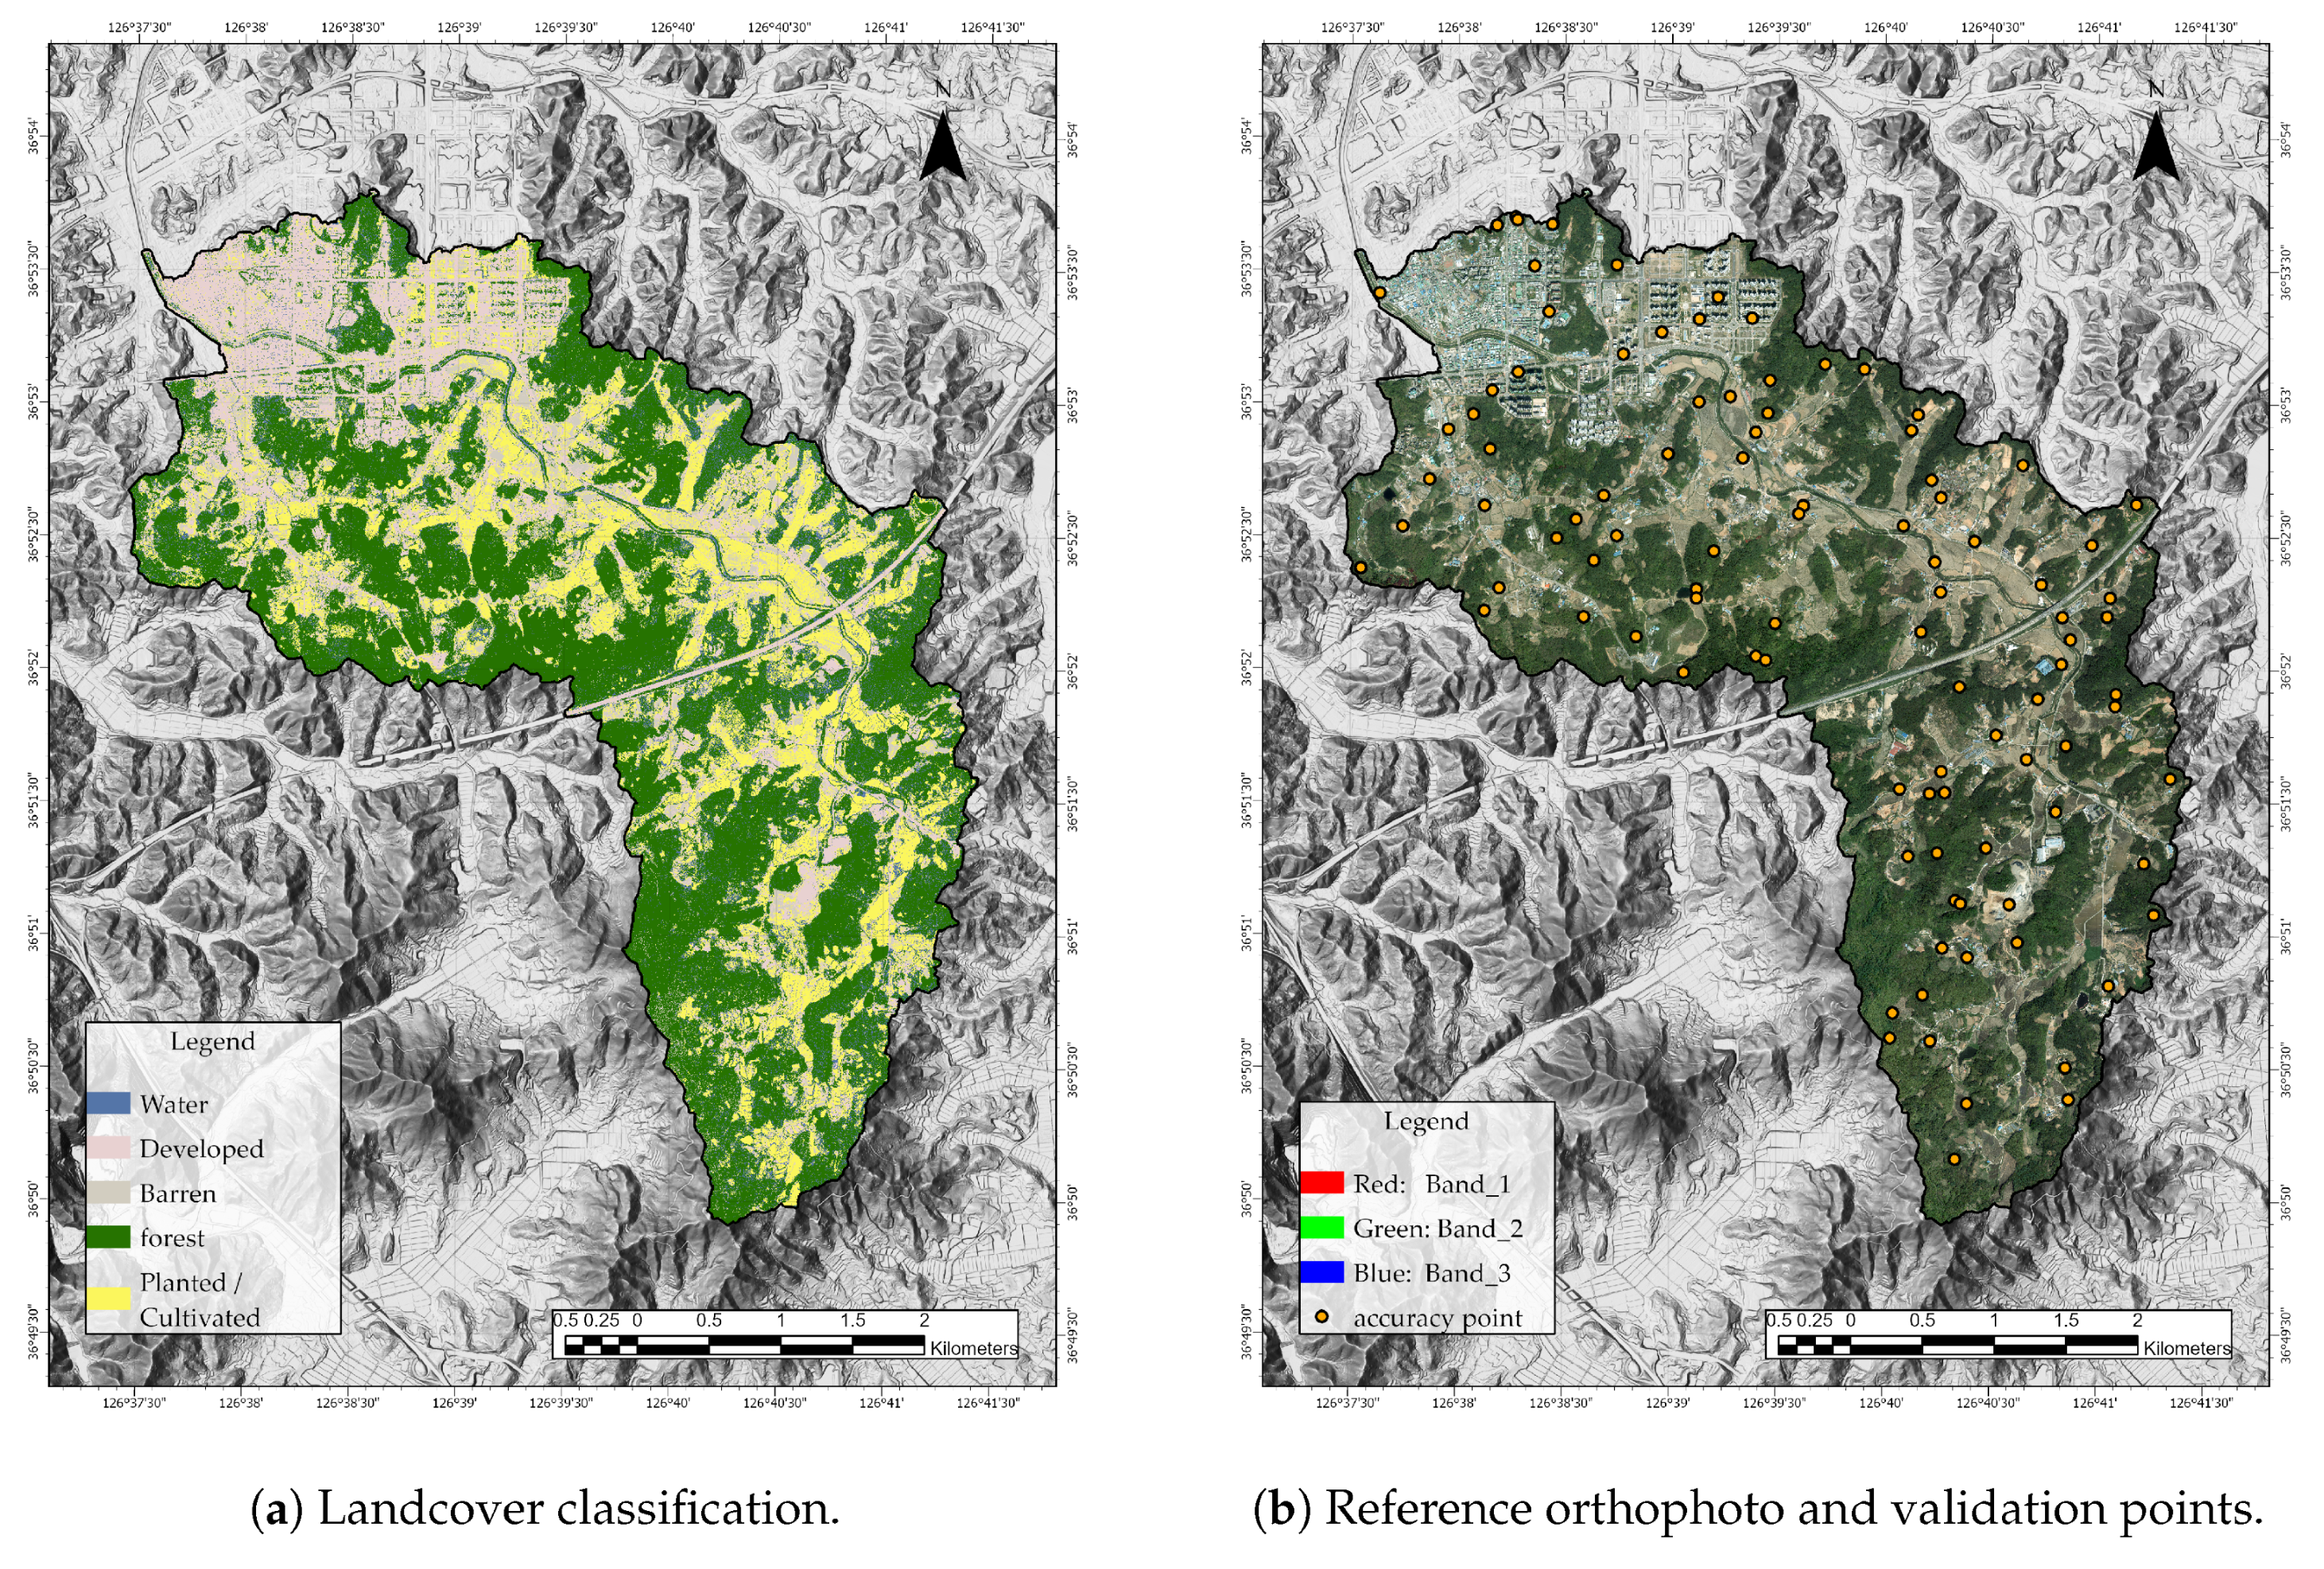
Land cover was derived from high-resolution aerial orthophotographs (1 m spatial resolution) using a pixel-based Support Vector Machine (SVM) classification approach. The classification was performed using the red, green and blue spectral bands (RGB), and the study area was categorized into five classes of land-cover: water, developed, barren, forest and planted/cultivated areas [20,21].
Training samples were collected through visual interpretation of orthophotographs. For each land-cover class, 20 representative polygons were manually delineated to capture spatial variability in surface characteristics. From each polygon, 100 training points were randomly extracted, resulting in a balanced and spatially distributed training dataset.
An SVM classifier with a radial basis function (RBF) kernel was used due to its strong generalization capability and robust performance in high-dimensional feature spaces, even with limited training samples [22,23].
The classification accuracy was assessed using an independent validation dataset consisting of 100 randomly generated accuracy assessment points. The reference class labels were assigned through detailed visual interpretation of the aerial images. The resulting confusion matrix yielded an overall precision of 81% and a Kappa coefficient of 0.71, indicating substantial agreement between the classified land-cover map and the reference observations.
The final land-cover data set was later used to assign spatially distributed infiltration parameters for rainfall–runoff and flood inundation simulations. The classification results, reference orthophotographs, and spatial distribution of the validation points are presented in Figure 3.
Figure 3.
Land-cover classification and accuracy assessment. (a) Land-cover map derived from high-resolution aerial orthophotographs. (b) Aerial image used as reference data and spatial distribution of accuracy assessment points.
Based on the previously derived land-cover classification map, infiltration rates were assigned to five land-cover classes: water, developed, barren, forest and planted/cultivated. Since previous studies have shown that the infiltration capacity within the same land-cover class can vary substantially depending on the texture of the soil, the sealing conditions of the surface, and the levels of compaction, in this study three scenarios were defined: conservative, moderate and optimistic [24].
For water bodies, the infiltration rate was fixed at 0 mm/h in all scenarios. In DEM-based flood simulations, surface water areas primarily function as hydraulic storage and flow domains rather than infiltration zones. Setting infiltration to zero helps isolate surface water depth variations and prevents unrealistic loss of water volume.
Developed areas, including asphalt pavement and building roofs, generally exhibit very low permeability. Previous research indicates that infiltration rates typically range from 0 to 1 mm/h. Therefore, values of 0 mm/h, 0.5 mm/h, and 1 mm/h were assigned for the conservative, moderate, and optimistic scenarios, respectively.
Barren land shows a wide range of infiltration capacity depending on the surface conditions. The compacted bare soil typically exhibits infiltration rates of approximately 1.2 to 50 mm/h, while the gravel or coarse surfaces may reach the upper limit of this range. Taking into account the typical exposed and partially compacted ground conditions observed in the Dangjin study area, infiltration rates of 1.2 mm/h, 20 mm/h and 50 mm/h were assigned for the three scenarios.
Forest areas demonstrate a strong dependence on the texture of the underlying soil. Previous studies report infiltration ranges of approximately 2.25–2.7 mm/h for clay soils, 16.5–20 mm/h for silt soils, and 176.3–211.5 mm/h for sandy soils. Consequently, representative values of 2.5 mm/h, 18 mm/h and 194 mm/h were assigned for conservative, moderate and optimistic conditions, respectively.
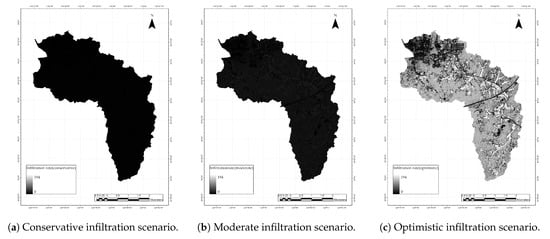
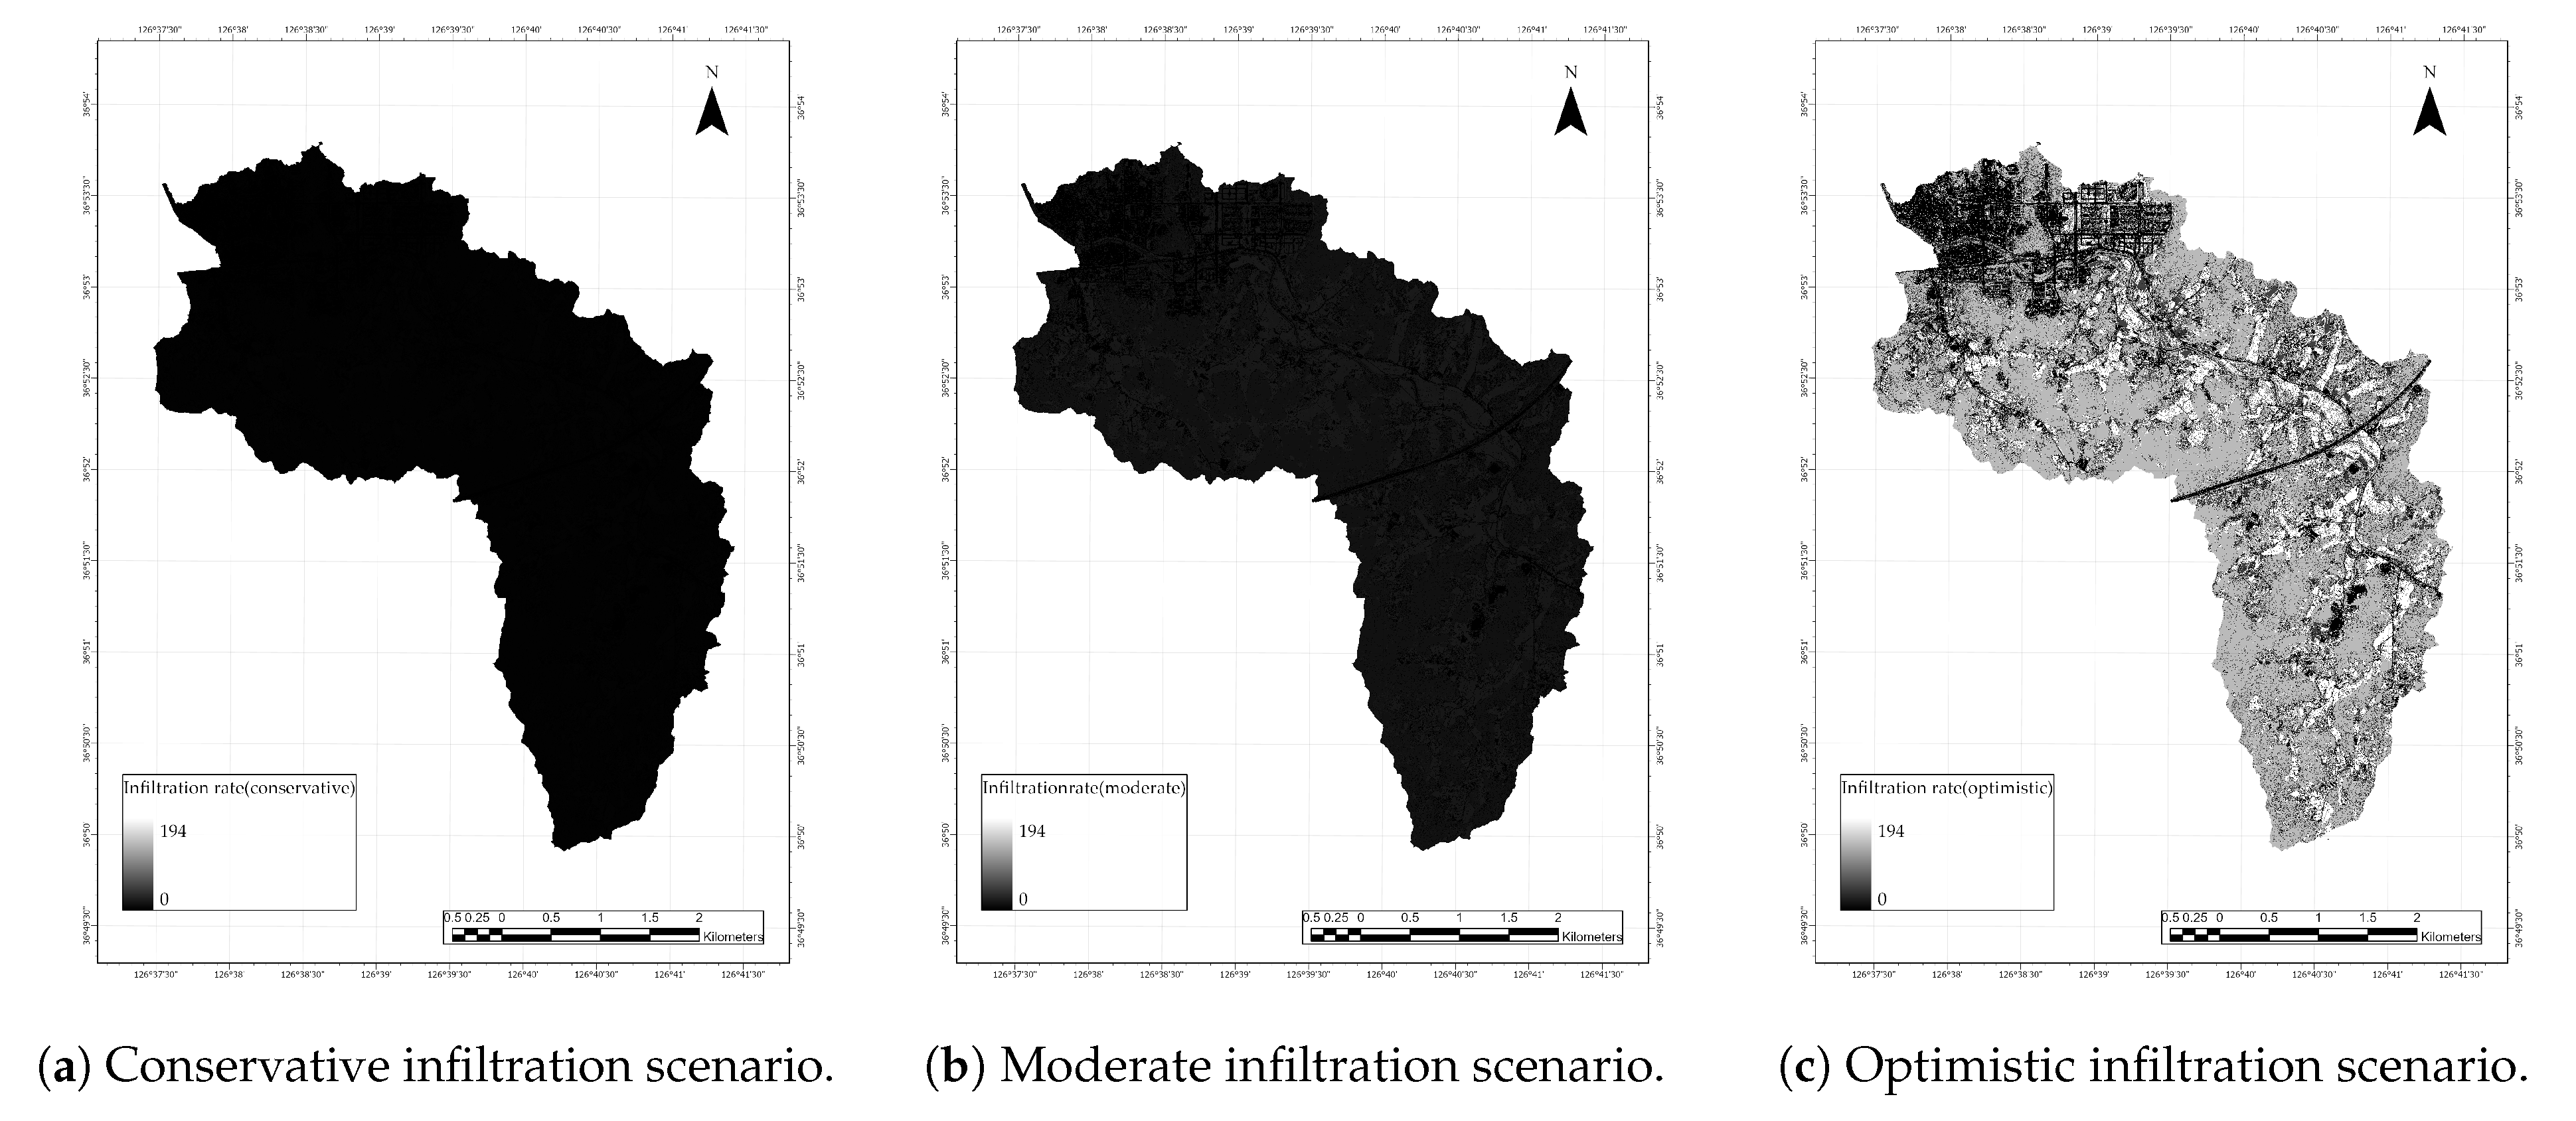
Similarly, planted or cultivated land exhibits infiltration rates of approximately 1.5–2.1 mm/h in clay soils, 11–15.4 mm/h in silt soils, and 117.5–164.5 mm/h in sandy soils. Based on these reported ranges, infiltration rates of 1.8 mm/h, 13.2 mm/h, and 141 mm/h were assigned for the three scenarios. The detailed infiltration rate settings used in this study are summarized in Table 1, and the spatial distribution of the three infiltration scenarios in the study area is illustrated in Figure 4.
Table 1.
Infiltration rates assigned to each land-cover class under conservative, moderate, and optimistic scenarios based on [24].
Figure 4.
Spatial distribution of infiltration rate scenarios used for uncertainty and sensitivity analysis in rainfall–inundation simulation.
Manning’s roughness coefficients were assigned based on commonly reported hydraulic resistance values for different types of land cover provided by the United States Geological Survey (USGS) and standard open-channel hydraulic references. These values reflect typical flow resistance conditions considering vegetation density, surface obstruction, and micro-topographic irregularities in floodplain environments.
Since the objective of this study was to evaluate flood responses under representative surface conditions rather than extreme hydraulic assumptions, a single moderate roughness value was assigned to each land-cover class. Consequently, Manning’s n values of 0.030, 0.120, 0.045, 0.160 and 0.090 were applied to water, developed, barren, forest and planted/cultivated areas, respectively (Table 2).
Table 2.
Moderate Manning’s roughness coefficients assigned to each land-cover class based on USGS hydraulic resistance guidelines.
2.3.3. Structure and Channel Data
Building footprints and heights were obtained from the V-World digital building dataset to represent urban obstructions and flow diversions. Incorporating building geometry can improve flood realism by reproducing blockage, deflection, and localized ponding in built-up areas. In addition, the alignment and representative cross-sectional properties of the Dangjincheon and adjacent drainage channels were incorporated to reflect the conveyance capacity and the potential overflow behavior in the simulation environment.
2.4. Simulation and Analysis
Flood inundation was simulated using the Rainfall Simulation capability in ArcGIS Pro 3.5, which implements a simplified two-dimensional (2D) hydraulic routing scheme for rainfall-driven overland flow. The framework computes the depth of the surface water that is varying in time on a gridded computational mesh derived from the digital elevation model (DEM). Water is treated as a single-phase incompressible fluid and is redistributed through cell-to-cell exchanges driven primarily by water-surface gradients while accounting for hydrological inputs (precipitation), optional sources/sinks, and losses such as infiltration and evaporation.
2.4.1. Rainfall Condition Setting
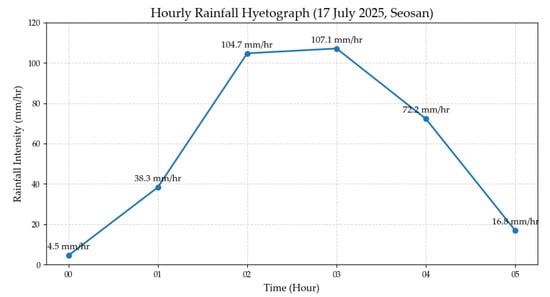
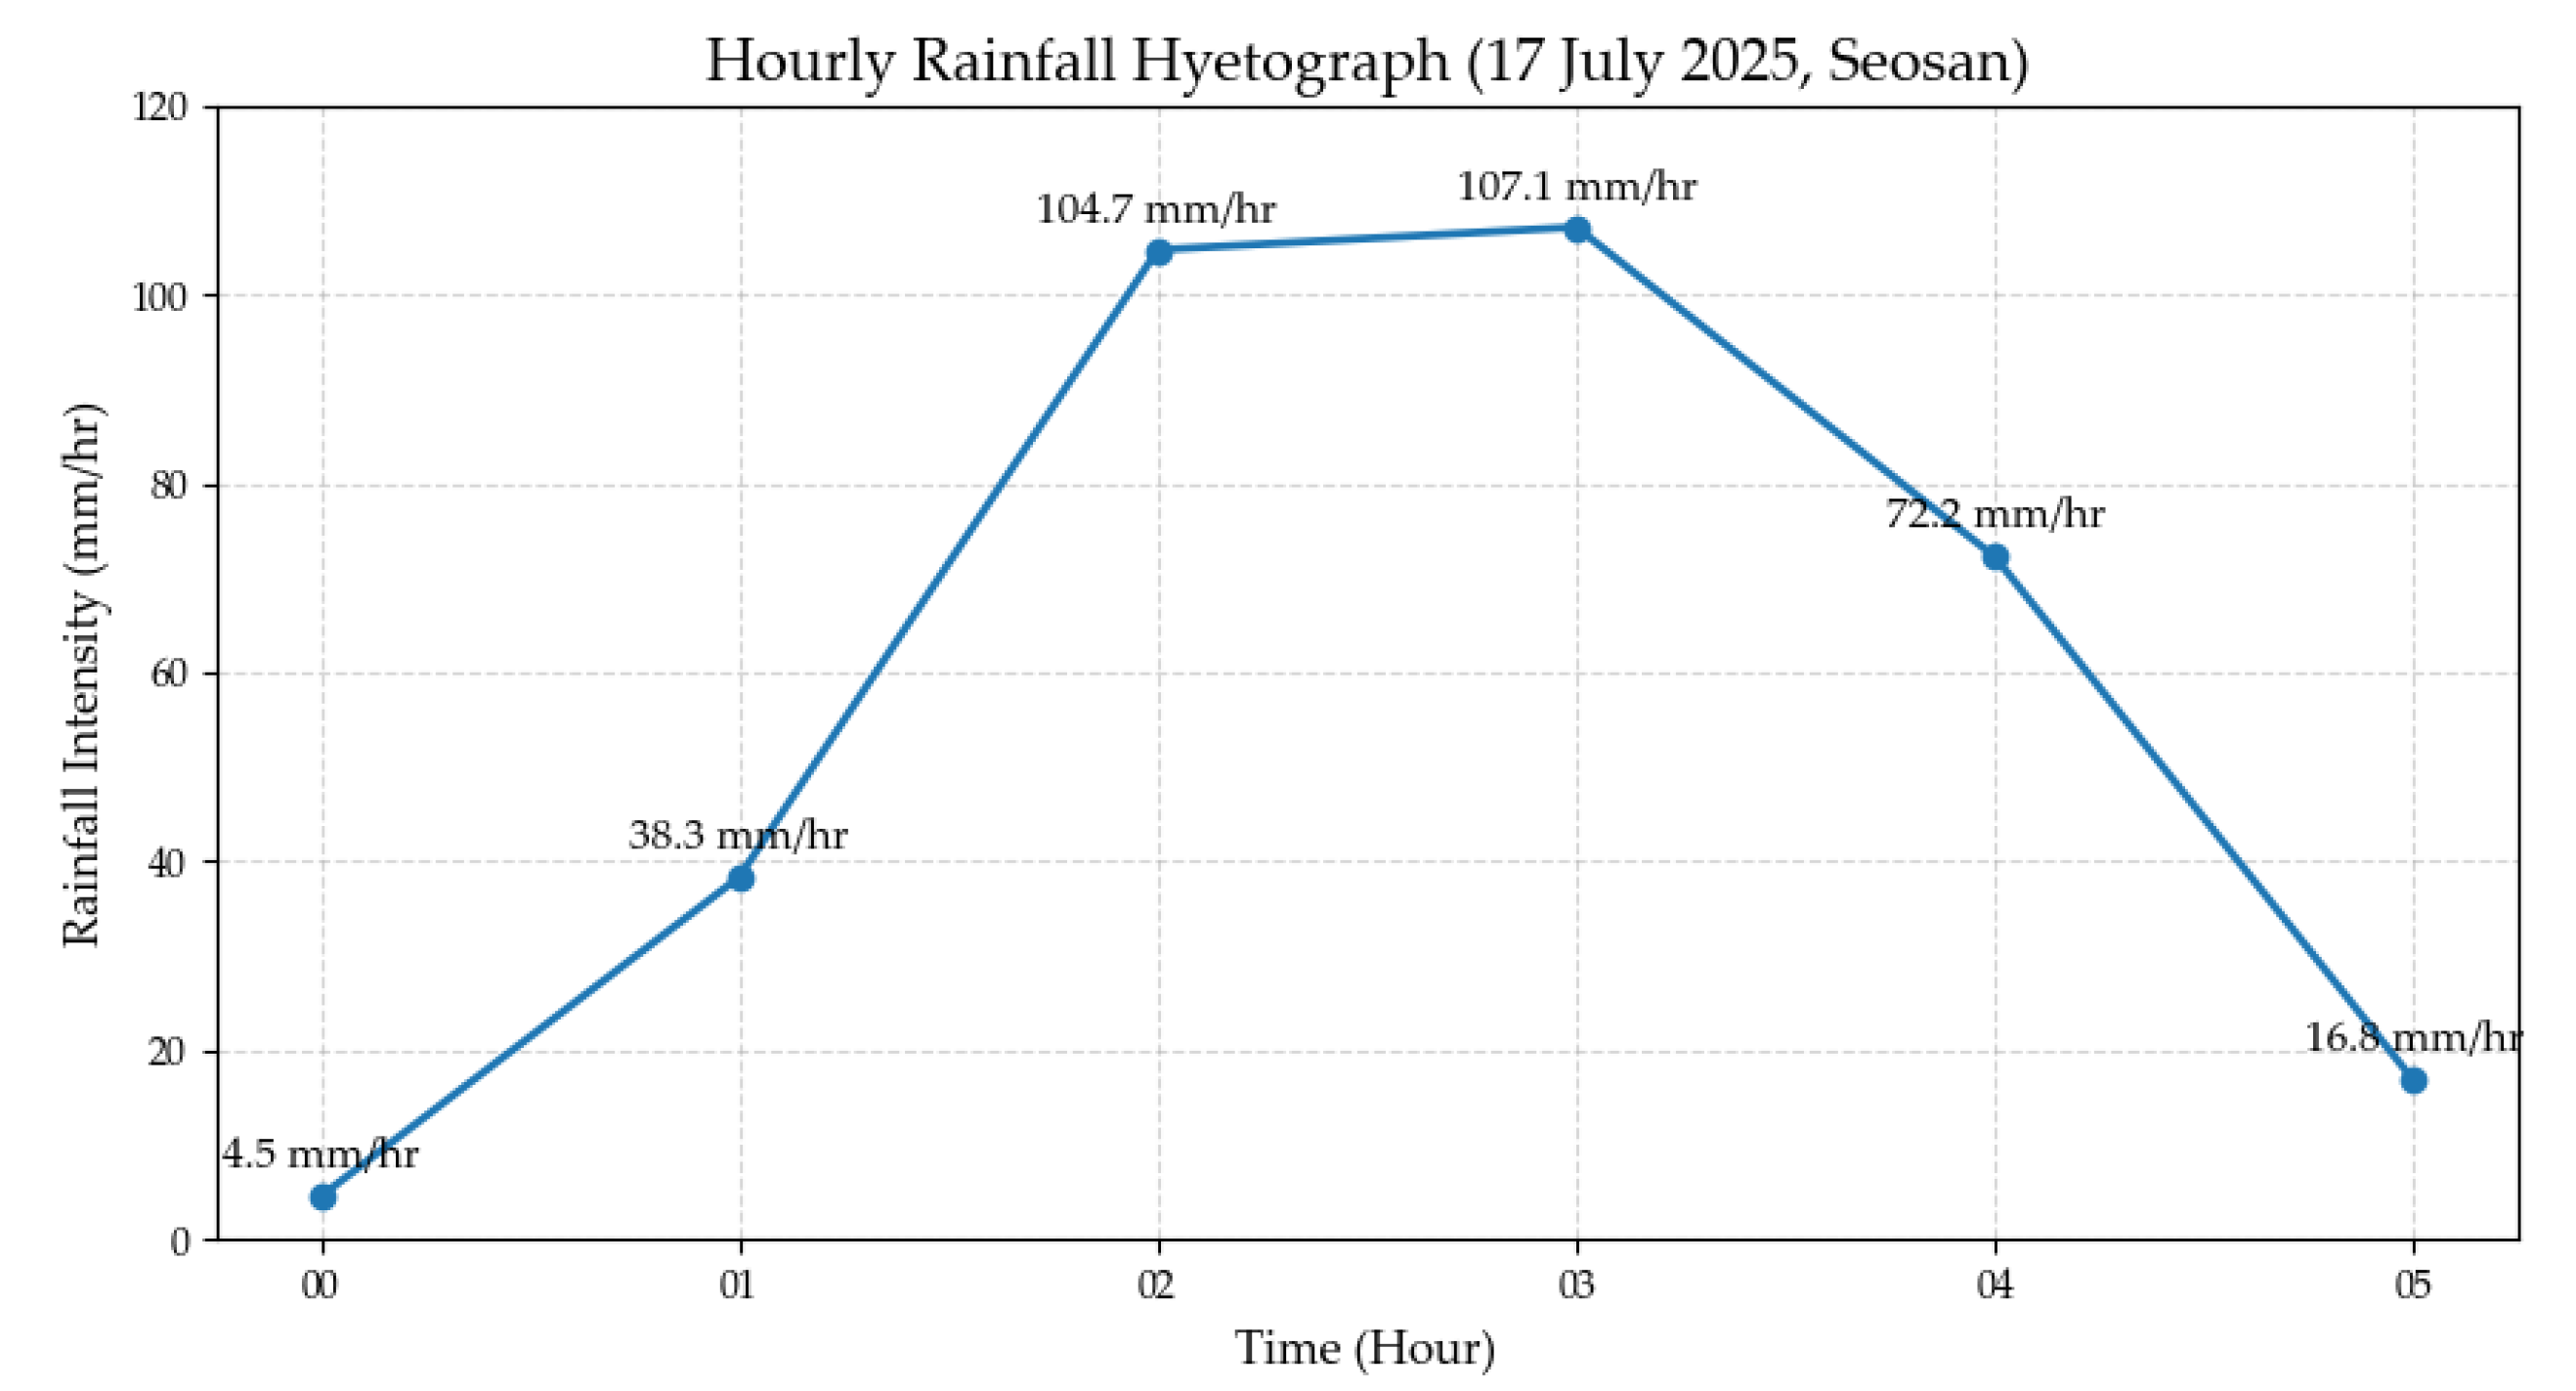
Rainfall forcing was defined on the basis of the extreme rainfall event that occurred in July 2025 in Dangjin, Republic of Korea. The hourly rainfall intensities recorded at the nearest meteorological station (Seosan station) were applied to preserve the observed temporal structure of the storm. The five-hour hyetograph consisted of 38.3 mm, 104.7 mm, 107.1 mm, 72.2 mm and 16.8 mm, resulting in a cumulative rainfall of 339.1 mm. By directly adopting the event-based hyetograph, the simulation was designed to reproduce realistic runoff generation and inundation dynamics under observed high-intensity rainfall conditions, rather than relying solely on hypothetical design storms. This approach enables a more reliable assessment of flood responses and mitigation effectiveness under real-world extreme rainfall conditions. The temporal distribution of the rainfall event is illustrated in Figure 5.
Figure 5.
Hourly rainfall hyetograph observed at Seosan station on 17 July 2025.
2.4.2. 3D Simulation Environment and Hydraulic Representation
To represent urban flow obstruction and preferential pathways more realistically, a 3D simulation environment was constructed by integrating the DEM with building-height information and channel geometry. The footprints and heights of the buildings were incorporated to account for blockages, flow diversion, and pond effects adjacent to the structures. The channel alignments and representative cross-sectional properties of Dangjincheon and nearby drainage features were also reflected to emulate the propagation of conveyance, overflow, and flooding along the drainage network.
2.4.3. Spatially Distributed Infiltration Parameterization
Infiltration was spatially parameterized using the land-cover map derived from high-resolution aerial orthophotographs (Section 2.3), which provides a more detailed representation of the characteristics of the urban surface compared to medium-resolution satellite imagery. The classification of land-cover was used to assign spatially distributed infiltration rates throughout the study domain, reflecting the heterogeneous hydrological response of different surface types, including developed areas, barren land, vegetated areas and cultivated land.
To account for inherent uncertainty and variability in infiltration capacity due to soil texture, surface sealing conditions, and compaction levels, three infiltration scenarios were defined: conservative, moderate, and optimistic. These scenarios represent a range of plausible hydrological conditions, from limited infiltration capacity to enhanced infiltration potential.
Rather than adopting a single set of deterministic parameters, the use of multiple infiltration scenarios enables a systematic sensitivity analysis of flood responses to infiltration variability. This approach allows for a more robust evaluation of the relative influence of infiltration processes on inundation dynamics and ensures that the effectiveness of structural mitigation measures is assessed under a spectrum of realistic surface conditions.
2.4.4. Rainfall Simulation Model in ArcGIS Pro
ArcGIS Pro simulates shallow overland flow driven by rainfall on a regular square-cell mesh in which each cell has a fixed ground elevation and a water depth varying over time . The water-surface elevation is therefore expressed as
For a cell with side length l (cell area ), the volume of stored water is
During a discrete internal time step , the change in storage is related to the change in water depth as
Continuity Equation (Mass Conservation)
The rate of change in water depth within each grid cell is governed by a mass-balance equation that accounts for rainfall input, external sources, infiltration, evaporation, and the net lateral discharge exchanged with adjacent cells:
where is the intensity of precipitation [L/T], represents the external inflow [L/T], is the infiltration rate [L/T], is the evaporation [L/T], and denotes the net outward discharge from cell to its four neighboring cells [L3/T].
Simplified Momentum and Inter-Cell Flow Exchange
Flow exchange between neighboring cells is driven by the water-surface gradient. The discharge is defined as positive when water flows from the cell to an adjacent cell . Using a simplified momentum relationship that retains only the pressure-gradient term, the change in discharge over a time step is expressed as
where g is the gravitational acceleration and l is the distance between the centers of two adjacent cells. This formulation follows the effective flux-exchange scheme implemented in ArcGIS Pro for raster-based overland flow routing [25].
Flow Correction and Strict Mass Conservation
To ensure physically admissible updates, two constraints are applied: (i) negative discharge is not allowed, and (ii) total outflow cannot exceed the available water volume stored in the cell. The non-negativity condition is written as follows.
and when the sum of outgoing fluxes exceeds cell storage, a scaling factor is applied:
Time Stepping and Numerical Stability
ArcGIS Pro employs an external time step to advance the simulation and an internal time step to iterative numerical updates. Both time steps are related to the grid resolution to maintain numerical stability, following grid-size-dependent empirical relationships:
Model Assumptions and Interpretation Scope
The rainfall–inundation simulation assumes that water behaves as a single-phase incompressible fluid and that the velocity is uniformly distributed within each cell of the grid. The simplified momentum formulation neglects friction, turbulence, wind shear, convective acceleration, and lateral inflows. In addition, the shallow-water assumption is invoked so that the flow depth remains small relative to the horizontal length scale. Under these assumptions, the model is suitable for scenario-based comparisons of relative changes in the extent, maximum depth, and duration of the flood under identical rainfall and infiltration conditions.
2.4.5. Analysis
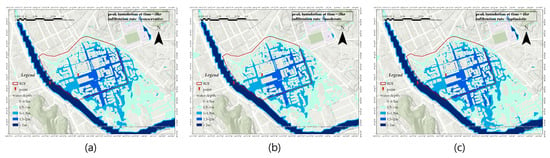
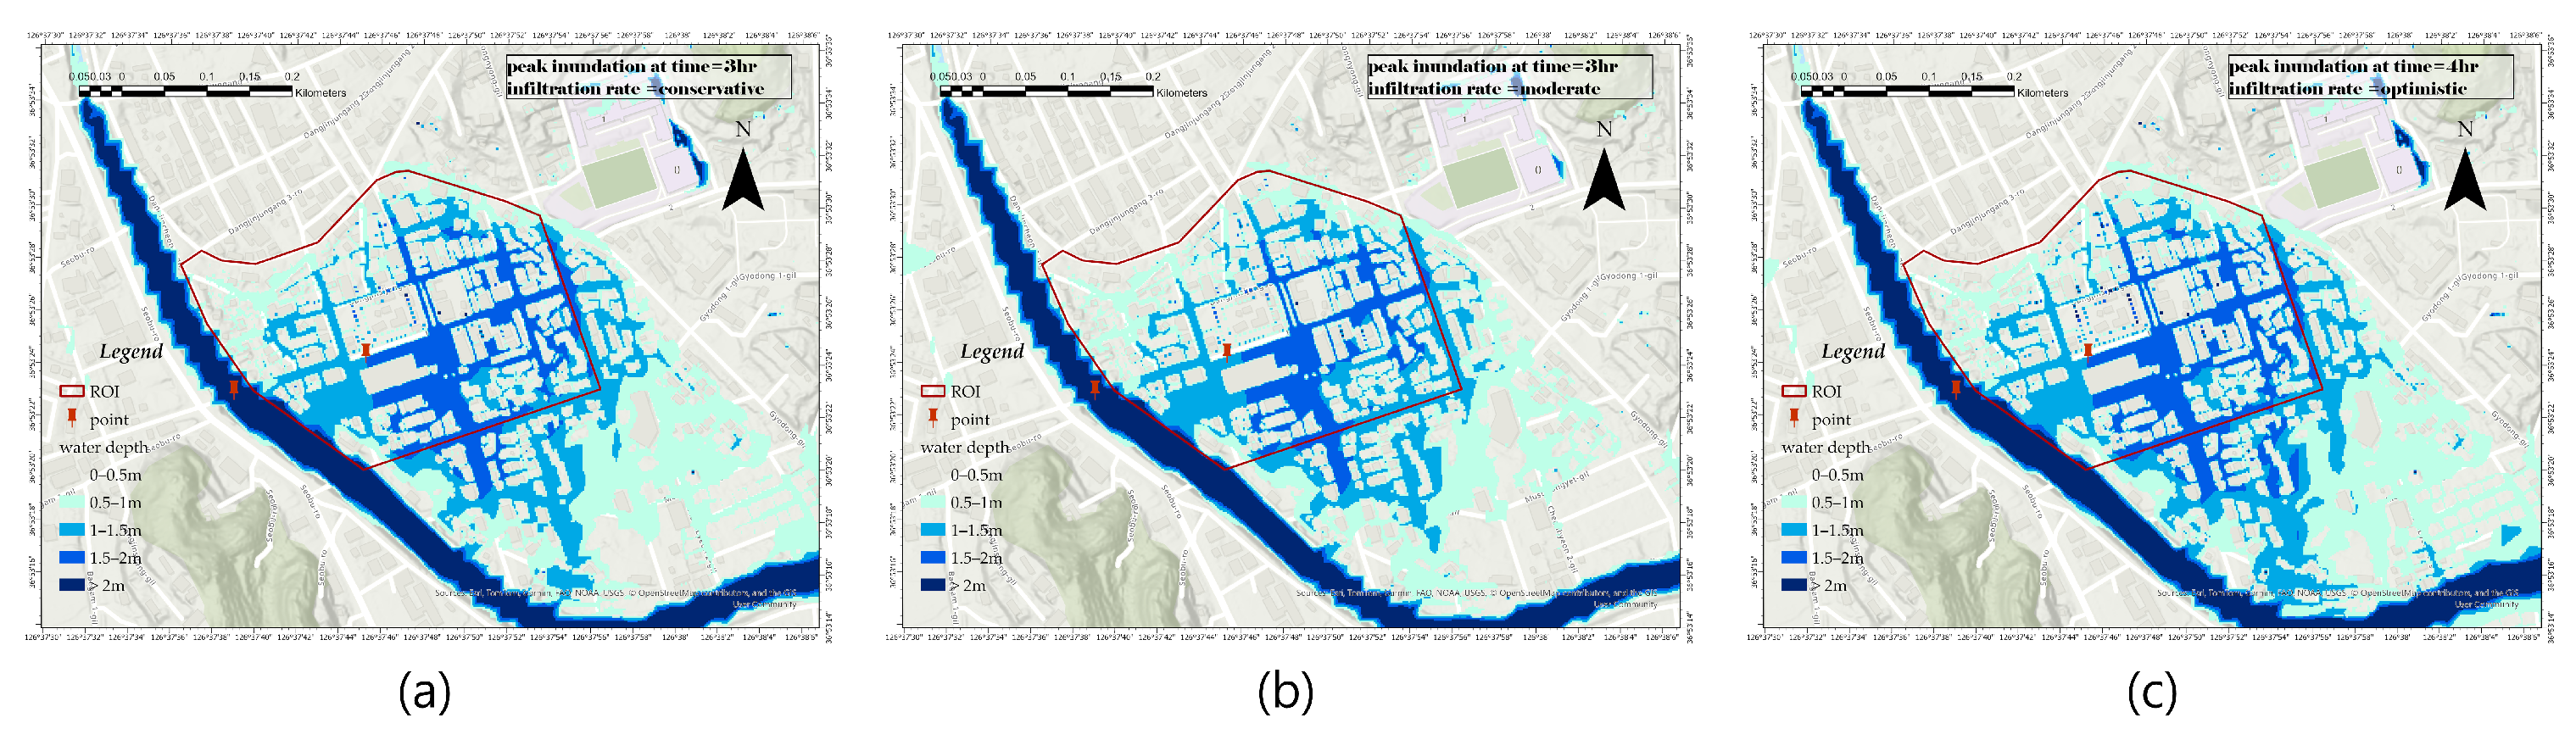
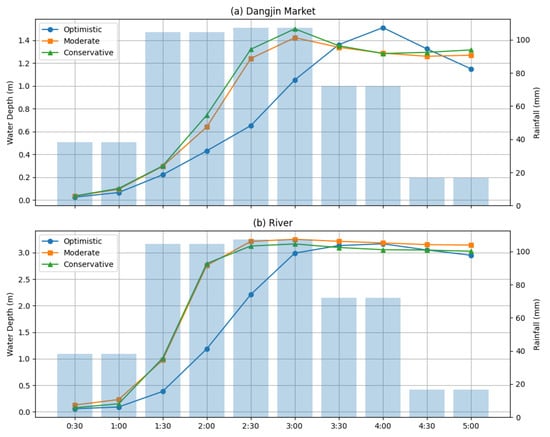
Figure 6 presents the spatial distribution of the maximum depth of flooding in the Dangjin Traditional Market under three infiltration scenarios (conservative, moderate, and optimistic). Although three different infiltration conditions were applied, the overall inundation patterns are not significantly different, showing similar spatial characteristics in all scenarios. The peak inundation generally occurred approximately t = 3 h after the onset of the rainfall, with a slight delay (t = 4 h) observed only in the optimistic scenario.
Figure 6.
Spatial distribution of peak inundation depth in the Dangjin Traditional Market under different infiltration scenarios: (a) conservative, (b) moderate, and (c) optimistic.
In all scenarios, the water level of the Dangjin Stream exceeded 3 m, while the depth of the flood in the traditional market of the Dangjin reached approximately 1.4–1.5 m. These results are consistent with field reports and news sources (Yonhap News Agency, 2025), which indicated that the flood depths exceeded the waist level of an adult male and that the Dangjin stream reached the flood stage and overflowed its banks.
The limited difference between the three infiltration scenarios suggests that flooding in this area is not primarily controlled by the variability of the infiltration, but rather by the topographic and hydraulic conditions. In particular, the Dangjin Traditional Market is continuously affected by runoff flowing from the northeastern urban area. At the same time, as the water level of the Dangjin Stream increases, it exceeds the elevation of the drainage outlet, resulting in a loss of drainage capacity. Consequently, water is no longer effectively discharged and accumulates within the market area, leading to widespread flooding.
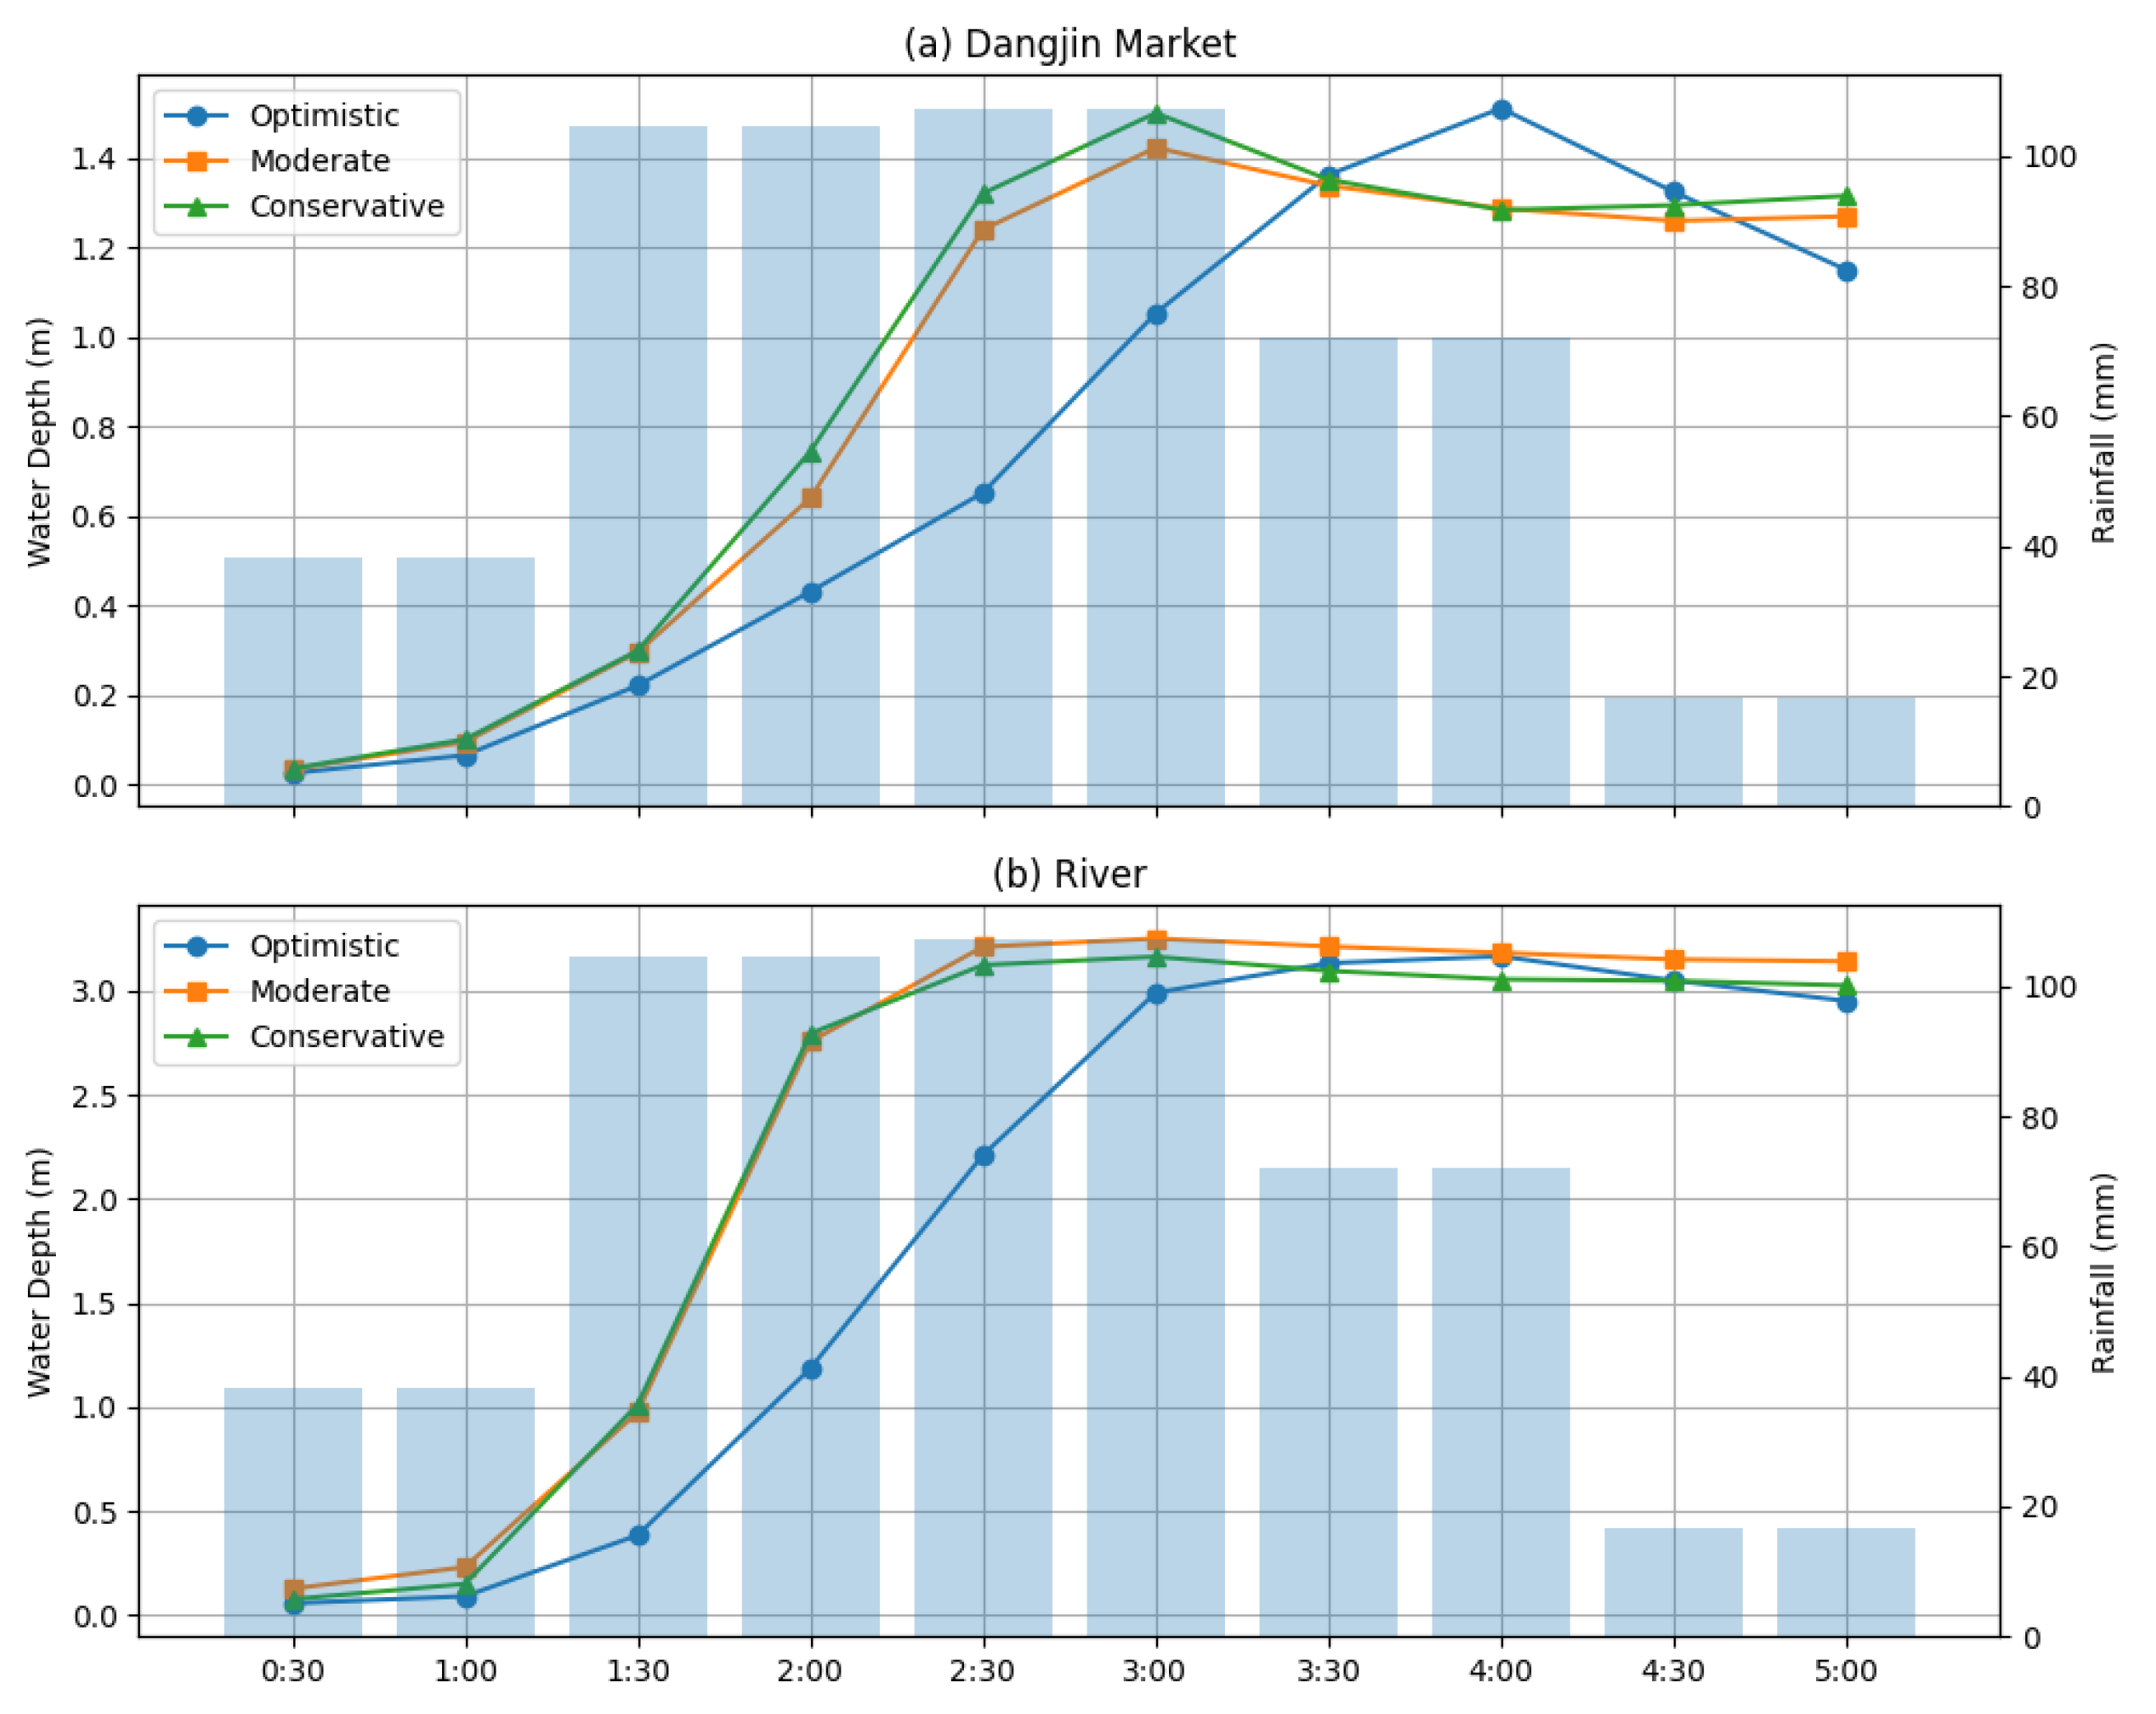
The temporal variation of the depth of the inundation is illustrated in Figure 7. The results indicate that the depth of the water increases rapidly after the maximum intensity of the rainfall period, with peak flooding occurring within a short time interval. Although the conservative scenario shows a slightly faster rise and higher peak depth and the optimistic scenario shows a somewhat attenuated response, the overall trends remain similar across all scenarios.
Figure 7.
Temporal Variation of inundation depth and rainfall intensity for (a) Dangjin Market and (b) river section under different infiltration scenarios. The sky-blue bars represent hourly rainfall intensity.
These simulation results are consistent with the conditions observed during the July 2025 flood event, indicating that the model reasonably reproduces the real flood behavior under extreme rainfall conditions. This provides indirect validation of the simulation results despite the absence of detailed field measurement data.
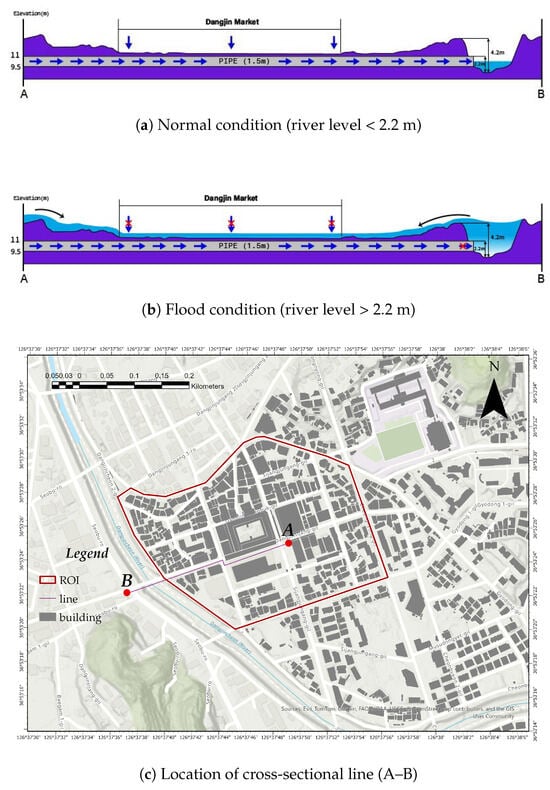
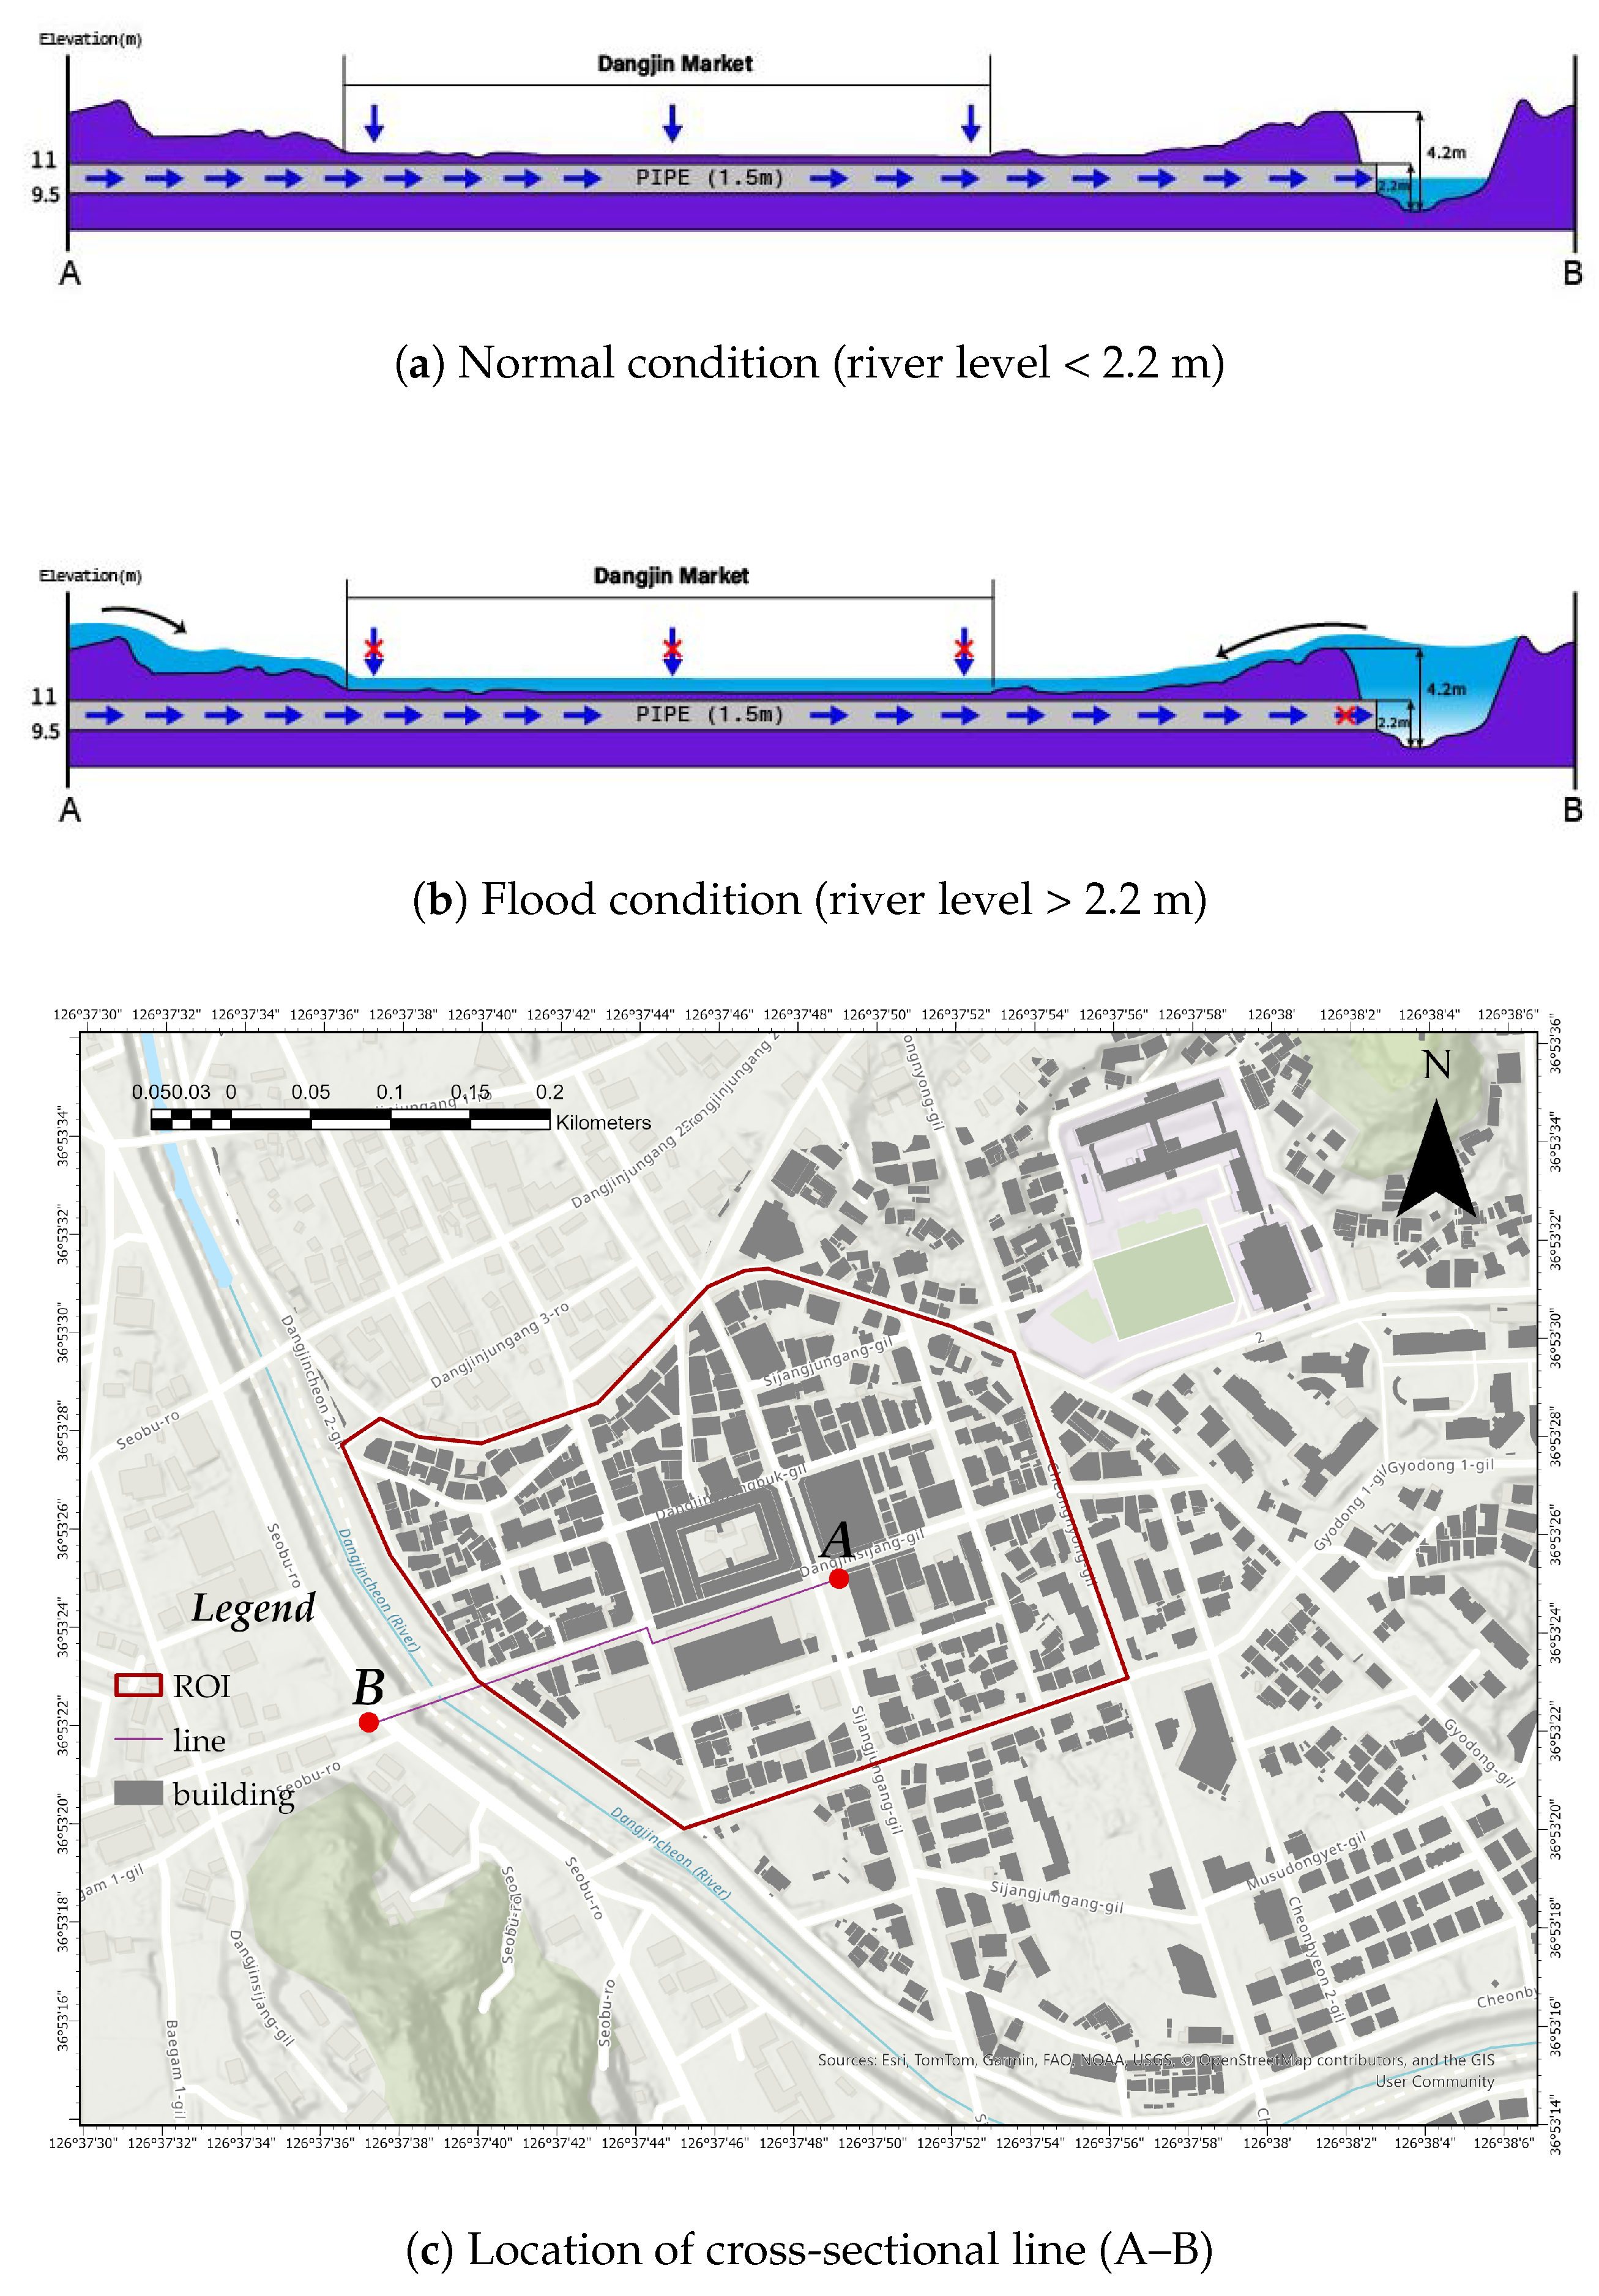
Figure 8 illustrates the primary mechanism that governs floods in the Dangjin Traditional Market. Figure 8c shows the location of the cross-sectional line A–B, while (a) and (b) represent the elevation and hydraulic conditions along the A–B section under normal and flood conditions, respectively.
Figure 8.
Conceptual flood mechanism in the Dangjin Traditional Market: (a) normal drainage condition, (b) drainage blockage due to elevated river stage, and (c) location of the cross-sectional profile (A–B).
Under normal conditions (Figure 8a), when the water level of the Dangjin Stream remains below approximately 2.2 m, efficient drainage is maintained, allowing runoff generated within the market area to be discharged into the river.
However, in flood conditions (Figure 8b), the level of the river water rises above the elevation of the drainage outlet, resulting in a reduced or reversed hydraulic gradient. Consequently, the drainage capacity is lost and the runoff from the northeast urban area accumulates within the market, leading to extensive flooding.
These findings clearly indicate that flooding in the Dangjin Traditional Market is primarily driven by the interaction between elevated river water levels (backwater effect) and incoming urban runoff, rather than by variations in infiltration capacity.
2.5. Structural Flood Mitigation Scenario
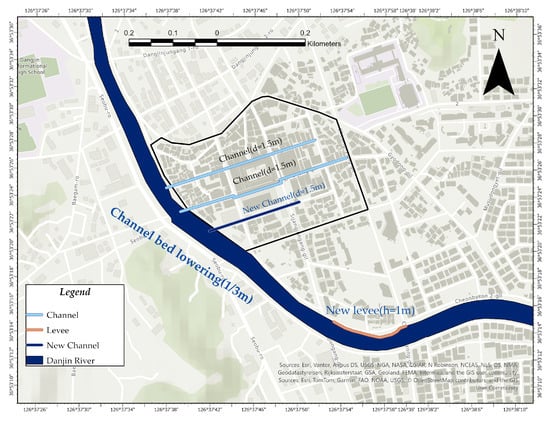
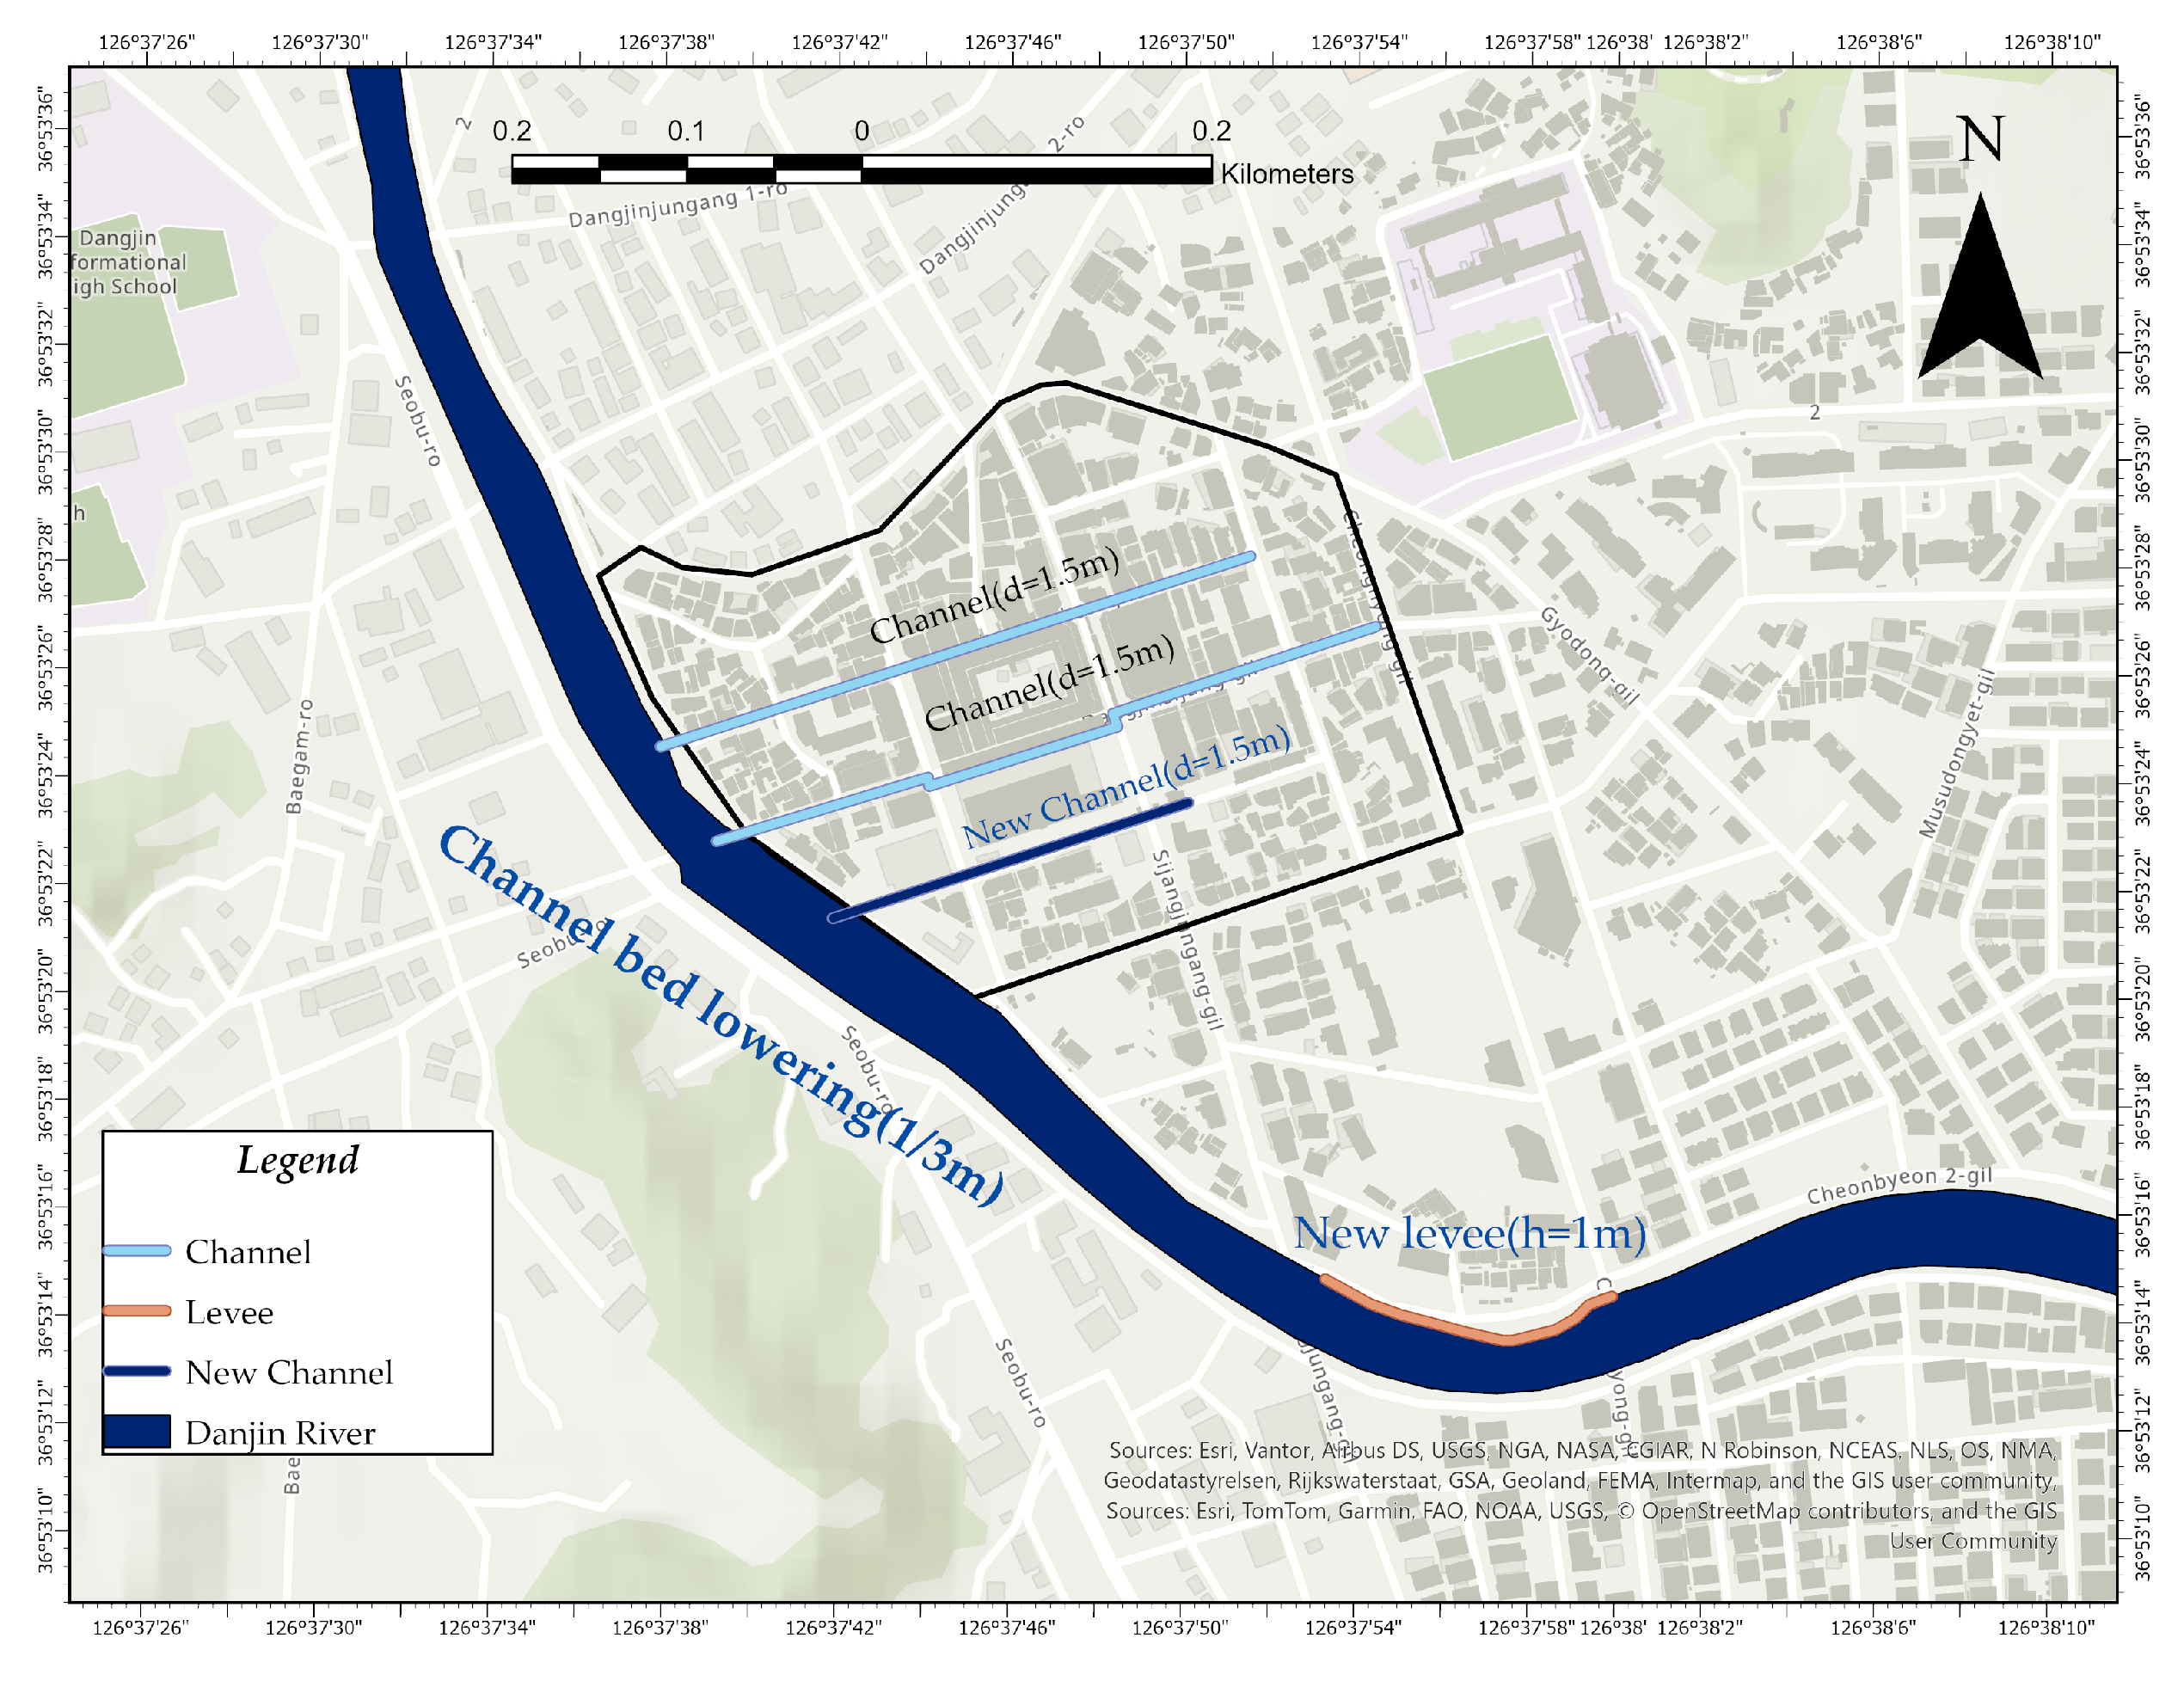
To evaluate the effectiveness of structural flood mitigation measures in the traditional Dangjin market, three types of engineering interventions were designed and implemented within the simulation framework (Figure 9). These measures were selected based on the dominant flood mechanisms identified in the study area, including limited channel conveyance capacity, inadequate urban drainage, and localized overflow in the sections of the channel curvature.
Figure 9.
Configuration of structural flood mitigation measures applied to the Dangjin Traditional Market. The mitigation strategy includes (i) channel bed lowering (1 m and 3 m scenarios), (ii) installation of a 1.5 m diameter drainage conduit with a length of 200 m, and (iii) levee reinforcement of 1 m height along a 250 m channel bend.
First, channel conveyance capacity was improved by lowering the riverbed of the Dangjin Stream. Two alternative scenarios were considered to assess the sensitivity of flood reduction to the degree of channel modification: (i) a 1 m channel bed lowering scenario and (ii) a 3 m channel bed lowering scenario. These scenarios were designed to evaluate how increased flow conveyance influences river stage and urban inundation under identical rainfall conditions.
Second, to improve internal drainage capacity within the urban area, a new drainage conduit with a diameter of 1.5 m and a total length of approximately 200 m was introduced adjacent to the Dangjin Traditional Market. This measure was intended to facilitate the rapid discharge of surface runoff toward the main channel, thus reducing the accumulation of water in low-lying commercial zones.
Third, a levee reinforcement measure was applied along a sharply curved section of the channel, where flow concentration and overflow were frequently observed. A levee with a height of 1 m was installed along a 250 m reach to prevent lateral overflow into the adjacent urban area and to stabilize the flow direction within the channel.
All mitigation measures were implemented under identical rainfall forcing and boundary conditions to ensure a consistent comparison between pre- and post-mitigation scenarios. This configuration enables a systematic evaluation of the individual and combined effects of structural interventions on flood extent and depth.
3. Results
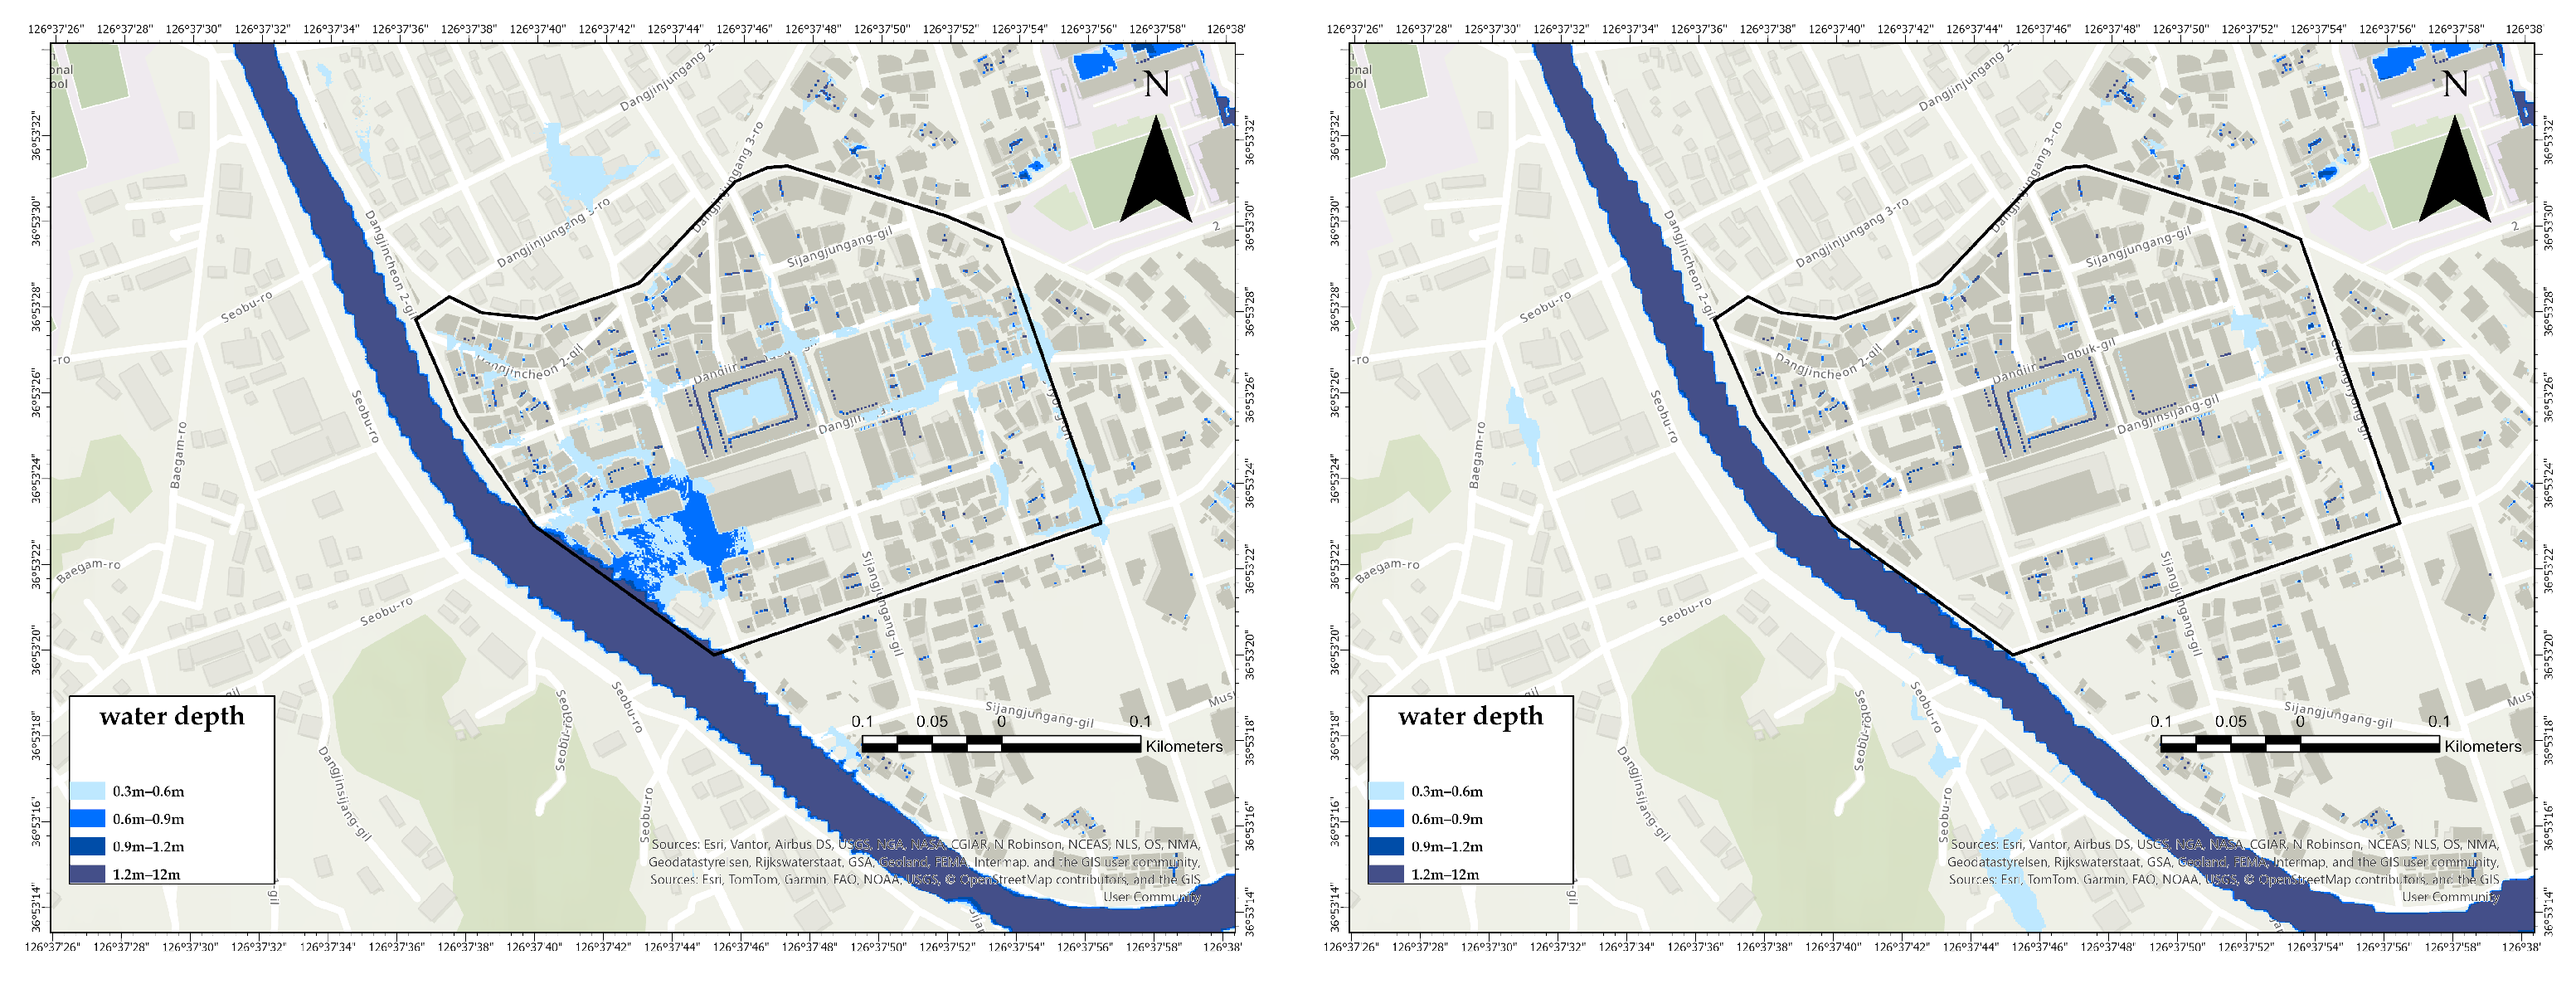
The simulation results are presented in Figure 10, Figure 11, Figure 12 and Figure 13. As shown in Figure 10, the inundation pattern changed significantly depending on the degree of lowering of the channel bed. In the 1 m channel bed lowering scenario, inundation was concentrated in the low-lying area adjacent to the river, particularly in the southwestern part of the study area. In contrast, in the 3 m channel bed lowering scenario, both the extent and depth of the flood were markedly reduced under the same rainfall conditions. This indicates that lowering the deeper channel bed improved the hydraulic conveyance capacity of the river.
Figure 10.
Comparison of simulated inundation depth under the 1 m and 3 m channel bed lowering scenarios. The 3 m scenario significantly reduces both inundation extent and depth compared with the 1 m scenario.
Figure 11.
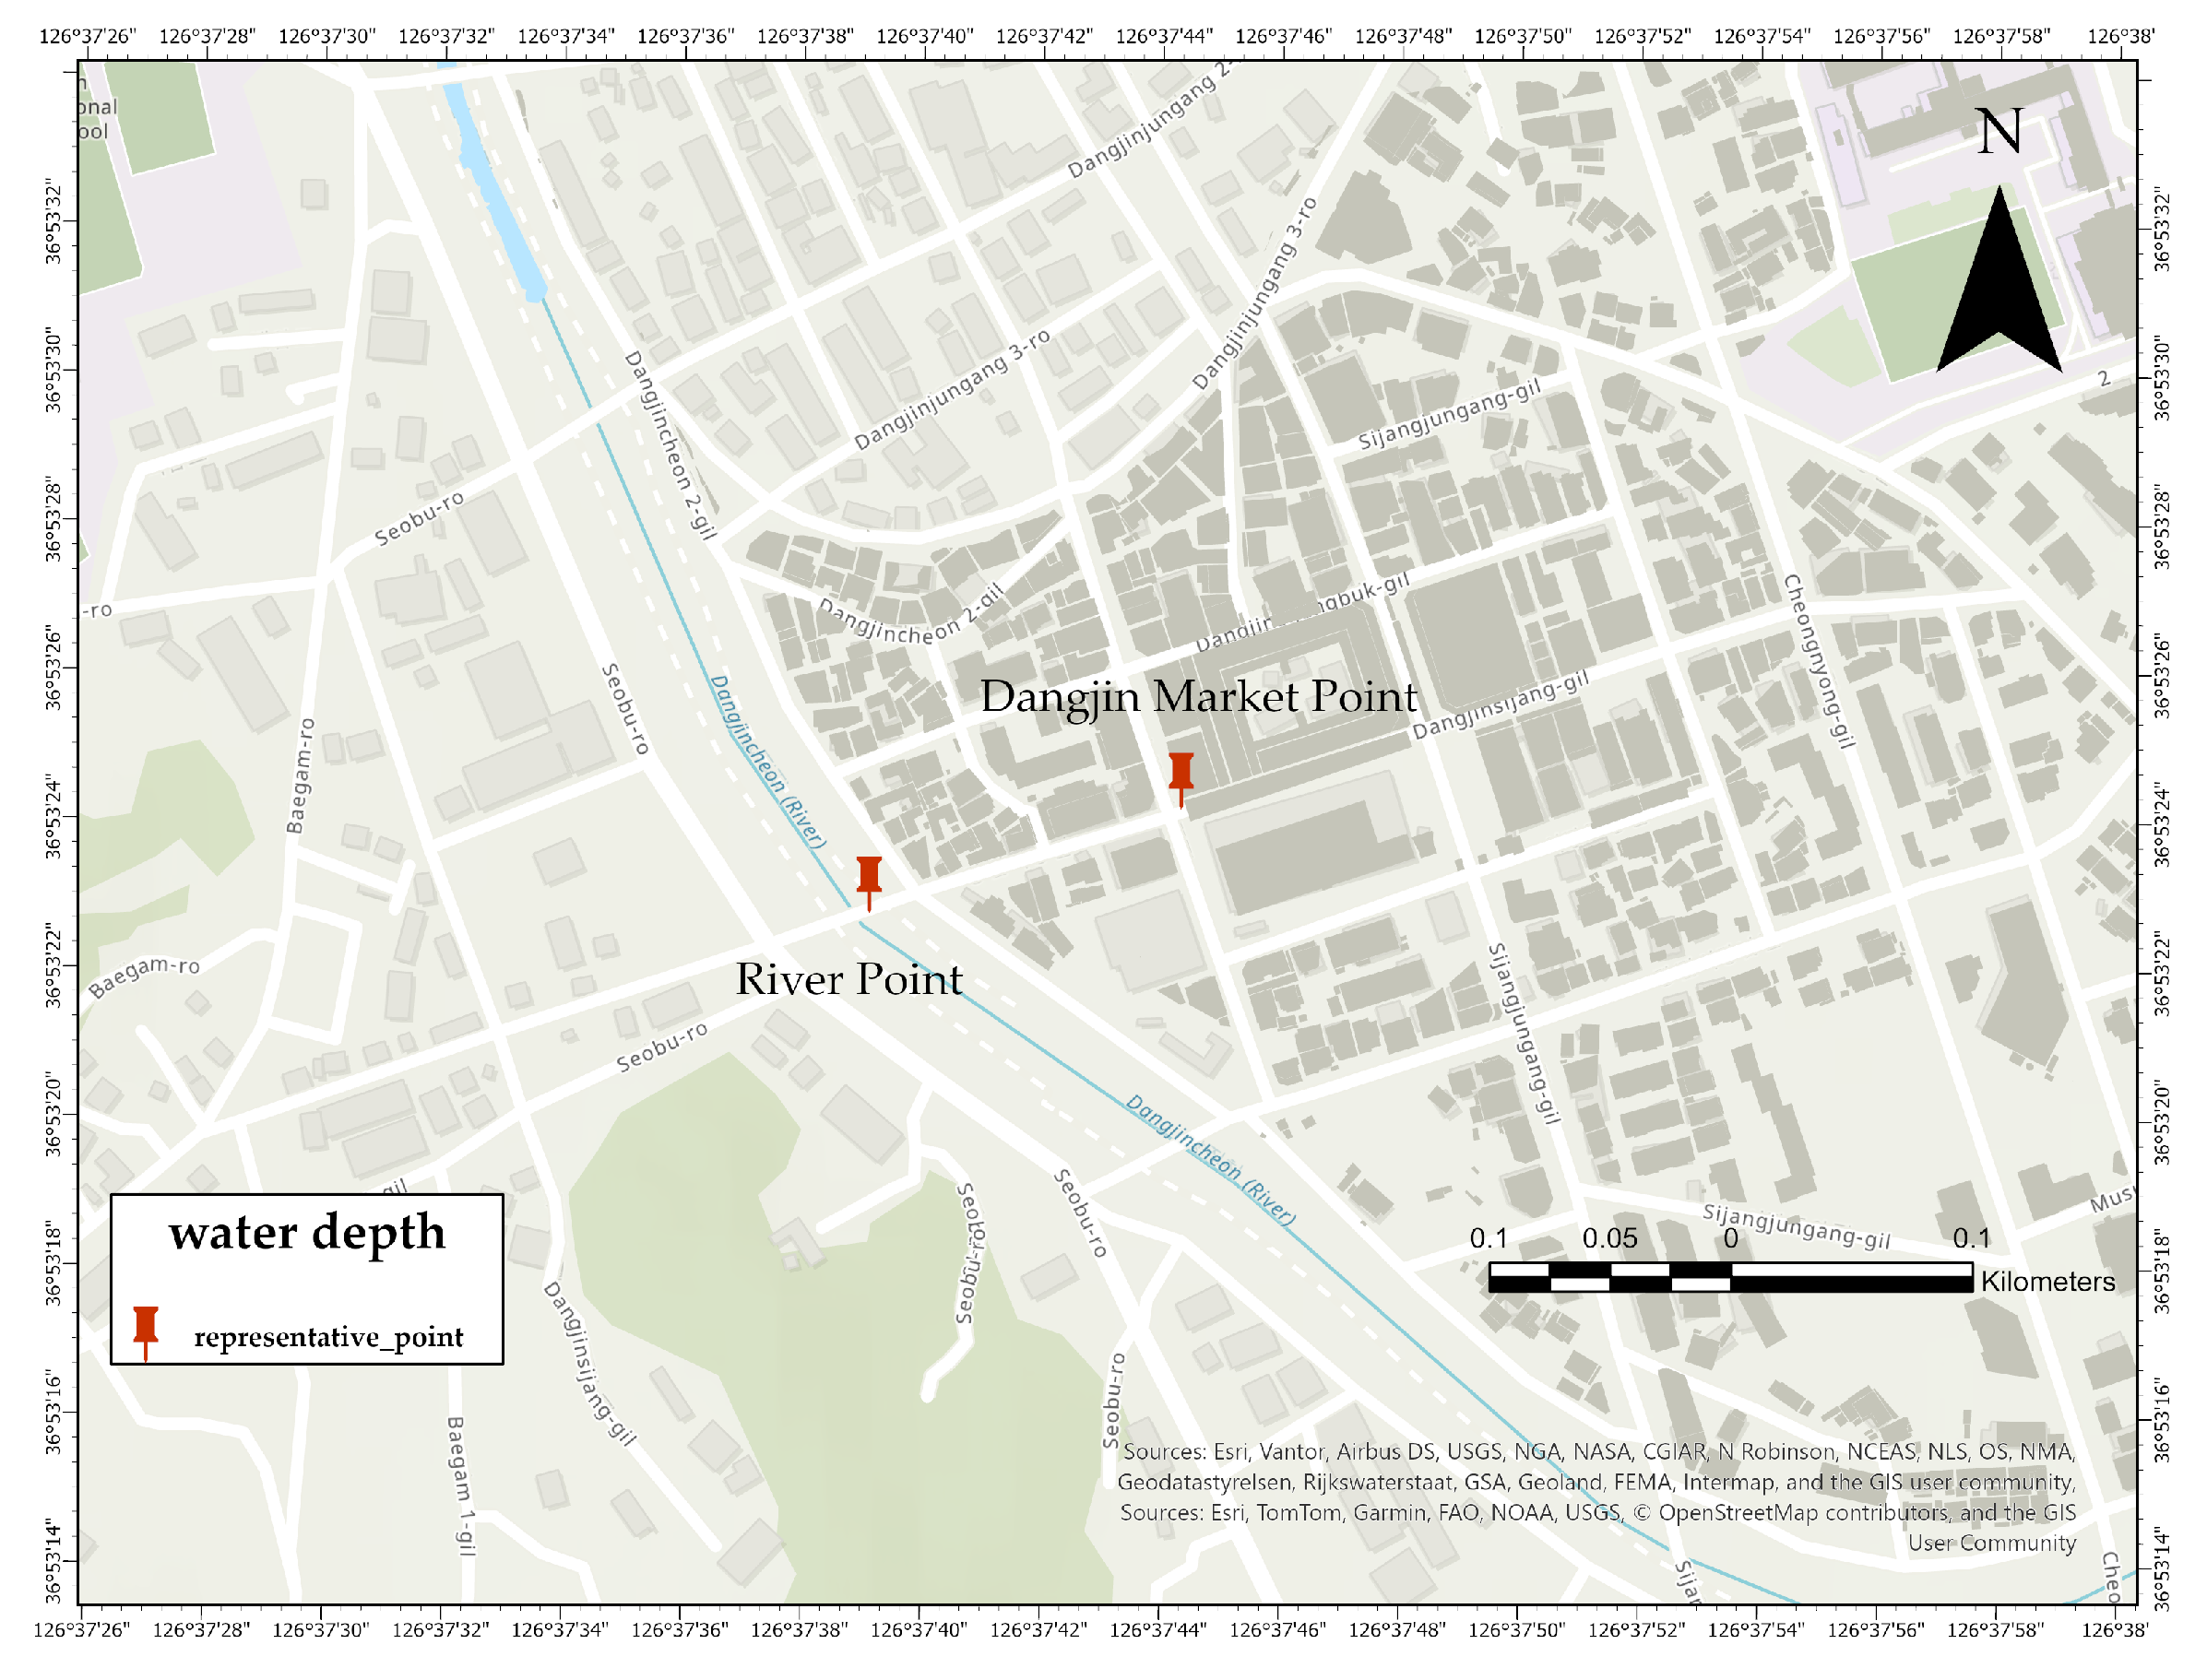
Locations of representative monitoring points used for temporal analysis: Dangjin Market Point and River Point.
Figure 12.
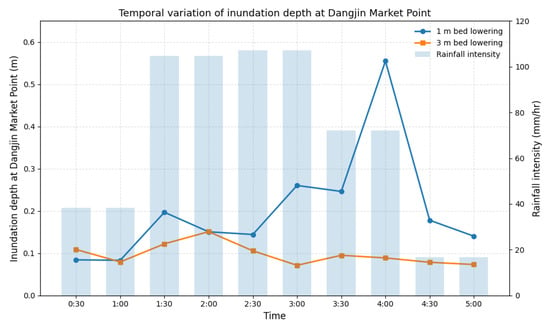
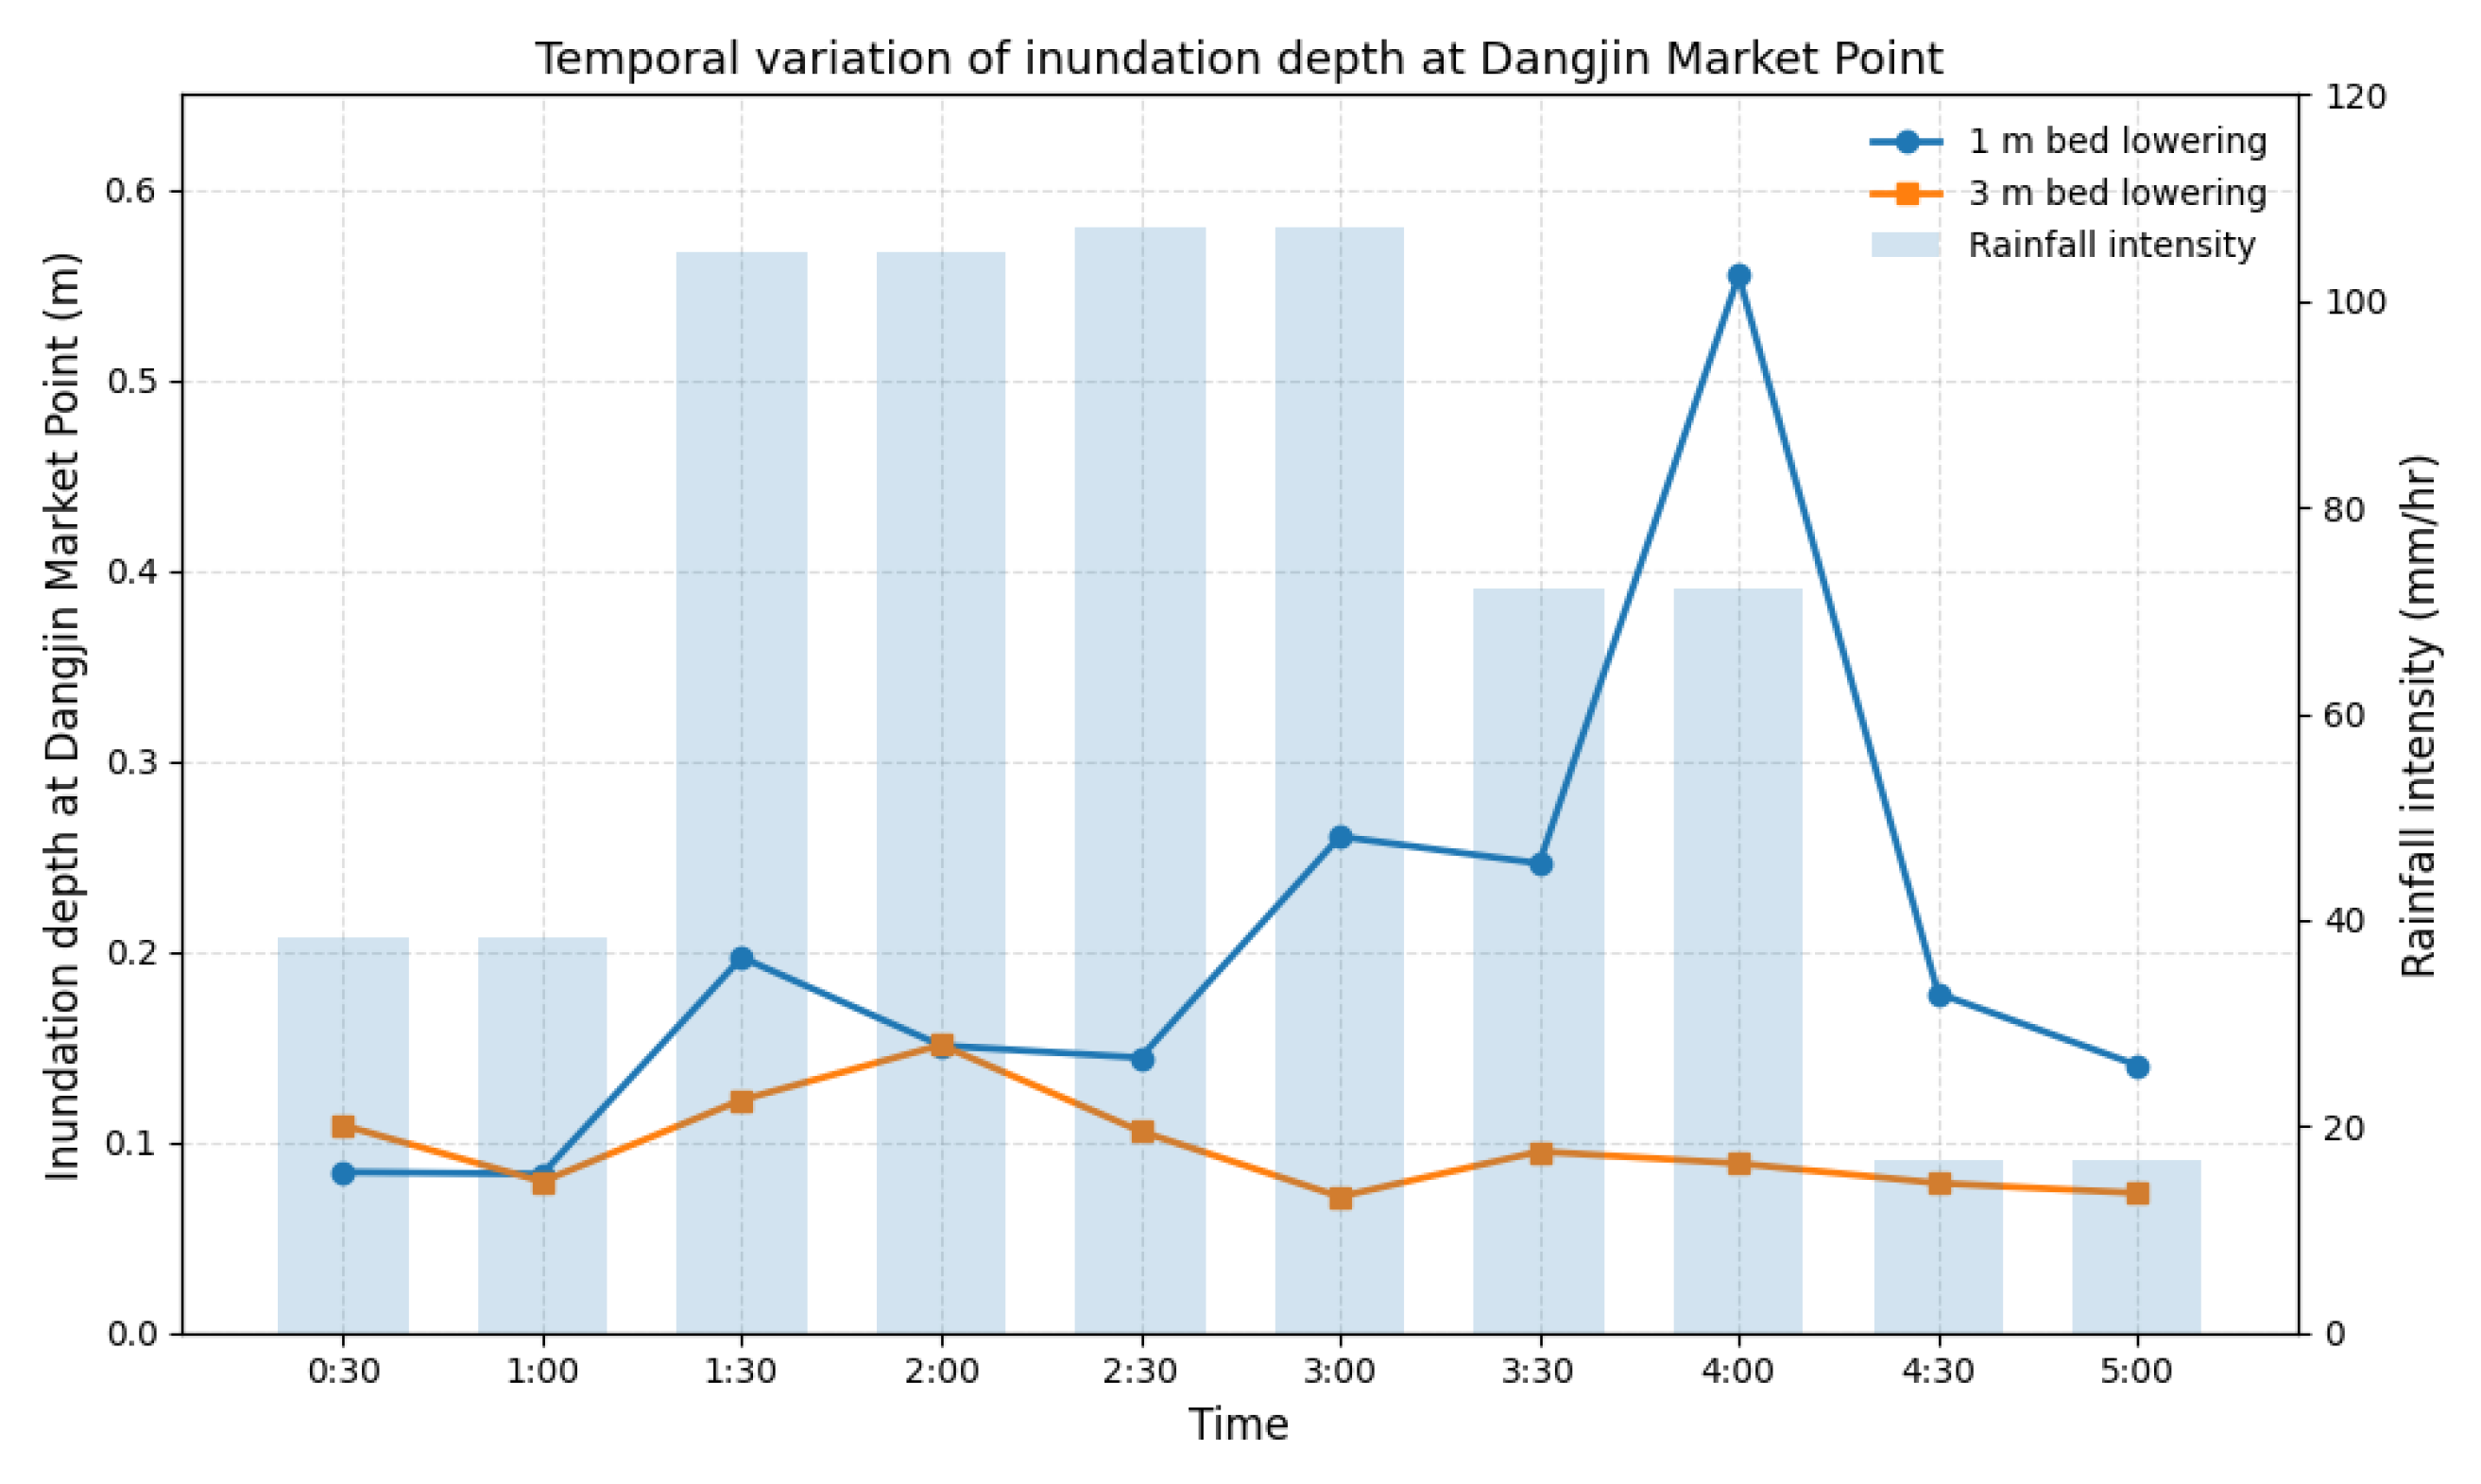
Temporal variation of inundation depth at the Dangjin Market Point under the 1 m and 3 m channel bed lowering scenarios, together with rainfall intensity.
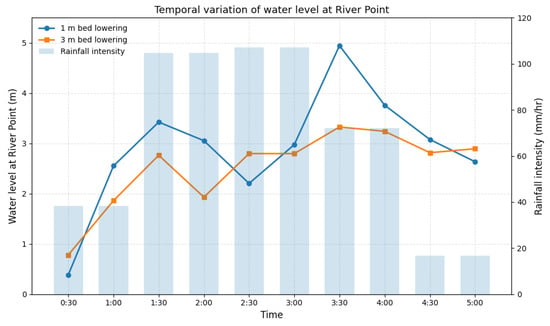
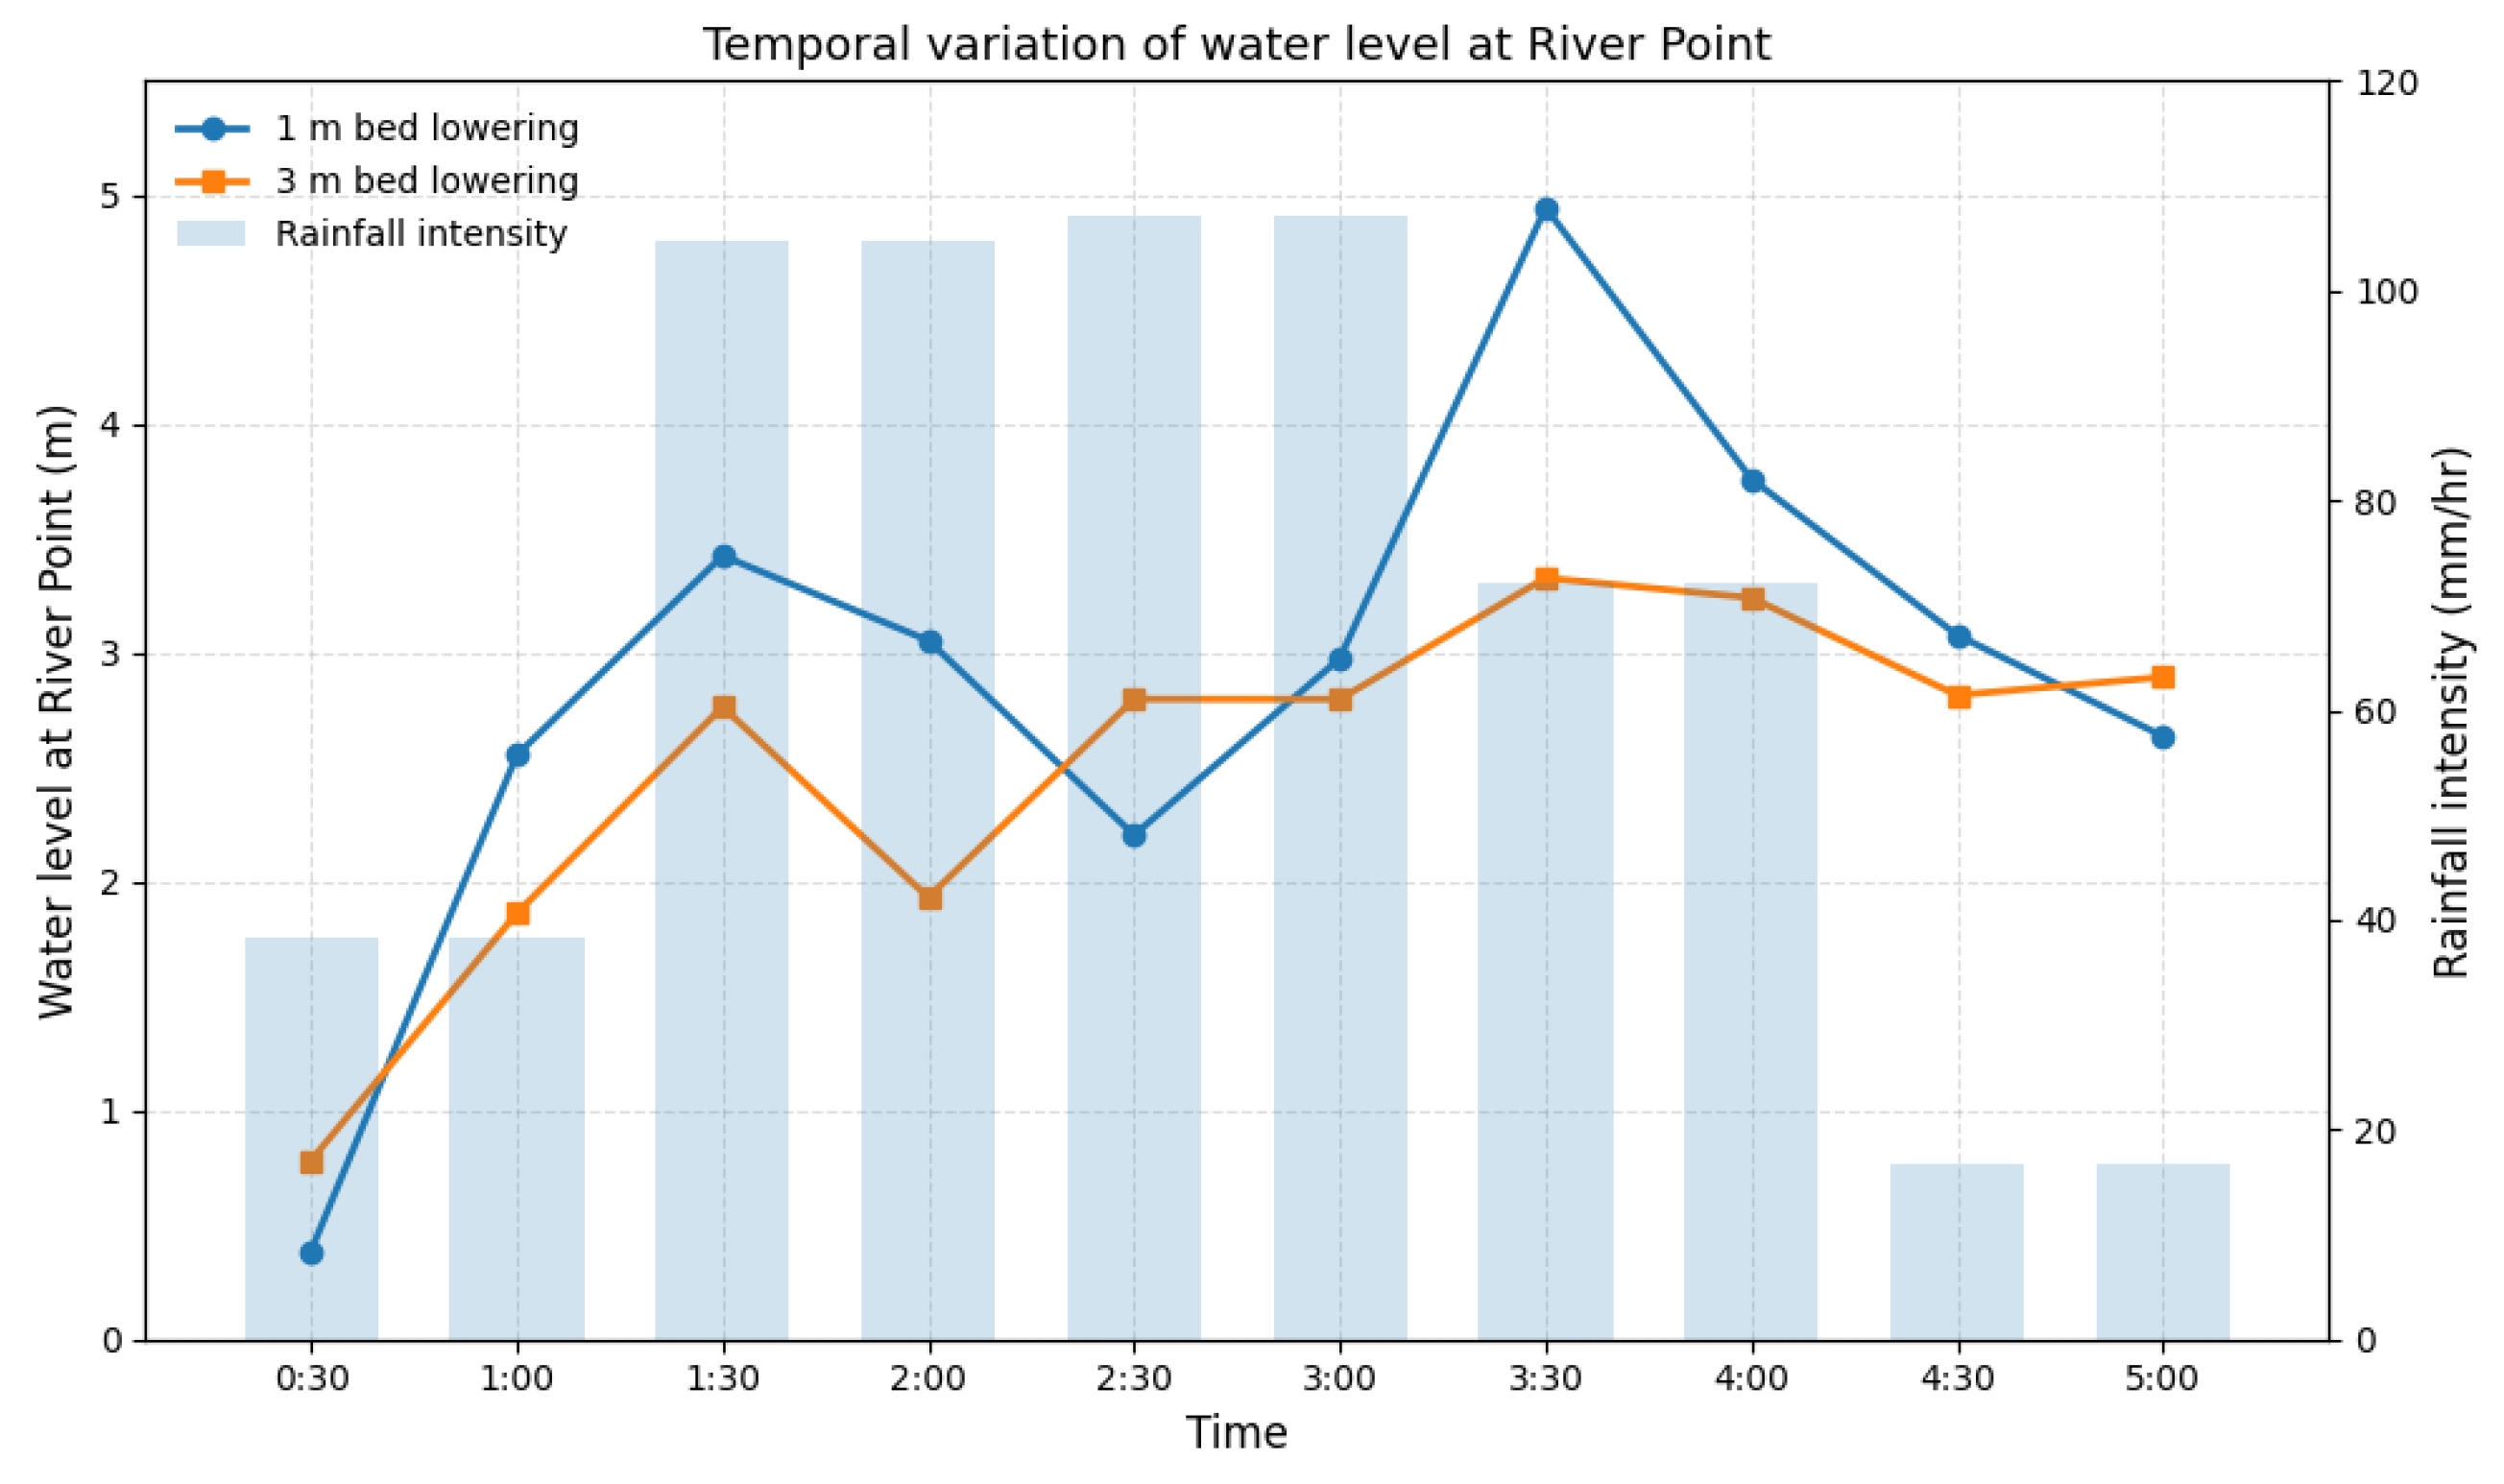
Figure 13.
Temporal variation of water level at the River Point under the 1 m and 3 m channel bed lowering scenarios, together with rainfall intensity.
To further investigate the flood response, two representative points were selected, namely the Dangjin Market Point and the River Point, as shown in Figure 11. The temporal variation in depth of the flood at the Dangjin Market Point is shown in Figure 12. In the 1 m scenario, the depth of the flood increased significantly in the later stage and reached a maximum of approximately 0.55 m. In contrast, in the scenario of 3 m, the depth of the flood remained relatively low, generally below 0.15 m throughout the simulation period.
The temporal variation of the water level at the River Point is shown in Figure 13. In the 1 m scenario, the river water level increased dramatically and reached approximately 4.9 m, indicating insufficient flow conveyance. In contrast, the 3 m scenario limited the maximum water level to approximately 3.3 m and showed a more stable hydraulic response.
In particular, the depth of the peak flood did not coincide with the intensity of the peak rainfall. Although the maximum rainfall occurred around 2:30–3:00, the maximum flood occurred later. This indicates that urban flooding is governed not only by rainfall intensity, but also by cumulative inflow, rising river stage, and delayed drainage. In particular, elevated river water levels likely restricted drainage and contributed to increased inundation in the urban area.
In general, the 3 m channel bed lowering scenario effectively reduced both the river stage and the depth of urban flooding, demonstrating that channel bed lowering is an effective structural mitigation strategy for reducing flood risk.
To quantitatively evaluate the effectiveness of the proposed mitigation measures, the inundation area within the ROI was calculated for different water-depth classes under the pre-mitigation condition and post-mitigation scenarios. The post-mitigation scenarios correspond to channel bed lowering depths of 1 m and 3 m. The results are summarized in Table 3.
Table 3.
Comparison of inundation area within the ROI under pre- and post-mitigation scenarios, including percentage reduction relative to the pre-mitigation condition.
Under the pre-mitigation condition, a substantial portion of the study area was exposed to severe flooding. In particular, the area with flood depths exceeding 1.5 m reached 28,085 m2, indicating a high level of flood hazard.
Following the implementation of mitigation measures, a pronounced reduction in the inundation was observed in the high-depth. In the channel bed lowering scenario of 1 m, the area greater than 1.5 m decreased to 1243 m2, corresponding to a reduction of approximately 95.6%. In the scenario of 3 m, this area was further reduced to 692 m2, indicating an enhanced mitigation effect.
A similar decreasing trend was observed for intermediate flood depths (0.9–1.5 m), where the affected area was significantly reduced in both post-mitigation scenarios. In contrast, the area corresponding to shallow inundation depths (0.3–0.6 m) increased substantially after mitigation.
This shift from high-depth to low-depth inundation is particularly important from a damage perspective, as severe flooding effectively transforms into less hazardous conditions. In general, these results demonstrate that channel bed reduction not only reduces the extent of severe flooding, but also redistributes inundation toward lower-risk depth ranges, significantly improving the resilience to urban floods.
4. Discussion
As demonstrated in this study, flood mitigation strategies for areas experiencing recurrent flooding should be formulated through simulation-based analysis and subsequently implemented after verifying their effectiveness in reducing the actual impacts of the disaster. However, institutional frameworks that systematically incorporate simulation-driven decision-making into flood management and urban planning remain insufficient. Therefore, it is necessary to establish and implement standardized procedures for integrating simulation-based evaluation into policy-making and engineering practice. To clarify the methodological significance of this study in relation to previous research, Table 4 summarizes the differences between conventional flood analysis approaches and the proposed simulation-based decision-support framework.
Table 4.
Comparison between conventional flood analysis approaches reported in previous studies and the proposed simulation-based decision-support framework.
One of the most critical issues in flood simulation studies is model validation. In this study, direct quantitative validation using statistical metrics such as RMSE or NSE could not be performed due to the absence of time-series field measurements of water depth and discharge during the flood event. Instead, a pseudo-validation approach was adopted by comparing the simulated inundation depths with ranges reported in media sources and field records. According to these reports, the depth of the flood in the study area was approximately 1.0 to 1.5 m. The simulation results reproduced a maximum flood depth of approximately 1.4 to 1.5 m, showing strong agreement with the magnitude of the reported flood. This level of agreement provides a quantitative basis for supporting the reliability of the model under data-limited conditions. These findings suggest that, although direct statistical validation was not feasible, the model reasonably captures the physical behavior and magnitude of the observed flood event.
Previous urban flood studies have commonly utilized satellite-based observations, such as Sentinel-1 SAR imagery [26,27,28], to validate the extent of the flood. Although such approaches are effective for large-scale or long-duration flood events, their applicability is limited in urban environments characterized by short-duration and high-intensity rainfall. Due to revisit interval constraints and temporal mismatches, satellite imagery often fails to capture peak flood conditions in rapidly evolving urban floods. Therefore, for this type of event, validation based on field evidence, including post-disaster investigation reports, flood marks, and damage records, is considered more appropriate and reliable. In this regard, the validation strategy adopted in this study should be understood as a realistic approach under the available data conditions.
In addition, several methodological aspects of the simulation framework require further improvement. First, more accurate river cross-sectional data and water-level observations should be incorporated during the wet season. The DEM used in this study represents terrain conditions at the time of data acquisition and does not account for seasonal increases in the river stage. As a result, the effective flow conveyance capacity during extreme rainfall events can be underestimated, which can lead to an underestimation of the depth of the flood.
Second, a more detailed representation of the infiltration processes is required. In this study, infiltration rates were assigned based on generalized land-cover classes. However, actual infiltration capacity is strongly influenced by soil properties, antecedent moisture conditions, and surface compaction, which are not explicitly represented in the current model. This simplification introduces uncertainty in runoff generation and may affect localized flood dynamics. Future studies should incorporate soil-type-based infiltration parameters or field-measured data to better represent spatial heterogeneity and improve model realism.
Despite these limitations, the primary objective of this study is not to achieve a precise flood prediction but to evaluate the relative effectiveness of structural mitigation measures under consistent conditions. From this perspective, the model should be understood as a comparative decision-support tool rather than a deterministic predictive model. The framework is designed to quantitatively compare changes in flood extent and depth under different mitigation scenarios, thereby enabling pre-implementation evaluation of flood mitigation strategies.
Furthermore, the findings of this study are consistent with previous research indicating that flood dynamics in low-lying urban areas are primarily governed by hydraulic interactions, such as increased river stage, limitations of drainage capacity, and upstream inflow, rather than variations in infiltration capacity alone. This suggests that the flood mechanism in the study area is dominated by interactions between the river system and the urban drainage network rather than surface infiltration processes.
In general, this study goes beyond conventional static flood risk assessments by presenting a dynamic simulation-based framework that incorporates observed rainfall conditions to evaluate the effectiveness of mitigation in advance. This approach enables decision-makers to assess whether specific structural interventions can effectively reduce critical hydraulic thresholds associated with urban flood damage prior to implementation. Therefore, the main contribution of this study lies not in the development of a new numerical model, but in bridging high-resolution geospatial flood simulation with resilience-oriented mitigation planning, thereby providing a practical and transferable decision-support framework for urban flood management.
5. Conclusions
This study quantitatively evaluated the effectiveness of pre-implementation of structural flood mitigation measures in the Dangjin Traditional Market area, which has experienced recurrent urban flooding. A GIS-based rainfall–inundation simulation framework was developed by integrating a 1 m resolution LiDAR-derived DEM, land-cover-based infiltration parameters, building and channel data, and an observed extreme rainfall event from July 2025 to reproduce realistic flood dynamics.
The results indicate that flooding in the study area is not primarily controlled by infiltration variability, but rather by the hydraulic interaction between elevated river stages and urban runoff. In particular, when the level of river water exceeds the elevation of the drainage outlet, the drainage capacity is significantly reduced or reversed, leading to rapid accumulation of water in the urban area.
Among the mitigation measures tested, channel bed lowering—especially the 3 m scenario—was found to be highly effective in reducing both the river stage and the depth of urban flooding. The area exposed to severe flooding (depth > 1.5 m) decreased by more than 95%, indicating a substantial shift from high-risk to low-risk flood conditions. In addition, the combined application of drainage improvement and levee reinforcement contributed to a more stable redistribution of the inundation patterns.
The main contribution of this study lies in the development of a simulation-based decision-support framework that enables pre-implementation evaluation of structural mitigation strategies using high-resolution spatial data and observed rainfall conditions. By allowing for direct quantitative comparison between pre- and post-mitigation scenarios under consistent hydrological conditions, the proposed framework addresses limitations of conventional flood hazard mapping and static hydraulic analyzes.
Although direct statistical validation was not feasible due to the lack of time-series field measurements, the simulation results showed strong agreement with reported flood depths, supporting the reliability of the model under data-limited conditions. Future work should incorporate field observations, detailed river cross-sectional data, and soil-specific infiltration characteristics to improve the accuracy of the model.
In general, the proposed framework provides a practical and transferable tool for proactive flood risk management in urban areas prone to recurrent flooding and offers meaningful implications for climate change adaptation and resilience-based urban planning.
Author Contributions
Conceptualization, S.-H.L. and H.-S.Y.; methodology, S.-H.L., H.-S.Y., S.-J.L. (Sang-Ji Lee) and D.-H.K.; software, S.-H.L., H.-S.Y., S.-J.L. (Sang-Ji Lee) and D.-H.K.; validation, S.-H.L., H.-S.Y., S.-J.L. (Sang-Ji Lee) and D.-H.K.; formal analysis, S.-H.L., H.-S.Y. and S.-H.P.; investigation, S.-H.L., H.-S.Y., S.-J.L. (Sang-Ji Lee), S.-H.P. and D.-H.K.; resources, S.-H.L. and H.-S.Y.; data curation, S.-H.L., H.-S.Y., S.-J.L. (Seung-Jun Lee) and D.-H.K.; writing—original draft preparation, S.-H.L., H.-S.Y., S.-J.L. (Sang-Ji Lee) and S.-H.P.; writing—review and editing, S.-H.L., H.-S.Y., S.-J.L. (Seung-Jun Lee), S.-J.L. (Sang-Ji Lee) and S.-H.P.; visualization, S.-H.L., H.-S.Y., S.-J.L. (Sang-Ji Lee), S.-J.L. (Seung-Jun Lee) and S.-H.P.; supervision, S.-H.L., H.-S.Y. and S.-J.L. (Seung-Jun Lee); project administration, S.-H.L. and H.-S.Y.; funding acquisition, S.-H.L. and H.-S.Y. All authors have read and agreed to the published version of the manuscript.
Funding
This work was supported by the National Research Foundation of Korea (NRF) grant, funded by the Korean government (MSIT) (RS-2023-00248092).
Institutional Review Board Statement
Not applicable.
Informed Consent Statement
Not applicable.
Data Availability Statement
The original contributions presented in the study are included in the article; further inquiries can be directed to the corresponding author.
Conflicts of Interest
The authors declare no conflicts of interest.
References
- Kang, D.H.; Nam, D.H.; Jeung, S.J.; Kim, B.S. Impact assessment of flood damage in urban areas using rcp 8.5 climate change scenarios and building inventory. Water 2021, 13, 756. [Google Scholar] [CrossRef] [Scilit]
- Zhou, Q. A review of sustainable urban drainage systems considering the climate change and urbanization impacts. Water 2014, 6, 976–992. [Google Scholar] [CrossRef] [Scilit]
- Westra, S.; Fowler, H.J.; Evans, J.P.; Alexander, L.V.; Berg, P.; Johnson, F.; Kendon, E.J.; Lenderink, G.; Roberts, N. Future changes to the intensity and frequency of short-duration extreme rainfall. Rev. Geophys. 2014, 52, 522–555. [Google Scholar] [CrossRef] [Scilit]
- Choo, Y.M.; Sim, S.B.; Choe, Y.W. A study on urban inundation using SWMM in Busan, Korea, using existing dams and artificial underground waterways. Water 2021, 13, 1708. [Google Scholar] [CrossRef] [Scilit]
- Yu, I.; Park, K.; Lee, E.H. Flood risk analysis by building use in urban planning for disaster risk reduction and climate change adaptation. Sustainability 2021, 13, 13006. [Google Scholar] [CrossRef] [Scilit]
- Mustafa, A.; Szydłowski, M.; Veysipanah, M.; Hameed, H.M. GIS-based hydrodynamic modeling for urban flood mitigation in fast-growing regions: A case study of Erbil, Kurdistan Region of Iraq. Sci. Rep. 2023, 13, 8935. [Google Scholar] [CrossRef] [Scilit]
- Kim, M.; Jang, S.; Kang, S.; Choi, H. Analysis of flood inundation simulation according to terrain resolution and interpolation methods. J. Korea Water Resour. Assoc. 2025, 58, 1379–1393. [Google Scholar]
- Bates, P.D.; Horritt, M.S.; Fewtrell, T.J. A simple inertial formulation of the shallow water equations for efficient two-dimensional flood inundation modelling. J. Hydrol. 2010, 387, 33–45. [Google Scholar] [CrossRef] [Scilit]
- Guven, D.S.; Yenigun, K.; Isinkaralar, O.; Isinkaralar, K. Modeling flood hazard impacts using GIS-based HEC-RAS technique towards climate risk in Şanlıurfa, Türkiye. Nat. Hazards 2025, 121, 3657–3675. [Google Scholar] [CrossRef] [Scilit]
- Madhuri, R.; Raja, Y.S.; Raju, K.S.; Punith, B.S.; Manoj, K. Urban flood risk analysis of buildings using HEC-RAS 2D in climate change framework. H2Open J. 2021, 4, 262–275. [Google Scholar] [CrossRef] [Scilit]
- Shah, Z.; Saraswat, A.; Samal, D.R.; Patel, D. A single interface for rainfall-runoff simulation and flood assessment—A case of new capability of HEC-RAS for flood assessment and management. Arab. J. Geosci. 2022, 15, 1526. [Google Scholar] [CrossRef] [Scilit]
- Manandhar, B.; Cui, S.; Wang, L.; Shrestha, S. Urban flood hazard assessment and management practices in south asia: A review. Land 2023, 12, 627. [Google Scholar] [CrossRef] [Scilit]
- Teng, J.; Jakeman, A.J.; Vaze, J.; Croke, B.F.; Dutta, D.; Kim, S. Flood inundation modelling: A review of methods, recent advances and uncertainty analysis. Environ. Model. Softw. 2017, 90, 201–216. [Google Scholar] [CrossRef] [Scilit]
- Houston, D.; Werrity, A.; Bassett, D.; Geddes, A.; Hoolachan, A.; McMillan, M. Pluvial (Rain-Related) Flooding in Urban Areas: The Invisible Hazard. 2011. Available online: https://eprints.gla.ac.uk/162145/ (accessed on 12 April 2026).
- Beven, K.J.; Kirkby, M.J. A physically based, variable contributing area model of basin hydrology/Un modèle à base physique de zone d’appel variable de l’hydrologie du bassin versant. Hydrol. Sci. J. 1979, 24, 43–69. [Google Scholar] [CrossRef] [Scilit]
- O’Callaghan, J.F.; Mark, D.M. The extraction of drainage networks from digital elevation data. Comput. Vis. Graph. Image Process. 1984, 28, 323–344. [Google Scholar] [CrossRef] [Scilit]
- Sanders, B.F. Evaluation of on-line DEMs for flood inundation modeling. Adv. Water Resour. 2007, 30, 1831–1843. [Google Scholar] [CrossRef] [Scilit]
- Fewtrell, T.J.; Duncan, A.; Sampson, C.C.; Neal, J.C.; Bates, P.D. Benchmarking urban flood models of varying complexity and scale using high resolution terrestrial LiDAR data. Phys. Chem. Earth Parts A/B/C 2011, 36, 281–291. [Google Scholar] [CrossRef] [Scilit]
- Jenson, S.K.; Domingue, J.O. Extracting topographic structure from digital elevation data for geographic information system analysis. Photogramm. Eng. Remote Sens. 1988, 54, 1593–1600. [Google Scholar]
- Huang, C.; Davis, L.; Townshend, J. An assessment of support vector machines for land cover classification. Int. J. Remote Sens. 2002, 23, 725–749. [Google Scholar] [CrossRef] [Scilit]
- Camps-Valls, G. Support vector machines in remote sensing: The tricks of the trade. In Proceedings of the Image and Signal Processing for Remote Sensing XVII; SPIE: Cergy-Pontoise, France, 2011; Volume 8180, pp. 81–89. [Google Scholar]
- Keerthi, S.S.; Lin, C.J. Asymptotic behaviors of support vector machines with Gaussian kernel. Neural Comput. 2003, 15, 1667–1689. [Google Scholar] [CrossRef] [Scilit]
- Hsu, C.W.; Chang, C.C.; Lin, C.J. A Practical Guide to Support Vector Classification. 2023. Available online: https://www.csie.ntu.edu.tw/~cjlin/papers/guide/guide.pdf (accessed on 18 February 2026).
- Friese, J. The Impact of Soil Land Cover Infiltration Rates on Flood Modelling. 2025. Available online: https://stud.epsilon.slu.se/21445/1/friese-j-20250708.pdf (accessed on 12 April 2026).
- Esri. Flood Simulation in ArcGIS Pro 3.6; Esri Technical Paper; Environmental Systems Research Institute (Esri): Redlands, CA, USA, 2025. [Google Scholar]
- Tavus, B.; Kocaman, S.; Nefeslioğlu, H.; Gokceoglu, C. Flood mapping using sentinel-1 sar data: A case study of ordu 8 August 2018 flood. Int. J. Environ. Geoinform. 2019, 6, 333–337. [Google Scholar] [CrossRef] [Scilit]
- Anucharn, T.; Chaikaew, N.; Sriprom, T.; Iamchuen, N. Cloud-Powered Flood Mapping and Impact Assessment: Leveraging Sentinel-1 SAR Imagery for Thailand’s Disaster Response. Int. J. Geoinform. 2025, 21, 95–122. [Google Scholar]
- Shinde, S.; Pande, C.B.; Barai, V.; Gorantiwar, S.; Atre, A. Flood impact and damage assessment based on the Sentitnel-1 SAR data using google earth engine. In Climate Change Impacts on Natural Resources, Ecosystems and Agricultural Systems; Springer: Berlin/Heidelberg, Germany, 2023; pp. 483–502. [Google Scholar]

Disclaimer/Publisher’s Note: The statements, opinions and data contained in all publications are solely those of the individual author(s) and contributor(s) and not of MDPI and/or the editor(s). MDPI and/or the editor(s) disclaim responsibility for any injury to people or property resulting from any ideas, methods, instructions or products referred to in the content. |
© 2026 by the authors. Licensee MDPI, Basel, Switzerland. This article is an open access article distributed under the terms and conditions of the Creative Commons Attribution (CC BY) license.