


Abstract
Typhoon-induced extreme weather poses a severe threat to power systems with high offshore wind penetration. Source-side wind turbine tripping and grid-side transmission line failures are likely to occur simultaneously, which may trigger cascading outages and large-scale load shedding. A multi-level source-grid-load-storage preventive resilience dispatch strategy is proposed. A typhoon spatiotemporal evolution model is first established based on the Batts gradient wind model. Failure probability models for offshore wind turbines and overhead transmission lines are developed while considering strong wind and lightning strike effects. The most probable and severe fault scenario is identified using an entropy-based quantification method. A two-stage robust preventive dispatch model is subsequently formulated. In the day-ahead stage, unit commitment, multi-type reserve allocation, and pumped storage scheduling are optimized at a 1 h resolution. In the real-time stage, combined wind-storage systems are coordinated at a 10 min resolution to accommodate rapid wind power ramps caused by high-wind shutdown events. The model is reformulated through Lagrangian duality and solved by the Benders decomposition algorithm. Case studies on a modified IEEE-RTS 24-bus system with three offshore wind farms demonstrate that the proposed strategy reduces wind curtailment by 66.3%, load shedding by 74.6%, and total cost by 14.8% compared with the case without energy storage. The combined operation cost of storage resources accounts for only 3.1% of the total cost, confirming its favorable cost-effectiveness for resilience enhancement. The proposed strategy contributes to the sustainable integration of offshore wind energy by ensuring a reliable power supply during extreme weather events.
1. Introduction
The role of offshore wind power in advancing sustainable global decarbonization has been widely acknowledged [1,2]. Rapid expansion of offshore wind installations has been witnessed in East Asian coastal waters over the past decade. These waters, however, are simultaneously among the most typhoon-prone regions worldwide [3,4]. Source-side offshore wind turbines face the dual threat of protective high-wind shutdown and irreversible structural failure when typhoons make landfall [5,6,7]. On the grid side, overhead transmission lines are vulnerable to both aerodynamic overloading and lightning-induced flashover [8,9]. Wind power output can fluctuate drastically within minutes under such extreme conditions [10]. When source-side and grid-side failures occur concurrently, cascading outages and widespread load shedding become highly probable [11]. Ensuring the resilience of power systems under typhoon threats is essential for achieving sustainable offshore wind energy utilization and long-term decarbonization goals. Preventive resilience dispatch for power systems integrating multiple offshore wind farms under typhoon threats, therefore, warrants an in-depth investigation.
Considerable attention has been devoted to modeling the physical effects of typhoons on offshore wind infrastructure. Qin et al. [5] carried out fully coupled aeroelastic simulations to quantify the extreme load and fatigue damage of monopile turbines exposed to typhoon winds. The spatial non-uniformity of hub-height wind speeds across a single wind farm was highlighted by Wang et al. [6], where order-of-magnitude differences between neighboring turbines were reported. Wang et al. [7] introduced a data-driven framework characterizing multi-stage wind load evolution throughout a typhoon transit. Probabilistic typhoon trajectory synthesis coupled with capacity-dependent turbine performance evaluation was addressed by Ning et al. [12]. Long-term escalation of cyclone-related hazards to offshore turbines due to climate warming was assessed by Wen et al. [13]. On the transmission side, Huang and Wang [8] presented a real-time downscaling technique, enabling dynamic wind-field risk prediction for overhead lines during tropical cyclones. Combined wind–rain effects on tower structural reliability were quantified by Wang et al. [9], where curtailment decisions and line outage contingencies were jointly embedded in a risk-aware scheduling formulation. Design-code adequacy for turbine towers in typhoon-affected Chinese waters was examined by Wang et al. [14], revealing insufficient safety margins in current standards. Despite these advances, source-side and grid-side failures are predominantly treated in isolation, and no integrated framework has been developed for their simultaneous occurrence.
Power system dispatch under typhoon uncertainty has also received growing interest. Liang et al. [15] formulated a Wasserstein-distance-based distributionally robust model addressing chance-constrained generation scheduling with multiple offshore wind farms. Typhoon-uncertain unit commitment was tackled via progressive hedging by Liu et al. [16]. Liu et al. [17] incorporated transient frequency security following turbine trip and island formation events into commitment decisions. A sample-based two-stage robust method for commitment optimization amid typhoon disturbances was devised by He et al. [18]. Zhang et al. [19] explored load-priority-aware preventive rescheduling, coordinating wind generation and thermal units. The above works share a common limitation: either source-side or grid-side contingencies are addressed, but not both simultaneously, leaving the compounded risk from their concurrent realization insufficiently explored.
Flexible resource coordination for extreme event resilience has attracted substantial research effort as well. Hu et al. [20] jointly scheduled diverse resources—wind power, demand response, and battery storage—through a two-stage stochastic program to bolster system survivability. Cross-network resource sharing within a coastal transmission–distribution–gas framework was realized via tri-layer distributed optimization by Cao and Li [21]. Ren et al. [22] employed column-and-constraint generation to derive robust ramp-control policies under wind forecast uncertainty. Multi-source hydro–thermal–wind coordination under typhoon conditions was optimized by Qian et al. [23] using conditional value-at-risk. Jia et al. [24] proposed a storm-aware ramp forecasting and mitigation pipeline for offshore wind farms. These studies largely confine themselves to a single extreme scenario. The interplay between concurrent source–grid failures and sub-hourly wind–storage coordination has received little attention.
Overall, three gaps are identified in the existing literature:
- Existing fault modeling under typhoon scenarios is mostly performed separately for source-side wind turbine outages or grid-side transmission line failures. A unified source–grid-coupled fault probability modeling method is still lacking, which limits the accurate characterization of the coupled disaster effects of typhoons on power systems.
- Most existing resilience dispatch strategies focus on a single timescale or a single type of resource. A multi-level coordination framework that integrates source, grid, load, and storage has not been established, which restricts the synergistic effectiveness of diverse flexible resources under extreme scenarios.
- The sub-hourly coordination mechanism of combined wind-storage systems during typhoon-induced high-wind shutdown events has not been sufficiently investigated. Existing methods cannot effectively cope with the short-term power deficit caused by the rapid decline in wind power output.
To address the above limitations, a two-level source-grid-load-storage preventive resilience dispatch strategy is proposed for power systems with multiple offshore wind farms under typhoon scenarios. The main contributions are summarized as follows:
- A unified source–grid-coupled fault modeling method is developed, integrating wind turbine and transmission line failure models with an entropy-based worst-case scenario identification approach.
- A two-stage robust dispatch model with source-grid-load-storage coordination is formulated, jointly optimizing unit commitment and multi-type reserves at the day-ahead stage and coordinating wind-storage systems at 10 min resolution in real time.
- A “charge-then-discharge” sub-hourly coordination mechanism is revealed for combined wind-storage systems to smooth rapid power decline during high-wind shutdown events.
The remainder of this paper is organized as follows. Section 2 reviews the background and related work. Section 3 presents the typhoon spatiotemporal evolution model and the source–grid dual fault probability analysis. Section 4 formulates the two-stage robust preventive dispatch model with source-grid-load-storage coordination. Section 5 conducts case studies and evaluates the dispatch performance under different scenarios. Section 6 provides the conclusions.
2. Background and Related Work
This section provides a broader review of the research background to contextualize the contributions of the present study. Three interrelated topics are discussed: typhoon hazard characterization for offshore wind and transmission infrastructure, power system resilience assessment, and energy storage for extreme event mitigation.
2.1. Typhoon Hazard Characterization for Offshore Wind and Transmission Systems
Typhoons represent one of the most destructive natural hazards for coastal power infrastructure. The physical interaction between typhoon wind fields and offshore wind turbines has been investigated from multiple perspectives. Chen et al. [11] evaluated the long-term fatigue life reduction of offshore turbine towers subjected to repeated cyclone passages. It was concluded that cumulative cyclone damage can shorten the design life by up to 15%. Li et al. [25] conducted a case study on the impact of Typhoon Mangkhut on floating offshore wind platforms. The mooring system was found to experience peak tension during the eyewall passage. Kresning et al. [26] quantified the uncertainty of extreme wind and wave loads in hurricane-prone regions. The sensitivity of structural reliability to the choice of probability distribution for extreme events was highlighted.
On the transmission side, the vulnerability of overhead lines to typhoon-force winds has been analyzed through fragility curve approaches and wind-field reconstruction techniques. Wang et al. [27] assessed the feasibility of different typhoon wind models for predicting the structural response of parked wind turbines and nearby tower structures. It was found that the Holland-type parametric model provides a reasonable balance between accuracy and computational efficiency. Xiong et al. [28] evaluated the ERA5 reanalysis wind field against observational data during typhoon storm surge events. Correction methods were proposed to improve accuracy for power system risk assessment in typhoon-prone coastal regions. These studies provide the physical foundation upon which the fault probability models in the present work are built.
2.2. Power System Resilience Assessment
The concept of power system resilience has gained significant attention in the context of increasing extreme weather frequency. Resilience is generally defined as the ability of a power system to anticipate, absorb, adapt to, and rapidly recover from high-impact, low-probability events [2]. Kasimalla et al. [2] presented a comprehensive review of sustainable power system resilience under severe weather and climate change. Machine learning-based assessment techniques were integrated with traditional resilience metrics, and the importance of coupling weather forecasting with dispatch decisions was emphasized. Mujjuni et al. [29] reviewed methods and assumptions for evaluating power system resilience to extreme weather events. Key gaps were identified in scenario generation, fragility modeling, and metric standardization. It was noted that most existing resilience assessment frameworks rely on simplified weather models that may not adequately capture the spatiotemporal evolution of typhoon wind fields. Lee et al. [30] proposed a data-driven approach to quantify the resilience of the US power grid. Weather patterns were mapped to large-scale customer outage records, and the results demonstrated that spatial correlation of outages is a critical factor often overlooked in simulation-based assessments. These frameworks establish the conceptual basis for the resilience-oriented dispatch strategy proposed in this paper.
2.3. Energy Storage for Extreme Event Mitigation
Energy storage systems have been widely recognized as critical flexible resources for enhancing power system resilience during extreme events. Hossain et al. [31] systematically reviewed the metrics and enhancement strategies for grid resilience during natural disasters. The potential of distributed energy storage in reducing outage duration and economic losses was emphasized. It was concluded that battery storage can reduce peak load shedding by 30–50% in distribution systems subjected to hurricane-induced outages when properly sized and positioned.
Battery energy storage can provide rapid power compensation on sub-minute timescales, which is particularly valuable during the fast power ramps caused by typhoon-induced turbine shutdowns. Pumped hydro storage, on the other hand, offers large-capacity energy shifting across hours and is well-suited for day-ahead scheduling optimization. The coordinated deployment of these two types of storage resources under typhoon scenarios, however, has received limited attention in the existing literature. Most studies focus on either battery storage or pumped storage in isolation, and the coordination between them across different timescales has not been systematically addressed. Furthermore, the integration of multi-type storage resources into a unified dispatch framework that accounts for concurrent source–grid failures under typhoon conditions remains an open research challenge. The present study aims to bridge this gap by developing a two-level coordination framework that leverages both battery storage (for real-time sub-hourly compensation) and pumped hydro storage (for day-ahead energy balance) within a robust optimization formulation.
3. Typhoon Spatiotemporal Evolution Modeling and Source–Grid Dual Fault Probability Analysis
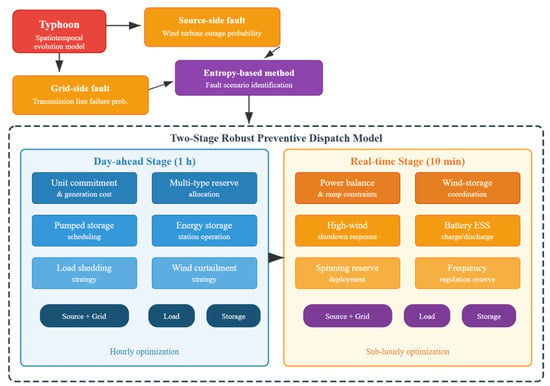
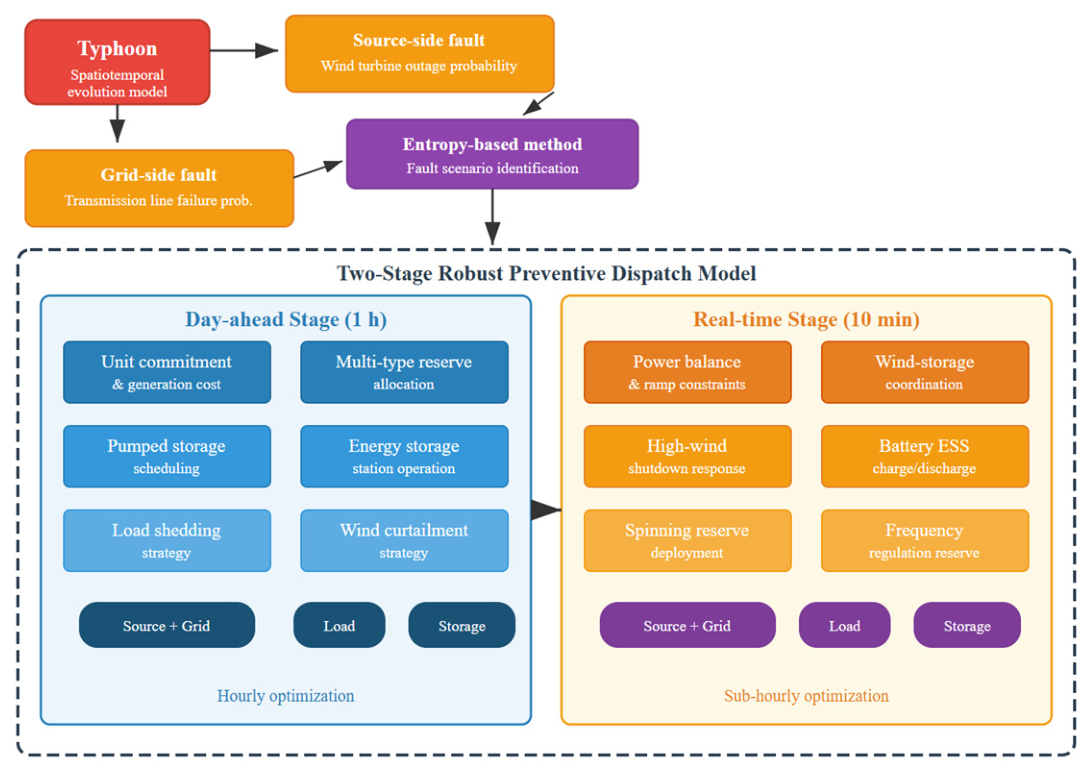
The overall framework of the proposed two-level source-grid load-storage preventive resilience dispatch strategy is illustrated in Figure 1. The framework consists of two main modules: the typhoon-induced fault analysis module (this section) and the two-stage dispatch optimization module (Section 3). In the fault analysis module, a typhoon spatiotemporal evolution model is first established. Failure probability models for offshore wind turbines and overhead transmission lines are then developed. Finally, the most probable and severe fault scenario is identified through an entropy-based quantification method.
Figure 1.
Overall framework of the proposed two-level source-grid-load-storage preventive resilience dispatch strategy. Source: authors’ own elaboration.
3.1. Typhoon Wind-Field Modeling Based on the Batts Gradient Wind Model
Typhoon wind-field modeling serves as a prerequisite for evaluating equipment failure probability. The Batts gradient wind model is adopted to describe the radial distribution of wind speed within the typhoon-affected area [15]. This model is based on the central pressure difference and the maximum wind speed radius. The gradient wind speed at a distance from the typhoon center is expressed as:
where is the pressure difference between the typhoon center and the periphery/Pa; is the air density/kg·m−3; is the radius of maximum wind speed/km; is the Holland pressure profile shape parameter; is the Coriolis parameter/s−1.
The shape parameter and the maximum wind speed radius are determined by the following empirical formulas:
where is the central pressure of the typhoon/hPa; is the latitude of the typhoon center/°; is the translational speed of the typhoon/m·s−1.
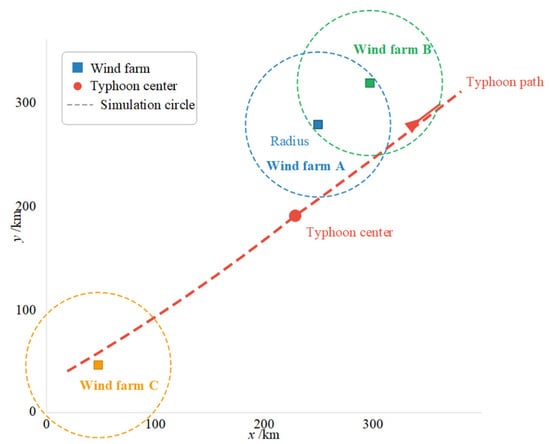
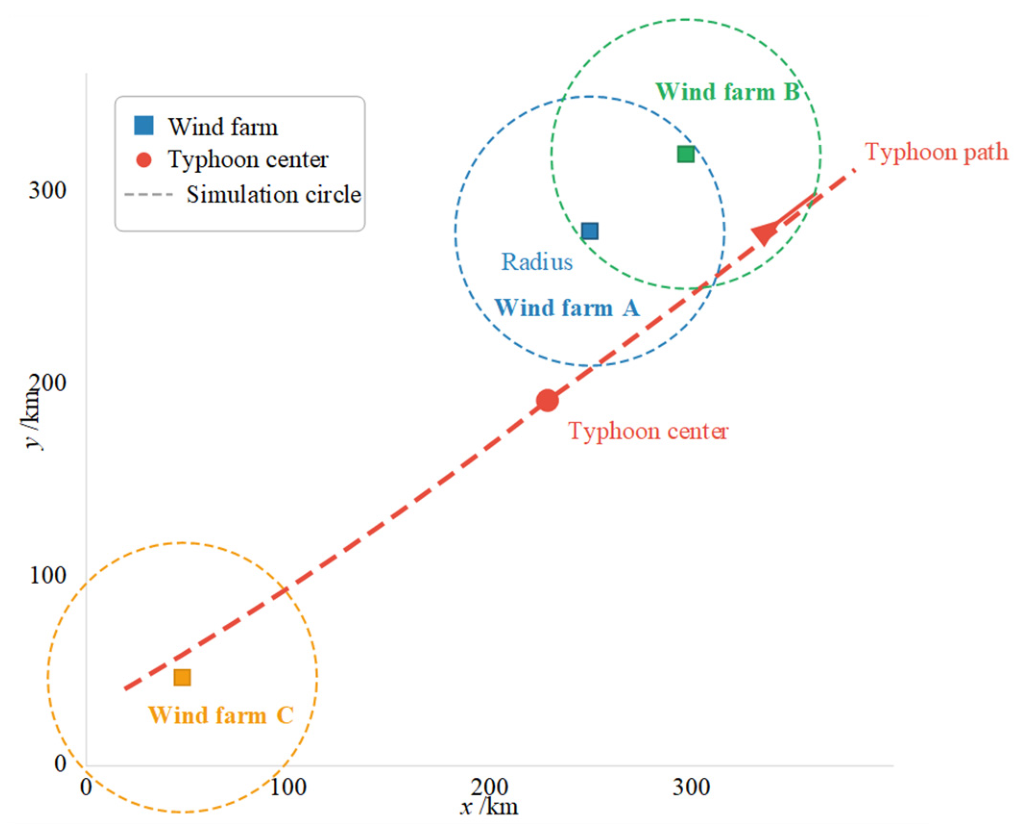
To determine the affected time period of each offshore wind farm, the circular sub-region method is adopted [15]. A circle with an influence radius is constructed around each wind farm. When the typhoon path intersects the circle, the corresponding wind farm is considered to be affected. The schematic diagram of this method for three offshore wind farms is shown in Figure 2. The typhoon enters the influence regions of different wind farms at different times. This reflects the spatiotemporal heterogeneity of typhoon impacts.
Figure 2.
Schematic diagram of the circular sub-region method for three offshore wind farms. Source: authors’ own elaboration.
The gradient wind speed is then converted to the hub height of wind turbines:
where is the wind speed at hub height/m·s−1; is the surface roughness correction coefficient; is the hub height/m; is the gradient wind height/m; is the wind shear exponent.
3.2. Failure Probability Model of Offshore Wind Turbines
Offshore wind turbines are exposed to both high-wind shutdown and structural damage during typhoon events [5]. When the hub-height wind speed exceeds the cut-out threshold, a protective shutdown is triggered. In addition, extremely high wind speeds may cause destructive failures of blades and towers. Considering both failure mechanisms, the failure probability of the wind turbine at time is expressed as:
where is the hub-height wind speed of the turbine at time /m·s−1; is the cut-out wind speed/m·s−1; is the destruction wind speed/m·s−1; and are the scale and shape parameters of the Weibull distribution, respectively.
During typhoon events, heavy rainfall may also degrade the aerodynamic performance of wind turbine blades due to surface roughness changes and water film formation. A rain-induced power loss factor is introduced to account for this effect:
where is the rain-corrected wind power output of turbine at time /MW; is the rain-induced power loss coefficient, typically ranging from 0.02 to 0.05, depending on the rainfall intensity [9]. This correction is applied to the available wind power before it enters the dispatch model.
When below the cut-out wind speed, the turbine operates normally. When the wind speed falls between the cut-out and destruction thresholds, the turbine is shut down, but a certain probability of structural damage exists. Above the destruction threshold, the turbine is considered to have completely failed.
The frequency of lightning strikes also increases significantly during typhoons. The additional failure probability due to lightning is modeled as:
where is the lightning strike density/strikes·km−2·h−1; is the equivalent lightning attraction area of turbine /km2; is the time step/h.
The combined failure probability of turbine at time is then obtained as:
3.3. Failure Probability Model of Overhead Transmission Lines
Overhead transmission lines are primarily subjected to wind loading and lightning flashover during typhoons [9]. When the wind load on conductors and towers exceeds the design capacity, structural failure occurs. The wind-induced failure probability of line at time is expressed as:
where is the standard normal cumulative distribution function; is the wind load on line at time /kN; is the design capacity/kN; is the logarithmic standard deviation reflecting parametric uncertainty.
Under heavy rainfall conditions, the insulation performance of transmission line surfaces is degraded, which increases the flashover probability. A rain correction factor is applied to the wind load:
where is the rain amplification factor for the effective wind load, reflecting the combined wind–rain loading on tower structures. For typical typhoon rainfall intensities, ranges from 1.05 to 1.15 [8]. In Equation (11), is replaced by when rainfall data are available.
The wind load is related to the wind speed as follows:
where is the drag coefficient; is the wind speed at the location of line at time /m·s−1; is the conductor diameter/m; is the span length/m.
The lightning-induced trip probability is given by:
where is the length of line /km; is the equivalent lightning attraction width/km.
The combined failure probability of line at time is obtained as:
3.4. Determination of Fault Scenarios Under Typhoon Weather
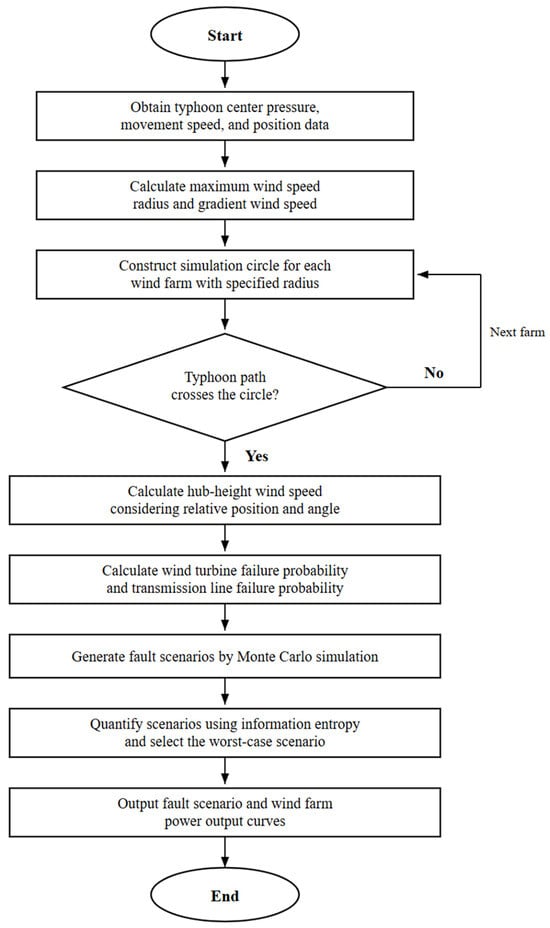
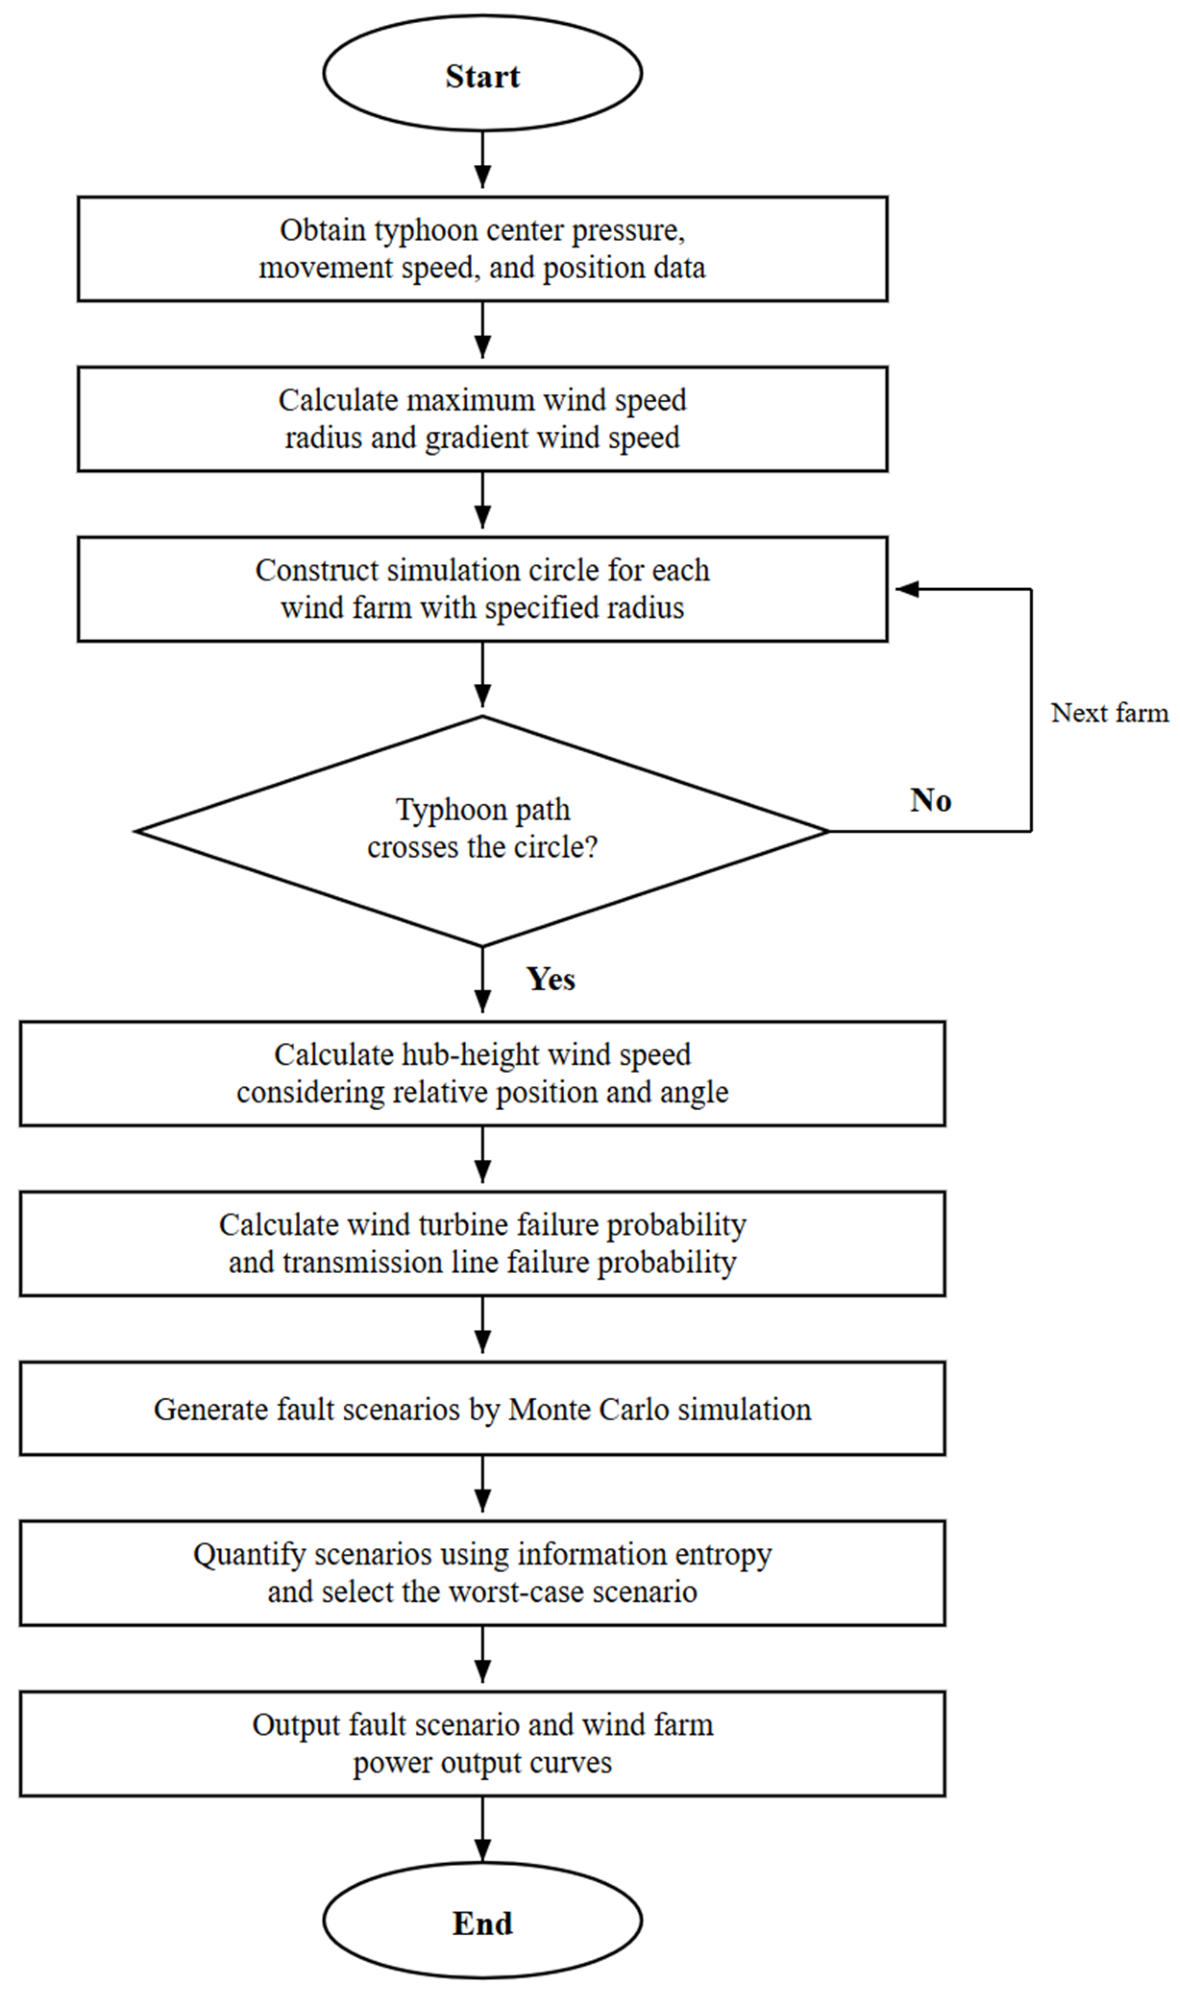
Based on the above failure probability models, a large number of source–grid-coupled fault scenarios are generated through Monte Carlo simulation [15]. However, it is computationally infeasible to consider all scenarios directly. A representative scenario must be identified. An information-entropy-based quantification method is adopted to evaluate each scenario from the perspectives of probability severity and consequence severity.
The complete flowchart for fault scenario determination is presented in Figure 3. For each scenario generated by Monte Carlo sampling, a composite severity index is defined as:
where and are weighting coefficients satisfying ; and are the probability severity and consequence severity of scenario , respectively.
Figure 3.
Flowchart for determining wind farm power output and fault scenarios under typhoon weather. Source: authors’ own elaboration.
The probability severity is defined based on information entropy:
where is the total number of equipment components (including wind turbines and transmission lines); is the failure probability of component in scenario .
The consequence severity is defined as the proportion of power deficit to total load:
where is the system power deficit under scenario /MW; is the total system load/MW.
The scenarios are ranked by the composite severity index in descending order. The top- scenarios are retained to form an uncertainty set . This set serves as the uncertainty input for the subsequent two-stage dispatch model. Compared with selecting only a single worst-case scenario, the multi-scenario uncertainty set provides improved robustness against typhoon trajectory variability.
4. Two-Stage Robust Preventive Dispatch Model with Source-Grid-Load-Storage Coordination
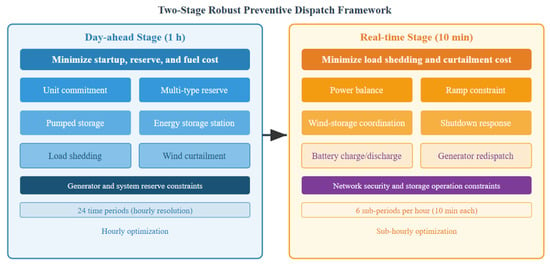
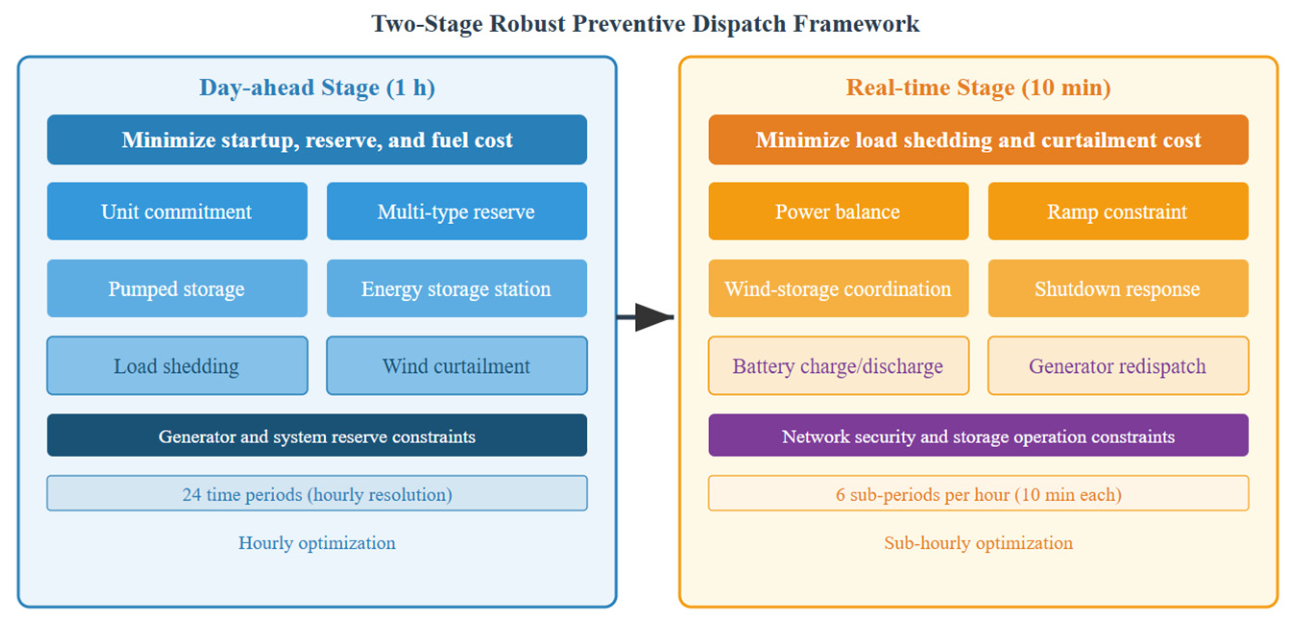
Based on the fault scenarios identified in Section 2, a two-stage robust preventive dispatch model is formulated. As shown in Figure 4, the day-ahead stage optimizes unit commitment, multi-type reserve allocation, and pumped storage scheduling at a 1 h resolution. The real-time stage coordinates the combined wind-storage system at a 10 min resolution to accommodate rapid power ramps caused by high-wind shutdown events.
Figure 4.
Framework of the two-stage robust preventive dispatch model with multi-timescale coordination. Source: authors’ own elaboration.
4.1. Objective Function
The total objective of the two-stage model is to minimize the sum of the day-ahead operating cost and the worst-case real-time adjustment cost:
where is the day-ahead cost; is the real-time cost under fault scenario ; is the fault scenario set determined in Section 3.4. The day-ahead decisions are optimized to be robust against the worst realization within .
The day-ahead cost consists of startup cost, fuel cost, and reserve cost:
where is the number of scheduling periods (); is the number of conventional generators; is the startup cost of generator /$; is the startup binary variable; is the fuel cost coefficient/$·MW−1; is the active power output of generator at period /MW; and are the prices of upward and downward spinning reserve/$·MW−1; and are the upward and downward spinning reserve capacities/MW; and are the prices of upward and downward frequency regulation reserve/$·MW−1; and are the corresponding reserve capacities/MW.
The real-time cost includes load shedding and wind curtailment penalties:
where is the number of sub-periods per hour (, i.e., 10 min resolution); is the load shedding penalty price/$·MW−1; is the amount of load shedding in sub-period of period under scenario /MW; is the wind curtailment penalty price/$·MW−1; is the corresponding curtailed wind power/MW; is the demand response compensation price /$·MW−1; is the total demand response curtailment at sub-period of period under scenario /MW.
4.2. Day-Ahead Unit Commitment and Multi-Type Reserve Constraints
The operational constraints of conventional generators include output limits, ramping limits, and minimum up/down time constraints:
where is the on/off status of generator at period (binary); and are the minimum and maximum power outputs/MW; and are the downward and upward ramping rates/MW·h−1; and are the minimum on and off durations/h.
The multi-type reserve constraints require the system to simultaneously satisfy spinning reserve and frequency regulation reserve requirements [18]:
where is the upward spinning reserve requirement at period /MW; is the upward frequency regulation reserve requirement/MW. The last constraint ensures that the total reserve provided by a single generator does not exceed its available headroom.
4.3. Combined Wind-Storage System Operation Constraints
Each offshore wind farm and its associated energy storage station form a combined wind-storage system. Power variation limits must be satisfied under both normal operation and high-wind shutdown conditions. The power balance of the combined wind-storage system is given by:
where is the combined output of wind farm at sub-period of period /MW; is the available wind power output/MW; is the curtailed wind power/MW; and are the discharging and charging powers of the storage station/MW.
The 10 min power variation rate constraint is expressed as:
where is the 10 min power variation limit/MW, as determined by Table 1.
Table 1.
Parameters of offshore wind farms in the test system.
The available wind power is subject to short-term forecast errors. To account for this uncertainty, the actual wind power output is modeled as:
where is the actual wind power output/MW; is the forecast error/MW, bounded by:
where is the relative forecast error bound of wind farm . In the robust dispatch formulation, the worst-case realization of within this interval is considered jointly with the fault scenario set in the inner maximization. The wind power term in the nodal balance constraint is accordingly replaced by .
4.4. Pumped Storage and Energy Storage Station Operation Constraints
Pumped storage units operate in either generation or pumping mode. These two modes are mutually exclusive within the same period [15]:
where and are the generation and pumping powers of unit at period /MW; is the operating mode variable (1 for generation, 0 for pumping); and are the maximum generation and pumping powers/MW; is the stored energy of the upper reservoir/MWh; is the pumping efficiency.
The operational constraints of the energy storage station follow a similar formulation:
where is the operating mode variable of the storage station; and are the discharging and charging efficiencies; is the state of energy/MWh; is the sub-period time step (10 min).
4.5. Real-Time Sub-Hourly Economic Dispatch Model
The real-time stage performs economic dispatch at a 10 min resolution based on the day-ahead unit commitment decisions. The decision variables include generator output adjustments, storage charging/discharging powers, and load shedding/wind curtailment amounts. The nodal power balance constraint is formulated as:
where , , , and denote the sets of generators, wind farms, pumped storage units, and transmission lines connected to bus , respectively; is the power flow on line /MW; is the load at bus /MW; is the demand response curtailment at bus in sub-period of period /MW.
The DC power flow equation is adopted to model the network constraints:
where and are the voltage phase angles at the two terminal buses of line /rad; is the line reactance/pu; is the line availability indicator under fault scenario (1 if operational, 0 if failed).
The line flow limit is expressed as:
where is the thermal capacity of line /MW. These constraints ensure that the impact of transmission line failures on network topology and power transfer capability is accurately captured.
The demand response resource is modeled as a voluntary load curtailment with an upper bound and a total energy limit:
where is the maximum demand response participation ratio at bus ; is the maximum allowable energy curtailment over the scheduling horizon/MWh.
The real-time output of each generator is bound by the day-ahead reserve allocation:
where is the output of generator at sub-period /MW; is the 10 min ramping capability/MW.
4.6. Deterministic Reformulation and Solution Method
The two-stage robust optimization model contains a min–max structure that cannot be solved directly. The inner maximization problem is first transformed into a deterministic equivalent form through Lagrangian duality [18]. The Benders decomposition algorithm is then applied to decompose the original problem into a master problem (day-ahead stage) and a sub-problem (real-time stage) that are solved alternately. The key derivation steps are presented as follows.
For fixed day-ahead decisions , the real-time sub-problem under scenario is written in compact form as:
where is the vector of real-time decision variables, including generator output adjustments, storage charging/discharging powers, load shedding amounts, and wind curtailment amounts; is the cost coefficient vector; is the constraint matrix of the sub-problem; is the coupling matrix linking day-ahead decisions to real-time constraints; is the right-hand side vector incorporating load data and scenario-dependent parameters.
Since the sub-problem is a linear program for fixed , strong duality holds. The dual of the sub-problem is:
where is the vector of dual variables associated with the real-time constraints, including the dual multipliers for nodal power balance, DC power flow and line capacity constraints, and generator output bounds.
Let denote the dual feasible set, which is independent of the day-ahead decisions . Let denote the optimal dual solution obtained at iteration , where is the iteration index. The Benders optimality cut appended to the master problem is:
where is an auxiliary variable that approximates the worst-case recourse cost. The master problem at iteration is:
subject to day-ahead constraints and accumulated optimality cuts:
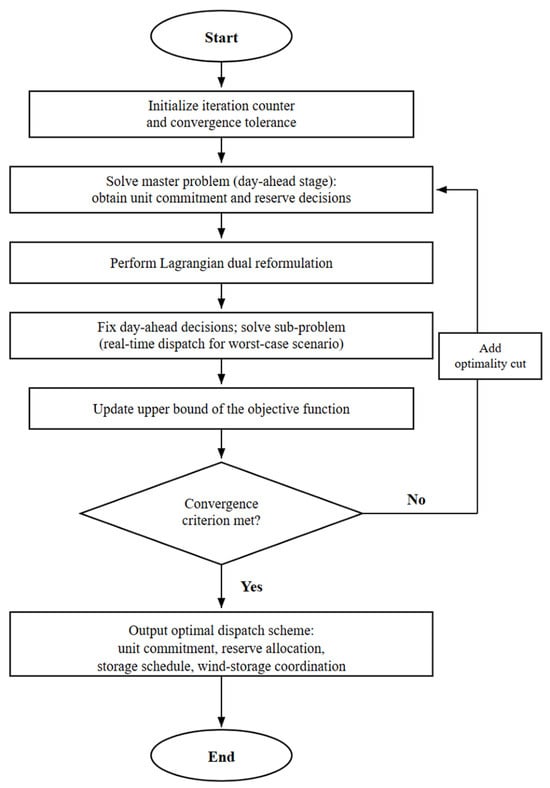
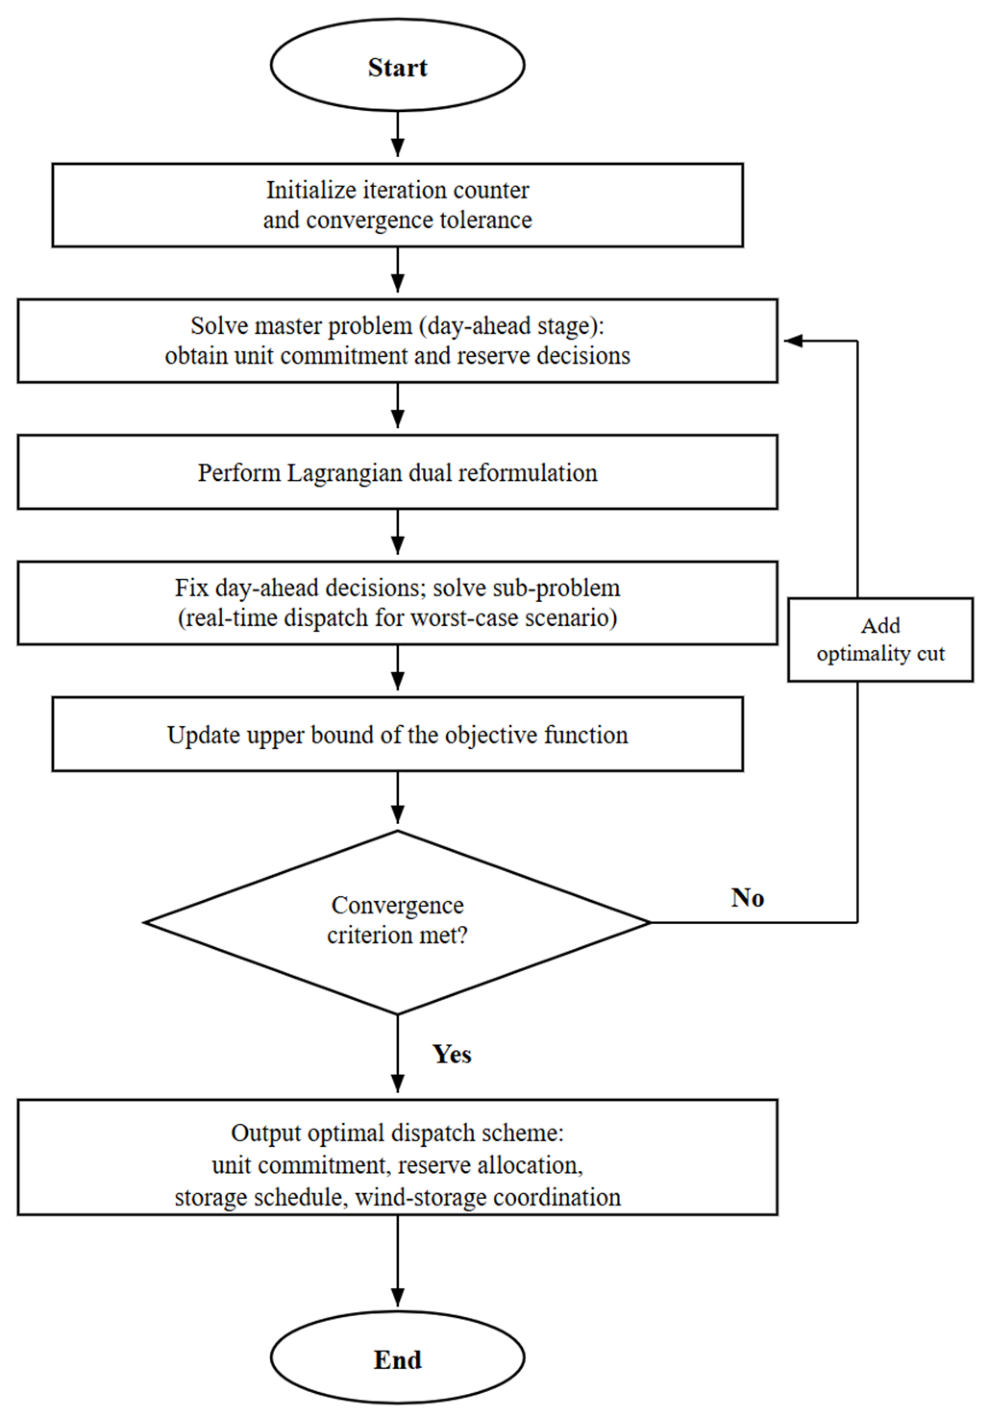
At each iteration, the master problem yields a lower bound , and the sub-problem yields an upper bound , where is the worst-case scenario within . The algorithm terminates when the convergence criterion is satisfied. The solution procedure is shown in Figure 5.
Figure 5.
Flowchart of the model reformulation and Benders decomposition solution procedure. Source: authors’ own elaboration.
The convergence criterion is given by:
where is the prescribed convergence tolerance.
5. Results
5.1. Test System and Parameter Settings
A modified IEEE-RTS 24-bus system is adopted as the test platform to validate the proposed strategy [32]. The original system contains 26 conventional thermal generators with a total installed capacity of 3405 MW and a peak load of 2850 MW. Three offshore wind farms (A, B, and C) are connected to buses 7, 15, and 21 through 220 kV submarine cables, respectively. The typhoon path is set to move from the southeast to the northwest, passing through the influence regions of the three wind farms sequentially. The parameters of each wind farm are listed in Table 1, and the parameters of the wind turbine generators adopted in this study are given in Table 2.
Table 2.
Parameters of offshore wind turbine generators.
A pumped storage station with four units is configured in the system. The generation and pumping capacities of each unit are 75 MW and 80 MW, respectively. The upper reservoir capacity is 1200 MWh. Battery energy storage stations with a rated power of 30 MW and a capacity of 120 MWh are installed at wind farms A and C. The charging and discharging efficiencies are both set to 0.92. The simulation circle radius is set to 250 km.
Each offshore wind farm and its associated storage station form a combined wind-storage system, whose output variation must satisfy the power variation limits listed in Table 3. These limits are adopted from the Chinese national standard for grid-connected wind farms and are applied in the constraints formulated in Section 4.3.
Table 3.
Power variation limits of offshore wind farms under normal operation. “—” indicates not applicable.
The typhoon parameters are selected based on typical data from the western Pacific region [3]. The central pressure is set to 945 hPa, the translational speed to 18 km/h, and the landfall latitude to 23.5°. Based on the Batts gradient wind model and the circular sub-region method, the hub-height wind speed time series for each wind farm is obtained throughout the entire typhoon lifecycle. A total of 1000 fault scenarios are generated through Monte Carlo simulation. The top- scenarios ranked by the composite severity index are retained to form the uncertainty set. In the base case, is adopted. In the worst-case scenario within this set, both wind farms A and C experience high-wind shutdown, and five 220 kV transmission lines fail due to strong winds or a lightning strike.
The rain-induced power loss coefficient is set to , and the rain amplification factor for transmission lines is set to , based on typical typhoon rainfall intensity data in the western Pacific region [9]. The relative forecast error bound is set to for all three wind farms, representing a ± 15% uncertainty range in the 10 min ahead wind power forecast during typhoon conditions.
The scheduling horizon is 24 h. The time resolution is 1 h for the day-ahead stage and 10 min for the real-time stage. The load shedding penalty price is set to 1000 $/MWh, and the wind curtailment penalty price is set to 150 $/MWh. The convergence tolerance of Benders decomposition is set to 0.1%. The model is implemented on the GAMS platform (GAMS Development Corporation, Fairfax, VA, USA; https://www.gams.com) using the CPLEX 22.1 solver (IBM, Armonk, NY, USA) [33].
To examine the effect of the number of scenarios on dispatch performance, the results under , , and are compared in Table 4.
Table 4.
Comparison of dispatch results under different numbers of scenarios.
The multi-scenario formulation () achieves a 14.3% reduction in load shedding compared with the single-scenario case (), while the computational time increases by 62%. Further increasing to yields only marginal improvement at a substantially higher computational cost. Therefore, is adopted as the default setting.
Seven cases are designed to comprehensively evaluate the effectiveness of different dispatch strategies, as summarized in Table 5. Case 1 serves as the baseline without considering any typhoon impact. Only the source-side wind turbine faults are considered in Case 2. Wind–storage coordination is introduced in Case 3 based on Case 2. Both source-side and grid-side faults are considered in Case 4, but no energy storage is deployed. The complete strategy proposed in this paper, including wind–storage coordination and pumped storage, is represented by Case 5. The storage capacity is increased to 200 MWh in Case 6 to analyze the marginal benefit of additional storage. In Case 7, demand response is enabled based on Case 5. The maximum participation ratio is set to (i.e., up to 10% of each bus load can be curtailed voluntarily). The maximum allowable energy curtailment is set to MWh. The demand response compensation price is set to $/MWh, which is lower than the load shedding penalty price (1000 $/MWh) but higher than the wind curtailment penalty price (150 $/MWh).
Table 5.
Design of simulation cases.
5.2. Wind Farm Power Output Analysis Under Typhoon Scenarios
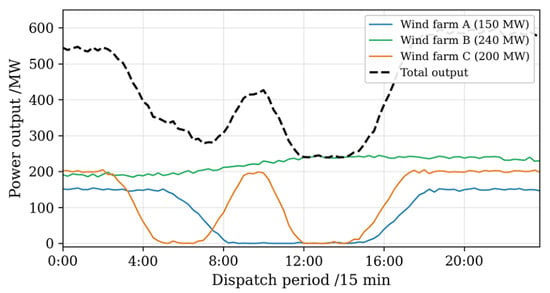
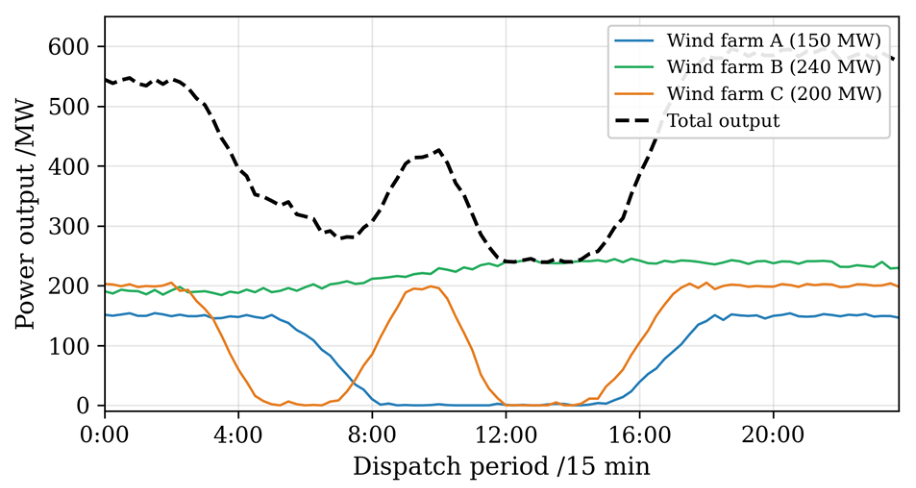
The power output variations of the three offshore wind farms and the total fleet output during the typhoon transit are presented in Figure 6. A distinct temporal staggering pattern is observed across the fleet due to the different geographical locations.
Figure 6.
Power output variations of offshore wind farms during typhoon transit. Source: authors’ own elaboration.
Wind farm C is closest to the typhoon landfall point and is affected first. The wind speed begins to exceed the cut-out threshold at approximately 02:30. The output decreases from the rated 200 MW and reaches a complete shutdown at approximately 04:30. A brief recovery to approximately 120 MW is observed at around 07:00 as the typhoon eye passes over. However, the rear-side wind band brings strong winds again, and a second shutdown occurs from 10:00 to 14:30. The rated output is restored at around 17:00. The cumulative shutdown duration is approximately 10 h, with a maximum power loss of 200 MW.
Wind farm A is located in the middle section of the typhoon track. The output begins to decline at 05:00, and a complete shutdown is reached at approximately 08:00. The output is restored at around 15:00, resulting in a shutdown duration of approximately 7 h. Compared with wind farm C, the shutdown duration is shorter. However, an overlap of approximately 5 h (10:00–15:00) exists between the shutdown of wind farm A and the second shutdown of wind farm C. This overlap is identified as the primary cause of the maximum system power deficit.
Wind farm B is farthest from the typhoon center track. No high-wind shutdown is experienced throughout the event. The output increases from an initial level of approximately 190 MW to the rated 240 MW due to the enhanced peripheral circulation, representing an increase of approximately 26%. This wind farm serves as a critical source of stable power supply during the entire typhoon transit.
The total fleet output under normal conditions is 590 MW. During the initial impact phase (02:30–04:30), only wind farm C is shut down, and the total output drops to approximately 390 MW (a 34% reduction). The most critical period is identified between 12:00 and 14:30, when both wind farms A and C are in shutdown simultaneously. The total output drops to approximately 240 MW (contributed solely by wind farm B), representing a 59% reduction from the normal level. The corresponding power deficit reaches 350 MW. During the recovery phase (15:00–17:00), wind farm A recovers first, and the total output rises to approximately 390 MW. After 17:00, wind farm C is also restored, and the total output returns to the normal level. The entire typhoon impact cycle lasts approximately 14.5 h.
5.3. Comparison of Different Dispatch Strategies
The dispatch results of the seven cases, including total cost, cost breakdown, wind curtailment, and load shedding, are summarized in Table 6.
Table 6.
Comparison of dispatch results under different cases. “—” indicates not applicable.
When only source-side faults are accounted for (Case 2), the total cost rises by 17.4% relative to the no-typhoon baseline (Case 1). The spinning reserve cost increases from 3.2 × 10⁴ $ to 5.8 × 10⁴ $, representing an 81.3% increase. This is identified as the primary driver of the cost increase. Wind curtailment of 0.083 pu and load shedding of 0.026 pu are also incurred.
A side-by-side look at Case 2 and Case 3 quantifies the benefit brought by wind–storage coordination. The total cost is reduced by 6.2% (3.5 × 10⁴ $). Wind curtailment is reduced from 0.083 pu to 0.041 pu (a 50.6% reduction), and load shedding is reduced from 0.026 pu to 0.012 pu (a 53.8% reduction). The storage service cost is only 1.2 × 10⁴ $. These results indicate that even without grid-side faults, the introduction of energy storage can significantly improve system operation.
A comparison of Case 2 and Case 4 highlights how grid-side faults amplify both system cost and load shedding. The total cost rises from 56.7 × 10⁴ $ to 72.5 × 10⁴ $, representing a 27.9% increase. The spinning reserve cost surges from 5.8 × 10⁴ $ to 12.4 × 10⁴ $ (a 113.8% increase), reflecting the substantially greater reserve demand caused by transmission line failures. Load shedding increases from 0.026 pu to 0.071 pu (a 173.1% increase). These figures confirm that neglecting grid-side faults would substantially underestimate the typhoon threat to the system.
Cases 4 and 5 are compared to assess the performance of the complete proposed strategy. The total cost is reduced by 14.8% (10.7 × 10⁴ $). Wind curtailment decreases from 0.095 pu to 0.032 pu (a 66.3% reduction), and load shedding decreases from 0.071 pu to 0.018 pu (a 74.6% reduction). The spinning reserve cost is reduced from 12.4 × 10⁴ $ to 8.7 × 10⁴ $ (a 29.8% reduction), and the frequency regulation cost is reduced from 5.6 × 10⁴ $ to 3.8 × 10⁴ $ (a 32.1% reduction). The combined operation cost of energy storage and pumped storage is 2.7 × 10⁴ $, accounting for only 4.4% of the total cost. However, a reserve cost reduction of 6.5 × 10⁴ $ is achieved, yielding a cost–benefit ratio of approximately 1:2.4.
A further comparison between Case 5 and Case 6 shows that increasing the storage capacity from 120 MWh to 200 MWh leads to an additional 3.9% reduction in total cost (2.4 × 10⁴ $). Wind curtailment and load shedding are further reduced by 21.9% and 38.9%, respectively. However, a significant diminishing marginal benefit is observed. From Case 4 to Case 5, a cost reduction of 10.7 × 10⁴ $ is achieved per 120 MWh of storage (89.2 $/MWh). From Case 5 to Case 6, only 2.4 × 10⁴ $ is saved per 80 MWh of additional storage (30.0 $/MWh). The cost reduction efficiency per unit storage capacity decreases by 66.4%. This result suggests that an economically optimal storage capacity exists. However, storage capacity expansion alone cannot eliminate load shedding entirely, as the residual shedding is constrained by network topology and the absence of demand-side flexibility.
The effect of demand response is examined by comparing Case 5 and Case 7. With the introduction of demand response (), the total cost is reduced from 61.8 × 10⁴ $ to 59.1 × 10⁴ $ (a 4.4% reduction). Load shedding decreases from 0.018 pu to 0.009 pu (a 50.0% reduction), while wind curtailment remains nearly unchanged at 0.031 pu. During the critical period (10:00–14:30), the demand response resource absorbs approximately 45 MWh of voluntary load curtailment at buses with a high load concentration, which would otherwise result in involuntary shedding. The demand response compensation cost is 2.3 × 10⁴ $, while the avoided load shedding penalty amounts to approximately 4.5 × 10⁴ $, yielding a net saving of 2.2 × 10⁴ $. These results confirm that even a modest demand response participation (10%) can substantially reduce involuntary load shedding and improve overall economic performance.
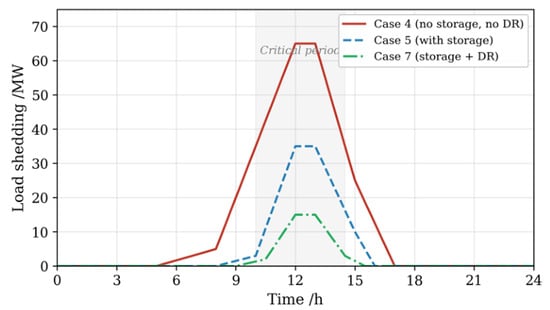
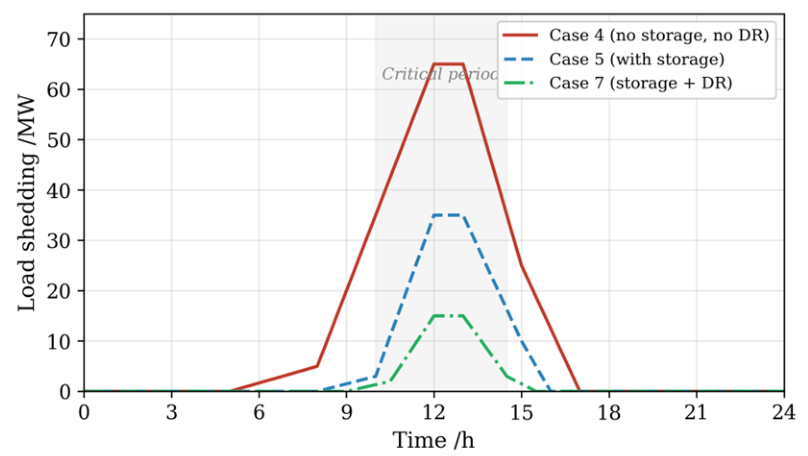
The load shedding power profiles under Case 4, Case 5, and Case 7 are compared in Figure 7. In Case 4 (no storage, no DR), load shedding peaks at approximately 65 MW at around 12:00 and persists over a wide time window from 05:00 to 17:00. With the introduction of energy storage (Case 5), the peak is reduced to approximately 35 MW, and the shedding duration is shortened to 08:00–16:00. When demand response is further enabled (Case 7), the peak is reduced to approximately 15 MW. The onset of shedding is delayed from 08:00 to 09:30, and the recovery is accelerated from 16:00 to 15:30. During the critical period (10:00–14:30, shaded area), the demand response resource absorbs a significant portion of the power deficit that would otherwise result in involuntary shedding.
Figure 7.
Comparison of load shedding power profiles under Case 4, Case 5, and Case 7. Source: authors’ own elaboration.
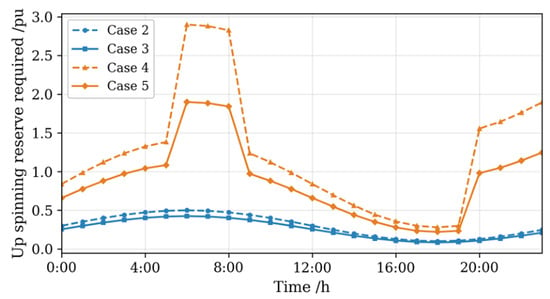
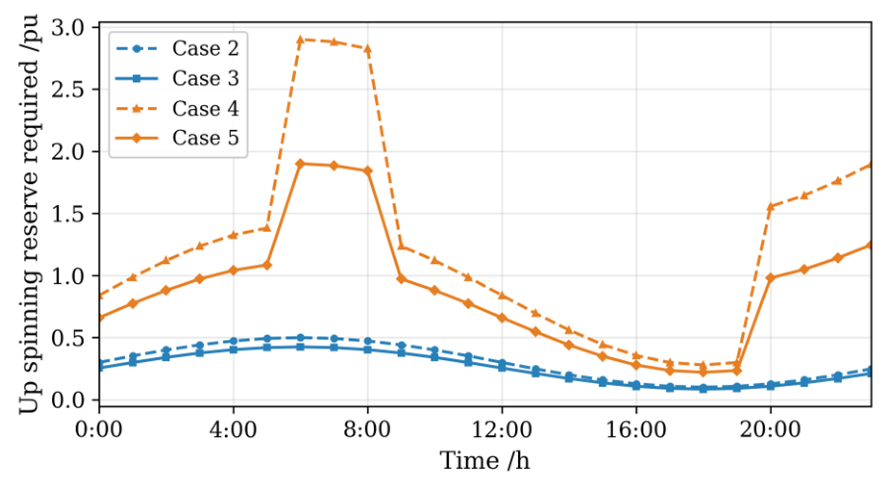
The upward spinning reserve requirements under four representative cases are compared in Figure 8. A clear contrast is observed between Case 2 and Case 4. When grid-side faults are included, two prominent peaks are exhibited in the reserve requirement. The first peak of approximately 2.9 pu occurs during 06:00–08:00 (the period of maximum typhoon intensity). The second peak of approximately 1.8 pu occurs during 20:00–24:00 (the typhoon attenuation and recovery phase). The peak reserve demand in Case 4 is approximately three times that of Case 2. With the deployment of energy storage (Case 3 and Case 5), the peak reserve requirements are substantially reduced. During the 06:00–08:00 period, the peak demand is reduced from 2.9 pu in Case 4 to approximately 1.9 pu in Case 5 (a 34.5% reduction). The fast-ramping burden is partially absorbed by the storage stations, thereby alleviating the reserve pressure on conventional generators.
Figure 8.
Upward spinning reserve requirements under different cases. Source: authors’ own elaboration.
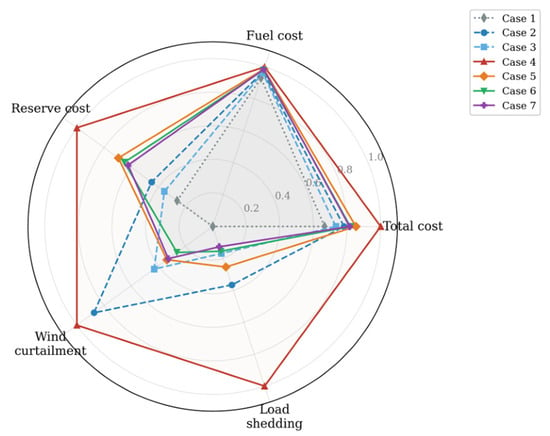
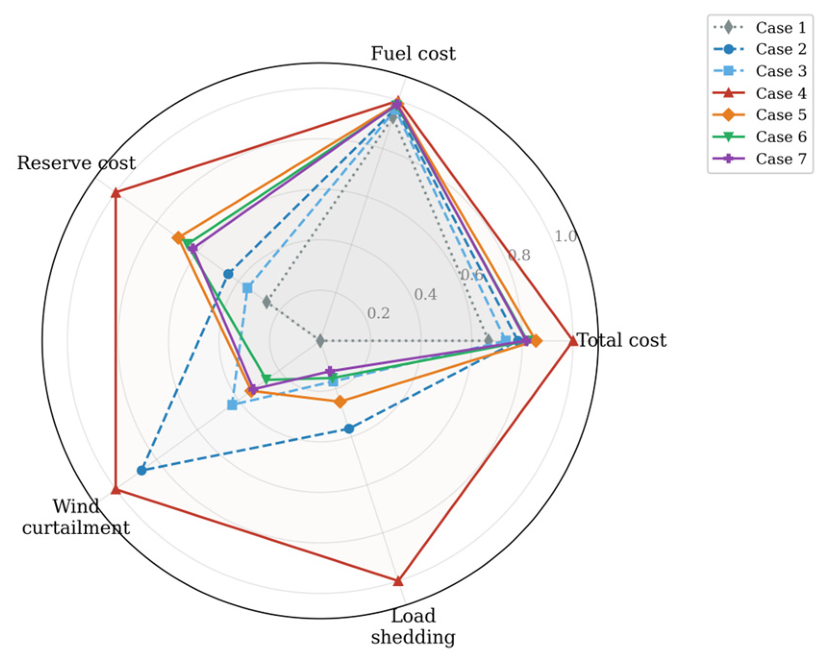
To provide a comprehensive multi-dimensional comparison, the normalized performance indicators of the seven cases are presented as a radar chart in Figure 9. All indicators are normalized against Case 4 (the worst-performing case). Case 1 (no typhoon) exhibits the smallest area, reflecting the best overall performance under normal conditions. Case 4 reaches the outer boundary on all five dimensions, confirming that source–grid-coupled faults without storage represent the worst scenario. Cases 5 and 6 show significantly contracted areas compared with Case 4, with the most notable reductions observed in the load shedding and wind curtailment dimensions. It is also observed that cases 5 and 6 nearly overlap, further confirming the diminishing marginal benefit of additional storage capacity. The fuel cost dimension remains relatively stable across all cases, indicating that the primary cost driver under typhoon scenarios is reserve allocation rather than fuel consumption.
Figure 9.
Radar chart of normalized performance indicators under different cases. Source: authors’ own elaboration.
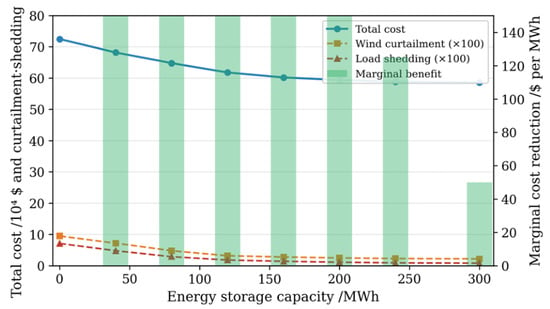
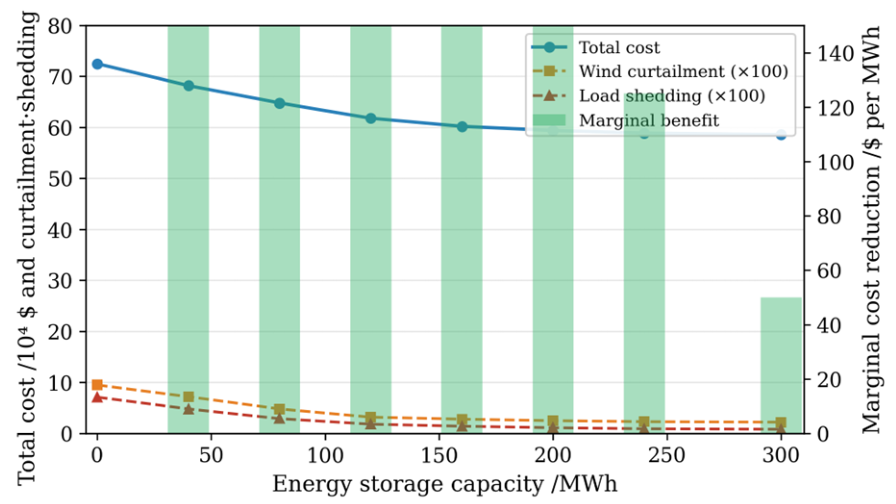
To further investigate the relationship between storage capacity and system performance, a sensitivity analysis was conducted by varying the storage capacity from 0 to 300 MWh. The results are presented in Figure 10. The total cost, wind curtailment, and load shedding all decrease monotonically with increasing storage capacity. However, the rate of decrease slows significantly beyond 120 MWh. The marginal cost reduction (shown as green bars on the right axis) drops from 107.5 $/MWh at 40 MWh to 85.0 $/MWh at 120 MWh, and further to 30.0 $/MWh at 200 MWh. Beyond 240 MWh, the marginal benefit falls below 20 $/MWh, and both curtailment and shedding approach asymptotic lower bounds (approximately 0.022 pu and 0.008 pu, respectively). These residual values cannot be eliminated by storage alone, as they are constrained by network topology and generator ramping limits. Based on this analysis, a storage capacity of 120–160 MWh is identified as the economically favorable range for the test system.
Figure 10.
Sensitivity analysis of energy storage capacity on total cost, wind curtailment, load shedding, and marginal cost reduction. Source: authors’ own elaboration.
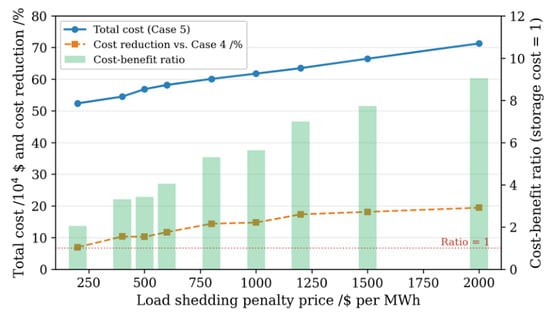
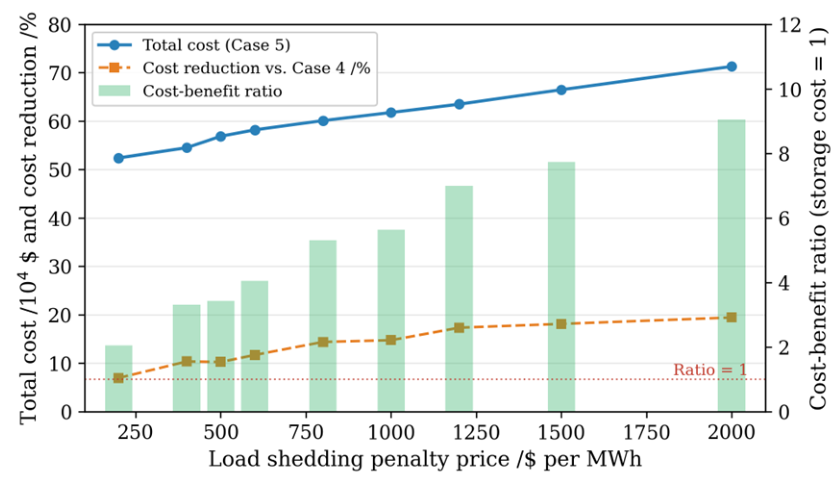
Since the energy storage benefits depend on the assumed load shedding penalty price, a sensitivity analysis is conducted by varying this parameter from 200 $/MWh to 2000 $/MWh. The results are summarized in Table 7.
Table 7.
Sensitivity analysis of load shedding penalty price.
When the penalty price is below 400 $/MWh, the cost–benefit ratio drops below 1:1, indicating that the economic advantage of storage becomes marginal. When the penalty price exceeds 1500 $/MWh, the cost reduction exceeds 18%, and the cost–benefit ratio reaches 1:4.2. Across the entire range (200–2000 $/MWh), the proposed strategy consistently outperforms the case without storage. The core conclusion regarding the favorable cost-effectiveness of energy storage is thus confirmed to be robust.
The relationship between the penalty price and system performance is further illustrated in Figure 11. As the penalty price increases, the total cost rises monotonically due to the higher economic weight assigned to each unit of load shedding. The cost reduction ratio, relative to Case 4, also increases, reflecting the growing advantage of the proposed strategy when load loss is more severely penalized. The cost–benefit ratio (green bars) exceeds 1:1 when the penalty price is above approximately 400 $/MWh and reaches 1:9 at 2000 $/MWh.
Figure 11.
Sensitivity analysis of load shedding penalty price on total cost, cost reduction, and cost–benefit ratio. Source: authors’ own elaboration.
To assess the computational scalability of the proposed method, the solution time is recorded for systems of different sizes. In addition to the 24-bus test system, a modified IEEE 118-bus system with six offshore wind farms and a peak load of 8500 MW is tested. The results are presented in Table 8.
Table 8.
Computational performance on systems of different scales.
The solution time increases by a factor of approximately 5 when the system scale expands from 24 buses to 118 buses. The Benders decomposition algorithm converges within 8 iterations for the 24-bus system and 14 iterations for the 118-bus system. The sub-linear growth in iteration count indicates that the decomposition structure is well-suited for medium-scale problems. For large-scale systems with thousands of buses, further acceleration techniques, such as parallel computing or scenario reduction, may be required.
5.4. Effect of Energy Storage on Wind Power Accommodation
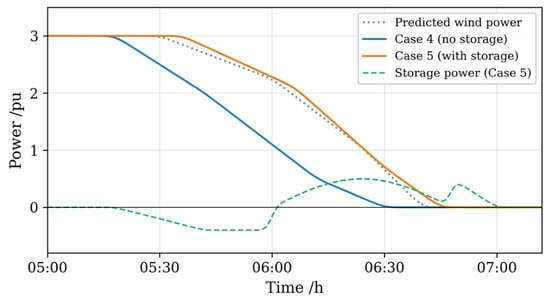
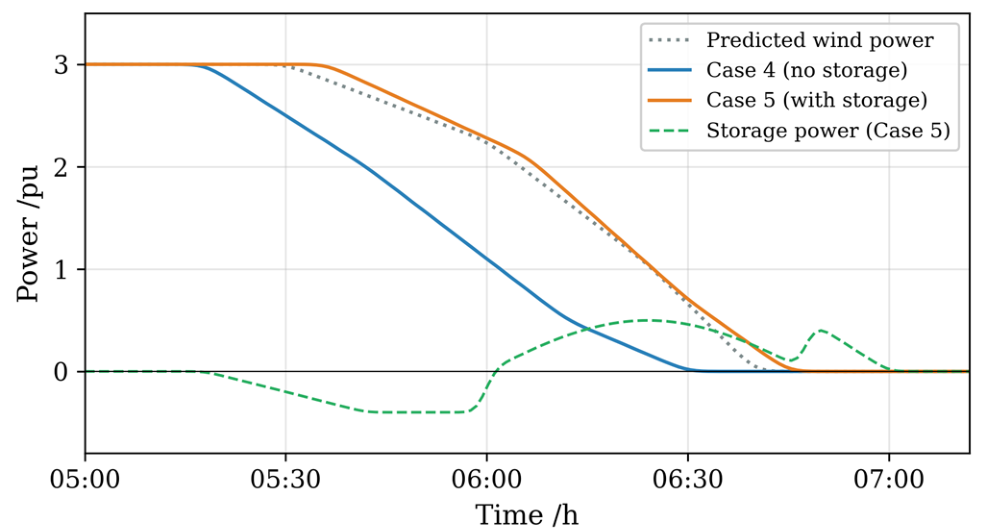
The shutdown process of wind farm A between 05:00 and 07:00 is used as a representative example to examine the role of energy storage during high-wind shutdown events. The results are shown in Figure 12.
Figure 12.
Effect of energy storage on wind power accommodation during high-wind shutdown events. Source: authors’ own elaboration.
In Case 4 (without storage), wind turbines begin to shut down in batches at approximately 05:20. No fast power compensation resource is available. The wind power output drops from 3.0 pu to 0 within approximately 70 min (05:20–06:30), resulting in an average decline rate of approximately 2.57 pu/h. The 10 min ramping capability of conventional generators is insufficient to fully track this rapid decline. A power gap of approximately 0.5 pu is observed during 06:00–06:30, leading to load shedding. In addition, the wind power output is curtailed in advance, starting from 05:00, to satisfy the power variation rate limits. An additional curtailment of approximately 0.4 pu is incurred before the actual shutdown.
In Case 5 (with storage), the energy storage station begins pre-charging at approximately 05:30 with a charging power of approximately 0.4 pu. When the turbines start to shut down at around 06:00, the storage station rapidly switches to the discharging mode. The peak discharging power reaches approximately 0.5 pu between 06:00 and 06:45. With the power buffering provided by the storage, the decline process of the combined wind-storage output is notably more gradual. The output drops from 3.0 pu to 0 over approximately 90 min (05:30–07:00), corresponding to an average decline rate of approximately 2.0 pu/h. Compared with Case 4, the decline rate is reduced by 22.2%. The shutdown completion time is also delayed from 06:30 to approximately 06:50. The power gap during 06:00–06:30 is reduced from 0.5 pu to nearly zero, and load shedding is essentially eliminated during this sub-period. The advance curtailment is reduced from 0.4 pu to approximately 0.1 pu (a 75% reduction).
These results confirm that energy storage plays a critical power buffering role during high-wind shutdown events. Through the “charge-then-discharge” coordination strategy, the decline rate of wind power is reduced by 22.2%, and the power gap is nearly eliminated. The demand for system reserve capacity is effectively alleviated.
5.5. System Resilience and Two-Level Resource Complementarity Analysis
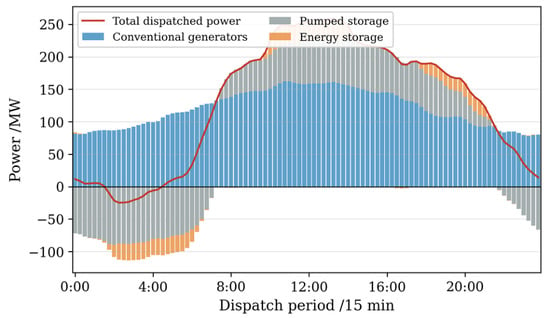
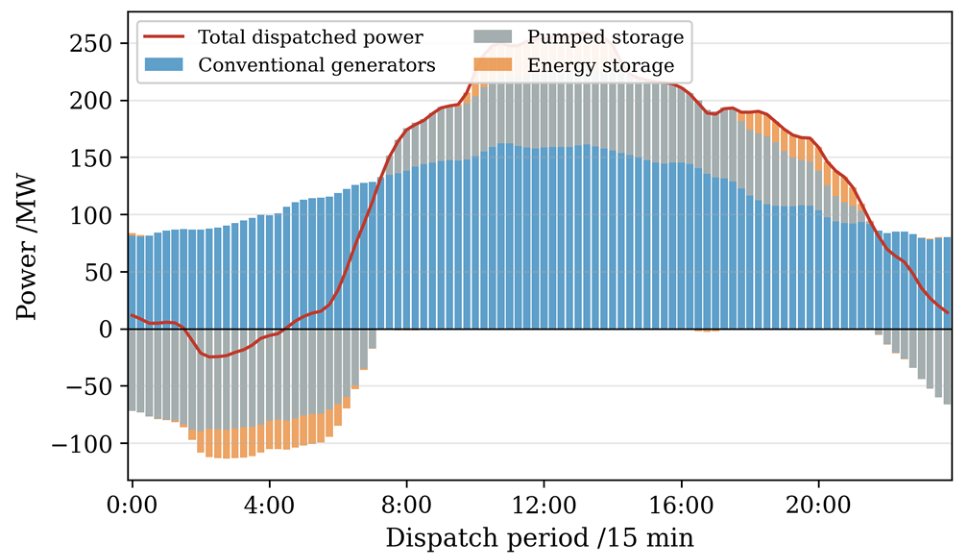
The two-stage dispatch results of Case 5 are illustrated in Figure 13, where the contributions of different resources are displayed as a bidirectional bar chart.
Figure 13.
Two-stage dispatch results showing the contribution of conventional generators, pumped storage, and energy storage. Source: authors’ own elaboration.
During the nighttime low-load period (0:00–06:00), conventional generators are operated at low output levels with an average output of approximately 85 MW. The pumped storage units are in pumping mode with an average pumping power of approximately 80 MW. A total of approximately 480 MWh of energy is accumulated during this period. The energy storage stations are also in the charging state with an average charging power of approximately 20 MW, accumulating approximately 100 MWh. The total dispatched power remains relatively low (approximately 10–100 MW) during this period. The system load is primarily met by the wind farm’s fleet output.
During the daytime high-load period (08:00–20:00), multi-level resources are coordinated to provide power supply. The pumped storage units switch to the generation mode at 08:00 with an average generation power of approximately 60 MW. The energy stored during the nighttime is released. Two concentrated discharging periods of the energy storage stations are observed. The first discharging period occurs during 10:00–14:00 (the peak shutdown period of wind farms A and C). An average discharging power of approximately 25 MW is maintained for 4 h, releasing approximately 100 MWh. The second discharging period occurs during 18:00–21:00 (the evening peak) with an average discharging power of approximately 15 MW. The output of conventional generators is ramped up in response to increasing load, reaching a peak of approximately 160 MW at around 12:00. The total dispatched power peaks at approximately 210 MW between 10:00 and 13:00, which coincides with the lowest total wind fleet output shown in Figure 6.
The complementarity of multi-level resources across different timescales is clearly demonstrated. At the day-ahead timescale, unit commitment and pumped storage scheduling provide system-level energy balance. The “pump-at-night, generate-by-day” pattern of pumped storage transfers approximately 480 MWh of off-peak energy to the peak period. At the real-time timescale, the fast response capability of battery storage (with a charge–discharge switching time of less than 1 min) compensates for the short-term power deficit caused by rapid wind power decline. Through the coordination of these two types of resources, the power gap during the most critical period (12:00–14:30) is reduced from approximately 350 MW in Case 4 to approximately 50 MW in Case 5, representing an 85.7% reduction.
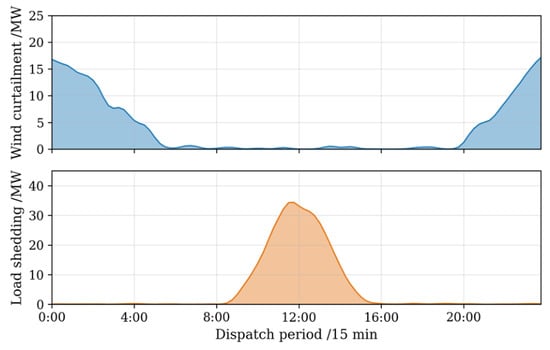
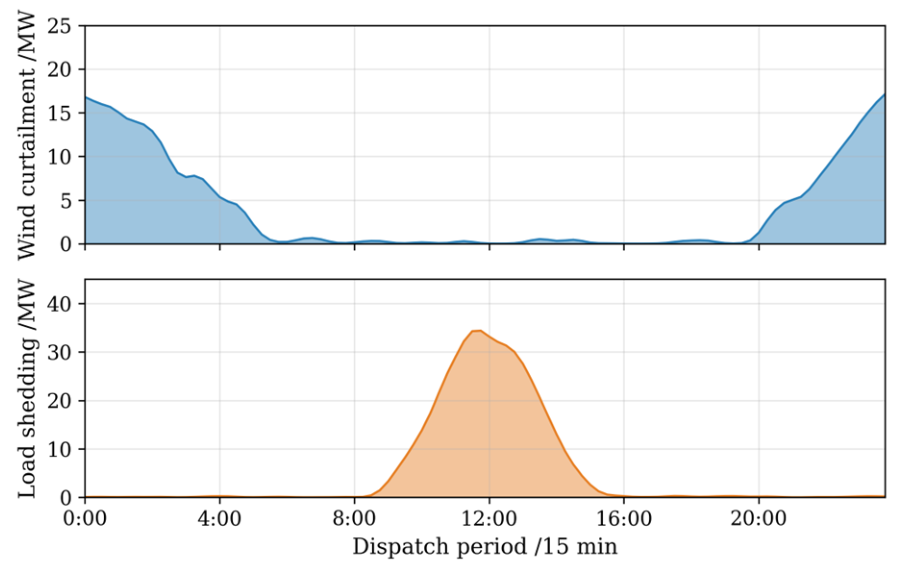
The wind curtailment and load shedding power profiles under Case 5 are shown in Figure 14. Wind curtailment is concentrated in two periods: 0:00–05:00 (maximum approximately 17 MW) and 20:00–24:00 (maximum approximately 15 MW). These two periods correspond to the nighttime low-load period with excessive wind power and the evening period when wind farms return to rated output while the load begins to decline, respectively. The total wind curtailment is 0.032 pu, which is substantially lower than the 0.095 pu observed in Case 4. Load shedding exhibits a single-peak distribution concentrated between 10:00 and 15:00. The peak value of approximately 35 MW occurs at around 12:00, coinciding with the simultaneous shutdown of wind farms A and C. After the wind farms gradually recover (beyond 15:00), load shedding decreases rapidly to zero. The total load shedding is 0.018 pu, which is only 25.4% of that in Case 4 (0.071 pu).
Figure 14.
Wind curtailment and load shedding power profiles under the proposed dispatch strategy (Case 5). Source: authors’ own elaboration.
The detailed cost breakdown of Case 5, as presented in Table 9, provides further insight into the economic performance of the proposed strategy. The fuel cost accounts for 72.2% of the total cost and remains the dominant cost component. However, it increases by only 5.9% compared with the normal operation case (42.1 × 10⁴ $ in Case 1), indicating that the fuel cost increase under typhoon scenarios is limited. The spinning reserve cost accounts for 14.1%, which is significantly higher than the 6.6% observed under normal conditions. This increase reflects the additional reserve investment required to cope with extreme events. The combined operation cost of energy storage and pumped storage is 1.9 × 10⁴ $, accounting for only 3.1% of the total cost. Wind curtailment is reduced by 66.3%, and load shedding is reduced by 74.6% compared with Case 4. If the economic loss of load shedding is evaluated at 1000 $/MWh, the avoided loss due to reduced load shedding in Case 5 compared with Case 4 amounts to approximately 5.3 × 10⁴ $. This is substantially higher than the storage operation cost of 1.9 × 10⁴ $, yielding a cost–benefit ratio of approximately 1:2.8. In Case 7, the DR compensation cost of 2.3 × 10⁴ $ further contributes to load shedding reduction. The combined cost of storage and demand response resources accounts for 6.9% of the total cost in Case 7, yet involuntary load shedding is reduced by 87.3% compared with Case 4 (from 0.071 pu to 0.009 pu).
Table 9.
Detailed cost breakdown of Case 5.
6. Conclusions
A multi-level source-grid-load-storage preventive resilience dispatch strategy was proposed to address the source–grid-coupled fault risks in power systems with multiple offshore wind farms under typhoon scenarios. The strategy was validated through case studies on a modified IEEE-RTS 24-bus system. The main conclusions are drawn as follows.
- Significant spatiotemporal heterogeneity was observed in the typhoon impact on multiple offshore wind farms. The shutdown periods of different wind farms were found to be staggered in time due to their distinct geographical locations. A typical double-peak shutdown pattern was identified for wind farms located along the eyewall path. The total fleet output was reduced by up to 59% when multiple wind farms were shut down simultaneously. This period was identified as the most critical window for system power deficit.
- The threat posed by source–grid-coupled faults was found to be substantially greater than that of source-side faults alone. A 17.4% increase in total cost was incurred when only source-side faults were considered. An additional 27.9% cost increase was observed when grid-side faults were further included. Load shedding was found to rise sharply from 0.026 pu to 0.071 pu. It is therefore concluded that the coupled fault effects of wind turbines and transmission lines must be considered simultaneously in resilience-oriented dispatch.
- System resilience was significantly enhanced by the introduction of wind–storage coordination and pumped storage scheduling. Compared with the case without energy storage, wind curtailment was reduced by 66.3%, load shedding was reduced by 74.6%, and the total cost was reduced by 14.8%. A critical power buffering role was played by energy storage during high-wind shutdown events. The rapid decline in wind power output was effectively smoothed by the “charge-then-discharge” coordination strategy. The dependence on spinning reserve from conventional generators was also alleviated. The introduction of demand response (10% participation) further reduced load shedding by 50.0% compared with the storage-only case, with a DR compensation cost of only 2.3 × 10⁴ $.
- An economically optimal point was shown to exist for energy storage capacity configuration. Wind curtailment and load shedding were further reduced by 21.9% and 38.9%, respectively, when the storage capacity was increased from 120 MWh to 200 MWh. However, the marginal benefit was found to diminish noticeably. The total cost was decreased by only an additional 3.9%.
- Significant complementarity among multi-level resources was demonstrated across different timescales. System-level energy balance was provided by unit commitment and pumped storage scheduling at the day-ahead timescale. Short-term power deficits caused by wind power fluctuations were compensated by the fast response capability of battery storage at the real-time sub-hourly timescale. The combined operation cost of energy storage, pumped storage, and demand response accounted for only 6.9% of the total cost in Case 7. Yet, substantial reductions in both wind curtailment and load shedding were achieved. The favorable cost-effectiveness of storage resources for resilience enhancement was thus confirmed.
Several limitations of this study should be noted. First, although a multi-scenario uncertainty set was constructed through the entropy-based method, the probabilistic nature of typhoon trajectories was not explicitly modeled. Stochastic typhoon track models could be incorporated to generate scenario sets with associated probabilities. Second, a simplified demand response model was included as voluntary load curtailment with a fixed participation ratio. More sophisticated mechanisms, such as price-responsive loads and flexible industrial processes, are expected to further enhance system flexibility. Third, short-term wind power forecast errors were modeled through a box uncertainty set with a ±15% relative error bound. More refined characterizations, such as data-driven distributional ambiguity sets, could improve the trade-off between conservatism and solution quality. Fourth, the rain-induced effects on wind turbine performance and transmission line reliability were modeled through simplified correction factors. Physics-based-coupled wind–rain failure models could further improve the accuracy of the fault probability assessment. Fifth, the energy storage capacity was preset in this study. Joint optimization of storage siting, sizing, and operational scheduling could achieve a more comprehensive trade-off between resilience enhancement and investment cost. Sixth, the proposed strategy was validated on the IEEE-RTS 24-bus and IEEE 118-bus systems. Although computational scalability to medium-scale systems has been demonstrated, testing on real-world coastal power grids is needed to further verify practical applicability.
The findings of this study provide practical guidance for the sustainable operation and planning of power systems with high offshore wind penetration in typhoon-prone regions.
Author Contributions
Conceptualization, Q.C. and J.G.; Methodology, Q.C. and J.G.; Software, J.G.; Validation, J.G. and X.S.; Formal analysis, J.G.; Investigation, J.G. and X.S.; Resources, Q.C. and F.L.; Data curation, J.G.; Writing—original draft preparation, J.G.; Writing—review and editing, Q.C. and X.S.; Visualization, J.G.; Supervision, Q.C.; Project administration, X.S.; Funding acquisition, X.S. All authors have read and agreed to the published version of the manuscript.
Funding
This research was funded by “the National Key Research and Development Program of China (2023YFB2406900)”.
Institutional Review Board Statement
Not applicable.
Informed Consent Statement
Not applicable.
Data Availability Statement
The data presented in this study are available on request from the corresponding author. The data are not publicly available due to confidentiality requirements of the funding project.
Conflicts of Interest
The authors declare no conflicts of interest. The funders had no role in the design of the study; in the collection, analyses, or interpretation of data; in the writing of the manuscript; or in the decision to publish the results.
References
- Ma, X.M.; Li, M.X.; Li, W.Q.; Liu, Y.Q. Overview of Offshore Wind Power Technologies. Sustainability 2025, 17, 596. [Google Scholar] [CrossRef] [Scilit]
- Kasimalla, S.R.; Park, K.; Zaboli, A.; Hong, Y.; Choi, S.L.; Hong, J. An Evaluation of Sustainable Power System Resilience in the Face of Severe Weather Conditions and Climate Changes: A Comprehensive Review of Current Advances. Sustainability 2024, 16, 3047. [Google Scholar] [CrossRef] [Scilit]
- Li, J.W.; Li, Z.N.; Jiang, Y.C.; Tang, Y.G. Typhoon Resistance Analysis of Offshore Wind Turbines: A Review. Atmosphere 2022, 13, 451. [Google Scholar] [CrossRef] [Scilit]
- Mattu, K.L.; Bloomfield, H.C.; Thomas, S.; Martínez-Alvarado, O.; Rodríguez-Hernández, O. The Impact of Tropical Cyclones on Potential Offshore Wind Farms. Energy Sustain. Dev. 2022, 68, 29–39. [Google Scholar] [CrossRef] [Scilit]
- Qin, M.F.; Shi, W.; Chai, W.; Fu, X.; Li, L.; Li, X. Extreme Structural Response Prediction and Fatigue Damage Evaluation for Large-Scale Monopile Offshore Wind Turbines Subject to Typhoon Conditions. Renew. Energy 2023, 208, 450–464. [Google Scholar] [CrossRef] [Scilit]
- Wang, H.; Lv, Z.T.; Ren, L.; Ke, S.T.; Wang, L.; Wang, T.G. Spatiotemporal Typhoon Impacts on Wind Speed Field of Offshore Wind Farms in the Worst Scenario of Chinese Waters. Phys. Fluids 2024, 36, 067117. [Google Scholar] [CrossRef] [Scilit]
- Wang, H.; Ke, S.T.; Wang, T.G.; Kareem, A.; Hu, L.; Ge, Y.J. Multi-Stage Typhoon-Induced Wind Effects on Offshore Wind Turbines Using a Data-Driven Wind Speed Field Model. Renew. Energy 2022, 188, 765–777. [Google Scholar] [CrossRef] [Scilit]
- Huang, X.B.; Wang, N.Y. An Adaptive Nested Dynamic Downscaling Strategy of Wind-Field for Real-Time Risk Forecast of Power Transmission Systems during Tropical Cyclones. Reliab. Eng. Syst. Saf. 2024, 242, 109731. [Google Scholar] [CrossRef] [Scilit]
- Wang, S.Y.; Foley, A.M.; Chen, N.; Chen, B. Risk-Based Dispatch Strategy for a Power System with High Wind Power Integration Considering Damage Due to Typhoons. Electr. Power Compon. Syst. 2023, 51, 2098–2115. [Google Scholar] [CrossRef] [Scilit]
- Yu, G.Z.; Lu, L.; Tang, B.; Wang, S.Y.; Chung, C.Y. Ultra-Short-Term Wind Power Subsection Forecasting Method Based on Extreme Weather. IEEE Trans. Power Syst. 2023, 38, 5045–5056. [Google Scholar] [CrossRef] [Scilit]
- Chen, Y.S.; Wu, D.; Yu, Y.G.; Gao, W. Do Cyclone Impacts Really Matter for the Long-Term Performance of an Offshore Wind Turbine? Renew. Energy 2021, 178, 184–201. [Google Scholar] [CrossRef] [Scilit]
- Ning, J.; Shi, R.F.; Xuan, S.D.; Jiang, C.Y.; Jia, L.M. Assessment of Offshore Island Wind Energy Potential in Typhoon-Prone Regions with a KDE-Based Probabilistic Modeling Approach. Energy 2025, 339, 139092. [Google Scholar] [CrossRef] [Scilit]
- Wen, Z.G.; Wang, F.M.; Wan, J.; Wang, Y.Z.; Yang, F.; Guo, C.C. Assessment of the Tropical Cyclone-Induced Risk on Offshore Wind Turbines under Climate Change. Nat. Hazards 2024, 120, 5811–5839. [Google Scholar] [CrossRef] [Scilit]
- Wang, H.; Wang, T.G.; Ke, S.T.; Hu, L.; Xie, J.J.; Cai, X.; Cao, J.F.; Ren, Y.X. Assessing Code-Based Design Wind Loads for Offshore Wind Turbines in China against Typhoons. Renew. Energy 2023, 212, 669–682. [Google Scholar] [CrossRef] [Scilit]
- Liang, Y.T.; Lin, S.J.; Feng, X.Y.; Liu, M.B.; Su, L.; Zhang, B.R. Optimal Resilience Enhancement Dispatch of a Power System with Multiple Offshore Wind Farms Considering Uncertain Typhoon Parameters. Int. J. Electr. Power Energy Syst. 2023, 153, 109337. [Google Scholar] [CrossRef] [Scilit]
- Liu, Y.Q.; Liu, D.D.; Zhang, H.C. Stochastic Unit Commitment with High-Penetration Offshore Wind Power Generation in Typhoon Scenarios. J. Mod. Power Syst. Clean Energy 2024, 12, 535–546. [Google Scholar] [CrossRef] [Scilit]
- Liu, Y.Q.; Xie, D.J.; Zhang, H.C. Frequency-Constrained Unit Commitment Considering Typhoon-Induced Wind Farm Cutoff and Grid Islanding Events. J. Mod. Power Syst. Clean Energy 2024, 12, 1760–1772. [Google Scholar] [CrossRef] [Scilit]
- He, J.H.; Hu, Z.C.; Liu, Y.; Bao, Z.Y.; Zhu, Y. Dispatch Strategy for the Power System with Large Offshore Wind Power Integration Under a Typhoon: A Two-Stage Sample Robust Optimization Approach. IEEE Trans. Ind. Appl. 2025, 61, 4636–4648. [Google Scholar] [CrossRef] [Scilit]
- Zhang, H.; Zhang, S.X.; Cheng, H.Z.; Li, Z.; Gu, Q.F.; Tian, X.Q. Boosting the Power Grid Resilience under Typhoon Disasters by Coordinated Scheduling of Wind Energy and Conventional Generators. Renew. Energy 2022, 200, 303–319. [Google Scholar] [CrossRef] [Scilit]
- Hu, B.H.; Ye, C.J.; Tan, Z.K. Two-Stage Stochastic Scheduling of Diverse Flexible Resources for Enhancing Resilience of High Wind-Penetrated Power Systems. Int. J. Electr. Power Energy Syst. 2025, 169, 110750. [Google Scholar] [CrossRef] [Scilit]
- Cao, Z.H.; Li, Z.S. Tri-Layer Distributed Scheduling for Coastal Integrated Transmission-Distribution-Gas System with Uncertain Typhoons-Affected Offshore Wind Power. IEEE Trans. Sustain. Energy 2026, 17, 277–294. [Google Scholar] [CrossRef] [Scilit]
- Ren, B.X.; Jia, Y.Y.; Li, Q.; Wang, D.J.; Tang, W.J.; Zhang, S. Robust Wind Power Ramp Control Strategy Considering Wind Power Uncertainty. Electronics 2024, 13, 211. [Google Scholar] [CrossRef] [Scilit]
- Qian, M.H.; Chen, N.; Chen, Y.G.; Chen, C.M.; Qiu, W.Q.; Zhao, D.W.; Lin, Z.Z. Optimal Coordinated Dispatching Strategy of Multi-Sources Power System with Wind, Hydro and Thermal Power Based on CVaR in Typhoon Environment. Energies 2021, 14, 3735. [Google Scholar] [CrossRef] [Scilit]
- Jia, Y.Y.; Ren, B.X.; Li, Q.; Wang, C.G.; Wang, D.J.; Zou, X.M. An Integrated Scheme for Forecasting and Controlling Ramps in Offshore Wind Farms Considering Wind Power Uncertainties during Extreme Storms. Electronics 2023, 12, 4443. [Google Scholar] [CrossRef] [Scilit]
- Li, J.W.; Bian, J.Y.; Ma, Y.X.; Jiang, Y.C.; Tang, Y.G. Impact of Typhoons on Floating Offshore Wind Turbines: A Case Study of Typhoon Mangkhut. J. Mar. Sci. Eng. 2021, 9, 543. [Google Scholar] [CrossRef] [Scilit]
- Kresning, B.; Hashemi, M.R.; Shirvani, A.; Lewis, M.; Neill, S. Uncertainty of Extreme Wind and Wave Loads for Marine Renewable Energy Farms in Hurricane-Prone Regions. Renew. Energy 2024, 220, 119570. [Google Scholar] [CrossRef] [Scilit]
- Wang, Y.; Yang, Q.S.; Li, T.; He, Y.C. Feasibility of Typhoon Models and Wind Power Spectra on Response Analysis of Parked Wind Turbines. J. Wind Eng. Ind. Aerodyn. 2023, 242, 105579. [Google Scholar] [CrossRef] [Scilit]
- Xiong, J.; Yu, F.J.; Fu, C.F.; Chen, G.S. Evaluation and Improvement of the ERA5 Wind Field in Typhoon Storm Surge Simulations. Appl. Ocean Res. 2022, 118, 103000. [Google Scholar] [CrossRef] [Scilit]
- Mujjuni, F.; Betts, T.R.; Blanchard, R.E. Evaluation of Power Systems Resilience to Extreme Weather Events: A Review of Methods and Assumptions. IEEE Access 2023, 11, 87279–87296. [Google Scholar] [CrossRef] [Scilit]
- Lee, S.M.; Chinthavali, S.; Bhusal, N.; Stenvig, N.; Tabassum, A.; Kuruganti, T. Quantifying the Power System Resilience of the US Power Grid Through Weather and Power Outage Data Mapping. IEEE Access 2024, 12, 5237–5255. [Google Scholar] [CrossRef] [Scilit]
- Hossain, E.; Roy, S.; Mohammad, N.; Nawar, N.; Dipta, D.R. Metrics and Enhancement Strategies for Grid Resilience and Reliability during Natural Disasters. Appl. Energy 2021, 290, 116709. [Google Scholar] [CrossRef] [Scilit]
- Grigg, C.; Wong, P.; Albrecht, P.; Allan, R.; Bhavaraju, M.; Billinton, R.; Chen, Q.; Fong, C.; Haddad, S.; Kuruganty, S.; et al. The IEEE Reliability Test System-1996. A Report Prepared by the Reliability Test System Task Force of the Application of Probability Methods Subcommittee. IEEE Trans. Power Syst. 1999, 14, 1010–1020. [Google Scholar] [CrossRef] [Scilit]
- GAMS Development Corporation. General Algebraic Modeling System (GAMS). Available online: https://www.gams.com (accessed on 1 March 2026).

Disclaimer/Publisher’s Note: The statements, opinions and data contained in all publications are solely those of the individual author(s) and contributor(s) and not of MDPI and/or the editor(s). MDPI and/or the editor(s) disclaim responsibility for any injury to people or property resulting from any ideas, methods, instructions or products referred to in the content. |
© 2026 by the authors. Licensee MDPI, Basel, Switzerland. This article is an open access article distributed under the terms and conditions of the Creative Commons Attribution (CC BY) license.