


Abstract
At present, most plateau-constrained cities worldwide—plateau cities whose spatial form is strictly constrained by topography—have entered the late stage of urbanization. The relationship between urban form and the surrounding geographic spatial pattern has consequently exhibited distinctive new characteristics. However, planning and policy often continue to adopt green-space allocation schemes developed in the mid-stage of urbanization and based on the experience of plain cities, resulting in difficulties in plan implementation, intensified human–land conflicts, and imbalances in both the supply–demand relationship and equity of green public services with severe challenges to urban sustainable development, calling for urgent correction and reconstruction. Through a literature review and comparative case analysis, this study clarifies global trends in the paradigm shift in plateau-city planning and develops an evaluation system comprising “adaptability analysis of originally planned spaces within the built-up area + assessment of the potential for converting ecological value in green spaces outside the built-up area + integrated spatial optimization.” Building on Analytic Hierarchy Process (AHP) weighting and spatial analysis, the study establishes a comprehensive assessment framework and applies it empirically to Kunming as a typical case, with the aim of proposing a correction-and-reconstruction paradigm for green-space allocation tailored to plateau-constrained cities to achieve sustainable development goals. The results indicate a widespread paradigm shift in many cities from “pattern optimization during incremental expansion” and “passive adaptation to ecological patterns” toward “enhancing governance effectiveness during stock-based renewal” and “proactive innovation in governance instruments.” The Kunming case shows that, during the mid-stage of urbanization, numerous parks and green spaces were planned within the built-up area (flat land), yet many of these proposals proved infeasible due to excessive costs and trade-offs. Meanwhile, the adjacent mountainous ecological spaces with substantial scenic and recreational potential were long excluded from the urban public service system. In response, this study proposes a three-dimensional allocation model that combines “optimized adaptation” within the built-up area and “potential conversion” in adjacent peri-urban areas together with differentiated policy instruments and an implementation/transfer assurance mechanism. This approach not only offers practical planning guidance for Kunming but also provides a broadly applicable set of theoretical and practical tools for improving land-use efficiency and promoting green equity in similar cities worldwide.
1. Introduction
In this paper, “plateau-constrained cities” refer to cities located in plateau or mountainous regions where flat land is scarce and valuable, and where urban spatial form is tightly constrained by complex topography such as mountains and valleys. They constitute an important urban type worldwide. As global urbanization enters a late stage characterized by stock-based optimization, plateau-constrained cities are facing an unprecedented crisis in spatial governance. Unlike plain cities with extensive resource hinterlands, these cities are constrained by exceptionally harsh terrain conditions, creating an inherent and acute tension between scarce flat-land resources and the continuously growing demand for high-intensity development (Goddard, 2018) [1]. In this context, urban green space is not only a foundation for ecological resilience and inclusive public amenities, but also a central arena where human–land tensions are manifested. Such spatial constraints and environmental complexity mean that the success or failure of green-space allocation directly affects urban sustainability and social equity.
During the mid-stage of urbanization (urbanization rate 30–70%), plateau-constrained cities such as Kunming (Yunnan–Guizhou Plateau, Asia), Denver (Colorado Plateau, North America), Bogotá (Altiplano Plateau, South America), and Bolzano (the Alps, Europe) reshaped their urban spatial patterns through new-town development, old-district renewal, industrial upgrading (i.e., “retreating secondary industry and advancing tertiary industry”), development zones, relocation of transport hubs, and the construction of rail transit and elevated roads. At that time, because city size and urban form were relatively limited, the contradiction between spatial resources and development demand was less pronounced. Influenced by urban ecology and landscape ecology—and by the path dependence of learning from advanced plain-city practices—these cities often adopted relatively idealized gridded or ring–radial green-space structures and land-use ratios. However, in the late stage of urbanization (urbanization rate above 70%), development shifts toward stock-based growth. Because valley-type and basin/intermontane-plain cities constitute the dominant forms of plateau cities, urban areas are often closely intertwined with ecologically sensitive upstream reaches of major rivers, lake–river networks, and wetland systems. As a result, the proportion of strictly protected no-build zones and restricted-development zones is high. Meanwhile, as urban scale and form expand, mountainous barriers constrain outward growth, forcing population and construction to concentrate within limited buildable space. Consequently, scarce flat land must accommodate multiple competing functions, intensifying human–land conflicts and rendering the idealized green-space structures and land-use ratios planned during the mid-stage difficult to implement. At the same time, the mountainous spaces that constrain urban form—despite their substantial scenic, recreational, and socio-cultural value—are often neglected in planning practice. They have long been treated as “ecological barriers and red lines” that limit development, rather than as “ecological resources” that can be actively leveraged. This produces a dual contradiction: “unmet demand within the built-up area” alongside the “failure to convert the ecological value of peri-urban mountains into effective public benefits.”
In the context of stock-based transformation and increasingly intense competition for spatial resources, a central question for plateau-constrained cities is how to correct planning failures—manifested as unimplementable blueprints and inflated green-space targets—caused by the mechanical transplantation of planning experience from plain cities and the neglect of plateau geographic constraints. Accordingly, this study aims to develop an evaluation and allocation framework tailored to complex plateau environments in the late stage of urbanization, one that can both rectify dysfunctional legacy plans and, through spatial reconstruction, enable green-space optimization and a transition in governance.
2. Literature Review
2.1. In Terms of Research Paradigm
Classic theories in landscape ecology—such as McHarg’s pioneering method of vertical ecological suitability analysis (McHarg, 1969) [2] and Forman’s patch–corridor–matrix model (Forman, 1995) [3]—provide a theoretical foundation for understanding the coupling between the built environment and the natural substrate in plateau cities. Subsequently, scholars both in China and internationally have advanced paradigm evolution and practical explorations for plateau-constrained cities in line with these theories. Early studies largely followed a technically rational paradigm of “adapting to terrain,” emphasizing passive responses to topographic constraints through measures such as mountain cutting and valley filling, as well as elevation-based suitability assessments (Zhou & Chen, 2019) [4]. Since 2010, as major plateau-constrained cities worldwide have entered the late stage of urbanization and spatial expansion has reached rigid natural boundaries, scholarly attention has shifted from “pattern optimization during incremental expansion” to “enhancing governance effectiveness during stock-based renewal.” Representative practices (Table 1) illustrate this shift: Denver (USA) has used an institutional instrument—an urban growth boundary (UGB)—to translate natural limits into policy boundaries; Innsbruck (Austria) has adopted multi-municipality coordination to address tensions between seasonal tourism surges and ecological carrying capacity; Bogotά (Colombia) has developed networks of pocket parks to respond to demands for spatial justice; and Bolzano (Italy) has innovated governance tools aligned with terrain constraints. Related research, including studies on counterintuitive general patterns in the Himalayan region of India (Anees et al., 2024) [5] and proactive trade-offs in ecological conservation in Xining, China (Zhou et al., 2024) [6], further indicates that although specific conflicts and response paradigms vary substantially across cities (Table 1), the common trajectory of paradigm evolution is evident: a transition from “passive adaptation to ecological patterns” toward “proactive innovation in governance instruments.”
Table 1.
Comparison of planning paradigms in representative plateau-constrained cities worldwide.
2.2. In Terms of Research Topics and Recent Progress
The literature can be summarized in five major strands: (1) Ecological security patterns and boundary identification. Early studies focused on delineating ecologically sensitive areas and high-risk geological hazard zones around plateau cities; the theory of ecological security patterns and its core methods have become a mainstream paradigm in this field (Yu, 1996) [7]. More recently, research has emphasized more operational approaches to delineating and restoring ecological protection redlines (Xu et al., 2021) [8], providing scientific evidence for reconciling tensions between conservation and development (Liu et al., 2022) [9]. (2) Quantification and interpretation of urban form. Earlier work widely applied quantitative tools such as space syntax and landscape pattern indices to measure urban form (Wu et al., 2023) [10]. In recent years, studies have increasingly examined causal links between urban morphology and urban microclimate (e.g., heat-island effects) as well as residents’ health outcomes (e.g., physical activity) (Lu et al., 2021) [11]. (3) Coupling between transport systems and spatial structure. Early research highlighted the adaptive application of transit-oriented development (TOD) in mountainous cities as a key advance (Curtis et al., 2010) [12], aiming to enhance sustainable accessibility (Harvey, 1973) [13]. More recent studies have explored the complex spatiotemporal interactions between land use around transit stops and passenger demand (Zhao et al., 2022) [14], as well as how TOD can balance high-density development with public-space quality and its implications for housing affordability (Li et al., 2023) [15]. (4) Spatial justice and health equity. Early studies asked whether access to protected ecological mountains and scarce flat-land resources is equitable across social groups (Angelo et al., 2018) [16]. Affluent groups often occupy advantaged locations, whereas low-income groups may be pushed toward peripheral spaces, intensifying socio-spatial differentiation (Cohen-Shacham et al., 2016) [17]. Recent work has focused on social stratification in environmental justice. Empirical evidence shows that residents in low-income communities in plateau cities generally have lower access to high-quality, walkable green spaces (Chen et al., 2022) [18], prompting further discussion on advancing healthy-city agendas (Li et al., 2021) [19]. (5) Resilience planning based on nature-based solutions. Following efforts to integrate green infrastructure (GI) and nature-based solutions (NbS) with mountainous terrain (Allan et al., 2011) [20], recent studies have emphasized systematically embedding these approaches in stormwater management, heatwave mitigation, and biodiversity conservation in plateau cities (Liu et al., 2022) [21], thereby generating resilience and co-benefits (Wang et al., 2023) [22].
Nevertheless, significant gaps remain in the understanding of plateau-constrained cities: (1) A theoretical discontinuity in planning correction. Most existing studies retain an institutional path dependence on “incremental thinking” (Zhang et al., 2022) [23]. Yet plateau-constrained cities worldwide have broadly entered the late-stage, stock-based phase of urbanization, in which spatial expansion has reached rigid natural boundaries. In China, for example, cultivated land and grassland in Xining continue to be encroached upon by construction land (Zhi et al., 2024) [6]; in Lhasa, the spatially positive correlation between ecosystem service value and the intensity of human activities has become significantly decoupled (Zhang et al., 2025; Zhang et al., 2026) [24,25]; and projections suggest that Kunming’s ecosystem resilience index will remain at a low level over the next decade (Kunming Study, 2025) [26]. When additional space is no longer available for incremental allocation, it becomes necessary to systematically diagnose the deep mismatch between mid-stage planning blueprints—implicitly premised on “unlimited spatial supply”—and the late-stage reality of “absolute spatial scarcity,” and to explore theories and implementation pathways for “planning correction.” To date, however, few studies have systematically proposed diagnostic methods or correction frameworks targeting this form of “planning mismatch.” (2) A narrow set of dimensions in effectiveness evaluation. Existing evaluation systems tend to focus on single dimensions (e.g., ecology, urban form, or transport) and lack a comprehensive, quantitative assessment—grounded in the perspective of “spatial governance effectiveness”—that accounts for implementation feasibility, costs and trade-offs, and the conversion potential of cross-boundary resources (e.g., peri-urban mountains). Such limitations may produce—or even exacerbate—existing spatial inequalities (Mahajan et al., 2026; Nieto et al., 2024) [27,28]. Related evidence also indicates that cultural ecosystem services (CES) display pronounced spatial gradients at the community scale (Lhasa CES Study, 2025) [29], and that city centers often face a “triple-low” dilemma—low area, low connectivity, and low quality of green infrastructure (Anees et al., 2023) [5].
In sum, this study directly addresses these gaps by developing a “three-dimensional green-space allocation and planning-correction framework oriented toward spatial governance effectiveness.” Using Kunming as an empirical case, it proposes new pathways for spatial optimization and governance transformation in plateau-constrained cities in the late stage of urbanization.
3. Research Framework and Methods
3.1. Development of the Technical Route
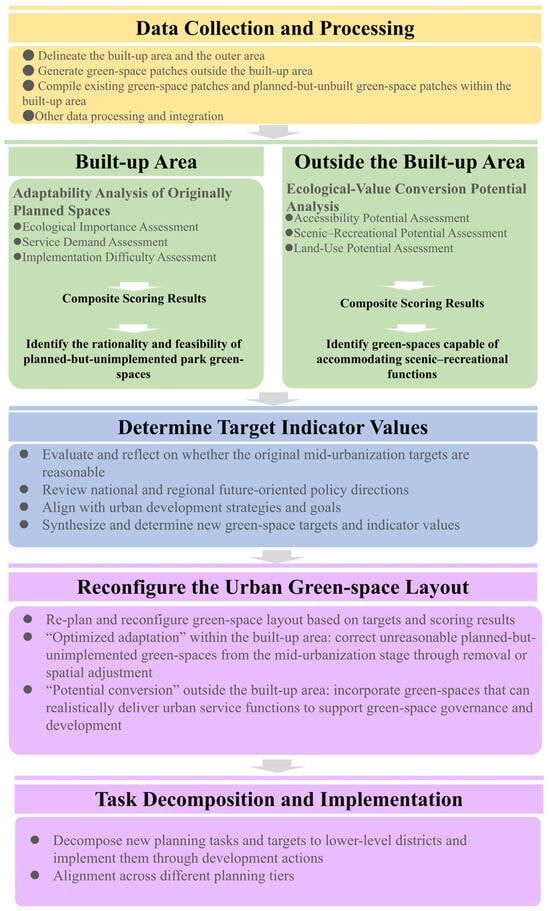
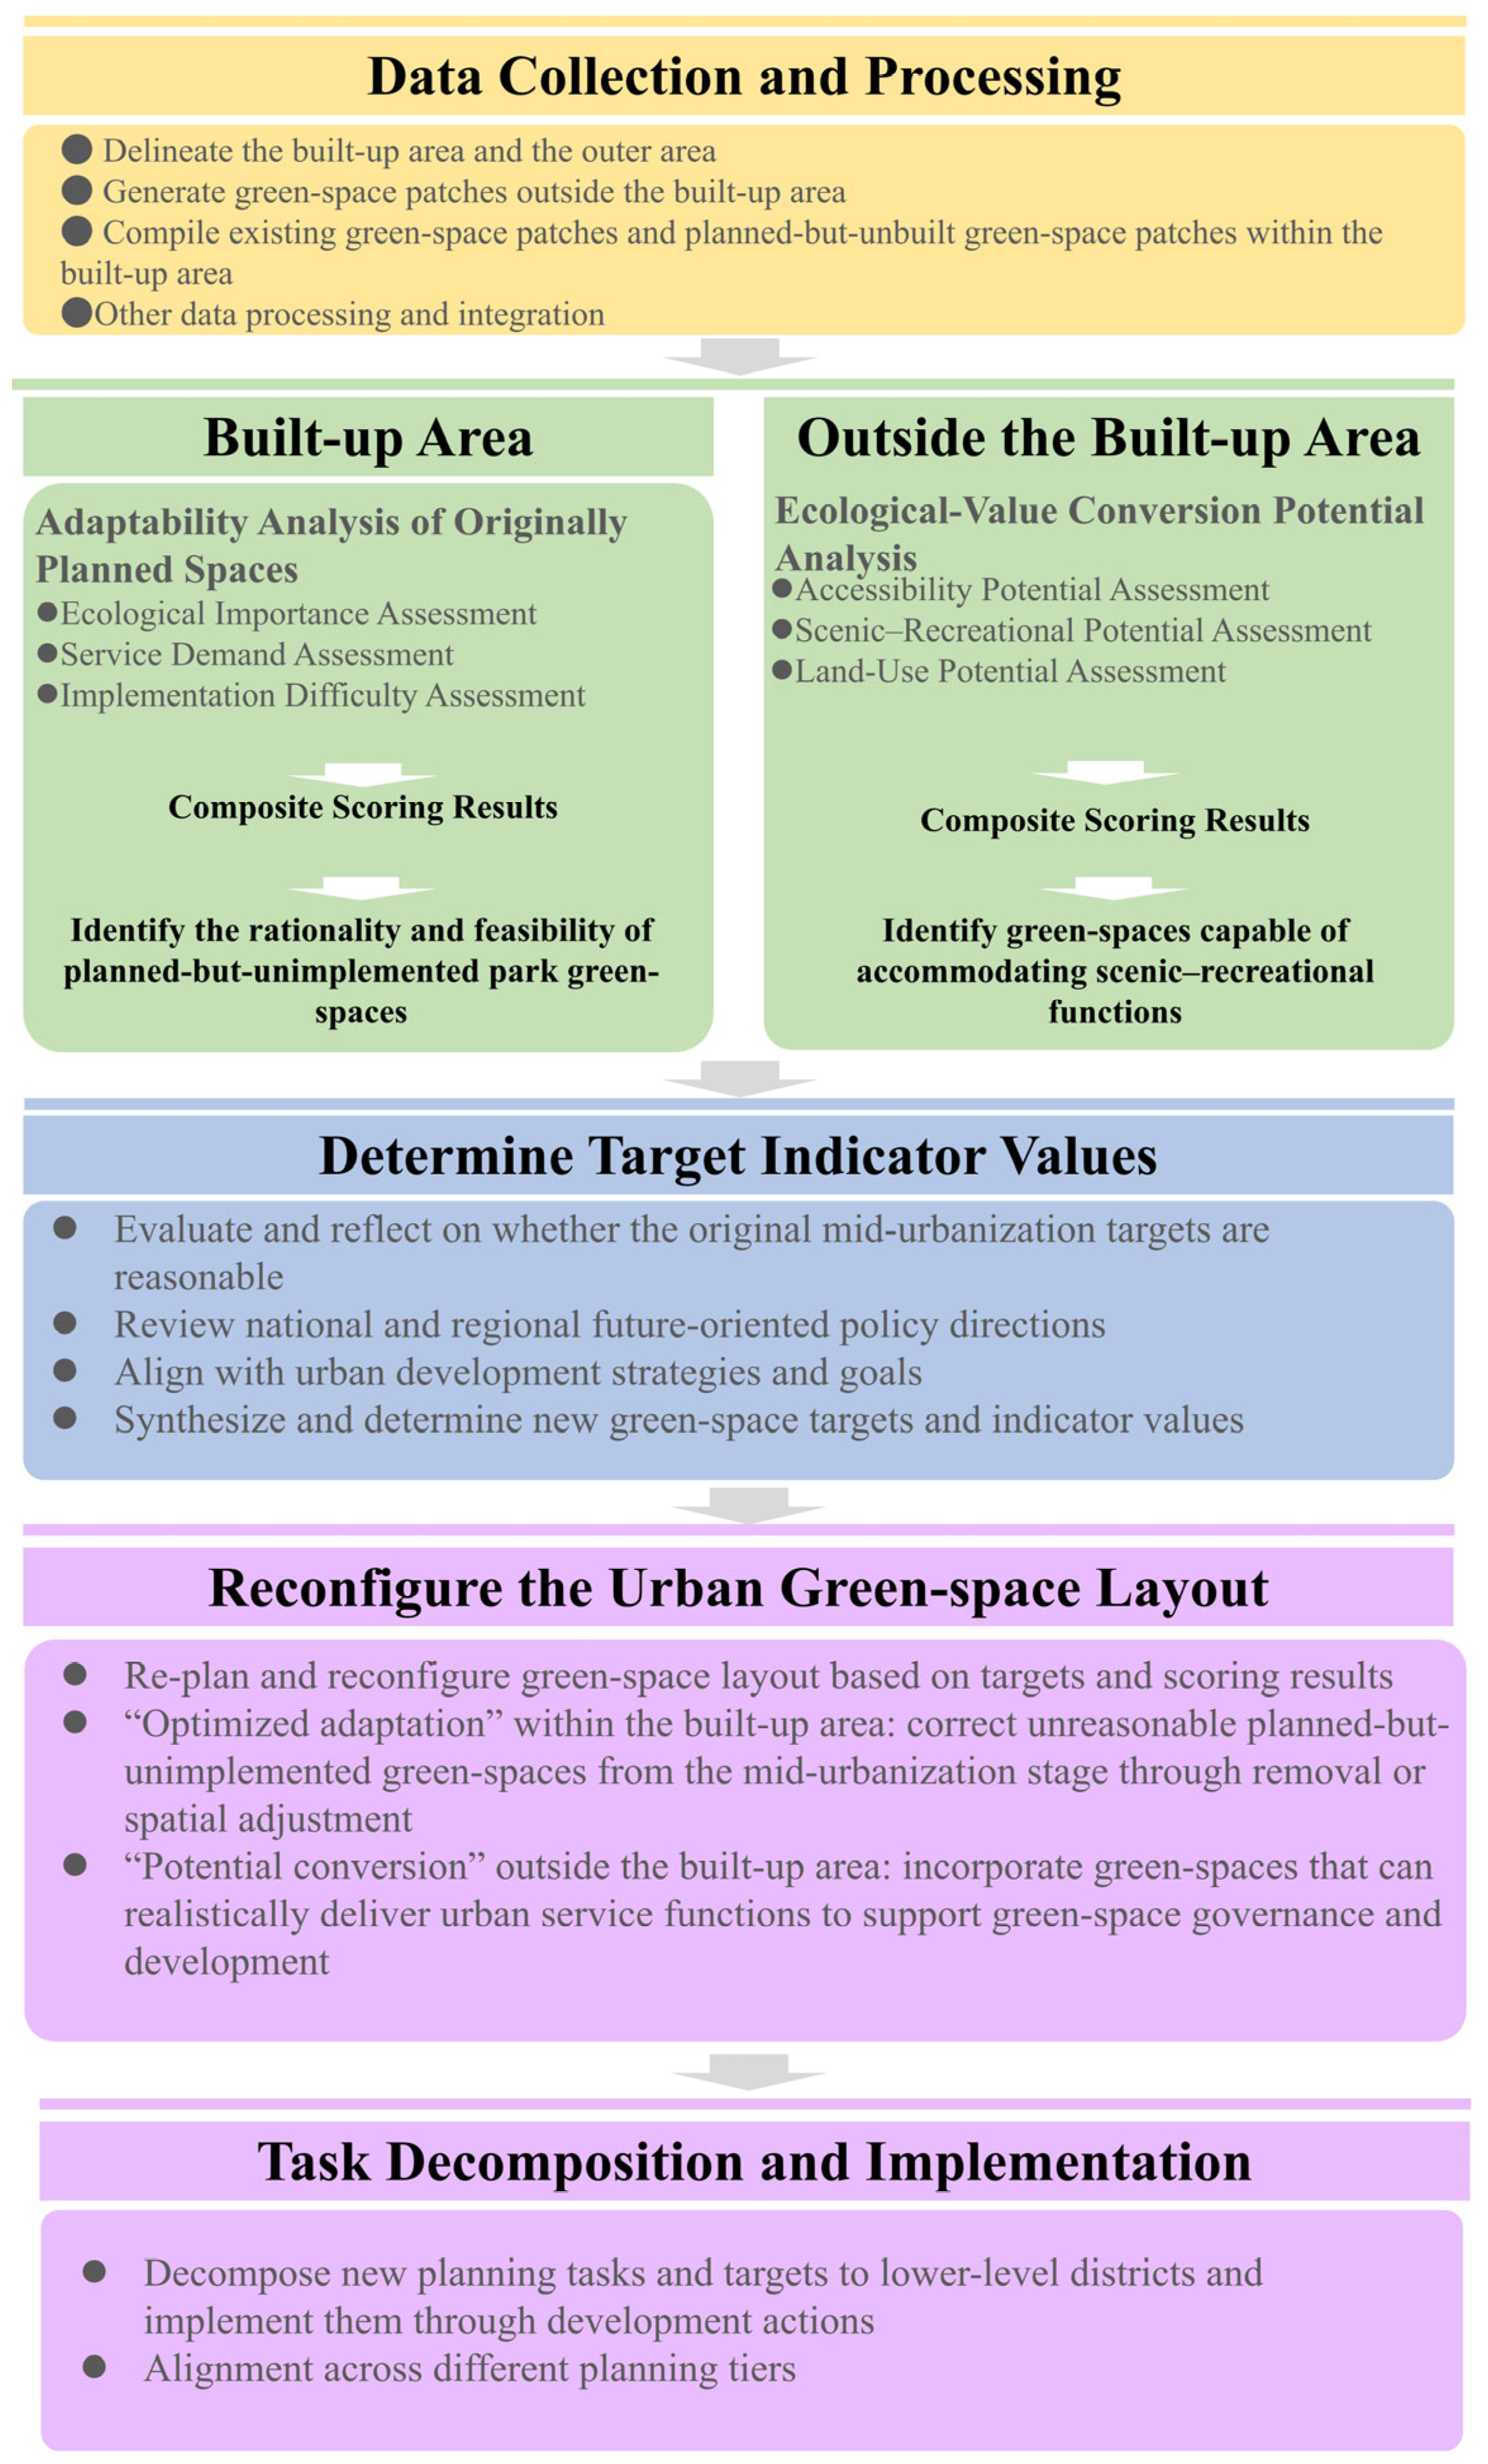
In allocating urban green space in plateau-constrained cities at the late stage of urbanization, cities face a dual dilemma: scarce and valuable flat land intensifies human–land conflicts, while extensive mountainous landscapes beyond the flatland have not been effectively converted into ecological and public-service value. Coupled with the theoretical discontinuity in planning correction and the narrow dimensionality of current effectiveness evaluations, this study argues that two approaches are essential: “optimized adaptation” within the built-up area dominated by flat land, and “potential activation” in adjacent outer areas dominated by mountainous terrain. Accordingly, the study proposes a technical route for correcting and reconstructing green-space allocation that integrates: (1) adaptability analysis of originally planned spaces within the built-up area; (2) assessment of the potential for converting ecological value in green spaces outside the built-up area; and (3) integrated spatial optimization (Figure 1). Here, the “built-up area” refers primarily to the flat-land urban area, while the “outer area” refers to mountainous zones adjacent to the built-up area.
Figure 1.
Technical framework for urban green-space layout optimization.
3.2. Evaluation Focus and Methods
Building on theories from urban ecology, landscape ecology, and scenic-resource studies, this paper draws on technical standards and guidelines including the UN City and Community Indicators, the WHO Urban Green Space Guidelines, Germany’s Open Space Planning Standards, and China’s Standard for Urban Green Space Planning (GB/T 51346-2019) [30] and National Garden City Evaluation Criteria (2022 edition) [31]. In response to the characteristics of plateau-constrained cities, the analysis of adaptability for originally planned spaces within the built-up area proposes three first-level dimensions—ecological importance, service demand, and implementation difficulty—and 11 s-level indicators for planned-but-unimplemented park green-space patches (Table 2). For the assessment of ecological-value conversion potential outside the built-up area, the paper proposes three first-level dimensions—accessibility potential, scenic–recreational potential, and land-use potential—and 13 s-level indicators for green spaces (Table 3), covering key factors affecting the implementation of green-space planning in plateau cities. Indicator weights are then determined using the Delphi method and the Analytic Hierarchy Process (AHP) based on three criteria—expert consensus, indicator complementarity, and basic necessity—to construct the evaluation formula as follows:
Table 2.
Built-up area: Indicator system for adaptability analysis of originally planned spaces.
Table 3.
Outside the Built-up Area: Indicator system for ecological-value conversion potential of green spaces.
Here, TS denotes the score of a planned-but-unimplemented park green-space patch within the built-up area, or of a green-space unit outside the built-up area; a higher score indicates stronger implementability (or higher conversion potential). is the weight of indicator i, is the score of indicator i, and N is the number of second-level indicators (11 or 13).
4. Empirical Analysis: The Kunming Case
4.1. Policy and Planning Context
Since the 1980s, China has gradually established a statutory planning system comprising national strategic planning/urban system planning → provincial/municipal urban system planning → urban master planning → sectoral (special) plans → regulatory detailed plans. At the city level, this system primarily includes the urban master plan (renamed the territorial spatial master plan in 2019), sectoral plans, and regulatory detailed plans. Green-space system planning is both a mandatory component of the master plan and a required sectoral plan for all cities. Regulatory detailed plans operationalize the requirements of master and sectoral plans and serve as the statutory basis for land conveyance and development activities. Land in China is classified into collectively owned land and state-owned land, with state-owned land being the primary category for urban development. Over the past four decades, urban green space has typically been planned as urban construction land (i.e., state-owned). Under urban expansion, this often requires expropriation of collectively owned land and conversion to state ownership, which entails substantial administrative and financial costs.
4.2. Overview of Kunming
The Yunnan–Guizhou Plateau is a representative karst plateau worldwide. It forms a complex mosaic of continuous mountain ranges, deeply incised valleys, and solution basins, where plateau-constrained cities are distributed in clusters and rapid urbanization has intensified tensions between conservation and development, alongside pronounced spatial–structural challenges [32]. Kunming is located in the central-western part of the Yunnan–Guizhou Plateau. By the end of 2024, it had a permanent resident population of 8.687 million and an urbanization rate of 83.54%, making it the only mega-city on the plateau with a markedly high primacy. The central urban area covers 2520 km2, with approximately 5.5 million residents by the end of 2024 and a planned population of 6.7 million by 2035. Its core is the Dianchi Basin (about 1100 km2, including 299 km2 of lake surface), and the city’s morphology is strictly constrained by Lake Dianchi and the surrounding mountains. As a typical plateau-constrained city, Kunming once ranked among China’s leaders in urban green-space development in the 1990s (when it was in the mid-urbanization stage). Over the past decade, however, as the city entered a stock-oriented late-urbanization phase, green-space development has increasingly lagged and become difficult to advance. Despite iterative planning, evaluation, and revisions during the mid-urbanization stage, Kunming has established a relatively complete statutory planning and policy system (municipal urban system plan–master plan–sectoral plans–detailed plans). Local regulations and sectoral plans for protecting and controlling ecological spaces—such as watershed conservation, water-source areas, nature reserves, scenic areas, and green buffers—are also relatively mature. Nevertheless, the city continues to face a dual dilemma of “failure of flatland-based planning” and “underutilization of mountain potential,” making the correction, adjustment, and refinement of legacy plans urgent. Accordingly, this study conducts an empirical analysis using Kunming as a typical case to enhance both academic contribution and practical relevance.
4.3. Data Sources and Processing
This study primarily relies on statutory datasets and official planning outputs publicly released by relevant government agencies or research institutions and commonly used in professional practice:
- (1)
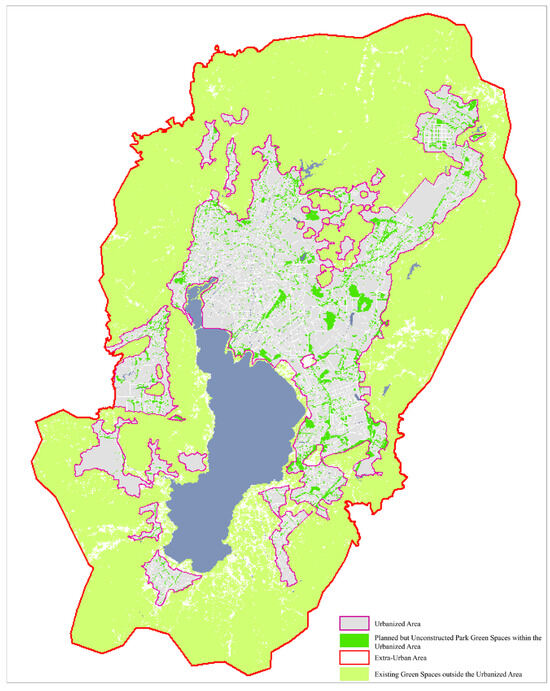
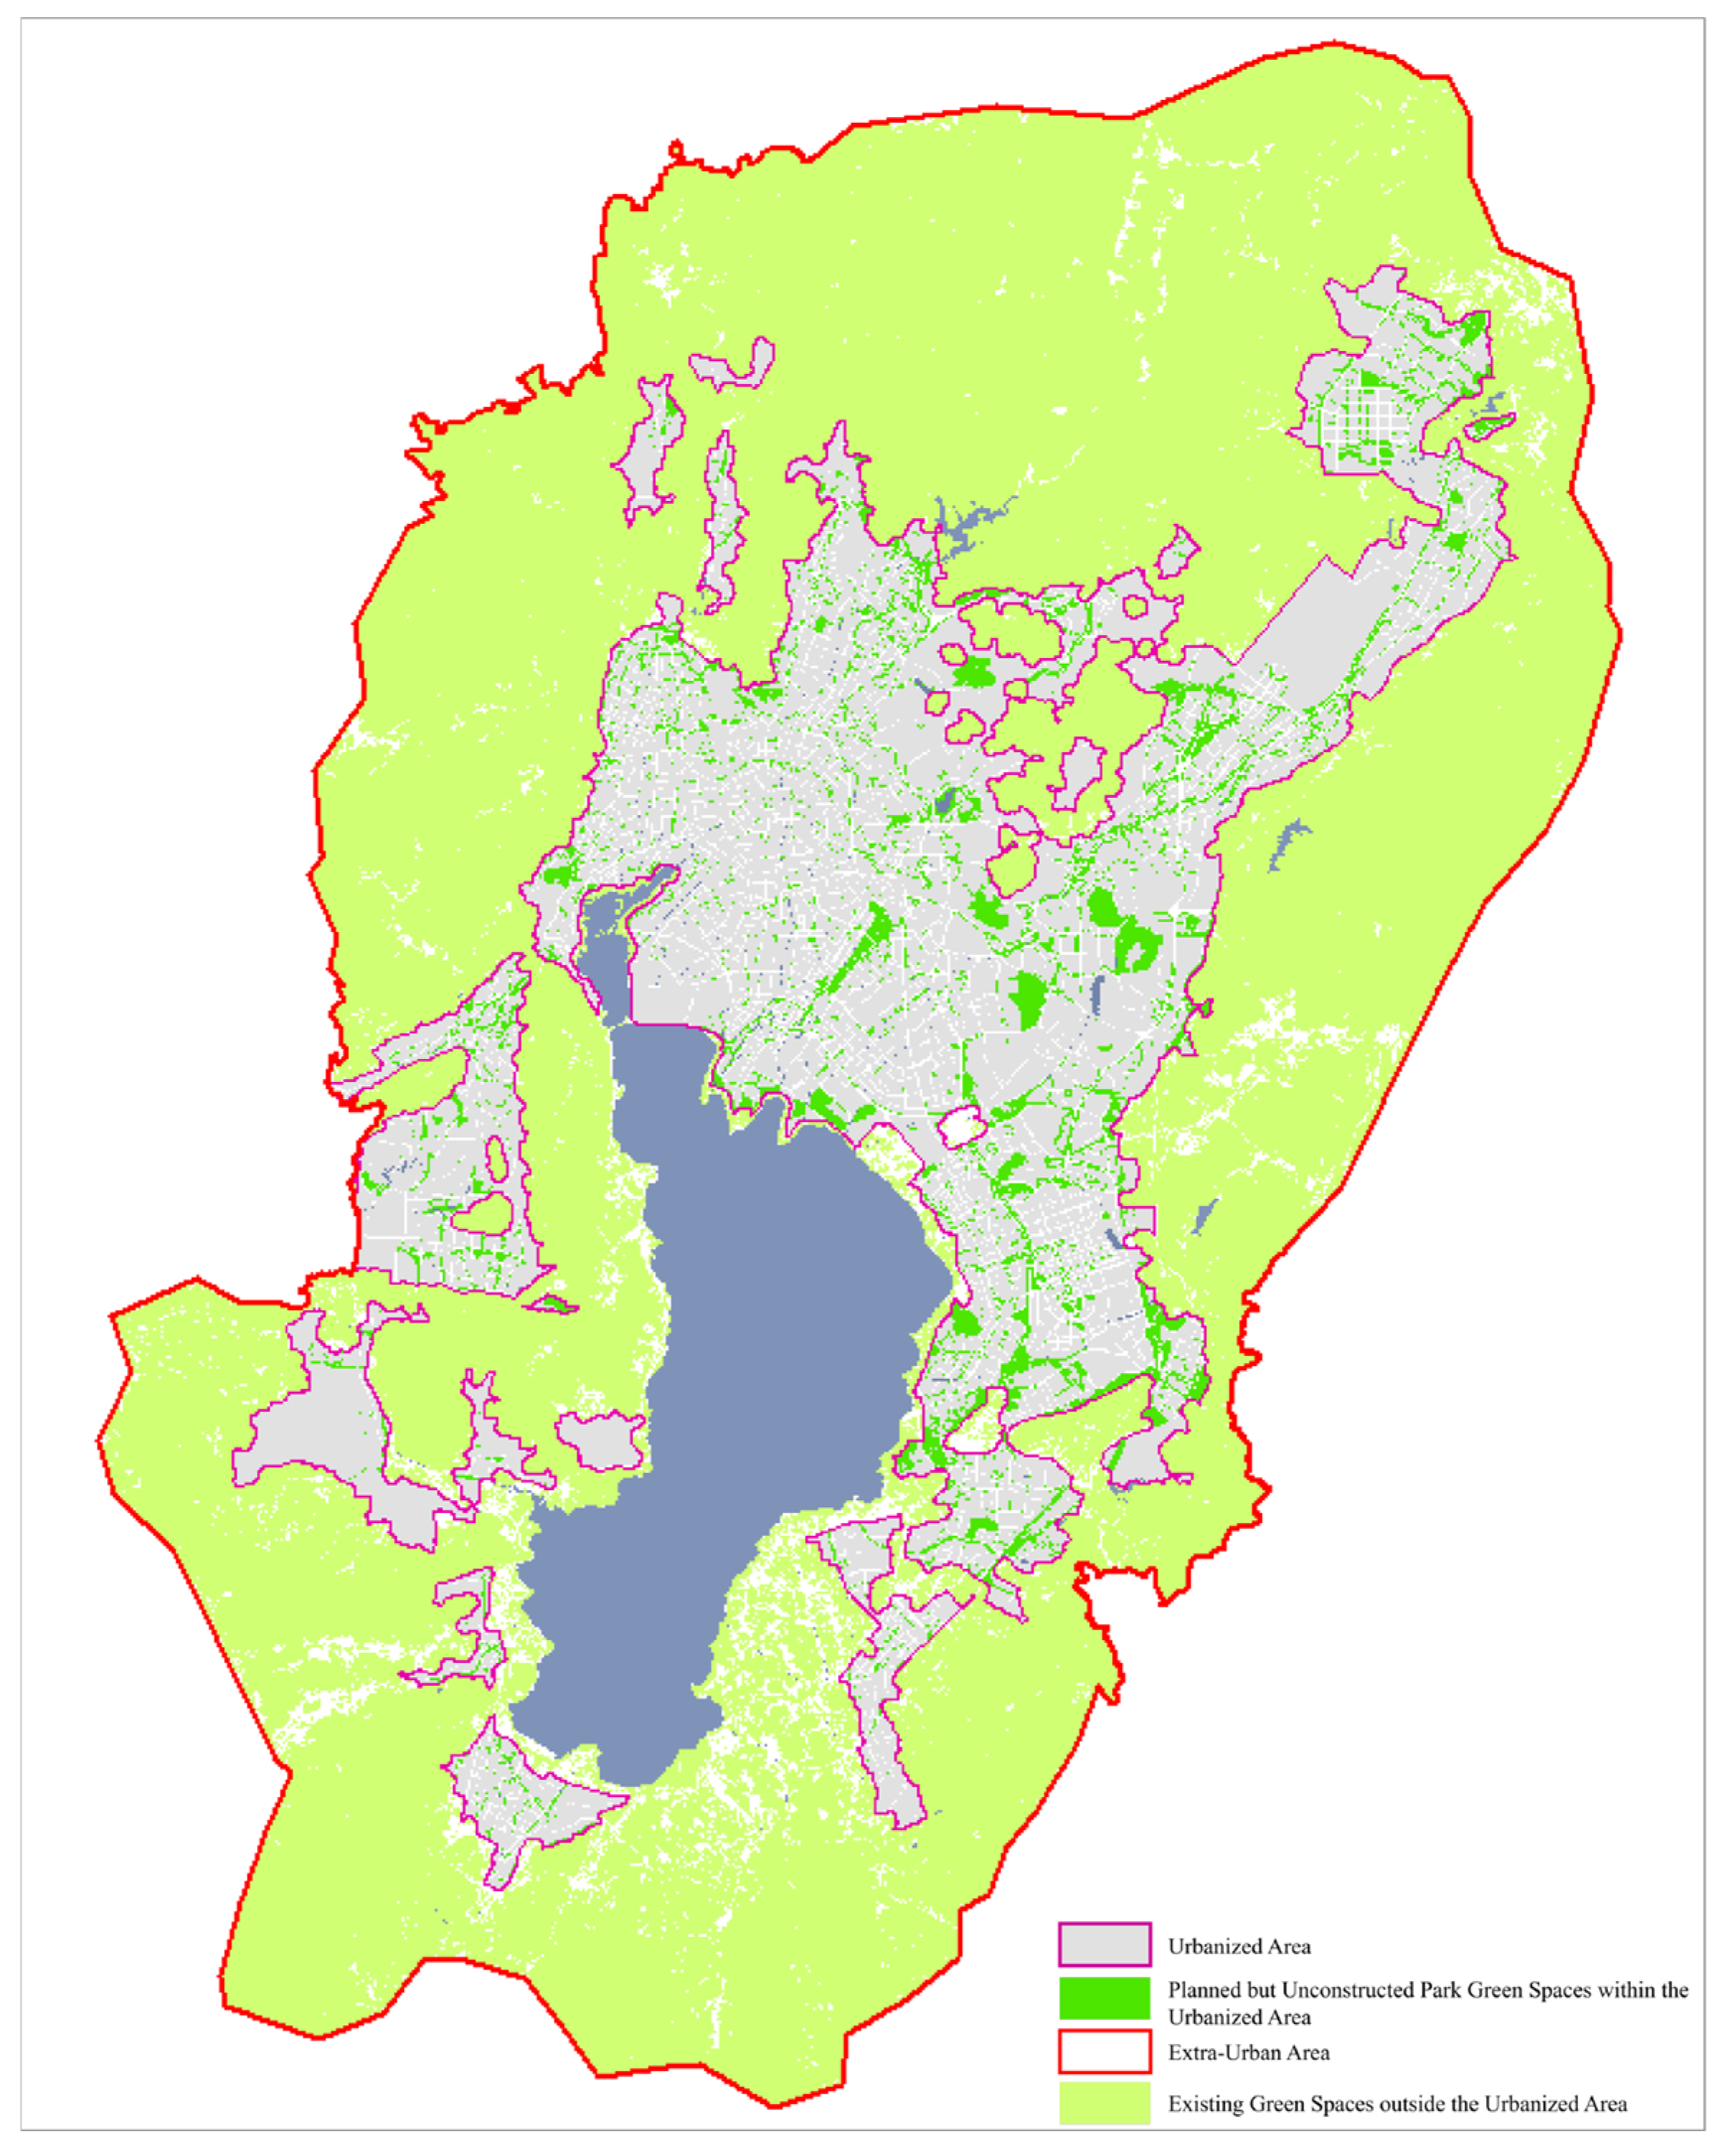
- Delineation of the built-up area and the outer area: Based on the 2035 central urban area and basin-area extent defined in the current statutory territorial spatial master plan, we delineated the built-up area for this study by using the planned urban construction area toward 2035 and incorporating adjacent gentle-slope spaces to form a continuous boundary (989.33 km2). We then expanded outward from the 2035 central urban boundary and delineated the outer area (excluding the built-up area) by integrating terrain features, subdistrict administrative boundaries, and watershed-based collaborative governance considerations (2533.59 km2) (Figure 2).Figure 2. Built-up area and outer-area boundaries and the base spatial units for analysis.
- (2)
- Within the built-up area: focus on park green space: Over the past four decades of policy practice in China, urban green space has been mainly categorized into park green space and protective green space. Because park green space functions as a core piece of inclusive green public service infrastructure, it is a mandatory component to be planned and implemented in the territorial spatial master plan, sectoral plans, and regulatory detailed plans. Its core contents typically include spatial layout (i.e., delineating the green-line boundary) and per capita park green-space area (i.e., land-use proportion). Therefore, park green space is the central focus of urban green-space configuration. Accordingly, we compiled the dataset of planned-but-unbuilt park green-space patches within the built-up area based on green-space patches designated in the master, sectoral, and regulatory detailed plans.
- (3)
- Outside the built-up area: green-space patches: We processed the latest GLC_FCS30D dataset| ① to produce land-surface land-use/land-cover classification patches (Figure 2).
- (4)
- Additional supporting data: We used the most recent vector data from the municipal landscaping and greening survey, validated against high-resolution imagery, to compile existing park green-space patches. Current population data were taken from annual statistics released by municipal statistical authorities, while planned population figures were based on the central-city population specified in the territorial spatial master plan. We also extracted relevant control lines and requirements from statutory sectoral plans (e.g., green-space system, historic-city conservation, overall urban design, ecological space, and transport planning) to compile other datasets needed for analysis.
4.4. Scoring Rules for Key Indicators
To support the correction and reconstruction evaluation of Kunming’s green-space configuration, we localized and refined the scoring rules and conducted the assessment accordingly (Table 4 and Table 5).
Table 4.
Scoring rules for the built-up area: adaptability analysis of originally planned park green space.
Table 5.
Scoring rules for the outer area: ecological-value conversion potential of green space.
In addition, we invited 15 experts in urban planning and landscape architecture (Appendix A) to score indicator importance in light of Kunming’s local context. We then derived the eigenvectors, maximum eigenvalues, consistency indices, and consistency ratios for the first-level indicators (Appendix B).
For the built-up-area first-level indicators (adaptability analysis of originally planned spaces), the judgment matrix yields a maximum eigenvalue of λmax = 3. The consistency index is CI = (3 − 3)/(3 − 1) = 0. With RI = 0.58, the consistency ratio is CR = 0/0.58 = 0. Since CR < 0.1, the judgment matrix passes the consistency test, indicating satisfactory internal consistency of the weight allocation. For the outer-area first-level indicators (ecological-value conversion potential), the judgment matrix yields λmax = 3. The consistency index is CI = (3 − 3)/2 = 0. With RI = 0.58, the consistency ratio is CR = 0/0.58 = 0. Since CR < 0.1, the matrix passes the consistency test, indicating satisfactory internal consistency of the weight allocation (Table 6).
Table 6.
Weights for the built-up-area adaptability indicators and the outer-area ecological-value conversion indicators.
4.5. Evaluation Results and Layout Optimization
4.5.1. Key Findings from the Evaluation
- (1)
- Results for the built-up area: adaptability analysis of originally planned spaces
Our analysis shows that the total planned park green-space area across statutory plans within Kunming’s built-up area is 13,389.18 ha. Among this total, existing built parks account for 5419.37 ha (40.48%), while planned-but-unbuilt park green space accounts for 7969.81 ha (59.5%). This indicates that even at a high level of urbanization (urbanization rate 83.54% by the end of 2024) and despite Kunming’s status as a National Garden City since 2010, planned park green space remains dominated by unbuilt areas under a 2035 stock-oriented development context. This suggests that the park green-space targets established during the mid-urbanization stage (urbanization rate 30–70%) were overly idealistic and optimistic, with a substantial share lacking feasibility and implementability.
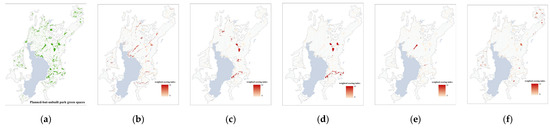
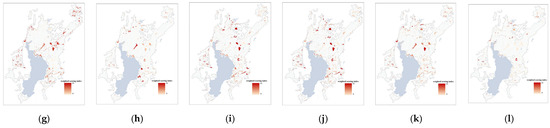
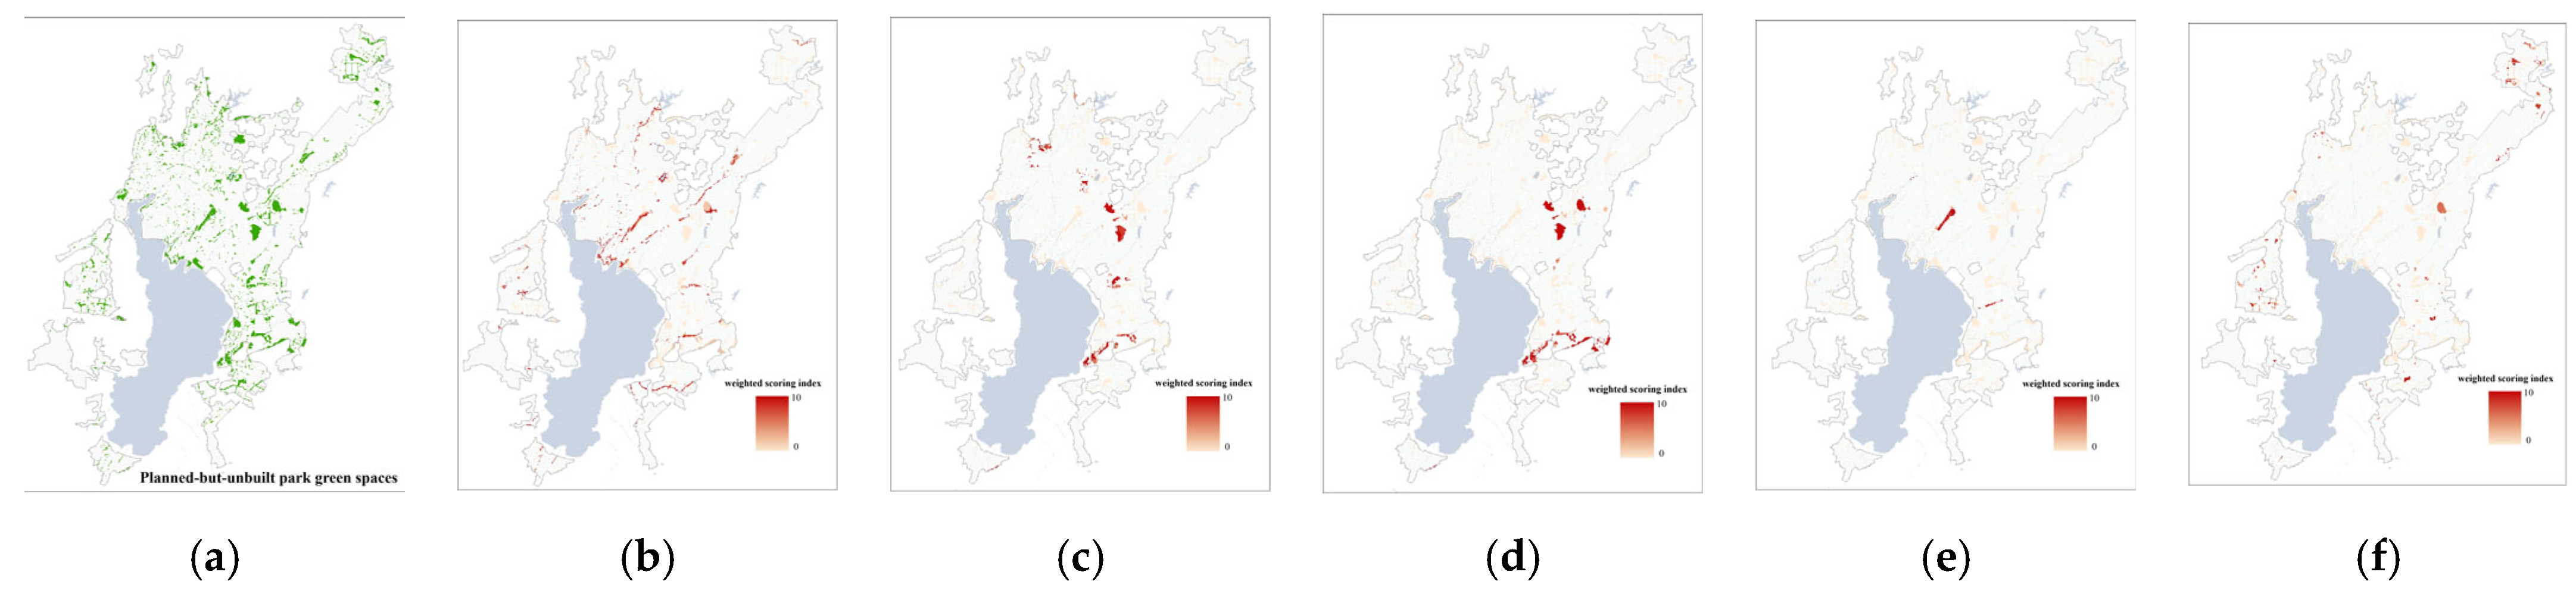
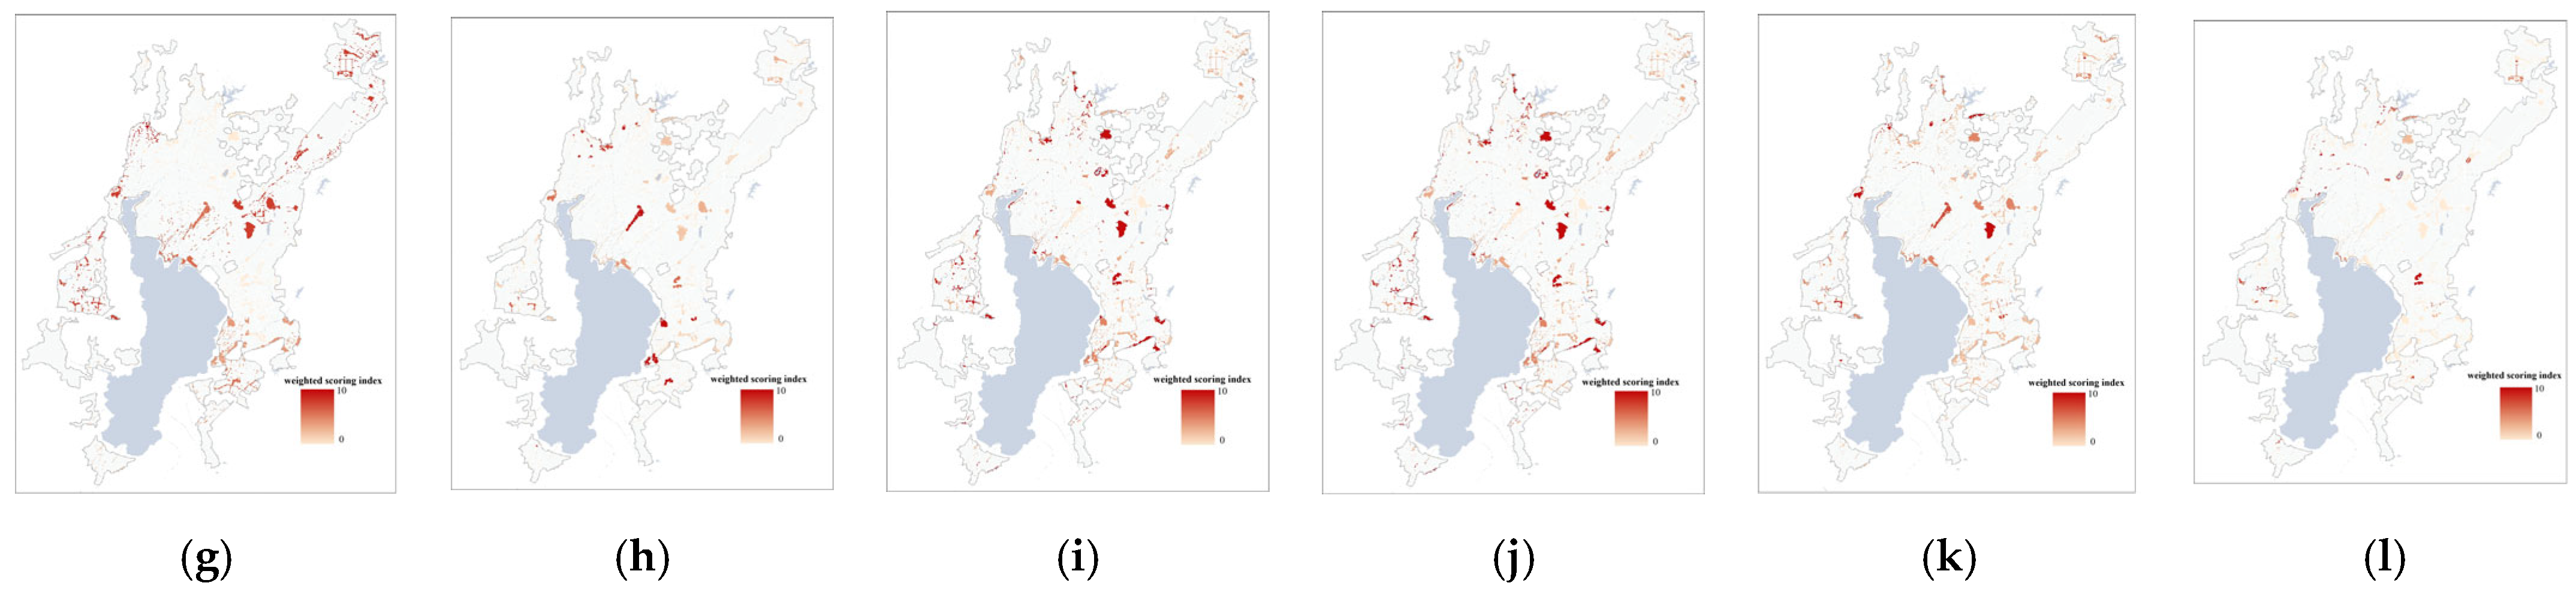
Applying the built-up-area adaptability assessment to the 7969.81 ha of planned-but-unbuilt park green space (Figure 3), the sub-indicator results show that, in terms of ecological importance, higher ecological–landscape value is concentrated along the parallel linear river corridors flowing into Dianchi, within green buffers between major urban clusters (the four traditional core districts and new districts), and along the Wujiaba central axis. In terms of service demand, new districts such as Chenggong, Dianzhong, the Economic Development Zone, and Taiping exhibit substantially higher demand for various park types than the four traditional core districts. Regarding implementation difficulty, planned-but-unbuilt park sites larger than 5 ha generally face substantial barriers, especially those located in high-density urban villages, where redevelopment-driven stock renewal and intensified competition for space further increase costs and difficulty. This also implies a strong need to compensate for these implementation constraints by developing scenic–recreational green spaces with comprehensive-park functions outside the built-up area.
Figure 3.
Sub-indicator results for the adaptability analysis of originally planned green space within the built-up area. (a) Zoned but not yet implemented parkland. (b) Hydrological corridor significance index. (c) Topographic ridgeline corridor significance metric. (d) Buffer-isolation priority index. (e) Landscape connectivity centrality metric. (f) Service-radius demand intensity. (g) Service overlap demand intensity. (h) Composite urban park demand index. (i) Development-intensity feasibility index. (j) Land-use conversion feasibility index. (k) Land-tenure acquisition difficulty index. (l) Urban renewal plan implementation feasibility index.
To further examine the relationship between planned-but-unbuilt park green space and the built-up fabric, we normalized the scores of the 11 s-level indicators and the overall score. Based on the historical formation of Kunming’s built-up area, we divided the study area into three non-overlapping zones: (i) areas built up by 2005, (ii) areas built up during 2005–2025, and (iii) incremental areas planned for 2025–2035. For each zone, we calculated the area shares of planned-but-unbuilt park green space across the score bands 0–0.3, 0.3–0.7, and 0.7–1.0 for each indicator and for the overall score (Table 7). The results remain relatively robust after increasing the weight of “implementation difficulty” by 10%. The analysis indicates that, both in areas already built up by 2025 and in incremental areas planned toward 2035, a large share of planned-but-unbuilt park green space falls into the 0–0.3 band for ecological importance and service demand, suggesting an oversupply of low-value planned sites. Consequently, implementing and controlling only the relatively limited area in the 0.7–1.0 band could yield substantial effectiveness. By contrast, in terms of implementation difficulty, barriers to implementing planned-but-unbuilt parks show a decreasing trend from the pre-2005 built-up areas to the 2005–2025 built-up areas and further to the 2025–2035 incremental areas, indicating that “optimization and pressure relief” in the traditional inner city and existing built-up areas should be prioritized.
Table 7.
Proportional area of planned-but-unbuilt park green space by score interval across built-up areas from different development periods.
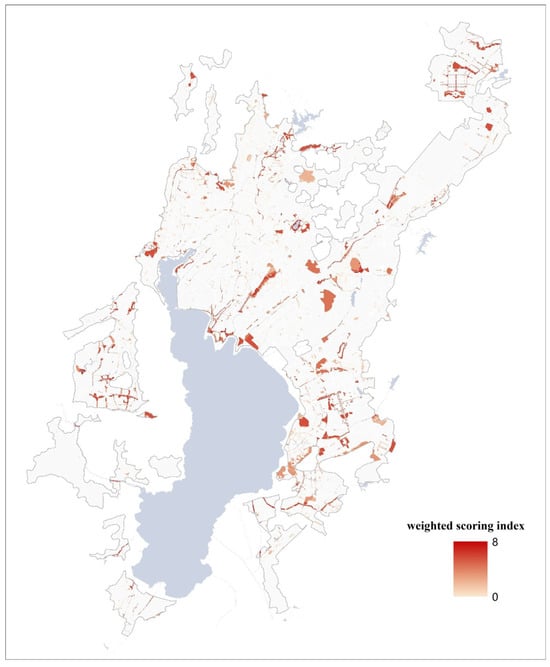
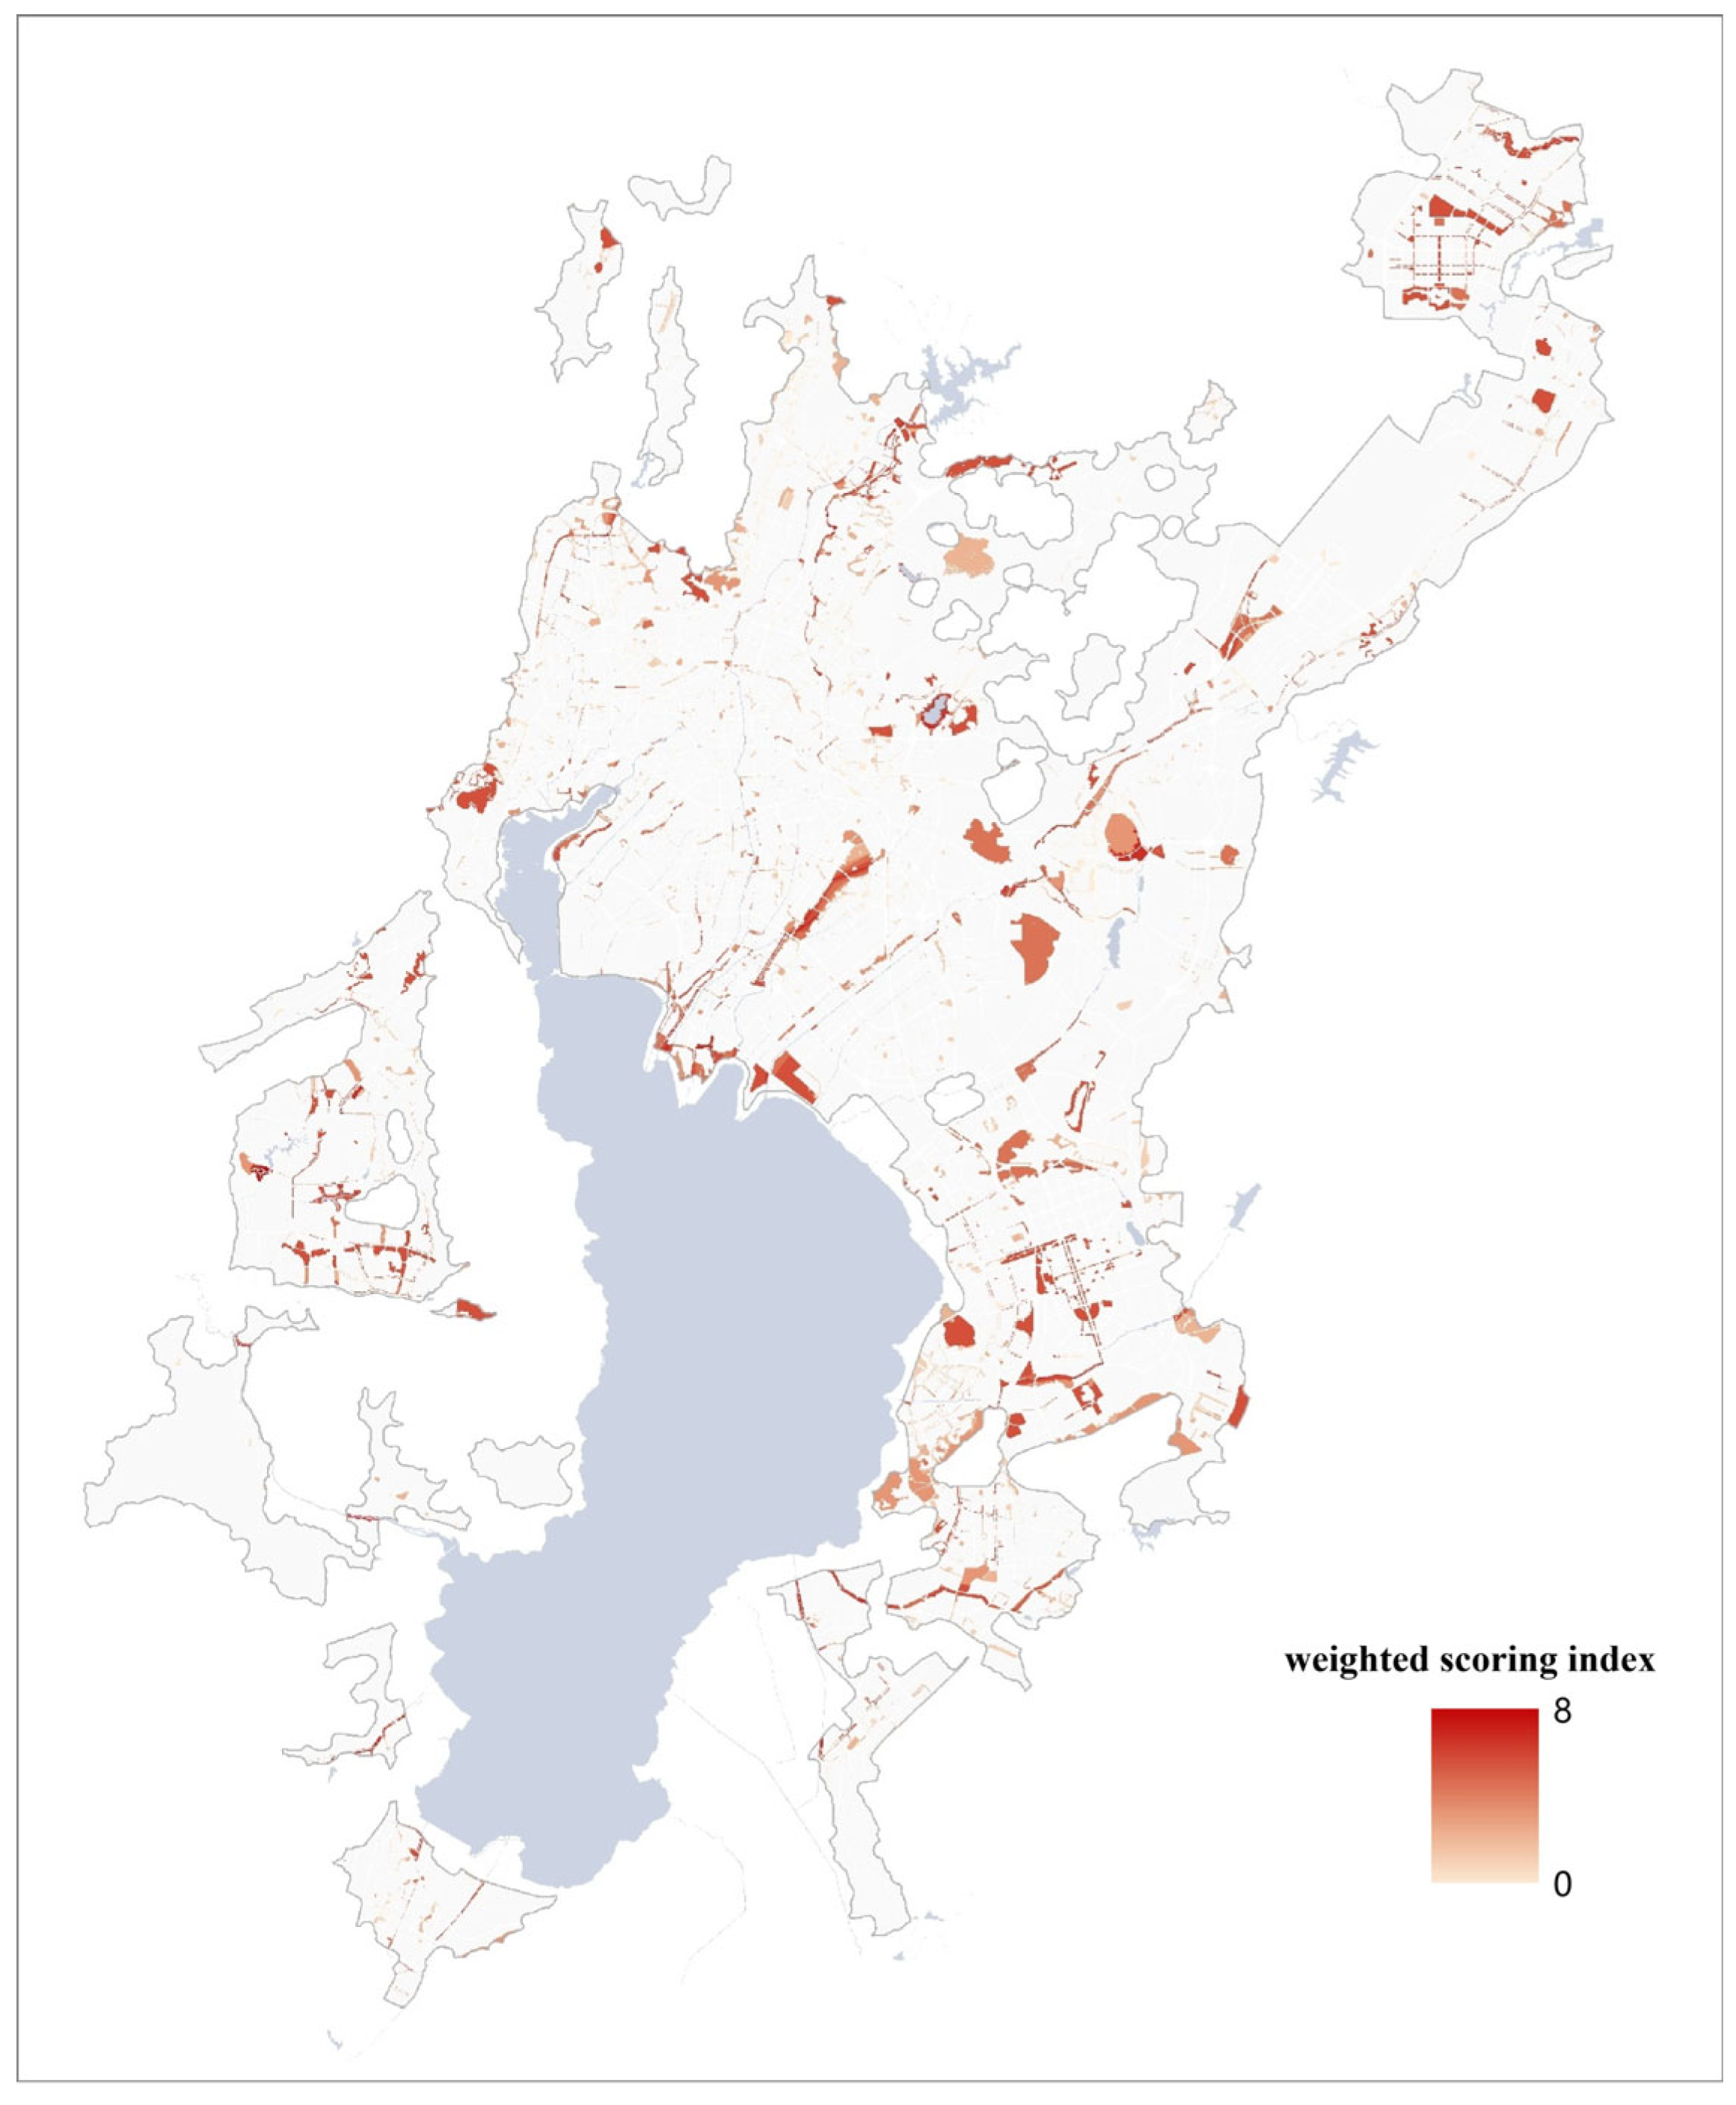
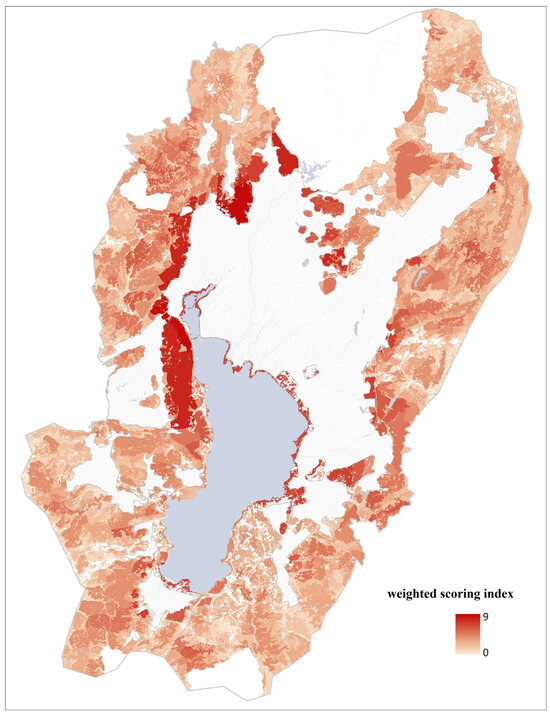
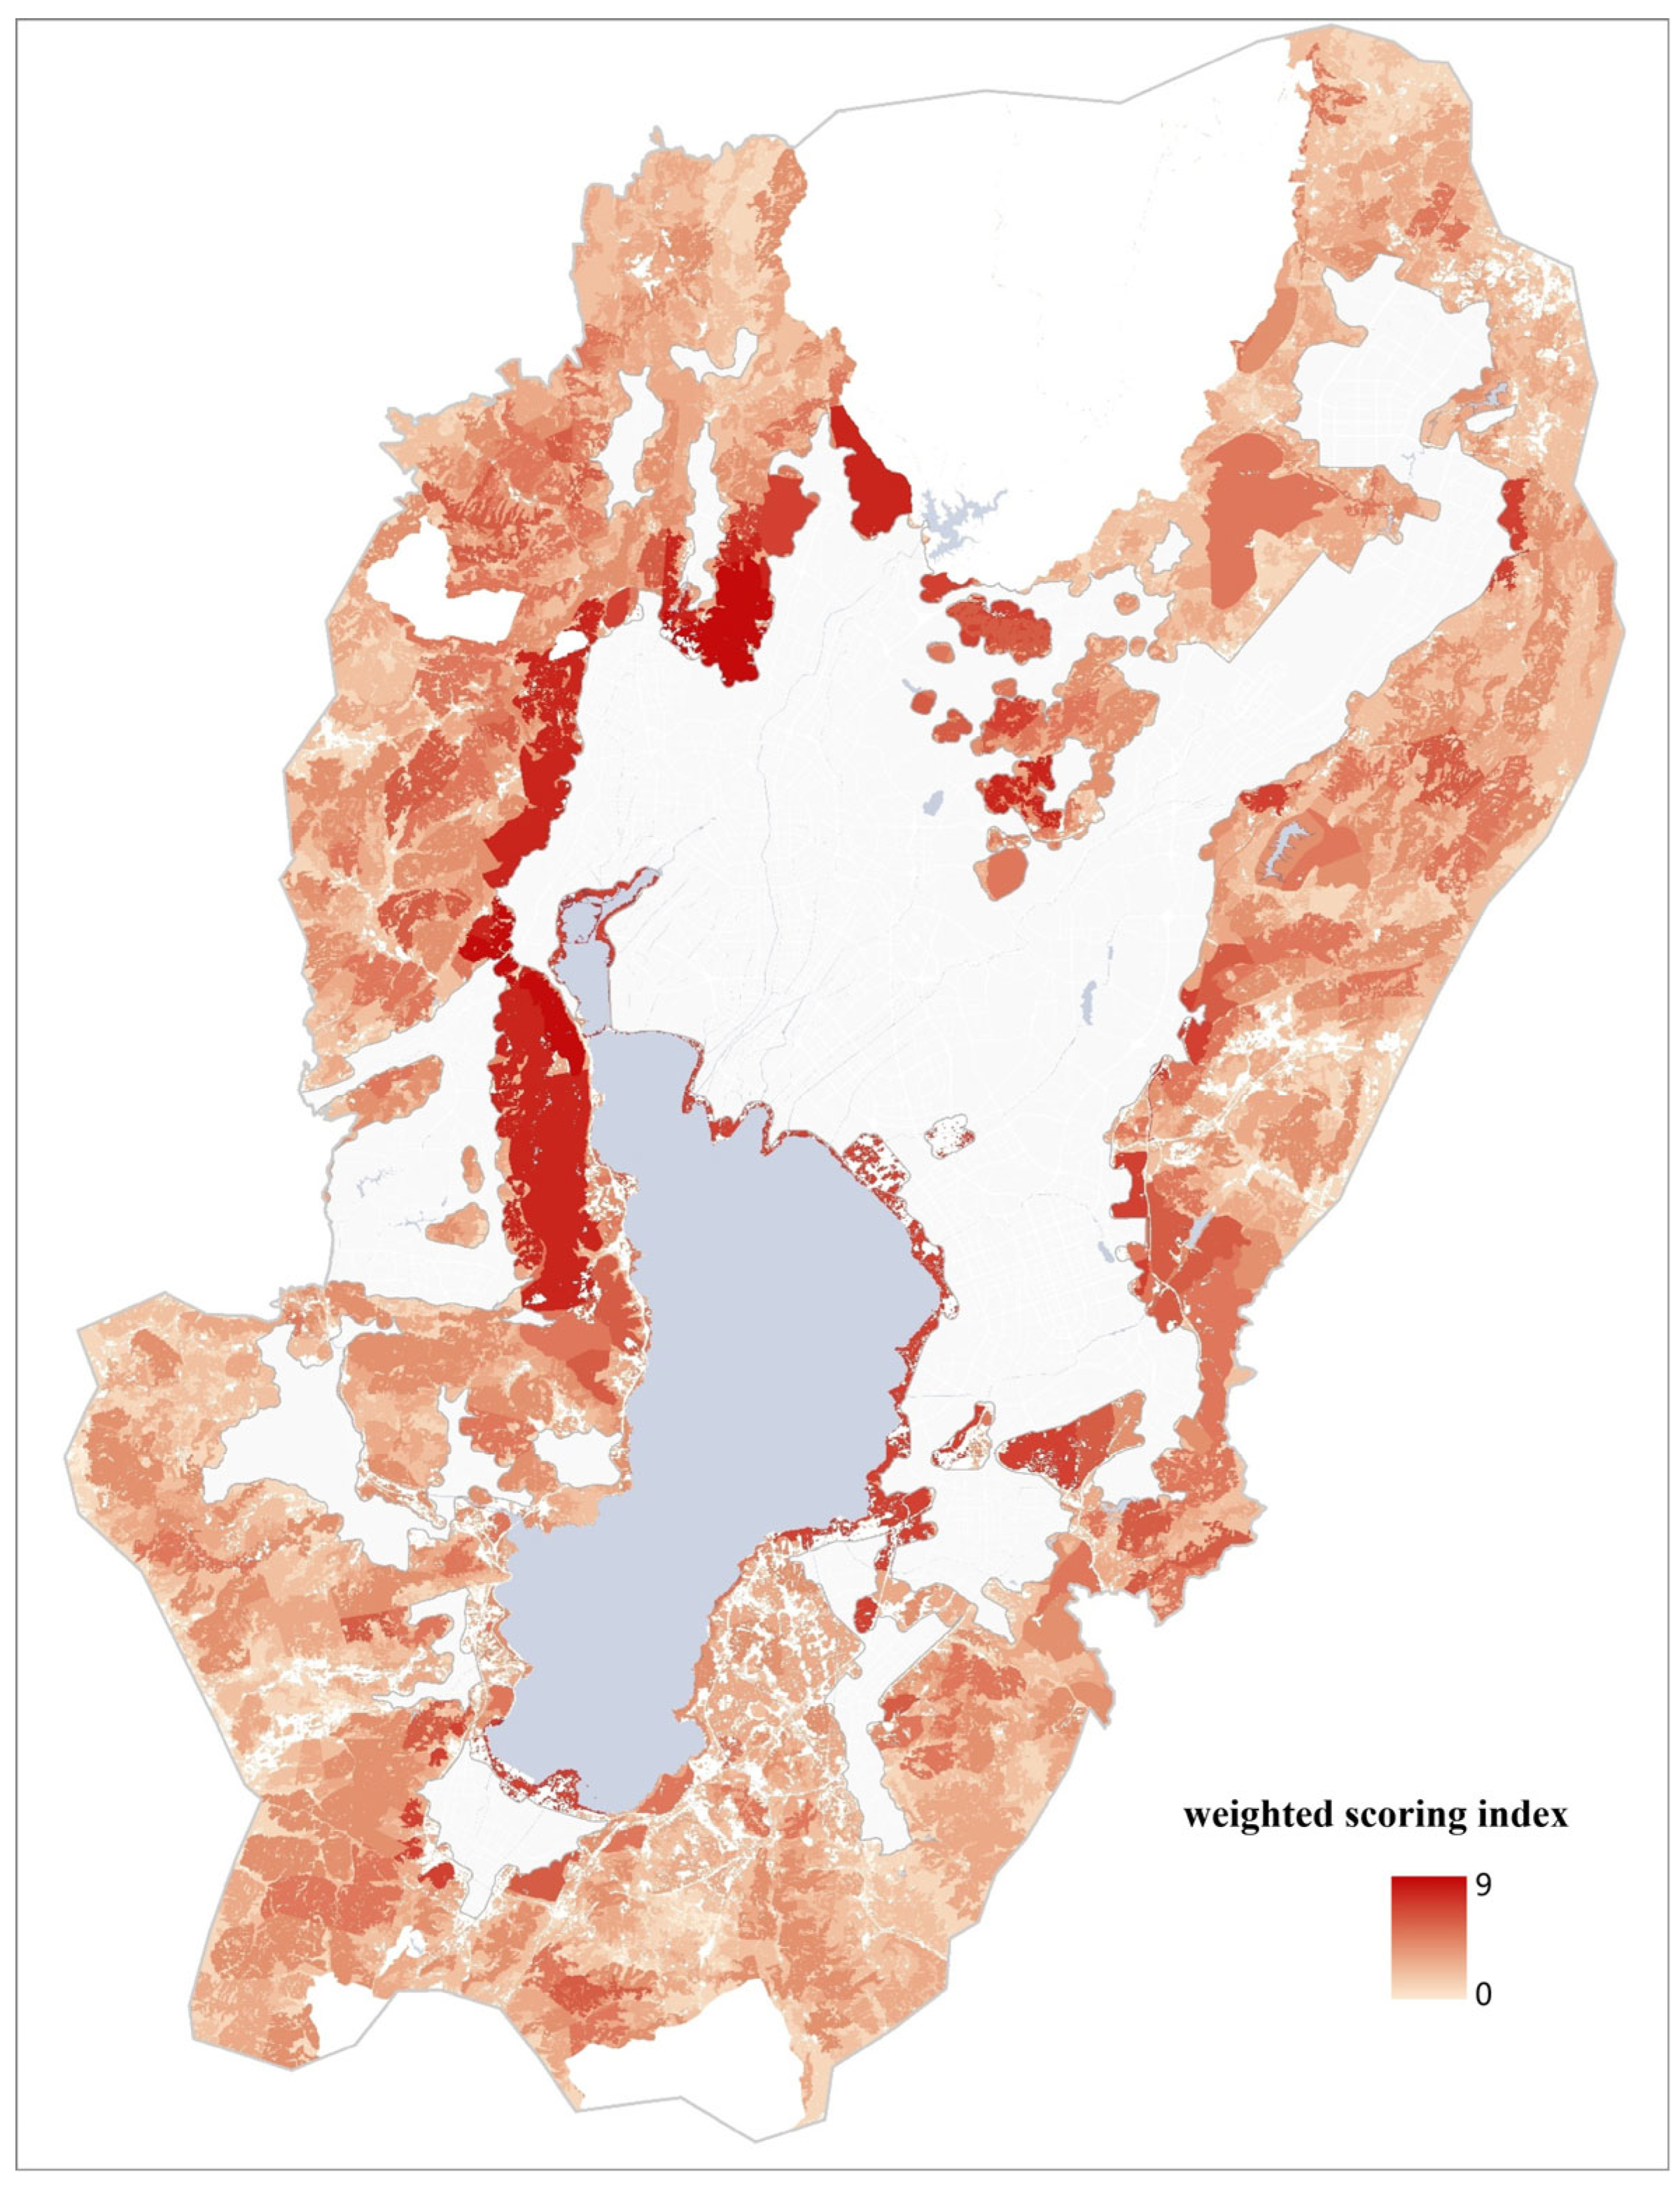
In the overall evaluation (Figure 4), planned-but-unbuilt park sites scoring 0.7–1.0 show strong necessity and implementability and are recommended for priority implementation, totaling 2972.44 ha (37.30%). Sites scoring 0.3–0.7 may be converted directly to other land-use types to release space, or their implementation may be deferred depending on actual urban renewal and development needs, with feasibility and necessity to be reassessed after 5–10 years; these total 3423.83 ha (42.96%). Sites scoring 0–0.3 exhibit very low necessity and implementability and are recommended for removal from statutory plans and conversion to other land-use types to release space; these total 1573.55 ha (19.74%).
Figure 4.
Overall score of the adaptability analysis of originally planned green space within the built-up area.
- (2)
- Results for the outer area: ecological-value conversion potential
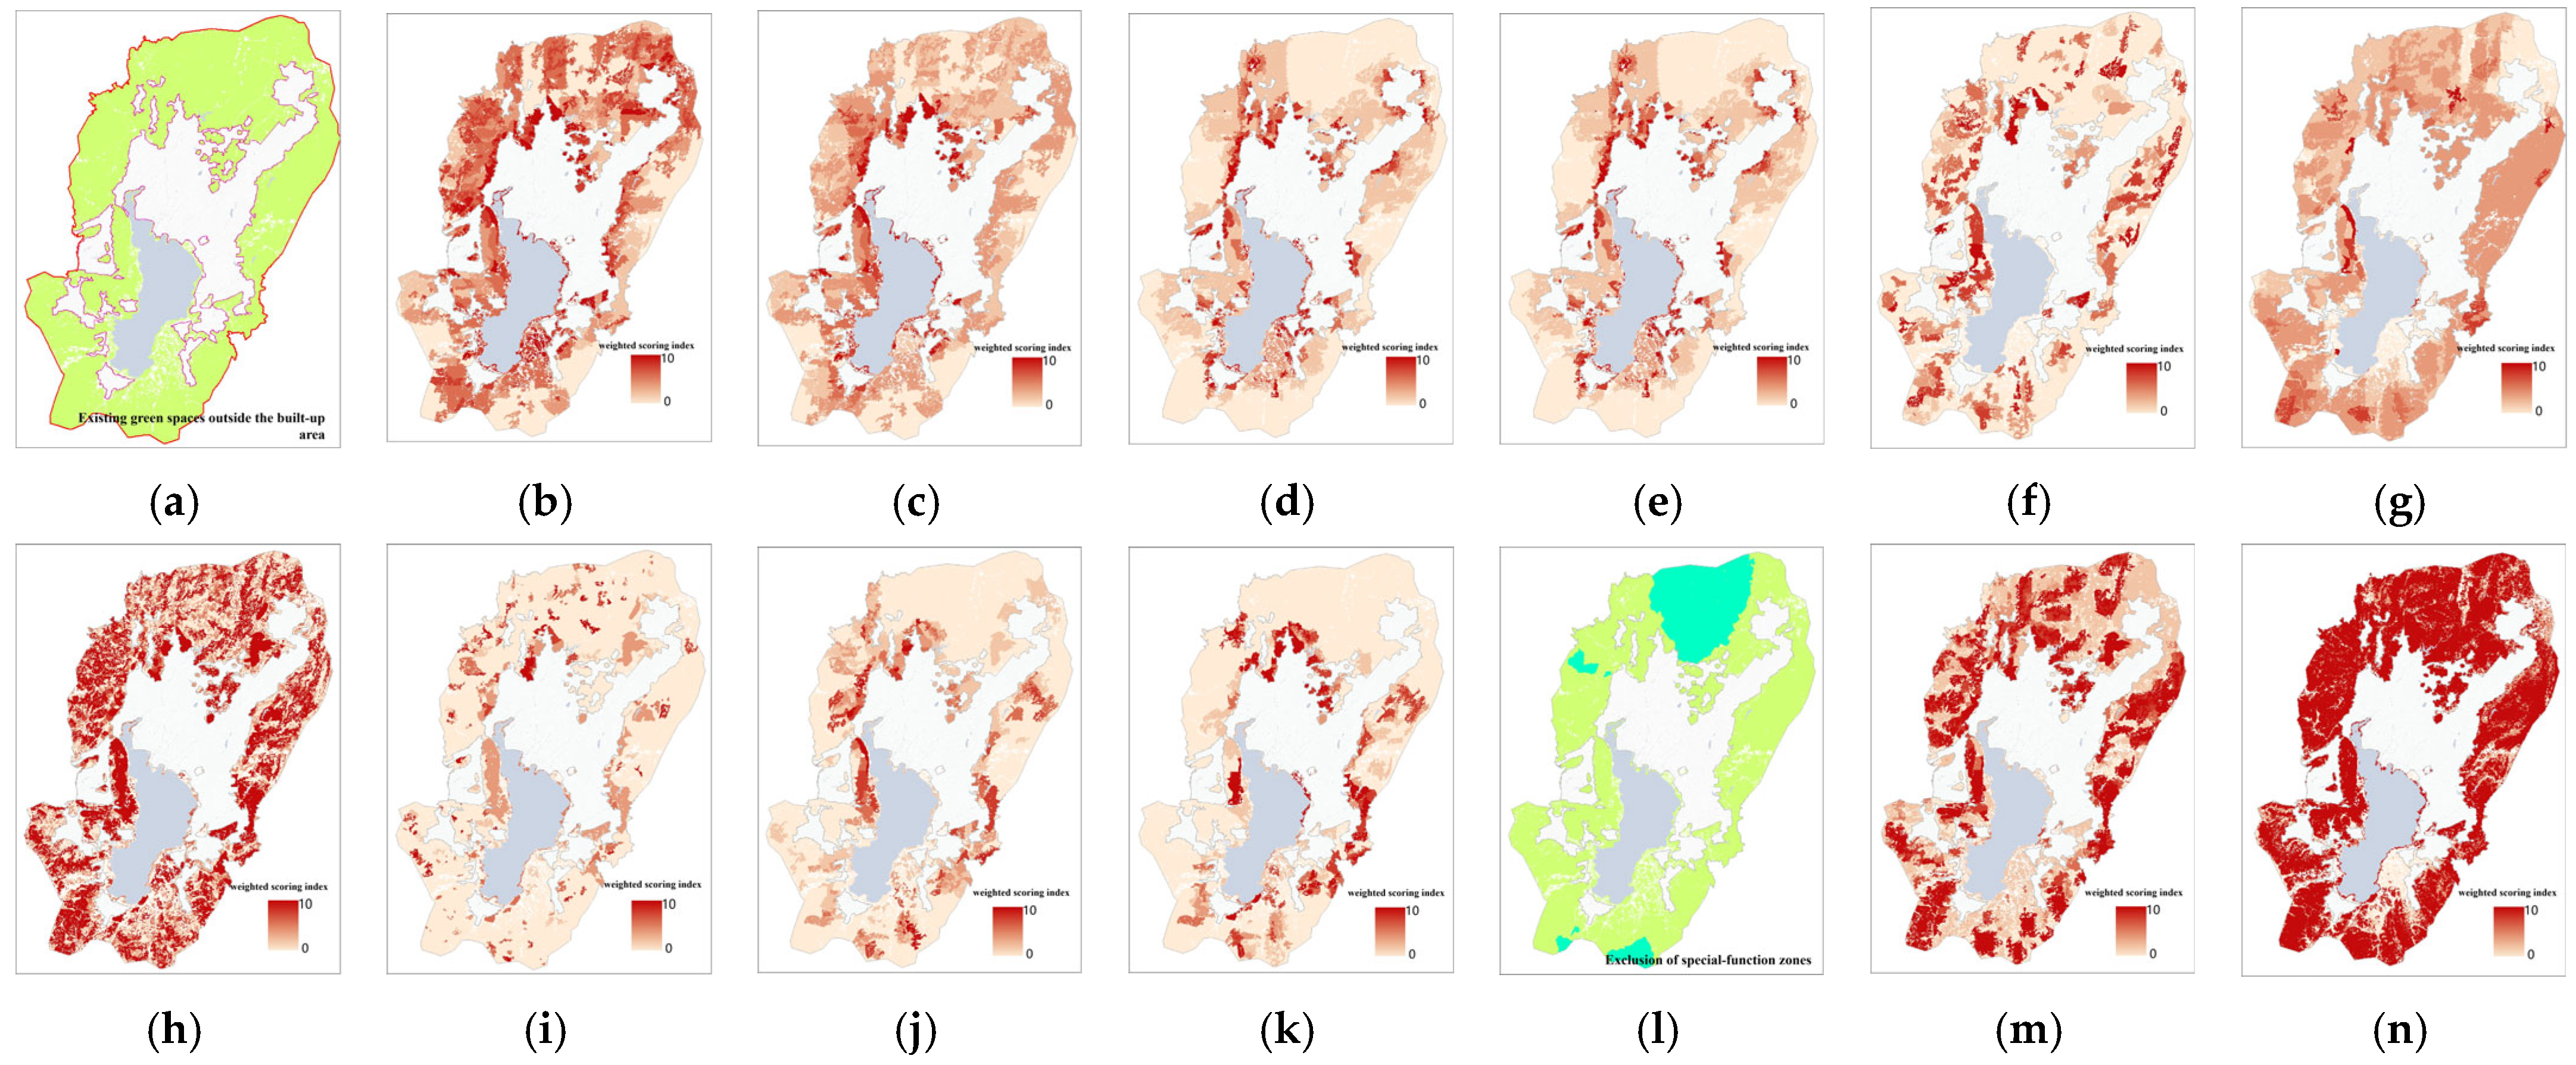
We included in the evaluation the green spaces within the outer area—namely, predominantly agricultural/forestry functional spaces excluding built-up land and water bodies—covering a total of 2101.26 km2. We then applied the ecological-value conversion potential method to assess these spaces (Figure 5).
Figure 5.
Sub-indicator analysis for potential of ecological value conversion of green spaces outside urban areas. (a) Extrinsic urban existing green space. (b) Vehicular accessibility. (c) Active-mobility accessibility. (d) Service-radius potential. (e) Existing-tourism-site potential. (f) Elevation-mediated landscape potential. (g) Slope-conditioned landscape potential. (h) Landscape-homogeneity potential. (i) Landscape-heterogeneity potential. (j) Hill-based city-viewing potential. (k) Mountain-mediated scenic potential. (l) Special-function screening. (m) Topographic-performance potential. (n) Land-use conversion resistance index.
In the sub-indicator results, accessibility potential is relatively high in the peri-urban mountains integrated with the city on the west, north, and east sides of the four traditional core districts, as well as along the Dianchi lakeshore where urban functional clusters are present. Scenic–recreational potential is higher in the mountainous areas to the west and north of the Dianchi Basin. This is likely because tectonic uplift is more evident there, producing more dramatic and diverse landforms and, consequently, more varied scenic–recreational resources. Moreover, since the Yuan Dynasty, the development of numerous attractions—often centered on temples and Taoist monasteries—has provided a historical foundation for leisure and recreation. In terms of land-use potential, mountainous areas generally have greater potential than flat or gently sloped areas. Mountains are dominated by forests and grasslands, which can accommodate scenic–recreational functions while maintaining ecological and economic roles. In contrast, flat and gentle-slope areas are mainly cropland and orchards; given China’s high population and limited arable land and the strengthened national protection of farmland, cropland and orchards have lower compatibility with land-use conversion and recreational functions.
To further examine the relationship between outer-area green space and urban space (existing and planned residential land), we normalized the 13 s-level indicator scores and the overall score. We then defined three nested spatial extents: (i) within 1 km of existing and planned residential land, (ii) within 3 km of existing and planned residential land ②, and (iii) the entire outer-area extent. For each extent, we calculated area shares of green space across the score bands 0–0.3, 0.3–0.7, and 0.7–1.0 for each indicator and for the overall score (Table 8). The results remain relatively robust after increasing the weight of “accessibility potential” by 10%. The results show that, compared with the 1 km zone, the 3 km zone has a relatively higher share of green space with overall scores in the 0.7–1.0 band and is substantially higher than that of the entire outer-area extent. This suggests that embedding and developing scenic–recreational functions in green spaces within 3 km of existing and planned residential land could be highly effective.
Table 8.
Area proportion of green spaces within different score intervals across varying service radii.
In the overall evaluation (Figure 6), areas scoring 0.7–1.0 exhibit very high scenic–recreational capacity and can effectively substitute for planned-but-unbuilt inner-city parks in terms of service radius, accessibility, and recreational functions. These areas total 15,306 ha, far exceeding both the 5419.37 ha of existing built parks and the 7969.81 ha of planned-but-unbuilt parks within the built-up area. This indicates that as Kunming’s built-up area expanded within the Dianchi Basin, it has become increasingly integrated with the surrounding basin-ring mountains. With improved accessibility and enhanced landscape-ecological and recreational value, these mountains can provide a large-scale supply of green spaces that can be readily converted to park-like functions. We recommend incorporating these spaces into the planning, development, and management framework of urban park green space by drawing on policy directions that encourage (i) exploring mechanisms under which park green spaces are not necessarily counted within the urban construction land quota ③ and (ii) allowing parks adjacent to built-up areas that meet residents’ daily leisure and recreation needs to be included in official statistics ④. This would help unlock the ecological value of mountainous spaces in plateau cities. Areas scoring 0.3–0.7 show partial conversion potential, totaling 66,807 ha, and may be protected and utilized in a context-sensitive manner in combination with peri-urban rural resource endowments. Areas scoring 0–0.3 have limited conversion potential and are recommended to retain their original functions.
Figure 6.
Sub-indicator analysis for potential of ecological value conversion of green spaces outside urban areas.
4.5.2. Determining Target Indicators
- (1)
- Review of original targets
In the 1990s, during mid-urbanization structural adjustment, Kunming adopted the “network ecological structure” concept commonly used in plain cities and developed a networked, radial green-space pattern. Under such an “idealized” structure, the planned park green-space area tended to be high and optimistic. Accordingly, since 2008, Kunming set goals of attaining “National Eco-Garden City” status and achieving per capita park green space ≥ 12.5 m2 by 2020. These targets were among the most ambitious across provincial-capital-level cities and above at the time. However, by 2020, per capita park green space was only 9.32 m2 (calculated strictly based on urban construction land), falling short of expectations; by the end of 2024, the situation remained essentially unchanged.
- (2)
- Setting new targets
Based on the above analysis, plateau-constrained cities may adopt a more operational approach in planning and governance by defining per capita park green space = an inner-city component + an outer-area component, with the determination of the inner-city component being critical. For Kunming, within the built-up area, existing parks (5419.37 ha) and planned-but-unbuilt parks scoring 0.7–1.0 (2972.44 ha) constitute the core guaranteed supply of park green space. Planned-but-unbuilt parks scoring 0.3–0.7 (3423.83 ha) function as an important reserve. Considering the planned 2035 population for the built-up area, it is reasonable to set per capita park green space within the built-up area at ≥7 m2. Given the substantial potential outside the built-up area, the outer-area component may be guided and governed toward per capita park green space ≥ 10 m2, or even higher.
- (3)
- Reconfiguring the park green-space layout
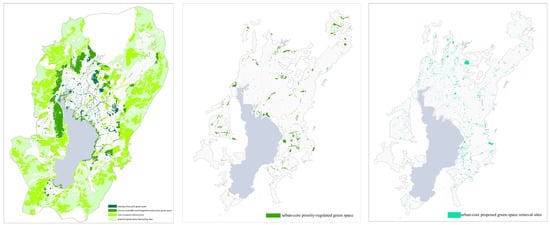
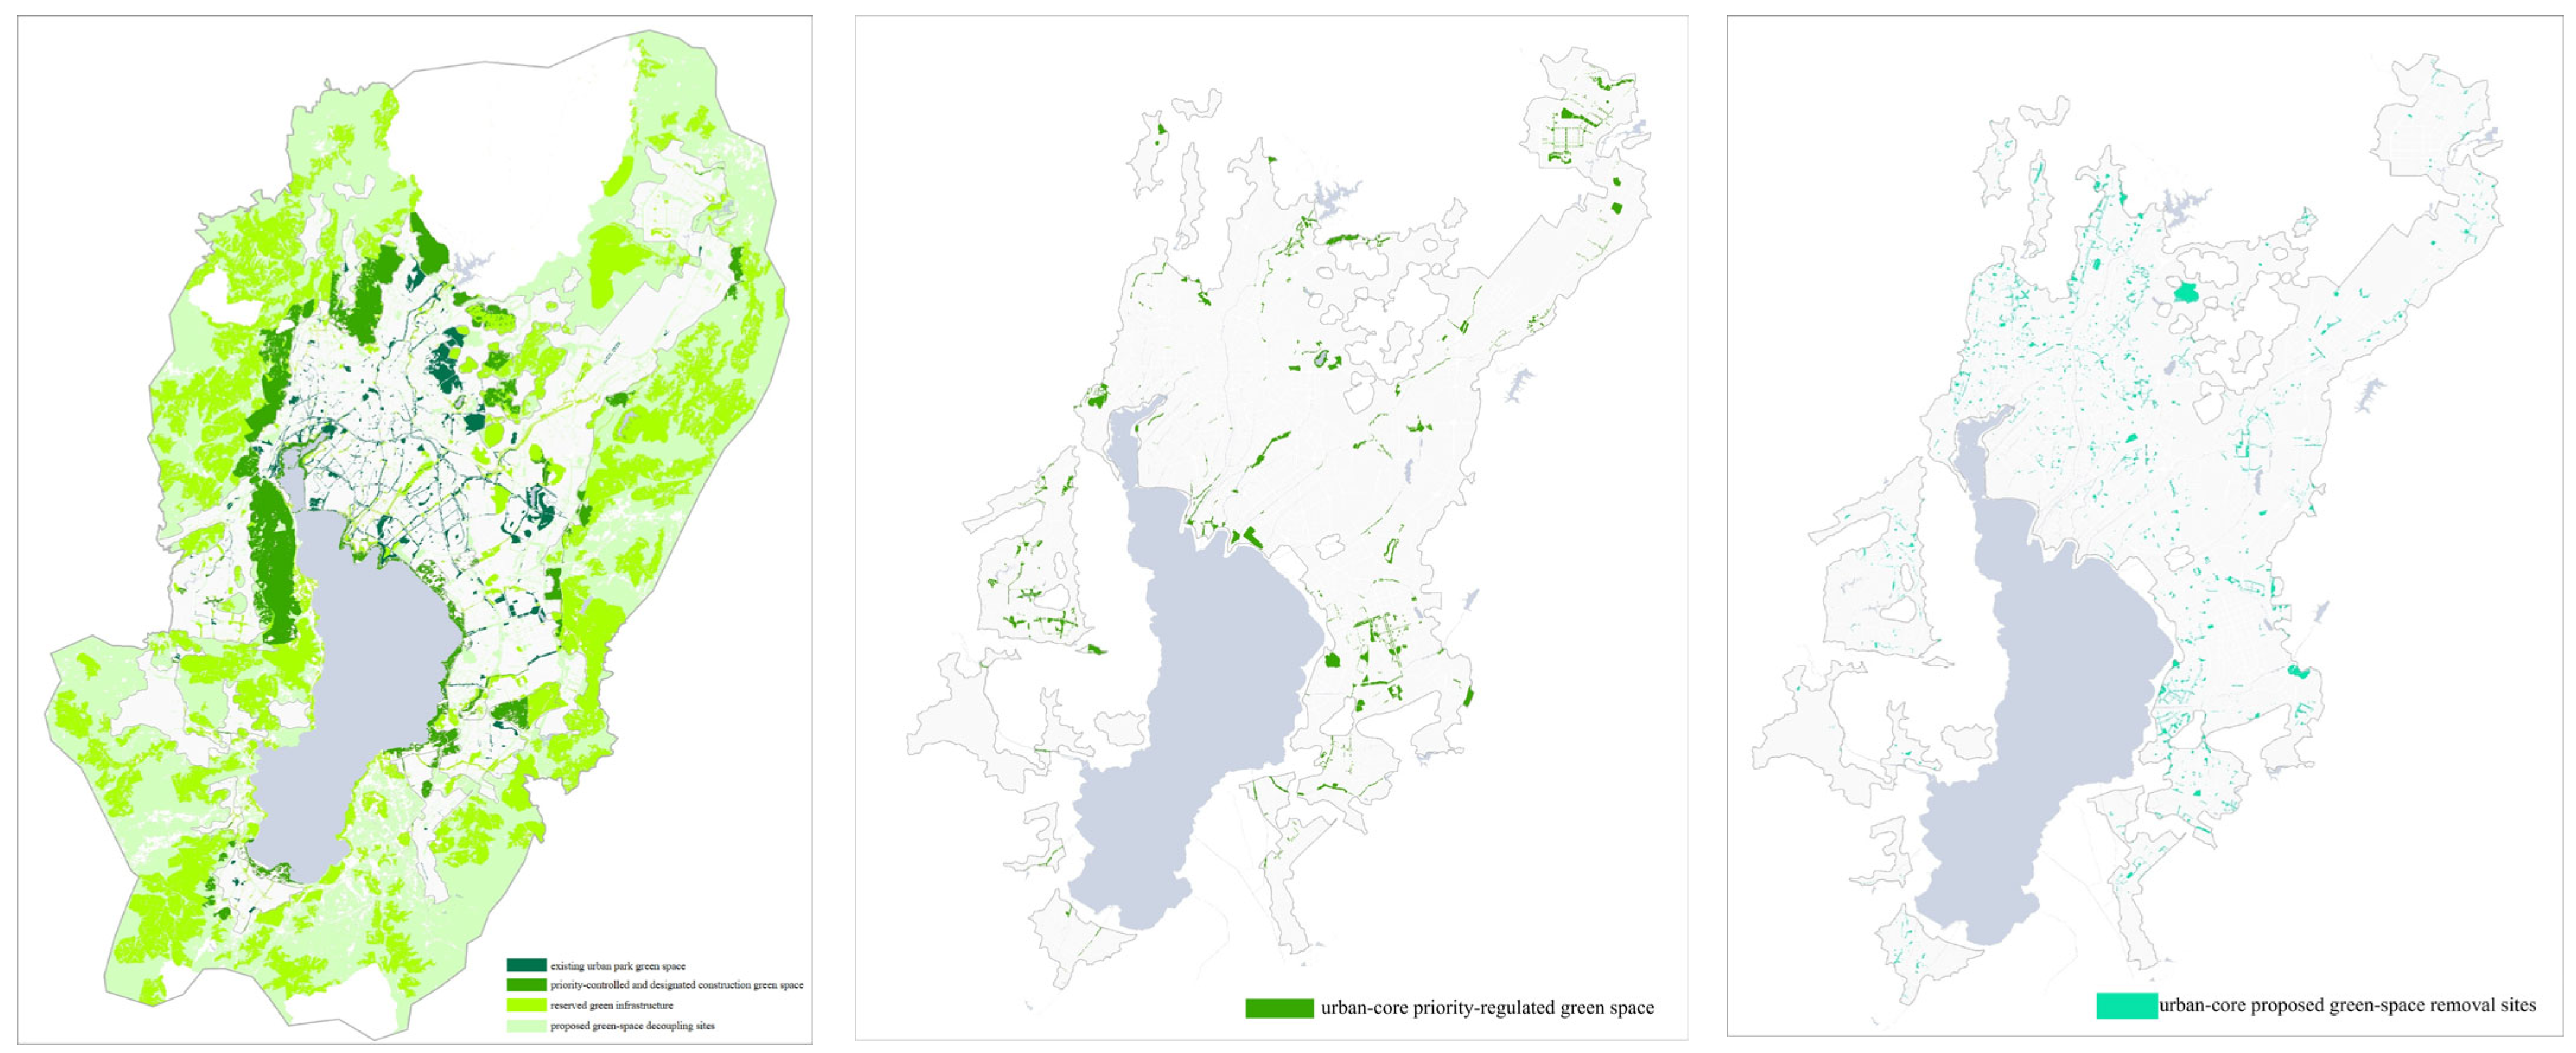
Building on the existing 5419.37 ha of built parks, we designate as “priority green spaces for control and development” the 2972.44 ha of planned-but-unbuilt inner-city parks scoring 0.7–1.0 and the 15,306 ha of outer-area green spaces scoring 0.7–1.0. These areas are reclassified as city-level control lines, with explicit rules for regulation and guided implementation. For originally planned-but-unbuilt inner-city parks scoring 0–0.3, we delineate areas “recommended for removal from statutory plans,” requiring that planning documents at all levels no longer designate or control them as park green space. For originally planned-but-unbuilt inner-city parks scoring 0.3–0.7, if detailed planning units can still meet life-circle provision requirements (typically per capita park green space ≥ 4 m2), they may also be considered for “recommended removal,”(Figure 7) and statutory plans would no longer designate or regulate them as park green space.
Figure 7.
Park green-space redistribution plan.
4.5.3. Target Decomposition and Policy Safeguards
We decompose the targets—per capita park green space ≥ 7 m2 within the built-up area and ≥10 m2 outside the built-up area—to the district level and further to regulatory detailed plans (Table 9). These targets will be operationalized through subsequent land conveyance and development activities, enabling iterative optimization and adjustment and gradually correcting unreasonable planning elements inherited from the mid-urbanization stage.
Table 9.
Overview of target decomposition across Kunming’s administrative districts.
In addition, for green spaces outside the built-up area, policy arrangements should relax the conventional constraint that urban green space must be classified as urban construction land (state-owned). Even on collectively owned land (without expropriation or conversion to state ownership), if a site can provide recreational functions within a defined accessibility range, it may be developed and managed as park green space.
5. Conclusions and Implications
5.1. Contributions and Innovations
Compared with prior studies, this paper emphasizes a three-dimensional reconstruction of spatial governance effectiveness, manifested in three aspects:
Shift in theoretical lens: We introduce “spatial governance effectiveness” to expand green-space evaluation beyond ecological functions toward a multi-dimensional framework incorporating implementation feasibility and distributional equity. This reveals the mismatch between “planning blueprints” and “geographic realities” in plateau-constrained cities and corrects indicator-only planning detached from implementation constraints.
Innovation in allocation mode: We propose a “three-dimensional allocation mode,” which synergizes “optimized adaptation within the built-up area” (removing low-efficiency planned sites) with “potential conversion outside the built-up area” (activating mountainous recreational value). This approach effectively addresses the severe scarcity of flatland resources in basin areas and contributes to urban sustainable development.
Correction in practical pathway: Using Kunming as a typical case, we develop a quantifiable and transferable toolkit for planning correction, offering highly actionable planning references for high-altitude, topographically constrained cities worldwide and providing scientific tools for formulating sustainable development policies.
5.2. Key Conclusions
Green-space allocation should differ fundamentally from that of plain cities. The path-dependent planning paradigm formed during mid-urbanization—largely inherited from plain-city logic—underestimates the substantial costs of achieving high green-space targets on scarce flat land. Therefore, plateau-constrained cities require a distinct allocation approach.
Peri-urban mountains are strategic green assets. Mountainous spaces around plateau cities should not be treated merely as “ecological barriers” to growth; instead, they should be reframed as strategic assets and competitive advantages for urban identity. By integrating greenways and active-mobility systems, cities can effectively leverage adjacent, mountain-dominated spaces—walkable in scale, coverable in service radius, and capable of carrying park functions—to convert ecological value into public benefits.
Mitigating human–land conflicts is the central criterion for spatial allocation. Through “co-evolution and symbiosis” between the city and its mountainous geographic substrate, plateau-constrained cities should intensify the use of scarce flat land within the built-up area to prioritize housing, public services, and industry, while systematically protecting and utilizing peri-urban mountains at high standards to meet residents’ demand for high-quality ecological recreation. This integrated approach can alleviate human–land conflicts and jointly advance ecological benefits, social equity, economic efficiency and sustainable development.
5.3. Limitations
This study focuses on spatial governance effectiveness; however, due to constraints in time and resources, it does not sufficiently address biodiversity outcomes and low-carbon/carbon-sequestration functions of park green space and other green spaces. Future work should extend the analysis through broader and more collaborative research.
5.4. Future Research Directions
Theoretical deepening toward quantitative evaluation models. Future research could develop a quantitative model of “overall land–space effectiveness” for plateau-constrained cities by integrating multiple objectives—ecosystem service value, public health promotion, land economic value, and social equity indices—into a unified framework, thereby providing a precise and comprehensive tool for evidence-based spatial planning decisions.
Technological innovation toward supporting technical standards. Research could develop planning techniques and policy toolkits adapted to plateau geographic characteristics, such as design guidelines/plans, supporting policies, and governance mechanisms for effectively utilizing agricultural/forestry spaces to support urban sustainable development.
Interdisciplinary integration to support spatial governance. Interdisciplinary studies spanning urban–rural planning, ecology, GIS, and public policy should be encouraged to maximize ecosystem service functions while maintaining the long-term health and stability of mountain ecosystems.
Notes:
- ①
- GLC_FCS30D dataset: A global 30 m land-cover time-series dynamic remote-sensing product (1985–2022) released in March 2024 by the team led by Liu Liangyun at the Aerospace Information Research Institute, Chinese Academy of Sciences; downloaded from the CAS data-sharing service system.
- ②
- According to China’s National Garden City Standard (2022 edition) [31] issued by the Ministry of Housing and Urban–Rural Development, the 1–3 km range is a common planning threshold for residents’ daily recreational accessibility. Scenic–recreational spaces within 1–3 km of residential land can effectively compensate for deficits in inner-city park green space.
- ③
- Source: Guiding Opinions of the General Office of the State Council on Scientific Greening (Guobanfa [2021] No. 19), China.
- ④
- Source: China’s National Garden City Standard (2022 edition), Ministry of Housing and Urban–Rural Development.
Author Contributions
Conceptualization, X.G. and H.B.; methodology, X.G.; software, X.G. and J.P.; validation, H.Y. and X.Y.; formal analysis, X.G. and X.Y.; investigation, X.G. and H.B.; resources, X.G. and X.D.; data curation, J.P. and H.Y.; writing—original draft preparation, X.G.; writing—review and editing, J.P. and X.D.; visualization, X.G. and J.P.; supervision, H.B. and F.T. All authors have read and agreed to the published version of the manuscript.
Funding
Supported by Yunnan Provincial Science and Technology Talent and Platform Program (Liu Jian Expert Workstation, Grant No.: 202305AF150126); Yunnan Provincial Department of Science and Technology—Basic Research Program (Grant No.: 202401CF070132).; Certification of International Science and Technology Specialists (Individual) in Yunnan Province for the Year 2025 (Grant No.: 202503AK140065).
Institutional Review Board Statement
Ethical review and approval were waived for this study by Institution Committee as per Article 32 of the Measures for the Ethical Review of Life Sciences and Medical Research Involving Humans, jointly issued by the National Health Commission, the Ministry of Education, the Ministry of Science and Technology, and the National Administration of Traditional Chinese Medicine of China.
Informed Consent Statement
Informed consent has been obtained from all research subjects.
Data Availability Statement
The dataset generated in this study is publicly available.
Conflicts of Interest
Authors Xueguo Guan and Junting Peng are employed by the company Kunming Urban Planning and Design Institute. The remaining authors declare that the research was conducted in the absence of any commercial or financial relationships that could be construed as a potential conflict of interest.
Appendix A
List of Expert Group Members
| Expert | Professional Title | Specialty | Affiliation |
| Expert 1 | Associate Professor | Built Environment Heritage | Affiliation 1 |
| Expert 2 | Senior Engineer (Associate Professor equivalent) | Landscape Architecture | Affiliation 2 |
| Expert 3 | Senior Engineer (Associate Professor equivalent) | Urban and Rural Planning | Affiliation 3 |
| Expert 4 | Senior Engineer (Professor equivalent) | Urban & Rural Planning; Conservation and Development of Special Resources | Affiliation 4 |
| Expert 5 | Senior Engineer (Associate Professor equivalent) | Urban and Rural Planning | Affiliation 5 |
| Expert 6 | Senior Engineer (Associate Professor equivalent) | Urban Design | Affiliation 6 |
| Expert 7 | Senior Engineer (Associate Professor equivalent) | Detailed Territorial Spatial Planning; Urban Green Space System Planning | Affiliation 7 |
| Expert 8 | Senior Engineer (Associate Professor equivalent) | Urban Planning; Landscape; 15 min Neighborhood/Life Circle | Affiliation 8 |
| Expert 9 | Senior Engineer (Associate Professor equivalent) | Urban Planning | Affiliation 9 |
| Expert 10 | Senior Engineer (Associate Professor equivalent) | Tourism Planning/Landscape & Recreation | Affiliation 10 |
| Expert 11 | Senior Engineer (Professor equivalent) | Landscape Architecture | Affiliation 11 |
| Expert 12 | Senior Engineer (Associate Professor equivalent) | Landscape Architecture | Affiliation 12 |
| Expert 13 | Lecturer | Protected Area Planning and Management | Affiliation 13 |
| Expert 14 | Associate Professor | Cultural Tourism/Landscape Architecture Planning and Design | Affiliation 14 |
| Expert 15 | Senior Engineer (Associate Professor equivalent) | Historic & Cultural Heritage; Urban Regeneration; Urban Design | Affiliation 15 |
Appendix B
Judgment Matrix of Primary Indicators for Adaptive Analysis of Originally Planned Urban Spaces.
| Ecological Importance | Service Demand | Implementation Feasibilit | |
| Ecological Importance | 1 | 2 | 2 |
| Service Demand | 1/2 | 1 | 1 |
| Implementation Feasibilit | 1/2 | 1 | 1 |
Judgment Matrix of Primary Indicators for Ecological Value Transformation Potential of Green Spaces outside Urban Areas.
| Accessibility Potential | Scenic Recreation Potential | Land Use Potential | |
| Accessibility Potential | 1 | 1 | 1 |
| Scenic Recreation Potential | 1 | 1 | 1 |
| Land Use Potential | 1 | 1 | 1 |
References
- Goddard, G.D. (Ed.) Land Use Competition: Ecological, Economic and Social Perspectives; Springer: Berlin/Heidelberg, Germany, 2018. [Google Scholar]
- McHarg, I.L. Design with Nature, 1st ed.; American Museum of Natural History, The Natural History Press: New York, NY, USA, 1969; p. viii+197. [Google Scholar]
- Forman, R.T.T. Land Mosaics: The Ecology of Landscapes and Regions; Cambridge University Press: Cambridge, UK, 1995; p. xx+632. [Google Scholar]
- Zhou, G.; Chen, D. Simulating the impacts of planning policies on the urban form of a mountain city: A case study of central Chongqing, China. Environ. Plan. B Urban Anal. City Sci. 2019, 46, 1291–1310. [Google Scholar]
- Anees, M.M.; Banzhaf, E.; Wang, J.; Joshi, P.K. Quality index approach for analysis of urban green infrastructure in Himalayan cities. Land 2023, 12, 279. [Google Scholar] [CrossRef] [Scilit]
- Zhou, X.; Wanghe, K.; Jiang, H.; Ahmad, S.; Zhang, D. Construction of green infrastructure networks based on the temporal and spatial variation characteristics of multiple ecosystem services in a city on the Tibetan Plateau: A case study in Xining, China. Ecol. Indic. 2024, 163, 112089. [Google Scholar] [CrossRef] [Scilit]
- Yu, K. Security patterns and surface model in landscape ecological planning. Landsc. Urban Plan. 1996, 36, 1–17. [Google Scholar] [CrossRef] [Scilit]
- Xu, L.; Huang, Q. Integrating ecosystem services and ecological security into land use planning: A case study of the Yangtze River Delta, China. Sci. Total Environ. 2021, 757, 143932. [Google Scholar]
- Liu, Y.; Li, T.; Zhao, W. Constructing and optimizing ecological security patterns in a rapidly urbanizing region: A case study in the central Yunnan Province, China. Ecol. Indic. 2022, 136, 108604. [Google Scholar]
- Wu, C.; Li, J.; Wang, C.; Song, C.; Chen, Y. Assessing the impacts of 3D urban form on urban heat island effect: A case study of Chengdu, China. Sustain. Cities Soc. 2023, 88, 104283. [Google Scholar]
- Lu, Y.; Chen, L. The association between street-scale urban design and walking behaviors: A systematic review. Health Place 2021, 68, 102525. [Google Scholar]
- Curtis, C.; Scheurer, J. Planning for sustainable accessibility: Developing tools to aid discussion and decision-making. Prog. Plan. 2010, 74, 53–106. [Google Scholar] [CrossRef] [Scilit]
- Harvey, D. Social Justice and the City; University of Georgia Press: Athens, GA, USA, 1973; p. 336. [Google Scholar]
- Zhao, P.; Li, S. Examining the relationship between built environment and metro ridership: A case study in Beijing using GWR. J. Transp. Geogr. 2022, 98, 103257. [Google Scholar]
- Li, Y.; Zheng, S. Transit-oriented development, land value capture, and housing affordability in a mountainous city: Lessons from Chongqing, China. Land Use Policy 2023, 124, 106439. [Google Scholar]
- Angelo, H.; Vormann, B. How the mountain became urban: The spatial politics of land use planning in a Southern California city-region. Urban Stud. 2018, 55, 2853–2868. [Google Scholar]
- Cohen-Shacham, E.; Walters, G.; Janzen, C.; Maginnis, S. (Eds.) Nature-Based Solutions to Address Global Societal Challenges; IUCN: Gland, Switzerland, 2016; p. xii+97. [Google Scholar]
- Chen, Y.; Zhou, S. Dynamic accessibility to urban parks under different travel modes: A case study in Shenzhen, China. J. Transp. Geogr. 2022, 98, 103242. [Google Scholar]
- Li, H.; Zhang, X. The unequal distribution of street greenery and its association with walkability in highly dense urban areas: A case study in Shanghai. Urban For. Urban Green. 2021, 64, 127299. [Google Scholar]
- Allan, P.; Bryant, M. The resilience of a city: A conceptual framework for the integration of resilience and sustainability in planning. Cities 2011, 28, 547–553. [Google Scholar]
- Liu, H.; Jia, H. Planning and implementation of sponge city projects in China: A review of research and practice. J. Environ. Manag. 2022, 304, 114310. [Google Scholar]
- Wang, H.; Qin, H. A comprehensive review on the integration of green and gray infrastructure for sustainable stormwater management. Sci. Total Environ. 2023, 857, 159625. [Google Scholar]
- Zhang, X.H.; Chen, X.J.; Zhang, G. Research on urban renewal strategies in alpine cities based on ecological resource development: A case study of Nagqu City, Tibet Autonomous Region. Urban Archit. Space 2022, 29, 21–24. [Google Scholar]
- Zhang, J.R.; Mi, M.W.D.; Cheng, L.; Qian, L.Y. Spatiotemporal coupling analysis of ecological service value and human activities in the central urban area of Lhasa. Landsc. Archit. 2025, 32, 86–95. [Google Scholar] [CrossRef] [Scilit]
- Zhang, J.; Qian, L.; Wang, G.; Wangdwei, M.; Zhu, Q. Resilience planning for urban ecosystems in the Himalayas: Ecosystem service value decline and network vulnerabilities in Lhasa. Ecol. Front. 2026, 46, 227–241. [Google Scholar] [CrossRef] [Scilit]
- Li, H.; Liang, F.; Du, J.; Liu, Y.; Wang, J.; Xu, Q.; Tang, L.; Zhou, X.; Sheng, H.; Chen, Y.; et al. Research on resilience evaluation and prediction of urban ecosystems in plateau and mountainous area: A case study of Kunming city. Sustainability 2025, 17, 5515. [Google Scholar] [CrossRef] [Scilit]
- Mahajan, S.; Argota Sánchez-Vaquerizo, J.; Mahajan, S. Not your mean green: Beyond averages in mapping socio-spatial inequities in urban greenery for smart cities. EPJ Data Sci. 2026, 15, 8. [Google Scholar]
- Zambrano, J.; da Fonseca, E.L. Neighborhood variations in urban green cover patterns in Bogotá (Colombia) estimated by NICFI-Planet images. Int. Arch. Photogramm. Remote Sens. Spat. Inf. Sci. 2024, XLVIII-4-2024, 315–322. [Google Scholar] [CrossRef] [Scilit]
- Li, Y.; Zhao, S.; Jin, A.; Nie, Z.; Li, Y. Assessment and spatial optimization of cultural ecosystem services in the central urban area of Lhasa. Land 2025, 14, 1722. [Google Scholar] [CrossRef] [Scilit]
- GB/T51346-2019; Urban Green Space Planning Standard. Ministry of Housing and Urban-Rural Development of the People’s Republic of China: Beijing, China, 2019.
- National Garden City Selection Standard; Ministry of Housing and Urban-Rural Development of the People’s Republic of China: Beijing, China, 2022.
- Li, Z.Y.; Chen, N.X.; Pei, Y.L.; Chen, T.; Wang, H.; Liu, M. Spatial pattern evolution and driving mechanisms of urban agglomerations in the plateau-mountain area of Central Yunnan. Sci. Technol. Eng. 2022, 22, 12579–12589. [Google Scholar]

Disclaimer/Publisher’s Note: The statements, opinions and data contained in all publications are solely those of the individual author(s) and contributor(s) and not of MDPI and/or the editor(s). MDPI and/or the editor(s) disclaim responsibility for any injury to people or property resulting from any ideas, methods, instructions or products referred to in the content. |
© 2026 by the authors. Licensee MDPI, Basel, Switzerland. This article is an open access article distributed under the terms and conditions of the Creative Commons Attribution (CC BY) license.