


Abstract
Agriculture in dryland regions faces increasing pressure from climate variability, water scarcity, and competing urban and environmental demands. A recent basin-wide technical analysis for the Rio Grande/Rio Bravo in the United States of America (USA) and Mexico shows that consumptive water use in the river system overall is on an unsustainable path. The Middle Rio Grande Basin (MRGB) of central New Mexico (USA) exemplifies these sustainability challenges, where irrigated agriculture persists despite low precipitation, high evaporative demand, and prolonged drought. This study provides analytical spatial description of irrigated agriculture in the MRGB, examining farm size distribution, crop composition, groundwater access, and consumptive water use measured by evapotranspiration (ET) and effective ET. Using 2021 remotely sensed crops and ET data, groundwater well records, and GIS-based aggregation to the irrigator farm level, the analysis reveals a highly fragmented agricultural landscape dominated numerically by micro-scale and small farms, which together account for 55.9% of total agricultural ET. Alfalfa and other hay crops occupy nearly three-quarters of irrigated acreage and consume 74% of total ET, reflecting the prevalence of forage production. Groundwater access is highly uneven, with most wells concentrated among large farms, creating resilient disparities. The findings highlight that consumptive agricultural water use in the MRGB is diffuse rather than concentrated: non-commercial farms (<12 hectares) account for 55.9% of basin-wide ET, while commercial farms contribute only 14.4% despite occupying about one-fifth of irrigated land. This complicates water conservation efforts. Resilient management strategies must therefore engage thousands of small, largely non-commercial irrigators through mechanisms that recognize both hydrological and spatial realities. The study provides an empirical basis for designing sustainable irrigation and water-management strategies in dryland agricultural systems facing increasing climatic and institutional pressures.
1. Introduction
Irrigated agriculture in dryland regions faces increasing pressure from climate change, water scarcity, and competing land and water demands [1,2,3]. Rising temperatures increase evapotranspiration (ET), while declining and more variable precipitation reduces surface water reliability, intensifying dependence on irrigation [4,5]. In river-dependent agricultural systems, these forces heighten trade-offs between food production, ecosystem integrity, and urban water security, making basin-scale assessments of agricultural water use increasingly critical for water planning [6,7,8]. A recent basin-wide technical analysis for the Rio Grande/Rio Bravo in the United States and Mexico shows that consumptive water use in the river system overall is on an unsustainable path [9]. Focusing on the portion of the Rio Grande running through the state of New Mexico, it has recently been estimated that 85% of consumptive use (direct and indirect) is overconsumption, or, put differently, unsustainable going forward.
The Middle Rio Grande Basin (MRGB) of central New Mexico (USA) exemplifies these sustainability challenges. Situated within an arid to semi-arid environment, the basin supports a narrow ribbon of irrigated agriculture along the Rio Grande, surrounded by desert and rangelands. Despite rapid urbanization and declining agricultural employment, irrigated farming remains the dominant user of surface water in the basin, accounting for approximately 69% of total withdrawals (86.9% excluding Bernalillo County) [10]. As a result, agricultural water use continues to play a central role in regional water allocation, interstate compact compliance, and environmental flow management.
Notably, it is estimated that over the period of 2000–2019, there was a reduction of 28% of irrigated croplands for the entire Rio Grande basin in NM [9]. This corresponds roughly to what has been observed in the MRGB in NM; if we take the average of irrigated land from the combined USDA Census of Agriculture for 1992 and 1997 and compare that with the average from the combined Censuses for 2017 and 2022, then we observe a 25% decline in irrigated acres [11]. Despite the downward trend in irrigated lands, the unsustainable overconsumption is so significant that reservoir and groundwater storage trends are all down [9].
With this trend in unsustainable water use, it is important that we drill down into the multi-dimensional mix of MRGB-irrigated agriculture and understand the distinct sub-sectors. Prescribing sustainable policy actions may require tailoring across different types of irrigators, who may have different abilities to adapt (e.g., capitalization to switch to different crops or irrigation technologies, or ability to deficit irrigate) or willingness to respond to conservation incentives (e.g., payment amounts for voluntary fallowing programs).
To start, from an economic perspective, agriculture contributes only a very small share to regional gross domestic products. In 2025, agriculture, forestry, fishing, and hunting accounted for 0.18% and 0.20% of GDP in Valencia and Socorro Counties, respectively, while accounting for 0.10% and 0.12% of GDP in the more urban counties of Bernalillo and Sandoval [12]. At the basin scale, the sector represented roughly 0.12% of total GDP across MRGB counties [10]. Yet within the agricultural sector, production is highly concentrated: dairy and forage crops, particularly alfalfa, dominate farm revenues locally and statewide, accounting for roughly 85% of New Mexico’s total agricultural value [11,13]. These irrigated feed systems support large livestock and dairy operations, but they also rely heavily on scarce surface and groundwater resources.
Beyond market values, agriculture in the MRGB provides substantial cultural, environmental, and landscape benefits. Pueblo and Hispanic farming communities have maintained acequia-based irrigation systems for centuries, shaping a land-based culture that links agricultural practice to identity, heritage, and stewardship [14]. Irrigated fields create green corridors and cooler microclimates within the desert valley, supporting biodiversity, wildlife habitat, and recreational and aesthetic amenities [14]. These non-market benefits mean that agriculture continues to be socially valued even when its direct economic contribution is small, reinforcing the importance of understanding how water and land use are distributed across different types of irrigators.
Despite the centrality of agriculture to basin-scale water management, there remains a limited, spatially explicit analytical understanding of how irrigated land, crop types, groundwater access, and water consumption are distributed across different farm sizes and production systems within the MRGB. Most previous studies have focused either on basin-wide water balances or on specific crops and institutions, rather than on the heterogeneity of irrigator farms that collectively determine agricultural water demand [6,8,14]. In particular, little is known empirically about how small, non-commercial irrigator farms compare with larger commercial operations in terms of ET, effective water use, and access to groundwater.
This study addresses that gap by providing a spatially explicit descriptive analysis of irrigated agriculture and water use across the MRGB. Using geospatial data from CropScape, OpenET, groundwater well records, and climate archives, the analysis maps crop patterns, irrigator farm sizes, groundwater access, and both total and effective ET. An “irrigator farm” is defined as a distinct parcel or aggregation of parcels actively managed by an irrigator for crop production through the application of irrigation water and serves as the unit of analysis in this study.
The objectives of this paper are threefold. The first objective is to analytically characterize the spatial distribution of irrigated land, crop types, and irrigator farm sizes in the MRGB. The second objective is to examine patterns of groundwater access across farm types and crop categories. The third objective is to quantify total and effective evapotranspiration across commercial and non-commercial irrigator farms.
This study is structured around three empirical research questions: (RQ1) How is consumptive agricultural water use distributed across irrigator farm sizes in the MRGB? (RQ2) How does crop composition shape basin-scale evapotranspiration patterns? (RQ3) How is groundwater access distributed across irrigator farms, and how does this relate to water-use intensity and drought resilience? Based on prior irrigation and dryland agriculture literature, we hypothesize that (H1) non-commercial irrigator farms dominate numerically but not individually in water use, (H2) evapotranspiration is highly concentrated in forage systems, and (H3) groundwater access is disproportionately concentrated among larger farms.
By linking spatial land-use data with consumptive water-use metrics, this study provides a basin-scale empirical foundation for understanding how agricultural water demand is structured in a dryland river system. The results inform long-term-oriented policy debates on sustainability, water conservation, irrigation management, and the role of smallholder and commercial agriculture under increasing climatic and institutional constraints. Understanding how agricultural water use is structured across different farm types is essential for designing sustainability-oriented water-management policies in dryland river basins.
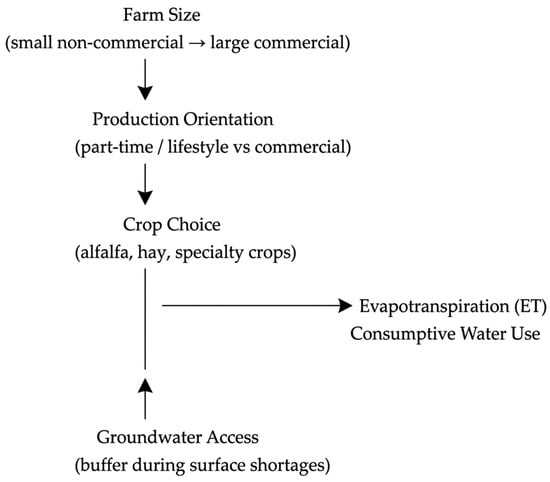
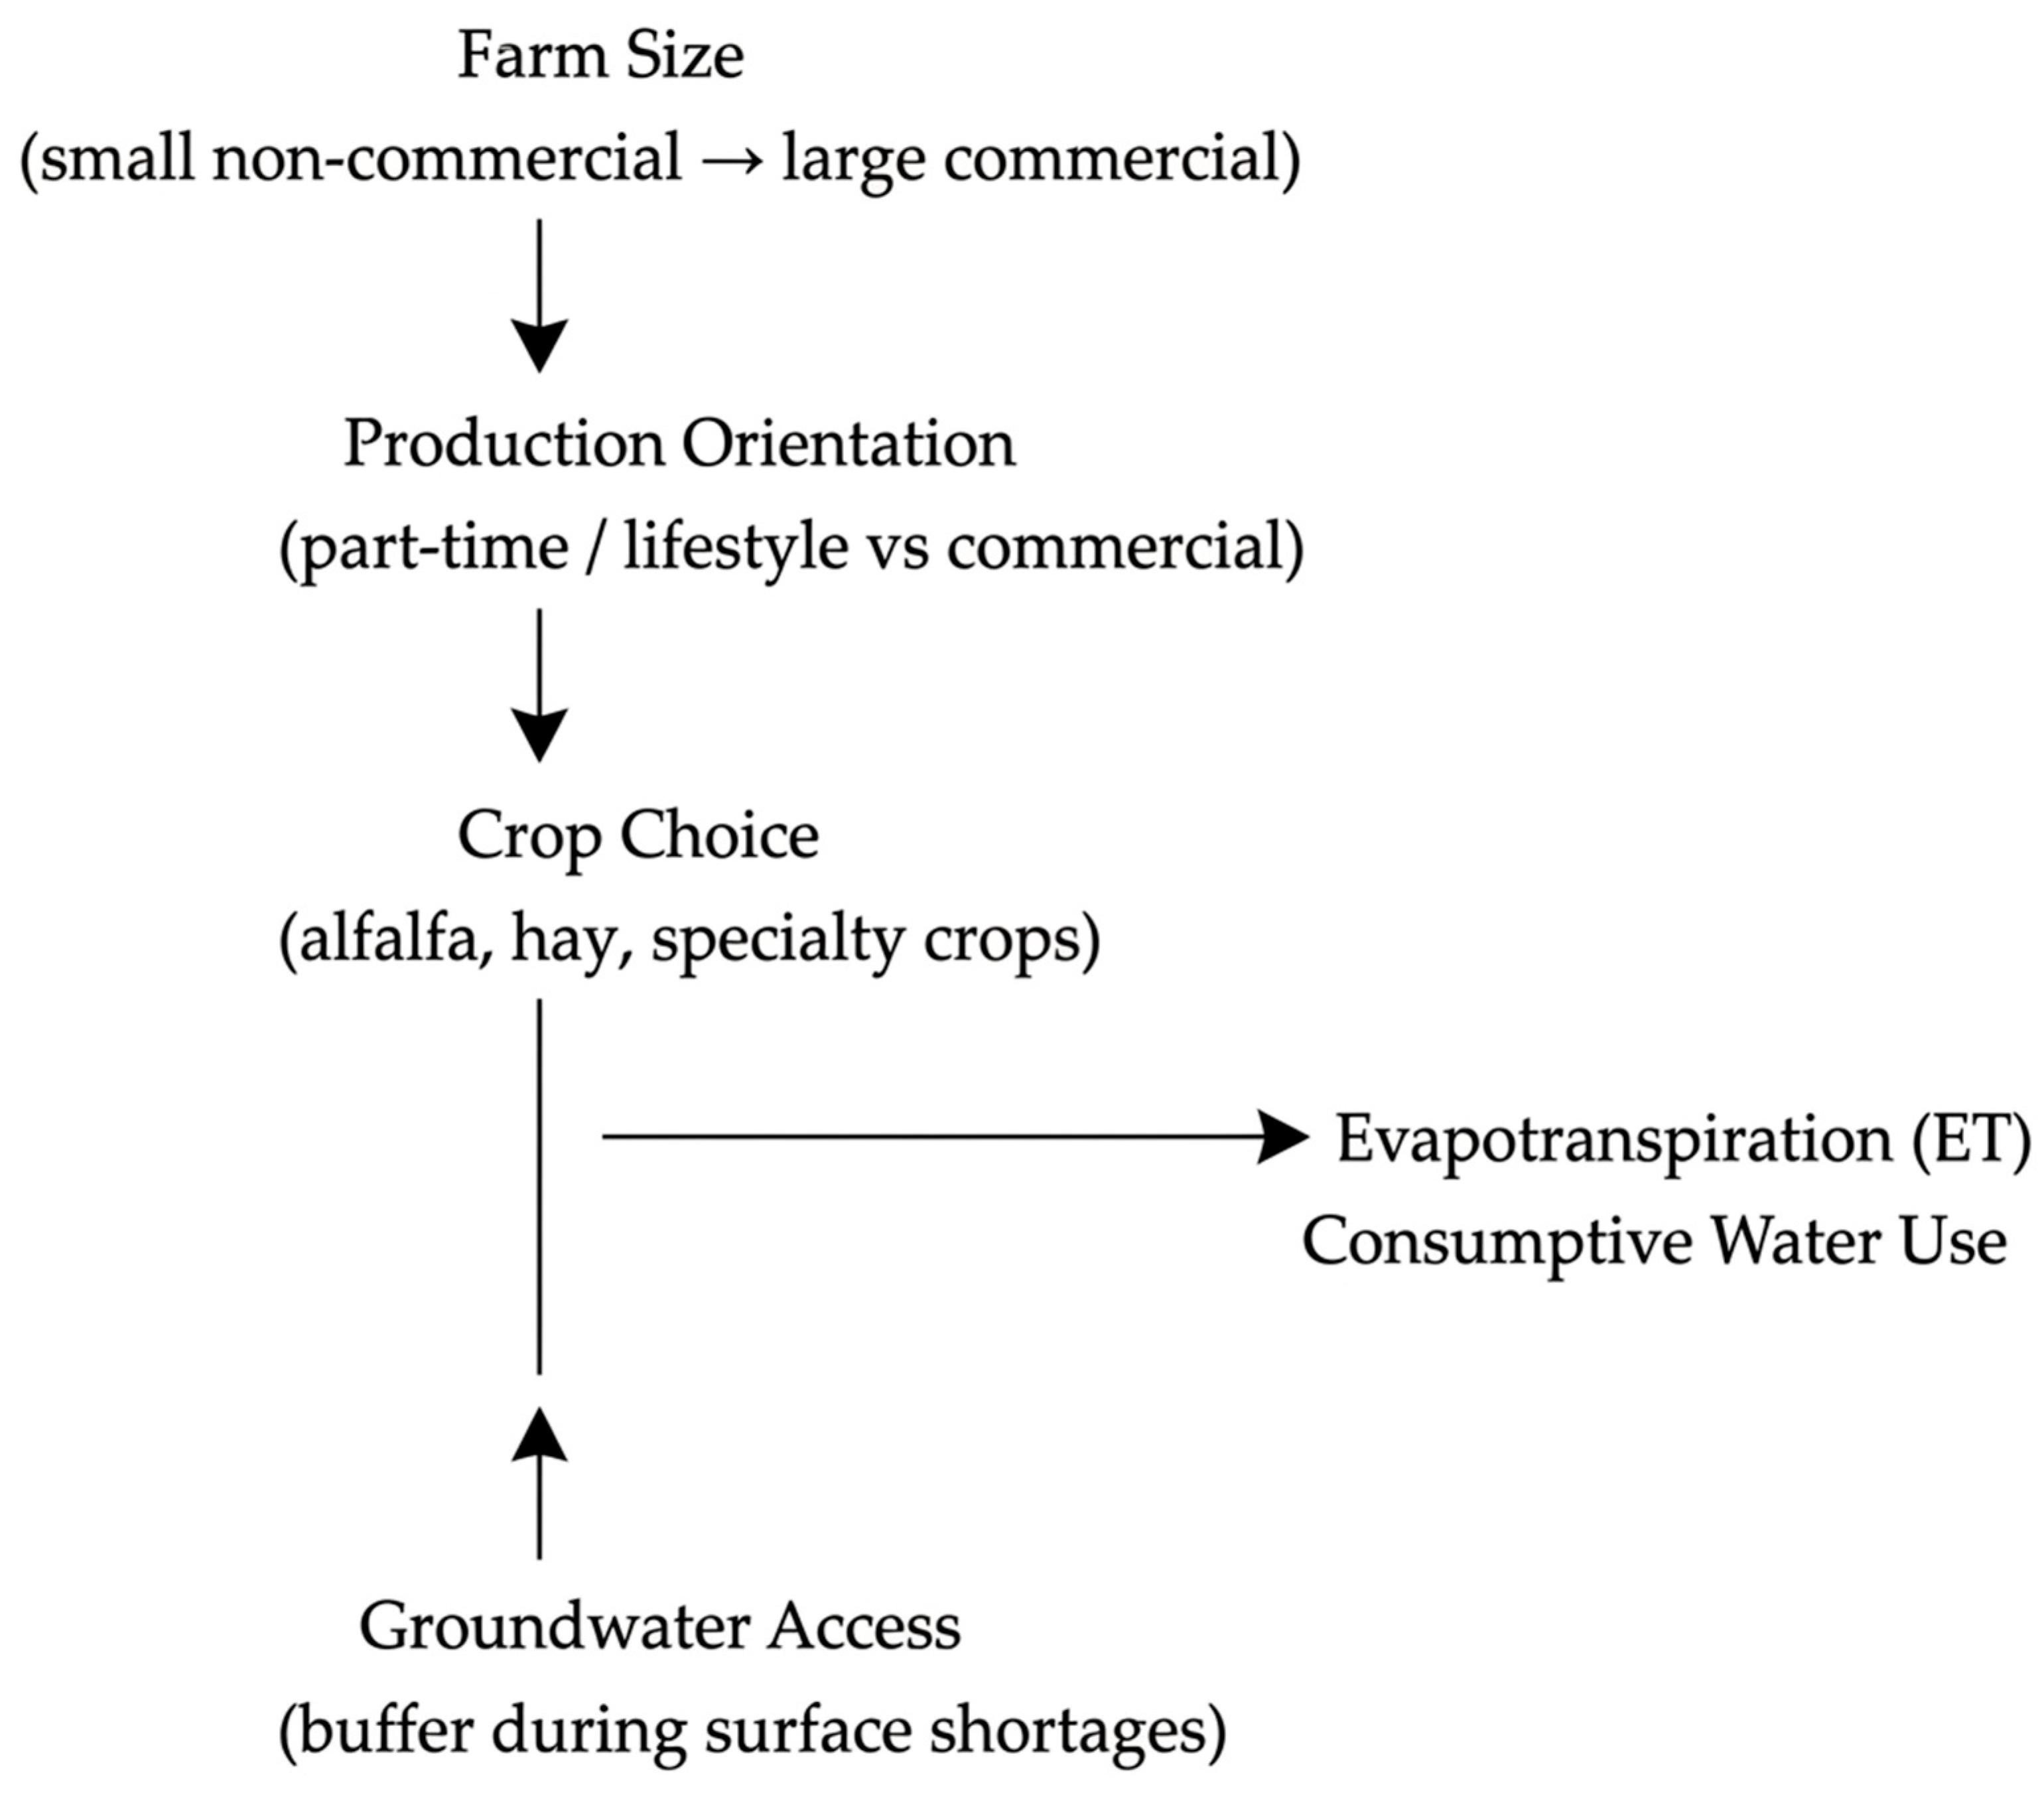
Conceptually, irrigator farm size, crop choice, and groundwater access jointly shape agricultural water demand in the basin. Farm size influences production orientation, capital availability, and management intensity. Crop choice determines crop water requirements and irrigation duration, particularly in perennial forage systems such as alfalfa. Groundwater access provides buffering capacity during surface-water shortages, allowing some farms to maintain irrigation during drought conditions. These factors jointly shape patterns of evapotranspiration and consumptive water use across irrigator farms, as shown in Figure 1. This conceptual framework underlies the research questions and descriptive hypotheses examined in this study. This also motivates the analysis linking spatial farm structure, crop composition, and groundwater access to patterns of consumptive water use in the Middle Rio Grande Basin.
Figure 1.
Conceptual framework linking farm structure to consumptive agricultural water use in the Middle Rio Grande Basin.
2. Background on the Middle Rio Grande Basin
As part of the nearly 2000-mile-long Rio Grande/Rio Bravo system in the United States (US) and Mexico, the MRGB in the US state of New Mexico (NM) is a roughly 150-mile-long river valley flowing north to south through four counties (Sandoval, Bernalillo, Valencia, and Socorro). This river reach includes the greater Albuquerque, NM metropolitan area, with a total population of nearly one million people, with roughly 25 percent living on the river valley bottom lands. Despite the presence of a large metropolitan area, irrigated agriculture accounts for the super majority of freshwater withdrawals and is increasingly exposed to drought, climate variability, and competing demands for limited surface water supplies [10], exceeding 95% in two of the four most rural counties (Valencia and Socorro).
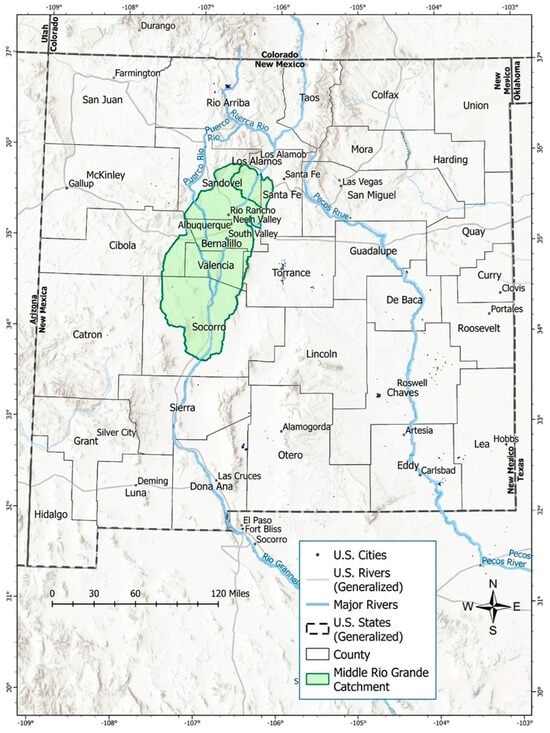
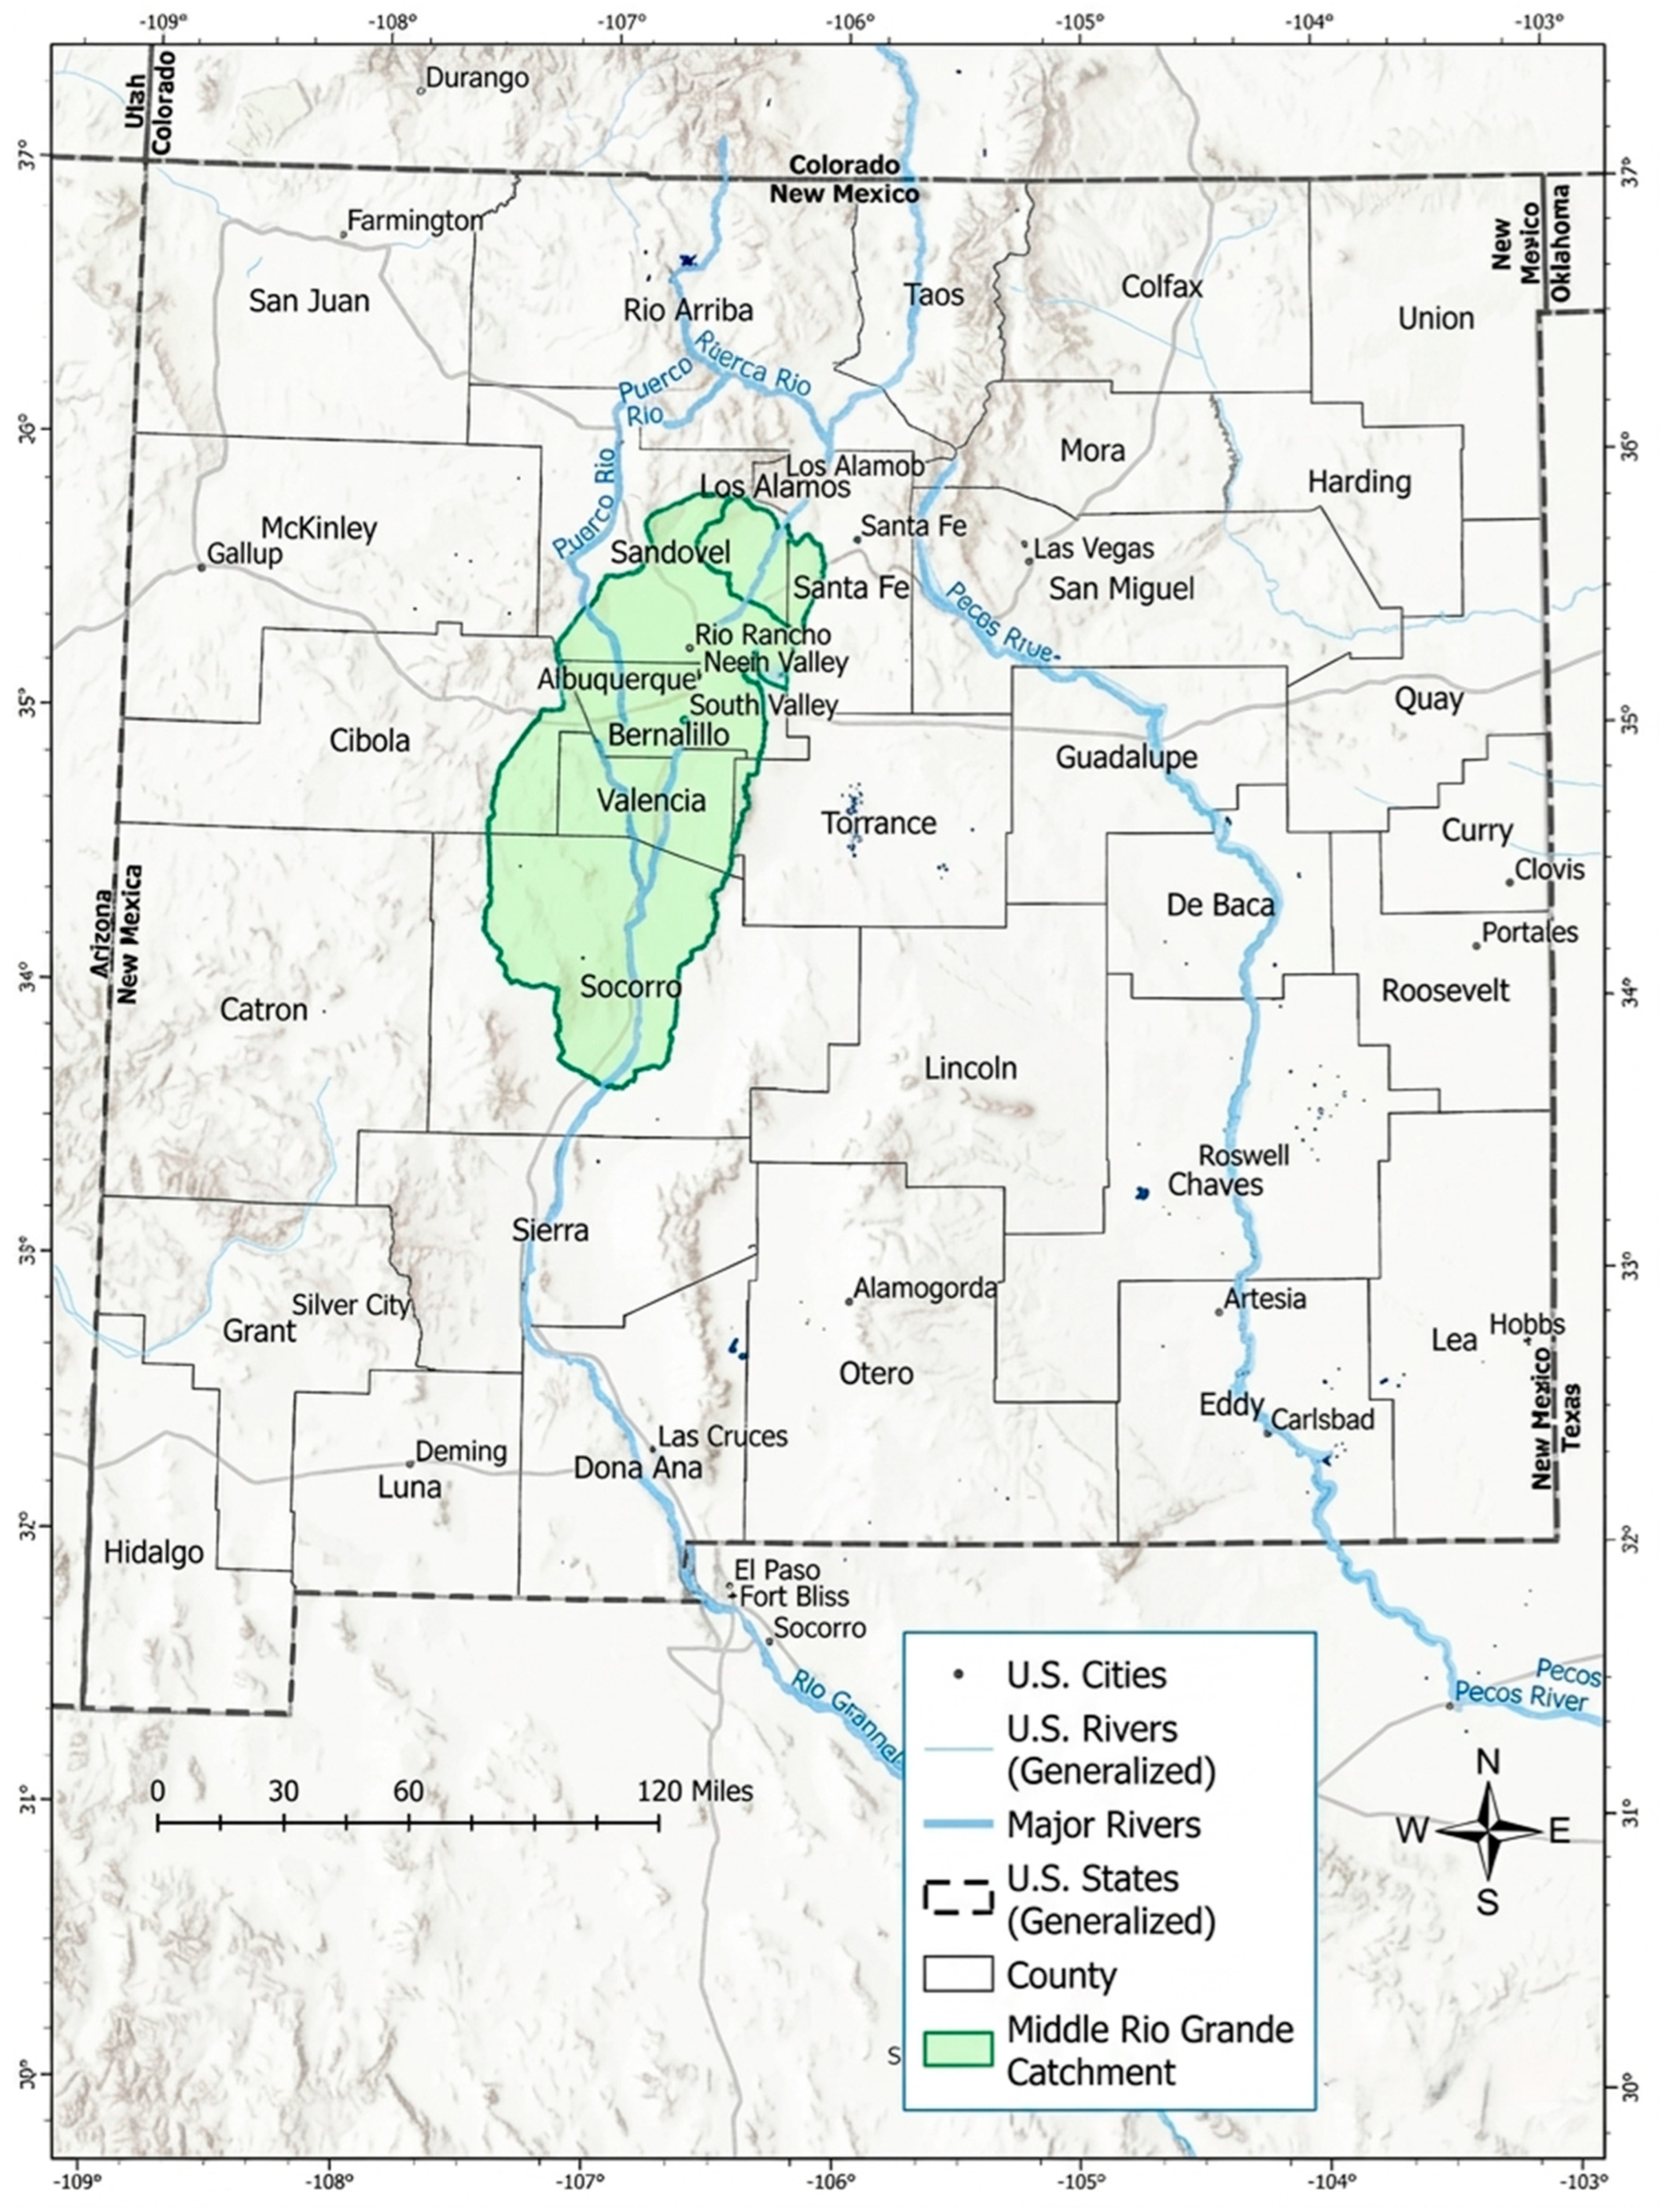
The MRGB in central New Mexico focuses on the irrigated agricultural lands along the Rio Grande from Cochiti Reservoir in the north to the San Acacia/Elephant Butte area in the south [6]. This area corresponds to the service area of the Middle Rio Grande Conservancy District (MRGCD) and adjacent farming communities. Extending from Cochiti Lake downstream to San Acacia and bounded by desert uplands on both sides, the basin forms a narrow alluvial valley [15], with the valley floor often only a few miles wide. Valley floor elevations range from approximately 4500 to 5000 feet, and mean annual precipitation is generally below 250 mm (9.8 inches), reinforcing the basin’s reliance on irrigation for crop viability [5]. Figure 2 shows MRGB.
Figure 2.
Map of New Mexico showing the Middle Rio Grande Basin (MRGB).
The physical environment of the MRGB strongly constrains agricultural continuity. Annual precipitation on the valley floor averages only 190–250 mm, with roughly half falling during the summer monsoon season [16]. Potential evapotranspiration exceeds precipitation, making irrigation indispensable for nearly all crop production [16]. Recurrent drought further compounds these constraints: between 2000 and 2025, the basin experienced extreme to exceptional drought conditions in most years, and from 2020 to 2023, nearly 80% of New Mexico was classified under severe to exceptional drought [17,18]. These climatic pressures directly reduce Rio Grande streamflow and increase reliance on stored surface water and groundwater pumping.
Soils and landforms further restrict farming to the Rio Grande floodplain, where deep alluvial soils support irrigated cropping, while surrounding mesas and uplands are largely unsuitable for cultivation. This produces a highly spatially concentrated agricultural landscape embedded within the riparian bosque, one of the world’s longest cottonwood forests.
Water management to these lands is governed by a multi-purpose, public (state) corporation known as the Middle Rio Grande Conservancy District (MRGCD), which manages irrigation diversions, but also provides flood protection and river control in the MRGB [19]. The MRGCD operates a complex network of diversion dams, canals, and drains designed to both supply irrigation water and control shallow groundwater and salinity [20]. Although groundwater provides a supplemental supply for many farms, pumping is constrained by urban demands (managed by various municipal water providers), declining aquifer levels, and interstate and intrastate water agreements between Colorado (CO), New Mexico (NM), and Texas (TX) known as the Rio Grande Compact [16,21].
The northern half of the middle Rio Grande remains home to six different sovereign Native American Pueblos, irrigating on their traditional lands with what are referred to as “prior and paramount” water rights. Such rights were protected as part of the creation in the 1920s of the MRGCD [19].
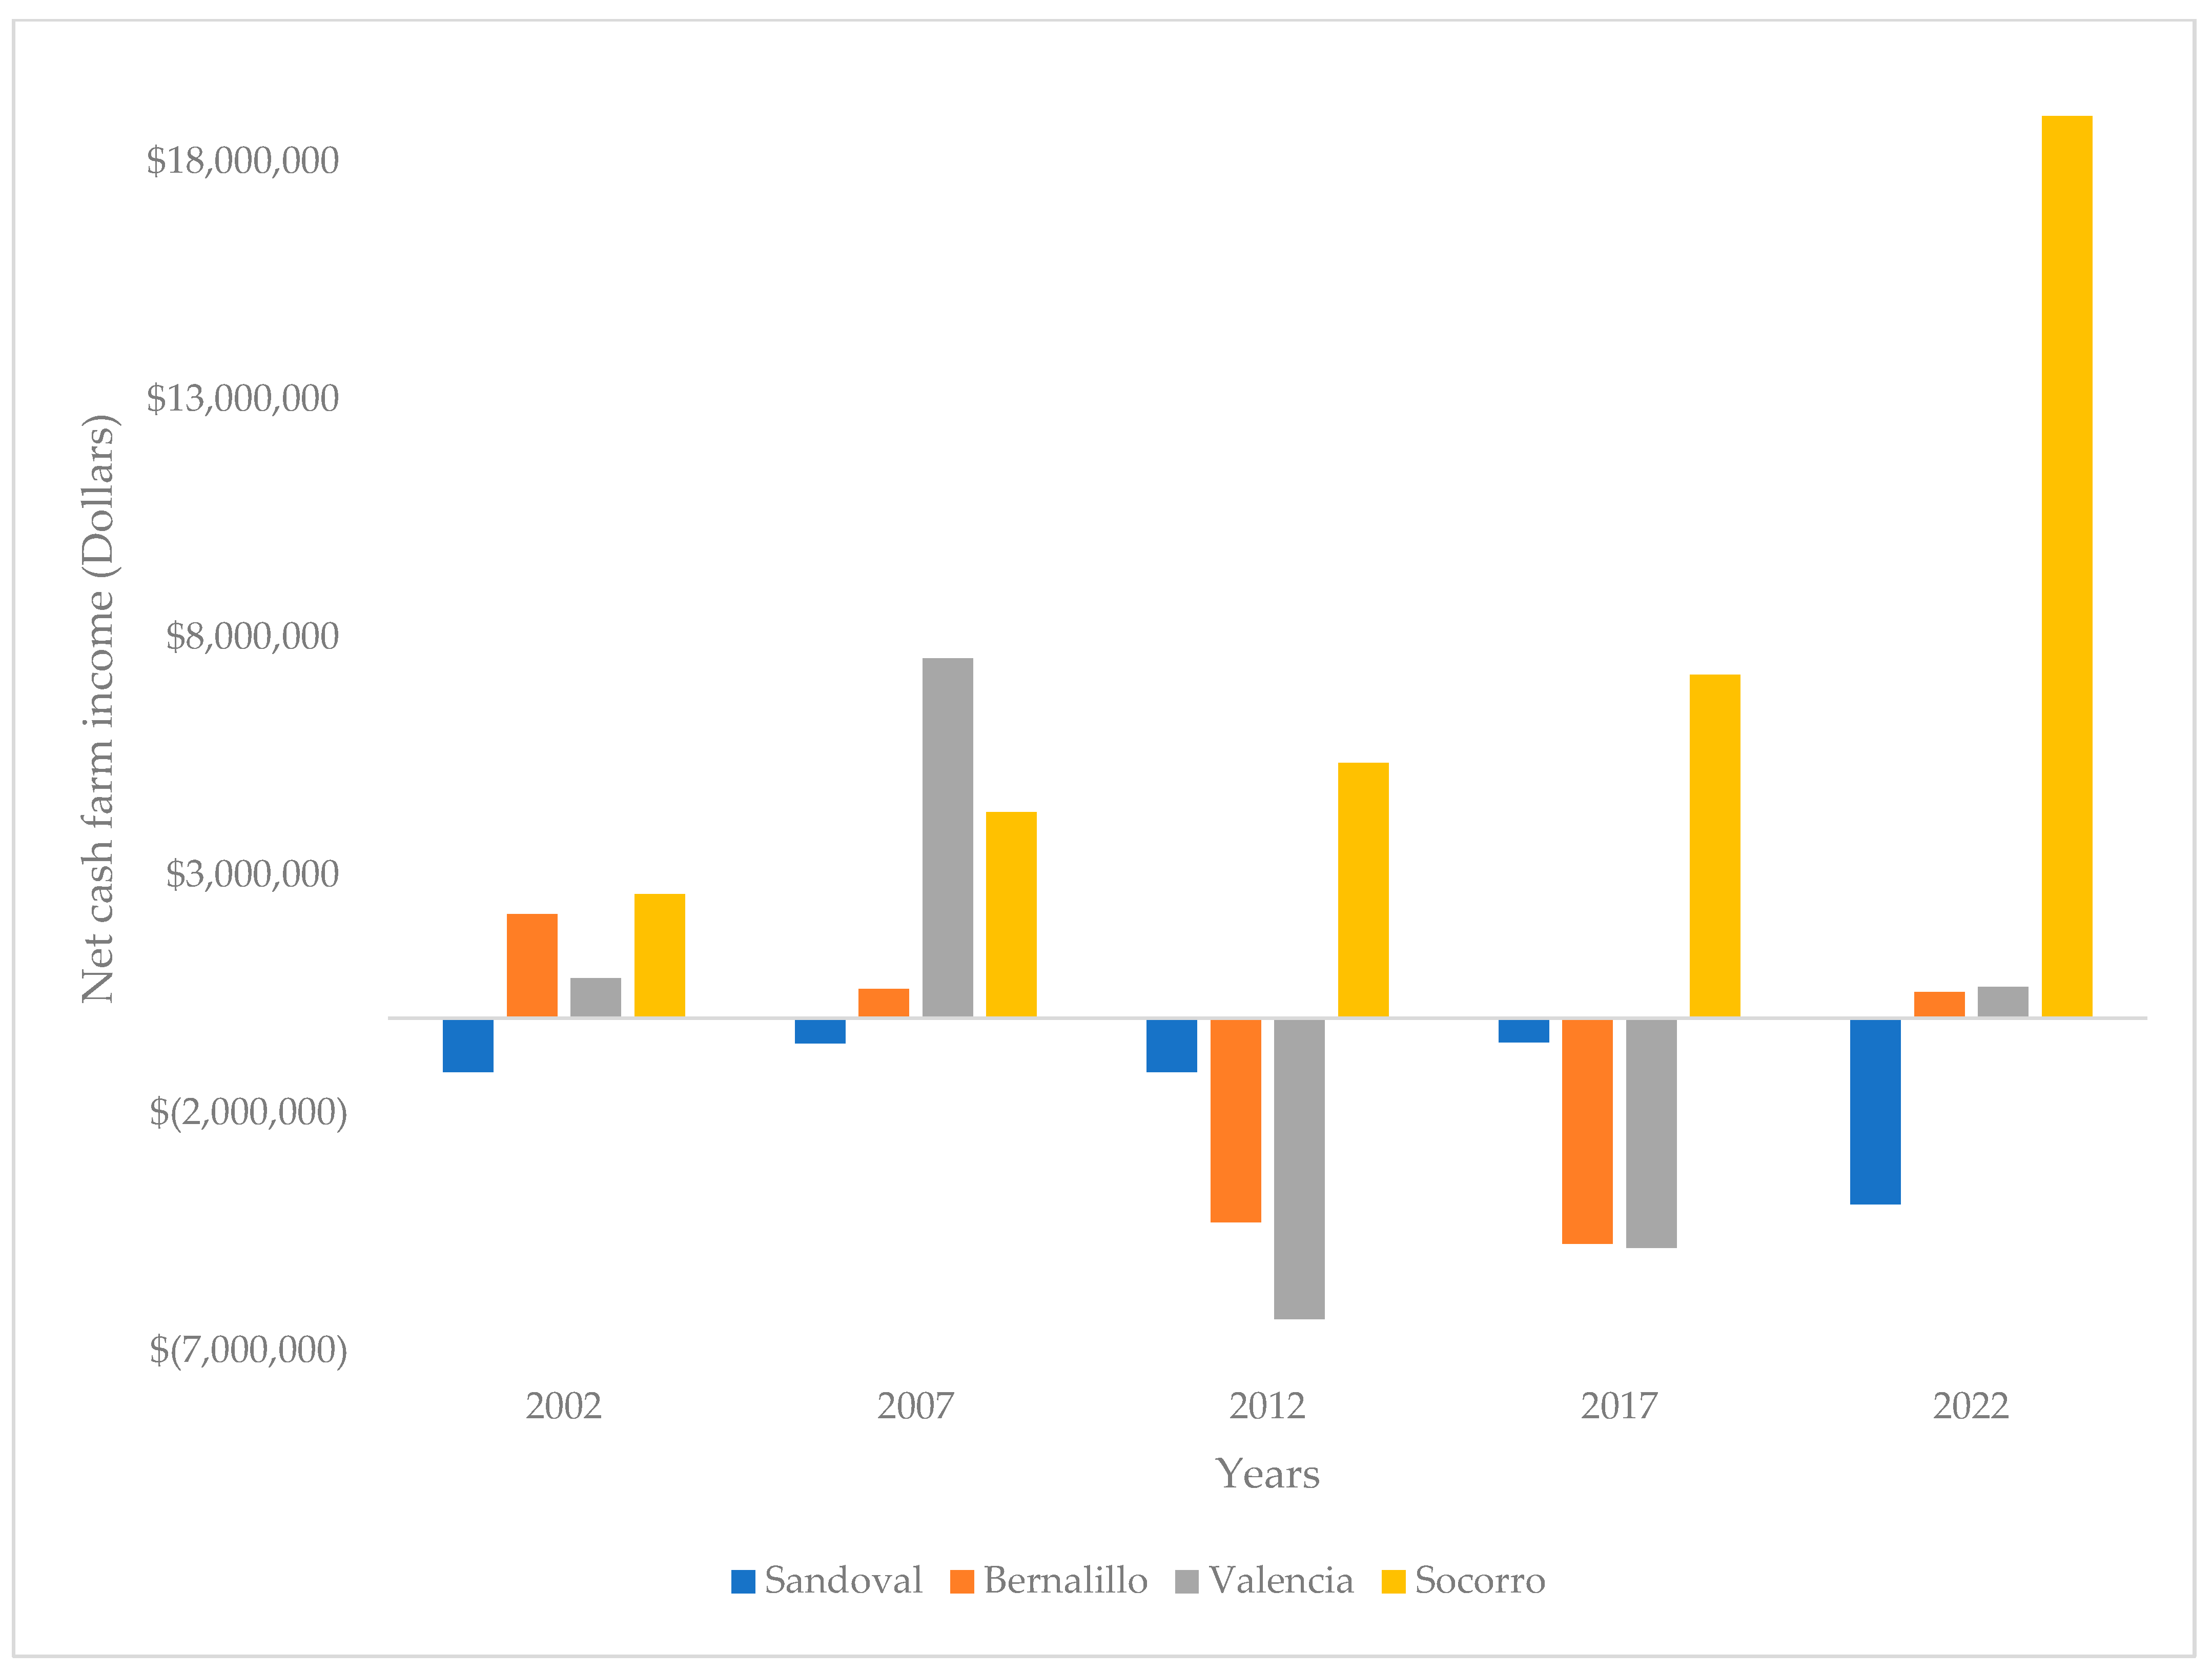
Figure 3 shows the county-level agricultural statistics (net cash farm income of operations) over two decades. County-level agricultural statistics confirm that most small irrigator farms in the MRGCD do not generate substantial farm income. In Sandoval, Bernalillo, and Valencia Counties, where micro and small farms dominate, average net cash farm income is near zero or negative, driven largely by crop losses and limited market-oriented production [11]. In Bernalillo County, net cash farm income is negative overall, while Sandoval County reports an aggregate loss of approximately USD 3.9 million from agriculture, with crop production accounting for most of the deficit [11]. In contrast, Socorro County, which hosts a higher share of large, irrigated farms and dairy operations, generates positive net cash farm income (approximately USD 19 million), largely from livestock, poultry, and dairy products, which account for nearly 90% of total agricultural sales [11]. Across the basin, more than half of farms report annual sales below USD 2500, and fewer than 13% exceed USD 100,000 in sales, indicating that most irrigator farms operate at very small commercial scales. These patterns are consistent with national evidence that small farms rely heavily on off-farm income. In the United States, 96% of farm households earn income from off-farm sources, which provides more than 80% of total household income on average [22]. In the Middle Rio Grande, farming is frequently maintained for lifestyle, heritage, and water-rights preservation rather than for financial profitability [23]. This economic background helps to explain why numerous small irrigator farms persist despite low market returns.
Figure 3.
County-level agricultural statistics, 2002 to 2022.
3. Data and Methods
This study adopts an observational spatial analytical design. The analysis is descriptive–analytical rather than causal, aiming to quantify structured empirical patterns in consumptive water use across irrigator farms rather than estimate causal effects.
3.1. Data Sources
This study integrates multiple geospatial and hydrological datasets to characterize irrigated agriculture and water use in the MRGB. Crop and land-use information was obtained from the MRGCD ISOLog dataset, which provides a 30 m resolution, remotely sensed classification of irrigated crops and land cover for 2021, including alfalfa, other hay, orchards, and other cultivated classes [24]. The year 2021 was selected because it represents an extreme drought period, with approximately 50% of New Mexico classified as having exceptional drought and an additional 30% under extreme drought conditions, providing a stringent test of irrigation-dependent agricultural systems [17].
Evapotranspiration and effective ET are derived from OpenET, a field-scale water-use platform that integrates satellite imagery, meteorological inputs, and multiple ET models to generate spatially explicit estimates of consumptive water use [25]. Effective ET is calculated by adjusting total ET for precipitation inputs derived from the GRIDMET gridded meteorological dataset, which provides high-resolution estimates of precipitation and climate variables across the western United States [4]. While OpenET provides ensemble estimates that incorporate model variability, the analysis focuses on comparative patterns across irrigator farms rather than precise absolute estimates of evapotranspiration. Groundwater well data, including well locations and reported pumping information, are obtained from the New Mexico Office of the State Engineer (NMOSE) and clipped to the study area to identify irrigators with access to groundwater supplies. All spatial datasets are projected to a common coordinate system (WGS 84/UTM Zone 13N) and processed within a geographic information system (GIS) environment.
3.2. Data Preparation and Analytical Spatial Processing
All geospatial analyses are conducted using QGIS, an open-source geographic information system widely applied in spatial and environmental analysis [26]. Input datasets are reprojected to EPSG:32613 (WGS 84/UTM Zone 13N) to ensure spatial consistency and accurate area calculations across raster and vector layers [27]. Data layers are clipped to the geographic extent of the MRGB, defined as the area between Cochiti Reservoir in the north and the Elephant Butte Reservoir inflow in the south, encompassing Sandoval, Bernalillo, Valencia, and Socorro Counties.
The primary raster datasets (ISOLog, OpenET, and GRIDMET) have a spatial resolution of 30 m × 30 m, corresponding to a cell area of 900 m2. Raster-derived areas are converted to acres (1 acre = 4046.86 m2) to ensure consistency with U.S. agricultural statistics and facilitate interpretation at the farm scale [11]. Parcels classified as irrigated agriculture in the ISOLog dataset are spatially aggregated by irrigator identifier to create “irrigator farms,” defined as contiguous or managed groups of parcels operated by a single irrigator. These irrigator farms constitute the unit of analysis in this study and allow land use, groundwater access, and water consumption to be examined at the decision-making scale rather than at the level of individual fields [28]. The analysis represents a single-year cross-section for 2021, aggregating net consumptive water use across all crops present on each irrigator farm during that year, including both annual and perennial crops.
3.3. Farm Classification and Sample Selection
Following regional agricultural classifications and observed farm size distributions, irrigator farms are classified into four size categories based on total irrigated acreage:
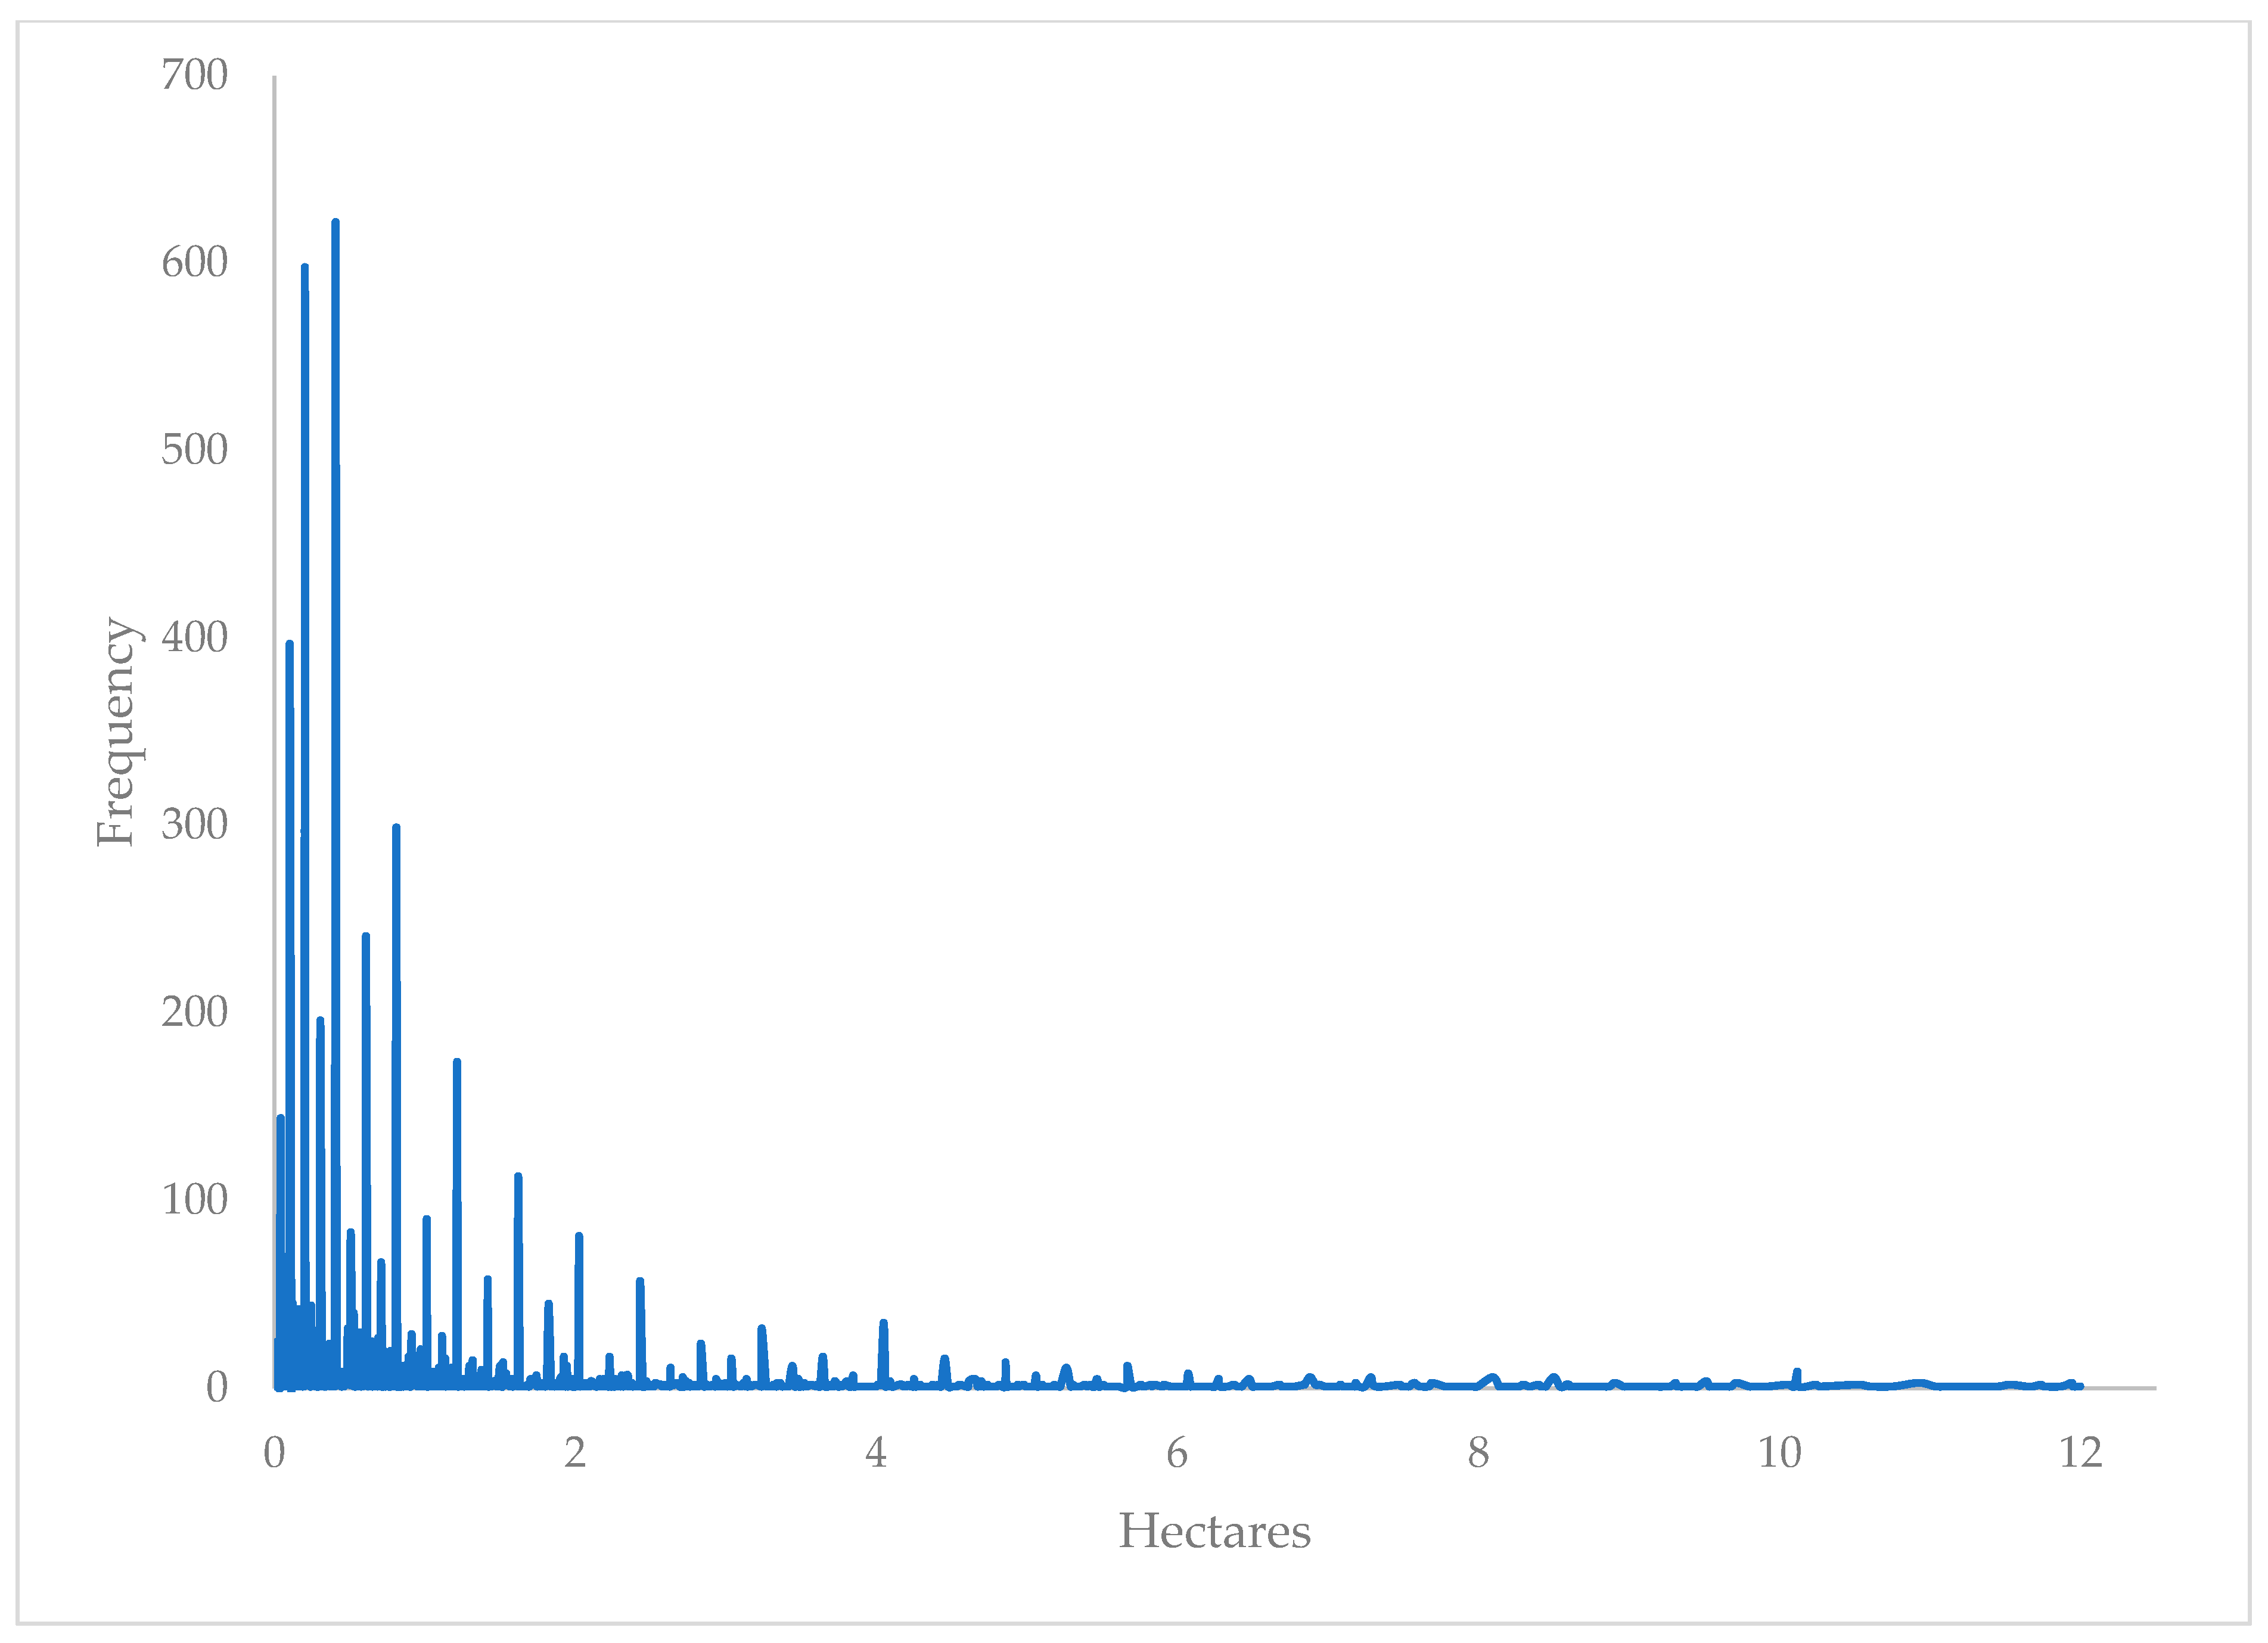
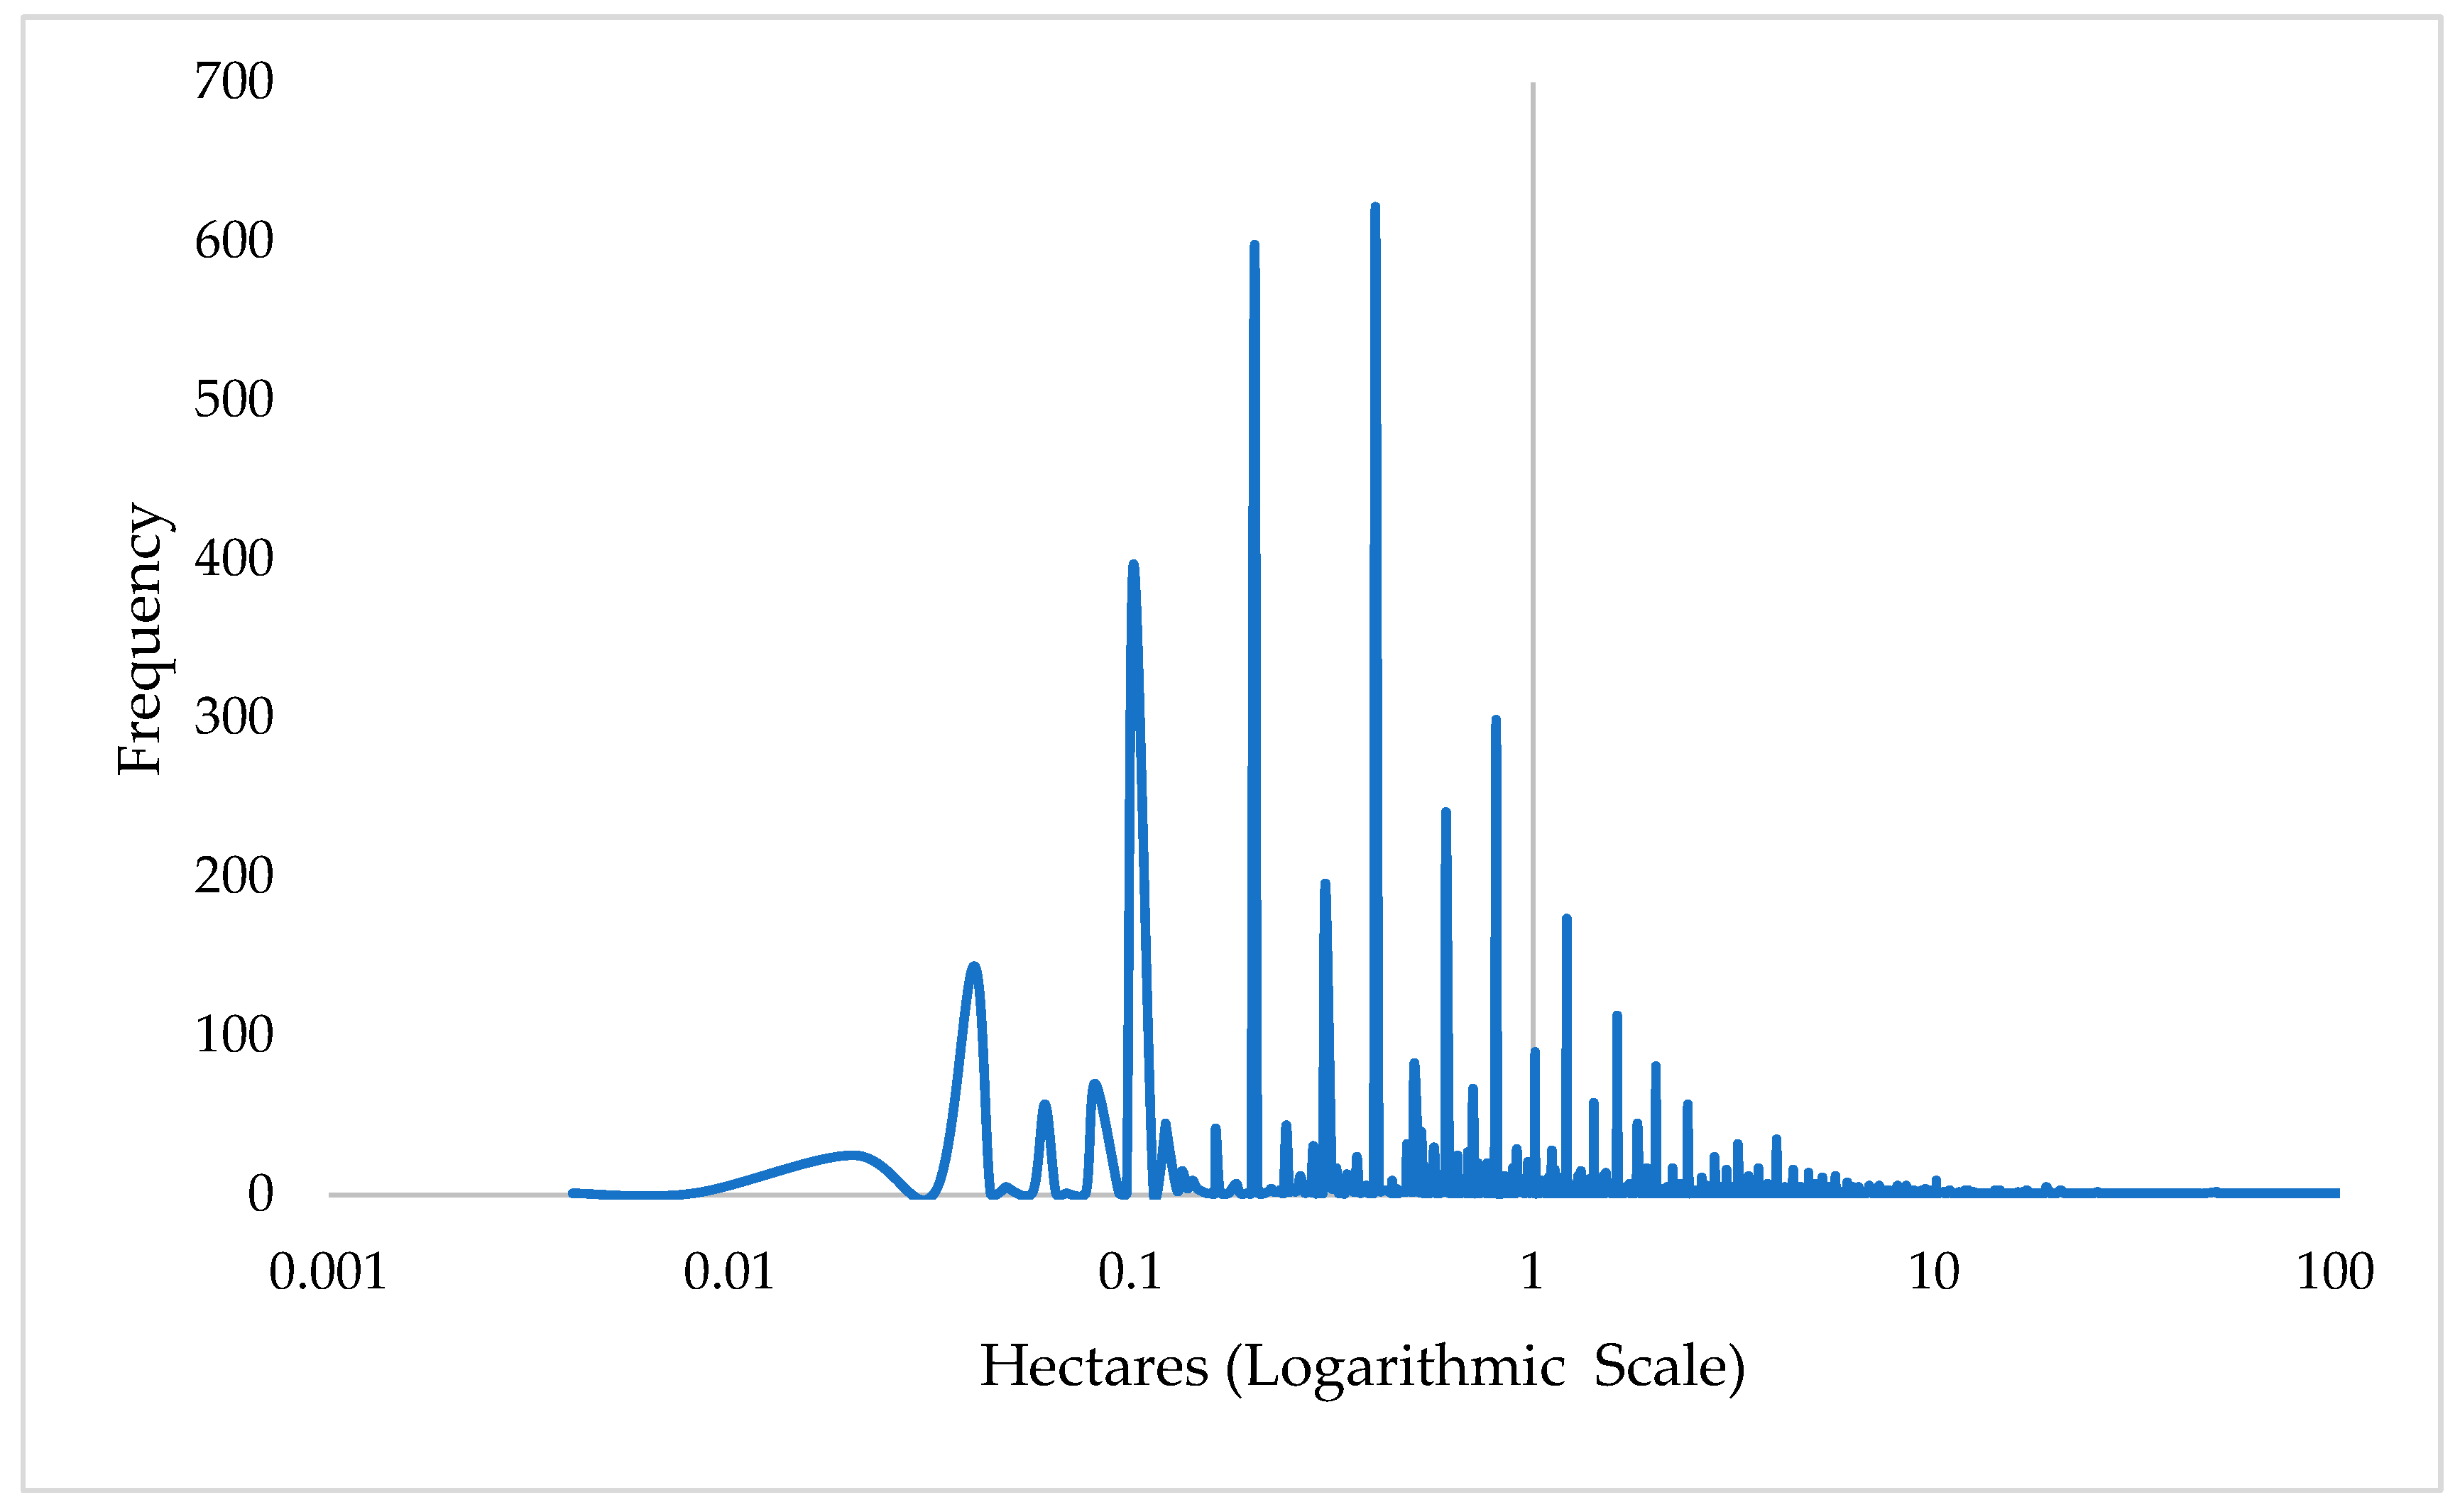
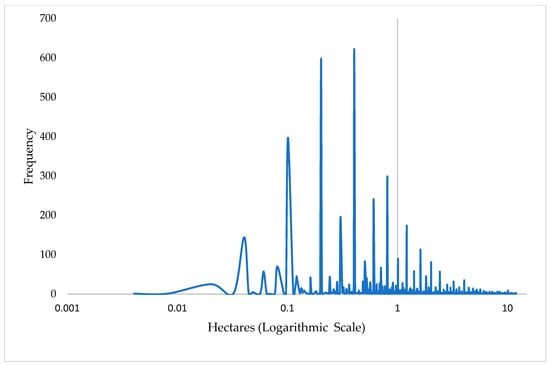
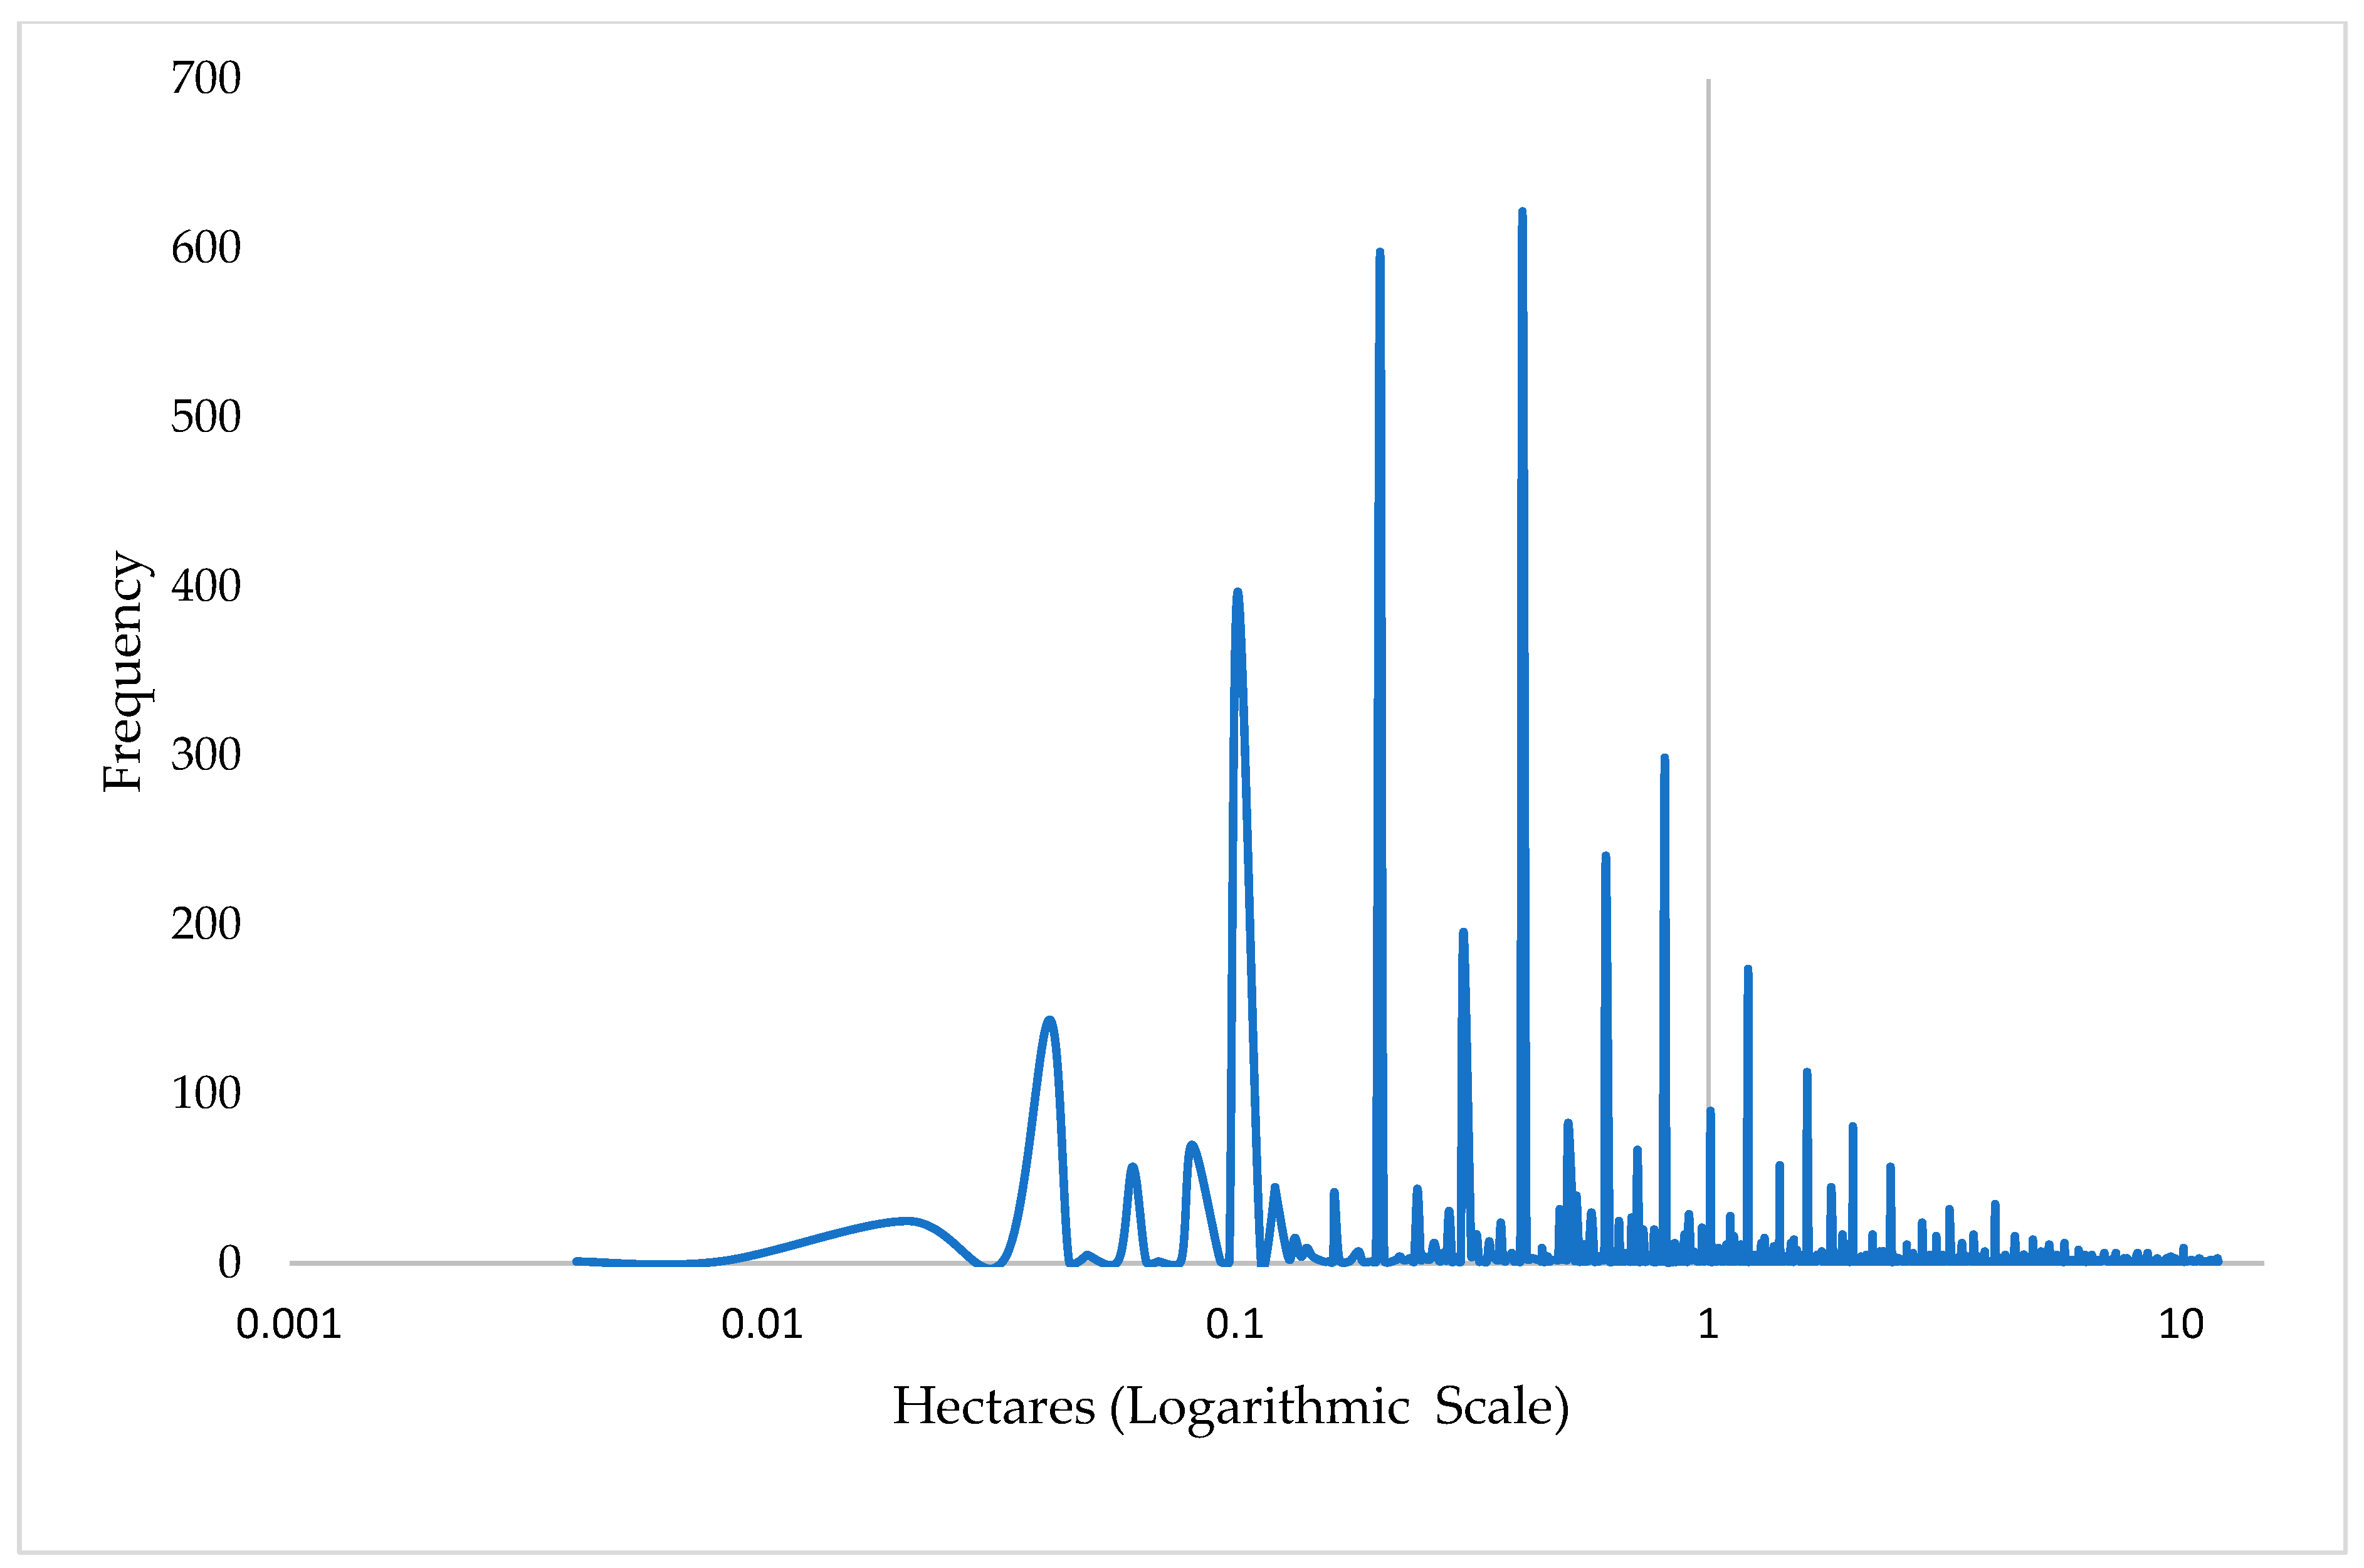
(1) micro-scale (<2 hectares [5 acres]); (2) small (2–11.9 hectares [5–29.9 acres]); (3) medium (12–59.9 hectares [30–149.9 acres]); and (4) commercial or large (>60 hectares [150 acres]). These thresholds reflect the empirical distribution of farm sizes in the basin and are consistent with classifications used in U.S. agricultural statistics and irrigation studies [11]. The distinction between commercial and noncommercial irrigators is primarily based on the empirical distribution of farm size in our collected GIS data, but is also supported and informed by the regular Census of Agriculture survey conducted by the U.S. Department of Agriculture, roughly every five years in the US. This information across states and counties is collected separately from any analysis for the local conservancy district (i.e., the MRGCD). For example, from the USDA Census of Agriculture, over the last several decades, the three northernmost counties in our analysis (Valencia, Bernalillo, and Sandoval) have been predominated by numerous small farms that regularly report average net farm incomes that are near zero or often negative, which is not consistent with commercial operations [11]. More specifically, the ratio of farms reporting net losses to farms with any positive gains was 2.61 to 1 in 2017 (with 3595 registered farm operations), and 3.15 to 1 in 2022 (with 2651 registered farm operations). The number of farms reporting total revenues exceeding $250,000 (roughly the amount to be able to independently support a family) was extremely limited. For 2017, the weighted average of net farm income across the three northernmost counties was −$3281.24, and then again negative (−$1.036.25) in 2022. Numerous other small irrigation operations (e.g., with less than $1000 of farm expenses) are not even registered with the USDA. The resulting hectarage distributions are illustrated in Figure 4 and Figure 5. The two illustrate the irrigator farm sizes on a logarithmic scale to improve visualization of the highly skewed distribution, stacked less than two hectares [five acres]. For comparison, Appendix A Figure A1 and Figure A2 display the same distribution using a linear scale.
Figure 4.
Distribution of all irrigator farm hectarage (logarithmic scale). Blue line is the distribution frequency and grey is the vertical axis.
Figure 5.
Distribution of less than 12-hectare irrigator farm (logarithmic scale). Blue lines are the distribution frequencies and grey is the vertical axis.
Non-irrigated parcels are excluded because the study focuses on irrigation-dependent agriculture and consumptive water use. Parcels operated by government agencies (e.g., correctional institutions) are removed because they do not represent typical private farming behavior in terms of water rights, management objectives, or production decisions. Pueblo agricultural lands are also excluded due to differences in legal jurisdiction, governance, and water-rights frameworks, which are not directly comparable to non-Pueblo farms, and to protect their data sovereignty.
3.4. Groundwater Access and Water-Use Estimation
Groundwater access is incorporated by spatially joining irrigation well locations from the NMOSE database to irrigator farm polygons using the “Join Attributes by Location” function in QGIS. This procedure identified farms with one or more associated wells, enabling the distinction between irrigators relying solely on surface water and those with access to conjunctive surface–groundwater supplies [29].
Total and effective ET are estimated at the irrigator farm level using zonal statistics. OpenET raster layers are overlaid on irrigator farm polygons to compute total ET for each farm. Effective ET is derived by subtracting precipitation contributions based on GRIDMET rainfall estimates, allowing net consumptive water use to be calculated for each irrigator farm [4,25]. This approach provides a spatially explicit, physically based measure of agricultural water consumption that is directly comparable across crops and farm sizes.
4. Results
4.1. Spatial Distribution of Irrigator Farm Sizes
After excluding 1331.4 hectares (3328.6 acres) of government-managed institutional and conservation lands (such as parcels operated by correctional departments, the New Mexico Department of Game and Fish, the U.S. Fish and Wildlife Service, and the New Mexico Boys and Girls Ranch), representing 8.4% of mapped irrigated land. The analysis focuses on 14,536.9 irrigated hectares (36,342.3 acres) distributed across 5922 irrigator farms. These irrigator farms exhibit an extremely skewed size distribution dominated by very small operations.
Approximately 97% of all irrigator farms operate on less than 12 hectares [30 acres] (Figure 5). The largest group consists of micro-scale farms (<2 hectares), which account for 77.9% of all irrigators, followed by small farms (2–11.9 hectares) at 18.8% and medium farms (12–60 hectares) at 2.8%. Commercial-scale farms (≥60 hectares) represent only 0.44% of all irrigators. This structure implies that irrigated agriculture in the MRGB is overwhelmingly dominated by non-commercial and part-time farm operators.
Although large farms are rare (0.44%), they occupy a disproportionate share of land. Commercial-scale farms account for approximately 21% of total irrigated hectarage, while medium farms account for roughly 28%. In contrast, the large number of micro- and small-scale farms collectively control about 52% of irrigated land, indicating that smallholders, in aggregate, command a significant share of land and water resources. Table 1 provides a detailed distribution of irrigator farm sizes.
Table 1.
Descriptive analysis of irrigator farms by size. Micro-scale (<2 hectares), small (2–11.9 hectares), medium (12–59.9 hectares), and commercial (≥60 hectares).
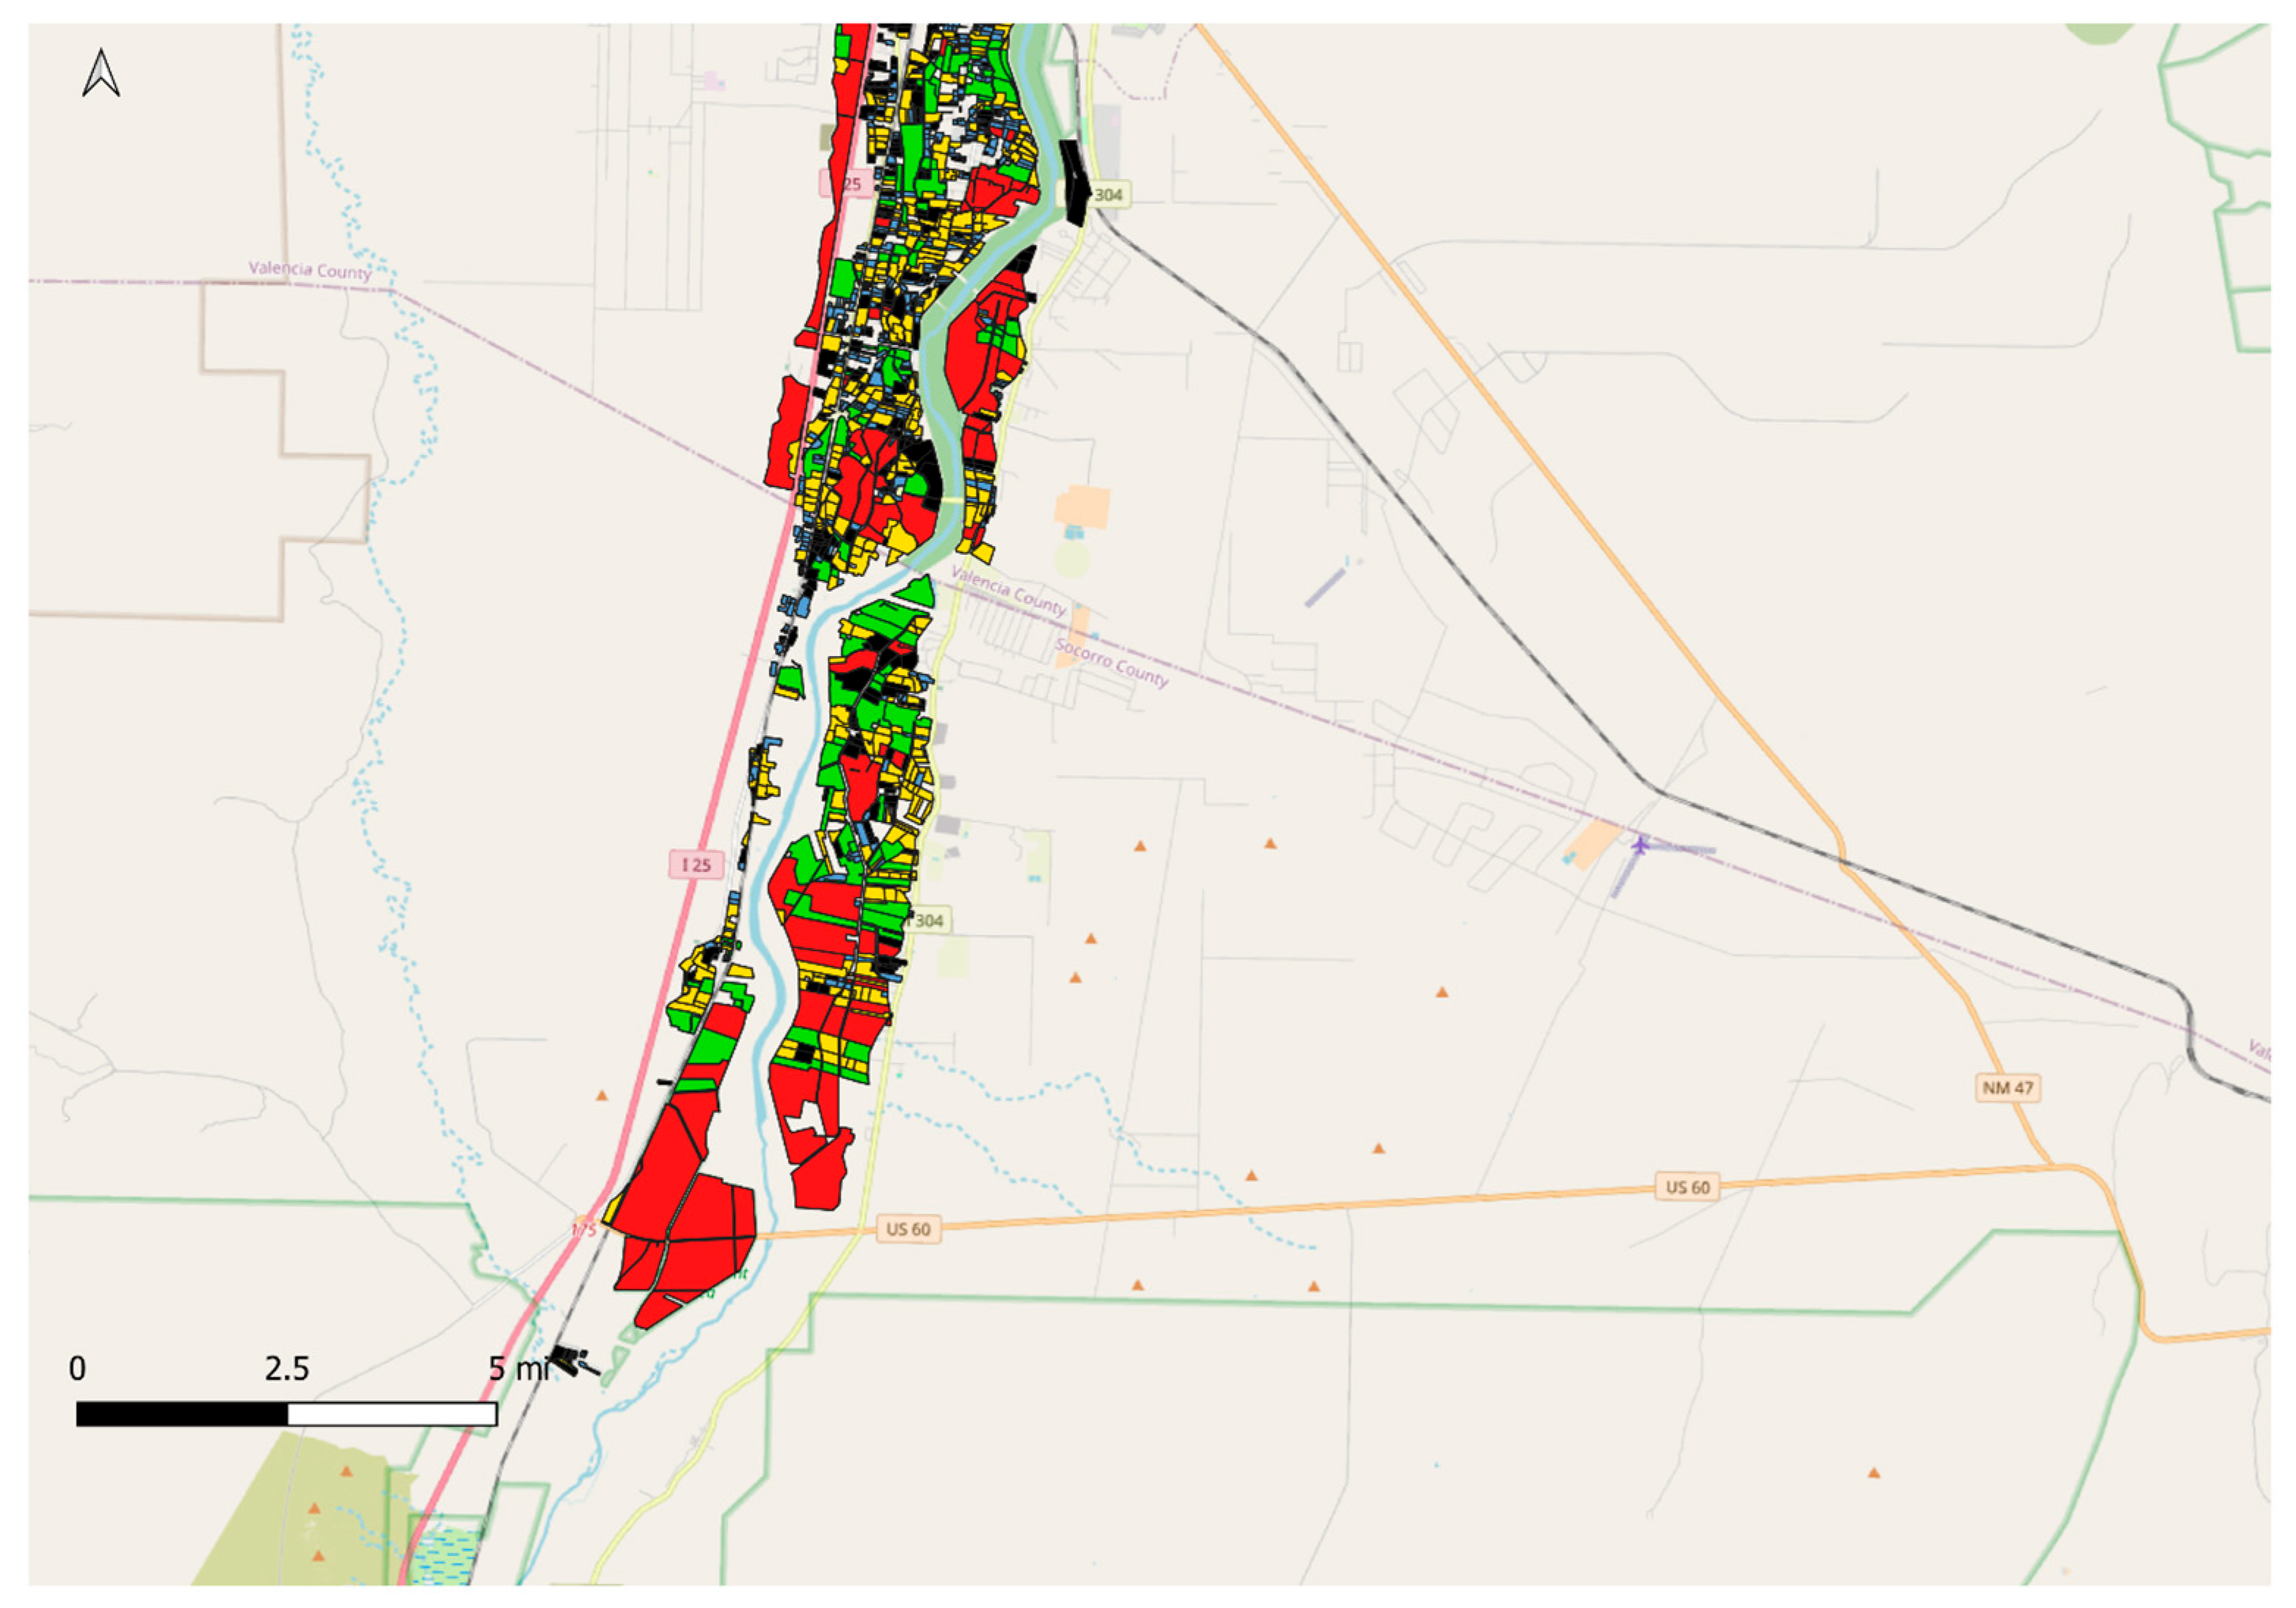
The total mapped irrigated area of approximately 14,707.1 hectares [36,342 acres] closely matches independent USDA Census estimates for the region (about 13,192.76 irrigated hectares [32,600 acres] in 2022), suggesting that the spatial dataset captures most irrigated agriculture in the basin [11]. Spatially, small irrigator farms are clustered around Albuquerque and other urbanized areas in Sandoval, Bernalillo, and Valencia Counties, whereas the few large farms are primarily located in downstream areas of Socorro County, which have a more commercially oriented agricultural profile. (See Figure A3, Figure A4, Figure A5, Figure A6 and Figure A7 in Appendix A for the spatial maps).
4.2. Crop Distribution Across Irrigator Farms
Crop mapping from the ISOLog dataset reveals a strong dominance of forage crops across the basin. Alfalfa and other hay crops account for more than 59% of all mapped irrigated parcels and approximately 69% of total irrigated hectarage (Table 2). The remaining area is divided between other single crops (such as vegetables, fruits, corn, and small grains) and combination parcels that include mixed cropping or orchards with intercrops.
Table 2.
Distribution of major crop categories.
This heavy concentration in forage production is consistent across all four counties and reflects the basin’s specialization in livestock (including horses) feed production [23]. Alfalfa is particularly well-suited to the Middle Rio Grande’s irrigated system because it is a perennial crop with deep roots and high tolerance to intermittent water stress. It also fits local farming practices, irrigation infrastructure, and equipment investments, reinforcing its dominance in the cropping system.
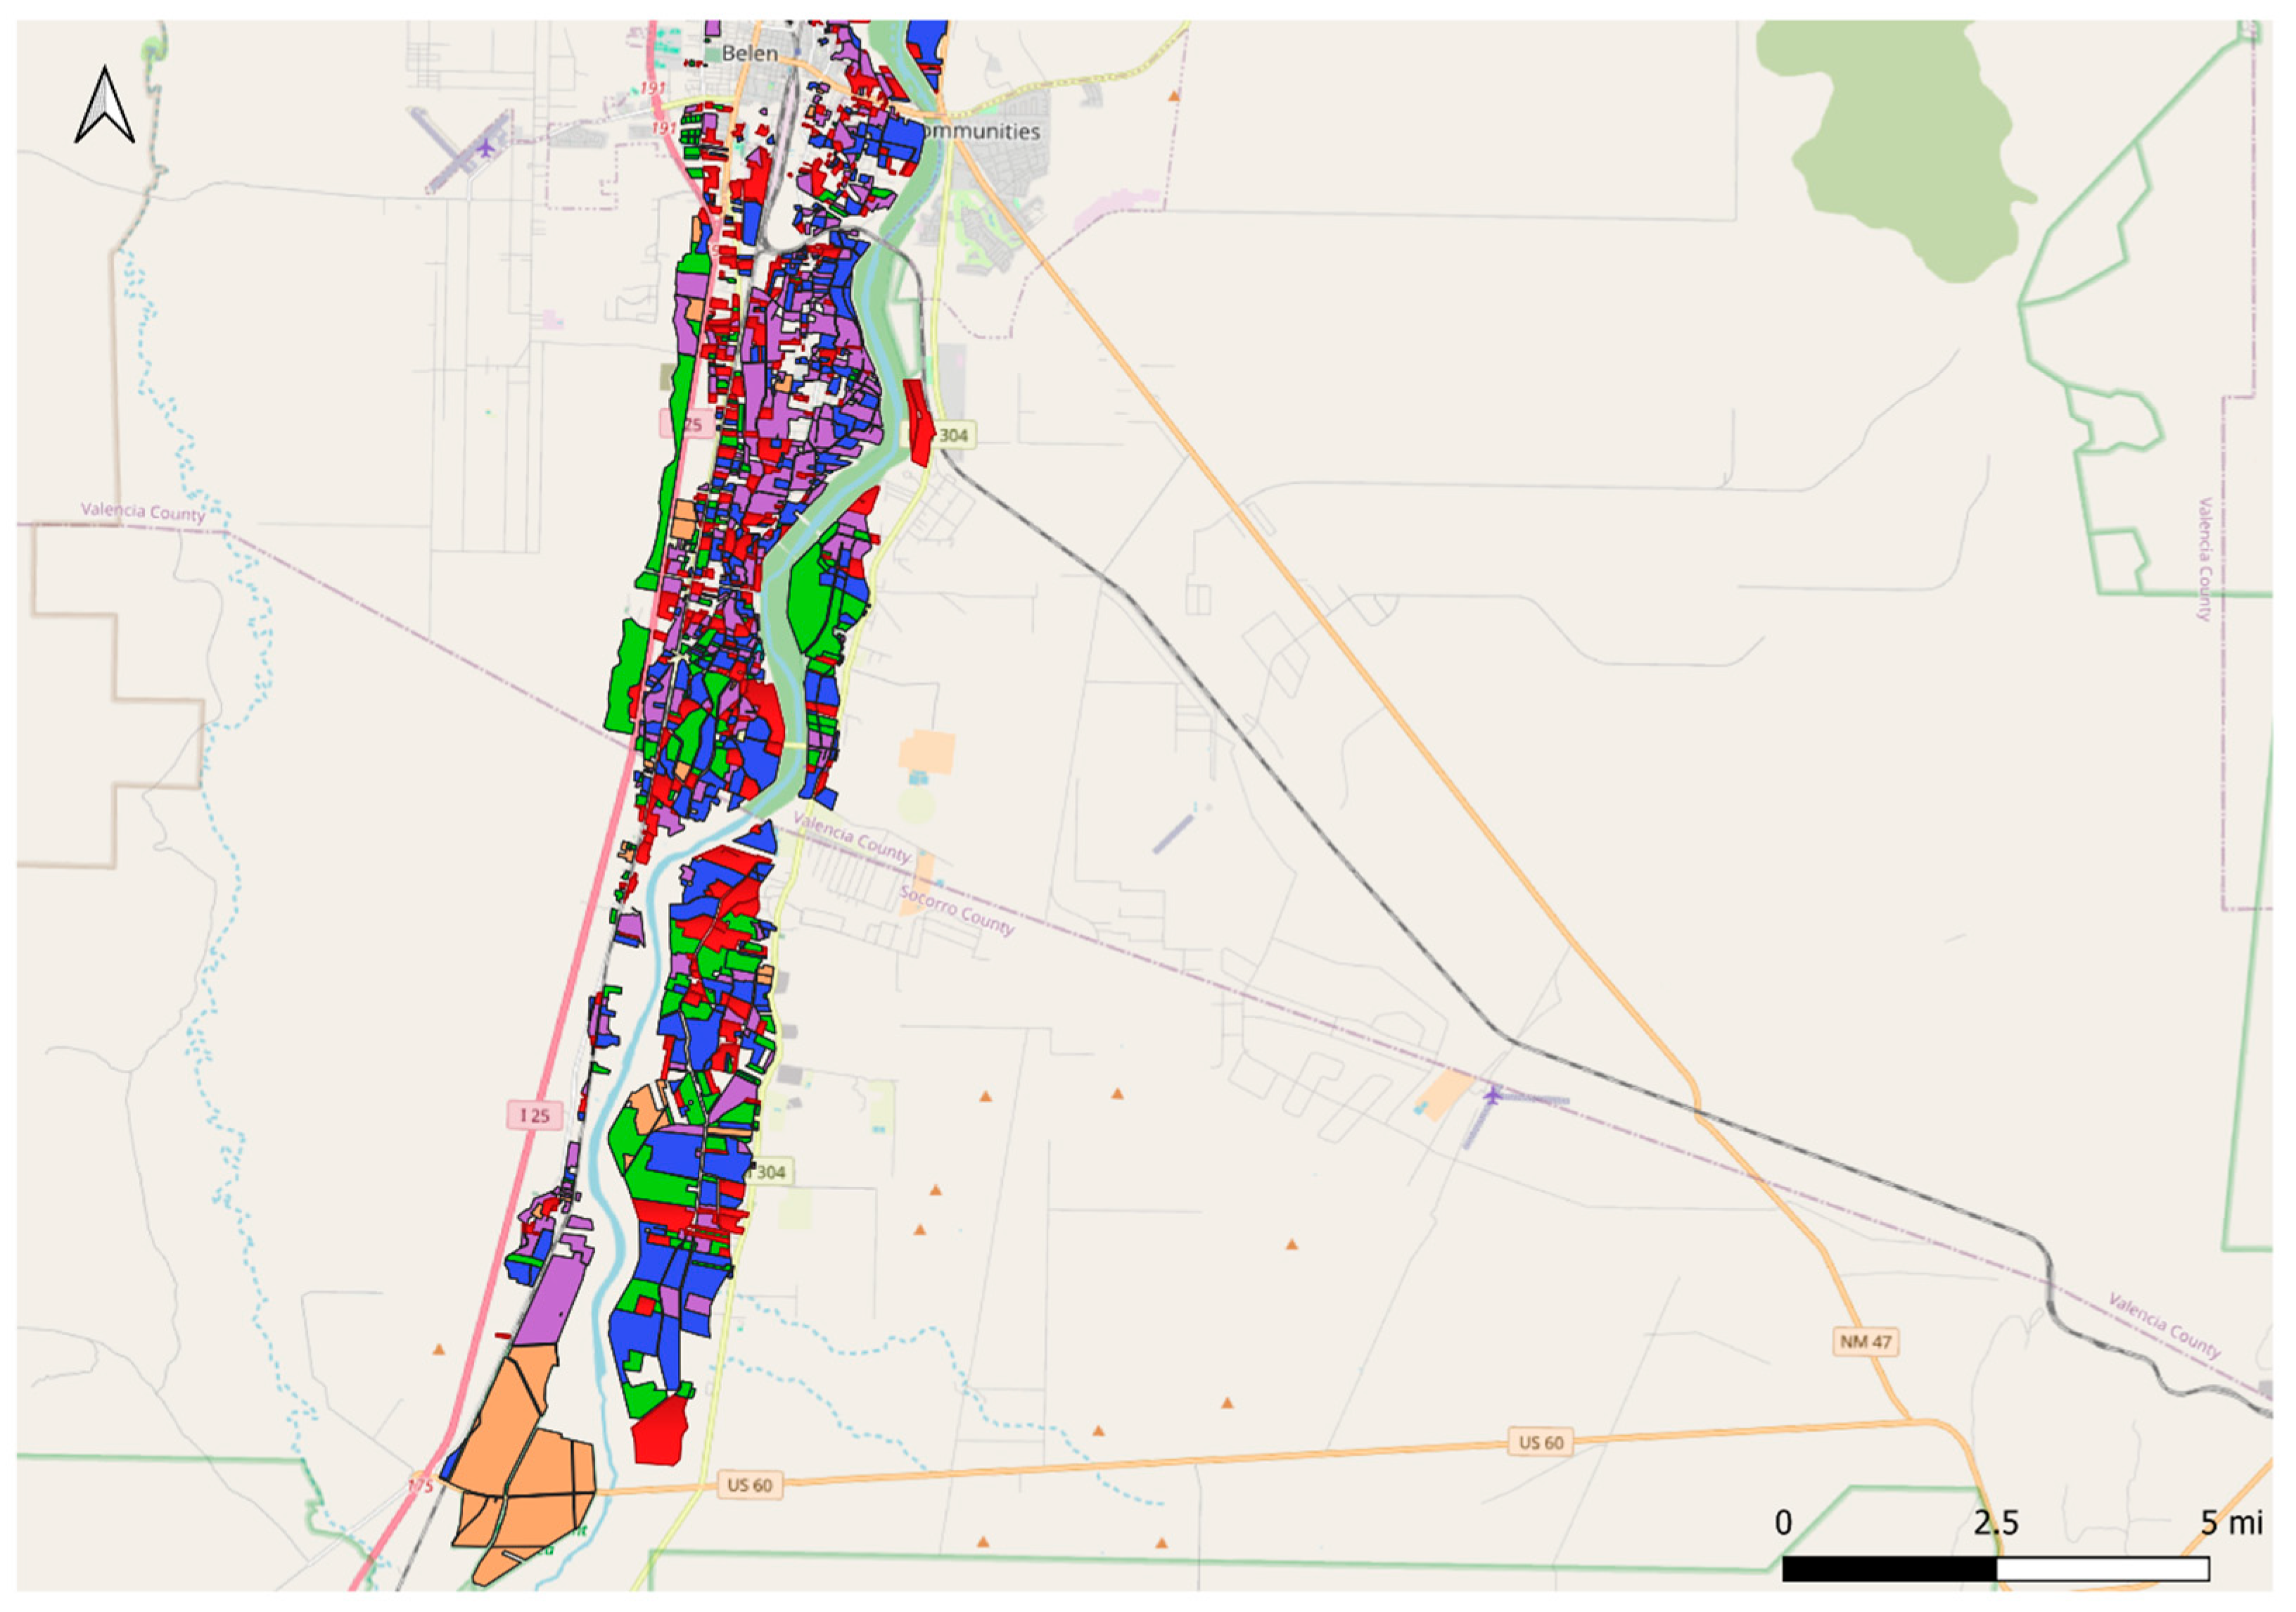
The spatial distribution of crops shows that forage production is widespread across both small and large irrigator farms, whereas higher-value vegetables and fruits are concentrated in smaller parcels near urban markets and in mixed-crop operations. This pattern highlights the coexistence of subsistence-oriented, lifestyle farms and commercially oriented feed production within the same irrigated landscape. (See Figure A8, Figure A9 and Figure A10 in Appendix A for the spatial maps).
4.3. Groundwater Access Across Irrigator Farm Sizes
Groundwater plays a limited but uneven role in irrigated agriculture in the MRGB. Only 3.2% of all irrigator farms have at least one registered agricultural irrigation well (Table 3), indicating that most farms depend on surface-water supplies administered by the MRGCD.
Table 3.
Irrigation well access by farm category. Micro-scale (<2 hectares), small (2–11.9 hectares), medium (12–59.9 hectares), and commercial (≥60 hectares).
However, well access is highly concentrated among commercial operations. Approximately 84.6% of commercial-scale farms (60 hectares [150 acres] and larger) have one or more irrigation wells, compared with only 21.6% of medium-sized farms (12–59.9 hectares [30–149.9 acres]) and 5.4% of small farms (2–11.9 hectares [5–29.9 acres]). Micro-scale farms (<2 hectares [<5 acres]) almost never have irrigation wells. This pattern may be attributed to the substantial fixed costs, regulatory requirements, and pumping infrastructure associated with groundwater development, which are feasible mainly for commercial-scale farms.
This asymmetry in groundwater access creates a pronounced resilience divide. During drought years or when MRGCD imposes surface-water rotation or curtailments, large farms can partially offset surface shortages by pumping groundwater, whereas small farms typically have no such buffer and must reduce irrigated area, apply deficit irrigation, or fallow fields [23]. In 2021, for example, more than 3000 irrigator farms reported fallowing land in response to limited surface-water deliveries and compensated participation in the MRGCD Environmental Water Leasing Program [24]. Although groundwater contributes only a small fraction of total irrigation supply basin-wide, its concentration among large farms potentially reinforces disparities in drought resilience and production stability. As a result, surface-water-only irrigators, who are predominantly smallholders, bear a disproportionate share of water-supply risk during dry years. (See Figure A11, Figure A12 and Figure A13 in Appendix A for the spatial maps.
4.4. Total Evapotranspiration by Irrigator Farm Size
Total crop evapotranspiration across the basin in 2021 is estimated at approximately 140,612.55 thousand cubic meters (103 m3) [114,041 acre-feet (AF)] (Table 4). This magnitude is consistent with independent diversion-based estimates from the MRGCD when typical conveyance and on-farm efficiencies are considered [30].
Table 4.
Descriptive analysis of agricultural evapotranspiration. Micro-scale (<2 hectares), small (2–11.9 hectares), medium (12–59.9 hectares), and commercial (≥60 hectares).
Despite their small individual size, non-commercial irrigator farms (<12 hectares [30 acres]) collectively account for 55.9% of total ET, equivalent to approximately 78,543.33 103 m3 [63,701 AF]. Micro-scale farms (<2 hectares [5 acres]) alone contribute 21.6%, 30,341.66 103 m3 [24,608 AF], while small farms (2–11.9 hectares [5–29.9 acres]) contribute an additional 34.3%, 48,202.90 103 m3 [39,094 AF]. Medium farms (12–59.9 hectares [30–150 acres]) account for 29.7%, 41,776.51 103 m3 [33,882 AF], and the commercial-scale farms (≥60 hectares [150 acres]) use 14.4% 20,292.71 103 m3 [16,458 AF], even though they occupy about one-fifth of total irrigated land.
This result highlights the cumulative impact of the thousands of small irrigator farms that dominate the basin numerically. Although large farms are more water-intensive individually, the sheer number of small farms means that they collectively consume more water than all commercial farms combined. These patterns are reinforced by the dominance of flood-irrigated forage crops, particularly alfalfa, on small parcels, which require long irrigation seasons and high ET rates [31].
Average consumptive use across the basin is approximately 3.1–3.7 103 m3 [2.5–3.0 AF] per acre, consistent with crop water requirements in the Middle Rio Grande Valley and with state-level consumptive-use guidelines [20,23]. These results indicate that agricultural water demand in the basin is not driven by a few large users, but rather by the aggregated behavior of many small irrigators. (See Figure A14, Figure A15 and Figure A16 in Appendix A for the spatial maps).
4.5. Evapotranspiration by Crop Type
Crop composition strongly shapes basin-wide water use. Alfalfa alone accounts for approximately 62,669.69 103 m3 [50,827 AF] of ET (46.2% of total), while other hay and pasture crops add another 37,245.23 103 m3 [30,207 AF] (27.5%) (Table 5). Together, forage crops account for nearly 74% of total evapotranspiration, closely matching their share of irrigated acreage.
Table 5.
Distribution of evapotranspiration by major crop categories.
Specialty crops, including vegetables, orchards, and grains, consume about 16,971.44 103 m3 [13,764 AF] (12.5%), while mixed or combination cropping systems account for approximately 18,753.52 [15,210 AF] (13.8%). Alfalfa also exhibits the highest average ET per square meter (0.84 m), followed by other hay (0.77 m), mixed cropping systems (0.71 m), and single specialty crops (0.74 m). These differences reflect alfalfa’s long growing season and the prevalence of flood irrigation, whereas higher-value crops sometimes employ drip or sprinkler systems that reduce non-beneficial evaporation.
Although forage crops are water-intensive, they are also relatively drought-resilient. Alfalfa can tolerate deficit irrigation by going dormant and recovering when water becomes available, which makes it attractive under uncertain water supplies [32]. During severe droughts, farmers in the MRGB have historically reduced acreage of annual cash crops while maintaining forage production, as observed during the 2003–2004 drought [23,24]. This behavior reinforces the dominance of forage crops in both land use and water consumption.
4.6. Effective Evapotranspiration and Irrigator Farm Size
Effective evapotranspiration across the basin totaled approximately 120,667.50 103 m3 [97,865 AF], or about 86% of total ET (Table 6). This implies that roughly 14% of crop water requirements are met by precipitation, with the remainder supplied by irrigation.
Table 6.
Descriptive analysis of effective evapotranspiration. Micro-scale (<2 hectares), small (2–11.9 hectares), medium (12–59.9 hectares), and commercial (≥60 hectares).
Non-commercial farms (<12 hectares [30 acres]) still account for the majority of net irrigation consumption (51.0%, or 61,577.25 103 m3), although their share is slightly lower than their contribution to total ET (55.9%) (Table 5). Medium farms contribute 27.0% (32,522.84 103 m3) [26,377 AF], and commercial farms contribute 22.0% (26,567.45 103 m3) [21,547 AF]. These results indicate that while small farms dominate aggregate consumptive use numerically, larger farms exhibit higher per-square-meter effective ET intensity.
Consumptive water-use intensity also increases with farm size. Micro-scale farms average only 0.54 Meters [1.76 feet] per square meter of effective ET, whereas commercial farms average 0.80 Meters [2.62 AF] per square meter. Variability rises sharply with scale: the standard deviation of effective ET increases from just over 5.00 103 m3 [4.06 AF] among micro-scale farms to more than 262.54 [212.93 AF] among large farms, reflecting differences in cropping patterns, irrigation practices, and groundwater access.
The distribution of effective ET is highly skewed. The median effective ET of commercial farms, 652.74 103 m3 [529.39 AF], exceeds the 75th percentile of micro-scale farms by nearly two orders of magnitude. These patterns reveal a structurally differentiated water-use system in which large farms exert a disproportionate influence on irrigation demand, even though small farms remain the dominant group numerically. (See Figure A17, Figure A18, Figure A19 and Figure A20 in Appendix A for the spatial maps).
The ET and effective ET results demonstrate that agricultural water use in the MRGB is shaped by both farm scale and crop composition. While thousands of small farms collectively account for the majority of consumptive water use, larger farms and forage-dominated systems exhibit higher per-farm water-use intensity and greater access to groundwater. These structural differences have important implications for drought resilience and equity, as discussed in the following section.
The empirical results provide support for the descriptive hypotheses outlined in Section 1. Consistent with H1, forage crops (primarily alfalfa and hay) account for the majority of basin-wide evapotranspiration (Table 5). H2 is also supported: while non-commercial irrigator farms dominate numerically, larger farms exhibit much higher ET and effective ET per farm (Table 4 and Table 6). Finally, H3 is consistent with the observed distribution of irrigation wells, which is disproportionately concentrated among larger irrigator farms (Table 3).
5. Discussion
5.1. Smallholder-Dominated Irrigation and the Challenge of Demand Management
The results show that agricultural water consumption in the MRGB is not concentrated in a small number of large users: micro- and small-scale farms collectively account for 55.9% of total evapotranspiration despite operating on less than 12 hectares each. Instead, thousands of micro- and small-scale irrigator farms (5729) collectively account for the majority (55.86%) of evapotranspiration, reflecting a fragmented irrigation landscape where the aggregate behavior of many smallholders drives basin-wide water demand. This pattern complicates conventional water-conservation strategies that typically target large producers, because effective demand management in the MRGB requires engagement with a very large number of part-time and non-commercial irrigators.
This highly fragmented structure contrasts with irrigation systems in parts of California’s Central Valley and Arizona’s irrigated districts, where water use is often concentrated among fewer [33,34], larger commercial operations, and institutional conservation efforts can focus on major diversion points or high-volume users. Studies in Western U.S. basins have shown that farm size and institutional structure strongly influence the distribution of consumptive water use and the feasibility of coordinated conservation efforts [32]. In systems dominated by larger farms, water-use reductions can sometimes be negotiated with a relatively small number of stakeholders. In contrast, basins characterized by numerous smallholders, such as acequia-based systems in New Mexico and other traditional irrigation communities, face distinct transaction-cost and coordination challenges. The present findings situate the MRGB more closely within this latter institutional and social context.
Empirical studies in the Middle Rio Grande Valley indicate that many small irrigators flood irrigate pasture or alfalfa primarily to preserve cultural traditions, maintain a land-based lifestyle, or provide household-level benefits rather than to maximize net farm income [14,31]. Such motivations reduce the likelihood that purely financial incentives, especially those aimed at profit optimization, will induce major shifts in practice. In addition, smallholders often lack the capital, equipment, and economies of scale needed to adopt irrigation modernization [31]. These social and economic realities help interpret why small farms persist even when farm income is low and why they continue to account for significant cumulative consumptive water use.
The dominance of small farms also has potential implications for system-level operations. Irrigation districts serving a patchwork of dispersed parcels may face higher conveyance and operational complexities, particularly when maintaining canal flows to reach scattered users [20]. While a portion of conveyance losses may return to the river or shallow aquifer and are not necessarily “lost” from a basin perspective, such structural features can influence short-run water availability and operational flexibility during the irrigation season. District-wide strategies that combine infrastructure improvements with outreach, such as optimizing delivery scheduling, promoting irrigation timing practices, and supporting low-cost on-farm adjustments, may therefore be relevant in systems characterized by highly fragmented farm structures.
In addition, the results highlight limited water-supply flexibility for most small irrigator farms. Because smallholders rarely have irrigation wells, they cannot easily buffer surface-water curtailments through conjunctive use. As a consequence, drought adaptation frequently occurs through deficit irrigation, reduced cultivated acreage, or temporary fallowing. Programs such as the Environmental Water Leasing Program (EWLP), which compensates irrigators for short-term reductions in irrigation demand, are therefore particularly relevant in this setting. Prior work documents that agricultural-to-urban transfers and leasing have occurred in the region and can provide meaningful volumes under drought conditions [35,36]. The present results suggest that such programs may have the greatest basin-wide impact when designed to reduce the transaction costs of participation for many small irrigators.
5.2. Forage Crop Dominance and Water-Productivity Trade-Offs
Crop composition is a primary determinant of consumptive water use in the basin. The results show that alfalfa and other hay account for nearly three-quarters (73.66%) of total evapotranspiration, consistent with the long irrigation season and high ET typical of forage systems under flood irrigation [30,31]. From a resource-efficiency perspective, this crop mix presents a fundamental trade-off: forage crops support regional dairy and livestock systems and are agronomically well-adapted to local conditions, yet they tend to generate relatively low economic returns per unit of water compared with higher-value specialty crops [12].
However, the persistence of alfalfa and hay is not simply economic inefficiency. Forage crops are comparatively low-risk and low-labor, can be harvested by custom operators, and fit the time constraints of part-time farmers. Agronomically, alfalfa can tolerate deficit irrigation by entering dormancy and recovering when water becomes available, which reduces downside risk during dry years [32]. This adaptive flexibility may make forage systems more resilient under uncertain surface-water supplies than many annual specialty crops that require more precise irrigation timing and intensive management [32].
These characteristics suggest that water conservation in the MRGB may be more feasible through management changes within forage systems than through wholesale crop switching. Recent evidence indicates that summer deficit irrigation strategies in alfalfa can reduce water use considerably while maintaining plant-stand longevity and acceptable yield outcomes, especially when paired with compensation or drought-response incentives [32]. Translating this insight to the Middle Rio Grande implies that targeted seasonal deficit strategies, such as full irrigation for early cuttings and reduced irrigation during peak summer demand, could function as a “deficit irrigation” approach. This approach preserves perennial stands while reducing consumptive use when the basin is most constrained [32]. The potential savings are non-trivial given alfalfa’s large share of total ET.
At the same time, diversification opportunities exist, particularly near urban markets where small parcels could potentially support higher-value crops. Yet the feasibility of diversification depends on labor availability, access to marketing channels, and farmer preferences. Prior research in the region suggests that many small irrigators explicitly treat farming as a secondary activity, implying that transitions to management-intensive cropping may be limited to a subset of farms [12,31]. For the broader group, conservation programs that maintain cultural landscape amenities while reducing irrigation demand, such as compensated fallowing, native/low-water cover, or seasonal irrigation reductions, may be more realistic and scalable. Recent research using satellite-derived evapotranspiration datasets demonstrates that field-scale ET information can help identify irrigation efficiency patterns and potential water-saving opportunities across agricultural landscapes [25]. Applying similar ET-based analytical approaches in the MRGB could provide a useful avenue for evaluating irrigation management strategies and conservation programs in future work. More broadly, the trade-offs between crop choice, water productivity, and risk management observed in the MRGB are consistent with patterns documented in dryland irrigation systems globally, where water scarcity, climatic variability, and farm-level risk considerations often lead farmers to favor resilient crop systems and flexible irrigation practices over strictly water-productivity-maximizing strategies (e.g., [37,38]).
5.3. Equity, Drought Resilience, and Conjunctive Water Management
The results indicate a pronounced disparity in groundwater access across farm sizes. While groundwater is not widely used across the basin, it is heavily concentrated among the largest irrigator farms (84.62%), which can pump to offset surface-water shortages. This creates differentiated drought resilience: 84.6% of commercial farms have access to irrigation wells compared with only 5.4% of small farms and 1.6% of micro-scale farms (Table 3). Farms with wells can smooth irrigation supply during curtailments, whereas surface-water-only farms must absorb shortages through land fallowing or reduced irrigation intensity. This pattern has equity implications because drought resilience is closely linked to access to capital-intensive groundwater infrastructure, which allows some farms to buffer water shortages and maintain irrigation during drought conditions (e.g., [39]).
From a basin-management perspective, conjunctive use remains an important but delicate instrument. Groundwater pumping imposes energy and maintenance costs and carries an intertemporal opportunity cost because aquifer recovery is slow and depletion reduces future water availability [7,40,41]. In addition, groundwater levels influence riparian ecosystems and connected surface-water systems in many Southwestern basins like MRGB [21]. As a result, strategies that treat surface water as the primary supply and groundwater as a supplemental drought buffer can reduce both short-run pumping costs and long-run depletion risks, consistent with the economics of groundwater as a stock resource [8,42,43].
Policy design, therefore, matters. In the MRGB, effective drought planning may require (i) improving mechanisms for voluntary, compensated short-run reductions in irrigation demand (e.g., leasing and rotational fallowing programs), (ii) ensuring that shortage-sharing arrangements are perceived as legitimate by both smallholders and commercial operations, and appropriately tailored to these different types as needed; and (iii) carefully evaluating any expansion of groundwater reliance to avoid unintended aquifer impacts. Cooperative approaches, rather than strictly top-down mandates, may be especially important in a basin characterized by many small irrigators and culturally embedded irrigation practices [23,31]. The results suggest that long-term water management in the Middle Rio Grande must integrate social heterogeneity, crop system realities, and differentiated drought resilience, not only hydrologic constraints.
6. Conclusions
Recent basin-wide technical analysis for the Rio Grande/Rio Bravo in the United States and Mexico shows that consumptive water use in the river system overall is on an unsustainable path, and this includes the Middle Rio Grande sub-basin in New Mexico (U.S.) [9]. Focusing on the portion of the Rio Grande running through the state of New Mexico, it has recently been estimated that 85% of consumptive use (direct and indirect) is overconsumption, or, put differently, unsustainable going forward. Within the Middle Rio Grande of New Mexico, direct consumption (excluding reservoir evaporation and riparian ET) is predominated by agriculture (roughly 90%), which is in turn predominated by the growing of alfalfa and other hay crops [9]. As noted elsewhere [44], municipal water use in most metropolitan areas in the Western U.S. has downward trends in both total and per capita water use, including Albuquerque, the major urban area in the MRGB. The implication is that much of the realistic solution space for moving towards sustainability may involve reductions in consumptive agricultural uses.
It is common to treat the agricultural sector in a region as one amalgamated whole, ignoring the often inherent multifunctionality. We start by recognizing the data sovereignty of six Native American Pueblo irrigation activities in our region and place our focus on the two sharply distinct irrigated agricultures operating in the same management region, MRGB in New Mexico, USA. Using new tools (e.g., OpenET) and uniquely combined datasets, this investigation provides an analytical and spatially explicit assessment of irrigated agriculture and consumptive water use in the MRGB, linking irrigator farm size, crop choice, groundwater access, and evapotranspiration. The empirical analysis demonstrates several key structural patterns. Specifically, the results show that (i) micro- and small-scale irrigator farms collectively account for the majority of basin-wide evapotranspiration, (ii) forage crops, particularly alfalfa and other hay, dominate crop composition and consumptive water use, and (iii) groundwater access is disproportionately concentrated among larger farms. Agricultural water demand in the basin is not dominated by a small number of large producers, but instead emerges from the cumulative behavior of thousands of micro- and small-scale irrigator farms, which together account for the majority of consumptive use as measured by evapotranspiration. At the same time, groundwater access, and therefore drought resilience, is highly concentrated among large farms, creating a structurally differentiated agricultural system.
Forage crops, particularly alfalfa and other hay, account for nearly three-quarters of total crop evapotranspiration. These crops are well adapted to the basin’s climate and to part-time and lifestyle-oriented farming, but they generate relatively low economic value per unit of water. The empirical results, therefore, indicate that crop composition plays a central role in shaping basin-wide consumptive water use. This imbalance suggests that meaningful water savings or reallocations could potentially occur under appropriately designed voluntary programs, although the magnitude of such effects would depend on participation rates and implementation details.
From a long-term resource management and policy perspective, the findings suggest three broad considerations. First, water-management strategies may need to account for the dominance of small irrigator farms. Second, alfalfa-based systems offer a promising entry point for water savings through seasonal deficit irrigation and compensated fallowing without requiring wholesale crop conversion. Third, conjunctive use and drought-response planning should recognize the unequal distribution of groundwater access and avoid shifting risks disproportionately onto surface-water-dependent smallholders.
These findings contribute to the broader sustainability literature by identifying structural drivers of agricultural water demand and highlighting pathways for improving the long-term resilience and sustainability of irrigated agriculture in dryland river basins. Results also suggest that meaningful water savings in the MRGB are more likely to arise from coordinated, basin-wide engagement with small irrigators and forage-crop systems than from policies targeting only a few large farms. Blending the region’s long-standing irrigation traditions with flexible, incentive-based water management may provide a viable pathway to sustaining agriculture, ecosystems, and communities under increasing climatic and institutional pressures.
From an economics and resource-management perspective, the commercial value of consumptive water use per 103 m3 [acre foot] in irrigated agriculture in the MRGB is relatively well investigated. For example, recent research has found values in the range of $48–$185 per acre foot [45], which is generally consistent with other studies [46]. But what is harder to measure and thus poorly understood is the value of consumptive water use per 103 m3 [acre foot] in non-commercial applications, associated with custom, culture, and lifestyle values in farming. This research empirically demonstrates how distinctly important these consumptive uses are in relative size and scale for this arid region. Monetizing, or at least better understanding these utility values, will take creative investigation. We hope that this analysis spurs such future research.
Supplementary Materials
The following supporting information can be downloaded at: https://www.mdpi.com/article/10.3390/su18073191/s1.
Author Contributions
Conceptualization, O.A.O., J.W. and R.P.B.; methodology, O.A.O., J.W. and R.P.B.; data, O.A.O. and R.P.B.; data curation, O.A.O.; formal analysis, O.A.O.; validation, O.A.O., J.W. and R.P.B.; writing—original draft preparation, O.A.O.; writing—review and editing, O.A.O., J.W. and R.P.B.; supervision, O.A.O., J.W. and R.P.B. All authors have read and agreed to the published version of the manuscript.
Funding
This research received external funding from New Mexico Water Resources Research Institute, NMWRRI22-23-Q02368; and The UNM Center for Regional Studies, CRS23-24-OO.
Institutional Review Board Statement
Not applicable.
Informed Consent Statement
Not applicable.
Data Availability Statement
The datasets analyzed in this study are available from publicly accessible sources. Crop and land-use data are obtained from the Middle Rio Grande Conservancy District ISOLog database. Evapotranspiration data are derived from the OpenET platform, and precipitation data are obtained from the GRIDMET gridded meteorological dataset. Groundwater well data are obtained from the New Mexico Office of the State Engineer. The processed datasets and aggregated analytical results used in this study are reported within the manuscript and its Supplementary Materials. Additional processed spatial datasets and analytical outputs are available from the corresponding author upon reasonable request.
Acknowledgments
The authors thank the Middle Rio Grande Conservancy District (MRGCD) and John Fleck for their assistance with the MRGCD ISOLog dataset and groundwater well dataset. During the preparation of this manuscript, O.O used ChatGPT (OpenAI, GPT-5.2) to assist with language editing, restructuring of sections, formatting to MDPI Sustainability journal style, and improvement of clarity and coherence of the original text. The authors reviewed and edited all generated content and take full responsibility for the content of this publication.
Conflicts of Interest
The author declares no conflicts of interest.
Abbreviations
The following abbreviations are used in this manuscript:
| Abbreviation | Definition |
| 103 m3 | Thousand cubic meters |
| AF | Acre-feet |
| ET | Evapotranspiration |
| EWLP | Environmental Water Leasing Program |
| GDP | Gross Domestic Product |
| GIS | Geographic Information System |
| GRIDMET | Gridded Meteorological Dataset |
| ISOLog | Irrigated System Operational Log (MRGCD dataset) |
| MRGB | Middle Rio Grande Basin |
| MRGCD | Middle Rio Grande Conservancy District |
| NMOSE | New Mexico Office of the State Engineer |
| QGIS | Quantum Geographic Information System |
| UTM | Universal Transverse Mercator |
| USDA | United States Department of Agriculture |
| WGS 84 | World Geodetic System 1984 |
Appendix A
Appendix below presents figures that provide detailed visualizations of irrigator farm characteristics and agricultural water-use patterns in the Middle Rio Grande Basin. Because the key variables exhibit highly skewed distributions, multiple figures are shown using successive zoomed-in views. These alternative visualizations are intended to improve interpretability across the full range of observations, from micro-scale farms to large commercial operations, and to avoid masking distributional structure that would be obscured in single full-range plots. The appendix figures complement the summary statistics and results presented in the main text and provide additional transparency regarding the underlying distributional patterns.
Appendix A.1. Linear Distribution of Irrigator Farms
Figure A1.
Distribution of all irrigator farm hectarage.
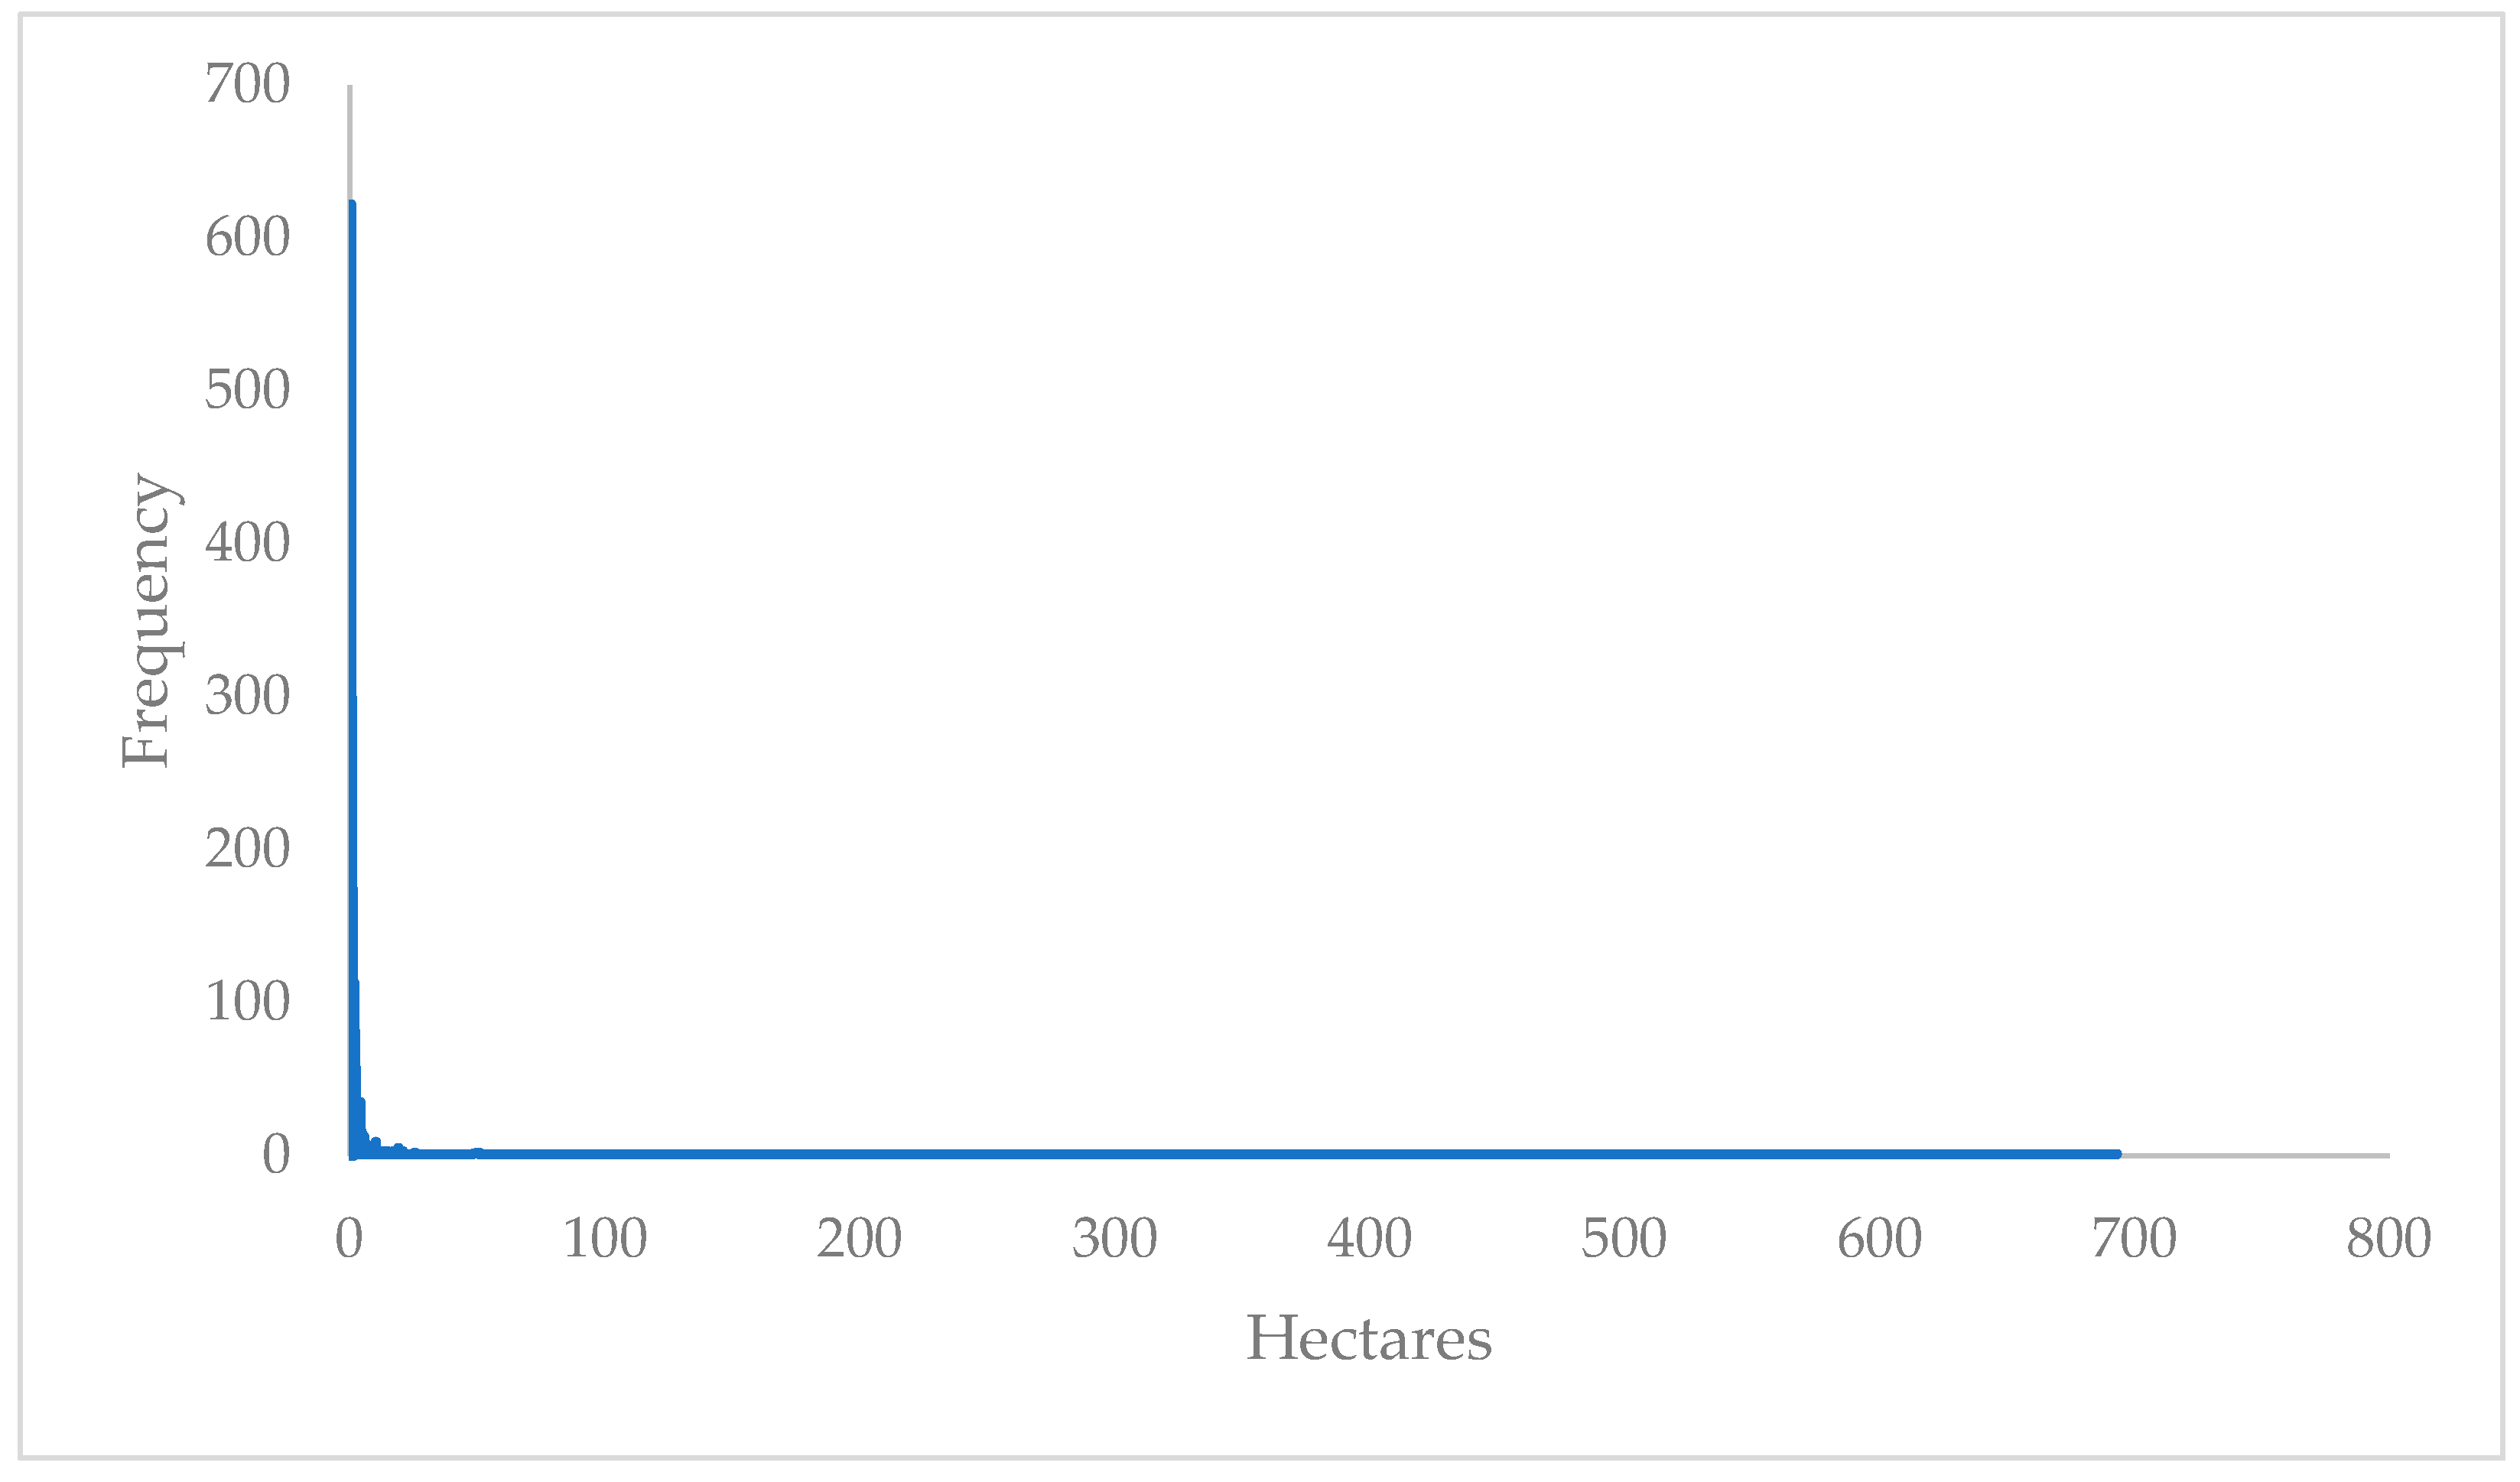
Figure A2.
Distribution of a less than 12-hectare irrigator farm.
Appendix A.2. Irrigator Farm Distribution by Size
Figure A3.
Irrigator farm distribution by size (zoomed–in view).
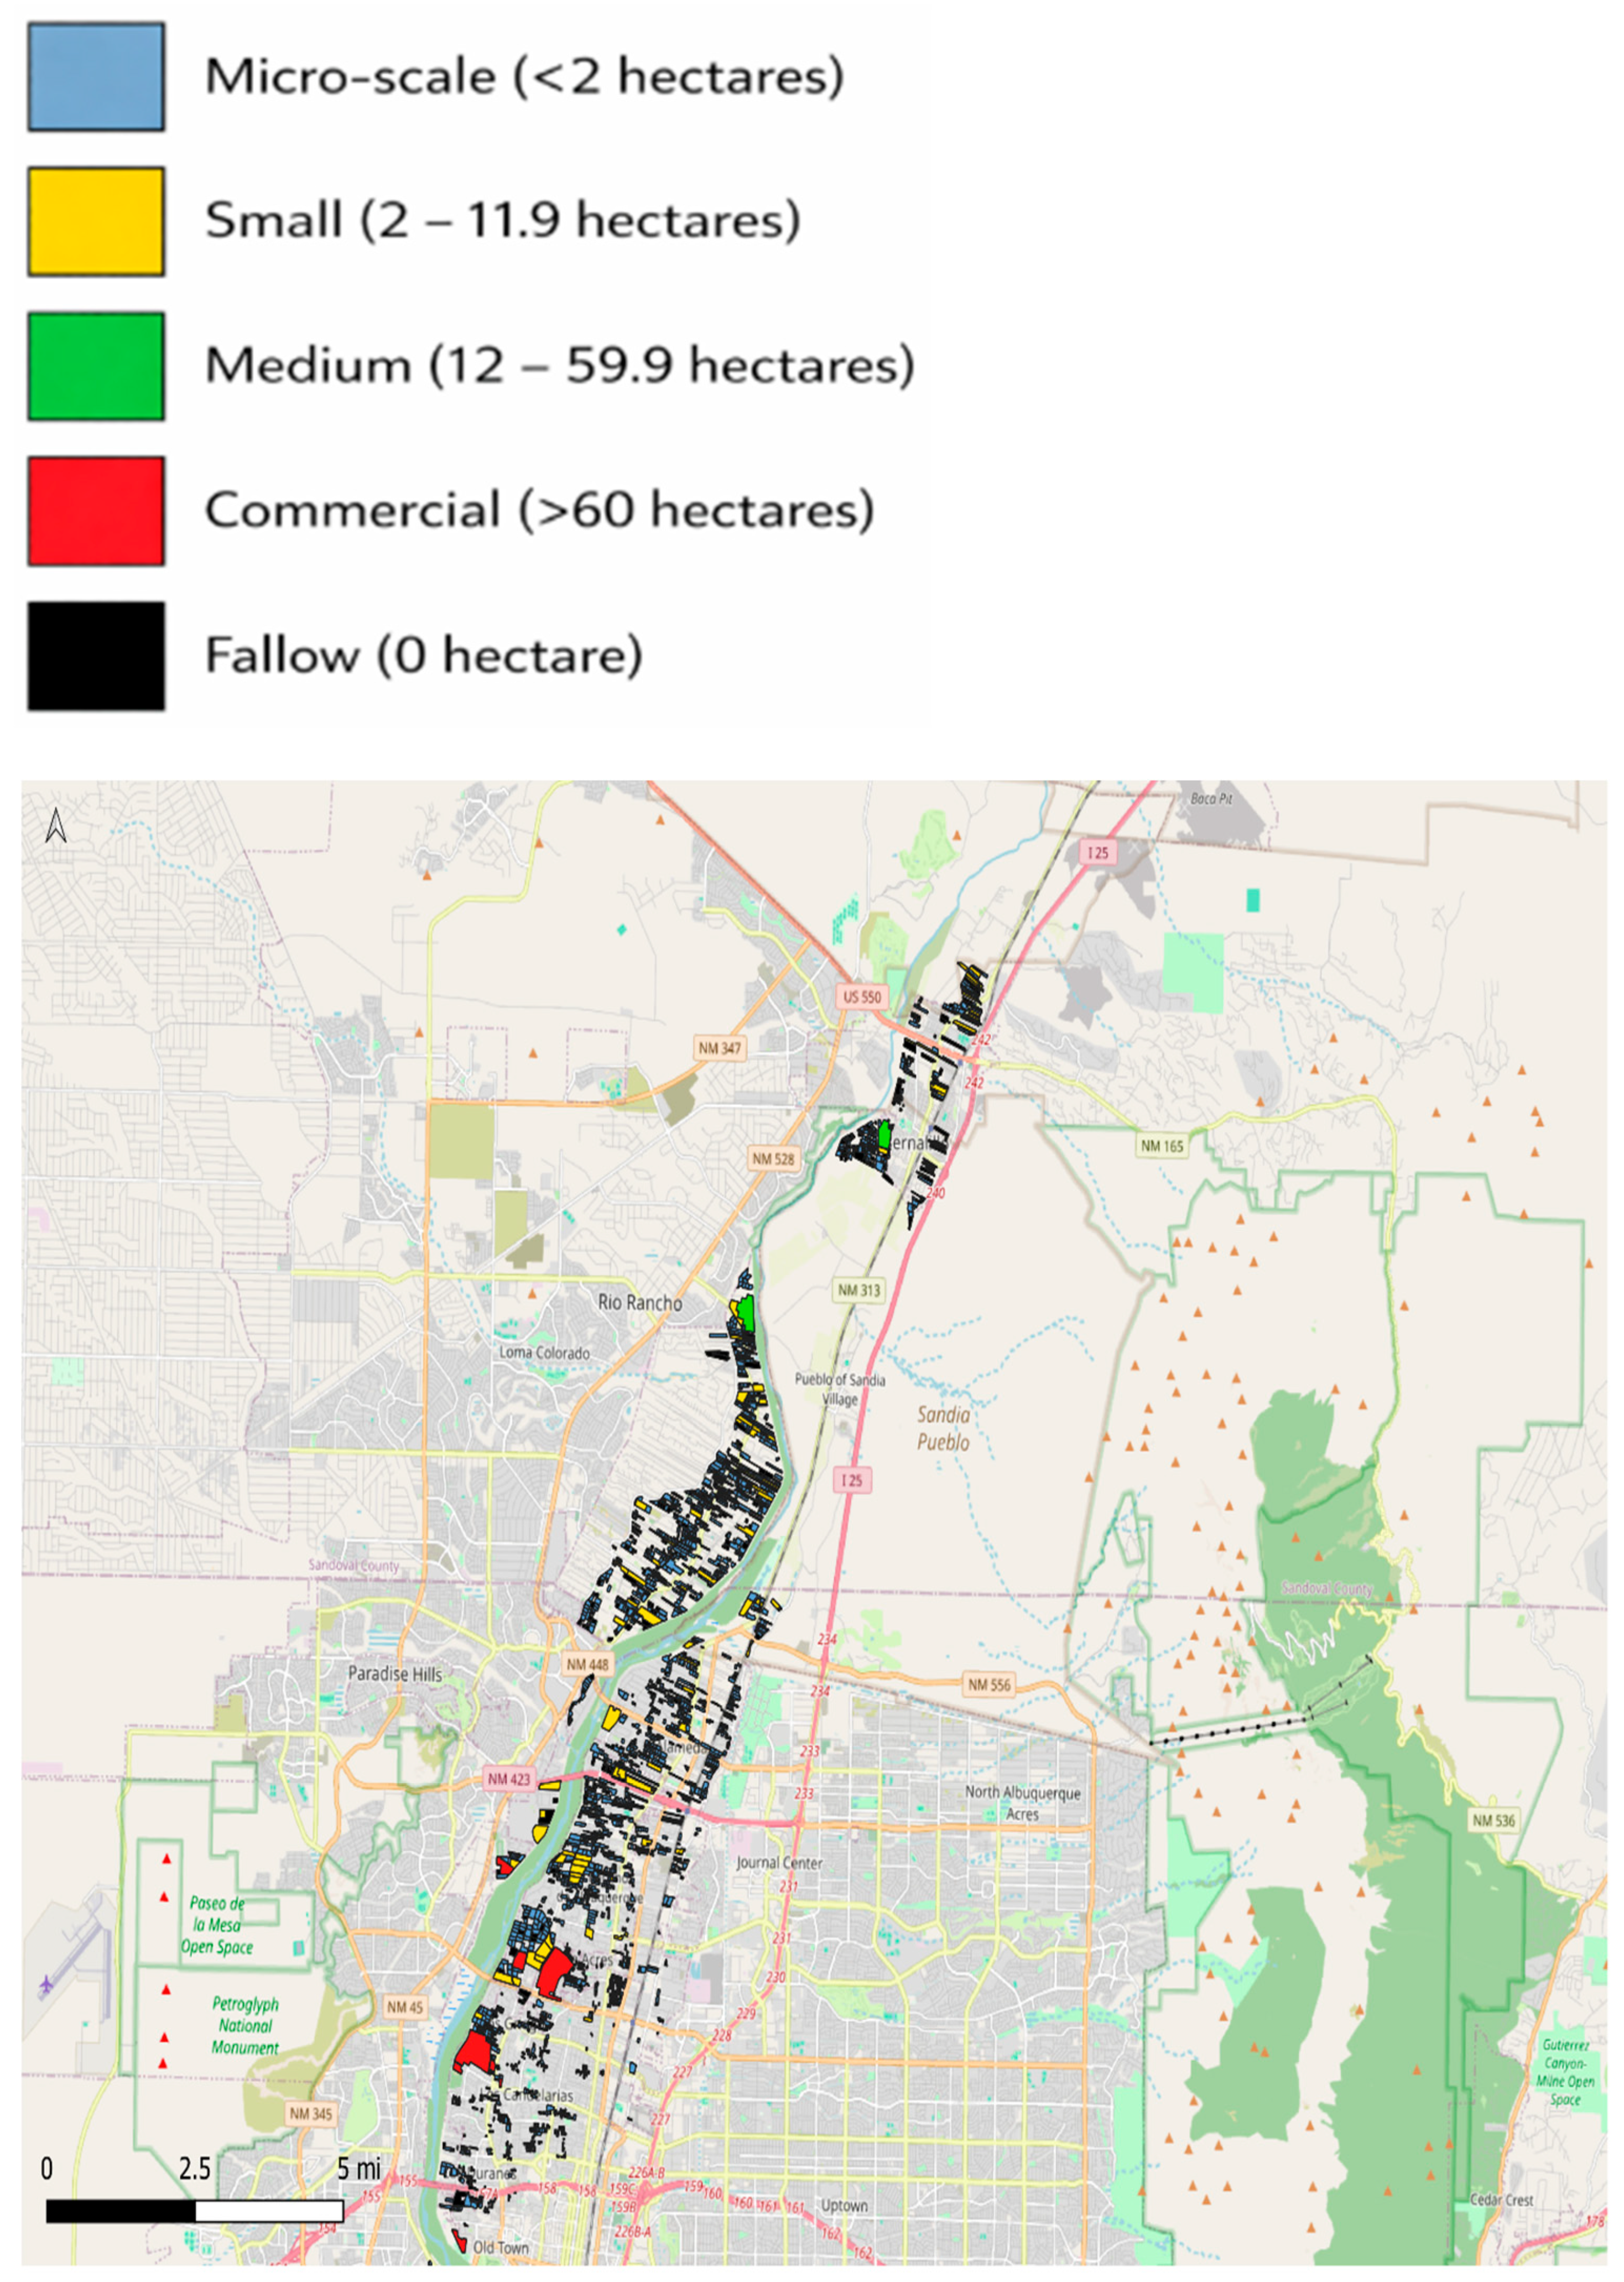
Figure A4.
Irrigator farm distribution by size (zoomed–in view, continued).
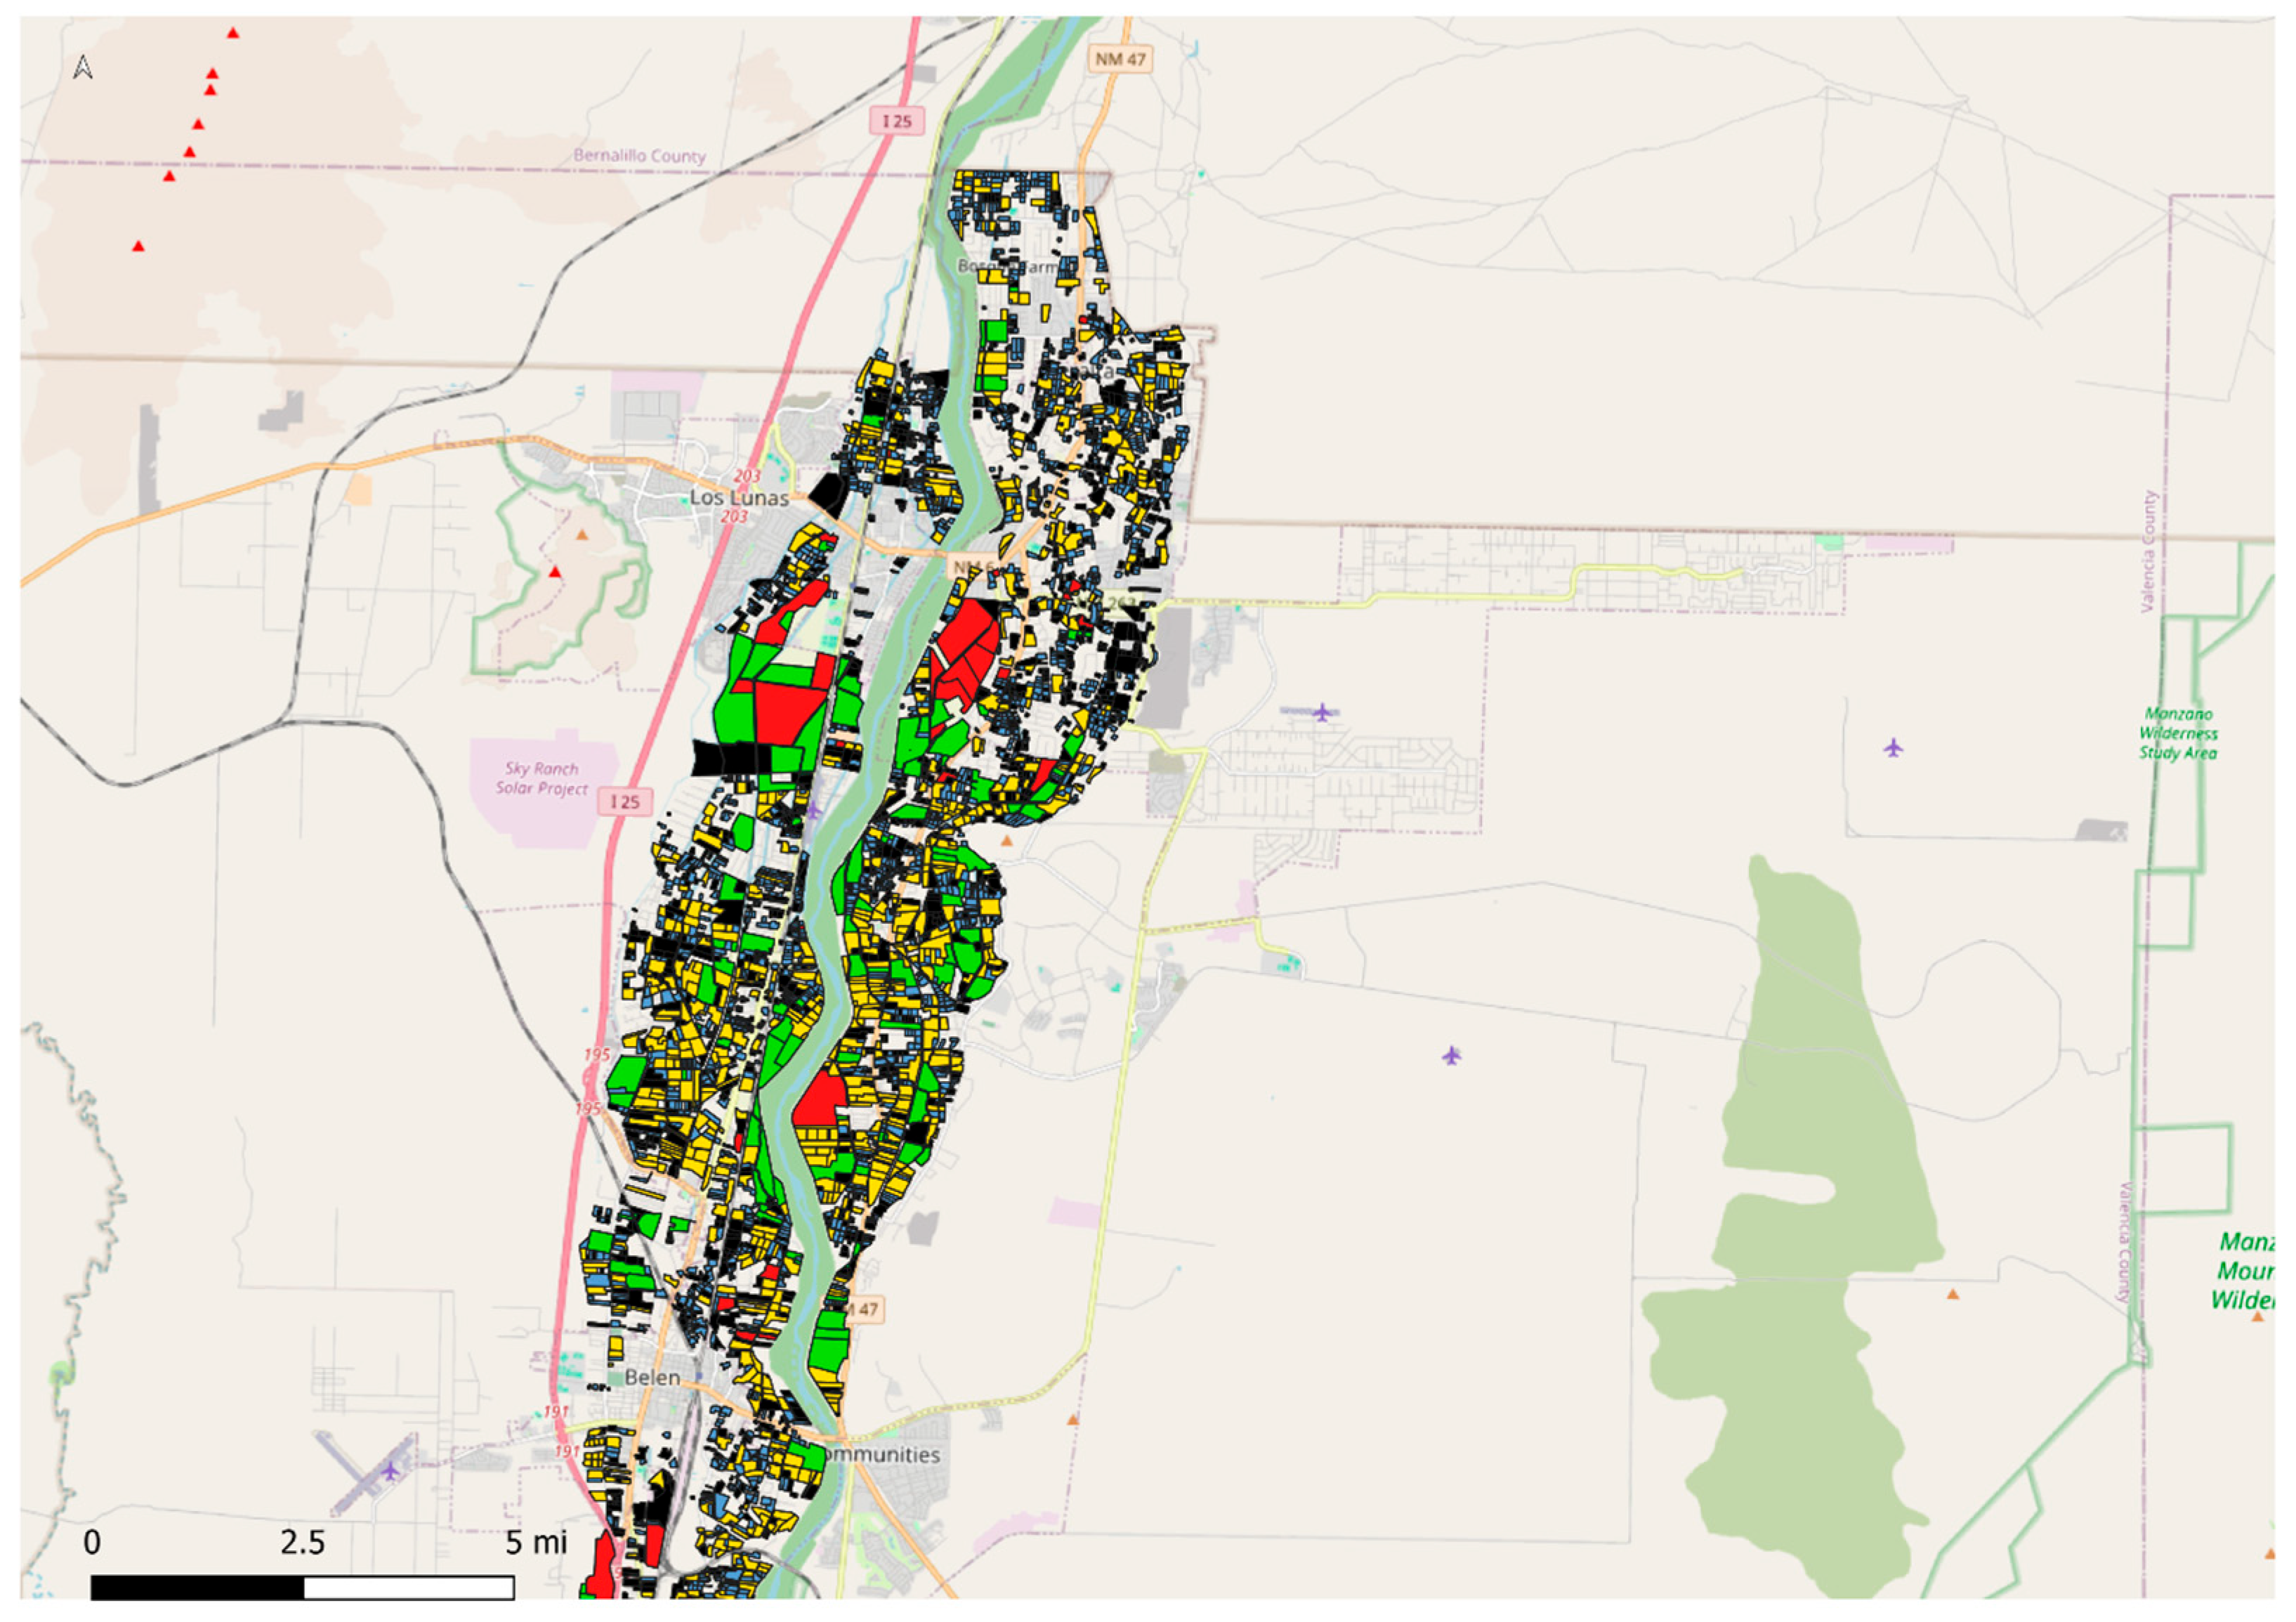
Figure A5.
Irrigator farm distribution by size (zoomed–in view, continued).
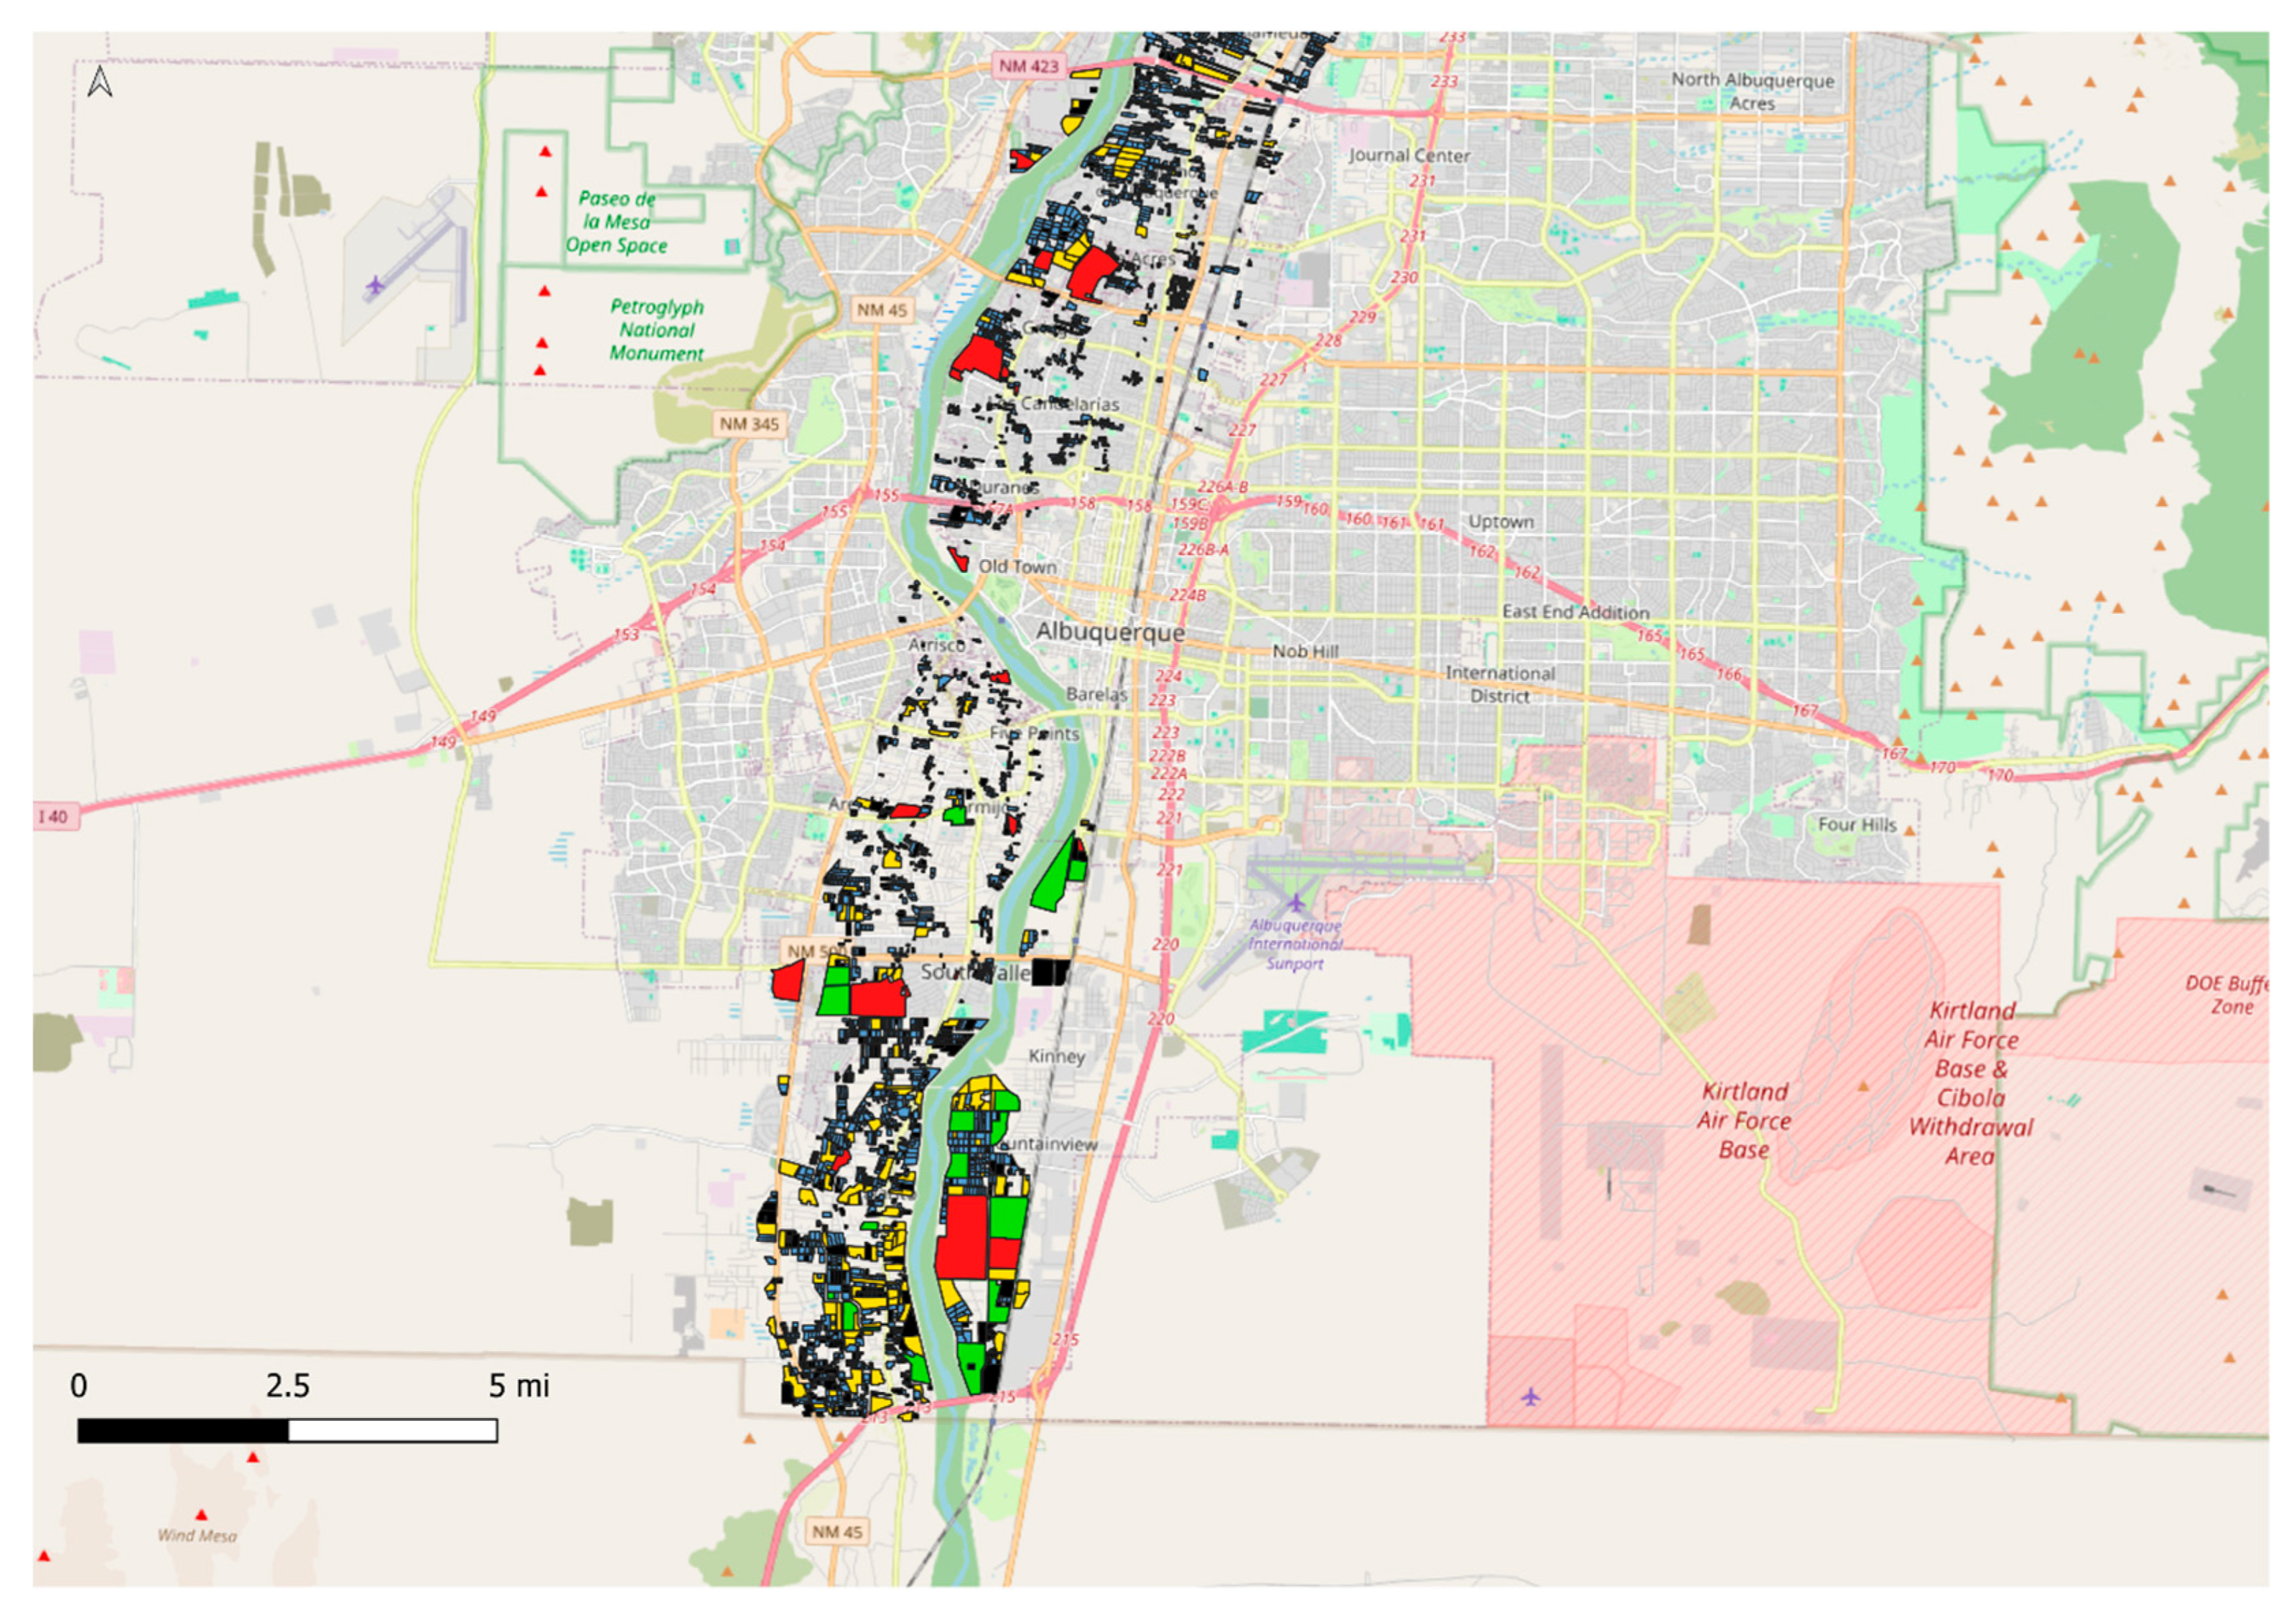
Figure A6.
Irrigator farm distribution by size (zoomed–in view, continued).
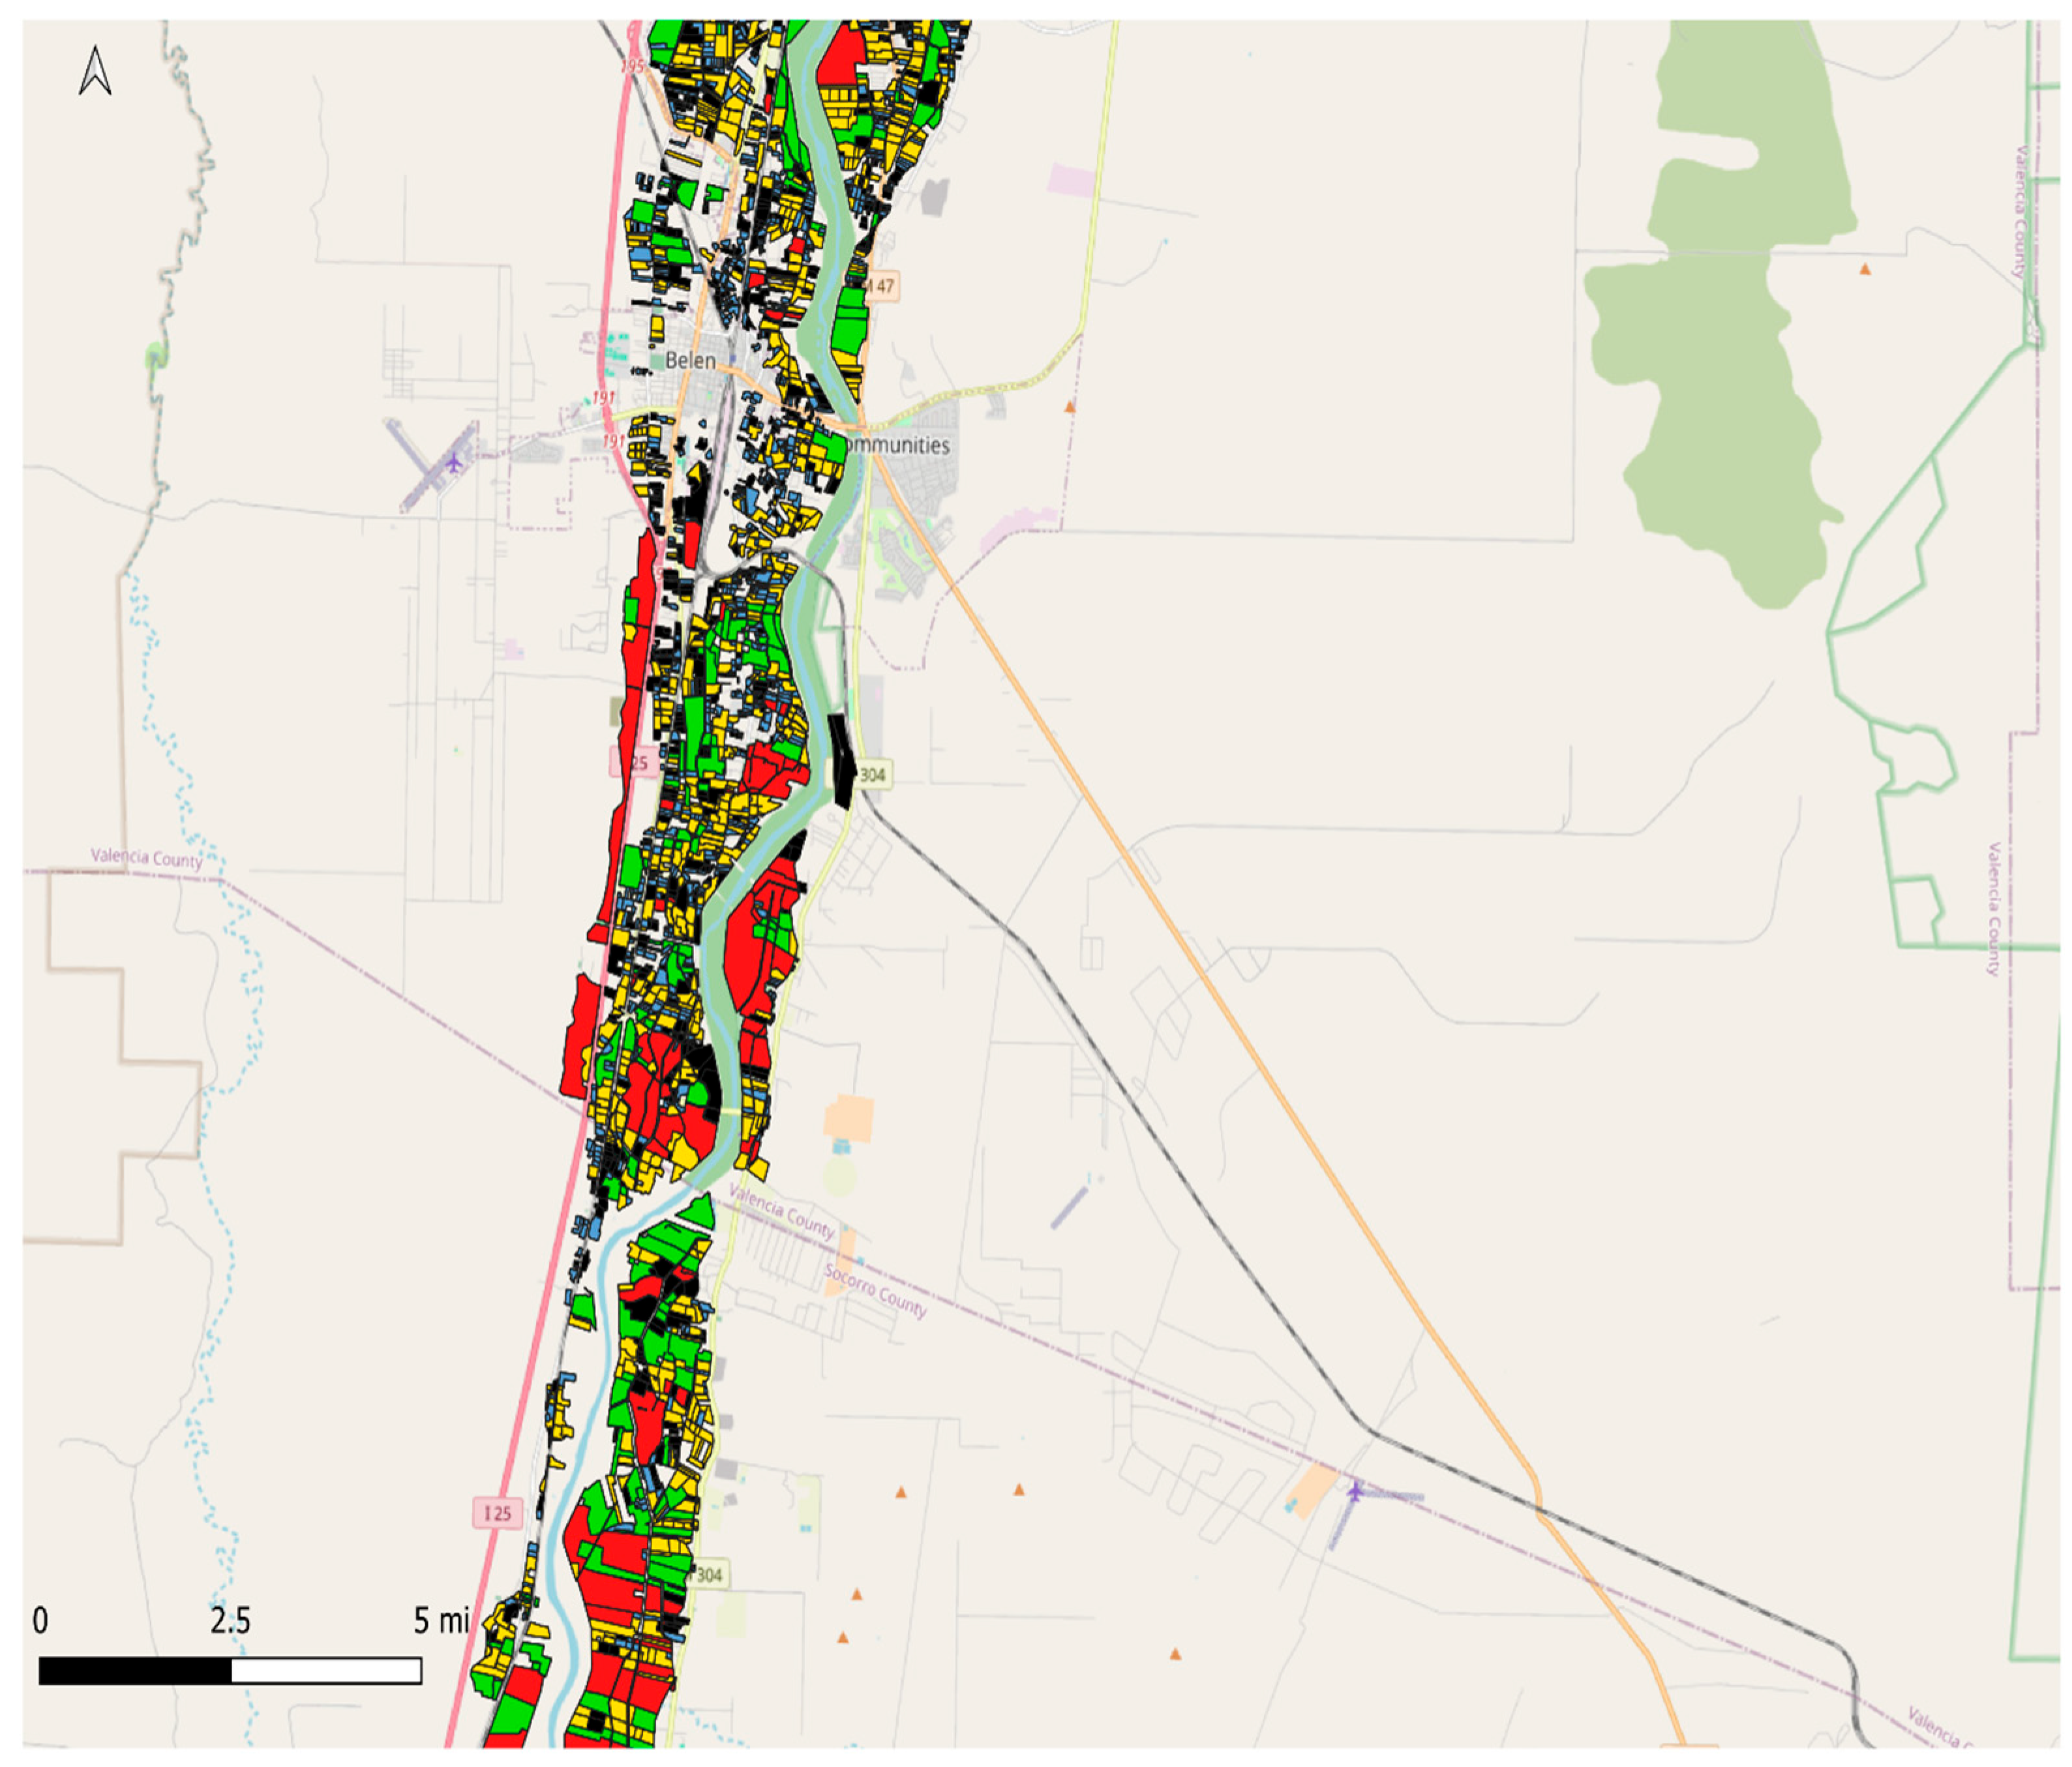
Figure A7.
Irrigator farm distribution by size (zoomed–in view, continued).
Appendix A.3. Irrigator Farm Distribution by Crop Type
Figure A8.
Irrigator farm distribution by crop (zoomed–in view).
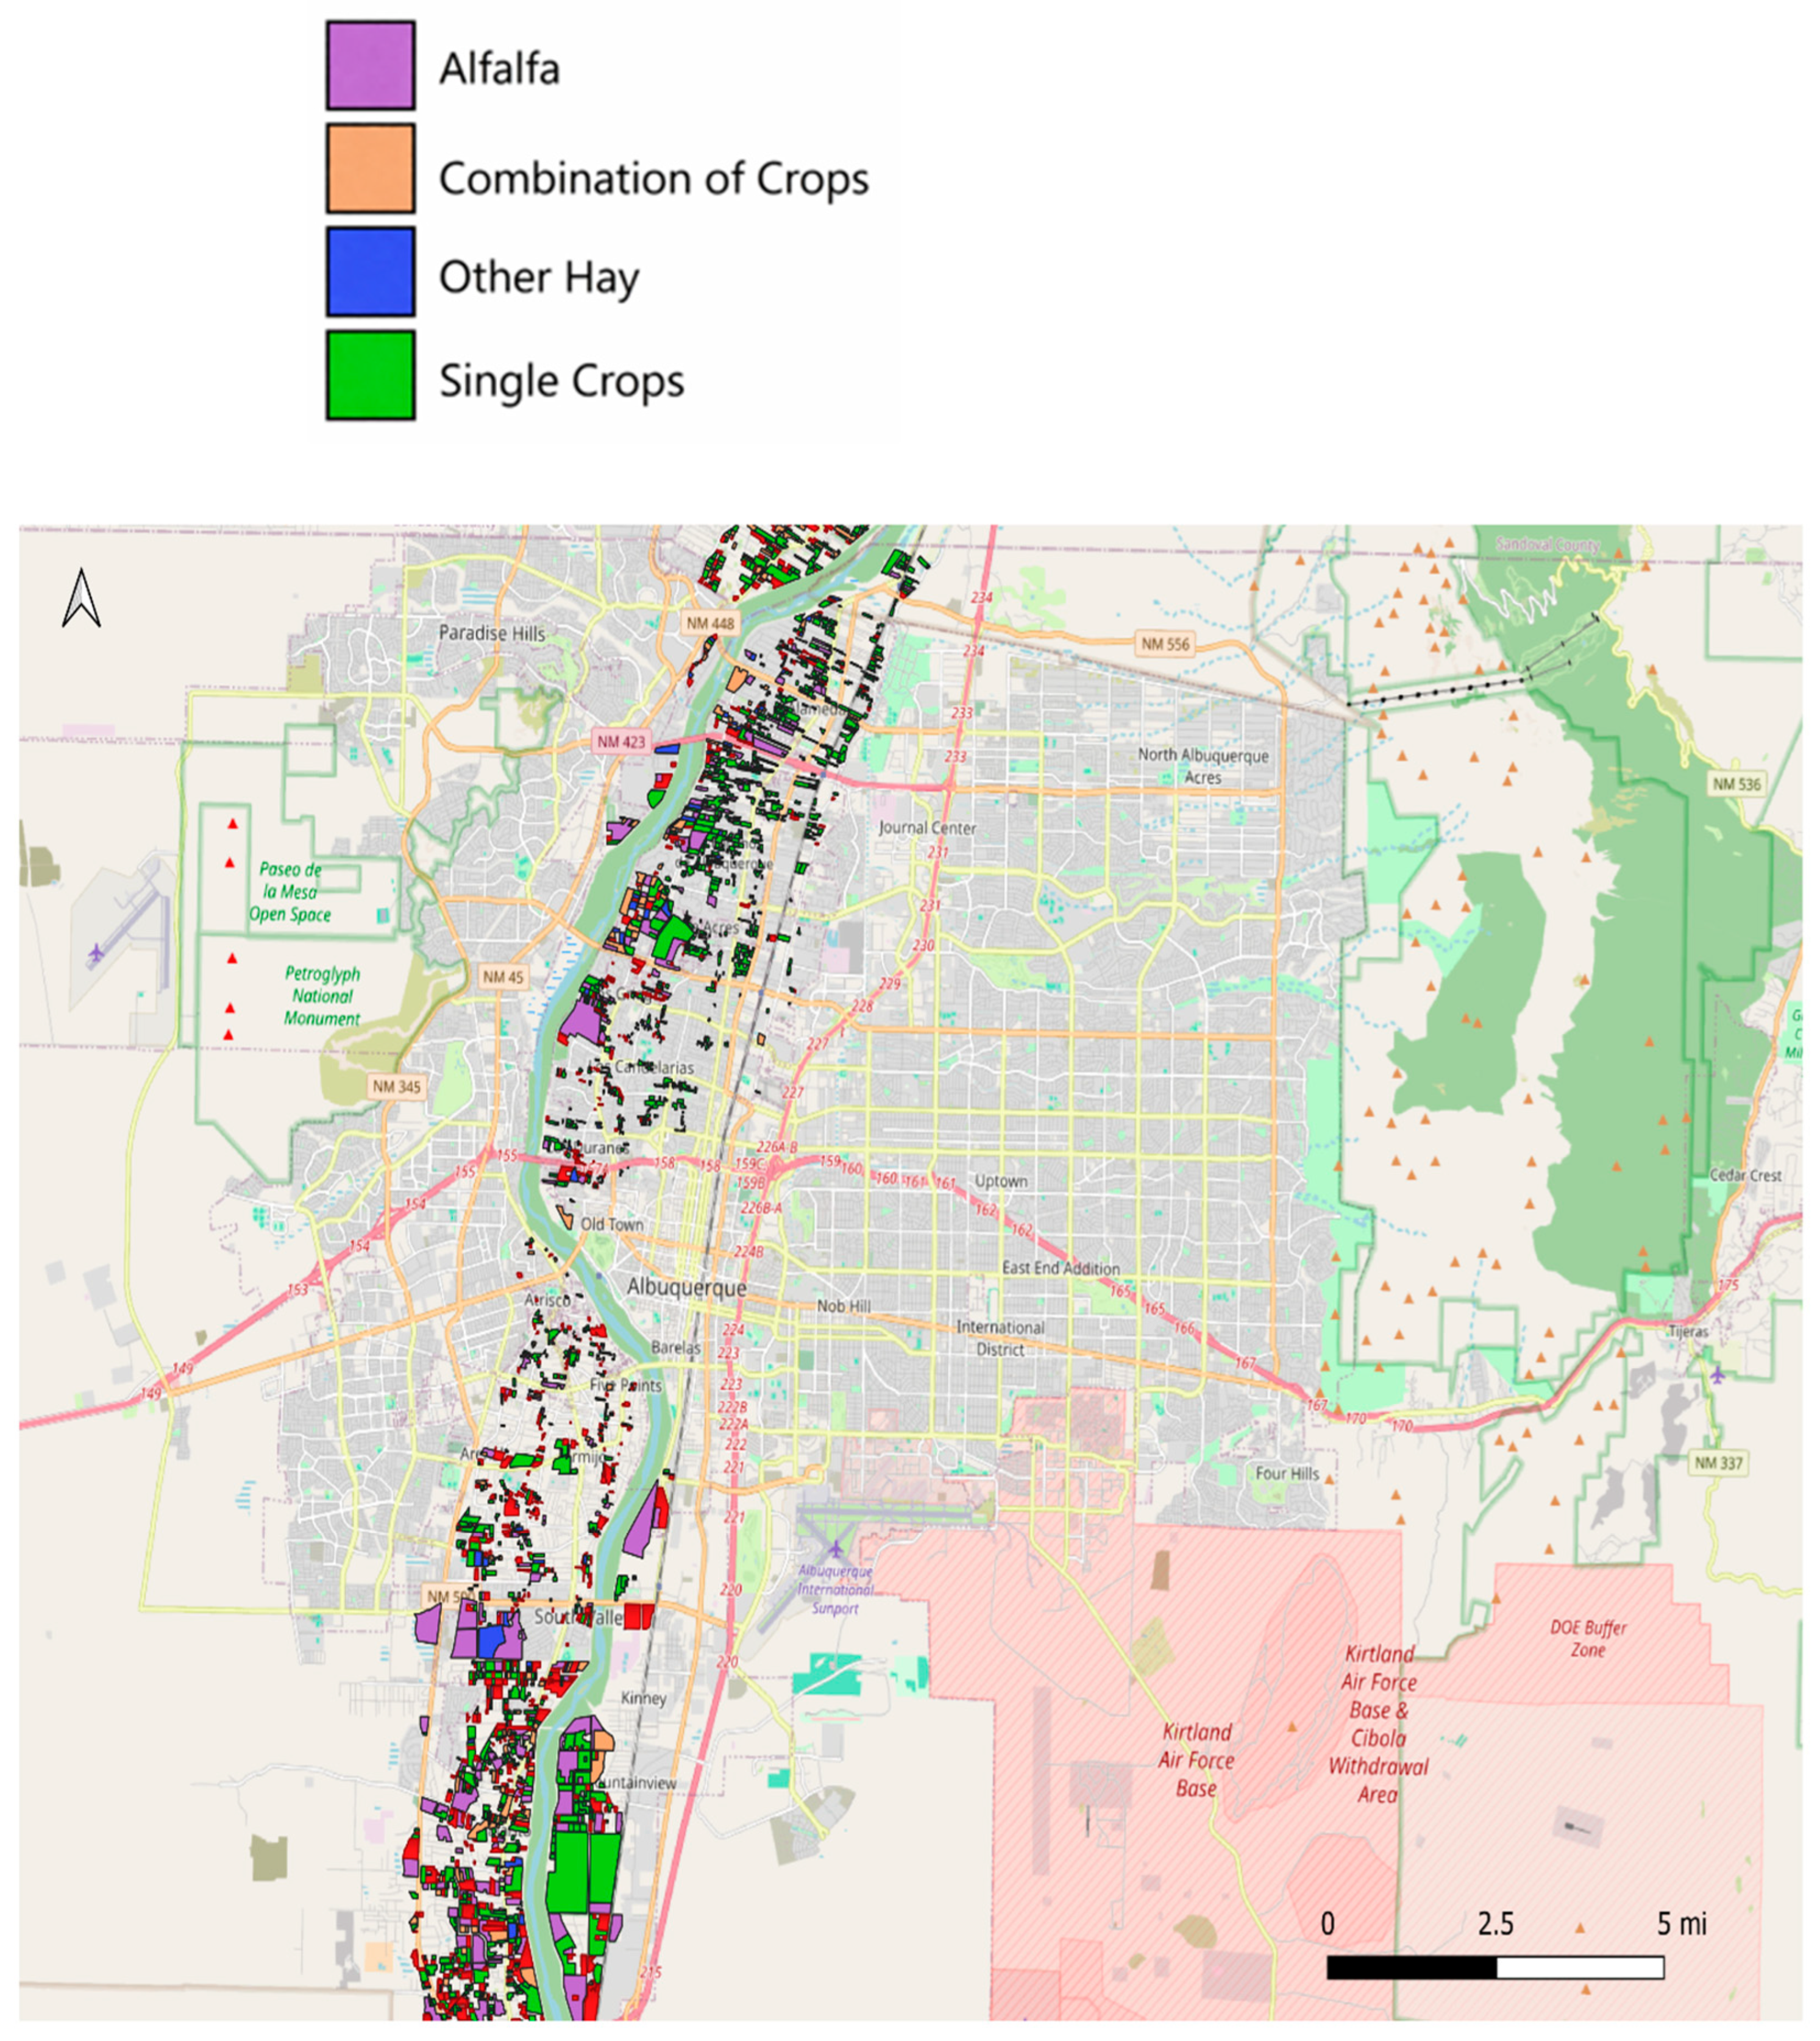
Figure A9.
Irrigator farm distribution by crop (zoomed–in view, continued).
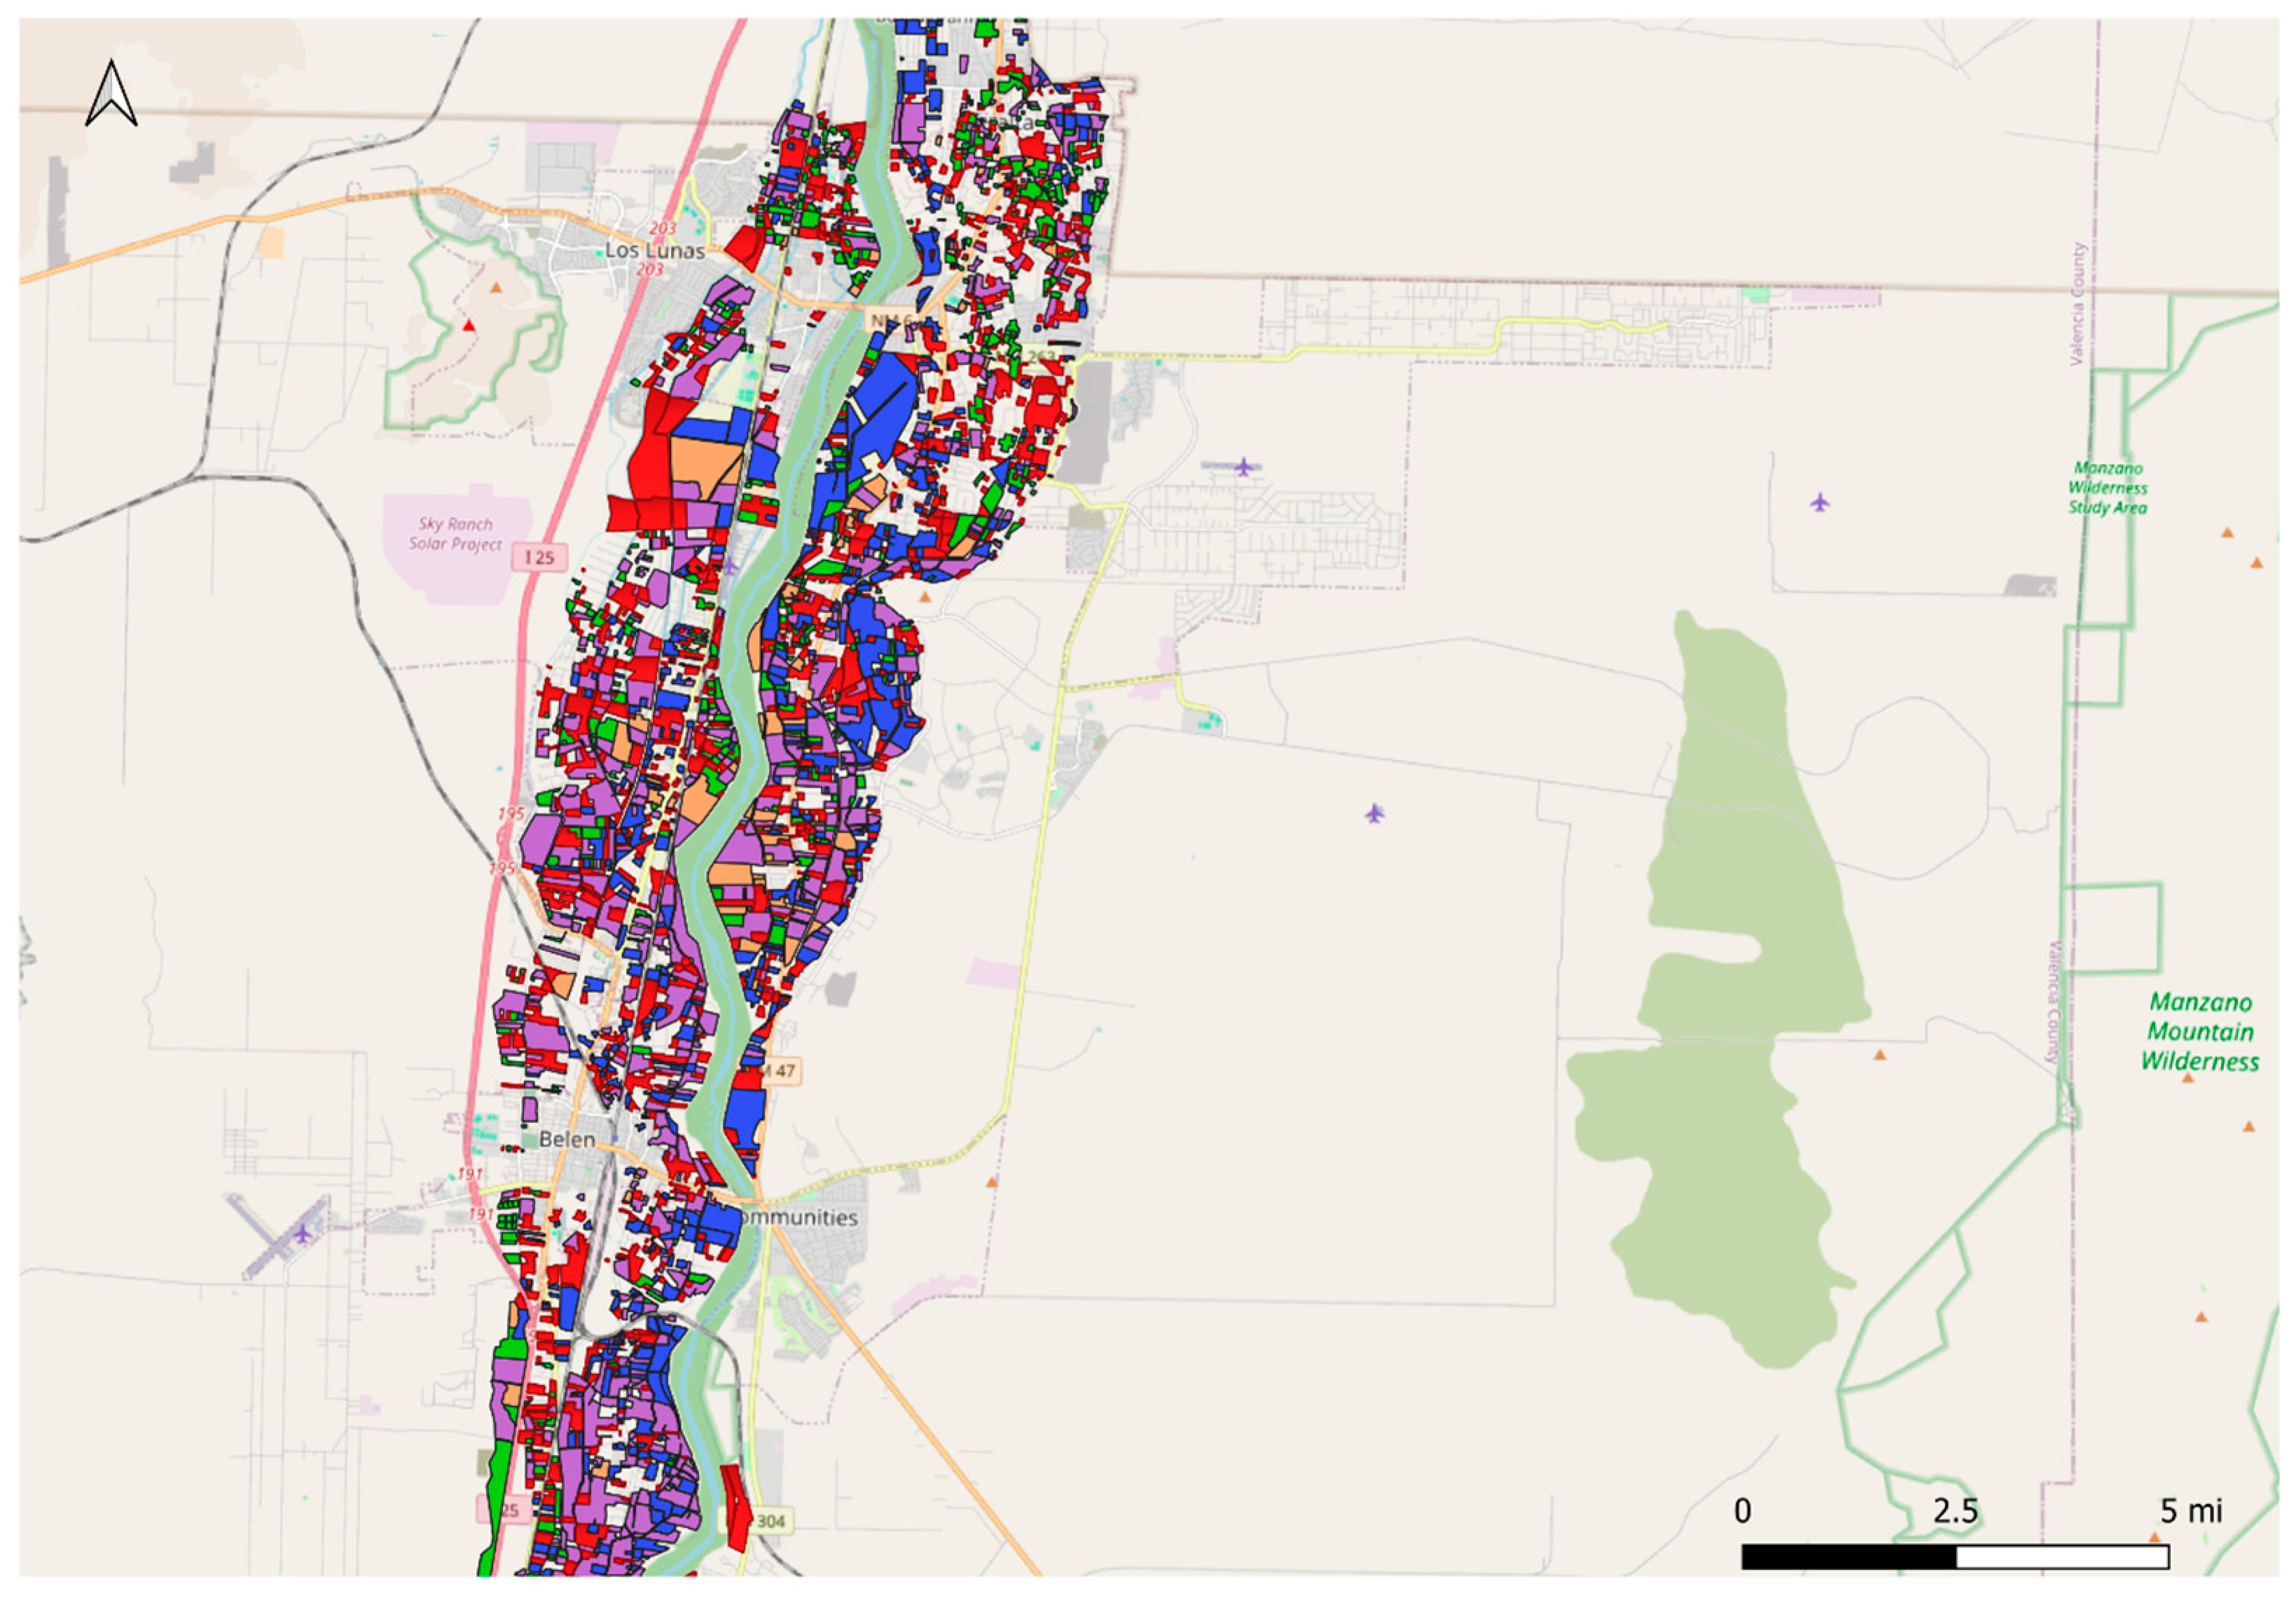
Figure A10.
Irrigator farm distribution by crop (zoomed–in view, continued).
Appendix A.4. Agricultural Wells Relative to Irrigator Farms
Figure A11.
Agricultural wells relative to irrigator farms (zoomed–in view).
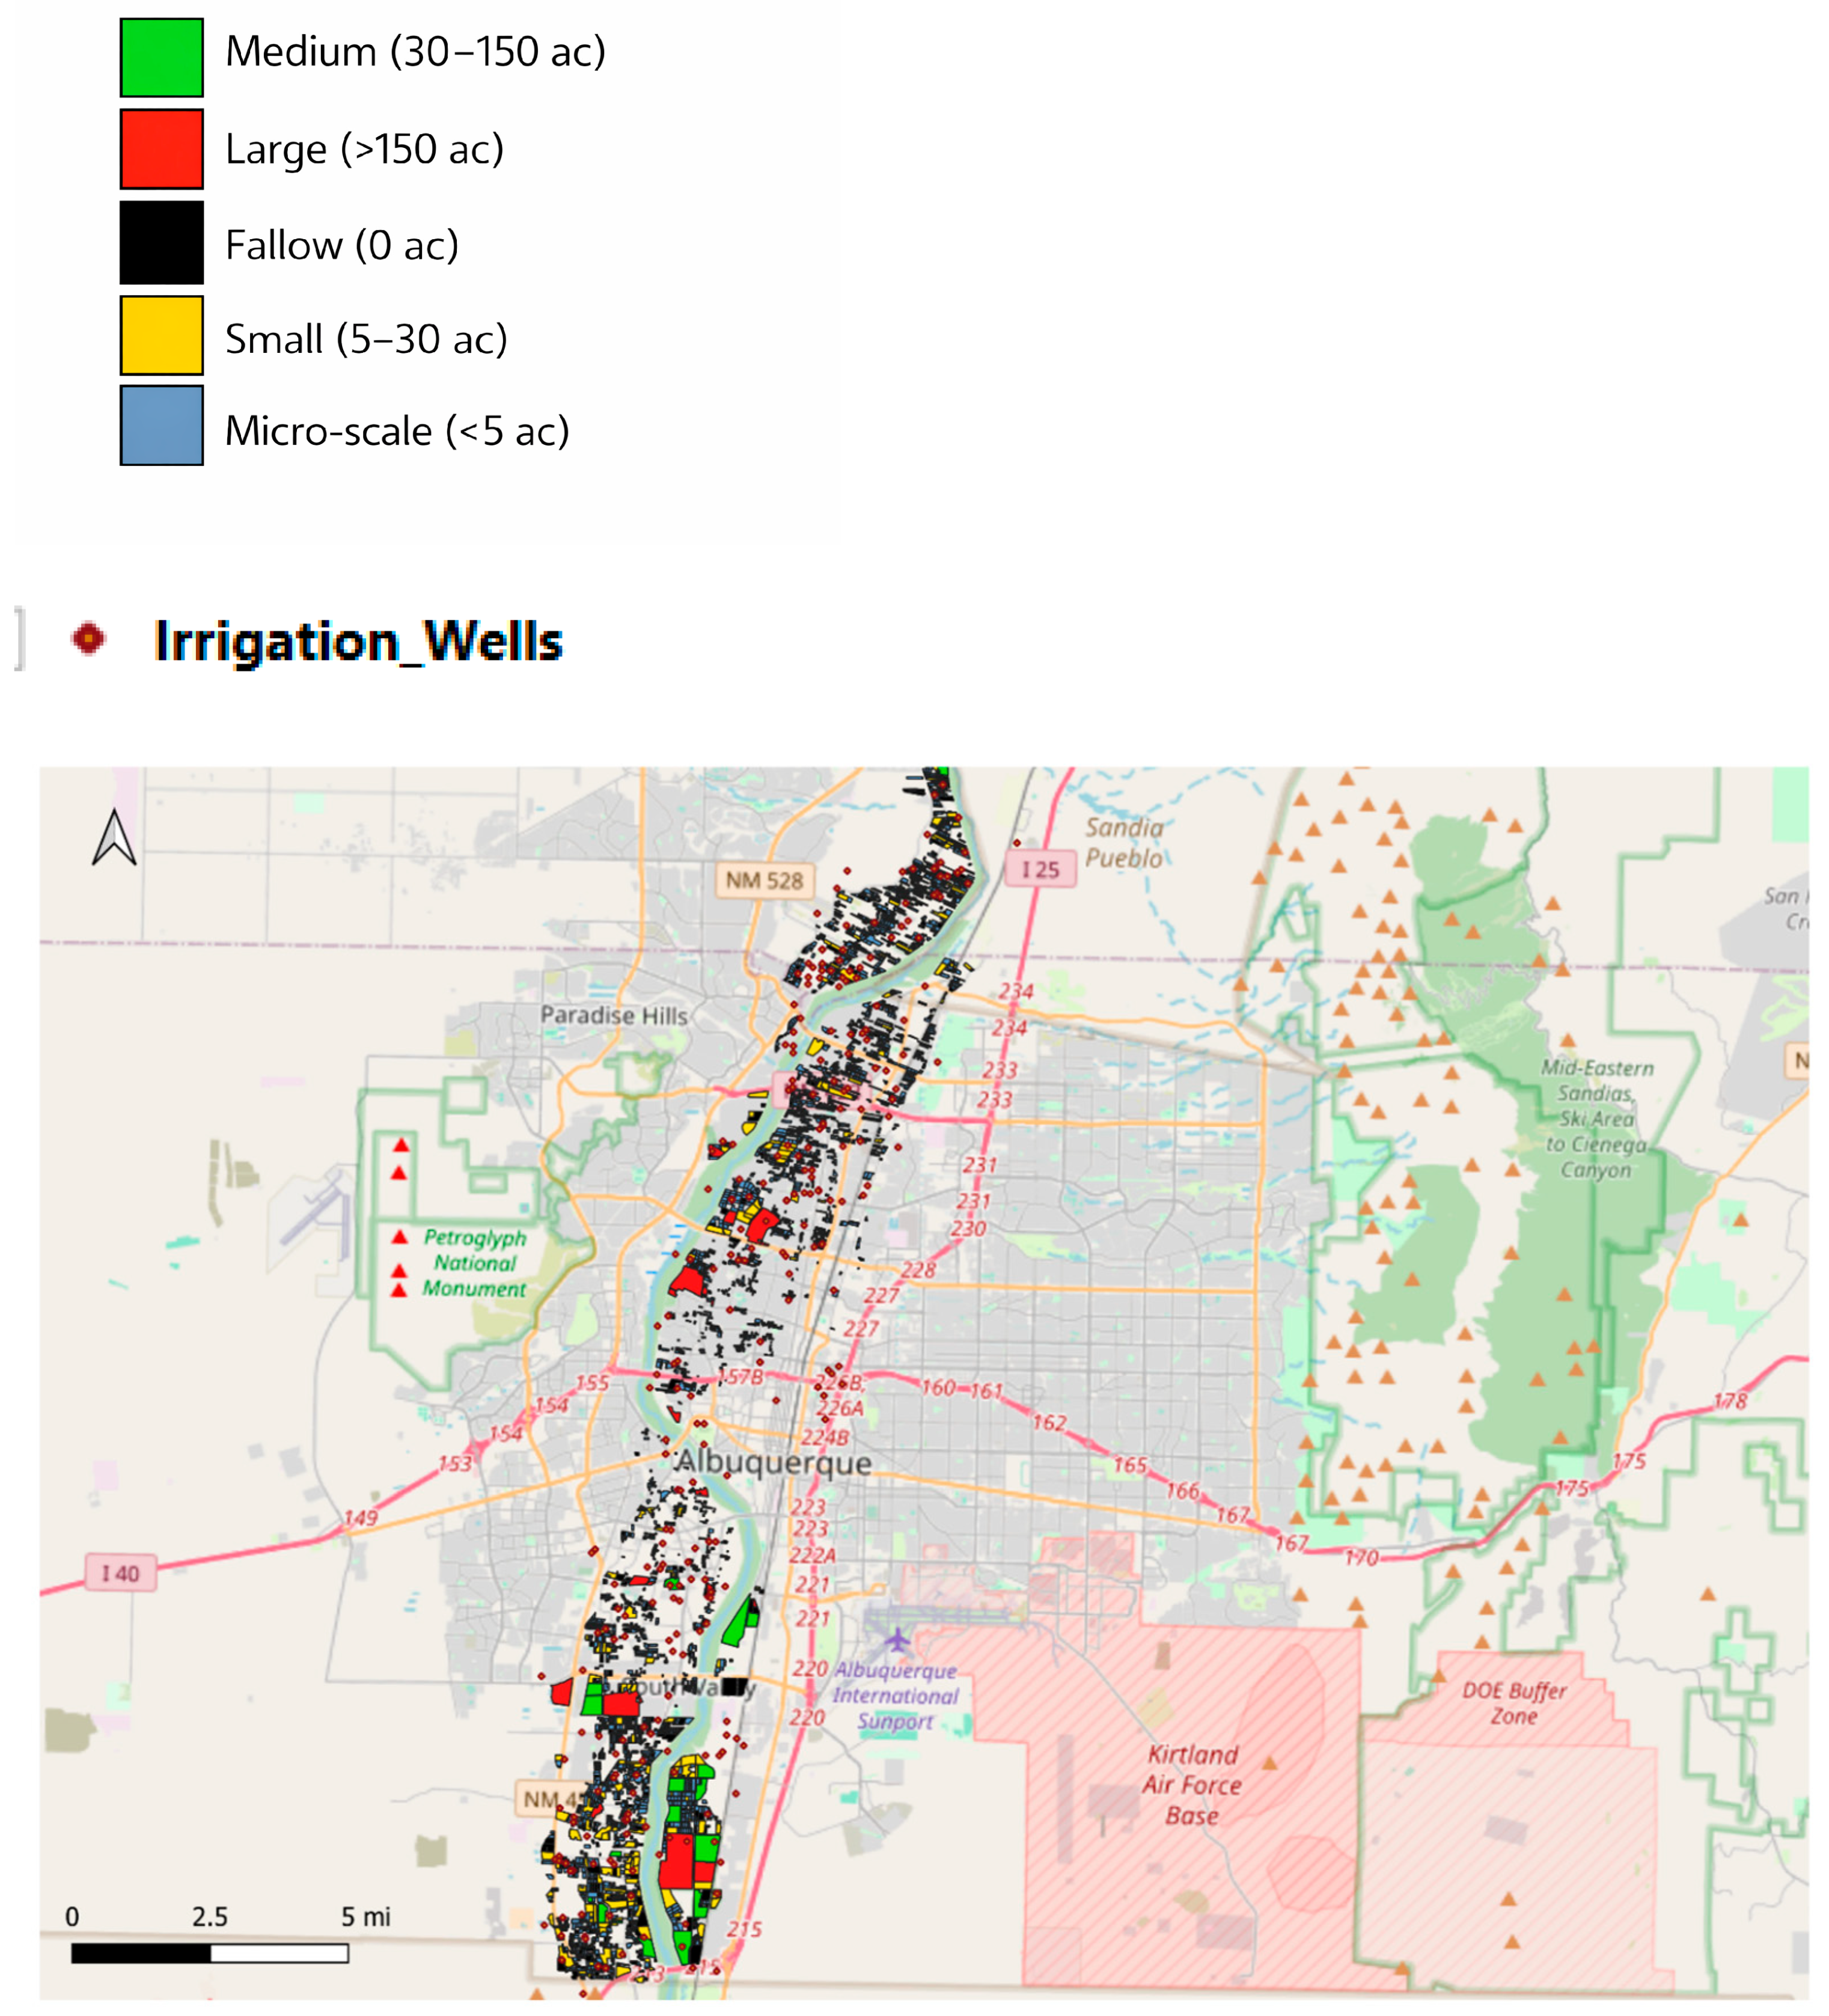
Figure A12.
Agricultural wells relative to irrigator farms (zoomed–in view, continued).
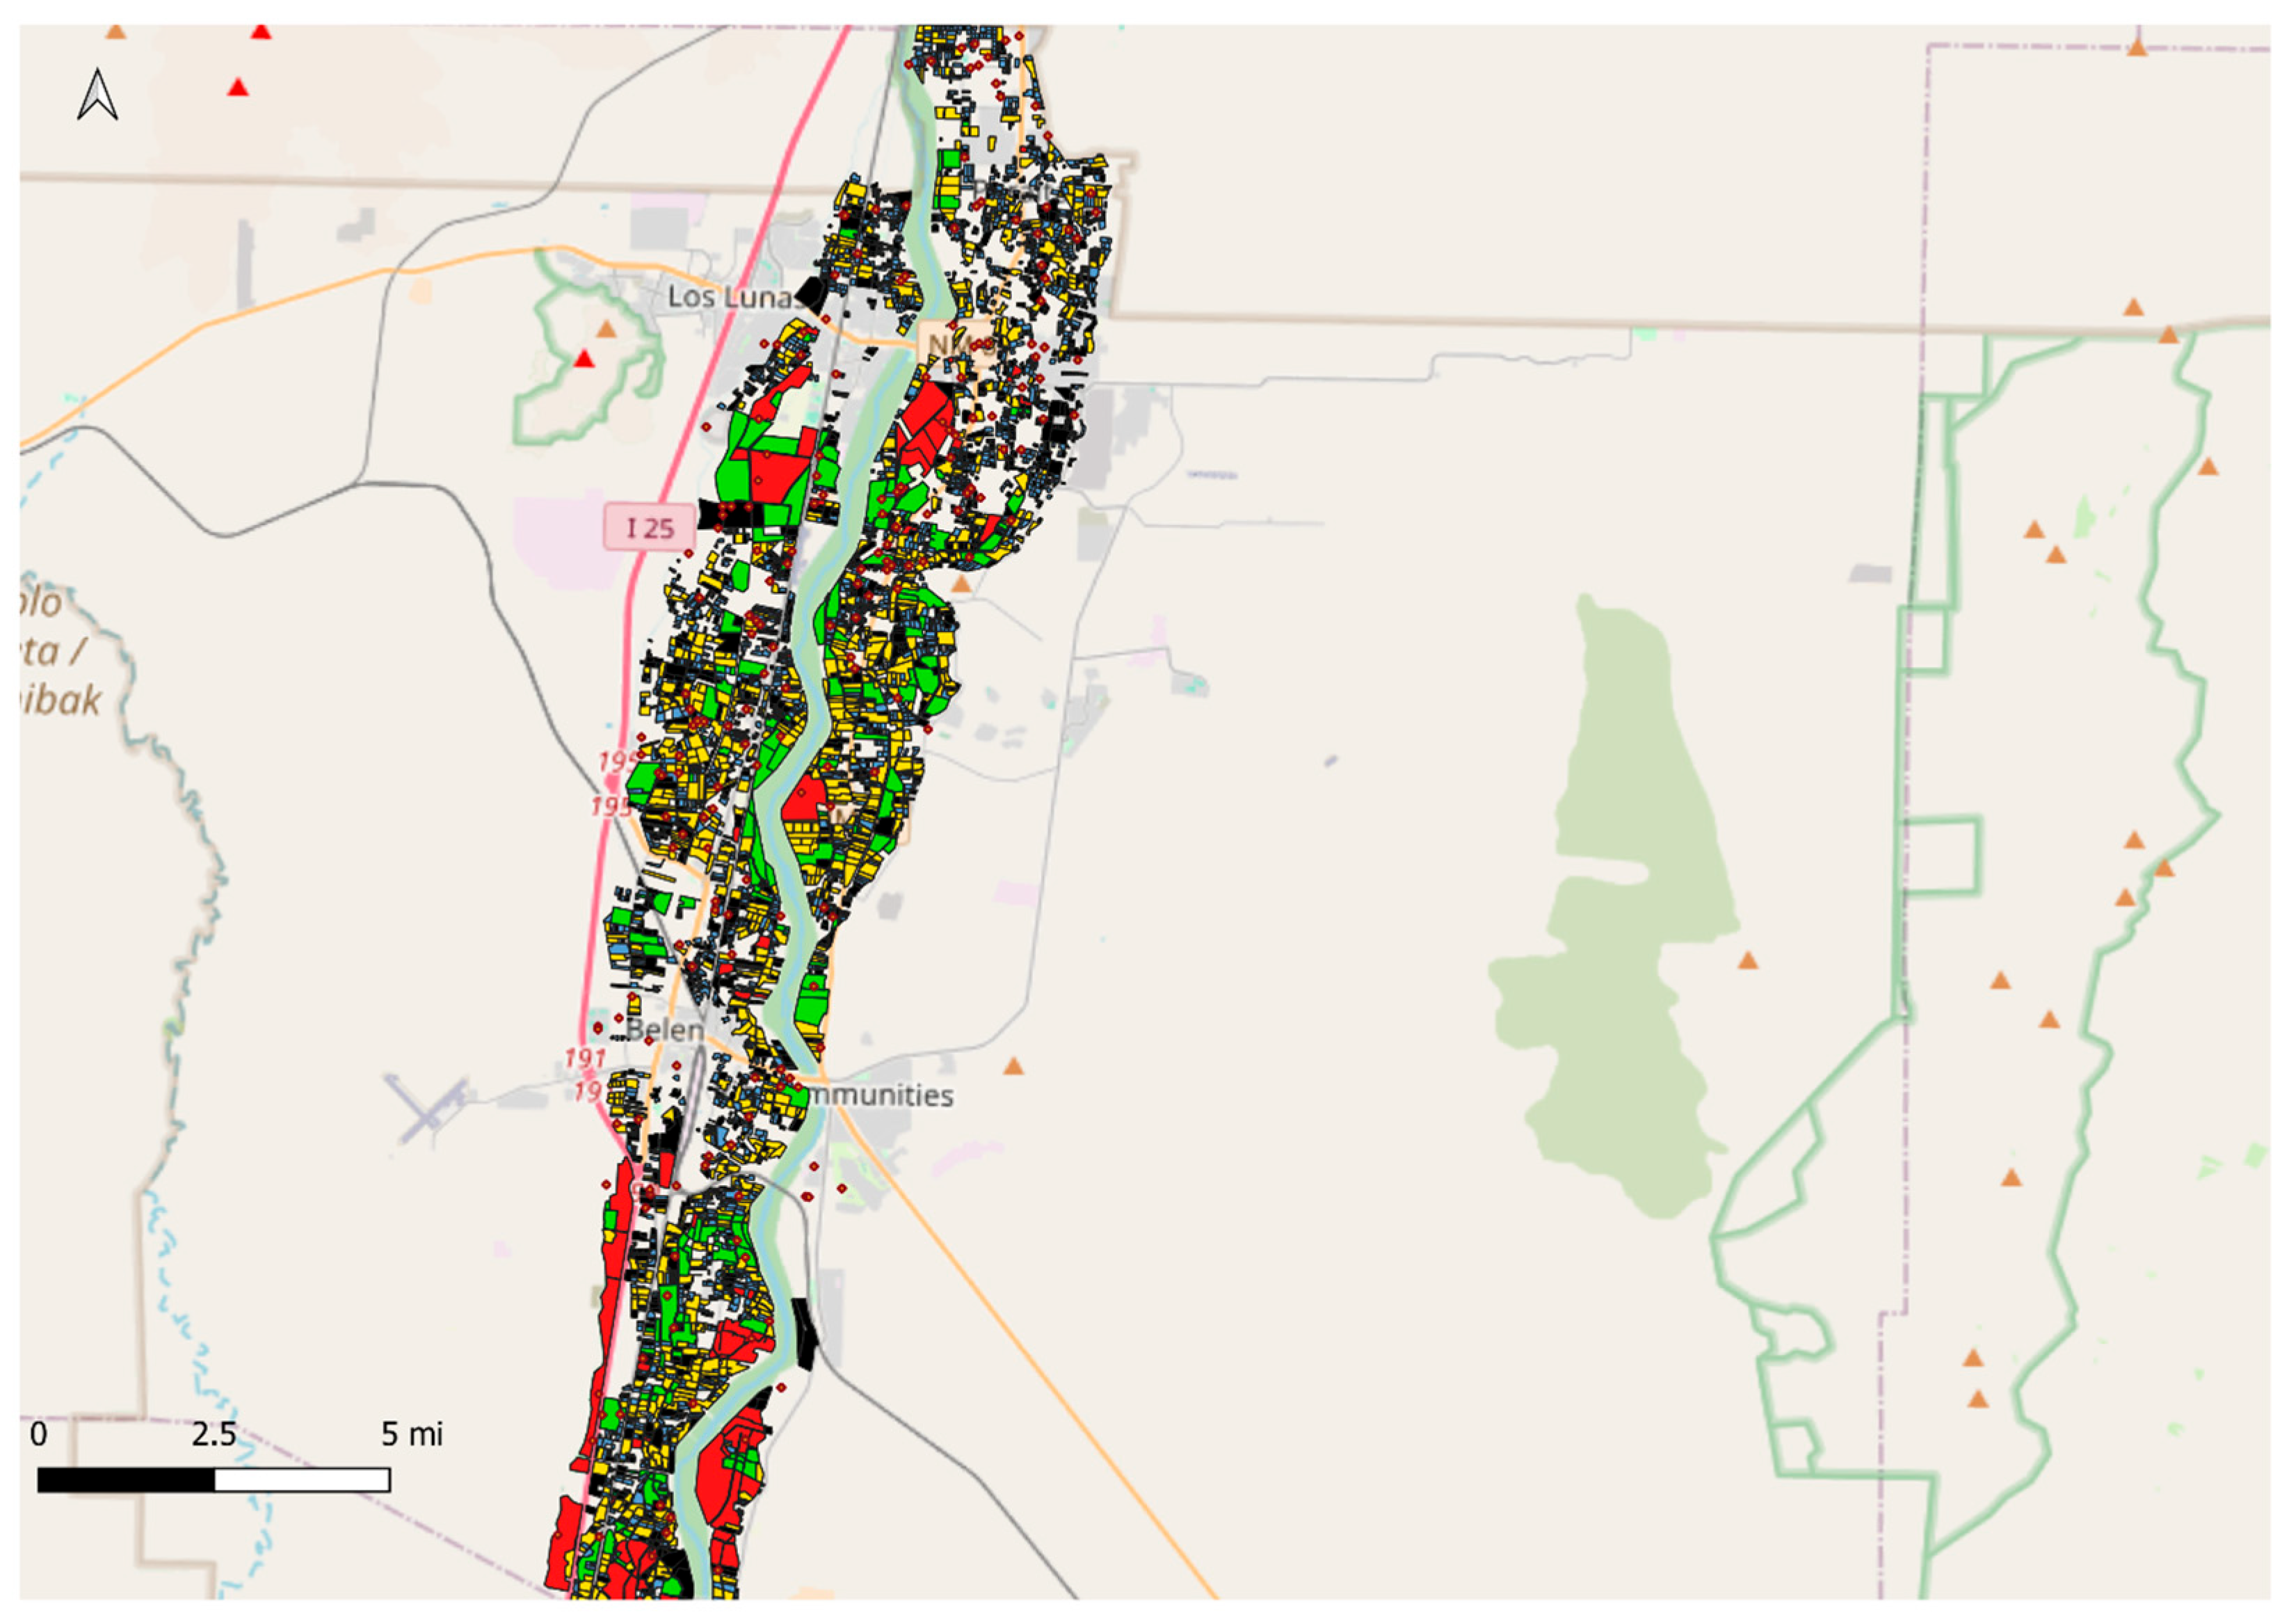
Figure A13.
Agricultural wells relative to irrigator farms (zoomed–in view, continued).
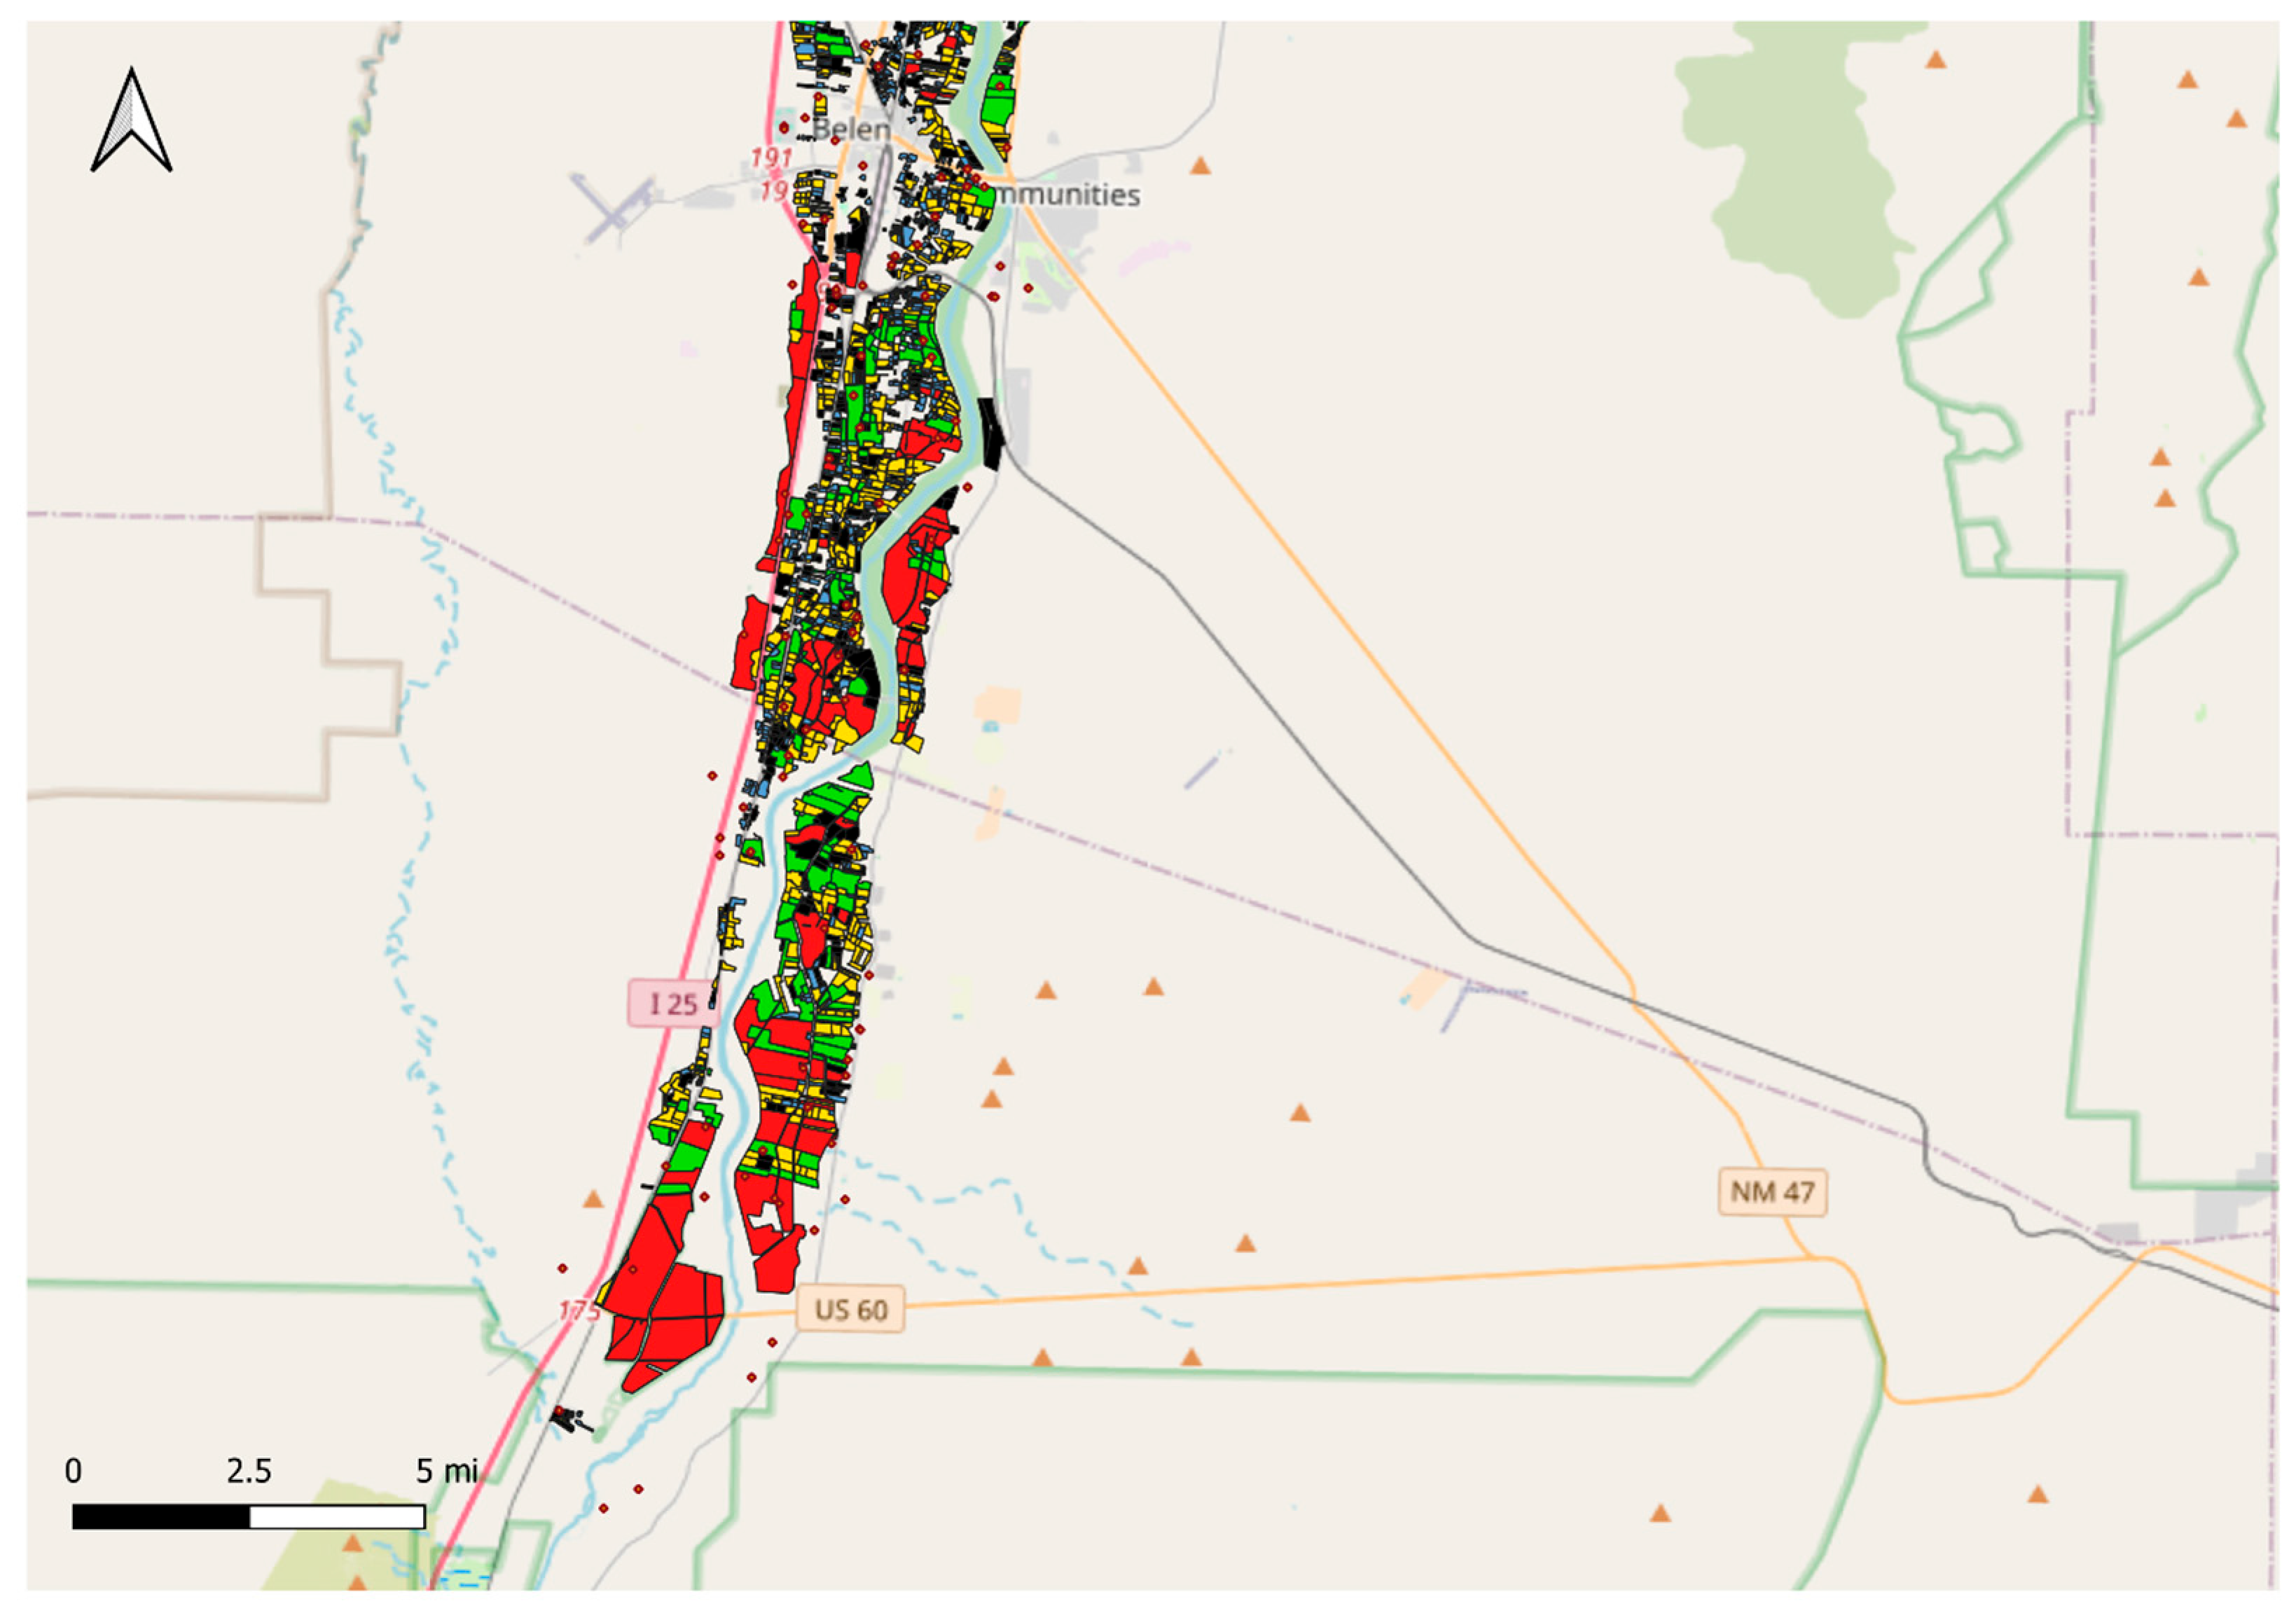
Appendix A.5. Distribution of Evapotranspiration by Irrigator Farms
Figure A14.
Distribution of evapotranspiration by irrigator farms (zoomed–in view).
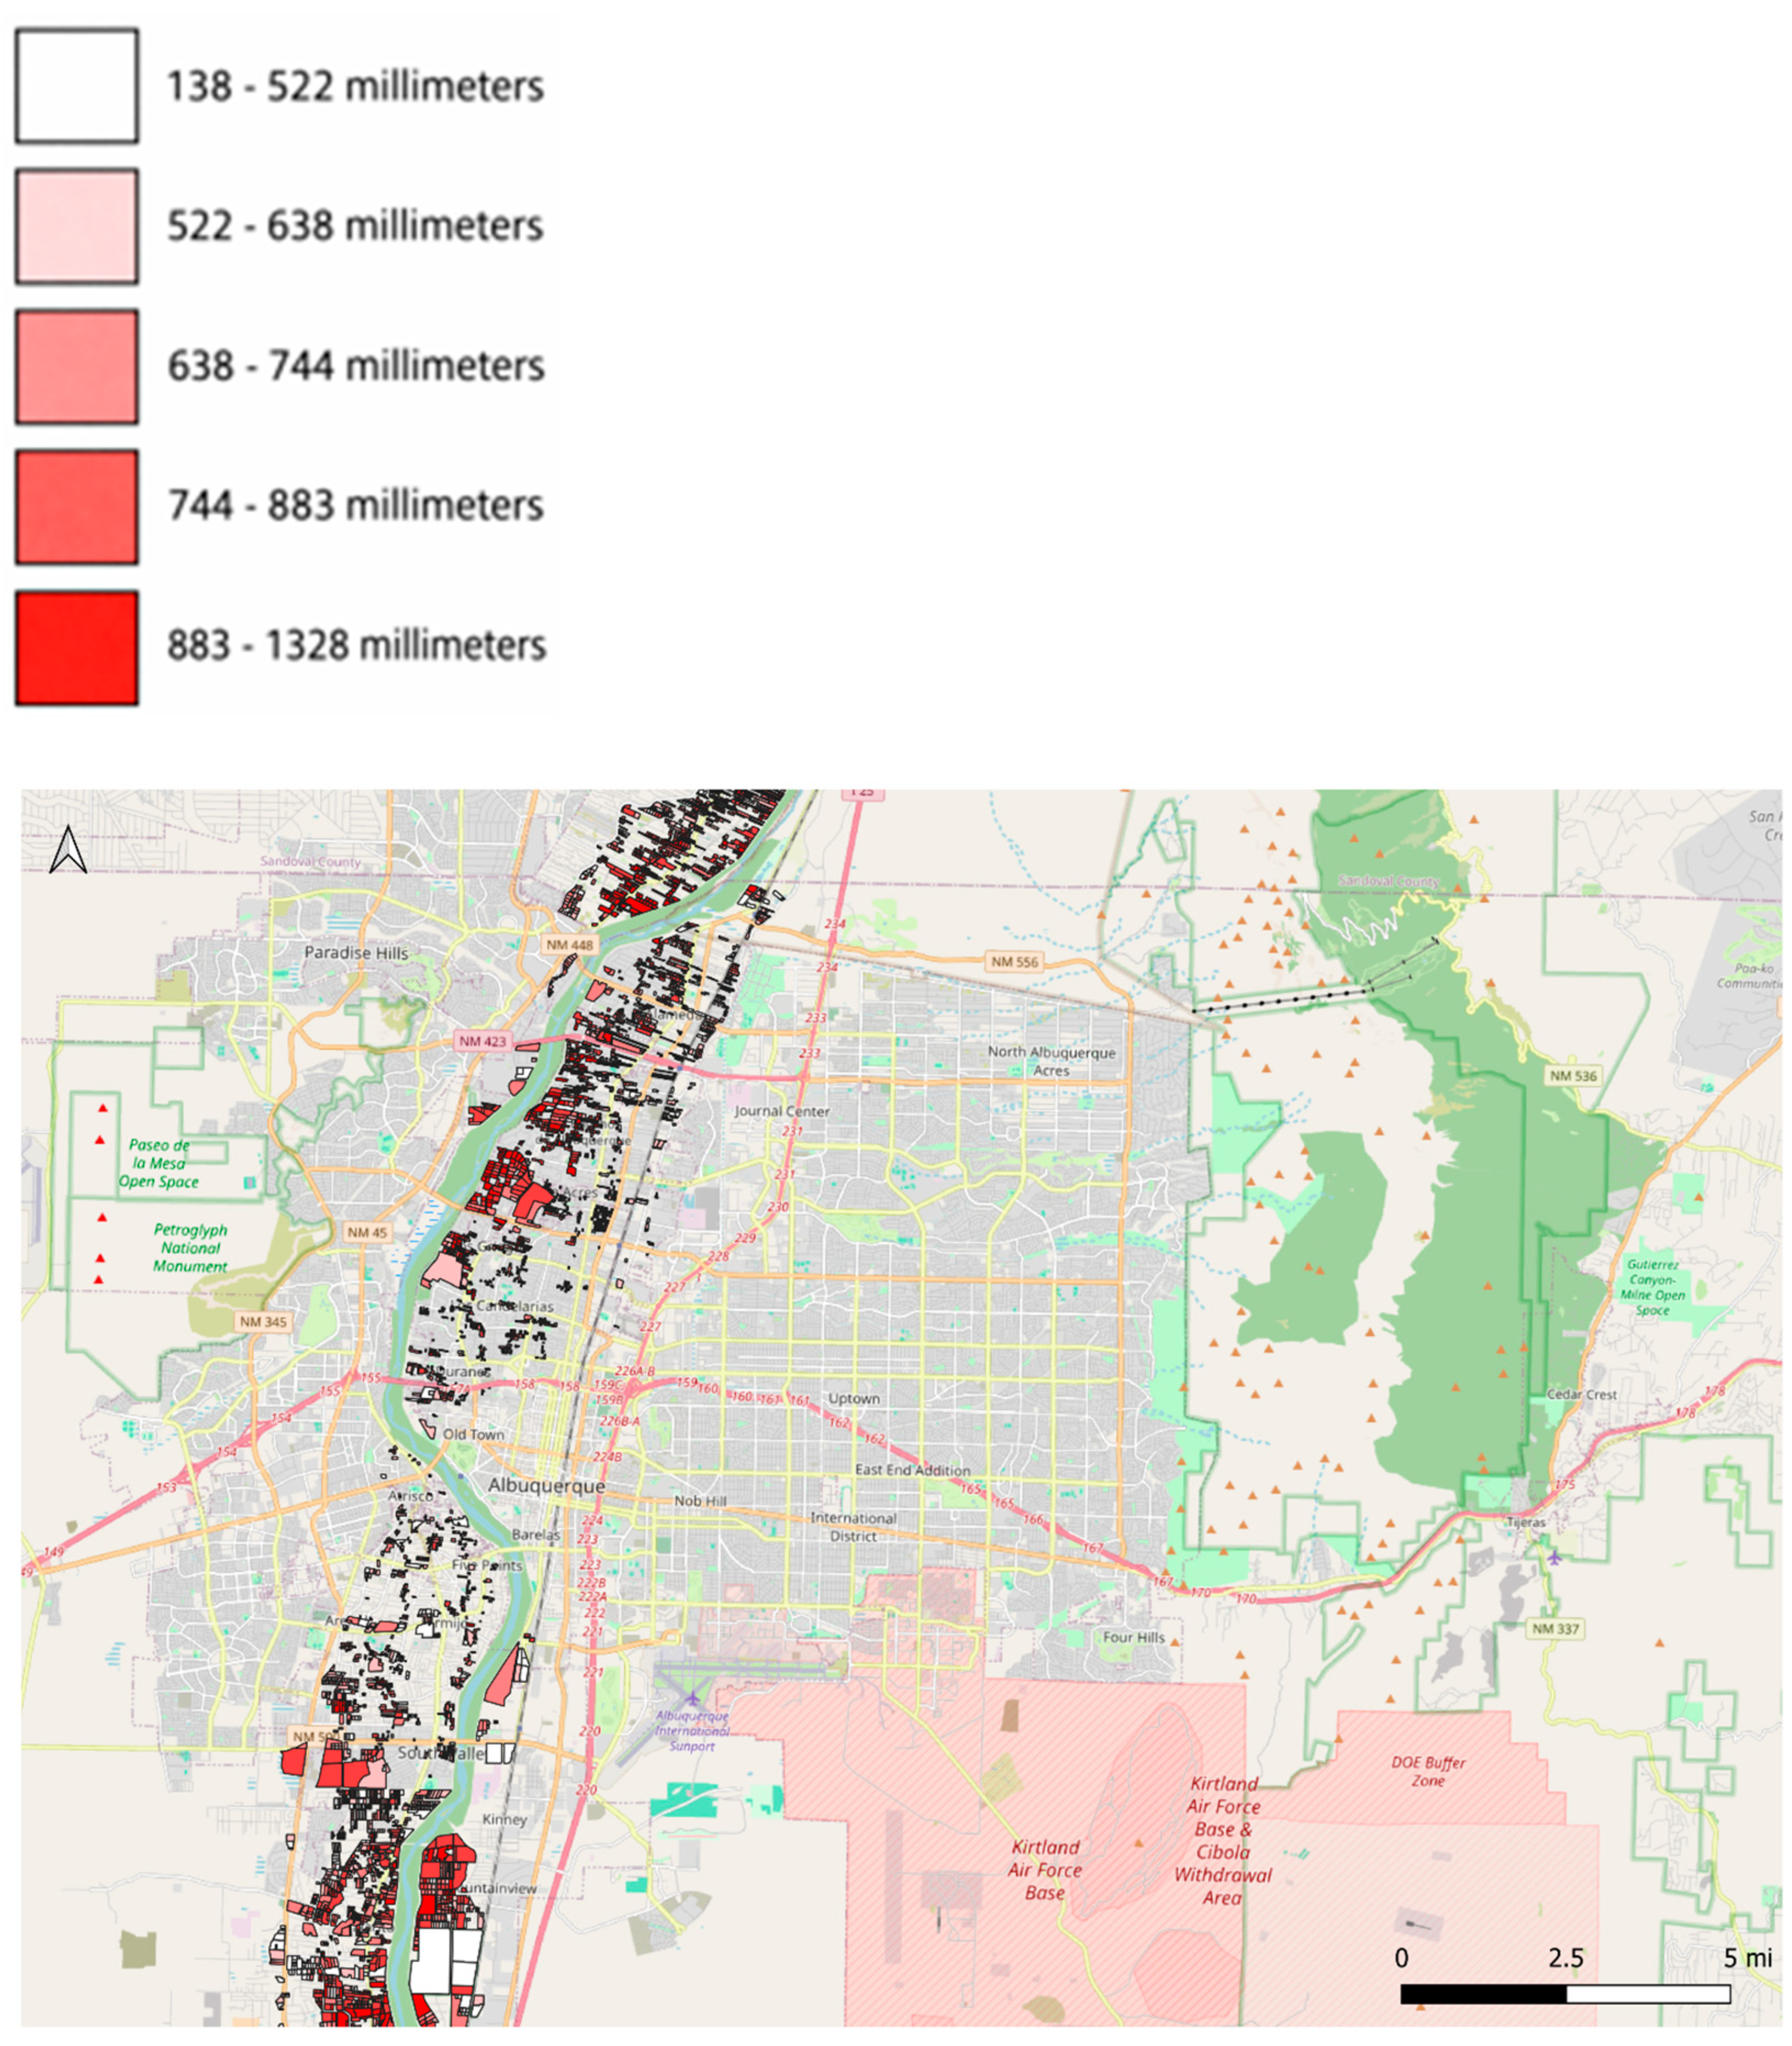
Figure A15.
Distribution of evapotranspiration by irrigator farms (zoomed–in view, continued).
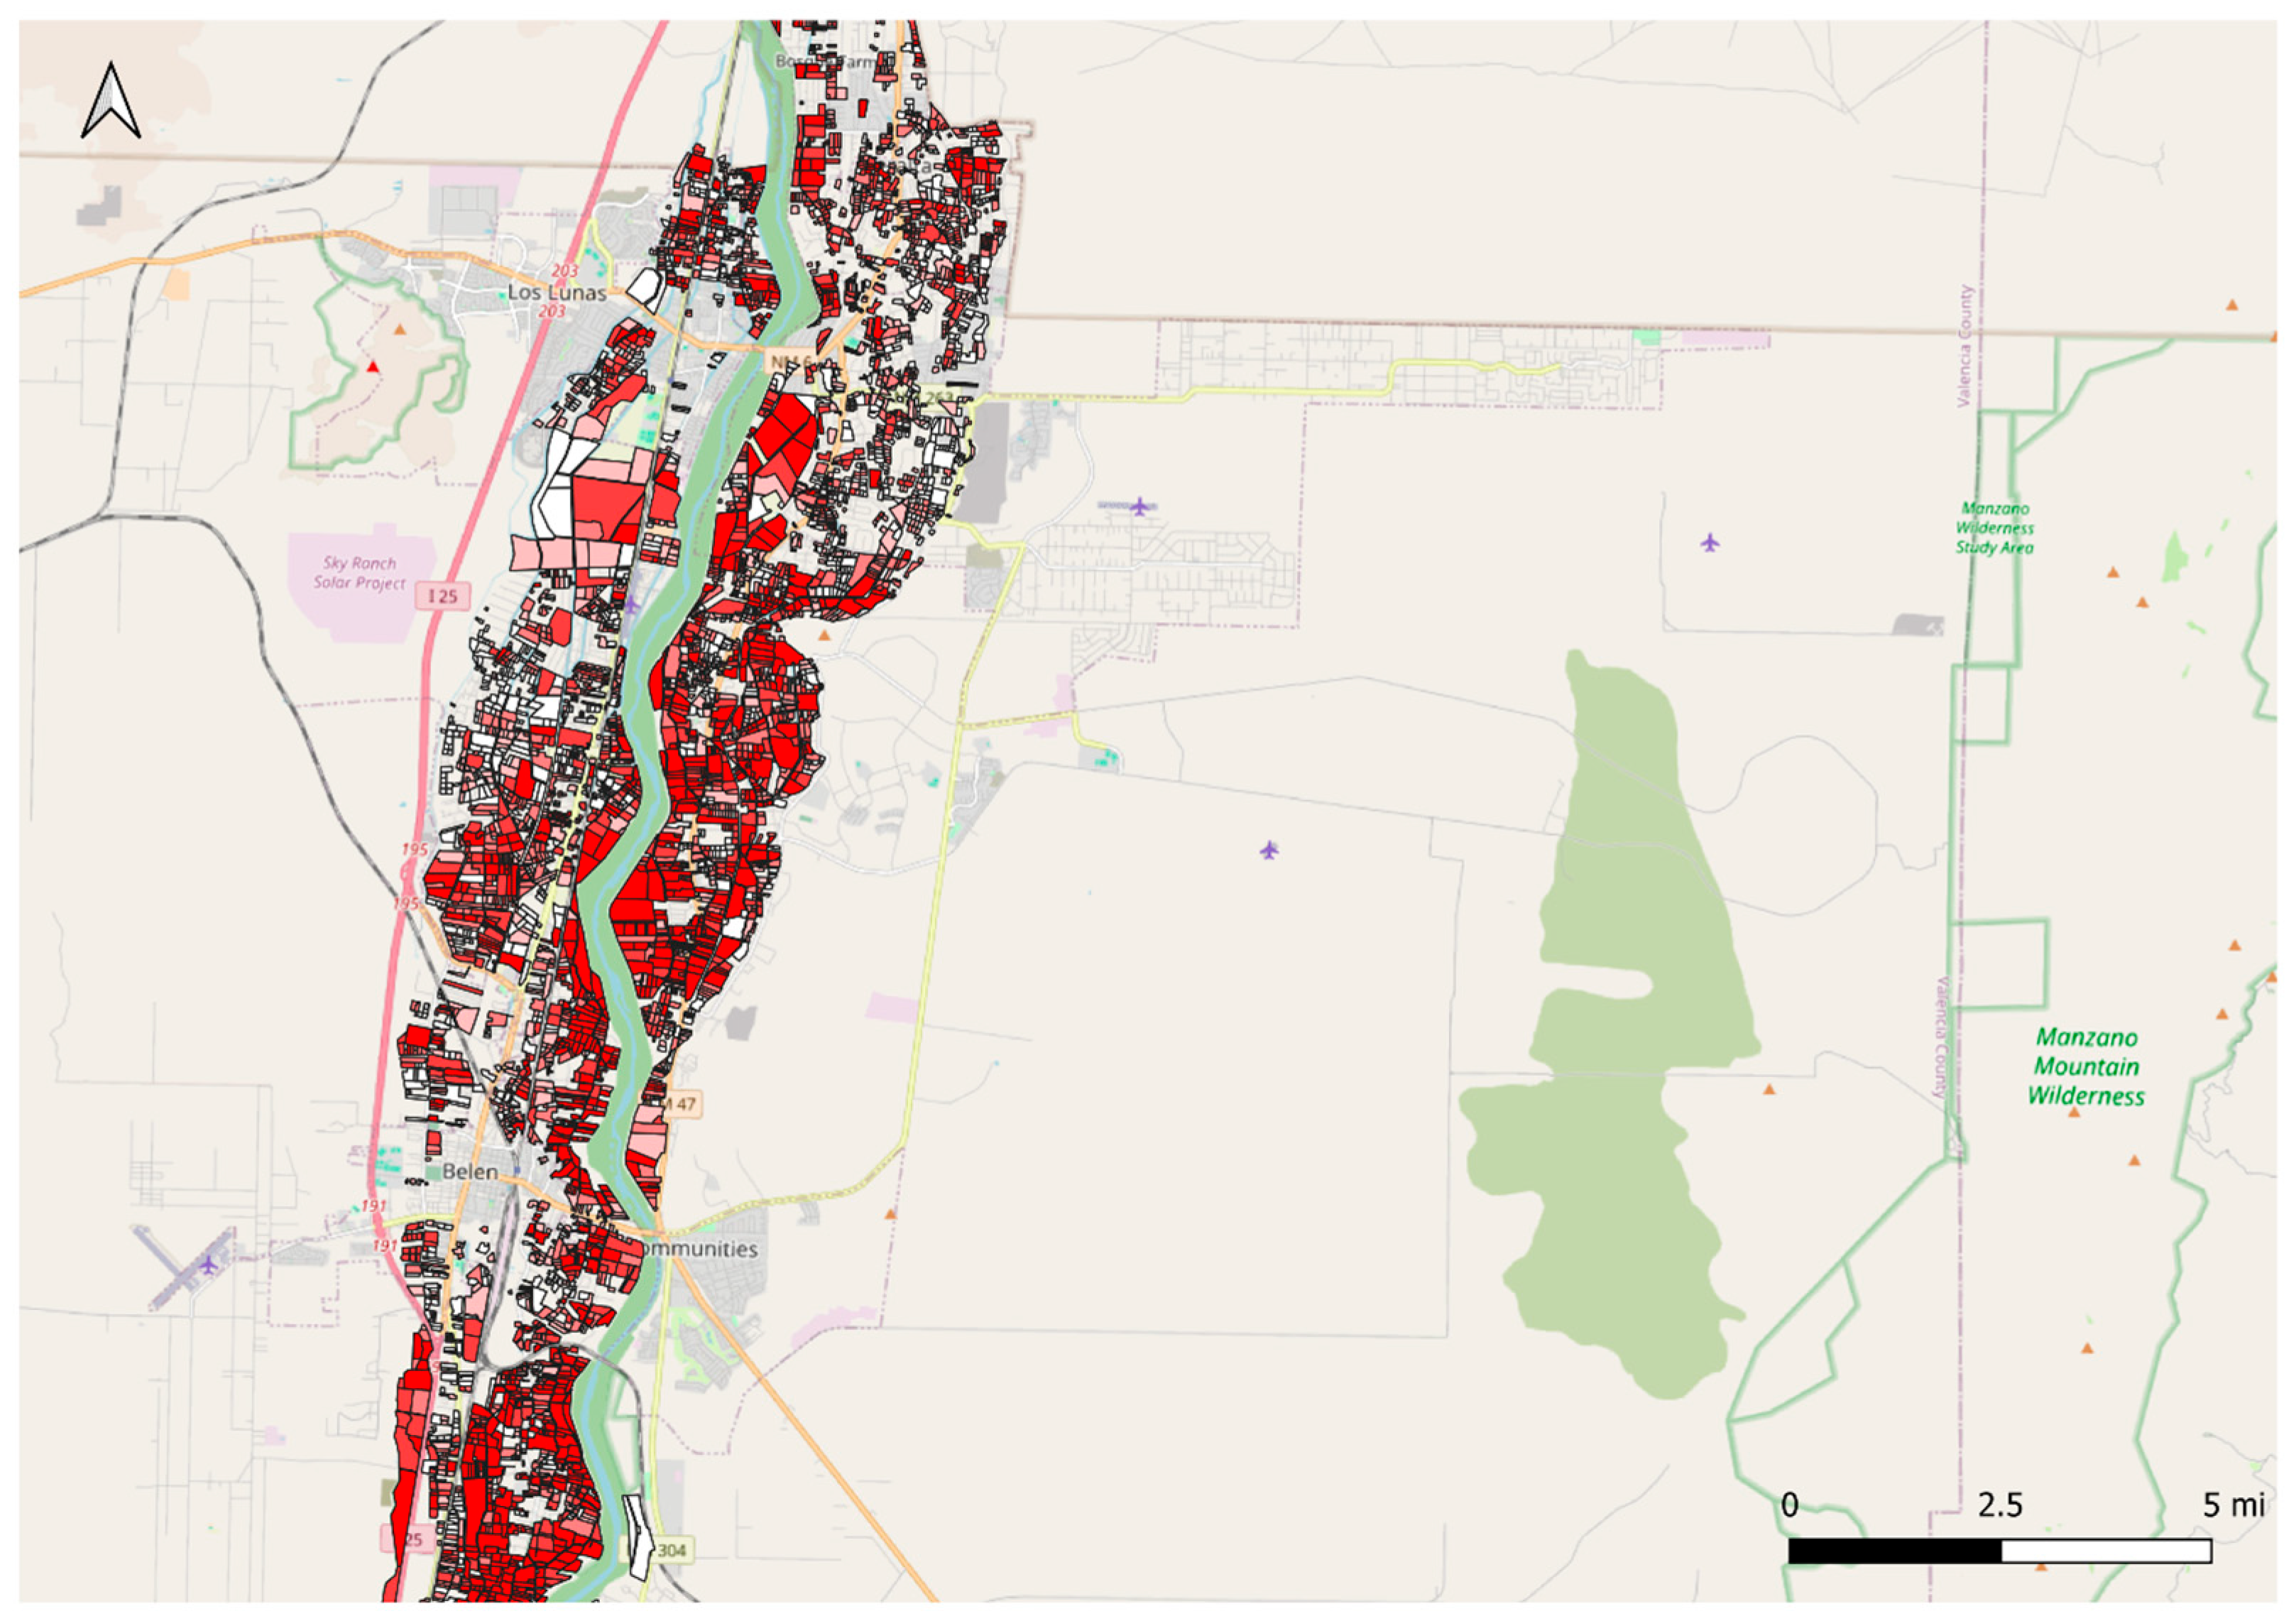
Figure A16.
Distribution of evapotranspiration by irrigator farms (zoomed–in view, continued).
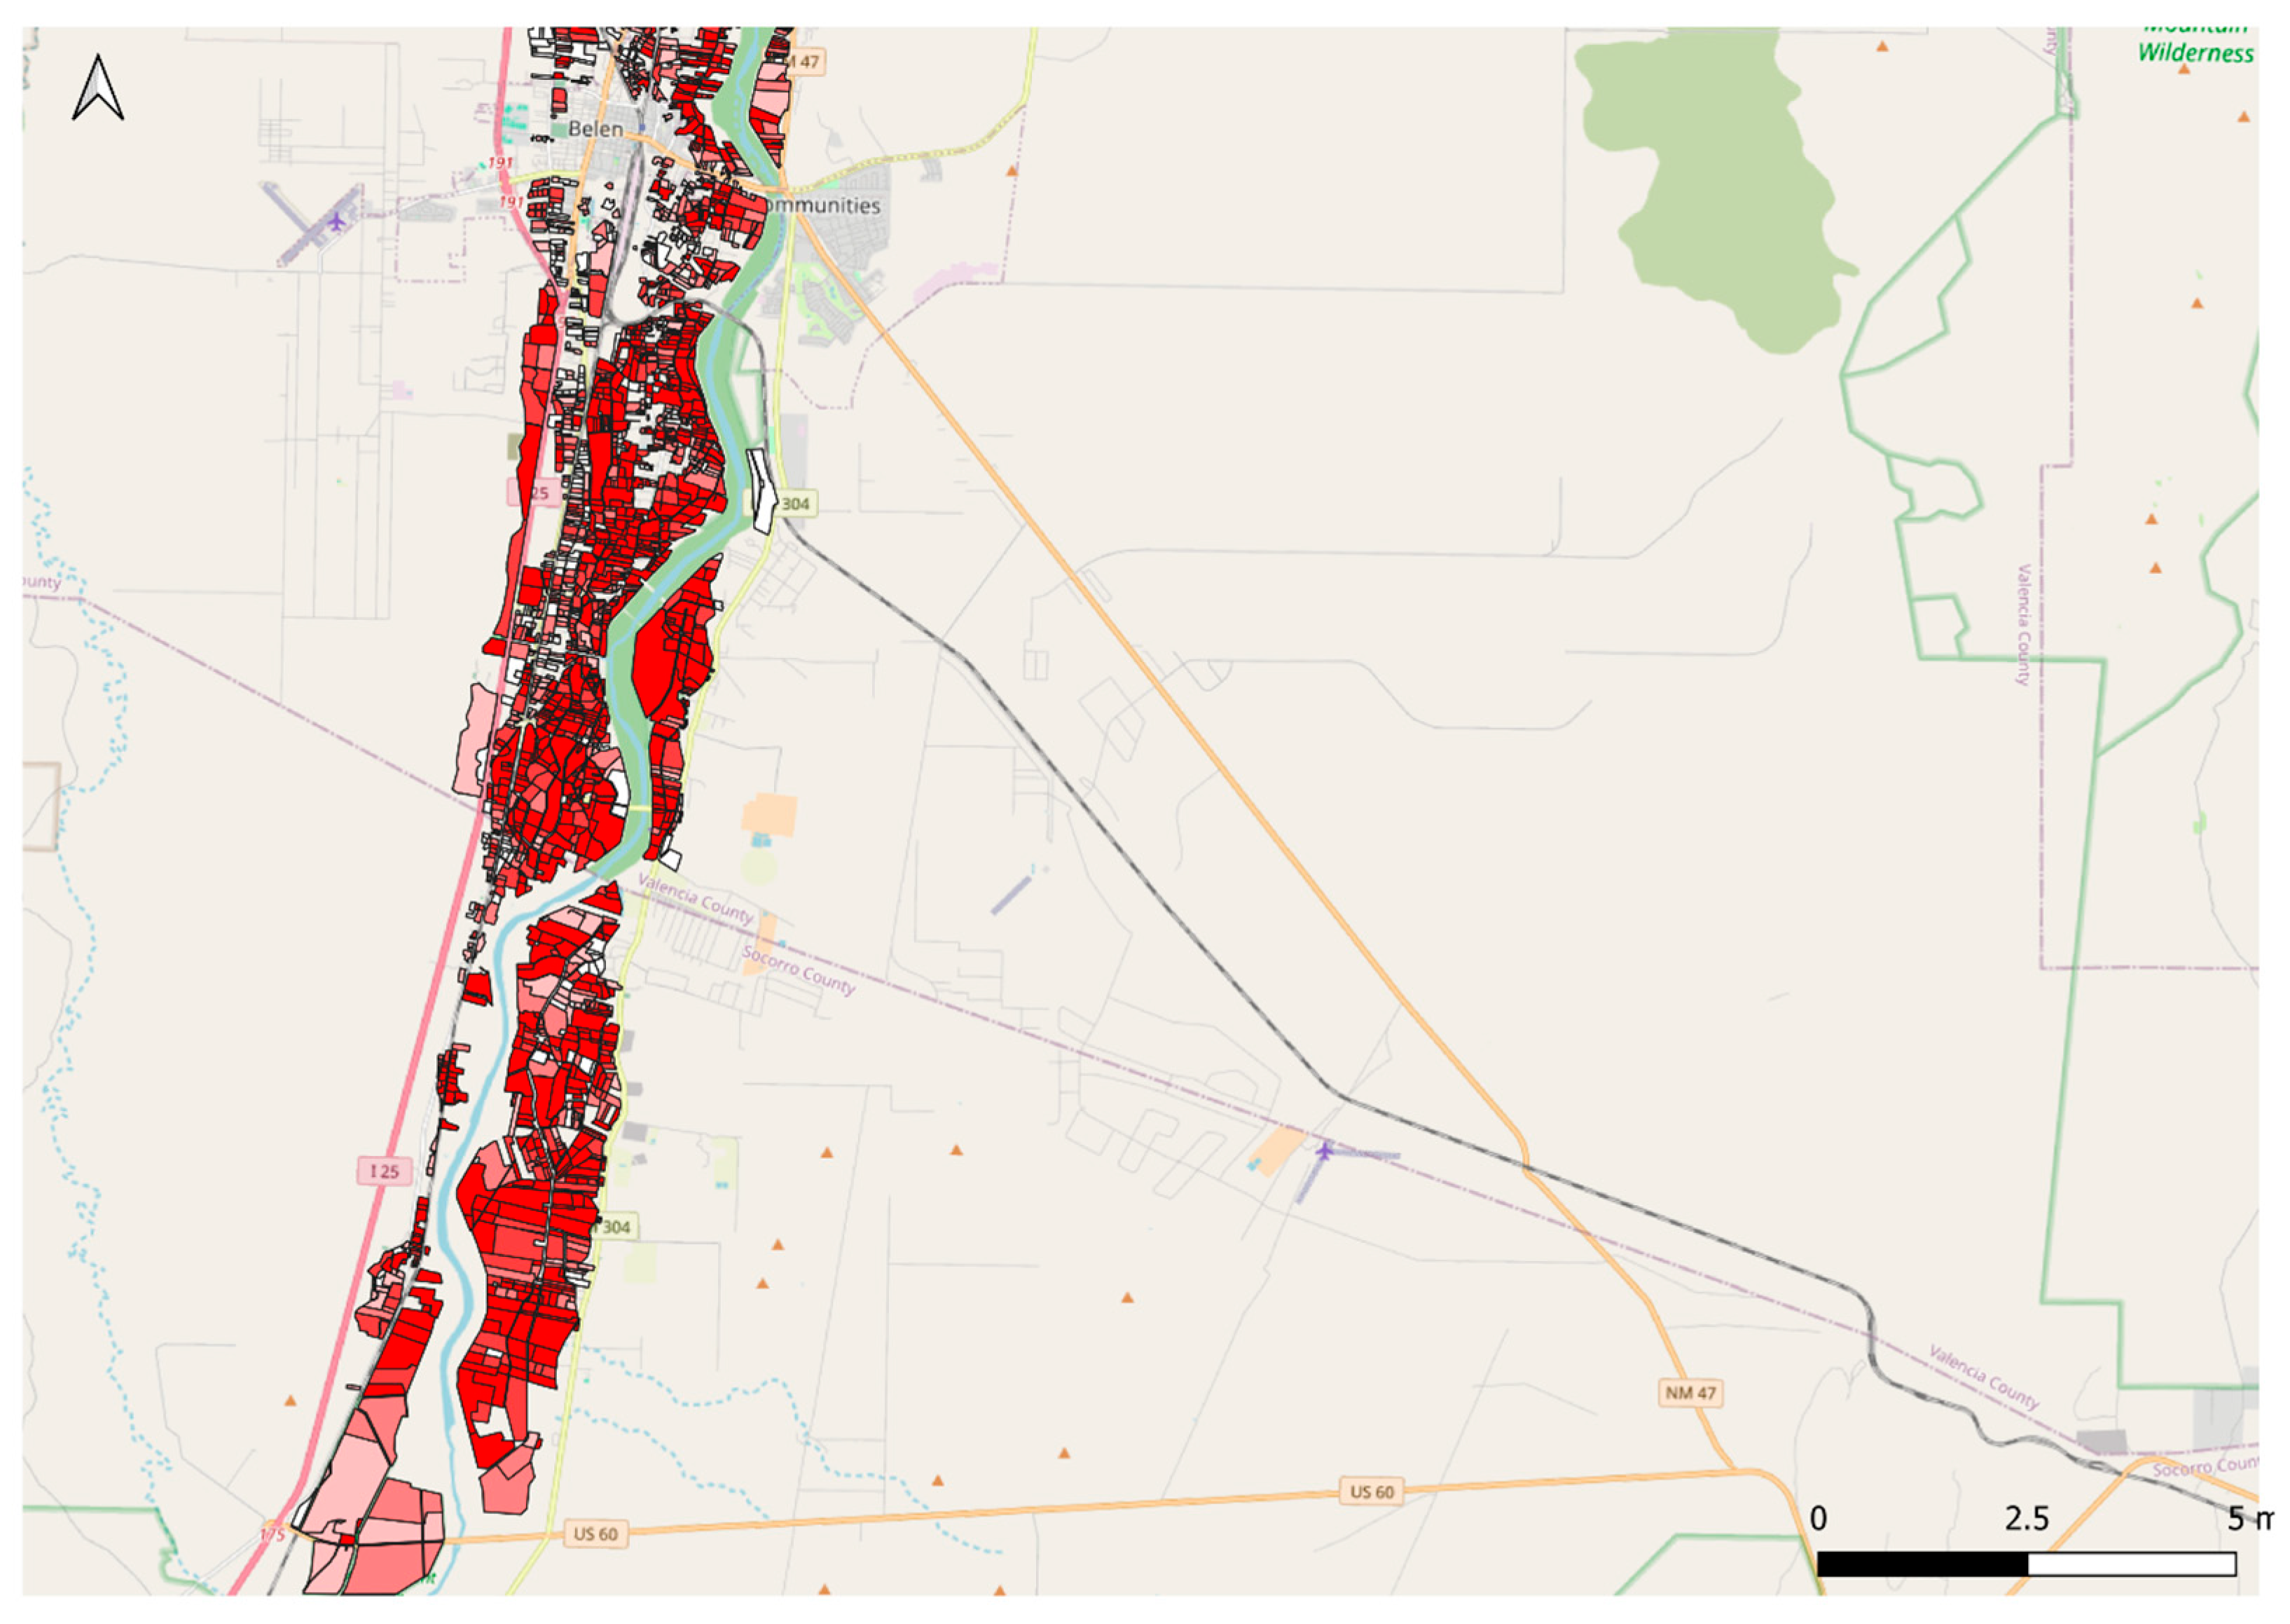
Appendix A.6. Distribution of Effective Evapotranspiration by Irrigator Farms
Figure A17.
Distribution of effective evapotranspiration by irrigator farms (zoomed–in view).
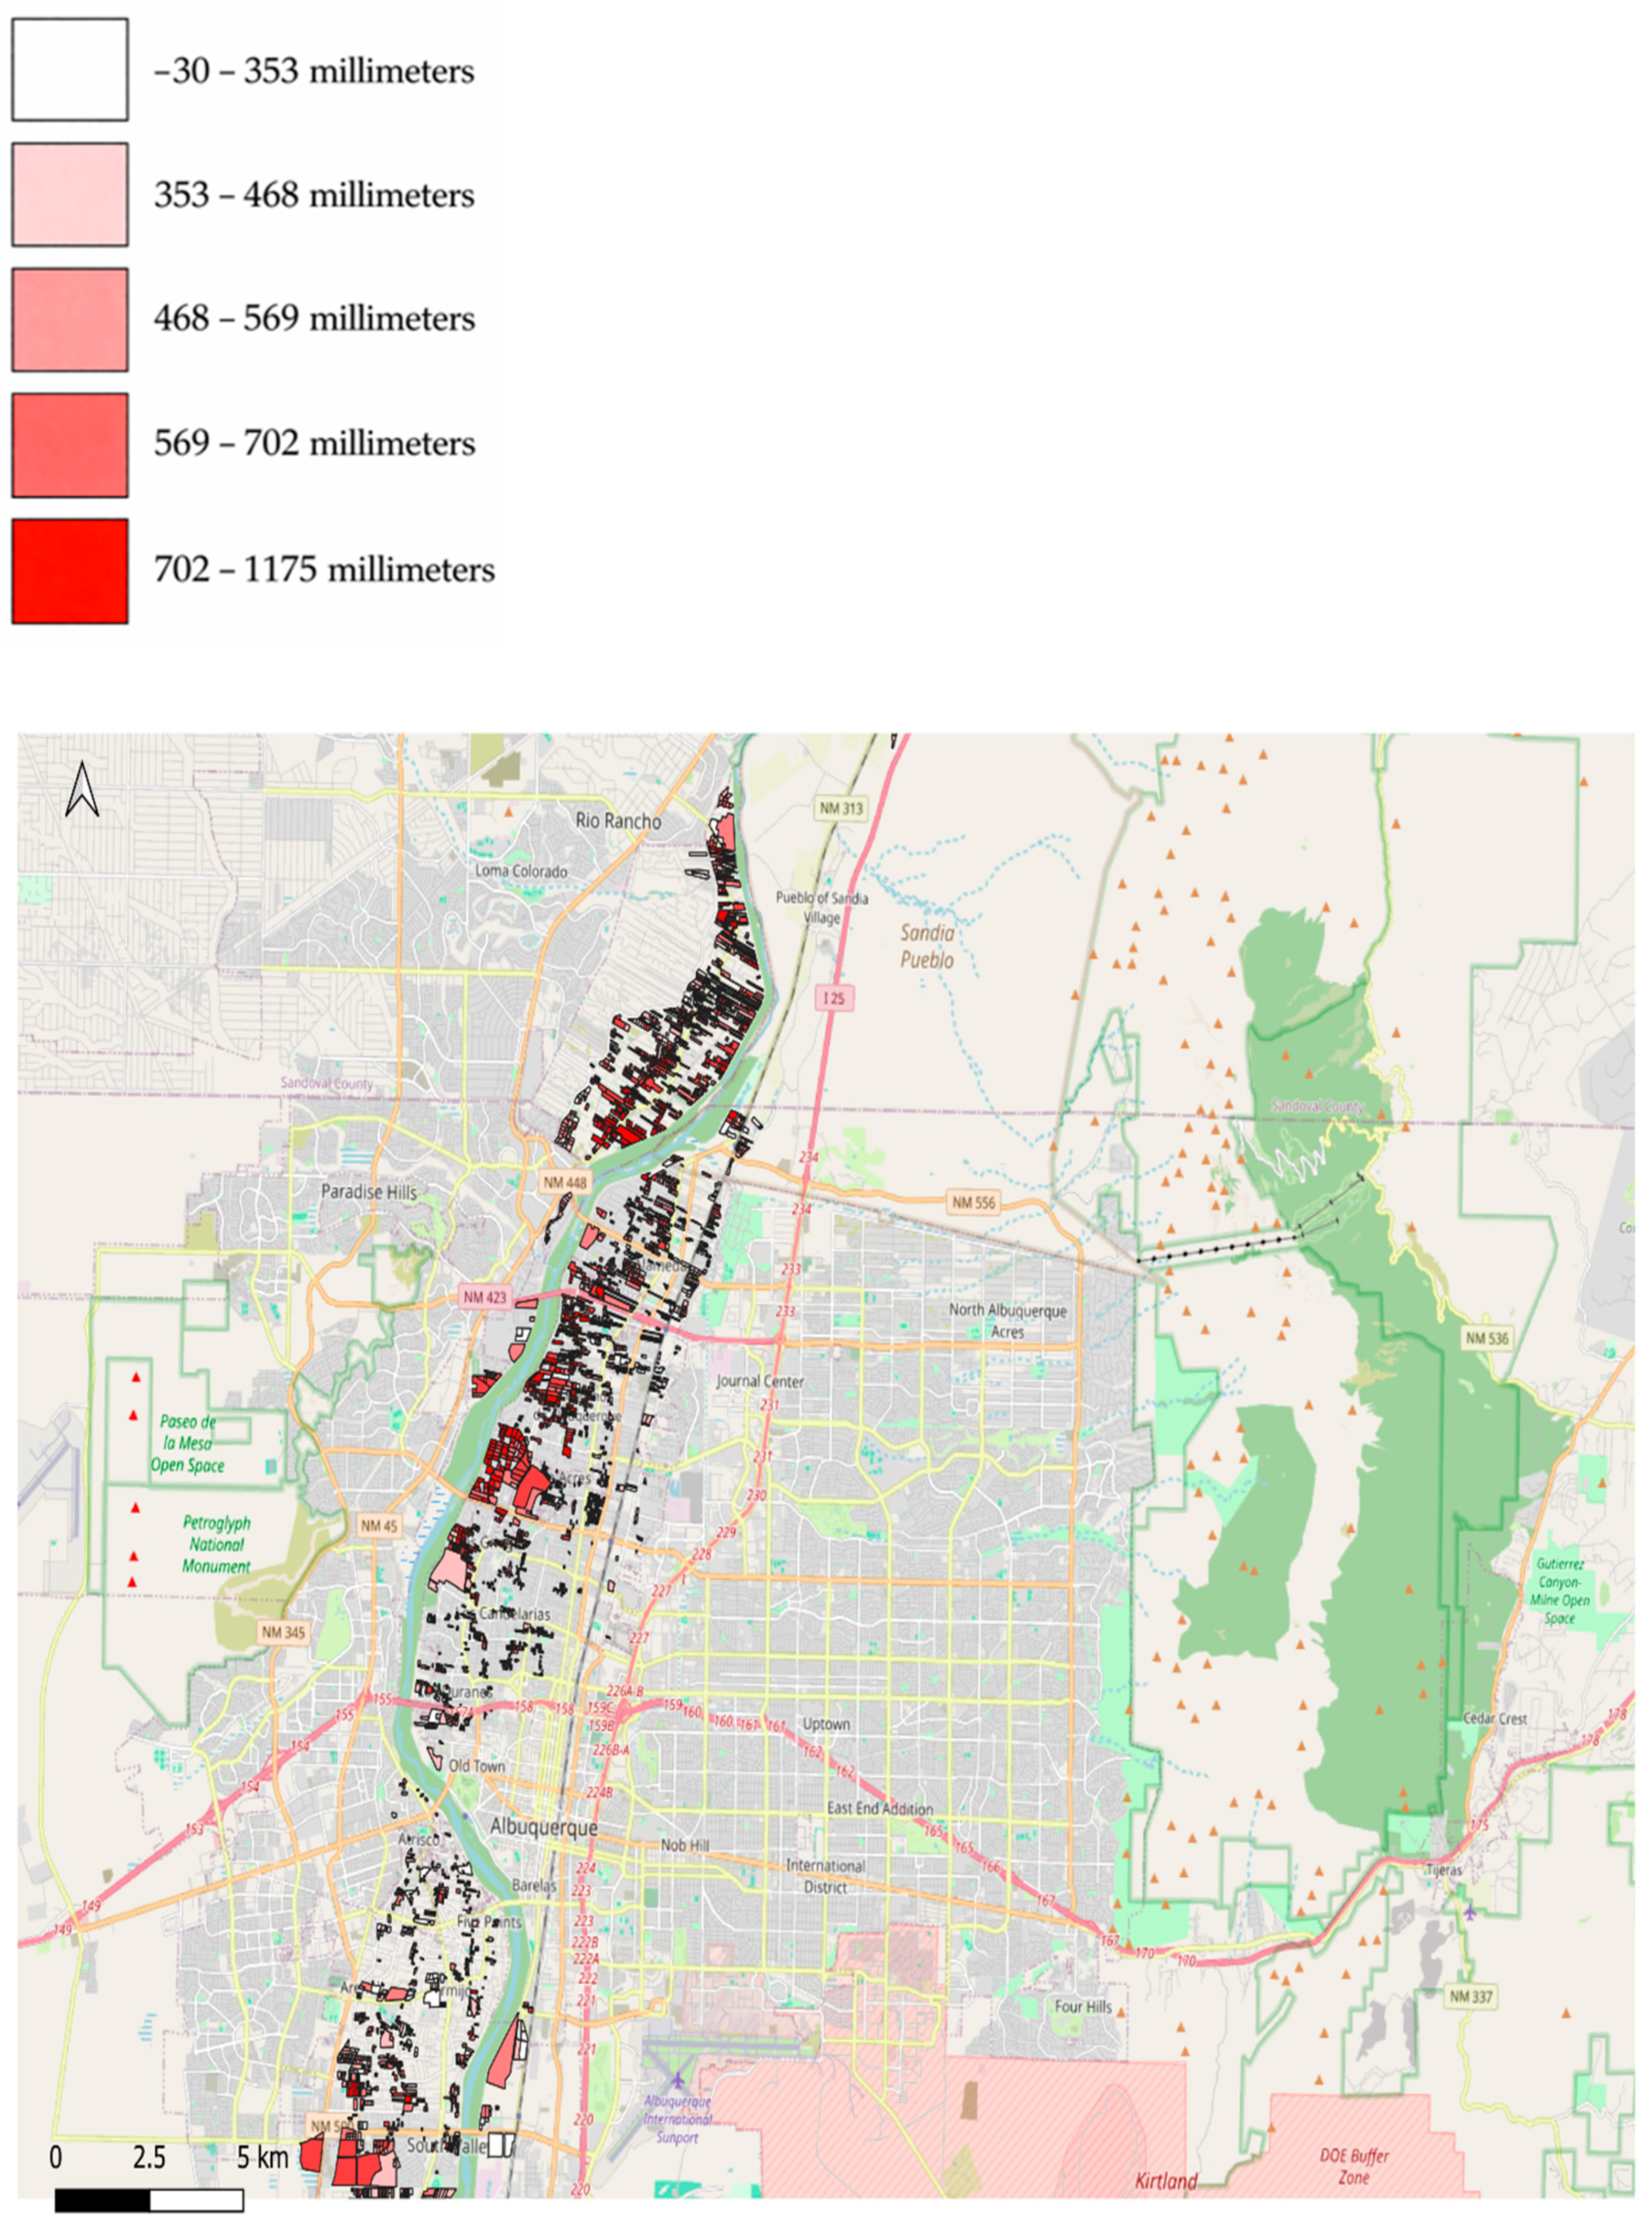
Figure A18.
Distribution of effective evapotranspiration by irrigator farms (zoomed–in view, continued).
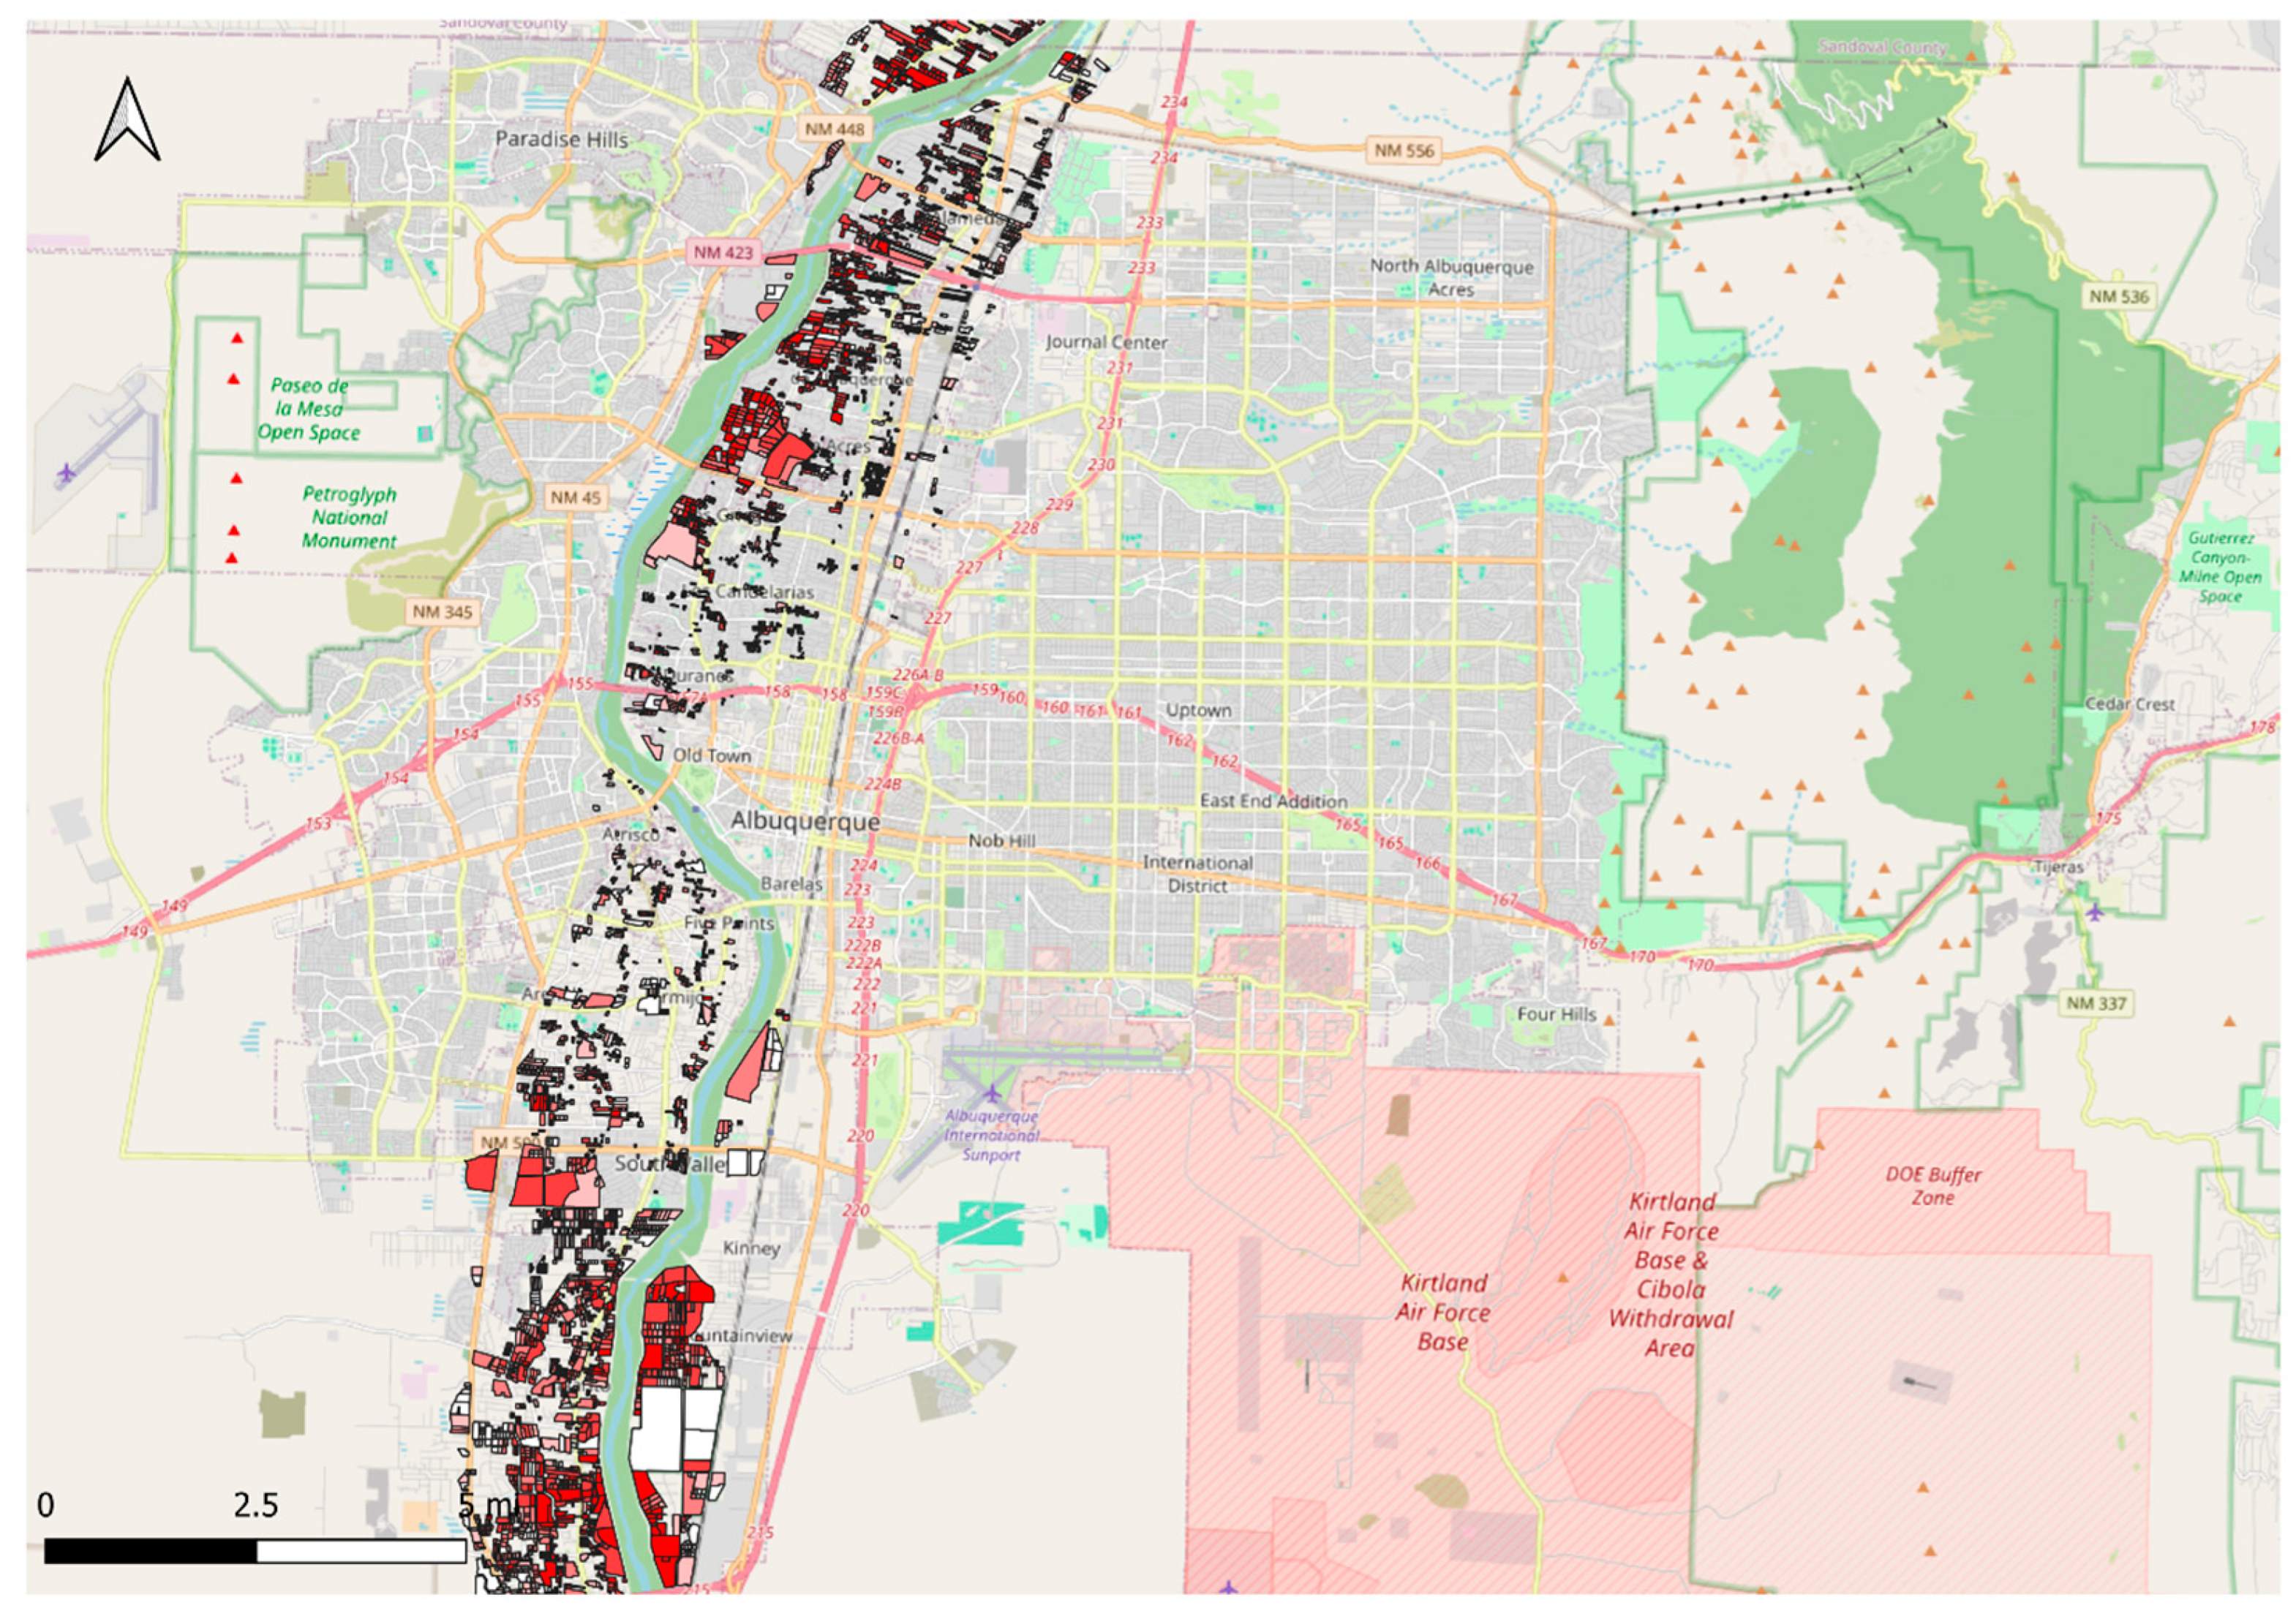
Figure A19.
Distribution of effective evapotranspiration by irrigator farms (zoomed–in view, continued).
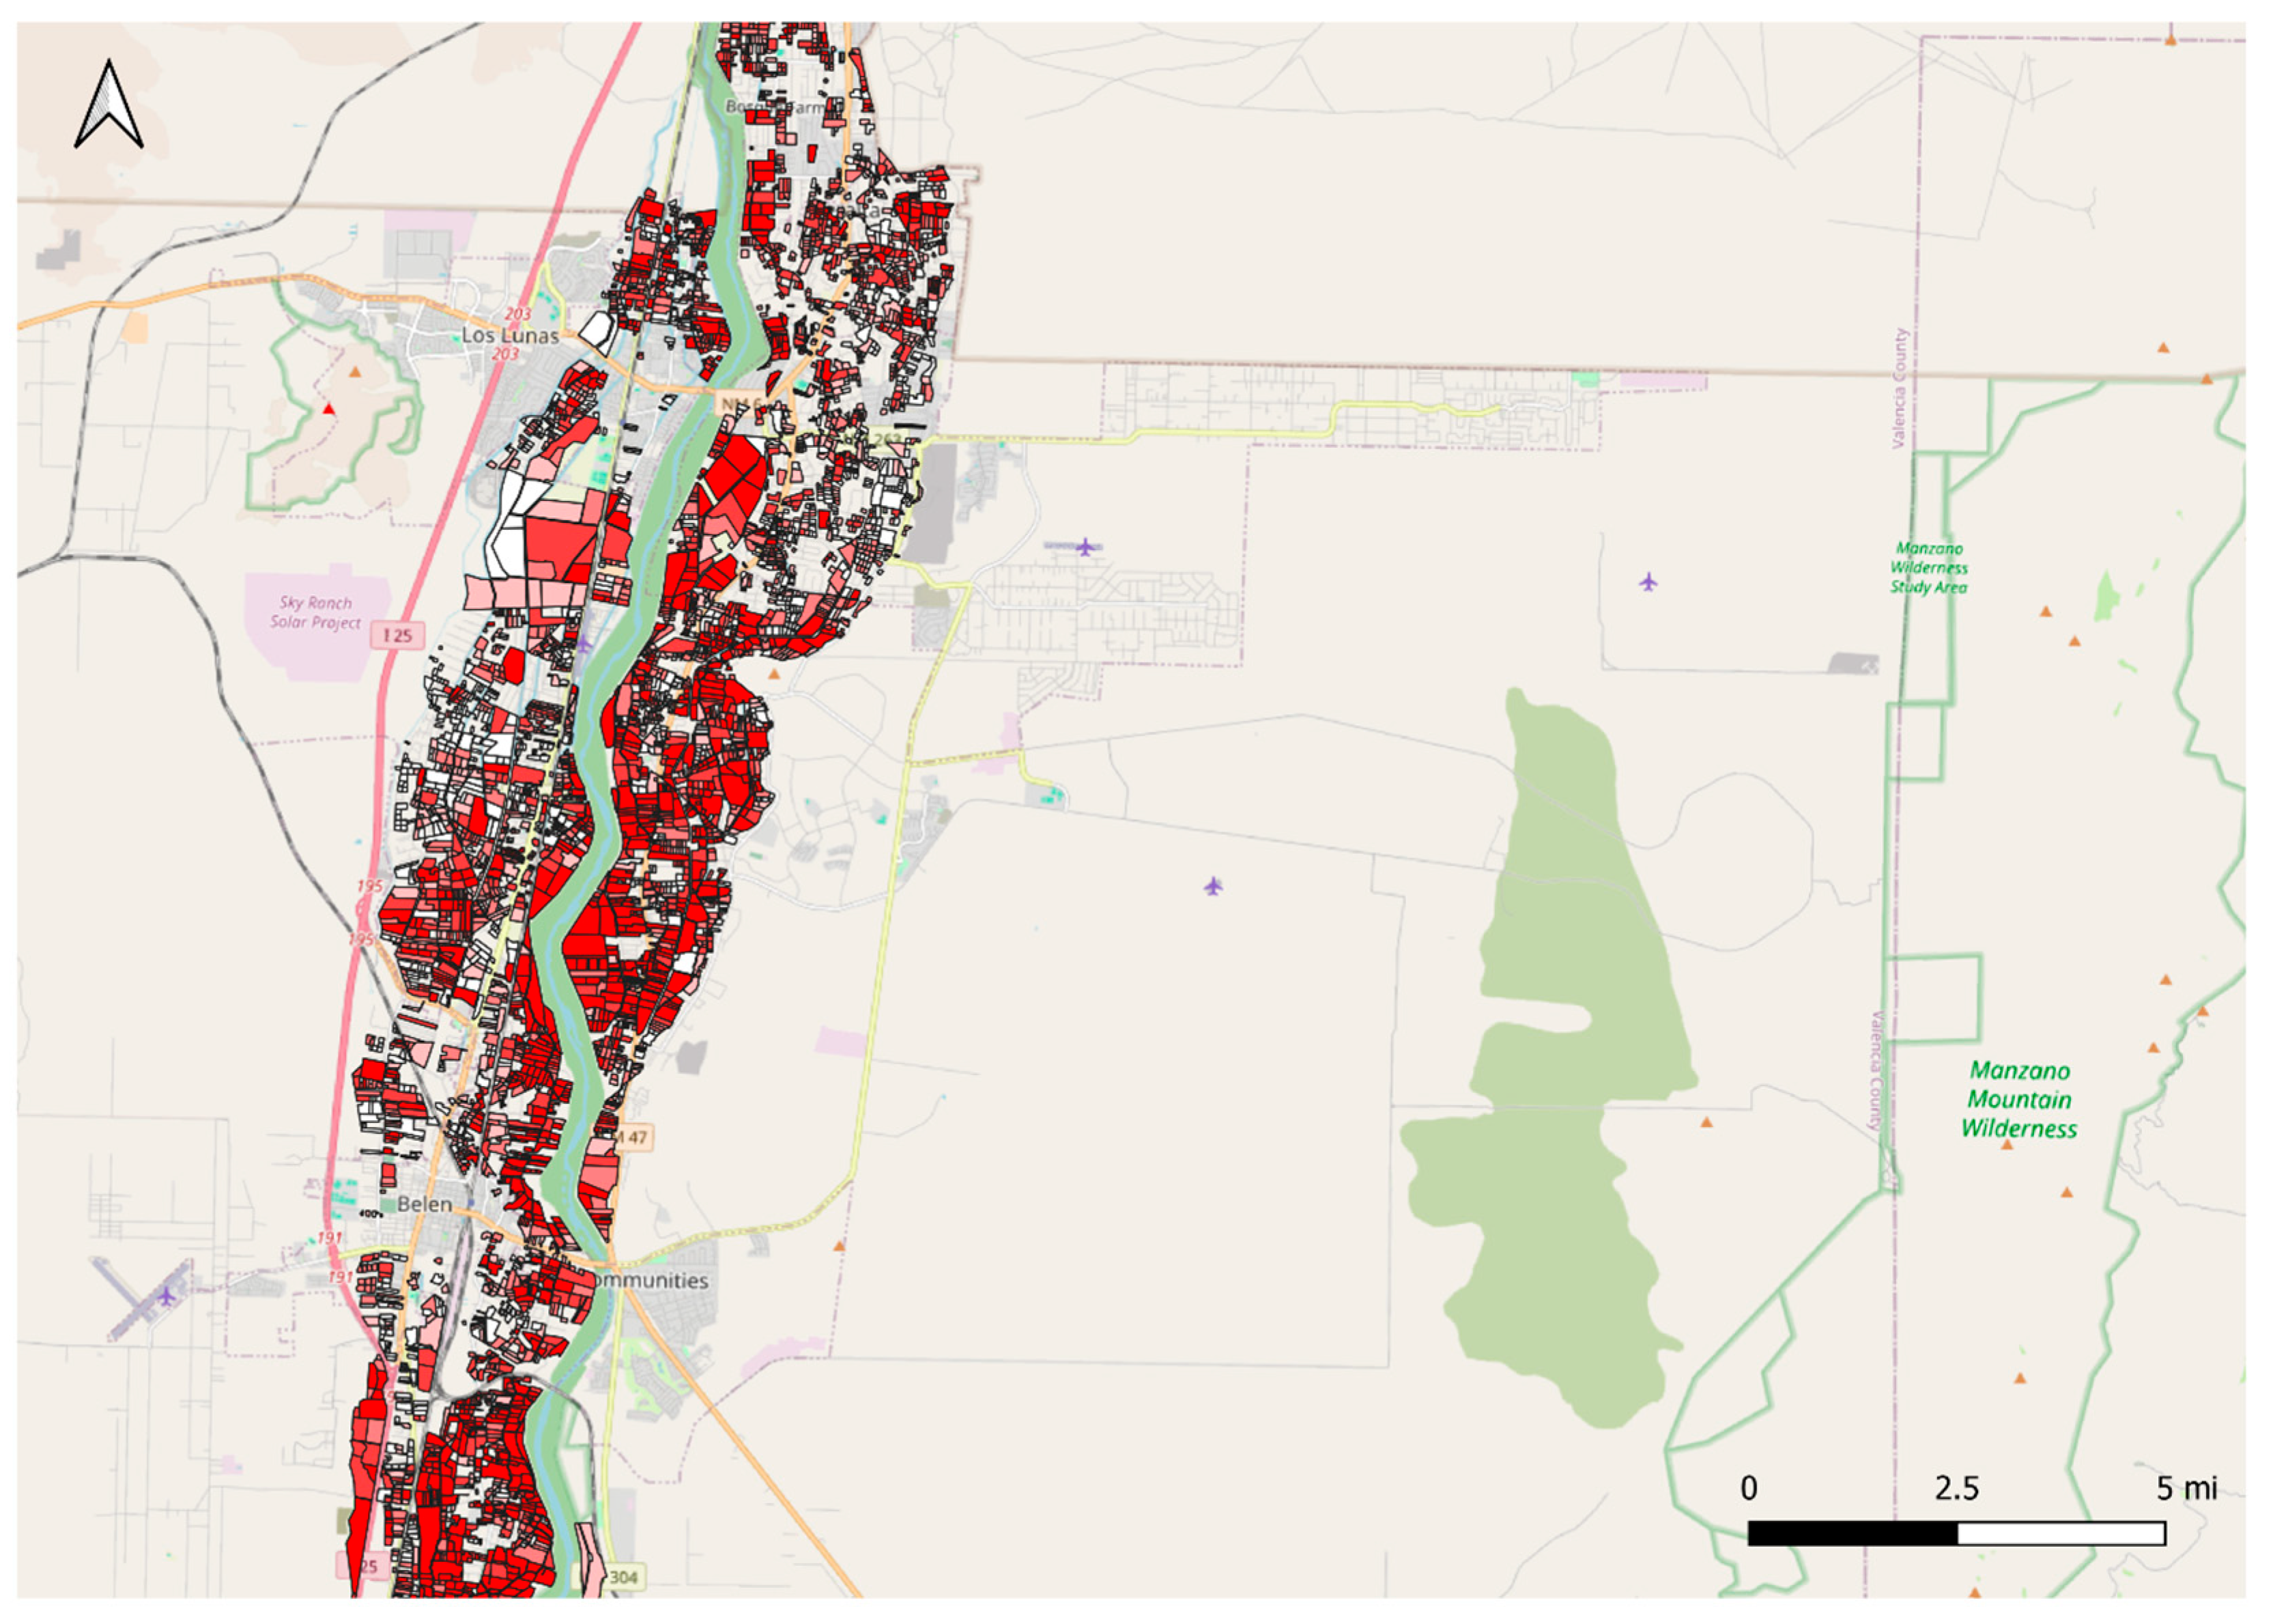
Figure A20.
Distribution of effective evapotranspiration by irrigator farms (zoomed–in view, continued).
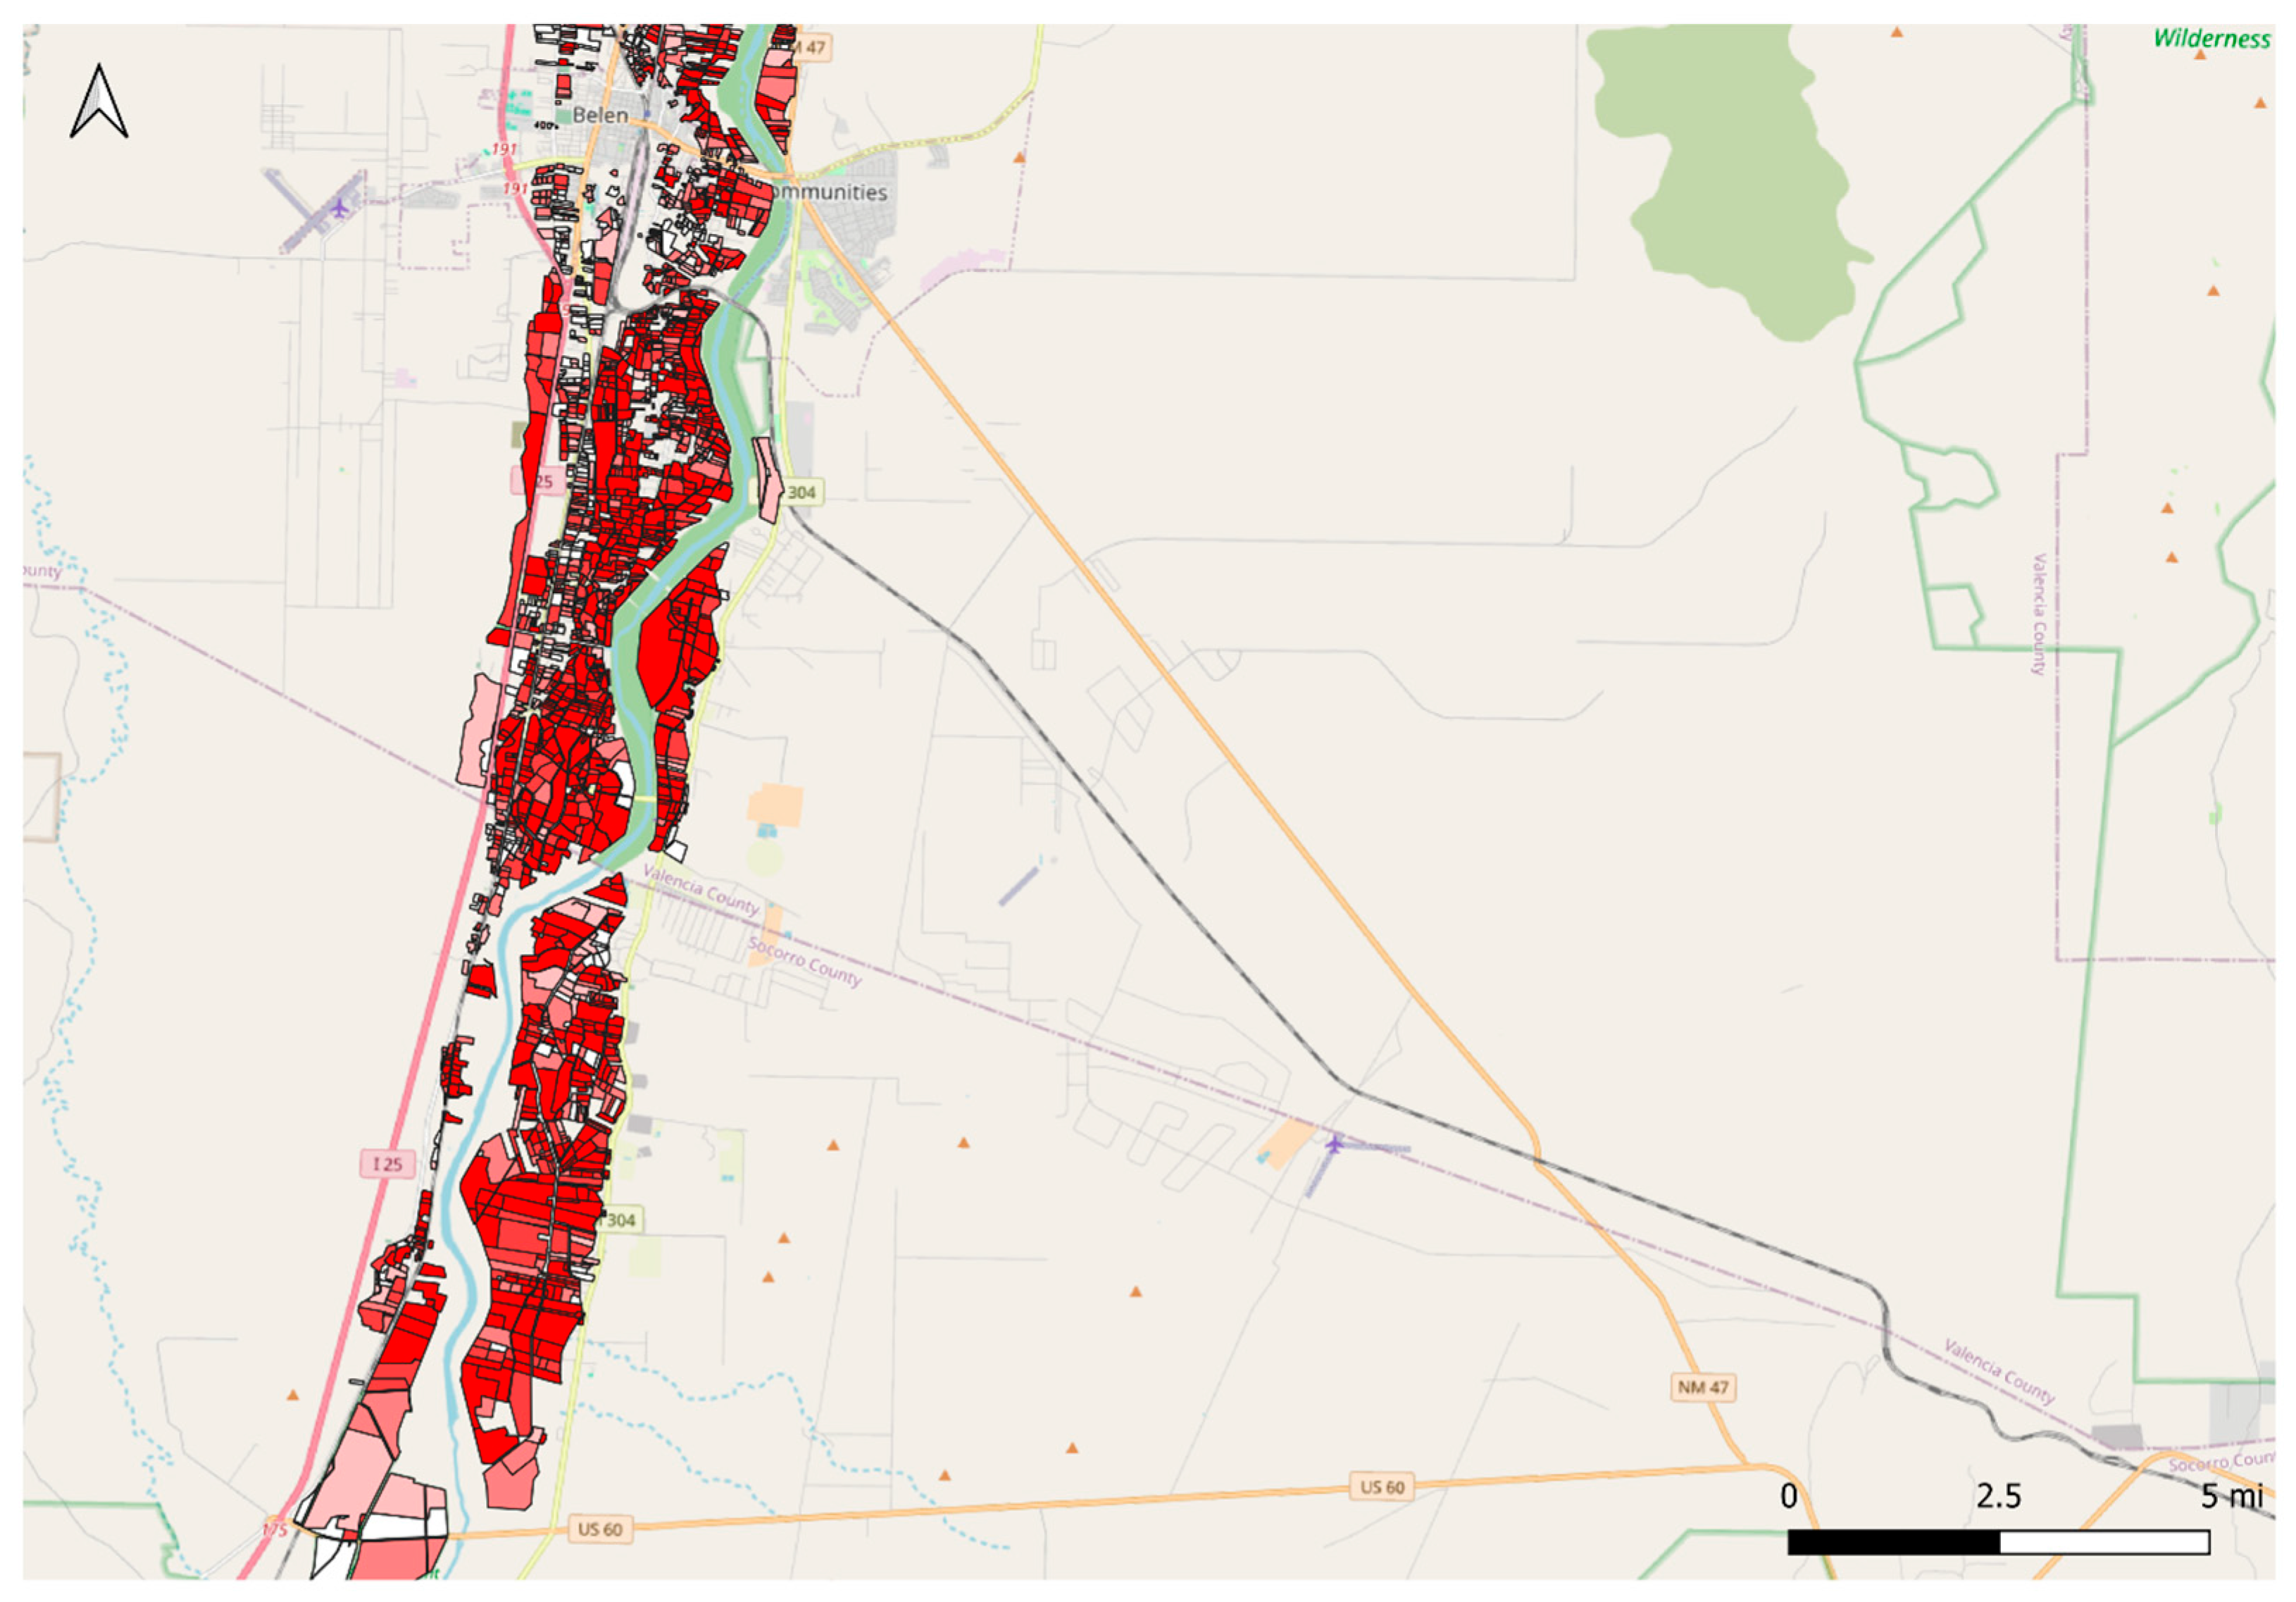
References
- Samimi, M.; Mirchi, A.; Townsend, N.; Gutzler, D.; Daggubati, S.; Ahn, S.; Sheng, Z.; Moriasi, D.; Granados-Olivas, A.; Alian, S.; et al. Climate change impacts on agricultural water availability in the Middle Rio Grande basin. JAWRA J. Am. Water Resour. Assoc. 2022, 58, 164–184. [Google Scholar] [CrossRef] [Scilit]
- Samimi, M.; Mirchi, A.; Moriasi, D.; Sheng, Z.; Gutzler, D.; Taghvaeian, S.; Alian, S.; Waner, K.; Hargrove, W. Adapting irrigated agriculture in the Middle Rio Grande to a warm-dry future. J. Hydrol. Reg. Stud. 2023, 45, 101307. [Google Scholar] [CrossRef] [Scilit]
- Holmes, R.N.; Mayer, A.; Gutzler, D.S.; Chavira, L.G. Assessing the effects of climate change on Middle Rio Grande surface water supplies using a simple water balance reservoir model. Earth Interact. 2022, 26, 168–179. [Google Scholar] [CrossRef] [Scilit]
- Abatzoglou, J.T. Development of gridded surface meteorological data for ecological applications and modelling. Int. J. Climatol. 2013, 33, 121–131. [Google Scholar] [CrossRef] [Scilit]
- South Central Climate Science Center. Drought History for New Mexico’s 8 Regions; South Central Climate Science Center: Norman, OK, USA, 2018; Available online: https://southcentralclimate.org/wp-content/uploads/2018/12/Drought-History-of-New-Mexicos-8-Regions-.pdf (accessed on 12 October 2025).
- Mortensen, J.G.; González-Pinzón, R.; Dahm, C.N.; Wang, J.; Zeglin, L.H.; Van Horn, D.J. Advancing the food–energy–water nexus: Closing nutrient loops in arid river corridors. Environ. Sci. Technol. 2016, 50, 8485–8496. [Google Scholar] [CrossRef] [Scilit] [PubMed]
- Kahil, M.T.; Ward, F.A.; Albiac, J. Multilevel groundwater management: Linking users with externalities. J. Hydrol. 2015, 525, 792–806. [Google Scholar]
- Ward, F.A. Water valuation for economic development and climate planning. Int. J. Water Resour. Dev. 2024, 40, 940–966. [Google Scholar] [CrossRef] [Scilit]
- Richter, B.D.; Abdelmohsen, K.; Dhakal, S.; Famiglietti, J.S.; Fowler, K.F.; Green, H.; Marston, L.; Mekonnen, M.M.; Prunes, E.; Rohde, M.M.; et al. Overconsumption gravely threatens water security in the binational Rio Grande–Bravo basin. Discov. Water 2025, 5, 104. [Google Scholar] [CrossRef] [Scilit]
- New Mexico Office of the State Engineer (NMOSE). NM Water Use by Categories 2020, Technical Report 56; NMOSE Water Use and Conservation Bureau: Santa Fe, NM, USA, 2024.
- New Mexico Economic Development Department (NMEDD). Quarterly Economic Summary; NMEDD: Santa Fe, NM, USA, 2025.
- U.S. Department of Agriculture, National Agricultural Statistics Service (USDA NASS). 2022 Census of Agriculture; USDA: Washington, DC, USA, 2022.
- Holmes, T.; Skaggs, R. Economic Impact of Agriculture in the Southern Albuquerque, New Mexico Metropolitan Area; New Mexico State University: Las Cruces, NM, USA, 2014. [Google Scholar]
- Wang, Y.X. Agriculture in Peri-Urban Regions: An Action Research Model for a New Economic Development Strategy. Master’s Thesis, New Mexico State University, Las Cruces, NM, USA, 2007. [Google Scholar]
- Rister, M.E.; Sturdivant, A.W.; Lacewell, R.D.; Michelsen, A.M. Challenges and opportunities for water of the Rio Grande. J. Agric. Appl. Econ. 2011, 43, 367–378. [Google Scholar] [CrossRef] [Scilit]
- Bartolino, J.R.; Cole, J.C. Ground-Water Resources of the Middle Rio Grande Basin, New Mexico; U.S. Geological Survey: Reston, VA, USA, 2002; Professional Paper 1222.
- National Oceanic and Atmospheric Administration—National Integrated Drought Information System (NOAA-NIDIS). New Mexico Drought Information. 2025. Available online: https://www.drought.gov/states/new-mexico (accessed on 10 October 2025).
- Tara, K.H.; Fleck, J. Last Call: The limitations of New Mexico’s existing water management framework in the face of reduced Colorado River water deliveries. Colo. Nat. Resour. Energy Environ. Law Rev. 2024, 35, 35. [Google Scholar]
- Fleck, J.; Berrens, R.P. Ribbons of Green: The Rio Grande and the Making of Modern Albuquerque; University of New Mexico Press: Albuquerque, NM, USA, 2026. [Google Scholar]
- New Mexico Office of the State Engineer (NMOSE). Evaluation of the MRGCD Irrigation System and Water Measurement Program; New Mexico Interstate Stream Commission: Santa Fe, NM, USA, 2002.
- Bell, M.T.; Montero, N.Y. Water-Level Data for the Albuquerque Basin and Adjacent Areas, Central New Mexico, Period of Record Through September 30, 2021; U.S. Geological Survey Scientific Investigations Report 2022–1162; USGS: Reston, VA, USA, 2022.
- Giri, A.K.; Subedi, D.; Todd, J.E.; Litkowski, C.; Whitt, C. Off-farm income a major component of total income for most farm households in 2019. Amber Waves 2021, 2021, 9. [Google Scholar]
- Hasenbeck, E.C.; Scruggs, C.E.; Morgan, M.; Wang, J.; Webster, A.J.; Gomez, C.M. Perspectives on innovative approaches in agriculture to managing water scarcity in the Middle Rio Grande Basin. Agriculture 2025, 15, 793. [Google Scholar] [CrossRef] [Scilit]
- Middle Rio Grande Conservancy District (MRGCD). ISOLog (Irrigation, Soil, and Land Use Log) Geospatial Dataset, 30 m Land-use/Crop Classification for 2021; MRGCD: Albuquerque, NM, USA, 2021. [Google Scholar]
- Melton, F.S.; Huntington, J.; Grimm, R.; Hain, C.; Anderson, M.; Kustas, W.; Herring, J.; Hall, M.; Rollison, D.; Erickson, T.; et al. OpenET: Filling a critical data gap in water management for the western United States. J. Am. Water Resour. Assoc. 2022, 58, 971–994. [Google Scholar] [CrossRef] [Scilit]
- QGIS Development Team. QGIS Geographic Information System, version 3.34; Open Source Geospatial Foundation: Beaverton, OR, USA, 2024. Available online: https://qgis.org (accessed on 24 August 2025).
- Burrough, P.A.; McDonnell, R.A.; Lloyd, C.D. Principles of Geographical Information Systems; Oxford University Press: Oxford, UK, 2015. [Google Scholar]
- Goodchild, M.F.; Li, W. Replication across space and time must be weak in the social and environmental sciences. Proc. Natl. Acad. Sci. USA 2021, 118, e2120015118. [Google Scholar] [CrossRef] [Scilit]
- New Mexico Office of the State Engineer (NMOSE). Water Rights and Groundwater Well Records Database (Well Locations and Related Attributes Used for Spatial Joins); NMOSE: Santa Fe, NM, USA, 2025.
- Middle Rio Grande Conservancy District (MRGCD). Drought Contingency Plan—Final Report; MRGCD: Albuquerque, NM, USA, 2019. [Google Scholar]
- Skaggs, R.; Demouche, L.; Holmes, T.; Samani, Z.; Bawazir, A.S. Urbanization Issues in the Middle Rio Grande Conservancy District; Colorado State University: Fort Collins, CO, USA, 2011. [Google Scholar]
- Waring, E.; Dahlke, H.E.; Abatzoglou, J.T.; Medellín-Azuara, J.; Yost, M.A.; Bali, K.M.; Naughton, C.C.; Putnam, D.H.; Sabie, S.K.; Santos, N.R.; et al. Reimagining alfalfa as a flexible crop for water security in the Southwestern USA. Sci. Total Environ. 2025, 990, 179851. [Google Scholar] [CrossRef] [Scilit] [PubMed]
- van Ginkel, K.C.H.; Haasnoot, M.; Botzen, W.J.W. A framework for identifying climate change induced socio-economic tipping points. SSRN Electron. J. 2021. Available online: https://ssrn.com/abstract=3935775 (accessed on 28 February 2026).
- Djamai, N.; Zhong, D.; Fernandes, R.; Zhou, F. Evaluation of vegetation biophysical variables time series derived from synthetic Sentinel-2 images. Remote Sens. 2019, 11, 1547. [Google Scholar] [CrossRef] [Scilit]
- Oat, J.; Paskus, L. Water marketing. In Water Matters! Utton Transboundary Resources Center: Albuquerque, NM, USA, 2015; pp. 145–152. [Google Scholar]
- Veihl, A. Securing Environmental Flows for the Rio Grande Silvery Minnow. 2023. Available online: https://digitalrepository.unm.edu/wr_sp/201/ (accessed on 12 January 2025).
- Molden, D. Water for Food, Water for Life: A Comprehensive Assessment of Water Management in Agriculture; Routledge: London, UK, 2013. [Google Scholar]
- Mobeen, M.; Kabir, K.H.; Schneider, U.A.; Ahmed, T.; Scheffran, J. Climate change perception, adaptation, and constraints in irrigated agriculture in Punjab and Sindh, Pakistan. Mitig. Adapt. Strateg. Glob. Change 2025, 30, 23. [Google Scholar] [CrossRef] [Scilit]
- United States Department of Agriculture, Economic Research Service (USDA ERS). Irrigation & Water Use; USDA ERS: Washington, DC, USA, 2018. Available online: https://www.ers.usda.gov/topics/farm-practices-management/irrigation-water-use (accessed on 2 March 2026).
- Pfeiffer, L.; Lin, C.-Y.C. Groundwater pumping and electricity consumption in agriculture. Am. J. Agric. Econ. 2014, 96, 1349–1362. [Google Scholar]
- Scanlon, B.R.; Zhang, Z.; Save, H.; Wiese, D.N.; Landerer, F.W.; Long, D.; Chen, J. Global evaluation of new GRACE mascon products for hydrologic applications. Water Resour. Res. 2016, 52, 9412–9429. [Google Scholar] [CrossRef] [Scilit]
- Ward, F.A. Economic impacts on irrigated agriculture of water conservation programs in drought. J. Hydrol. 2014, 508, 114–127. [Google Scholar] [CrossRef] [Scilit]
- Jasechko, S.; Seybold, H.; Perrone, D.; Fan, Y.; Shamsudduha, M.; Taylor, R.G.; Fallatah, O.; Kirchner, J.W. Rapid groundwater decline and some cases of recovery in aquifers globally. Nature 2024, 625, 715–721. [Google Scholar] [CrossRef] [Scilit] [PubMed]
- Richter, B.D. Decoupling urban water use from population growth in the Colorado River Basin. J. Water Resour. Plan. Manag. 2023, 149, 04022082. [Google Scholar] [CrossRef] [Scilit]
- Olofinsao, O.A. Agricultural Water Management, Farmer Decision-Making, and Climate Adaptation in Dryland Agriculture: Evidence from the Middle Rio Grande Basin. Doctoral Dissertation, University of New Mexico, Albuquerque, NM, USA, 2026. [Google Scholar]
- Trail, S.M.; Ward, F.A. Uniting agricultural water management, economics, and policy for climate adaptation through a new assessment of water markets for arid regions. Agric. Water Manag. 2024, 305, 109101. [Google Scholar] [CrossRef] [Scilit]

Disclaimer/Publisher’s Note: The statements, opinions and data contained in all publications are solely those of the individual author(s) and contributor(s) and not of MDPI and/or the editor(s). MDPI and/or the editor(s) disclaim responsibility for any injury to people or property resulting from any ideas, methods, instructions or products referred to in the content. |
© 2026 by the authors. Licensee MDPI, Basel, Switzerland. This article is an open access article distributed under the terms and conditions of the Creative Commons Attribution (CC BY) license.