


Abstract
The Shaanxi section of the Qinling Mountains serves as a critical ecological transition zone and security barrier between northern and southern China. Monitoring the dynamics of its vegetation Net Primary Productivity (NPP) is essential for understanding regional carbon cycling and informing ecological management strategies. This study integrates three complementary analytical frameworks: the Mann–Kendall test combined with the Theil–Sen slope for linear trend extrapolation (MK-Theil-Sen), mechanistic simulation (CASA model), and machine learning (random forest). First, we analyzed the spatiotemporal evolution of NPP from 2000 to 2023. Then, based on three CMIP6 scenarios (SSP119, SSP245, SSP585), we projected NPP changes for 2030–2050 and compared results across different models and scenarios. The key findings are as follows: ① From 2000 to 2023, NPP in the Shaanxi section of the Qinling Mountains exhibited a fluctuating upward trend with a cumulative increase of 16.7%. Spatially, it showed a pattern of “higher in the south, lower in the north; higher in the west, lower in the east”. ② Multiple models predict continued NPP growth, though the magnitude remains uncertain. Mechanistic models, incorporating climate stress factors, yield relatively conservative projections. ③ Emission scenarios significantly influence future trends, with low-emission pathways (SSP119) favoring NPP enhancement and extended growing seasons. ④ Different vegetation types exhibit varying responses to scenario changes: broadleaf forests show the highest sensitivity, while grasslands and meadows demonstrate strong climate stability across models, with cultivated vegetation exhibiting intermediate sensitivity. This study provides comprehensive scientific references for regional ecological security assessment and adaptive management through historical analysis and multi-model, multi-scenario projections of NPP in the Shaanxi section of the Qinling Mountains.
1. Introduction
Terrestrial ecosystem stability is increasingly threatened by global climate change and intensifying anthropogenic activities. For instance, global mean surface temperature has risen by approximately 1.1 °C since the pre-industrial era, and the frequency of extreme weather events (e.g., droughts, heatwaves) has increased by 30% over the past three decades, directly reducing ecosystem resilience [1,2]. Against the backdrop of warming climates and shifting precipitation patterns, compounded by regional development and vegetation disturbances, terrestrial ecosystem carbon cycles have undergone significant alterations. According to the IPCC Sixth Assessment Report, although global terrestrial net primary productivity (NPP) showed a slight upward trend (approximately +0.2 Pg C·a−1) from 1982 to 2015, in arid and semi-arid regions (e.g., Northwest and North China), NPP decreased by 5–12% due to frequent-extreme droughts, significantly inhibiting the capacity of vegetation to sequester atmospheric CO2 through photosynthesis [3,4,5]. These changes not only directly influence the spatiotemporal dynamics of net primary productivity (NPP) but also trigger related impacts such as fluctuations in ecosystem carbon sink functions and reduced stability of ecological barriers [6,7,8]. In actively addressing global climate change and advancing the implementation of the “dual carbon” goals, coordinating regional ecosystem conservation with enhanced carbon sink potential to achieve harmonized progress in ecological security and sustainable development is a critical focus in contemporary ecological and environmental research [9]. Therefore, conducting quantitative assessments, dynamic monitoring, and future projections of regional-scale NPP is essential for understanding ecosystem response mechanisms to global change and supporting ecological management decisions [10].
The estimation and forecast of regional-scale vegetation net primary productivity (NPP) represent a crucial technical approach for characterizing carbon cycling processes and evaluating ecosystem functions [11]. Diverse technical pathways have emerged within the academic community, with extensive practical achievements accumulated across different regions [12]. Mechanistic models of photosynthetic efficiency represent a classical approach for NPP estimation. Among these, the C-FIX model demonstrates good adaptability in regional carbon cycle simulations by integrating remote sensing parameters with photosynthetic physiological processes. Zhang Dongyou et al. (2011) estimated forest NPP in Heilongjiang Province using this model, achieving an error range of 3.92–5.85% compared to MODIS NPP products, validating its reliability in temperate forest ecosystems [13]. Improved mechanistic models, exemplified by the CASA model, have gained widespread application in complex climatic regions through optimized parameters for hydro-temperature stress factors. Ling Siyuan et al. (2022) utilized this model to analyze NPP dynamics in Tianjin from 2011 to 2020, revealing the primary influence of air temperature on regional vegetation carbon sequestration capacity [14]. The MODIS series NPP data, leveraging its high spatio-temporal resolution, provides a convenient data source for large-scale rapid assessments. Wang Shu et al. (2015) analyzed the spatio-temporal characteristics of NPP in the Shaanxi-Gansu-Ningxia region based on MOD17A3 data, finding that the cumulative carbon sequestration in the region increased by 1.06 × 10⁷ tons after the implementation of ecological restoration projects, demonstrating the application value of remote sensing data in long-term dynamic monitoring [15]. Regarding future projections, existing studies have explored multiple technical approaches: Cheng Songtao et al. (2023) coupled the SD and PLUS models to simulate habitat impacts from land-use changes in Ankang City under CMIP6 SSPs-RCPs scenarios, providing technical references for linking land-use and NPP predictions [16]. Qu Xuebin et al. (2026) combined the Delta downscaling method with the Lasso regression model to conduct multi-scenario predictions of NPP in Inner Mongolia based on CMIP6 data, revealing spatial differentiation patterns of NPP under different emission pathways [17]. While these methods possess distinct advantages in specific regions and scenarios, their applicability is constrained by model mechanisms, data accuracy, and regional characteristics: mechanistic models rely on complex parameter calibration [18], remote sensing data products may exhibit biases in topographically complex areas [19], and prediction models often focus on single drivers [20], making it difficult to comprehensively meet the dynamic assessment needs of NPP in complex ecosystems [21].
In regional-scale NPP estimation, prediction, and driver mechanism studies, typical ecological barrier zones—with their unique geographic positioning and ecological functions—often serve as crucial research areas for analyzing carbon cycle responses to global change [22]. These regions bear significant ecological conservation responsibilities, where NPP dynamics directly influence regional carbon sink potential and ecosystem stability, thereby demanding higher methodological rigor and precision in related research [23]. The Shaanxi section of the Qinling Mountains, serving as China’s north–south geographical boundary and a core ecological security barrier, exemplifies such representative regions. The spatiotemporal evolution and future trends of its NPP have become critical topics in ecological conservation and carbon cycle research [24]. Several scholars have conducted studies in this region: Liu Jiayi et al. (2019) employed the C-FIX model to reveal the “higher south, lower north” distribution pattern of NPP from 2000 to 2015, and combined it with the ASD model to project future trends under RCP scenarios [25]; Zhang Shanhong et al. (2017), using the CASA model, found that broadleaf forests exhibited the highest NPP, which correlated with monthly temperature [26]; and Zhao Xuerui et al. (2024), by improving the CASA model with TVDI, confirmed precipitation and land-use as the primary drivers of regional NPP [27]. Guo Siqi et al. (2020) coupled the CASA and LCM models to analyze vegetation carbon sequestration differences under four IPCC scenarios by 2030 [28]. Overall, existing studies predominantly rely on single-mechanism models for historical reconstruction or limited scenario projections, lacking multi-model comparison frameworks. Furthermore, systematic projections and uncertainty analyses under the latest CMIP6 SSP-RCPs scenarios have not been conducted [29], making it challenging to comprehensively support regional carbon sink assessments and climate adaptation strategy development [30].
The spatiotemporal dynamics of net primary productivity (NPP) in the Shaanxi section of the Qinling Mountains not only serve as a key indicator of regional ecosystem health but also directly bear on the regulation of north–south climate, the maintenance of biodiversity, and the regional implementation of China’s national “dual carbon” strategy [31]. However, current NPP research in this region remains significantly limited: on one hand, existing MODIS NPP products lack monthly-scale information and predictive capabilities, and their use of globally uniform parameters makes them inadequate for targeted characterization of the Qinling area; on the other hand, the Qinling region still lacks future NPP prediction studies coupling the CASA model with CMIP6 multi-scenario data. Furthermore, existing studies predominantly describe macro-spatial patterns without refining high/medium/low-value zoning at the city/county scale, nor do they systematically compare average, extreme NPP values, and vegetation–topography correlations between northern and southern slopes. Therefore, this study establishes a novel complementary framework that integrates trend analysis and linear extrapolation (Mann–Kendall + Theil–Sen), mechanistic simulation (CASA model), and machine learning (random forest regression) to analyze the spatiotemporal evolution of NPP from 2000 to 2023. This framework innovatively combines statistical trend detection, process-based physiological modeling, and data-driven statistical learning, which overcomes the limitations of single-method approaches and provides a more robust basis for future projections. It further projects NPP changes for 2030–2050 under SSP119, SSP245, and SSP585 scenarios and explicitly compares prediction discrepancies among different models. The study focuses on revealing spatial differentiation at the city and county scales and north–south slope differences, characterizing the dynamic features of vegetation types, elucidating the impact of emission scenarios on NPP growth, and analyzing the sensitivity and stability of vegetation responses. By conducting a comprehensive comparison across multiple models and scenarios, it quantifies prediction uncertainties, providing a more comprehensive and objective scientific basis for optimizing regional ecological security patterns, formulating climate adaptation strategies, and assessing carbon sinks under the “dual carbon” goals.
2. Materials and Methods
2.1. Study Area
The Shaanxi section of the Qinling Mountains (32°50′–34°45′ N, 104°30′–112°52′ E) lies in China’s inland hinterland, primarily comprising the central Qinling mountain range in southern Shaanxi. It spans multiple cities and counties in Shaanxi Province, including Baoji and Xi’an (Figure 1), covering a total area of approximately 58,000 km2. The region’s principal peak, Mount Taibai, rises to 3767 m above sea level, making it the highest peak in central-eastern China [32]. Serving as the watershed between the Yangtze and Yellow River basins, this area holds significant ecological and scientific research value [33].
Figure 1.
Location of the study area. (a) The Shaanxi section of the Qinling Mountains (red shaded area) within China; (b) detailed administrative divisions of the study area, including cities and counties.
The terrain generally slopes from west to east, with the main mountain ridges ranging between 2000 and 2800 m in elevation. This creates a distinct topographic contrast with the Weihe River Plain to the north. The region exhibits diverse landforms, and this topography directly influences the spatial distribution of water and heat resources [34,35]. Climatically, the region lies at the transition between subtropical and warm temperate zones. According to the Köppen climate classification, the southern slope is dominated by humid subtropical climates (Cwa/Cwb), while the northern slope and high-altitude areas are characterized by temperate continental climates (Dwa/Dwb/Dwc), resulting in pronounced north–south slope climatic differences and a complete vertical climatic zonation. Variations in water–heat combinations across different areas influence the spatial distribution and seasonal dynamics of regional NPP [36]. The complex topography and climate conditions foster diverse vegetation communities. The main vegetation types in the study area include: broadleaf forests and coniferous forests, which dominate the mountainous slopes, with broadleaf forests more prevalent in the lower, warmer elevations of the southern slope and coniferous forests becoming dominant at higher altitudes and on the cooler northern slope; shrublands and grasslands, which are widely distributed across the mid-elevation zones and transitional areas between forests and alpine zones; meadows, which are primarily found in the high-altitude areas above 2500 m, adapted to the cold and humid conditions; and cultivated vegetation, which is concentrated in the low-lying Weihe River Plain to the north, reflecting human land-use patterns. The spatial distribution of these vegetation types is closely related to topographic elevation and water–heat resources (Figure 2), providing the ecological basis for the spatial heterogeneity of NPP.
Figure 2.
Schematic distribution of vegetation types in the study area.
2.2. Data Sources and Processing
The specific sources, core attributes, and preprocessing procedures for various datasets used in this study are as follows:
(1) Temperature and precipitation data: Monthly mean temperature and precipitation data in this study were derived from the 1 km resolution datasets (1901–2023) provided by the National Tibetan Plateau Data Center [37]. These datasets were generated via the Delta spatial downscaling method, as detailed in Peng et al. (2020), which downscaled CRU 0.5° and WorldClim high-resolution data to 1 km over China [38]. Additive correction was used for temperature (T_down = T_obs + ΔT_model), and multiplicative correction for precipitation (P_down = P_obs × (P_model/P_model_ref)) to maintain spatial patterns. Validated against 496 national meteorological stations [1,2], the datasets show reliable performance. A secondary validation with 36 stations in/around the Shaanxi Qinling Mountains yielded R2 = 0.94 (RMSE = 1.23 °C) for temperature and R2 = 0.87 (RMSE = 18.65 mm) for precipitation, satisfying the study’s accuracy requirements.
(2) Vegetation Type Map: This dataset was derived from the 1:1,000,000 Vegetation Atlas of China, compiled and edited by Academician Hou Xueyu. The atlas was jointly developed by more than 250 experts from 53 institutions, including research institutes of the Chinese Academy of Sciences, national ministries, local departments of provinces and regions, and universities. It was officially published by Science Press and is publicly available worldwide.
(3) NDVI Data: Utilizes the monthly vegetation index product MOD13A3 regularly released by the National Aeronautics and Space Administration (NASA). This product generates monthly NDVI data through a time-synthesis algorithm based on MOD13A2 (16-day composite, 1 km resolution) VI data using a weighted average method. Specifically, the monthly data represents the weighted average of the 16-day period NDVI data covering the dates within that month.
(4) Solar Radiation Data: Sourced from the TerraClimate dataset, jointly developed by research institutions including the University of Idaho. This dataset contains global-scale climate elements such as solar radiation. Systematically validated and calibrated, it exhibits strong spatial continuity and reliable data accuracy, meeting the radiation factor analysis requirements of this study.
Furthermore, to ensure data consistency and analytical precision, all aforementioned datasets underwent standardized preprocessing: data clipping and reprojection were performed in ArcGIS software (ArcMap 10.8.1) to unify all datasets into the same coordinate system and 1 km spatial resolution. Through resampling, format conversion, and other operations, errors arising from differences in data formats and resolutions were eliminated, ultimately forming a standardized research dataset. The usage of data in the paper is shown in Table 1.
Table 1.
The usage of data.
2.3. Research Methodology
This study developed an integrated technical framework for analyzing NPP spatiotemporal dynamics and future trends (Figure 3). It incorporates multi-source data inputs and three core modules: the improved CASA model for historical NPP inversion, the MK-Logistic model for trend extrapolation, and the random forest model for multi-scenario projection.
Figure 3.
Flowchart of the used methodology.
2.3.1. CASA Model
We utilized the CASA model, optimized following Zhu et al. (2007), to estimate and project vegetation NPP [39] in the Shaanxi section of the Qinling Mountains. Based on the photosynthetic energy utilization mechanism, the model posits that NPP is jointly determined by the photosynthetically active radiation (APAR) absorbed by vegetation and the actual photosynthetic energy utilization efficiency (ε). The core formula is:
APAR calculation relies on the ratio of total solar radiation to vegetation canopy absorption, expressed as:
where SOL(x, t) represents total solar radiation (MJ/m2) at pixel x at time t, obtained from interpolated meteorological station data for historical periods and CMIP6-Earth-3 model scenario data for future projections; FPAR refers to the Fraction of Photosynthetically Active Radiation, and FPAR(x, t) is derived from empirical relationships between NDVI and vegetation types, serving as the critical parameter linking remote sensing data to the model [40]; and the constant 0.5 represents the proportion of photosynthetically active radiation (PAR, wavelength 0.38–0.71 μm) within total solar radiation [41]. The actual light energy utilization efficiency ε is derived from the maximum light energy utilization rate through environmental stress attenuation, calculated as:
εmax represents the maximum light energy utilization rate under ideal conditions (gC/MJ), assigned according to vegetation type; Tε1(x, t) and Tε2(x, t) denote low-temperature and high-temperature stress factors, respectively, calculated from monthly mean temperatures [42]; Wε(x, t) is the water stress factor, representing the ratio of actual to potential evapotranspiration, reflecting soil moisture constraints on photosynthesis [43].
2.3.2. Future NPP Prediction Based on MK Trend Extrapolation
This study employs a combined approach of Mann–Kendall trend testing and Theil–Sen slope estimation for future NPP projections [44]. Trend analysis of the 2000–2023 NPP sequence yielded a standardized statistic Z = 3.24 (p < 0.01), indicating a highly significant upward trend in NPP across the study area. Further, using the Theil–Sen slope estimation method, the median of 276 slope values from 24 years of data was calculated, yielding an interannual change rate β = 5.12 gC·m−2·a−1, indicating NPP growth at an annual rate of 5.12 gC·m−2 [45]. Using 2023 as the base year (NPP = 861.86 gC·m−2·a−1), a linear extrapolation prediction model was established:
NPPT represents the predicted NPP value for year T, where T denotes the target year. The projected NPP values for 2030, 2040, and 2050 are 897.7, 948.9, and 1000.1 gC·m−2·a−1. The scaling factors KT relative to 2023 were calculated as 1.0416, 1.1010, and 1.1604, respectively. Monthly-scale prediction employed a proportional allocation method under annual total control:
where NPPT,m denotes the NPP value for month m in the forecast year, NPP2023,m denotes the NPP value for month m in 2023, and m represents the month (1–12) to maintain the inter-monthly distribution pattern [46]. Based on Sen’s slope 95% confidence interval [4.87, 5.38], prediction uncertainty is quantified. For example, the 95% confidence interval for 2030 NPP is [895.95, 899.52] gC·m−2·a−1. This method requires no assumptions about data distribution, is robust to outliers, and offers computational transparency. However, it does not explicitly incorporate climate change scenarios. Subsequent comparisons with predictions from the CASA mechanistic model and the random forest model will provide multi-perspective references for this study.
2.3.3. NDVI Prediction Method: MK-Logistic Coupled Model
This study employs the MK-Logistic coupling model for NDVI prediction, balancing trend robustness and ecological plausibility [47]. First, the Mann–Kendall nonparametric trend test was applied to the monthly NDVI series from 2000 to 2010. This method does not require data to follow a normal distribution, is insensitive to outliers, and is suitable for vegetation index time-series analysis [48]. The core calculation formula is the statistic:
and the standardized test statistic:
When |Z| > 2.58, the trend is statistically significant at the α = 0.01 level. Subsequently, the interannual change rate β for each month’s NDVI was calculated using the Theil–Sen slope estimation method, which employs the median of all pairwise slopes between data points for greater robustness [49].
To prevent unreasonable NDVI values exceeding ecological upper limits due to linear extrapolation, a logistic growth model is introduced to characterize saturation effects. The core formula is:
where L = 0.92 (the saturation upper limit determined by the historical maximum NDVI value in the Qinling region), k is the growth rate, and t0 is the inflection point year. After linearizing the model, parameters were fitted using data from 2000 to 2010 [50].
This study adopted a “leave-one-out” validation strategy, using 2000–2010 as the training set and 2011–2020 as the validation set. Model reliability was assessed via RMSE, MAE, R2, and summer peak error metrics. After validation, projections were extended to 2030–2050 using the scaling coefficient method to generate raster data:
where m denotes the month (1–12) and Kₘ represents the scaling coefficient for each month, ensuring that spatial patterns align with the reference year [51].
2.3.4. Random Forest-Based Dynamic NPP Prediction Model
Based on monthly-scale observational data from the Shaanxi section of the Qinling Mountains spanning 2000–2023, this study constructs a random forest regression model to uncover the complex nonlinear relationship between environmental drivers and NPP. This enables precise prediction of NPP changes under different climate scenarios, providing technical support for regional ecological assessment [52].
As an ensemble learning algorithm, this model generates 10 training subsets from the original dataset via bootstrap sampling, with each subset independently training a decision tree. During node splitting, two features are randomly selected, and the optimal split point is determined by minimizing the mean squared error (MSE) by calculating node means and MSE. The final prediction value is the average of all decision tree results, balancing prediction accuracy and stability. Input features were selected based on CASA model mechanisms and Qinling vegetation growth characteristics, identifying five core factors: monthly average temperature (Tavg, °C), monthly total precipitation (Psum, mm), monthly total solar radiation (Rsum, MJ/m2), monthly average NDVI (dimensionless), and month (M, coded 1–12). The feature vector is defined as , with the target variable being the monthly NPP simulated by the CASA model. The training dataset comprises 288 samples spanning 24 years. This study did not directly incorporate topographic factors such as altitude and slope, because topography affects vegetation growth by regulating the distribution of hydrothermal resources, and its comprehensive effects have been fully characterized by NDVI (which is the most important feature in the model, with a contribution rate of 0.38). Moreover, as a stable underlying surface factor, topography exhibits no spatiotemporal changes in the future, which does not affect the NPP trend projection under climate scenarios. Additionally, excluding these factors can avoid feature redundancy and multicollinearity.
The model was trained on the Orange3 platform to determine optimal hyperparameters: number of decision trees B = 10, minimum sample size for splitting nodes nmin = 5, and optimized using mean squared error as the loss function. Evaluated via 10-fold stratified cross-validation, the model demonstrated excellent performance: MSE = 46.101, RMSE = 6.790, MAE = 4.363, MAPE = 10.0%, and R2 = 0.976, effectively capturing the correlation patterns between NPP and environmental factors. Feature importance ranking was: monthly average NDVI (0.38) > monthly total precipitation (0.26) > monthly average temperature (0.18) > month (0.12) > monthly total solar radiation (0.06), consistent with ecological understanding of Qinling vegetation growth [53]. The ranking of feature importance quantitatively reveals the relative contribution of each factor to NPP. Among them, the monthly mean NDVI ranks first, with a contribution rate of 0.38, which not only reflects the direct driving effect of vegetation growth status on NPP but also integrates the combined effects of underlying surface factors such as ecological policies, human activities, and the complex terrain of the Qinling Mountains (e.g., altitude, aspect, slope). This embodies the potential regulatory role of topographic factors on NPP by regulating the spatial redistribution of hydrothermal resources and further influencing vegetation growth, which aligns well with the topographic differentiation pattern of NPP in the Qinling Mountains—“high in the south and west, low in the north and east”. Meanwhile, monthly total precipitation (0.26) and monthly mean temperature (0.18) highlight the dominant driving role of climatic conditions in NPP changes. These findings provide a solid statistical basis for the qualitative discussion of NPP driving mechanisms.
The trained model was applied to three scenarios (SSP119, SSP245, SSP585), inputting monthly-scale climate data and predicted NDVI values for 2030–2050 to calculate future NPP. Uncertainty stems from differences in climate model projections, limitations of model extrapolation under extreme conditions, and the assumption of gradual changes in NDVI predictions. The error range is quantified by constructing a 95% confidence interval through variance calculations, enhancing the model’s decision-making reference value [54].
2.3.5. Predictive Foundation and Technical Framework Construction
Reliable projections rely on robust data systems and model frameworks. This study establishes a three-dimensional “time–space–vegetation type” data system and integrates three differentiated models, laying the foundation for future NPP projections.
Using the 2000–2023 period as the historical baseline, this study focuses on three key projection years (2030, 2040, 2050) based on NPP data (annual and monthly scales) derived from the CASA model. Projection indicators include total NPP, monthly dynamics, and NPP values for six vegetation types. Climate driver data utilize SSP119 (low-emissions), SSP585 (high-emissions), and SSP245 (medium-emissions) scenario data from the CMIP6 Earth-3 model, specifically monthly precipitation, temperature, and solar radiation. NDVI data are processed using the MK-Logistic coupling model, validated against 2011–2020 historical data, demonstrating excellent model fit (R2 = 0.82, RMSE = 0.0182), consistent with actual vegetation change patterns in the Qinling Mountains. Concurrently, this study establishes a complementary framework integrating three model types—“historical trend,” “physiological process,” and “statistical learning”—with specific parameters and inputs detailed in Table 2.
Table 2.
Core parameters and input data for three prediction models.
3. Results and Analysis
3.1. Model Accuracy Evaluation
This study validated the accuracy of the improved CASA model using the MOD17A3HGF data product. This dataset employs the MOD17 algorithm to estimate annual total NPP values for terrestrial ecosystems and has been widely applied in regional and global NPP estimation studies [55]. The correlation coefficient of 0.69 indicates a moderate correlation between the improved CASA model and MOD17A3HGF data in interannual NPP trends, demonstrating the model’s simulation capability within the study area and its ability to reflect spatio-temporal variations in vegetation NPP.
To further validate the reasonableness of the simulation results, this study also compared the multi-year average NPP (813.71 gC·m−2·a−1) with other relevant studies (Table 3). The results show that the simulated values in this study fall within the range of estimates from various models (602.2–1019 gC·m−2·a−1) and are relatively close to the results based on the CASA model by Fan Xiaochen et al. (2024) (878.44 gC·m−2·a−1) [56]. Differences among studies primarily stem from variations in model structure, data sources, and study periods. The results herein, falling within a reasonable range, further validate the applicability and reliability of the improved CASA model for the Shaanxi section of the Qinling Mountains.
Table 3.
Comparison of simulated NPP values in this study with other studies.
3.2. Spatiotemporal Evolution Analysis of NPP in the Qinling Mountains Based on the Improved CASA Model
3.2.1. Temporal Variation Characteristics
From 2000 to 2023, NPP in the Shaanxi section of the Qinling Mountains exhibited a three-stage fluctuating upward trend characterized by “rapid growth–stable fluctuation–gradual increase.” Overall, NPP increased from 738.32 gC·m−2·a−1 to 861.86 gC·m−2·a−1, representing a cumulative increase of 16.73% and an average annual growth rate of 0.68%. The regression equation y = 4.323x + 760.69 (R2 = 0.5861, p < 0.01) passed the 0.01 significance level test, indicating statistical significance (Figure 4).
Figure 4.
Interannual variation trend of NPP in the Shaanxi section of the Qinling Mountains. Note: The black solid straight line represents the linear trend of NPP from 2000 to 2023; The black dotted line represents the measured average NPP values from 2000 to 2023; the gray dashed line indicates the 95% confidence interval.
Phased analysis reveals a rapid growth phase from 2000 to 2007: the annual average NPP increased from 738.32 gC·m−2·a−1 to 801.38 gC·m−2·a−1, with an annual growth of 8.90 gC·m−2·a−1 and an increase of 8.54%. This phase coincided with the large-scale implementation of the Grain for Green Program in the Qinling region, where the restoration of natural vegetation served as the primary driver of NPP growth. 2008–2016: Steady Fluctuation Stage: Annual average NPP remained within the range of 774.32–858.72 gC·m−2·a−1, with a fluctuation range of 10.90%. During this period, the vegetation ecosystem entered a stable development phase, and NPP variations were primarily influenced by interannual climate fluctuations. 2017–2023 marked a slow increase phase: annual average NPP rose from 822.05 gC·m−2·a−1 to 861.86 gC·m−2·a−1, with an average annual increase of 6.54 gC·m−2·a−1 (4.84%). The deceleration in growth rate stems partly from regional vegetation cover approaching environmental carrying capacity thresholds and partly from short-term impacts of localized extreme climate events on vegetation.
Seasonally, NPP follows a distribution pattern of “summer > spring > autumn > winter,” with seasonal averages of 371.87, 215.88, 172.08, and 52.42 gC·m−2·season, respectively. Summer NPP accounted for 45.81% of the annual total, while winter NPP represented only 6.45%, indicating a pronounced seasonal distribution difference. This pattern aligns with the seasonal matching characteristics of water and heat in the subtropical–warm temperate transition zone of the Qinling Mountains. Spring (March–May) witnessed a rapid NPP increase, rising from 31.58 gC·m−2·month−1 in March to 106.84 gC·m−2·month−1 in May–a 238.32% surge. During this period, temperatures recovered to the optimal range of 10–20 °C, precipitation gradually increased, and both water and thermal conditions improved simultaneously. This transitioned vegetation from dormancy into the budding and growth phase, characterized by continuous expansion of leaf unfolding rates and photosynthetic area, leading to enhanced photosynthetic intensity—the primary driver of NPP growth. Summer (June–August) marked the peak NPP period, with the three–month average exceeding 122 gC·m−2·month−1 each month. July recorded the annual maximum of 132.57 gC·m−2·month−1. During this period, average temperatures ranged from 22 to 28 °C with monthly precipitation of 100–150 mm, representing the optimal match of water and heat resources throughout the year. Vegetation maintained high photosynthetic efficiency, with most species entering vigorous growth phases. Biomass accumulation rates reached their annual maximum, forming the primary foundation for the annual carbon sink. Autumn (September–November) saw a rapid decline in NPP, dropping from 89.82 gC·m−2·month−1 in September to 25.95 gC·m−2·month−1 in November–a 71.11% decrease. As cold air masses from the north advance southward, monthly average temperatures drop by 5–8 °C, and daily sunshine duration decreases by over 30% compared to summer. Vegetation photosynthetic enzyme activity declines, and deciduous vegetation enters a phase of leaf senescence and shedding, leading to a significant reduction in photosynthetic area and a marked weakening of carbon sequestration capacity. Winter (December–February) recorded the lowest annual NPP, with the three-month average consistently below 19 gC·m−2·month−1, reaching its minimum in January (16.59 gC·m−2·month−1). During this period, the regional average temperature falls below 5 °C, with permafrost occurring in some high-altitude areas. Most vegetation enters dormancy, while only evergreen coniferous forests maintain minimal photosynthetic activity through their needles, resulting in near-stagnation of carbon sequestration functions. These seasonal dynamics reflect both the regulatory influence of climatic factors on vegetation growth and provide crucial temporal context for regional carbon sink assessments. Summer represents the core period for enhancing regional carbon sink accumulation, while the spring vegetation emergence phase and autumn decline phase exhibit heightened sensitivity to climatic fluctuations. Consequently, extreme climatic events during these two periods—such as spring droughts and autumn floods—warrant particular attention for their potential impact on annual carbon sink performance.
3.2.2. Spatial Distribution Characteristics
The spatial distribution of NPP in the Shaanxi section of the Qinling Mountains exhibits distinct patterns of “higher values in the south and lower in the north, higher in the west and lower in the east,” with pronounced spatial heterogeneity (Figure 5).
Figure 5.
Spatial distribution of the 24-year average NPP in the Shaanxi section of the Qinling Mountains (2000–2023).
Long-term trend analysis indicates improvement across most areas from 2000 to 2023, though patterns in densely populated regions exhibit greater complexity (Figure 6).
Figure 6.
Distribution of NPP variation trends in the Shaanxi section of the Qinling Mountains.
(1) At the city and county scale, based on multi-year average NPP values, 35 cities and counties can be categorized into three productivity tiers: high, medium, and low. The high-value zone (≥830 gC·m−2·a−1) encompasses 11 cities and counties, represented by Ningshan County (892.01 gC·m−2·a−1) and Weibin District (887.68 gC·m−2·a−1). These areas are primarily located in the mid-to-high mountain zones of the Qinling Mountains at elevations of 1200–3000 m. They experience minimal human disturbance (population density generally < 50 people/km2), with dominant vegetation consisting of evergreen coniferous forests and deciduous broadleaf forests. Vegetation coverage exceeds 80%, with intact ecosystem structure and outstanding photosynthetic productivity, forming the core of high regional NPP values. The medium-value zone (800–830 gC·m−2·a−1) encompasses 10 cities and counties, such as Meixian (824.11 gC·m−2·a−1) and Ningqiang County (823.10 gC·m−2·a−1), predominantly situated in mountain–river valley transition zones at 600–1200 m elevation. Terrain is characterized by low mountains and hills with moderate human activity intensity. Natural vegetation (predominantly shrublands) intermingles with artificial vegetation, yielding balanced NPP levels across this zone. Low-value zones (<800 gC·m−2·a−1) encompass 14 cities and counties, with Huayin City (738.27 gC·m−2·a−1) registering the lowest value. These areas are concentrated in the northern Weihe River valley and eastern low mountain–hilly regions, generally below 600 m elevation. Over 60% of the land is cultivated. Urban construction land is concentrated, compressing natural vegetation growth space. Dominant vegetation consists mainly of sparse grasslands, resulting in overall low productivity.
(2) Comparison between northern and southern slopes revealed that the northern slopes (12 counties/cities) had a multi-year average NPP of 818.36 gC·m−2·a−1, exhibiting a spatial pattern of “higher in the west, lower in the east.” The western mid-to-high mountain areas (Weibin District, Liuba County) generally recorded NPP > 830 gC·m−2·a−1, while eastern Weihe River valley areas (Huayin City, Linwei District) generally recorded NPP < 800 gC·m−2·a−1, revealing pronounced east–west variation. The southern slope (23 counties/cities) exhibited a multi-year average NPP of 807.52 gC·m−2·a−1, with a spatial pattern characterized by “north–south differentiation + west-high east-low”, with higher NPP in the southern mid-to-high mountain areas (Ningshan County, Shiqian County) and moderate NPP in the northern areas near the ridge line (Lueyang County, Hantai District). Concurrently, western regions (Taibai County, Mian County) exhibit higher NPP than eastern regions (Hanbin District, Xunyang County). Comparing extremes, the difference between the highest value on northern slopes (Weibin District: 887.68 gC·m−2·a−1) and the lowest (Huayin City: 738.27 gC·m−2·a−1) was 149.41 gC·m−2·a−1. while the south slope’s maximum (Ningshan County: 892.01 gC·m−2·a−1) and minimum (Xunyang City: 764.21 gC·m−2·a−1) differed by 127.80 gC·m−2·a−1. Variability was greater on the north slope than the south slope, primarily due to the eastern Weihe River valley’s low-value areas lowering the lower bound. The NPP difference between the northern and southern Qinling slopes stems from long-term synergies of topography, climate, and human activities. The southern slope has steeper elevation gradients, stronger monsoon influence (subtropical humid climate), and earlier ecological restoration with lower human disturbance, while the northern slope is gentler (warm–temperate semi-humid climate) with more intensive agriculture and urbanization. This results in a pattern of slightly higher mean NPP but greater fluctuation on the northern slope, and more prominent high values with balanced distribution on the southern slope, matching the Qinling’s north–south hydrothermal divide.
3.3. NPP Characteristic Analysis of Different Vegetation Types in the Qinling Mountains Based on the Improved CASA Model
3.3.1. NPP Differences Among Vegetation Types
The multi-year average NPP ranking for six major vegetation types in the Shaanxi section of the Qinling Mountains is: broadleaf forests (917.16 gC·m−2·a−1) > cultivated vegetation (867.60 gC·m−2·a−1) > meadows (810.36 gC·m−2·a−1) > coniferous forests (754.89 gC·m−2·a−1) > shrublands (722.77 gC·m−2·a−1) > grasslands (684.30 gC·m−2·a−1). The difference between the highest and lowest values reached 232.86 gC·m−2·a−1, reflecting the impact of vegetation type on productivity.
Significant differences exist in the factors influencing NPP characteristics across vegetation types: broadleaf forests, as the most productive vegetation type, derive their advantage from tall canopy structures and deep root systems, enabling efficient utilization of light and soil nutrients. Their longer growth cycles result in NPP 12.57% higher than the regional average. Cultivated vegetation, significantly influenced by human management interventions, optimizes growth conditions through irrigation and fertilization. Its photosynthetic period exceeds that of natural herbaceous vegetation, yielding productivity second only to broadleaf forests, 6.49% higher than the regional average. Meadows predominantly occur in mid-to-high mountain zones with abundant summer precipitation and no pronounced dry season. Characterized by high vegetation coverage, their productivity is moderate, 0.54% lower than the regional average. Coniferous forests, dominated by Pinus tabulaeformis and Pinus armandii, are evergreen year-round but exhibit lower canopy closure than broadleaf forests. With higher soil nutrient requirements, their productivity is 17.70% lower than that of broadleaf forests. Shrublands are predominantly found in low-mountain and hilly areas. Constrained by soil depth and moisture conditions, plant height is relatively low, biomass accumulation rates are slow, and productivity is 11.29% lower than the regional average. Grasslands are mainly distributed in river valley plains and bare land margins, exhibiting low vegetation cover and plant height. They are also highly susceptible to human disturbance, with productivity 16.01% lower than the regional average.
3.3.2. Seasonal Dynamics of Vegetation Types
The seasonal rhythms of NPP across six core vegetation types all exhibit a “single-peak” distribution, with peaks concentrated in July, though their dynamic characteristics show marked differences (Figure 7). Broadleaf forests display the typical deciduous vegetation pattern of “spring increase, summer peak, autumn decline, and winter low,” exhibiting the largest seasonal fluctuation amplitude (summer–winter difference of 129.21 gC·m−2·month−1): spring leaf emergence propels NPP from 32.55 gC·m−2·month−1 to 120.49 gC·m−2·month−1, representing a 269.90% increase; summer crown closure reaches optimal levels, peaking NPP at 149.80 gC·m−2·month−1; autumn leaf senescence and shedding cause NPP to decline sharply; and winter maintains minimal photosynthetic activity through branch bark alone, yielding the highest winter NPP among all vegetation types (20.36–22.28 gC·m−2·month−1).
Figure 7.
Seasonal dynamics of multi-year average NPP in different vegetation types in the Shaanxi section of the Qinling Mountains.
Coniferous forests exhibit the evergreen vegetation characteristic of “high in summer, stable in winter,” showing the smallest seasonal fluctuation (summer–winter difference: 105.84 gC·m−2·month−1): spring new leaf emergence drives NPP from 28.45 gC·m−2·month−1 to 98.69 gC·m−2·month−1, a 246.89% increase; summer photosynthetic efficiency peaks at 124.75 gC·m−2·month−1, the highest annual value; autumn leaf shedding reduces the photosynthetic area; and winter cold inhibits photosynthetic efficiency, yet conifers maintain basal photosynthetic rates, yielding winter NPP second only to broadleaf forests (18.62–18.91 gC·m−2·month−1).
Cultivated vegetation exhibits the agricultural production pattern of “spring rise, summer peak, autumn decline, winter low”: spring crop regreening and sowing drive NPP from 37.84 gC·m−2·month−1 to 109.81 gC·m−2·month−1, a 190.20% increase; NPP peaks at 137.49 gC·m−2·month−1 during summer crop grain filling; post-harvest autumn crops cause a sharp decline; and winter crops enter dormancy, sustaining only basal respiration with negligible biomass accumulation (14.84–18.97 gC·m−2·month−1).
Seasonal dynamics across shrublands, grasslands, and meadows exhibited a consistent “high summer, low winter” pattern, though amplitude varied. Shrubland fluctuations fell between broadleaf and coniferous forests: spring shoot budding and leaf expansion drove NPP growth of 249.66%; summer NPP peaked at 118.93 gC·m−2·month−1; and winter saw deciduous shrubs entering dormancy and evergreen shrubs experiencing reduced photosynthetic rates, causing NPP to decline to 13.19–15.32 gC·m−2·month−1. Overall productivity and seasonal fluctuations in grasslands were relatively low: spring saw slow herbaceous regreening, with NPP increasing by 218.69%; summer NPP peaked at 110.05 gC·m−2·month−1; autumn saw biomass accumulation cease after herbaceous plants withered; and winter featured only residual root respiration (12.91–15.45 gC·m−2·month−1). Meadows exhibited pronounced mountain climate influences, showing a pattern of “high in summer, stable in autumn, low in winter, and low in spring”: spring growth rates were slow due to lower temperatures at high elevations; summer offered optimal water–heat conditions, with NPP peaking at 131.57 gC·m−2·month−1; autumn saw a gradual temperature decline while vegetation maintains high photosynthetic activity; and winter brought snow cover to some areas, inducing vegetation dormancy (16.14–19.62 gC·m−2·month−1).
3.3.3. Interannual Variation in NPP Across Vegetation Types
From 2000 to 2023, NPP exhibited an upward trend across all six vegetation types (p < 0.05), though the magnitude and rate of increase varied (Figure 8). Meadows exhibited the steepest growth slope, with an average annual growth rate of 0.78%. Their NPP increased from 716.70 gC·m−2·a−1 in 2000 to 855.68 gC·m−2·a−1 in 2023, representing a 19.39% increase. Broadleaf forests exhibited the lowest growth slope, with an average annual growth rate of 0.63%. Their NPP increased from 837.34 gC·m−2·a−1 in 2000 to 965.55 gC·m−2·a−1 in 2023, representing a 15.31% increase. The remaining vegetation types showed increases in descending order: cultivated vegetation (18.54%, average annual growth rate 0.75%), grasslands (18.32%, average annual growth rate 0.74%), shrublands (16.48%, average annual growth rate 0.67%), and coniferous forests (15.61%, average annual growth rate 0.64%).
Figure 8.
Interannual evolution trend of NPP in different vegetation types of Shaanxi Qinling.
From the perspective of the ecological significance of numerical differences, meadows, cultivated vegetation, and grasslands form a group with relatively fast growth rates, with their average annual growth rates generally exceeding 0.74%, significantly higher than those of natural forests and shrub communities. This differentiation profoundly reflects the heterogeneity in the responses of different vegetation types to regional environmental changes. Meadows, mostly distributed in high-altitude areas, are in a relatively active successional stage and exhibit a more sensitive response to climate warming and ecological conservation projects, thus demonstrating the strongest growth potential. The rapid growth of cultivated vegetation is primarily driven by advances in agricultural technology and refined management, where positive human interventions have greatly unlocked its production potential. In contrast, natural forest ecosystems such as broad-leaved and coniferous forests have reached a mature or over-mature stage, with net primary productivity (NPP) at a relatively stable level and limited room for growth, resulting in a more gradual growth trend.
From the perspective of growth drivers, the increase in the NPP of natural vegetation (broadleaf forests, coniferous forests, shrublands, meadows, grasslands) was primarily attributed to the implementation of ecological conservation projects. In 2010 and 2020, all natural vegetation NPP synchronously declined due to climate anomalies, indicating that climate fluctuations are a significant disturbance factor affecting interannual NPP variation. Cultivated vegetation NPP growth primarily resulted from agricultural technological advancements, with human management interventions playing a major role. This evolutionary pattern demonstrates that interannual variations in Qinling vegetation NPP stem from the combined effects of ecological conservation policies, climate fluctuations, and human management.
3.4. Future Projections of NPP in the Shaanxi Section of the Qinling Mountains and Multi-Model Multi-Scenario Comparison
To clarify future NPP trends and uncertainties in the Shaanxi section of the Qinling Mountains, this study conducted multidimensional projections using three model types and three CMIP6 emission scenarios. The results indicate that future NPP growth trends are dominated by emission scenarios, with the low-emission scenario (SSP119) most conducive to enhancing regional carbon sink capacity. Multi-model projections exhibit reasonable uncertainty ranges, where the mechanistic model (CASA) yields more conservative predictions due to incorporating climate stress factors, while the statistical model (random forest) predicts relatively faster NPP growth rates based on historical data correlations. Simultaneously, distinct heterogeneity exists in response to emission scenarios across vegetation types and spatial scales (county/municipal level and north/south slopes). broadleaf forests exhibit the highest sensitivity to scenario changes, while grasslands and meadows demonstrate greater stability.
3.4.1. Analysis of Prediction Rationality and Uncertainty
Model validation confirms the reliability of NPP predictions in this study. Prediction uncertainties primarily stem from three sources: data inputs, model mechanisms, and scenario assumptions. Both model types nevertheless converge on core patterns of vegetation response.
Historical validation results show that the CASA model (R2 = 0.86, RMSE = 31.2 gC·m−2·a−1) and the machine learning model (R2 = 0.84, RMSE = 34.5 gC·m−2·a−1) attained reliable prediction levels (R2 > 0.8). This indicates that both models can effectively capture the spatiotemporal variation patterns of NPP in the Qinling Mountains, providing a reliable foundation for future scenario predictions.
The primary sources of prediction uncertainty include the following three aspects: ① Data input uncertainty: The RMSE of NDVI-extrapolated data during the extreme drought year of 2018 (0.021) exceeded the overall mean (0.0182), and this deviation may lead to biased NPP predictions under future drought scenarios. ② Model mechanism uncertainty: the CASA model does not incorporate CO2 fertilization effects, potentially underestimating NPP under high-emission scenarios. Machine learning models rely on statistical distribution characteristics of historical data, and their predictive reliability may decrease for scenarios exceeding historical climate ranges. ③ Scenario assumption uncertainty: SSP scenarios do not account for land-use changes such as afforestation in the Qinling Mountains. If vegetation coverage in this region increases further in the future, actual NPP may exceed current projections.
3.4.2. Analysis of NPP Prediction Differences Across Scenarios Using the Same Model
Prediction differences under different emission scenarios for the same model primarily reflect the regulatory effect of emission intensity on the hydro-temperature conditions for vegetation growth.
- (1)
- CASA Model Scenario Comparison
On an annual scale: Under SSP119, NPP increases steadily from 924.62 gC·m−2·a−1 to 963.17 gC·m−2·a−1 between 2030 and 2050, with an average of 943.18 gC·m−2·a−1; under the SSP245 scenario, NPP growth is moderate, averaging 847.96 gC·m−2·a−1; and the SSP585 scenario shows an intermediate average NPP of 901.28 gC·m−2·a−1, overall exhibiting a gradient pattern of “SSP119 > SSP585 > SSP245.” The differences between scenarios gradually widen over time, with the NPP gap between SSP119 and SSP245 reaching 103.74 gC·m−2·a−1 by 2050. This gradient indicates that under the low-emission scenario, the warming and moistening of the climate occur more gradually, with fewer extreme weather events and more stable hydro-temperature conditions for vegetation growth, leading to the most pronounced NPP increase. In contrast, the medium-emission scenario exhibits heightened variability in hydro-temperature conditions, limiting sustained improvements in vegetation productivity.
Regarding seasonal and vegetation responses, the SSP119 scenario exhibits the longest growing season at 9 months, with the highest summer peak reaching 148.8 gC·m−2·month−1 in July. The extended growing season implies longer periods for photosynthetic accumulation, enhancing regional carbon sink potential. Broadleaf forests exhibit the highest sensitivity to scenario changes, with an NPP difference of 132.2 gC·m−2·a−1 between SSP119 and SSP245. This is attributed to broadleaf forests’ weaker adaptability to changes in water and heat conditions. In contrast, cultivated vegetation exhibits more stable responses to scenario changes due to the buffering effect of human management practices, with an NPP difference of 127.66 gC·m−2·a−1 between the two scenarios (Figure 9a).
Figure 9.
Dual-model comparison of scenario response sensitivity for vegetation types in the Shaanxi section of the Qinling Mountains (2030–2050). Note: NPP difference = SSP119 scenario NPP mean–SSP245 scenario NPP mean; a larger difference indicates greater sensitivity of the vegetation type to scenario changes. (a) CASA model results. (b) Random forest model results. Vegetation types are sorted by difference within each model from largest to smallest.
- (2)
- Machine Learning Model Scenario Comparison
On an annual scale, NPP overall follows the trend “SSP585 > SSP119 > SSP245.” By 2050, the NPP difference between the SSP119 and SSP245 scenarios is 44.80 gC·m−2·a−1. This result differs from the CASA model, primarily because machine learning models predict based on statistical correlations between historical “NPP–climate factors”: climate data in high-emission scenarios, though exhibiting greater variability, remains within the statistical distribution range of historical data, leading the model to fit more closely to an extension of historical trends. In contrast, the hydro-temperature combination characteristics in medium-emission scenarios deviate significantly from historical patterns, resulting in the most gradual NPP growth trend in these predictions.
Regarding seasonal and vegetation responses: The SSP585 scenario exhibits the longest growing season at 8.6 months, with a July NPP peak averaging 133.96 gC·m−2·month−1. This is facilitated by evenly distributed precipitation, which mitigates seasonal droughts and extends the vegetation’s optimal growth window. Under SSP119, the summer NPP peak reaches 139.1 gC·m−2·month−1, exceeding SSP245’s 128.33 gC·m−2·month−1, reflecting superior summer water–heat matching under low-emission scenarios. In terms of vegetation response characteristics, broadleaf forests exhibit the highest sensitivity to scenario changes, with an NPP difference of 71.43 gC·m−2·a−1 between SSP119 and SSP245. Grasslands demonstrate greater adaptability, showing a difference of only 40.81 gC·m−2·a−1 between the two scenarios. This stems from the higher correlation between broadleaf forests and climate factors in historical data (R2 = 0.78), whereas grasslands exhibit relatively lower correlation (R2 = 0.65). The model responds more sensitively to scenario changes for vegetation types highly correlated with climate factors (Figure 9b).
3.4.3. Comparative Analysis of NPP Projections Across Models and Scenarios
Prediction discrepancies among models stem from differing core mechanisms and assumptions, forming a reasonable uncertainty range for future NPP changes. The prediction curves of the three models clearly reveal logical distinctions: the MK method, which does not incorporate climate variability and relies solely on extrapolating historical trends, exhibits the flattest predicted trajectory. The CASA model, considering climate stressors such as low temperature, high temperature, and moisture, yields more conservative predictions. The random forest model, simulating based on statistical correlations from historical data without explicitly incorporating vegetation physiological thresholds, predicts a relatively faster NPP growth rate (Figure 10).
Figure 10.
Comparison of multi-model & multi-scenario annual NPP prediction trends in the Shaanxi section of the Qinling Mountains.
- (1)
- Comparison between No-Scenario and Scenario Models
In terms of total deviation, the CASA model exhibits the smallest deviation from the MK method under the SSP119 scenario at just −0.61%. This indicates that the relatively stable climate conditions under low-emission scenarios align most closely with historical trends, and the CASA model effectively captures this characteristic. The machine learning model exhibited the smallest deviation under the SSP585 scenario at −5.6%, with its statistical fit more closely aligning with the extrapolated historical trend. Across all emission scenarios, the scenario model’s predictions were lower than those of the MK method. This discrepancy arises because the scenario model incorporates the inhibitory effect of future climate variability on vegetation growth, whereas the MK method omits this factor, leading to more optimistic projections.
Regarding growth rates, the MK method’s growth slope (5.12 gC·m−2·a−1) is significantly higher than that of the scenario model. The CASA model exhibits a gradient pattern of growth slopes across scenarios: “SSP119 > SSP585 > SSP245.” This reflects that fluctuations in hydrological conditions under the medium-emission scenario impose the most pronounced constraints on vegetation growth. This characteristic suggests that projections based solely on extrapolating historical trends may overestimate future NPP growth potential, whereas methods incorporating climate scenarios better align with actual conditions.
- (2)
- Comparison Among Scenario Models
Regarding total NPP correlations, Pearson correlation coefficients between CASA model and machine learning model predictions under SSP119, SSP245, and SSP585 scenarios were 0.92, 0.90, and 0.88, respectively, showing a slight decrease with increasing emission intensity. This indicates that under extreme emission scenarios, differences in model mechanisms amplify their impact on prediction outcomes, thereby increasing prediction uncertainty.
Monthly peak differences are visually represented in Figure 11: Both models predict monthly NPP peaks occurring between June and July, though the CASA model yields relatively higher peak values. For instance, under the SSP245 scenario, the CASA model’s NPP peak in June 2030 was 139.79 gC·m−2·month−1, while the machine learning model’s peak for the same period was 138.62 gC·m−2·month−1. The difference in NPP during the non-growing season (November–March) was even greater, averaging 4.5 gC·m−2·month−1 higher. This discrepancy stems from the CASA model’s more comprehensive consideration of vegetation’s reduced photosynthetic activity during winter, a physiological mechanism not incorporated into the machine learning model.
Figure 11.
Monthly NPP seasonal dynamics comparison of multiple models and multiple scenarios in Shaanxi Qinling.
Regarding vegetation prediction biases, grasslands and shrublands exhibited the highest consistency across both model types, with an average deviation of approximately 31 gC·m−2·a−1. Coniferous forests showed the largest prediction bias, reaching 111.2 gC·m−2·a−1. The core reason lies in the fact that the vegetation physiological parameters (such as maximum light use efficiency) in the CASA model are fixed values set based on vegetation types, while the vegetation-related parameters in the machine learning model are statistical values obtained through historical data fitting. The differences between these two types of parameters are more pronounced in the growth simulation of woody vegetation such as coniferous forests.
3.4.4. Comparative Analysis of Predictions Between Municipal/County and North/South Slope Zones
To clarify regional variations in future carbon sink changes, this section conducts spatiotemporal comparisons between CASA model-predicted NPP data for 2030–2050 and historical NPP data from 2000 to 2023. It focuses on analyzing growth patterns at the city/county scale and the differential evolution characteristics between the north and south slopes. Regional-scale prediction discrepancies fundamentally reflect scenario response heterogeneity driven by the combined effects of topography, vegetation types, and human activities. The low-emission scenario exhibits the highest alignment with historical evolution trends.
- (1)
- City/County-Scale Characteristics
Under the SSP119 scenario, areas with historically high NPP values (e.g., Ningshan County, Weibin District) exhibit the most pronounced increases (average 15.2% by 2050), consistent with the historical pattern of “steady enhancement of carbon sinks in central mountainous regions”. This indicates that climate conditions under low-emission scenarios better align with optimal vegetation growth environments. Maintaining this emission pathway would help sustain enhanced carbon sink functions in the Qinling Mountains’ mid-to-high elevations, supporting coordinated regional ecological conservation and “dual carbon” goals.
Under the SSP245 scenario, the growth rate of regional NPP slows down, with some high-value counties (Taibai County, Mian County) even experiencing negative growth (−2.5% to −1.2%), and the gap between high-value and low-value areas gradually narrows. This characteristic reflects that under moderate-emission intensity, the buffering effect of human management on vegetation productivity and the mitigating effect of climate fluctuations offset each other. This scenario represents a “transitional scenario” for NPP evolution in the Qinling Mountains. This suggests that under this scenario, ecological conservation and restoration measures need to be further strengthened to prevent the degradation of carbon sink functions in high-value areas.
Under the SSP585 scenario, NPP growth stagnates after 2040 in some high-value counties and districts (Ningshan County, Weibin District), deviating from historical trends. This phenomenon stems from the suppression of photosynthetic efficiency in broadleaf and coniferous forests caused by extreme summer heat and uneven precipitation. This result indicates that if the future climate deviates from the historically suitable range, the historically formed “carbon sink stable zones” in the Qinling Mountains may face the risk of functional degradation, necessitating targeted strategies to address extreme climate conditions.
- (2)
- North–South Slope Differences
Under the SSP119 scenario, the NPP disparity between northern and southern slopes slightly widened: high-value counties on the northern slope (Weibin District, Liuba County) showed increases of 15.1–15.5%, exceeding those on the southern slope (14.5–14.9%). The enhancement in photosynthetic efficiency was more pronounced in mid-to-high altitude coniferous forests on the northern slope. This widening disparity reinforces the historical spatial pattern of the Qinling Mountains—“higher in the west and lower in the east on the northern slope, higher in the south and lower in the north on the southern slope”—indicating that low-emission scenarios favor maintaining regional ecosystem stability.
Under the SSP245 scenario, the NPP disparity between northern and southern slopes remained at historical levels (mean difference: 11.27 gC·m−2·a−1): growth rates stagnated in high-value counties on the northern slope (−3.6% to −3.9%), while southern slope counties recorded declines of −5.4% to −9.0%. In the medium-emission scenario, hydro-temperature fluctuations suppressed vegetation growth. However, the dual buffering effects of topography and human management on the northern slope prevented significant changes in the north–south gradient, reflecting the characteristics of a “transitional scenario.”
Under SSP585, the NPP gap between slopes narrowed (mean difference 8.93 gC·m−2·a−1): southern slopes’ natural vegetation suffered more severe impacts from extreme climate events, while cultivated vegetation in northern river valleys experienced relatively lesser effects due to human management buffering. while high-value areas on the northern slope benefit from dual buffering by topographic shelter and human intervention, partially mitigating extreme climate impacts and narrowing the growth gap between slopes. This shift diverges from the historical trend of “slight northern slope dominance,” suggesting that high-emission scenarios may alter the ecological patterns across the Qinling Mountains.
A prior quantitative study [24] quantifies contributions to this slope difference: climate (45–55%), topography (25–35%), and human activities (10–20%). Our qualitative analysis aligns with these results, confirming climate and topography as the core natural drivers, with human activities further amplifying the divergence.
4. Discussion
This study integrates trend extrapolation, mechanism simulation (CASA), and machine learning (random forest) to analyze the historical (2000–2023) and future (2030–2050) dynamics of vegetation net primary productivity (NPP) in the Shaanxi section of the Qinling Mountains. By comparing multiple models and various emission scenarios (SSP119, SSP245, SSP585), we assess the evolution of regional carbon sinks and their associated uncertainties. Our results are consistent with global models and also reveal regional characteristics relevant to local ecological management.
4.1. Comparison of Historical NPP Trends in a Broader Context
Our results show that NPP exhibited an upward trend from 2000 to 2023, with a cumulative increase of 16.73%. This trend aligns with observations in China and the Northern Hemisphere, where greening has been attributed to the combined effects of climate change and ecological restoration projects.
Global and national context: The annual growth rate of 0.68% in the Qinling Mountains falls within the range reported for mid-latitude terrestrial ecosystems worldwide, where NPP generally increases due to extended growing seasons and enhanced photosynthesis. At the national level, similar patterns have emerged in other key ecological zones, such as the Loess Plateau and the Qinba Mountains. The three-stage pattern identified in this study—rapid growth, stable fluctuation, slow growth—is similar to the national trend reported by Shi et al. (2022), who found that China’s NPP growth slowed after 2010, partly because vegetation in some regions gradually approached environmental carrying capacity [9].
Regional validation: The multiyear mean NPP simulated by our improved CASA model is 813.71 gC·m−2·a−1, higher than the MOD17A3 product (602.20 gC·m−2·a−1), but within the range of existing estimates (602.2–1019 gC·m−2·a−1). It is relatively close to the value of 878.44 gC·m−2·a−1 reported by Fan et al. (2024) using a similar CASA framework [54]. Differences from MODIS products are common in topographically complex regions. As noted by Li et al. (2024), the coarse resolution and algorithmic assumptions of MODIS may underestimate productivity in heterogeneous areas like the Qinling Mountains, where microclimates and diverse vegetation structures exist [19]. This supports the necessity of regional model parameterization.
4.2. Spatial Heterogeneity: Roles of Topography and Vegetation Type
The spatial pattern of “high in the south and west, low in the north and east” is shaped by regional topography and climate. Broadleaved forests show higher productivity than coniferous forests or grasslands, consistent with the understanding that these ecosystems have higher light-use efficiency and longer growing seasons [51].
Comparison with adjacent regions: The NPP difference between the southern and northern slopes (818.36 vs. 807.52 gC·m−2·a−1) reflects the role of the Qinling Mountains as a geographical and climatic divide. This gradient is more pronounced than in non-barrier regions but similar to findings for the broader Qinba Mountains by Zhao et al. (2021), who highlighted that altitudinal zonation influences NPP spatial heterogeneity in the transition zone [34]. Productivity in middle-to-high elevation areas (e.g., Ningshan County) is consistent with observations in other mountain ecosystems worldwide, where human disturbance is low and moisture conditions are favorable [22,23]. The lower NPP in the eastern Weihe Valley is typical of areas affected by urbanization and agriculture, a pattern documented in the Guanzhong Plain [7,42].
4.3. Multi-Scenario Projections and Model Uncertainties
Future projections indicate that NPP will continue to increase, but the results vary with emission scenarios and models, introducing uncertainty. This uncertainty reflects broader challenges in climate simulation highlighted by the CMIP6 framework.
Influence of emission pathways: The low-emission pathway (SSP119) favors NPP enhancement and extended growing seasons, consistent with global-scale projections [4]. The more conservative estimates from the CASA model under the high-emission scenario (SSP585) reflect its explicit parameterization of temperature and water stress. This agrees with studies suggesting that photosynthetic efficiency may decline once temperatures exceed optimal thresholds [40]. Predictions from the random forest model under SSP585 rely on historical correlations and may not fully capture nonlinear thresholds and extreme climate events absent from training data. This limitation of machine learning methods in ecological forecasting has been noted [21,50].
Responses of specific vegetation types: Broadleaved forests show sensitivity to scenario changes, a pattern also reported for temperate forests in North America and Europe, where deciduous species respond to both warming and water availability [30]. Grasslands and meadows exhibit relatively stable responses across scenarios, consistent with studies in arid and semiarid regions, showing that grassland productivity is often limited more by precipitation than by temperature [5,17]. Cultivated vegetation shows an intermediate response, implying the buffering effect of human management (irrigation, fertilization), as observed in agroecosystems of the North China Plain [47].
The results of this study have direct practical implications for ecological protection and carbon sink management in the Shaanxi section of the Qinling Mountains. In line with the Regulations on Ecological and Environmental Protection of the Qinling Mountains and the regional “One Core, Four Zones” ecological plan, we propose the following recommendations. For high NPP areas (middle-to-high mountain zones such as Ningshan County and Weibin District), inclusion in the core protection area of Qinling National Park is suggested. Relying on existing Grain for Green and grassland restoration projects, priority should be given to protecting high-efficiency carbon sink vegetation such as broadleaved forests, strictly controlling human activities (e.g., restricting unregulated tourism development and prohibiting illegal logging), and maintaining carbon sink stability. For low NPP areas (Weihe Valley regions such as Huayin City and Linwei District), the territorial spatial layout should be optimized. Ecological planting techniques such as straw returning and precision irrigation should be promoted in agricultural production to improve carbon sink efficiency of cultivated vegetation, while urban development boundaries should be strictly delineated to avoid encroaching on natural vegetation growth space. Based on the divergent responses of vegetation types, regional vegetation configuration can be optimized: broadleaved forests, with high carbon sink potential but climate sensitivity, can be prioritized under low-emission scenarios (SSP119); grasses and meadows, with strong stability, can serve as ecological buffer vegetation under high-emission scenarios (SSP585). Mixed forests with coniferous species can be constructed to enhance the resilience of regional carbon sinks.
5. Conclusions
This study takes the Shaanxi section of the Qinling Mountains as the study area. Based on an improved CASA model, we accurately retrieved the spatiotemporal patterns of vegetation NPP from 2000 to 2023. Coupled with MK trend analysis, random forest model, and other methods, we projected NPP from 2030 to 2050 under multiple scenarios; systematically revealed the evolution rules, driving mechanisms, and future trends of regional vegetation productivity; and provided scientific support for the coordinated promotion of ecological protection and the “dual carbon” goals in the Qinling Mountains. The main conclusions are as follows:
(1) NPP showed a three-stage fluctuating upward trend during 2000–2023. Temporally, the cumulative increase reached 16.73%, with an average annual growth rate of 0.68%. The seasonal dynamics presented a stable pattern of summer > spring > autumn > winter, and summer NPP accounted for 45.81% of the annual total, representing the core period for carbon sink accumulation. Spatially, NPP was distributed as high in the south and west and low in the north and east. High-value areas were concentrated in mountainous regions with dense vegetation, while low-value areas were located in the Weihe Valley and other regions with intense human activities. Topographic conditions and human activity intensity were the main factors causing spatial heterogeneity.
(2) Obvious differences existed in NPP characteristics and response rules among different vegetation types. Broadleaved forests had the highest productivity (917.16 gC·m−2·a−1) and grasslands had the lowest (684.30 gC·m−2·a−1). Physiological characteristics and growth environments jointly determined the basic pattern of carbon sink capacity. In terms of seasonal fluctuation, broadleaved forests showed the largest fluctuation due to deciduous characteristics, and coniferous forests showed the smallest fluctuation due to evergreen properties. This difference provides an ecological basis for formulating targeted vegetation management strategies.
(3) Future NPP changes were dually regulated by emission scenarios and model mechanisms. At the scenario level, the low-emission scenario (SSP119) provided stable hydrothermal conditions, which were most conducive to the improvement of regional carbon sinks; the medium-emission scenario (SSP245) aggravated hydrothermal fluctuations, and NPP growth tended to be gentle; and the high-emission scenario (SSP585) potentially altered the ecological pattern between the northern and southern slopes. At the model comparison level, the historical trend extrapolation method predicted the gentlest trend; the CASA model, incorporating climatic stress factors, yielded more conservative projections; and the random forest model, based on statistical correlations, predicted a relatively faster growth rate. The uncertainty interval constructed by multiple models provides a comprehensive reference for decision-making.
(4) The evolution of regional NPP resulted from the synergistic effects of policies, climate, and human activities. The rapid NPP growth during 2000–2007 benefited from the implementation of the Grain for Green Project. The fluctuations during 2008–2016 were significantly affected by climate anomalies, and the productivity improvement of cultivated vegetation reflected the driving role of advances in agricultural technology. Existing studies [24] on quantitative attribution in the Qinling Mountains and surrounding areas showed that ecological restoration policies such as Grain for Green contributed 30–40% to regional NPP improvement, climate fluctuations contributed about 25–35%, and human activities such as agricultural technology advancement contributed 15–25% [24]. The qualitative analysis of this study is highly consistent with these quantitative conclusions, indicating that ecological policies were the core driving force for the rapid NPP growth from 2000 to 2007, while climate anomalies dominated the fluctuations from 2008 to 2016. Under the future low-emission pathway, the carbon sink function in the middle and high mountain areas of the Qinling Mountains will continue to strengthen, providing a clear direction for regional ecological protection and carbon sink management.
Although this study systematically revealed the evolution rules and future trends of NPP in the Shaanxi section of the Qinling Mountains, several limitations remain. First, the CASA model did not incorporate the CO2 fertilization effect, and the promotion of elevated atmospheric CO2 concentration on vegetation photosynthesis was not fully considered. According to studies in the subtropical–warm temperate transition zone of the Qinling Mountains and surrounding areas, the CO2 fertilization effect contributes about 5–8% to the improvement of regional vegetation NPP [57], among which woody vegetation such as broadleaved and coniferous forests shows a more significant response (contribution rate 6–9%), while herbaceous vegetation such as grasses and meadows shows a relatively weak response (contribution rate 3–5%). In this study, the mean NPP under SSP585 from 2030 to 2050 is 901.28 gC·m−2·a−1. Based on this estimation, the projected NPP under this scenario may be underestimated by 45.06–72.10 gC·m−2·a−1. Although this underestimation does not change the NPP gradient characteristics among emission scenarios or the response patterns of different vegetation types, it may still lead to an underestimation of carbon sink potential under high-emission scenarios. Second, the future projection assumes a static vegetation distribution and does not fully consider the impacts of land-use changes such as ecological restoration and urban construction, which may cause biases in the predicted spatial distribution of NPP. Third, the study did not systematically quantify the long-term impacts of extreme climate events (e.g., extreme drought and high temperature) on NPP, whereas the increasing frequency and intensity of extreme climates under global warming have become important factors affecting the stability of regional carbon sinks. Fourth, the analysis of NPP driving factors remains relatively macroscopic, and the contribution rates of climate change and human activities have not been clearly distinguished through quantitative methods such as the Geodetector.
In response to the above limitations, future research can be deepened in the following directions. First, integrate the CO2 fertilization effect into the CASA model, couple dynamic parameters of CO2 concentration, and optimize model settings to improve projection accuracy under high-emission scenarios. Second, couple land-use models (e.g., the PLUS model) with ecosystem models to simulate the spatiotemporal evolution of NPP under the combined effects of climate change and land-use change. Third, strengthen research on the impacts of extreme climate events, quantify their disaster-forming mechanisms, and formulate targeted countermeasures. Fourth, the current analysis of NPP driving forces is relatively macroscopic, and the contribution rates of climate change, ecological policies, and human activities have not been clearly distinguished via quantitative attribution methods such as Geodetector and residual trend analysis. In the future, these methods can be introduced, combined with longer time-series socioeconomic data, to systematically quantify the contribution of each driving factor and further deepen the understanding of driving mechanisms. Based on the above conclusions, combined with the functional positioning of each district and county in the study area and existing ecological protection projects, the following targeted practical measures are proposed: ① Under the low-emission scenario (SSP119), high NPP districts and counties such as Ningshan and Taibai can rely on forestry carbon sink trading pilots to transform carbon sink increments into ecological and economic values and further strengthen the carbon sink function of middle and high mountain zones. ② Under the medium-emission scenario (SSP245), for transitional districts and counties such as Lueyang and Hantai, ecological restoration projects (e.g., artificial vegetation restoration, soil and water conservation) should be continuously promoted to offset the inhibitory effect of hydrothermal fluctuations on NPP and avoid carbon sink degradation in high-value areas. ③ Under the high-emission scenario (SSP585), high-value districts and counties on the northern slope, such as Weibin and Liuba, should establish early warning mechanisms for extremely high temperatures and drought and introduce drought-tolerant native species such as Pinus tabuliformis and Hippophae rhamnoides in urban forestry and mountain vegetation restoration to improve the climate adaptability of ecosystems. ④ The Ankang and Hanzhong areas on the southern slope should cooperate with the Baoji and Xi’an areas on the northern slope to establish an ecological joint prevention and control mechanism across the northern and southern slopes of the Qinling Mountains, coordinately promote the construction of water conservation forests and ecological protection in valley zones, and jointly enhance the carbon sink capacity of the whole region. In addition, future research can be extended to the entire Qinling Mountains. Through cross-regional comparisons, the overall NPP evolution rules of the Qinling Mountains can be further revealed, providing more operable theoretical support for the protection of the Qinling ecological barrier, the implementation of regional “dual carbon” goals, and the coordination of provincial ecological governance.
Author Contributions
Conceptualization, L.Z.; methodology, L.Z. and X.L.; software, L.Z.; validation, X.L. and G.Z.; formal analysis, L.Z.; writing—original draft preparation, L.Z.; writing—review and editing, X.L., G.Z. and Z.L.; supervision, Z.L. All authors have read and agreed to the published version of the manuscript.
Funding
This research received no external funding.
Institutional Review Board Statement
Not applicable.
Informed Consent Statement
Not applicable.
Data Availability Statement
The original contributions presented in this study are included in the article. Further inquiries can be directed to the corresponding author.
Conflicts of Interest
The authors declare no conflicts of interest.
References
- Li, D.K.; Wang, Z. Quantitative analysis of climate change and human activities on vegetation NPP in Shaanxi Province. Ecol. Environ. Sci. 2022, 31, 1071–1079. [Google Scholar] [CrossRef]
- Xu, X.; Luo, Y.; Yang, S.T.; Lu, X.H.; Zhou, Q.W.; Liu, M.; Shi, C.M.; Liao, M.Y. Variation trends and sustainability of terrestrial vegetation net primary productivity in different climate zones worldwide. Acta Ecol. Sin. 2023, 43, 3729–3743. [Google Scholar]
- Xu, Y.; Lu, Y.G.; Zou, B.; Xu, M.; Feng, Y.X. Unraveling the enigma of NPP variation in Chinese vegetation ecosystems: The interplay of climate change and land-use change. Sci. Total Environ. 2023, 912, 169023. [Google Scholar] [CrossRef] [Scilit]
- Kang, Y.; Wang, Z.; Xu, B.N.; Shen, W.J.; Chen, Y.; Zhou, X.H.; Liu, Y.G.; Zhang, T.B.; Wang, G.Y.; Jia, Y.L.; et al. Disentangling the response of vegetation dynamics to natural and anthropogenic drivers over the Minjiang River Basin using dimensionality reduction and a structural equation model. Forests 2024, 15, 1438. [Google Scholar] [CrossRef] [Scilit]
- Yu, R. An improved estimation of net primary productivity of grassland in the Qinghai-Tibet region using light use efficiency with vegetation photosynthesis model. Ecol. Model. 2020, 431, 109121. [Google Scholar] [CrossRef] [Scilit]
- Wang, Z.; Li, D.K. Spatiotemporal distribution characteristics and driving factors of vegetation net primary productivity in Shaanxi from 2000 to 2015. Chin. J. Appl. Ecol. 2018, 29, 1876–1884. [Google Scholar] [CrossRef]
- Wang, X.Z.; Hu, H.T.; Wu, J.Z.; Wang, C.Y.; Lü, F.N. Spatiotemporal variation and potential of terrestrial ecosystem NPP in Shaanxi Province from 2000 to 2020. J. Soil Water Conserv. 2024, 38, 325–334. [Google Scholar] [CrossRef]
- Xu, M.Z. Spatiotemporal Simulation of NPP and NEP in Forest Ecosystems of the Qinling Mountains Based on the C-FIX Model. Master’s Thesis, Northwest University, Xi’an, China, 2016. [Google Scholar]
- Shi, Z.Y.; Wang, Y.T.; Zhao, Q.; Zhang, L.P.; Zhu, C.M. Spatiotemporal variation and driving mechanism of vegetation net primary productivity in China from 2001 to 2020. Ecol. Environ. Sci. 2022, 31, 2111–2123. [Google Scholar] [CrossRef]
- Du, Z.Q.; Liu, X.J.; Wu, Z.T.; Zhang, H.; Zhao, J. Responses of forest net primary productivity to climatic factors in China during 1982–2015. Plants 2022, 11, 2932. [Google Scholar] [CrossRef] [Scilit] [PubMed]
- Feng, X.F.; Sun, Q.L.; Lin, B. Process models of NPP at regional and global scales and responses of NPP to global change. Ecol. Environ. Sci. 2014, 23, 496–503. [Google Scholar] [CrossRef]
- Wei, X.D.; Yang, J.; Luo, P.P.; Lin, L.G.; Lin, K.L.; Guan, J.M. Assessment of the variation and influencing factors of vegetation NPP and carbon sink capacity under different natural conditions. Ecol. Indic. 2022, 138, 108834. [Google Scholar] [CrossRef] [Scilit]
- Zhang, D.Y.; Feng, Z.K.; Li, Y.Q.; Zhang, L.J.; Dong, B. Remote sensing estimation of forest vegetation net primary productivity in Heilongjiang Province based on the C-FIX model. Sci. Silvae Sin. 2011, 47, 13–19. [Google Scholar]
- Ling, S.Y.; Gao, Z.Y.; Ma, C.; You, H.Z. Estimation of vegetation net primary productivity and vegetation carbon sink in Tianjin based on the CASA model. Tianjin Agric. Sci. 2022, 28, 69–75, 81. [Google Scholar]
- Wang, S.; Zhang, Y.F.; Wei, H.J.; Zhang, H.Y. Changes of NPP and its carbon sequestration and oxygen release value in the Shaanxi-Gansu-Ningxia region under the background of ecological restoration. J. Desert Res. 2015, 35, 1421–1428. [Google Scholar]
- Cheng, S.T. Prediction of Land-Use and Its Impact on Habitat Quality in Ankang City in the 21st Century. Master’s Thesis, Chang’an University, Xi’an, China, 2023. [Google Scholar] [CrossRef]
- Qu, X.B.; Wu, N.E.; Zhao, Y.C.; Niu, D.; Wang, Y.Y.; Liu, X. Spatiotemporal characteristics analysis and multi-scenario prediction of NPP in Inner Mongolia. Arid Land Geogr. 2026, 1–14. Available online: https://link.cnki.net/urlid/65.1103.X.20260102.0942.001 (accessed on 13 July 2025).
- Waring, R.H.; Running, S.W. Measuring net primary production in forests: Concepts and field methods. Ecol. Appl. 2001, 11, 356–370. [Google Scholar] [CrossRef] [Scilit]
- Li, X.M.; Wu, Z.H.; Wang, Z.S.; Weng, S.H.; Sun, C.F.; Guan, H.; Wang, H. Spatiotemporal distribution of vegetation productivity and drought response analysis in Fujian based on MODIS remote sensing data. Ecol. Environ. Sci. 2024, 33, 841–852. Available online: https://link.oversea.cnki.net/doi/10.16258/j.cnki.1674-5906.2024.06.002 (accessed on 13 July 2025).
- Song, S.S.; Qin, S.J.; Sun, P.C.; Fu, X.T. Estimation and prediction of vegetation carbon sink in the Fenhe River Basin based on multi-source remote sensing data. Ecol. Environ. Sci. 2025, 34, 345–357. [Google Scholar] [CrossRef]
- Fan, C.X.; Li, C.X. Spatiotemporal variation and driving force analysis of grassland NPP in each ecological function area of Qinghai Province. Qinghai Sci. Technol. 2025, 32, 28–38, 100. [Google Scholar]
- Guo, Z.; Shi, Y.; Liu, T.M.; Zhang, Y.X.; Yan, Y.Z. Spatiotemporal pattern and driving factors of NPP in the northern foot of the Qinling Mountains from 2001 to 2020. Ecol. Environ. Sci. 2025, 34, 401–410. [Google Scholar] [CrossRef]
- He, T.; Dai, X.A.; Li, W.Y.; Zhou, J.Y.; Zhang, J.J.; Li, C.; Dai, T.R.; Li, W.L.; Lu, H.; Ye, Y.K.; et al. Response of net primary productivity of vegetation to drought: A case study of Qinba Mountainous area, China (2001–2018). Ecol. Indic. 2023, 149, 110148. [Google Scholar] [CrossRef] [Scilit]
- Gu, B.B.; Xu, G.B.; Wang, Z.A.; Li, Q.; Zhang, Y.; Chen, A.A. Spatiotemporal differentiation pattern and quantitative analysis of multi-driving forces of vegetation net primary productivity in the Shaanxi section of the Qinling Mountains. Acta Ecol. Sin. 2025, 45, 11105–11116. [Google Scholar] [CrossRef]
- Liu, J.Y. Simulation and Prediction of Net Primary Productivity of Forest Ecosystems in the Qinling Mountains. Master’s Thesis, Northwest University, Xi’an, China, 2019. [Google Scholar]
- Zhang, S.H.; Ding, X.S. Remote sensing estimation of NPP and its spatiotemporal variation characteristics in the Qinling Mountains. Acta Agric. Jiangxi 2017, 29, 124–128. [Google Scholar] [CrossRef]
- Zhao, X.R.; Han, L.; Liu, M.; Song, M.Q. Remote sensing estimation of vegetation NPP in Shaanxi Province based on an improved CASA model. Res. Soil Water Conserv. 2024, 31, 247–256. [Google Scholar] [CrossRef]
- Guo, S.Q. Land-Use Prediction and Ecosystem Service Relationship Research in the Qinling Mountains (Shaanxi Section) Under IPCC Scenarios. Master’s Thesis, Chang’an University, Xi’an, China, 2020. [Google Scholar] [CrossRef]
- Zhang, S.Q.; Xia, F.; Zhou, L.J.; Wang, X.R.; Xie, Y.J. Assessment and scenario prediction of forest vegetation carbon sequestration capacity to offset energy emissions in the Sanjianghui area of Hangzhou. Chin. Landsc. Archit. 2023, 39, 113–119. [Google Scholar] [CrossRef]
- Gang, C.; Zhou, W.; Wang, Z.; Chen, Y.; Li, J.; Chen, J.; Qi, J.; Odeh, I.; Groisman, P.Y. Comparative assessment of grassland NPP dynamics in response to climate change in China, North America, Europe and Australia from 1981 to 2010. J. Agron. Crop Sci. 2015, 201, 57–68. [Google Scholar] [CrossRef] [Scilit]
- Liu, Y.G.; Guo, H.J.; Luo, Z.W.; Yao, C.; Xu, C.; Hou, Y.J.; Bao, J.C. Spatiotemporal variation of vegetation carbon use efficiency and its driving factors in the Qinling Mountains of Shaanxi under climate change. Earth Environ. 2025, 53, 242–252. [Google Scholar] [CrossRef] [Scilit]
- Peng, J.B.; Shen, Y.J.; Jin, Z.; Liu, T.M.; Li, Y.H.; Zhuang, J.Q.; Wang, Z.H.; Yu, C.; Cheng, Y.X.; Ma, P.H.; et al. Key considerations in the study of the ecological geological environment system of the Qinling Mountains. Acta Ecol. Sin. 2023, 43, 4344–4358. [Google Scholar]
- Luo, X.; Wang, L.X.; Zhang, J.; Yang, Y.; Liu, Z. Spatiotemporal variation of ecological environment quality and driving force analysis in the Qinling Mountains. Environ. Sci. 2025, 46, 3720–3729. [Google Scholar] [CrossRef] [Scilit]
- Zhao, F.; Zhang, J.Y.; Liu, S.Y.; Wang, Z.Y.; Wang, L.H.; Gu, H.T.; Li, W.L. Multi-dimensional zonality of NPP and its response to climate change and the warm temperate-subtropical boundary in the Qinba Mountains. Acta Ecol. Sin. 2021, 41, 57–68. [Google Scholar]
- Zhou, N.F.; Gong, E.J.; Bai, T.H.; Zhao, T.; Bai, H.Y.; Wang, J. Spatiotemporal dynamics and influencing factors of NPP in the Qinba Mountains based on the CASA model. Acta Ecol. Sin. 2025, 45, 1829–1843. [Google Scholar] [CrossRef]
- Yuan, B.; Bai, H.Y.; Zhang, J.; Ma, X.P. Vegetation net primary productivity and its response to climate change in the Qinling Mountains. Bull. Bot. Res. 2013, 33, 225–231. [Google Scholar]
- Peng, S.; Ding, Y.; Liu, W.; Li, Z. 1 km monthly temperature and precipitation dataset for China from 1901 to 2017. Earth Syst. Sci. Data 2019, 11, 1931–1946. [Google Scholar] [CrossRef] [Scilit]
- Peng, S. 1 km Monthly Temperature and Precipitation Dataset for China (1901–2023); National Tibetan Plateau/Third Pole Environment Data Center: Beijing, China, 2020. [Google Scholar] [CrossRef]
- Zhu, W.Q.; Pan, Y.Z.; Zhang, J.S. Remote sensing estimation of terrestrial vegetation net primary productivity in China. Chin. J. Plant Ecol. 2007, 31, 413–424. [Google Scholar]
- Zhu, W.Q.; Chen, Y.H.; Xu, D.; Li, J. Research progress on calculation models of terrestrial vegetation net primary productivity. Chin. J. Ecol. 2005, 24, 296–300. [Google Scholar] [CrossRef]
- Piao, S.L.; Fang, J.Y.; Guo, Q.H. Estimation of vegetation net primary productivity in China using the CASA model. Chin. J. Plant Ecol. 2001, 25, 603–608, 644. [Google Scholar]
- Qian, H.; Zhang, C.; Fan, J.M.; Deng, Z.C.; Zhu, X.L.; Li, C.R. Spatiotemporal pattern analysis of vegetation NPP in Yunnan Province based on an improved CASA model. For. Grassl. Resour. Res. 2023, 6, 120–128. [Google Scholar] [CrossRef]
- Heng, R.; Wang, X.J. Prediction of vegetation NPP in the Gurbantunggut Desert based on the CASA model. Water Resour. Hydropower Eng. 2023, 54, 189–201. [Google Scholar] [CrossRef]
- Li, D.K.; Fan, J.Z.; Wang, J. Variation characteristics of vegetation NPP in Shaanxi Province based on MOD17A3. Chin. J. Ecol. 2011, 30, 2776–2782. [Google Scholar] [CrossRef]
- Gao, Y.; Sun, H.; Xu, Y.Y.; Zhang, S.F. Spatiotemporal variation of vegetation cover in Shaanxi Province and its response to extreme climate. Acta Ecol. Sin. 2022, 42, 1022–1033. [Google Scholar]
- Chang, D.E.; Wei, H.X.; Chen, L.Y. Spatiotemporal trends and driving mechanisms of vegetation NPP in Shaanxi Province from 2000 to 2023. Bull. Surv. Mapp. 2025, 11, 91–98. [Google Scholar] [CrossRef]
- Wang, G.J.; Peng, W.F.; Zhang, L.D.; Zhang, J. Quantifying the impacts of natural and human factors on changes in NPP using an optimal parameters-based geographical detector. Ecol. Indic. 2023, 155, 111018. [Google Scholar] [CrossRef] [Scilit]
- Wang, C.; Wang, L.S.; Zhao, W.Z.; Zhang, Y.Y.; Liu, Y.Y. Analysis of spatiotemporal change and driving factors of NPP in Qilian Mountains from 2000 to 2020. Rangel. Ecol. Manag. 2024, 96, 56–66. [Google Scholar] [CrossRef] [Scilit]
- Yang, H.; Li, H.F.; Qin, D.M. Integrated effects of meteorological factors, edaphic moisture, evapotranspiration, and leaf area index on the net primary productivity of winter wheat-summer maize rotation system. Field Crop Res. 2023, 302, 109080. [Google Scholar] [CrossRef] [Scilit]
- Yan, B. Analysis of vegetation dynamics in the Qinling-Daba Mountains region from MODIS time-series data. Ecol. Indic. 2021, 129, 108029. [Google Scholar] [CrossRef] [Scilit]
- He, Y.L.; Lin, C.; Wu, C.Y.; Pu, N.; Zhang, X.H. The urban hierarchy and agglomeration effects influence the response of NPP to climate change and human activities. Glob. Ecol. Conserv. 2024, 51, e02904. [Google Scholar] [CrossRef] [Scilit]
- Liu, H.H.; Chen, Y.; Liu, Y.; Gang, C.C. Spatiotemporal pattern and future evolution trend simulation of grassland net primary productivity on the Loess Plateau based on random forest model. Arid Zone Res. 2023, 40, 123–131. [Google Scholar] [CrossRef]
- Ji, Y.H.; Zhou, G.S.; Wang, S.D.; Wang, L.X.; Zhou, M.Z. Evolution characteristics and driving force analysis of vegetation ecological quality in the Qinling Mountains from 2000 to 2019. Chin. J. Plant Ecol. 2021, 45, 617–625. [Google Scholar] [CrossRef] [Scilit]
- Hou, F.G.; Wang, H.G. Spatial distribution of precipitation in Qinghai Province based on random forest and multi-source remote sensing data. J. Shandong Agric. Univ. (Nat. Sci. Ed.) 2022, 53, 91–97. [Google Scholar]
- Li, D.K.; Wang, Z. Analysis of variation characteristics of terrestrial vegetation NPP in China based on MOD17A3. Ecol. Environ. Sci. 2018, 27, 397–405. [Google Scholar] [CrossRef]
- Fan, X.C. Spatiotemporal evolution of NPP and altitudinal differentiation of natural and anthropogenic drivers in the Qinling Mountains from 2001 to 2020. Ecol. Resour. 2024, 12, 7–9. [Google Scholar]
- Obermeier, W.A.; Lehnert, L.W.; Kammann, C.I.; Müller, C.; Grünhage, L.; Luterbacher, J.; Erbs, M.; Moser, G.; Seibert, R.; Yuan, N.; et al. Reduced CO2 fertilization effect in temperate C3 grasslands under more extreme weather conditions. Nat. Clim. Change 2017, 7, 137–141. [Google Scholar] [CrossRef] [Scilit]
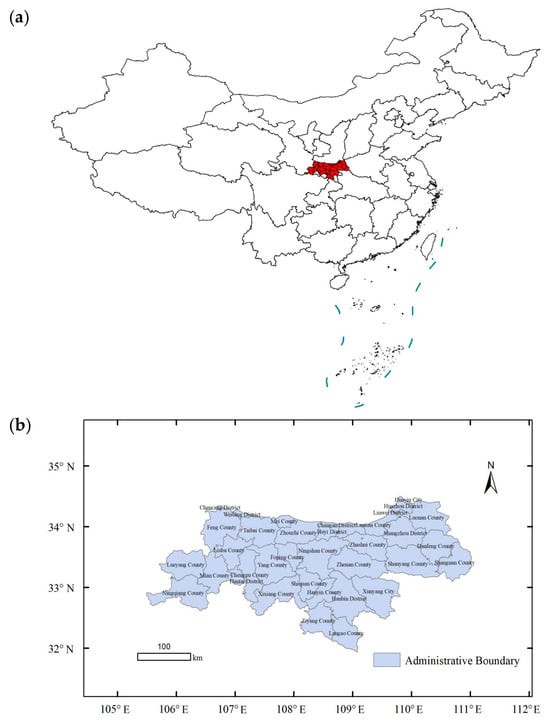
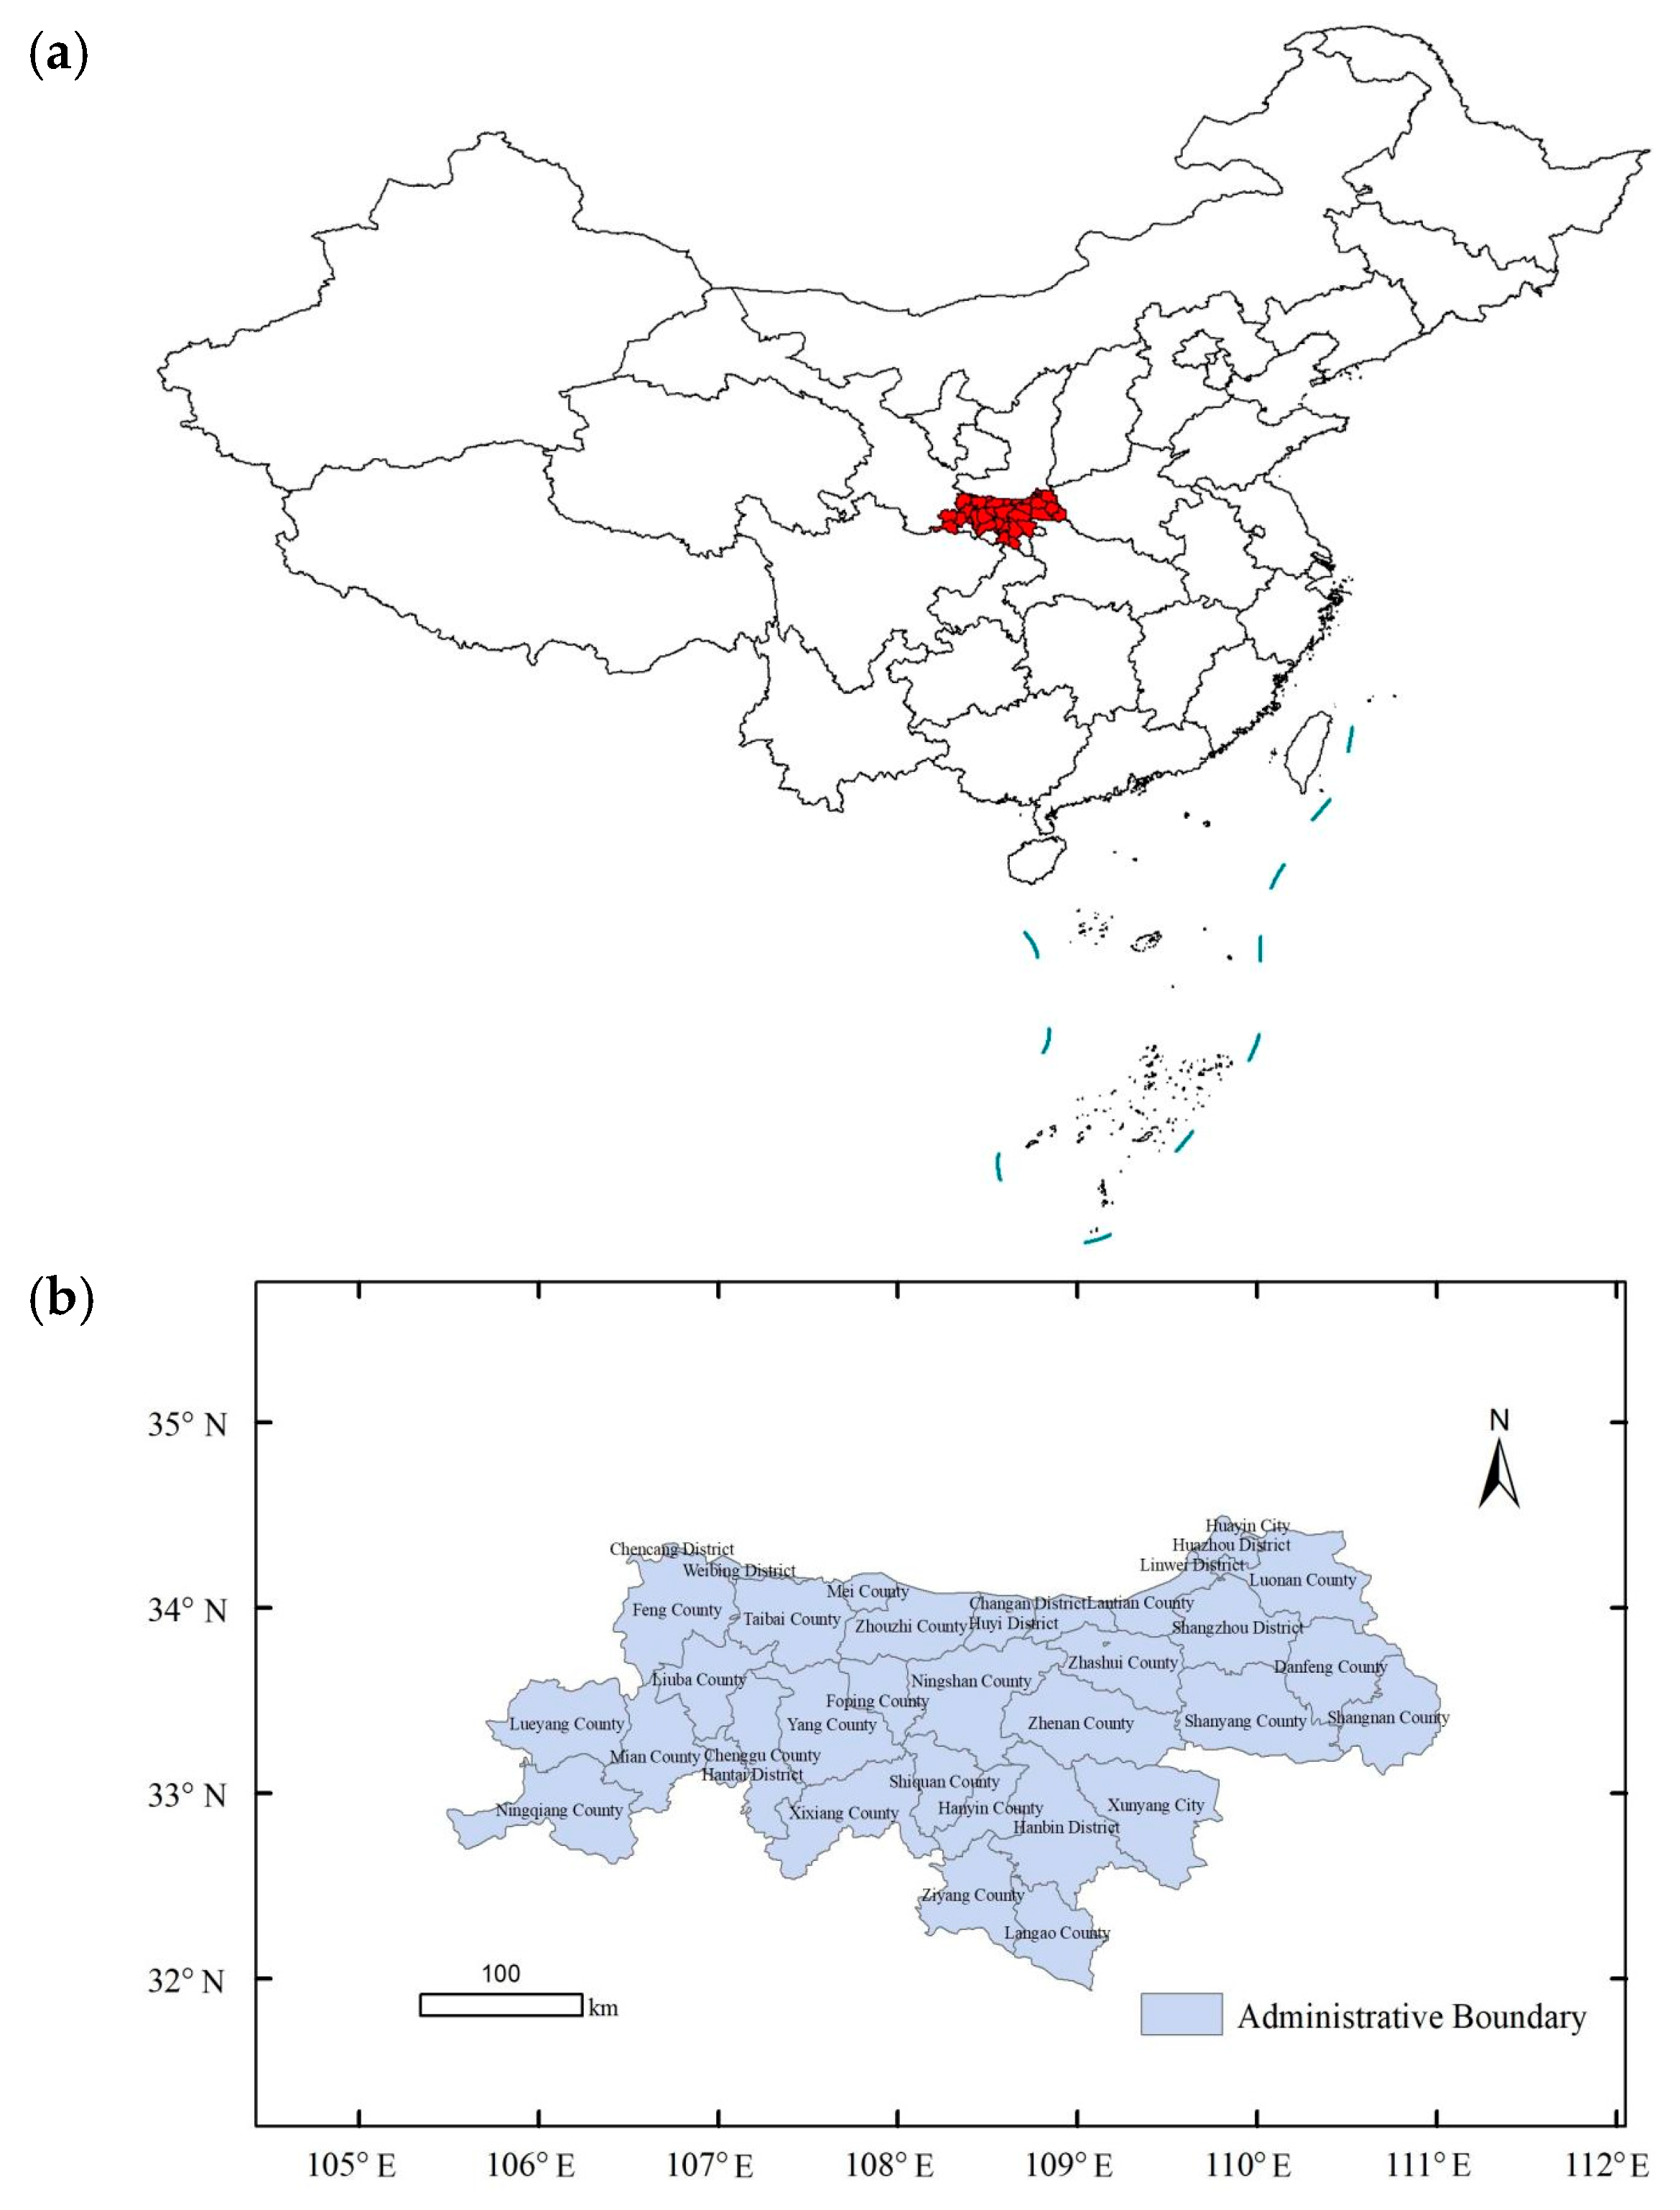
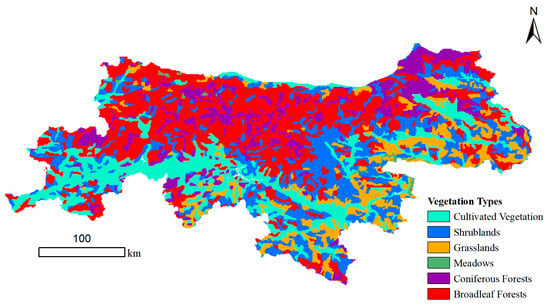
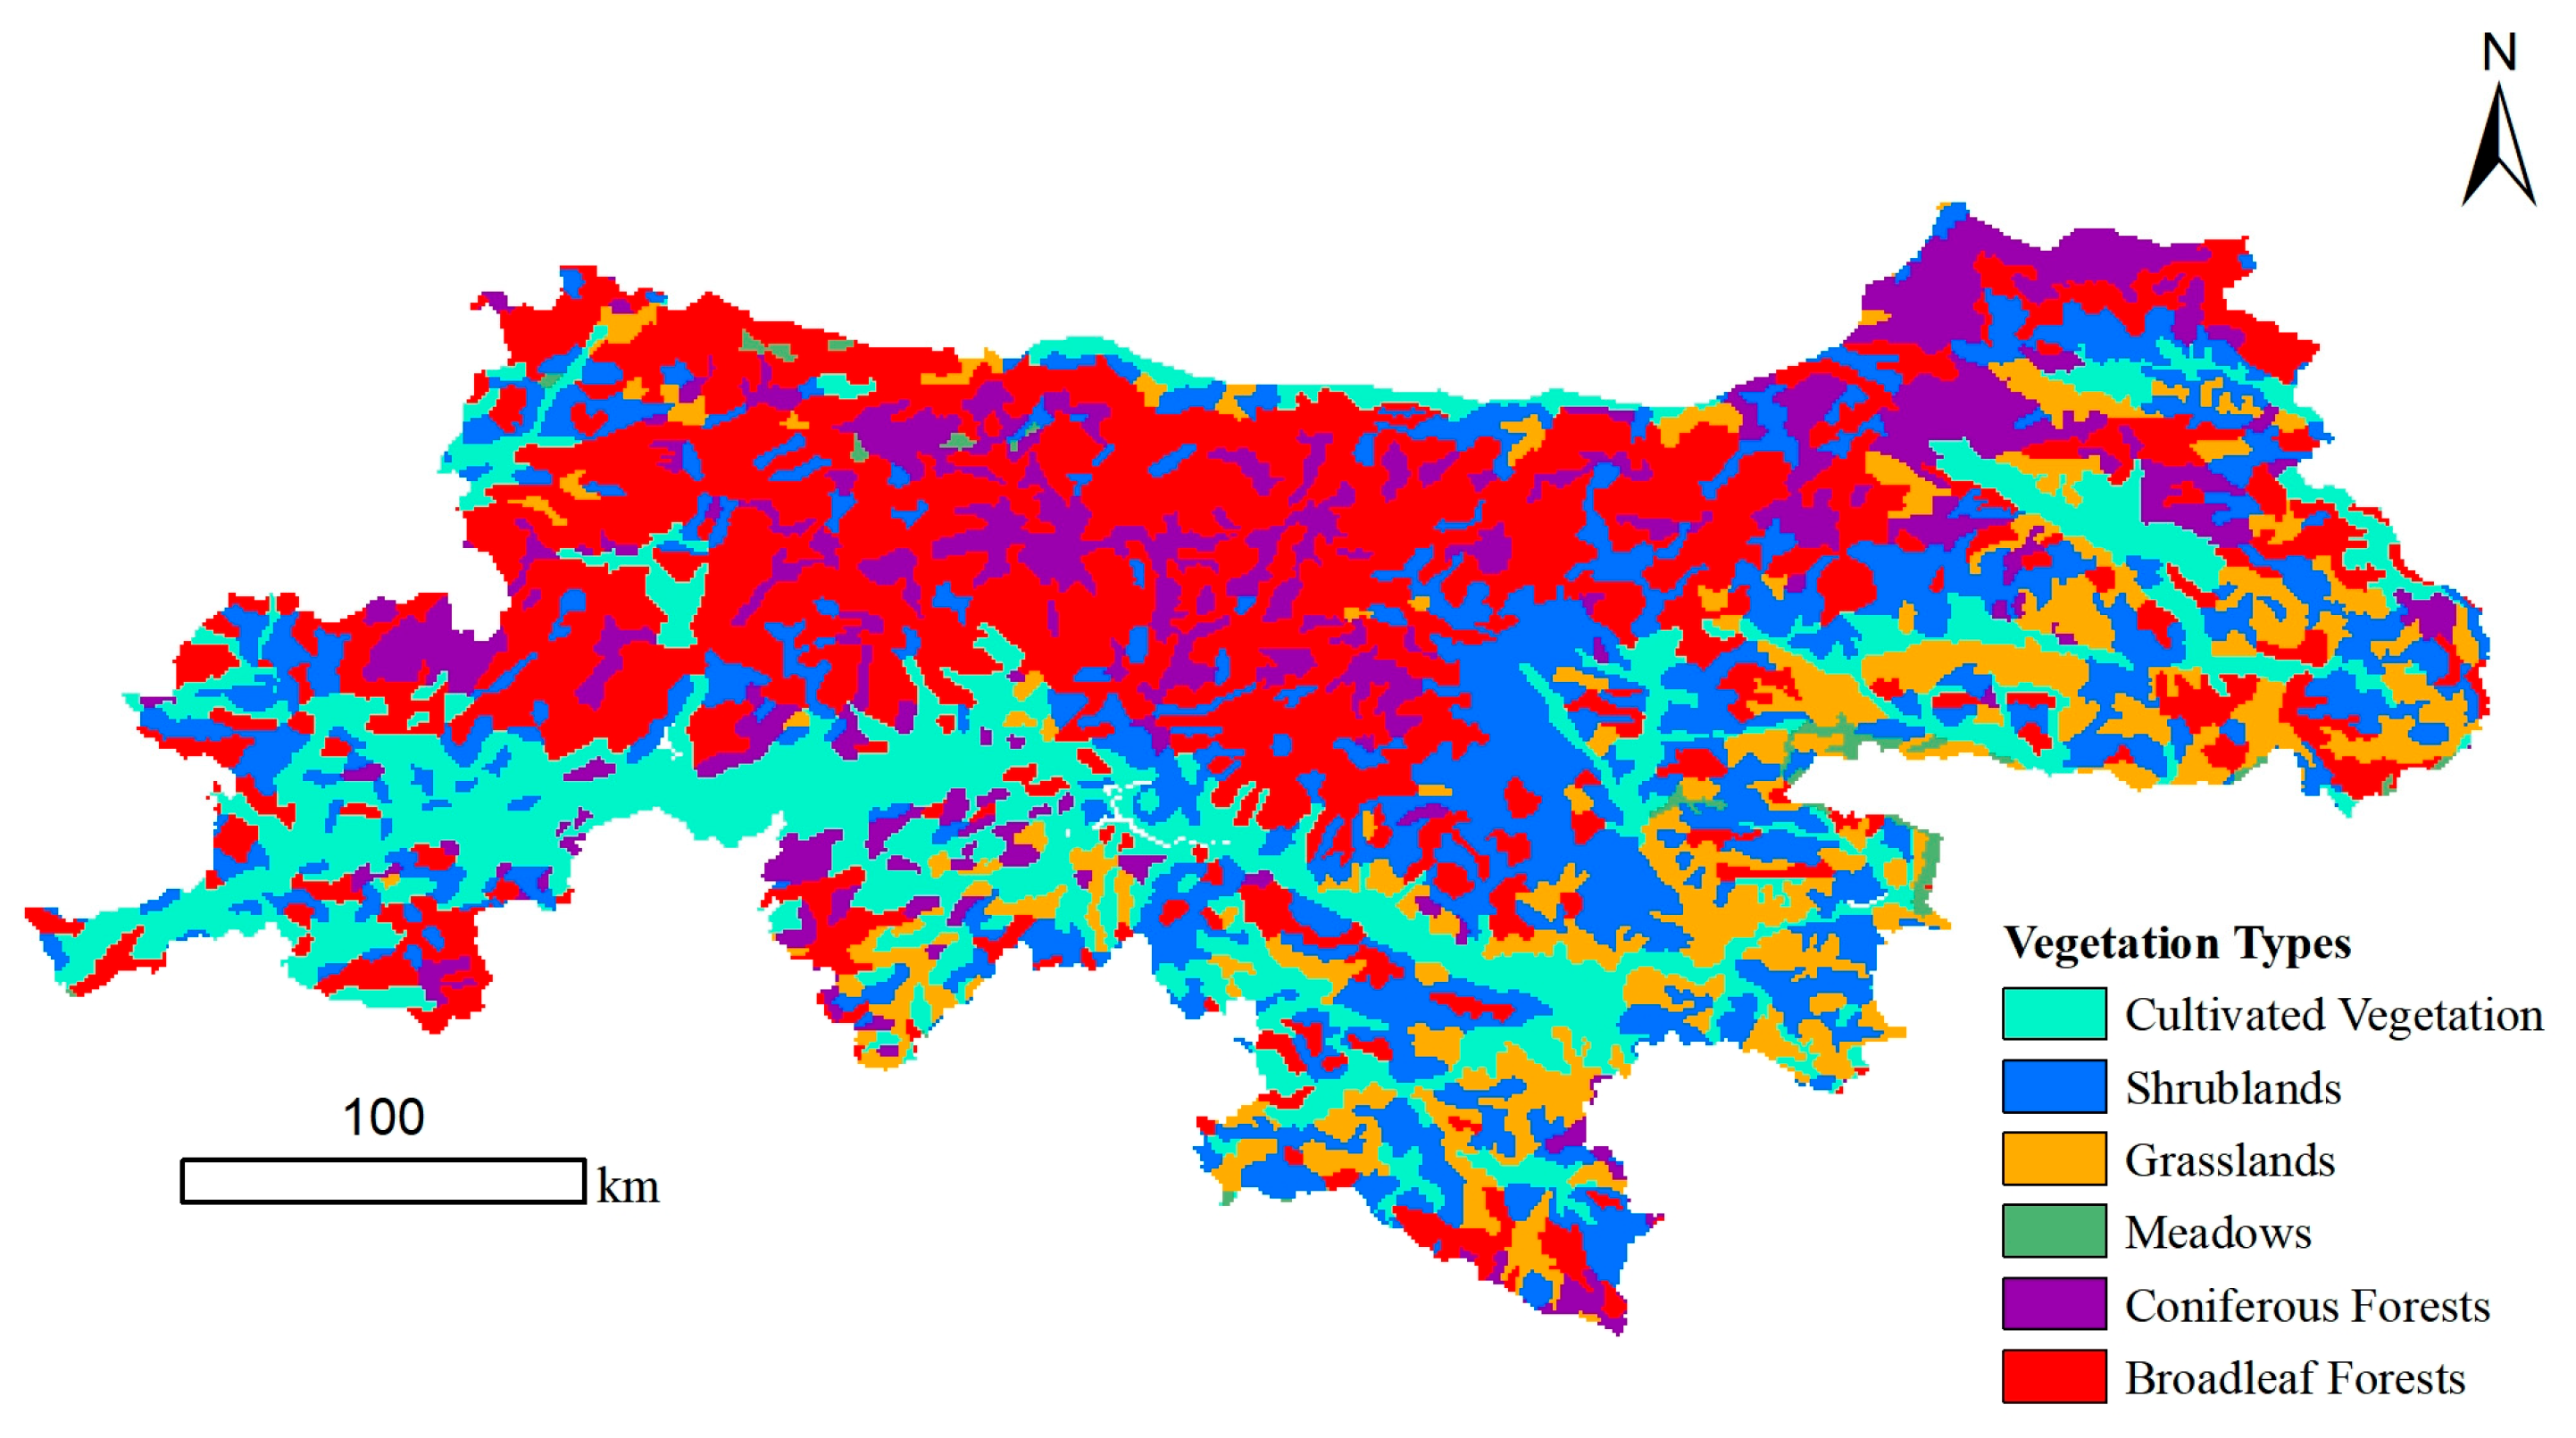
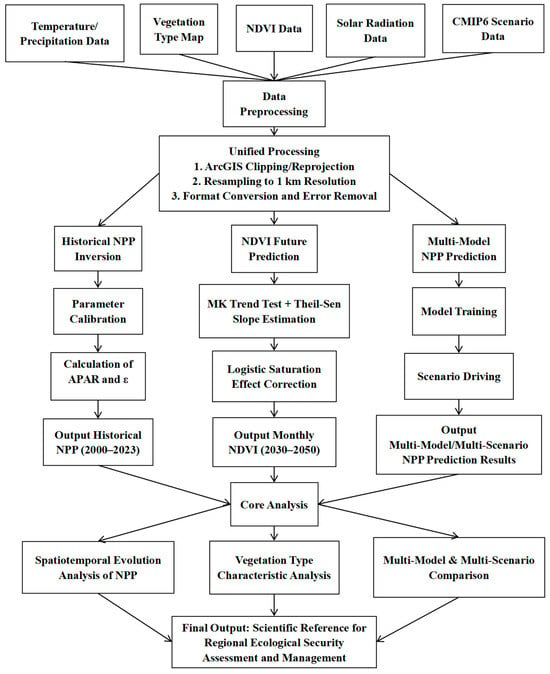
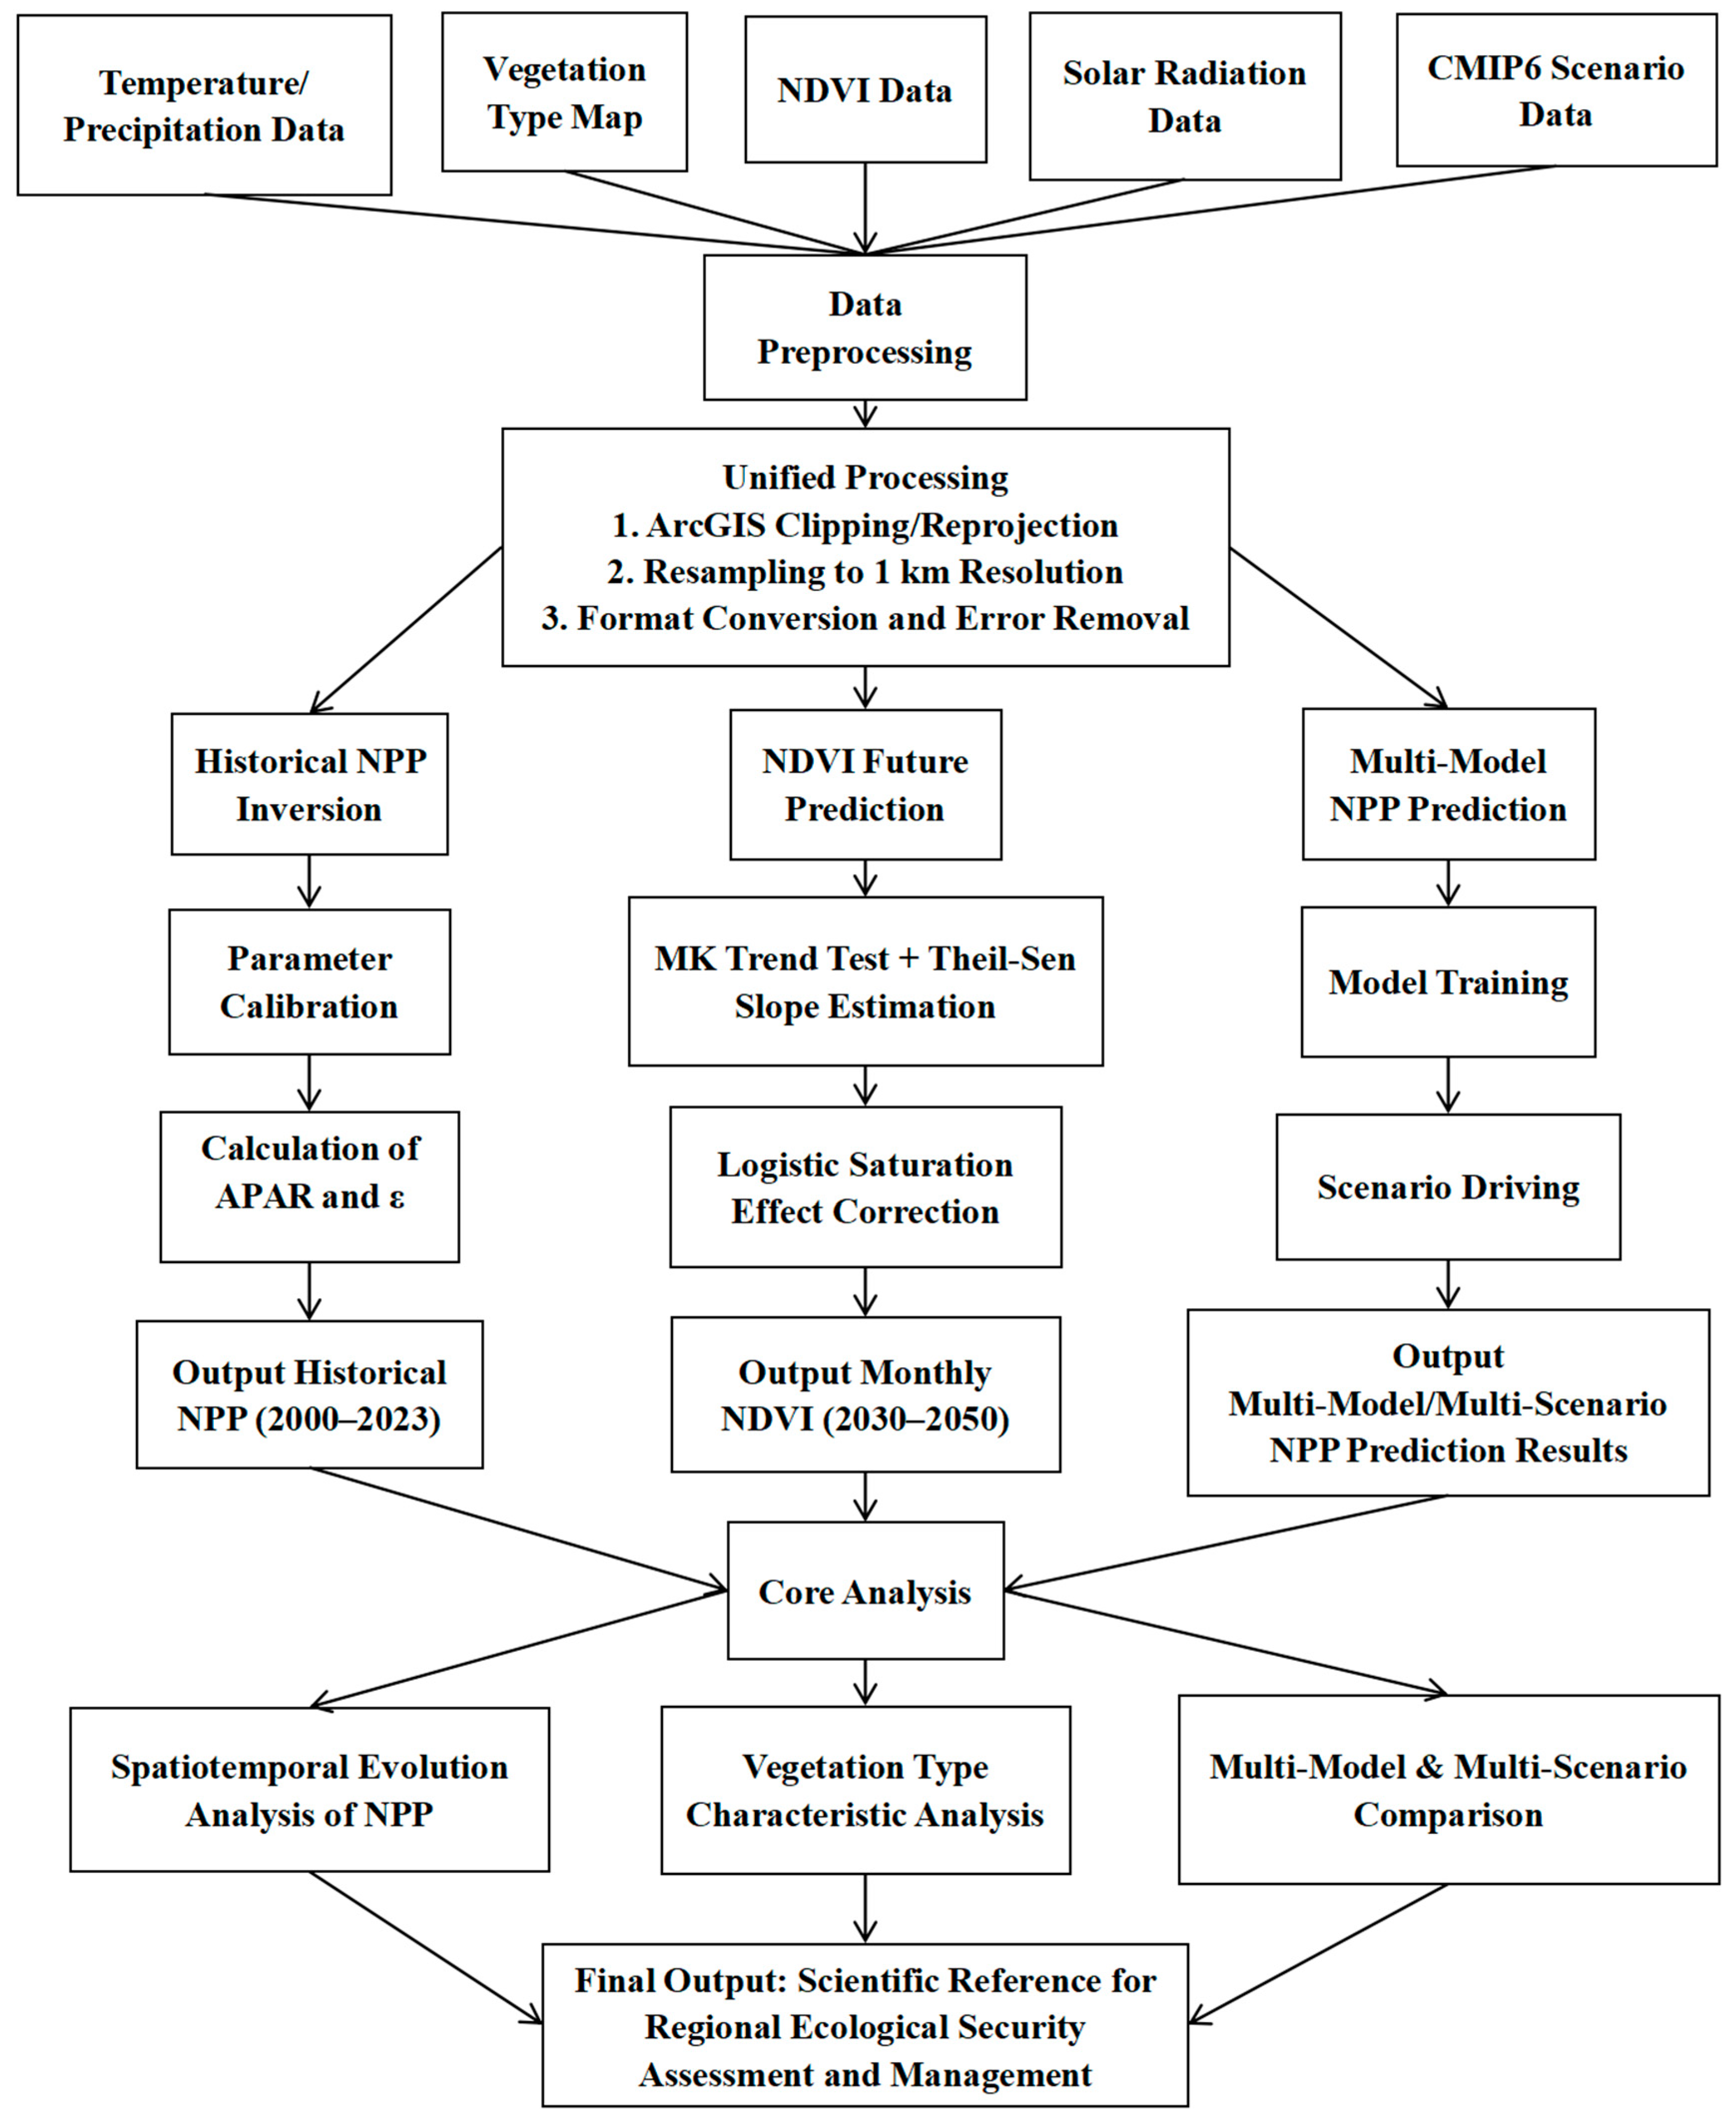
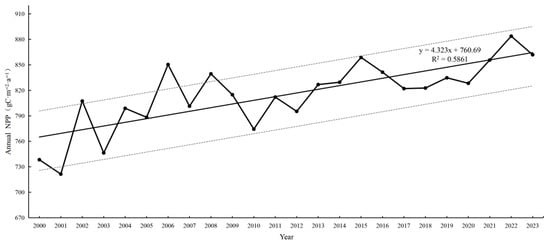
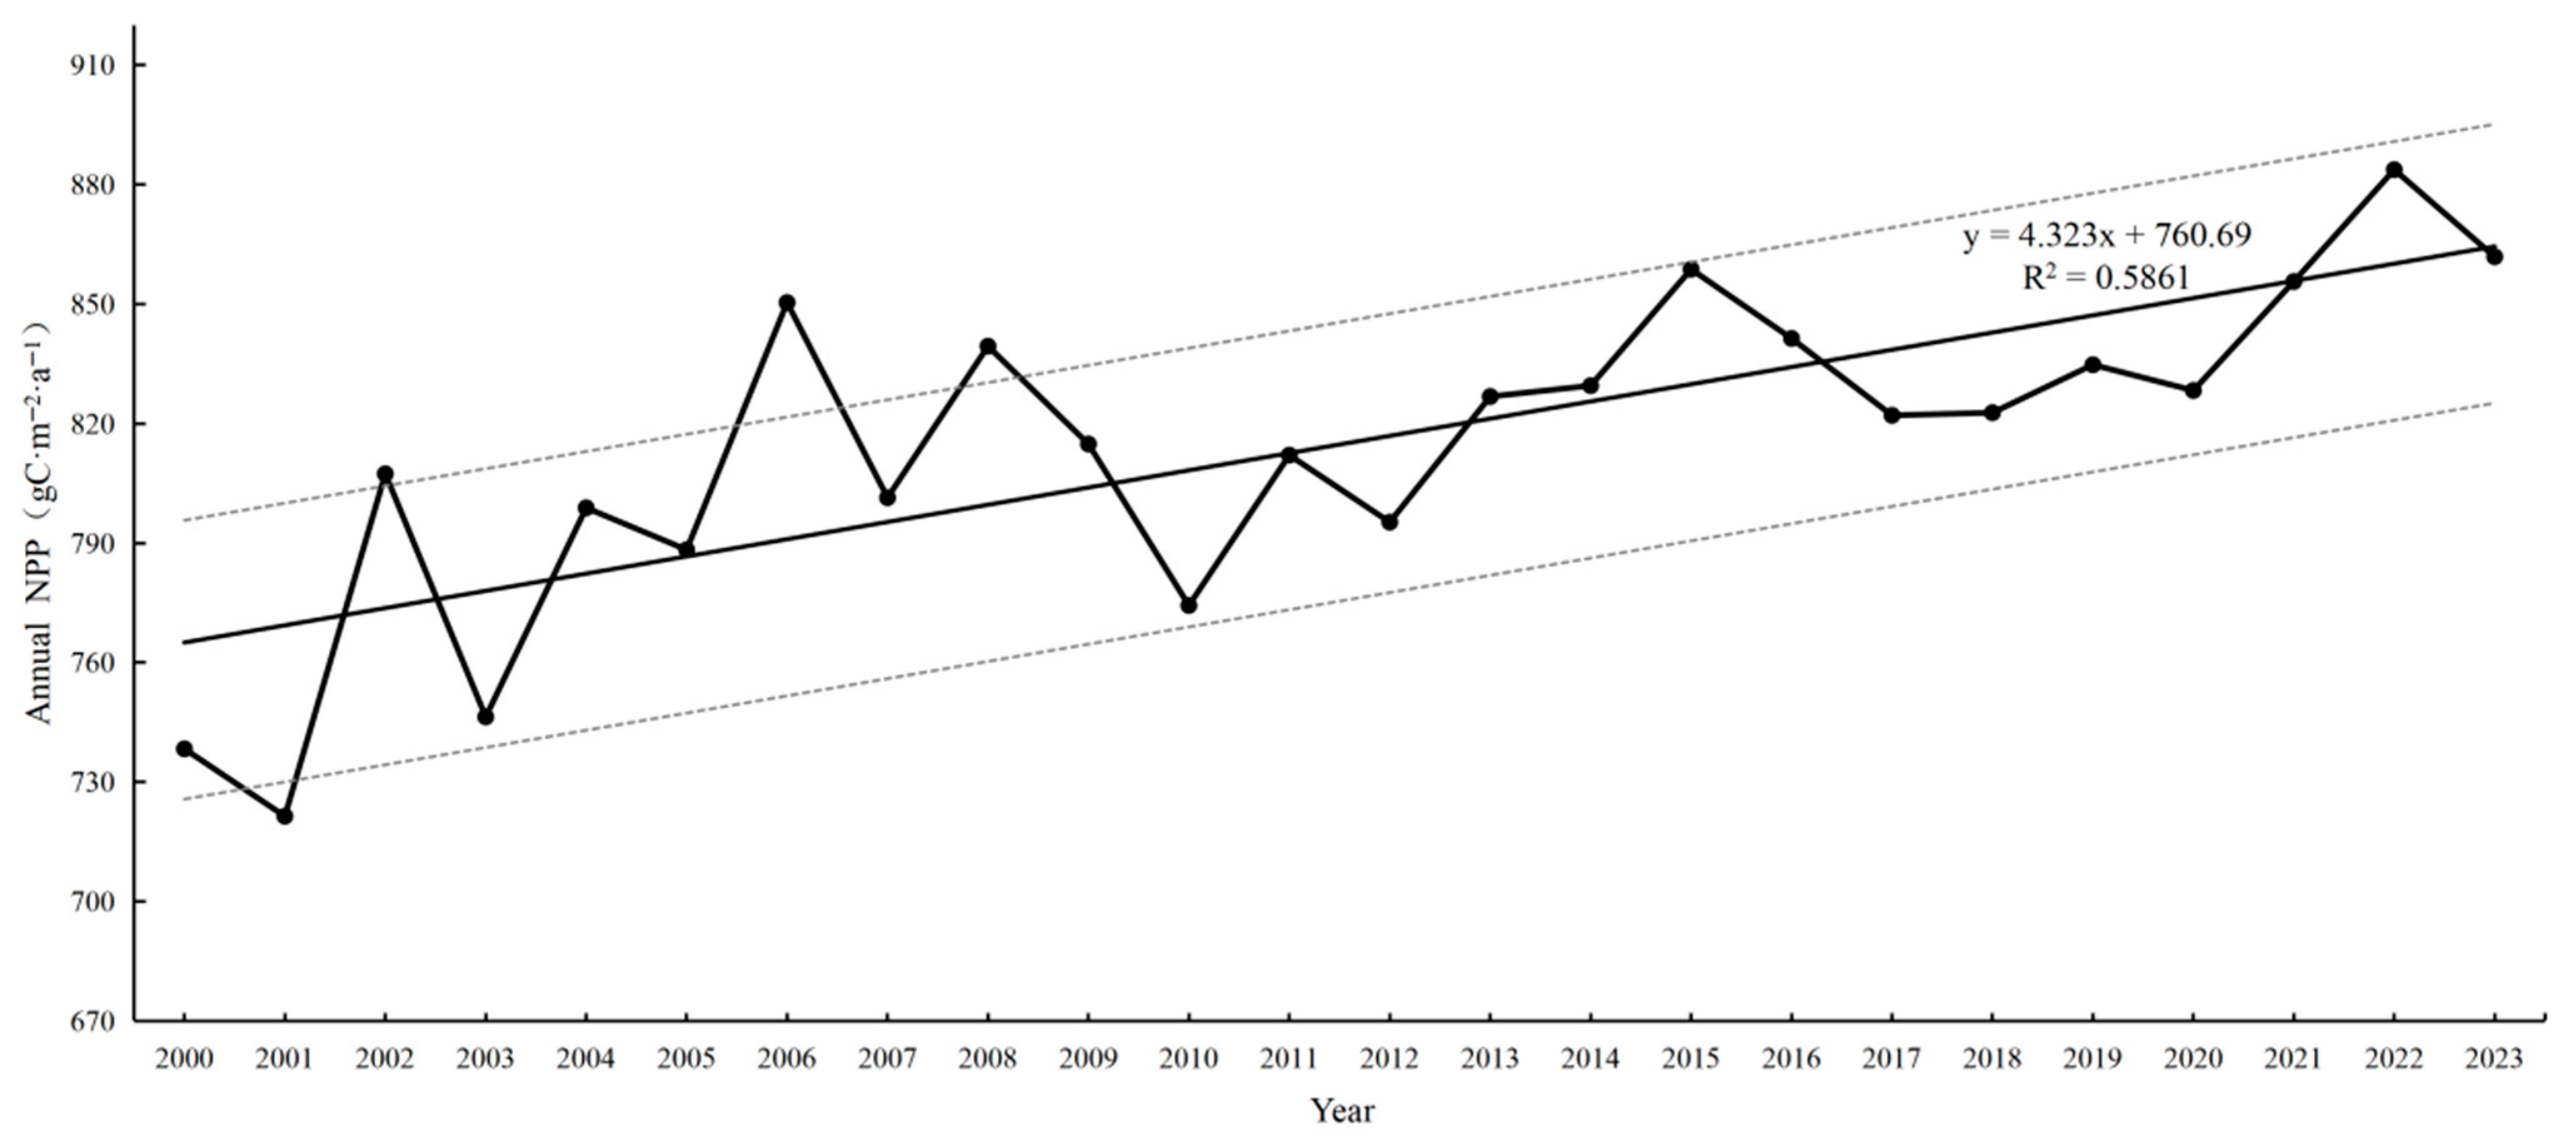
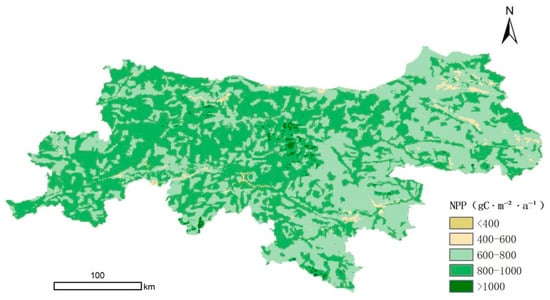
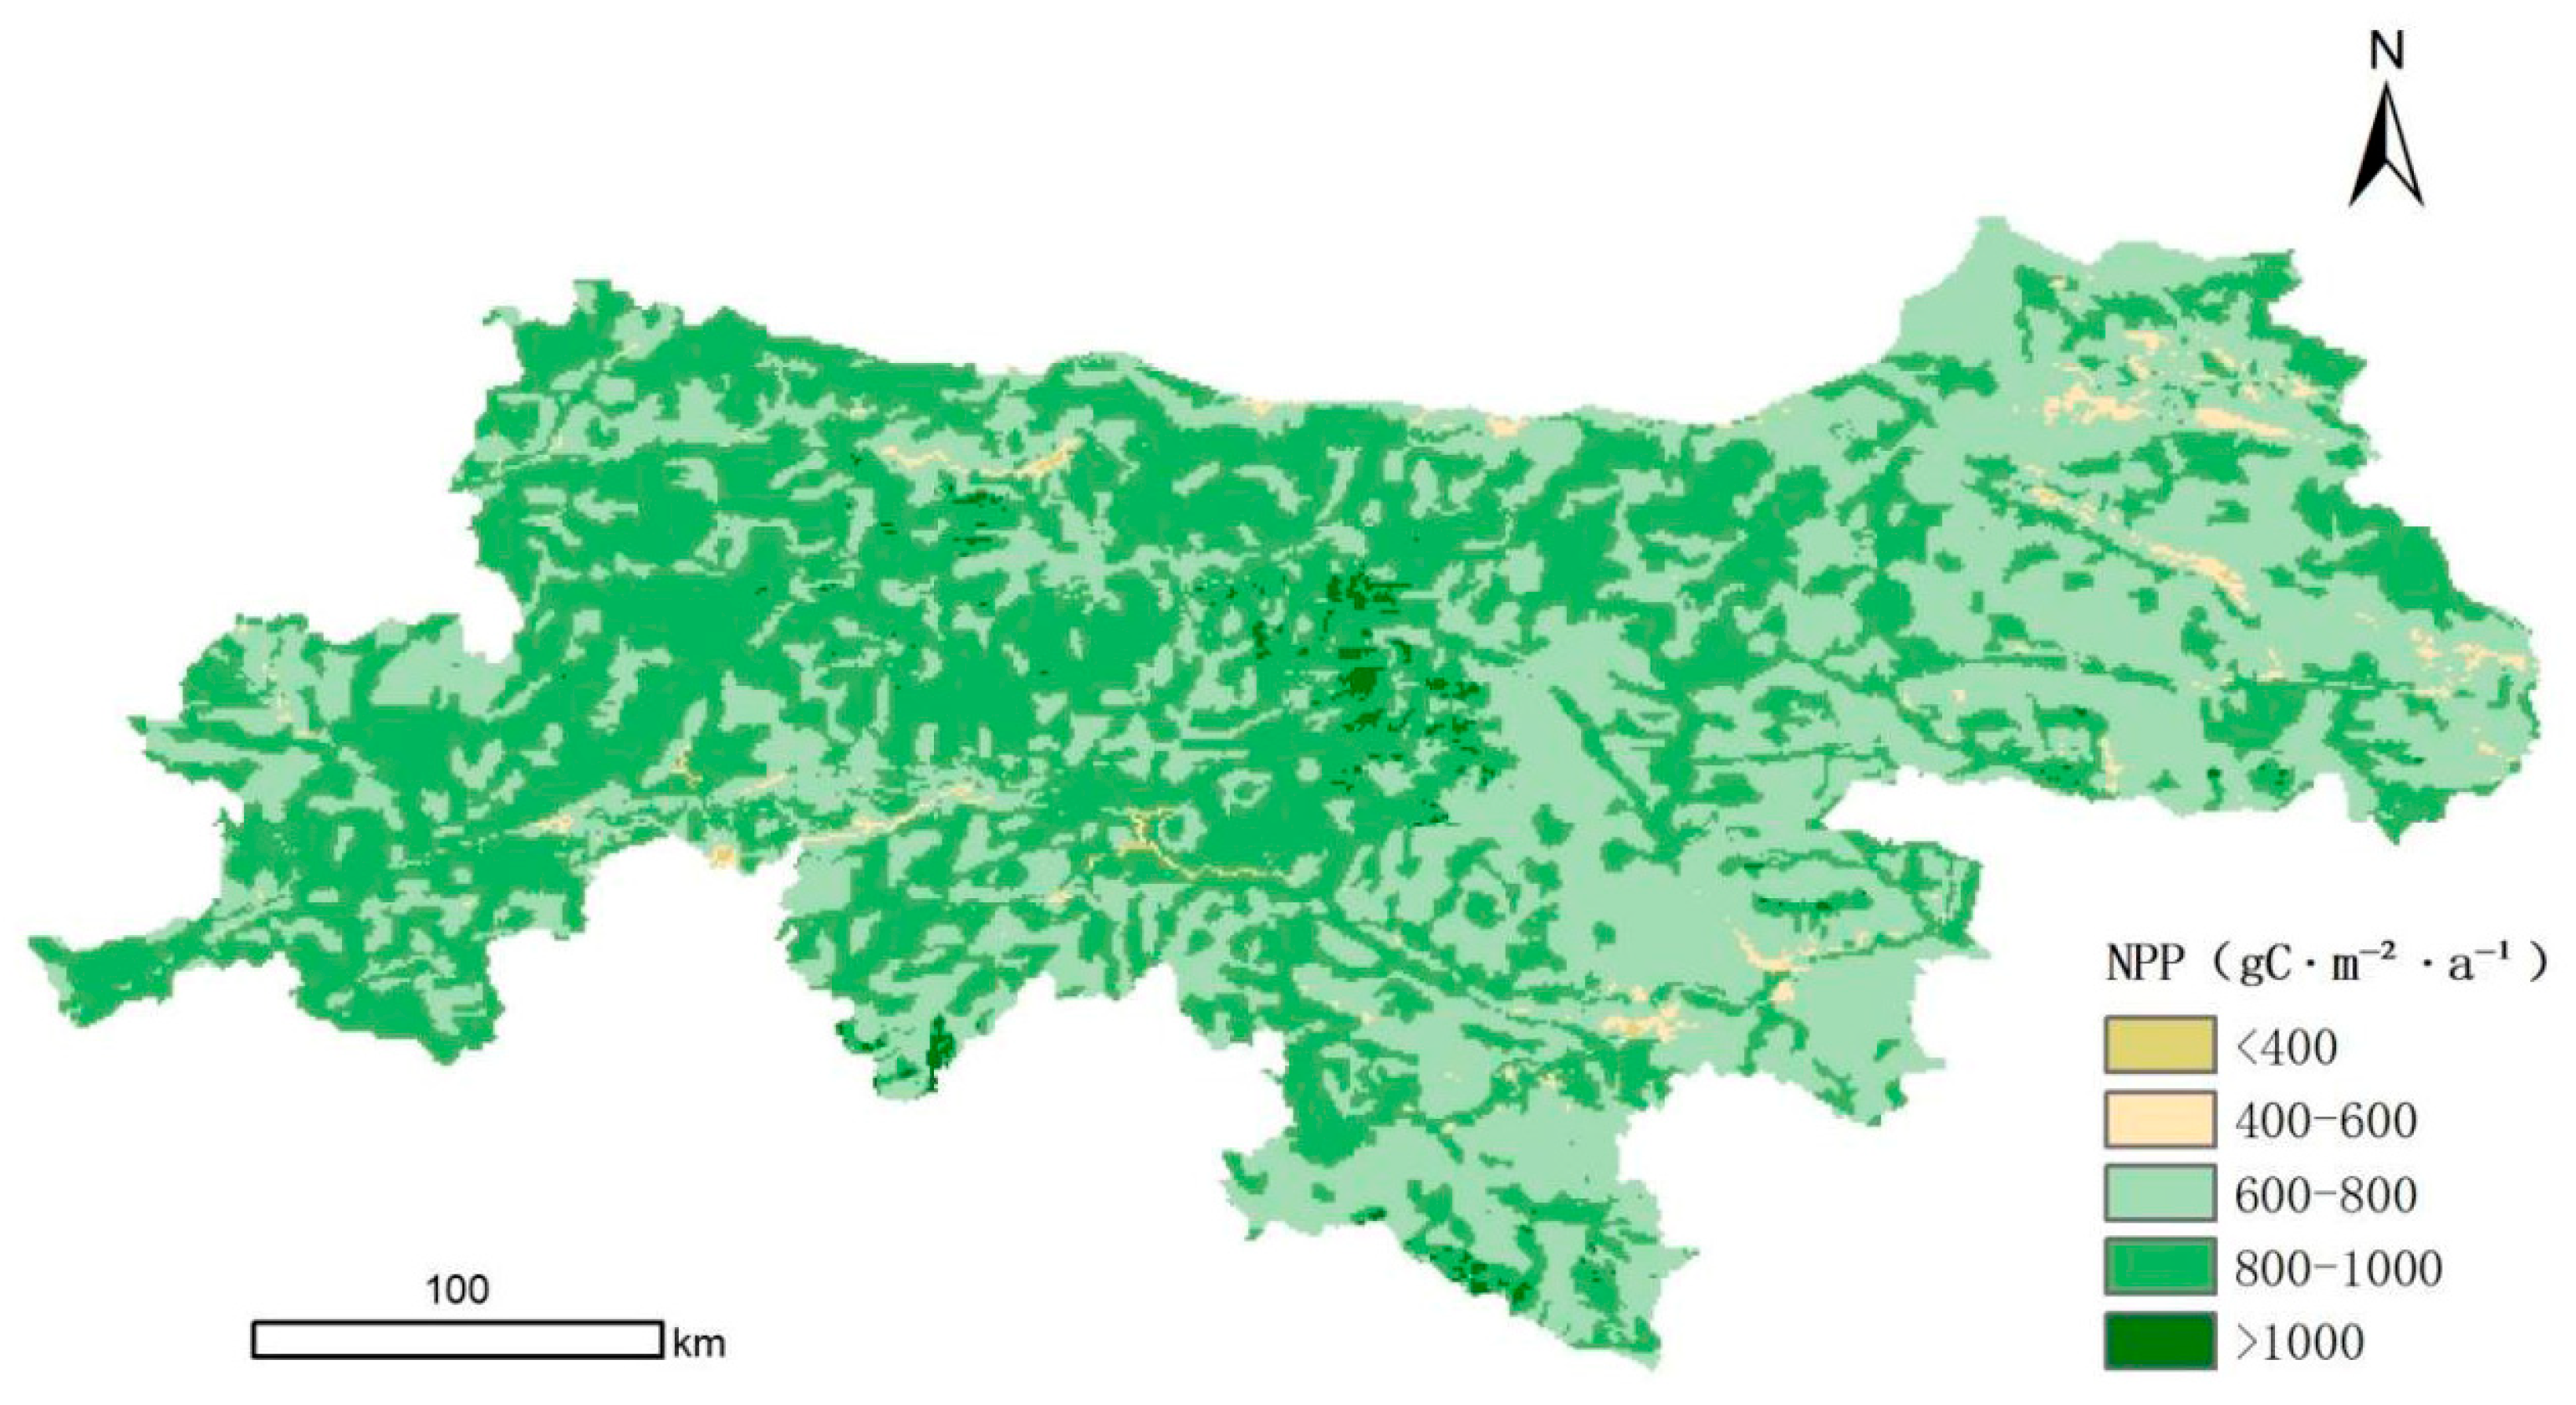
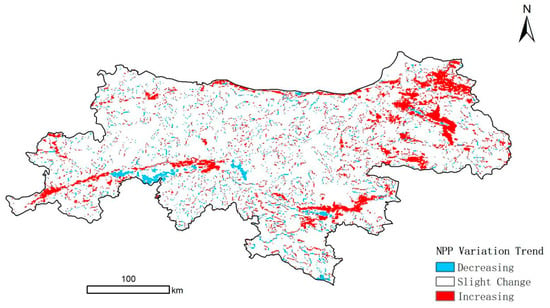
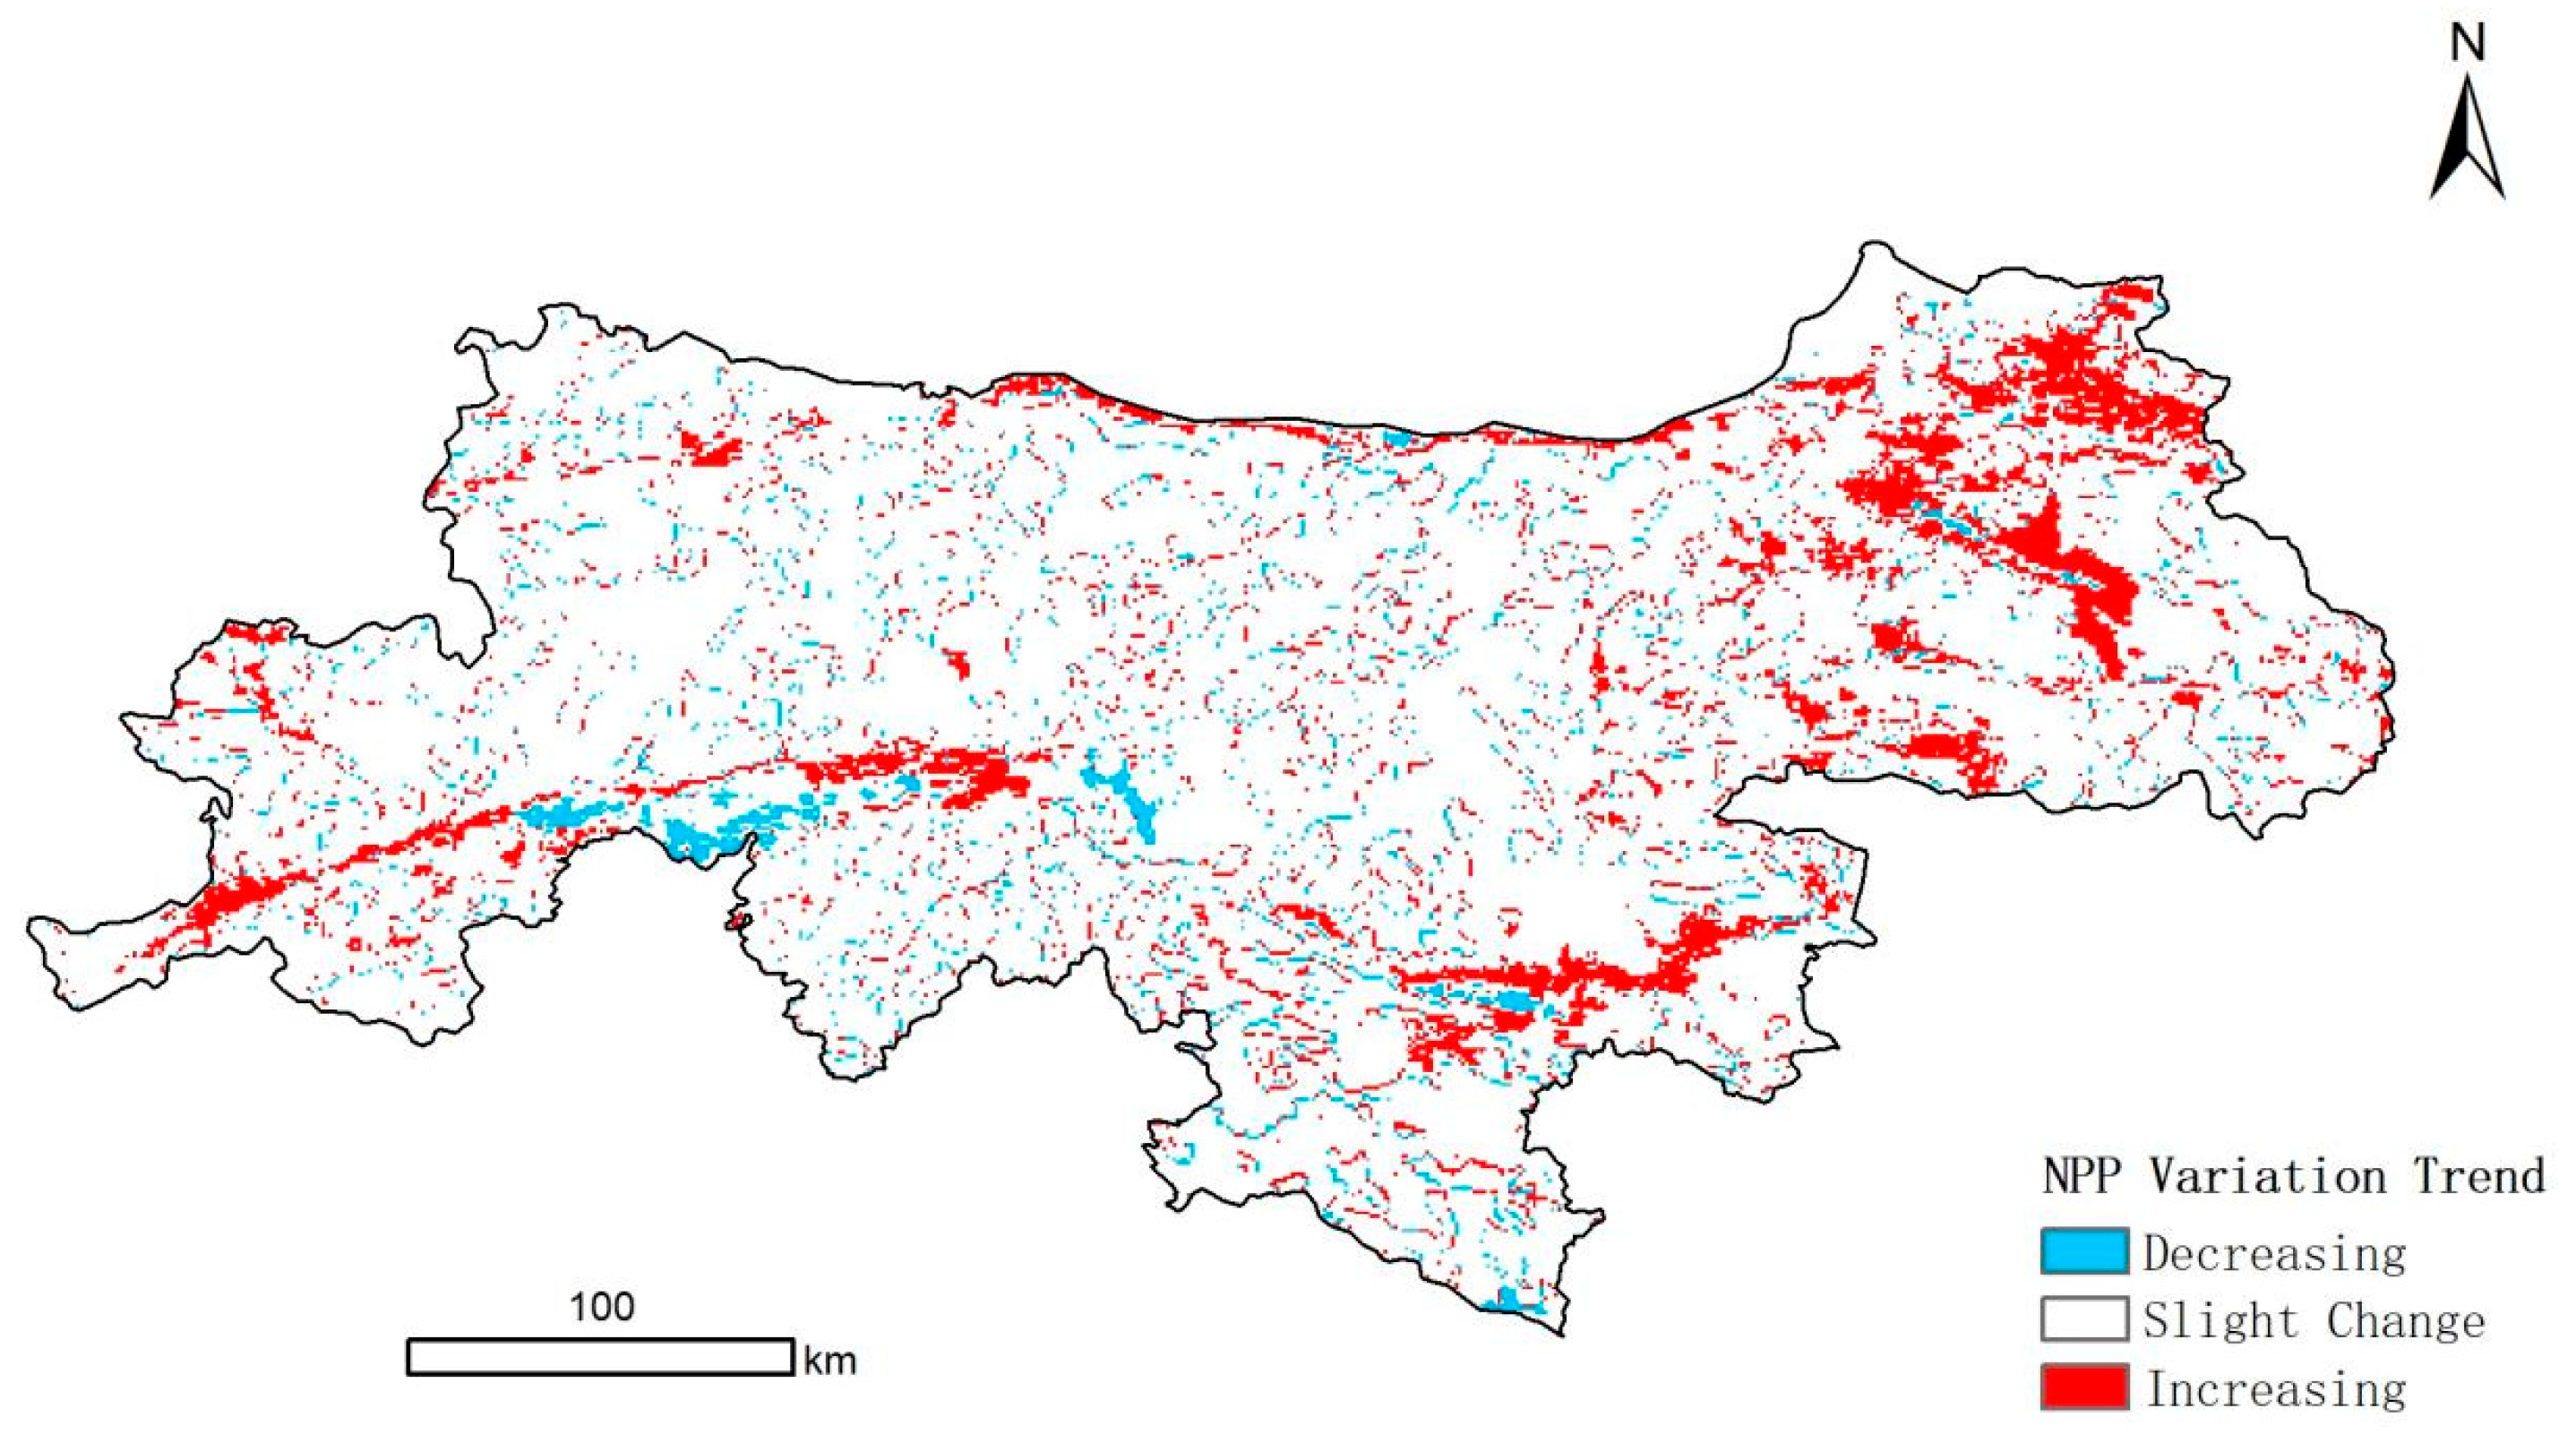
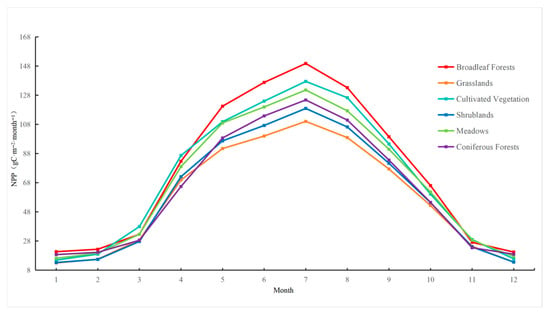
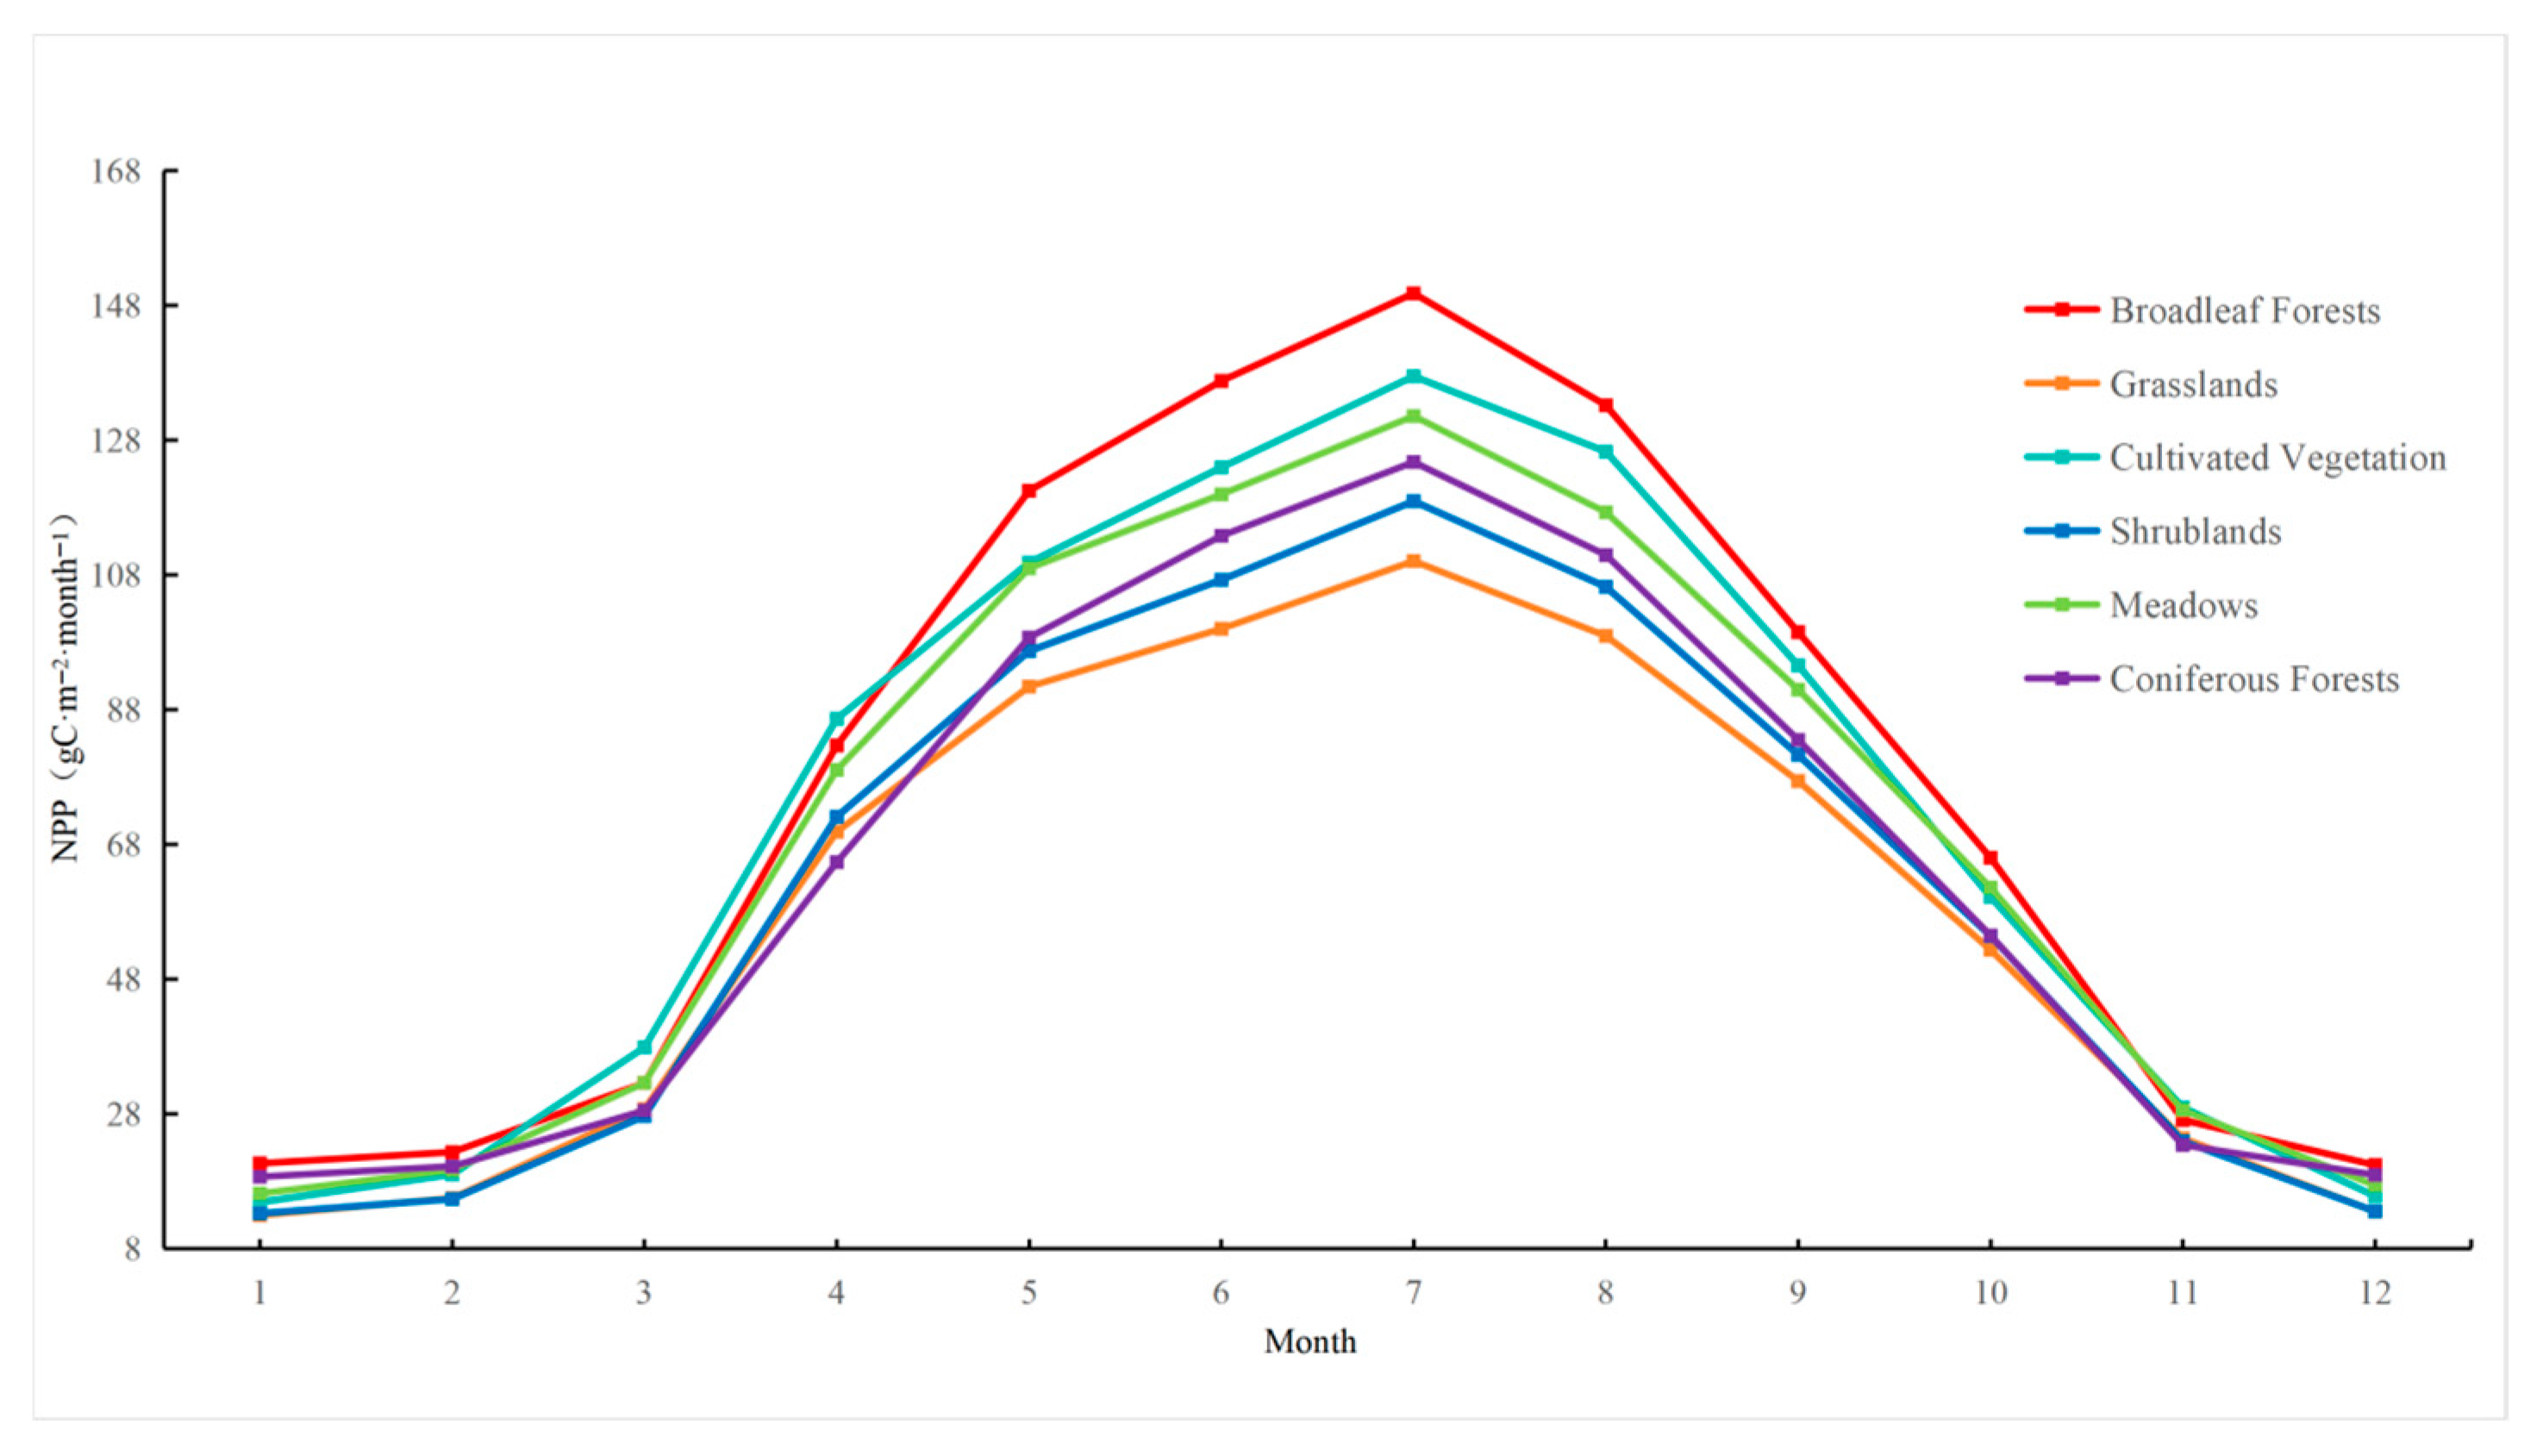
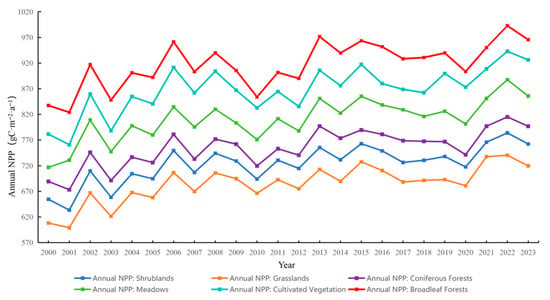
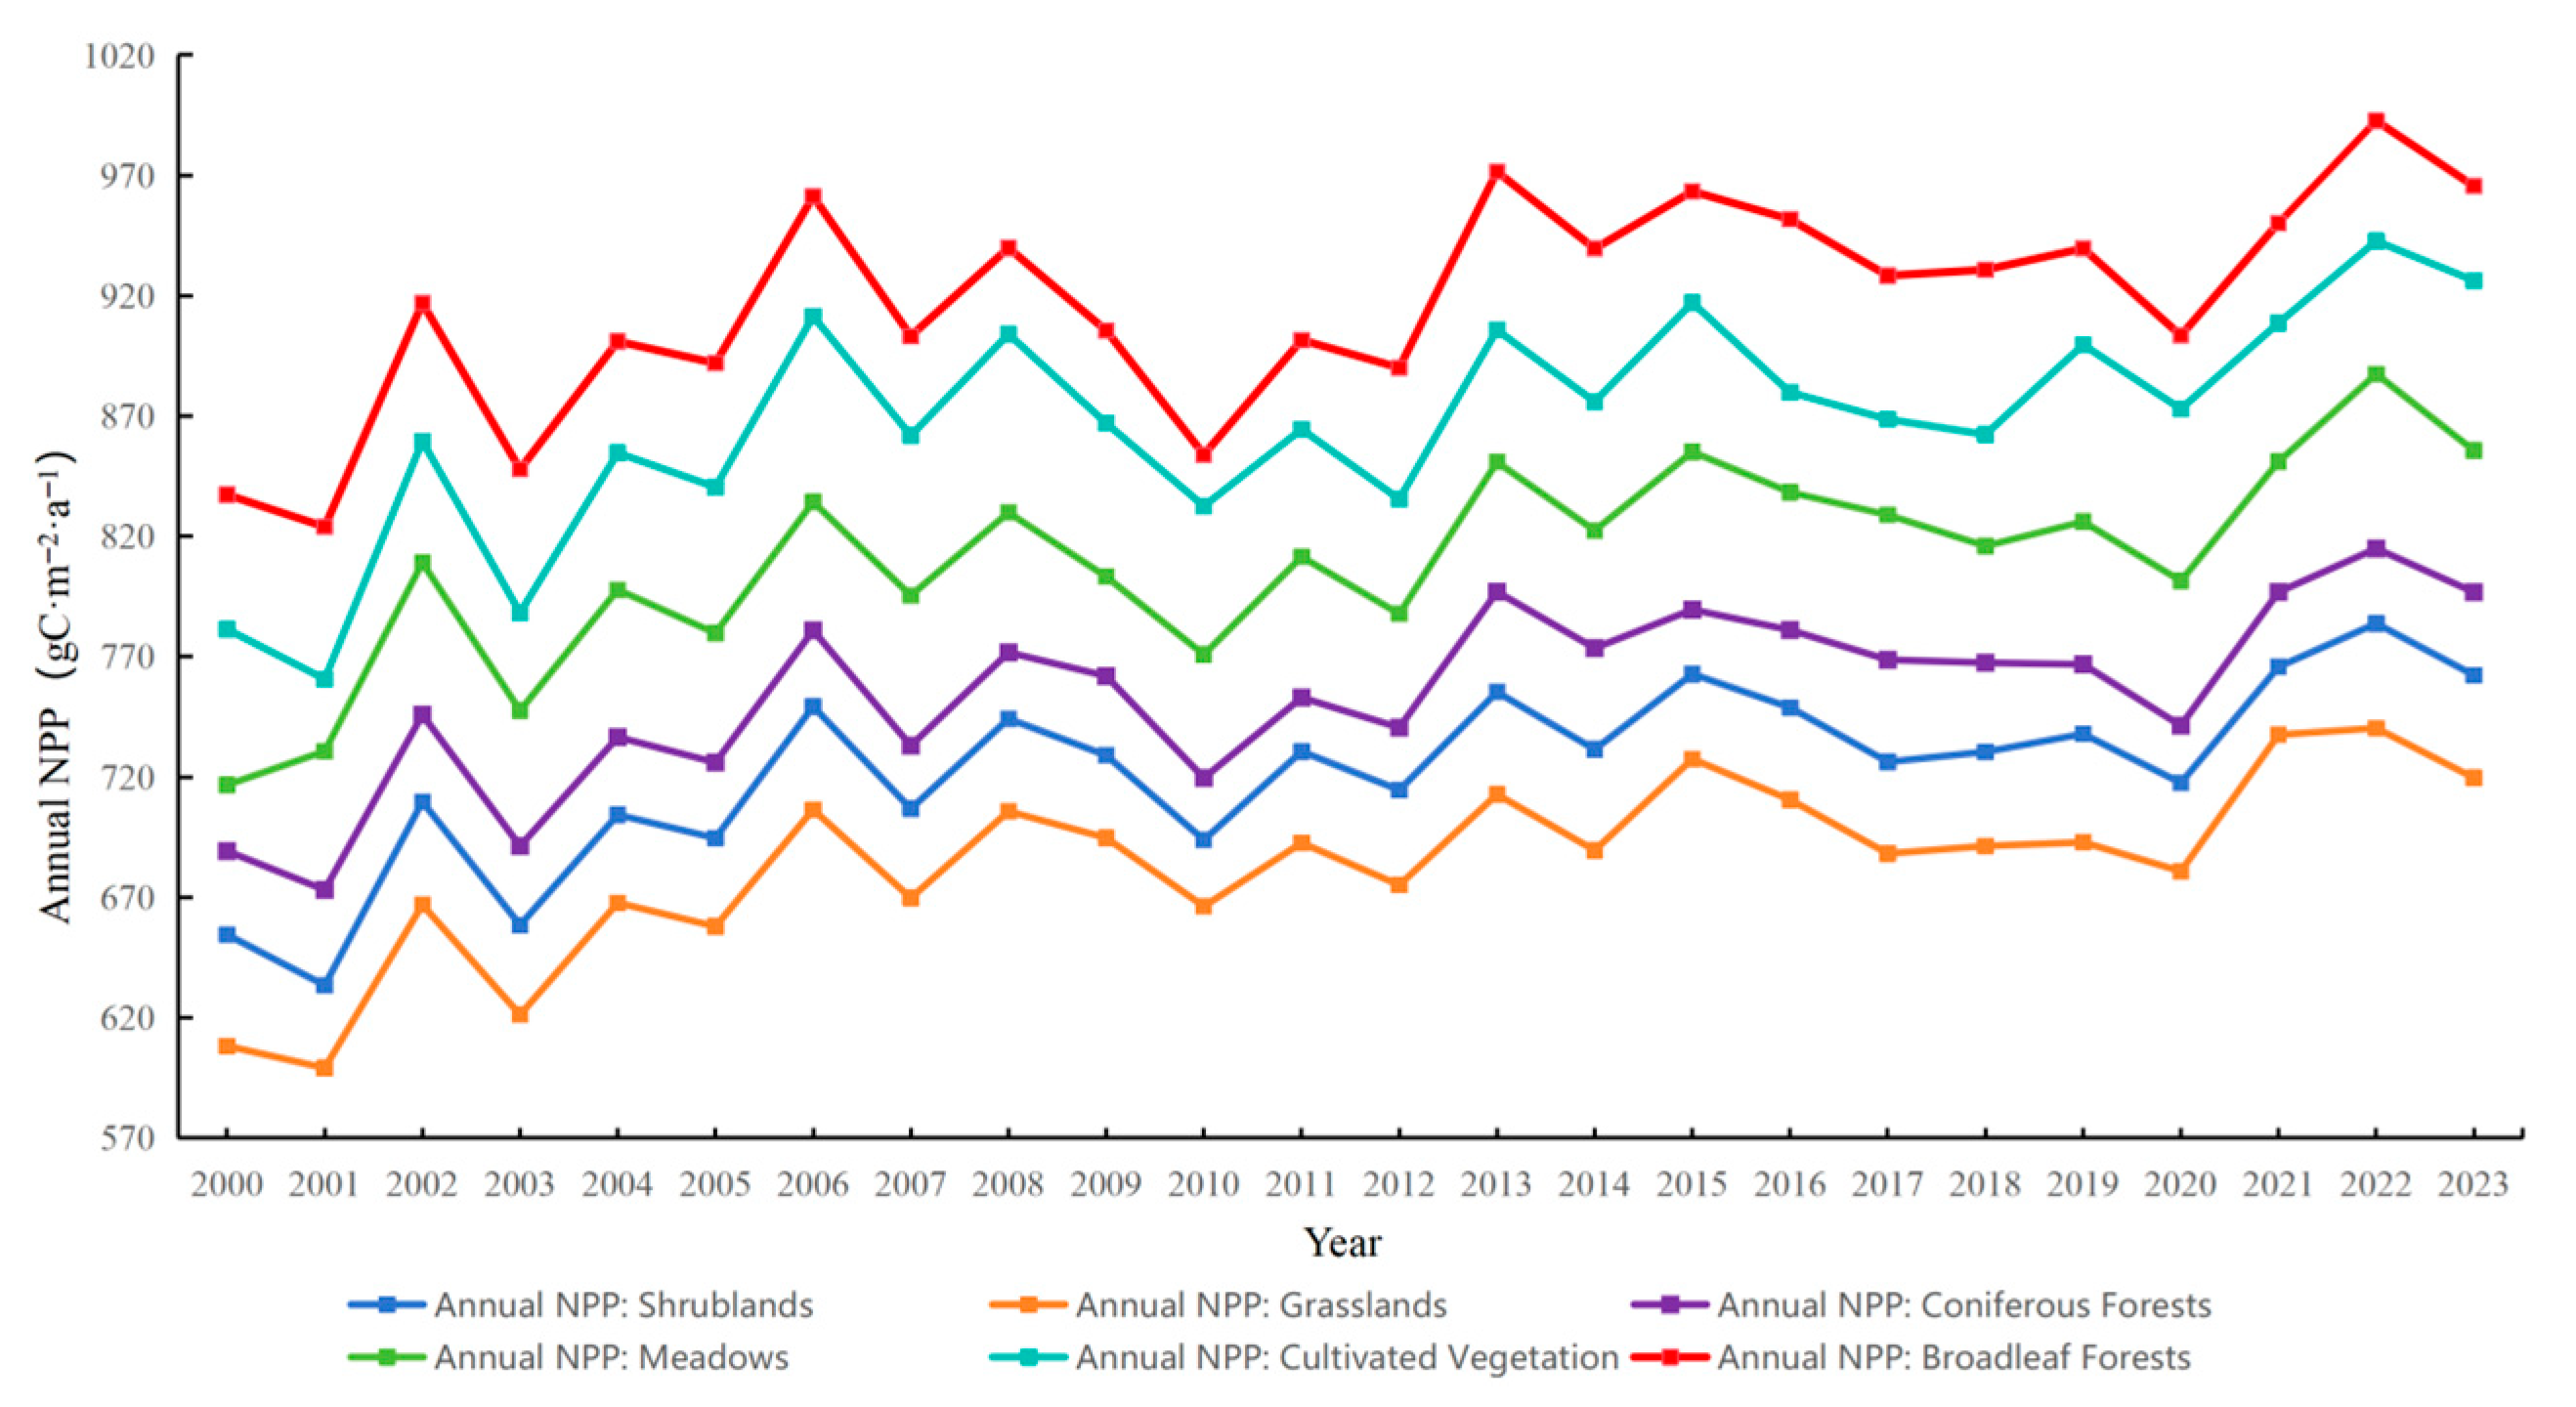
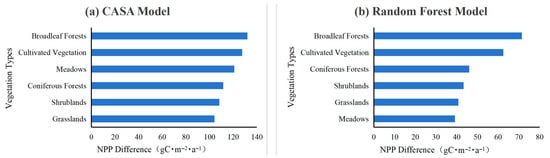
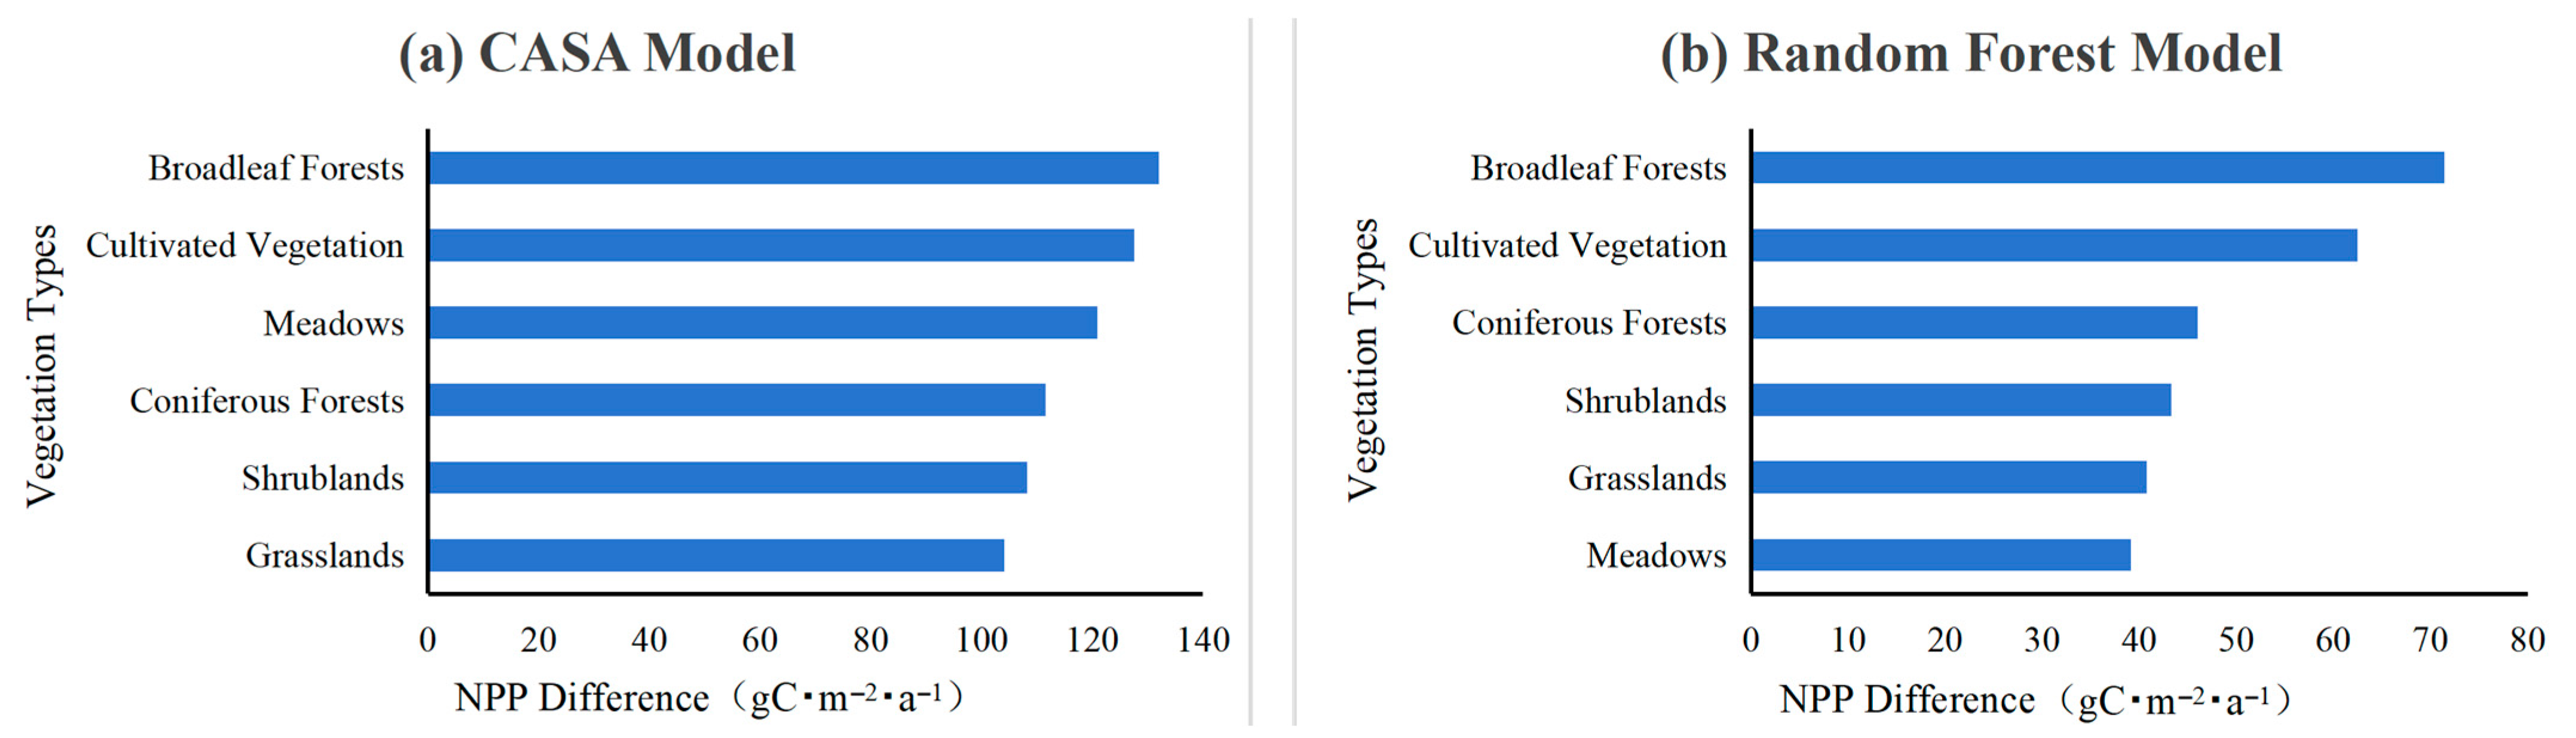
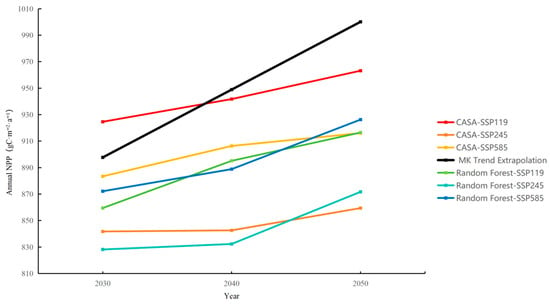
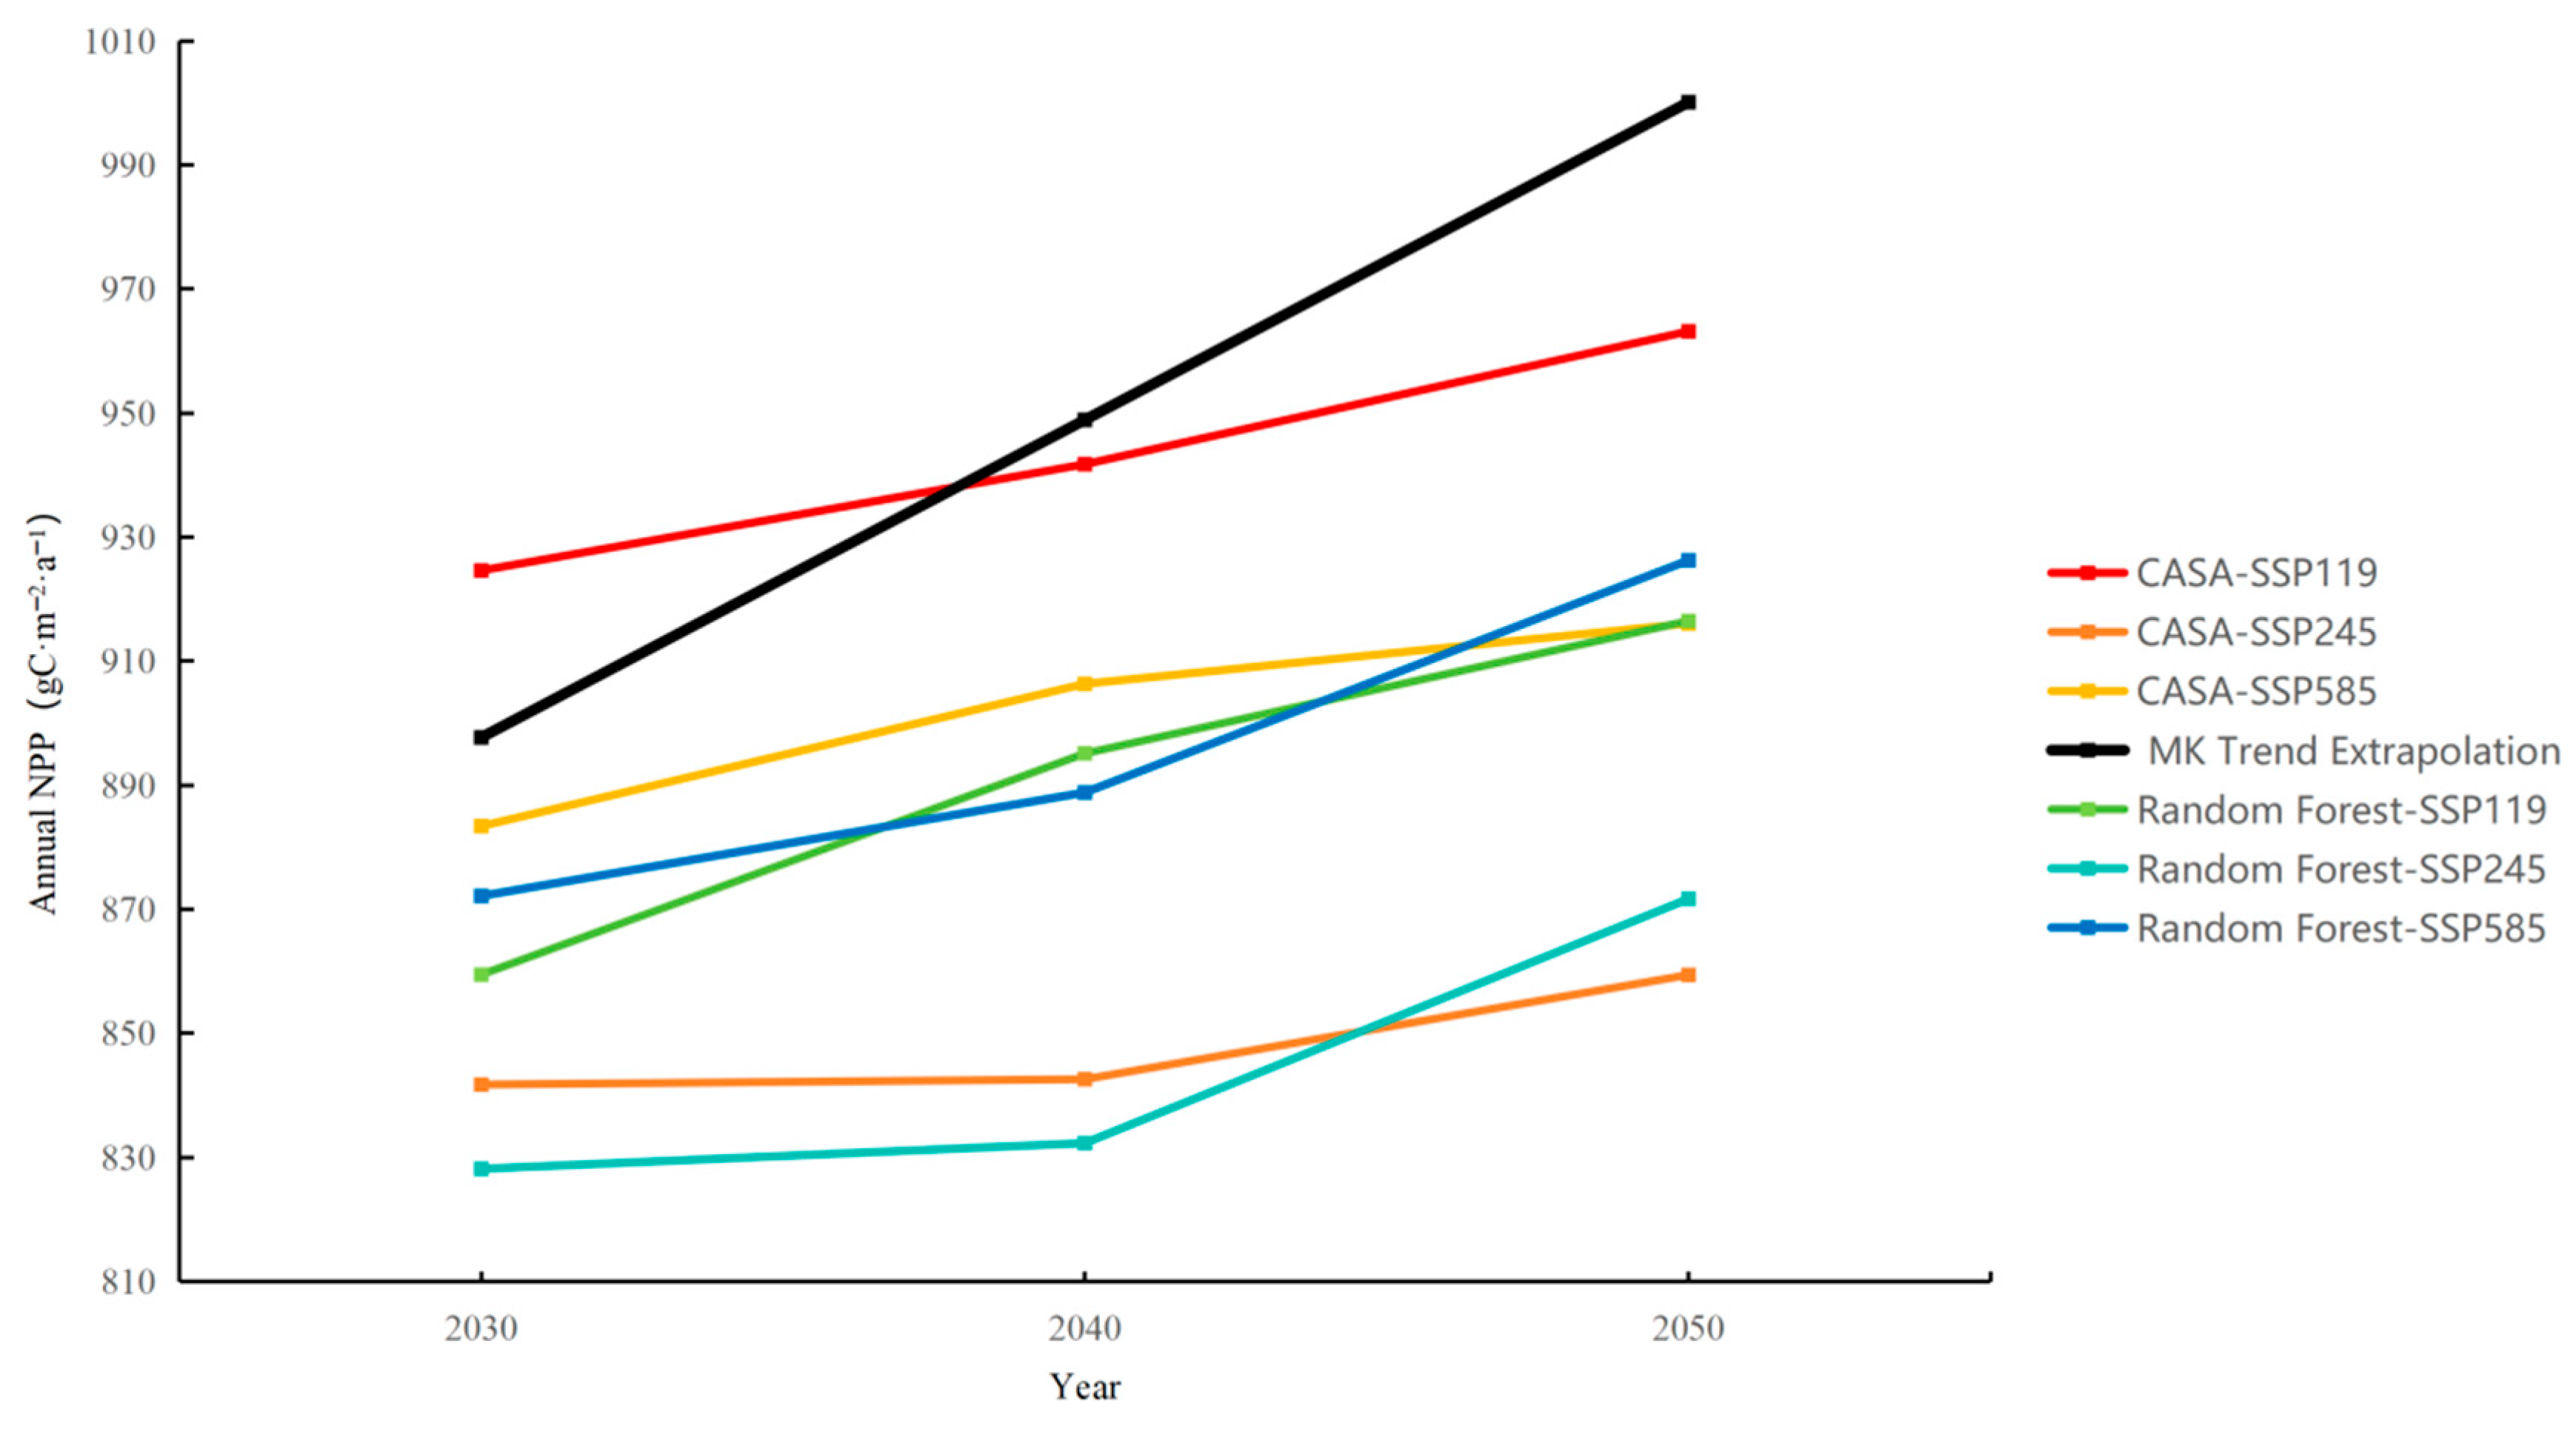
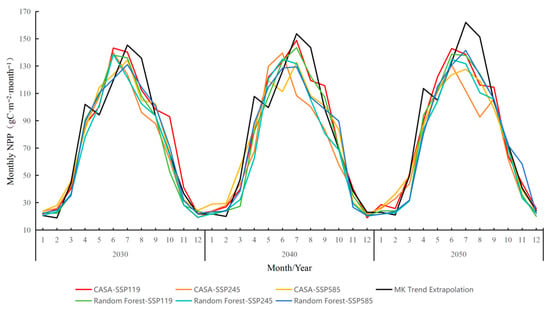
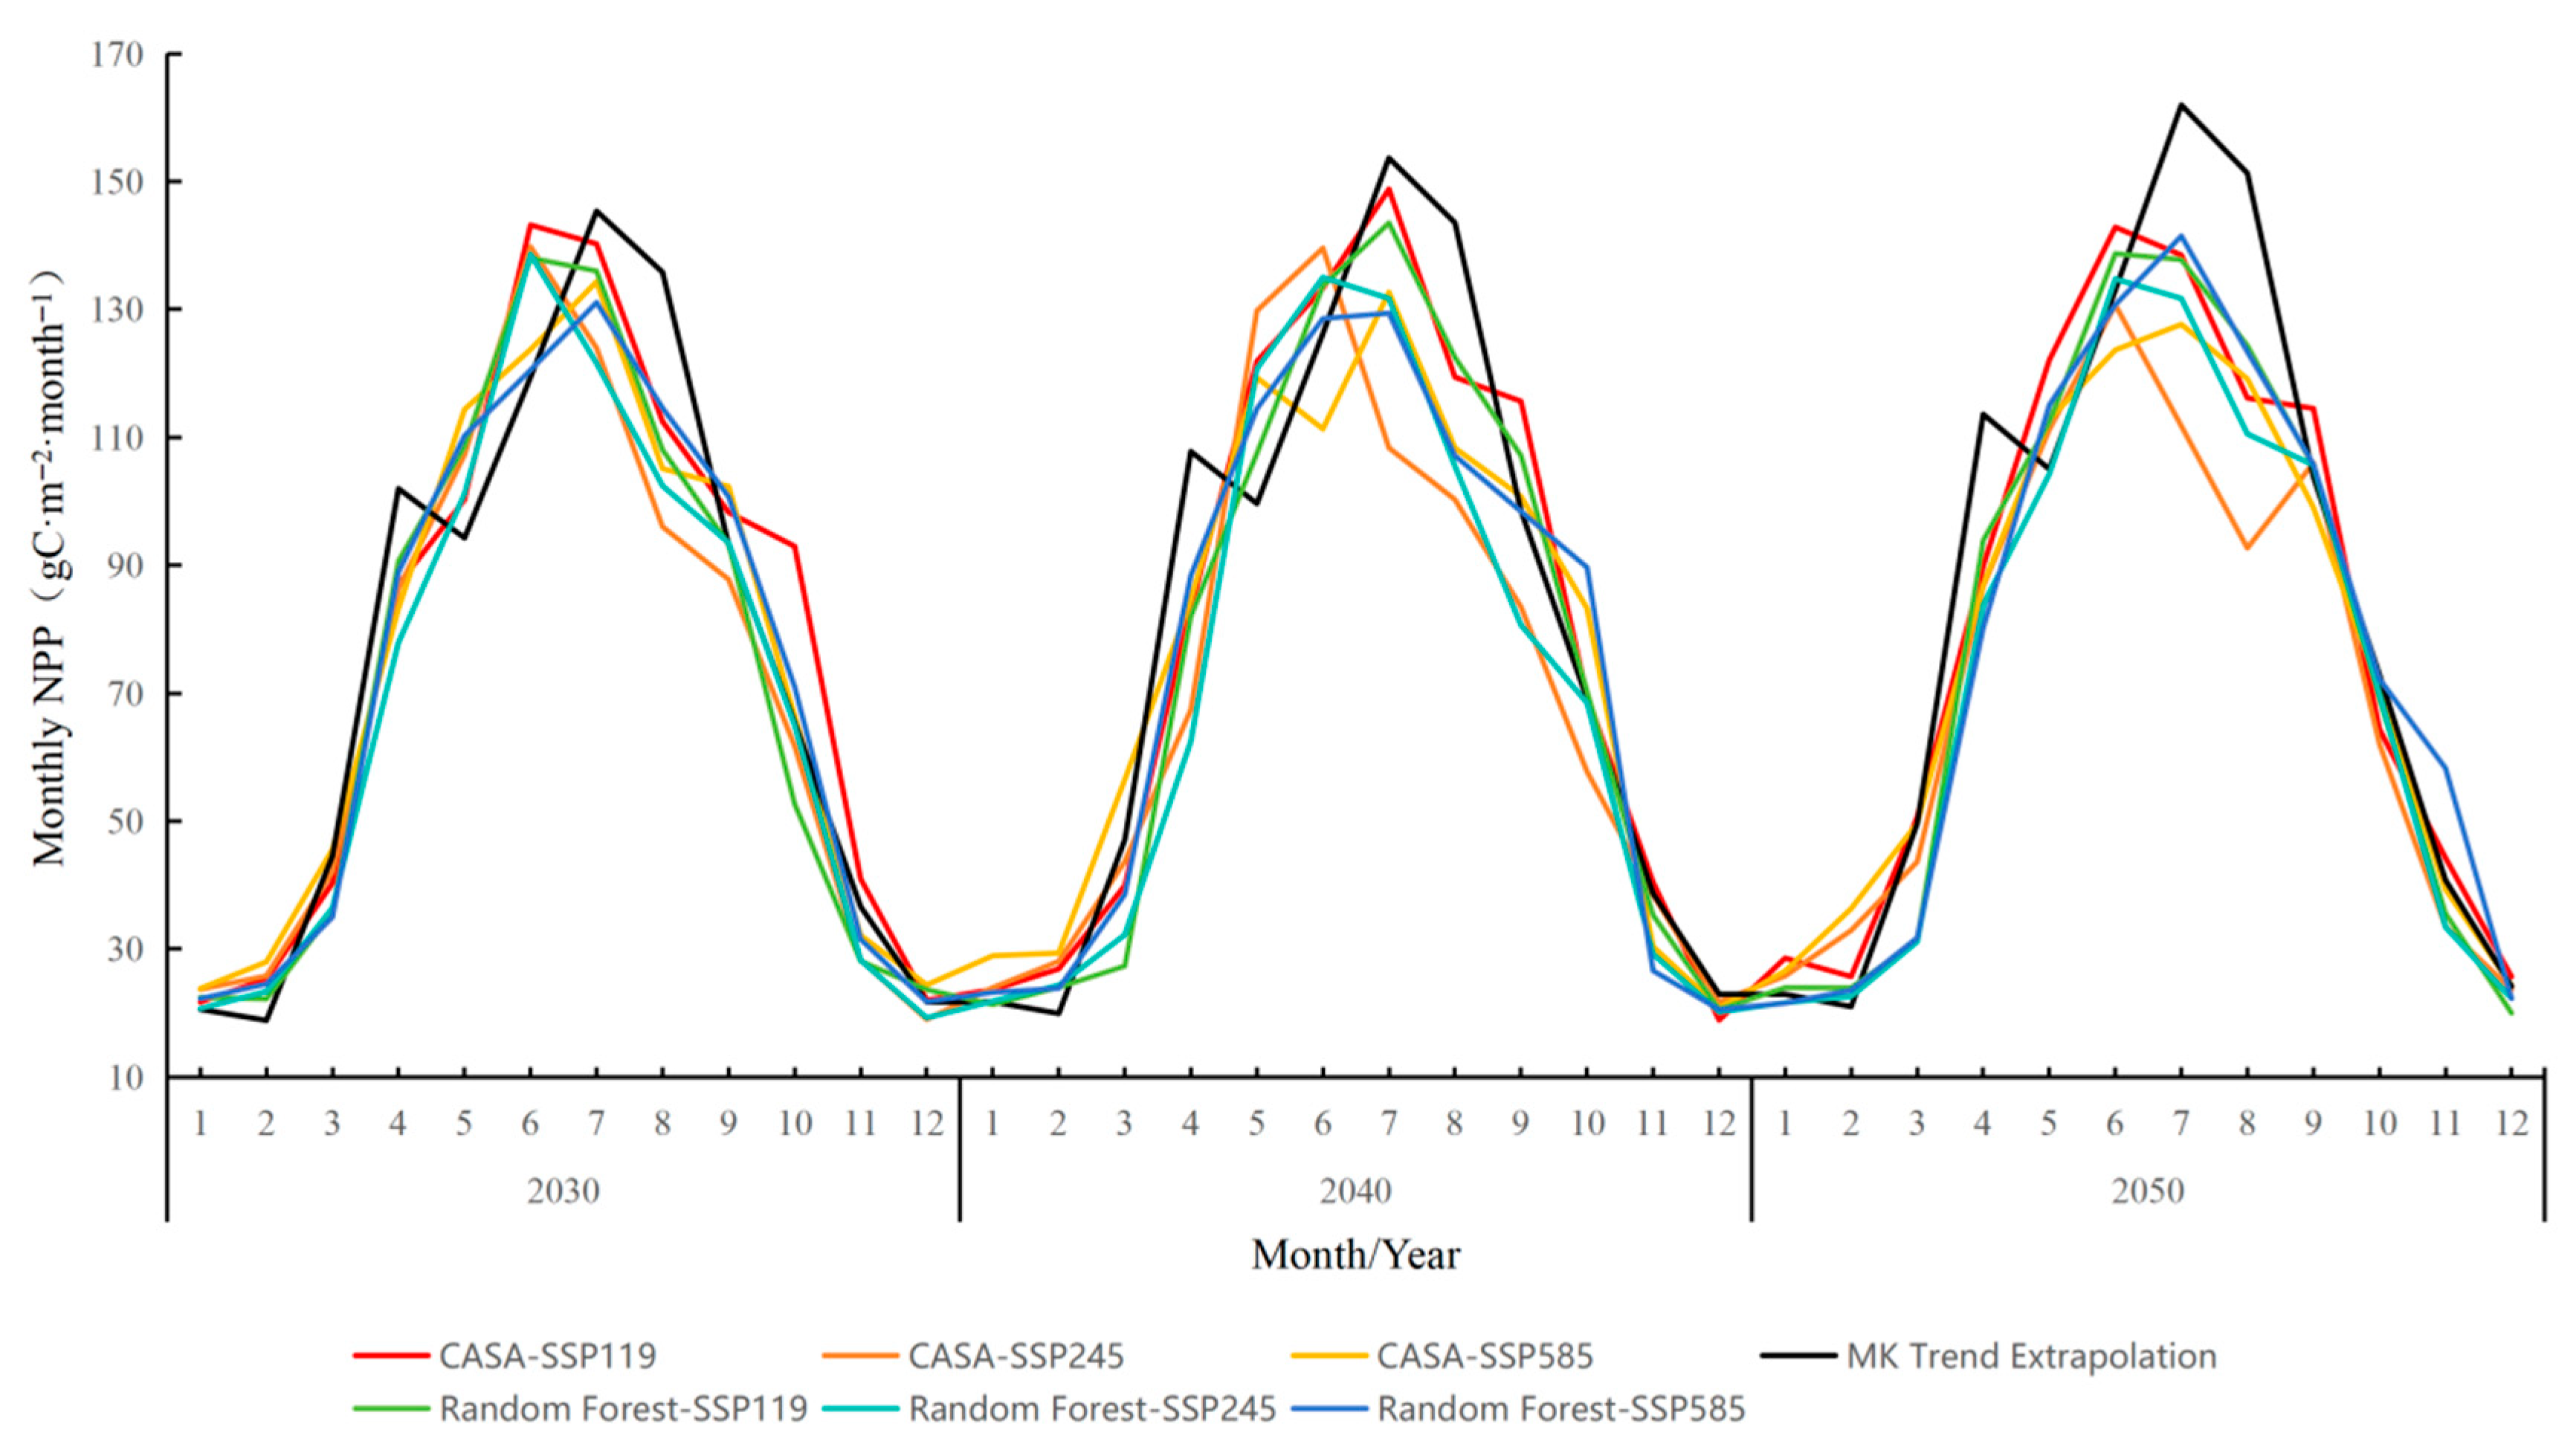

Disclaimer/Publisher’s Note: The statements, opinions and data contained in all publications are solely those of the individual author(s) and contributor(s) and not of MDPI and/or the editor(s). MDPI and/or the editor(s) disclaim responsibility for any injury to people or property resulting from any ideas, methods, instructions or products referred to in the content. |
© 2026 by the authors. Licensee MDPI, Basel, Switzerland. This article is an open access article distributed under the terms and conditions of the Creative Commons Attribution (CC BY) license.