


Abstract
The risks associated with hazardous materials (HazMat) transportation exhibit typical characteristics of chain-like distribution, spatiotemporal regularity, and individual heterogeneity. A personalized trip-chain feature spectra recognition framework for HazMat vehicles is proposed to enhance the capability to assess and analyze individual risks using vehicle positioning data. The proposed framework addresses the challenges of deriving personalized risk feature maps arising from missing real-time trajectory data, complex sub-trip-chain segmentation, and the extraction of personalized risk feature representations. An improved conditional Wasserstein Generative Adversarial Network (WGAN) model is initially developed to impute trajectories with missing positional data, and it can robustly reconstruct trajectories with large-scale missing segments by integrating a multi-head self-attention mechanism and a gradient penalty. A two-layer clustering algorithm, K-Means-multiplE-THreshOlds-adaptive-DBSCAN (KMETHOD), which combines an adaptive mechanism with threshold rules, is subsequently designed to identify the dwell time and related spatial attributes of dwell points along vehicle trips. A BERT-based model is incorporated to filter Points of Interest (POIs) around dwell points, which enables the extraction of their detailed location semantics and trip characteristics and thus supports trip chain identification and segmentation. A threshold-activated multilayer trajectory feature-map method (TAFEM) is constructed to generate feature maps for each trip chain. The Liquefied Natural Gas (LNG) transportation trajectory data from Guangdong Province is selected to evaluate the effectiveness of the proposed methods. The experimental results demonstrate that the proposed framework can effectively identify trip chains and generate their corresponding feature maps. The trajectory imputation model achieved the Mean Absolute Error (MAE), Mean Absolute Percentage Error (MAPE) and Dynamic Time Warping (DTW) of 2.34–3.33, 6.05–7.74, and 0.74–1.21, respectively, across different missing-rate scenarios, outperforming other benchmark models. The identification accuracy of dwell-point duration and location reaches 98.35%. The BERT-based method achieves a maximum accuracy of 92.83% in origin–destination (OD) point recognition, effectively capturing comprehensive trip-chain information. TAFEM accurately characterizes the spatiotemporal distribution and potential causal factors of personalized HazMat transportation safety risks, providing a reliable foundation for risk identification and safety management strategies.
1. Introduction
1.1. Background
Hazardous materials (HazMat) transportation plays an irreplaceable role in modern socioeconomic activities and industrial-chain operations, and its operational efficiency directly affects the stability of the entire supply chain. Due to the intrinsic characteristics of the transported substances, HazMat transport accidents can lead to severe casualties, substantial property losses, and environmental contamination. Although road HazMat transportation accidents account for only a small proportion of total traffic accidents, their consequences tend to be far more serious than those of ordinary freight transportation [1], making HazMat transport a critical focus of traffic operation management. In particular, improper loading and inadequate cargo securing substantially elevate the risks associated with HazMat transport, thereby underscoring the critical importance of implementing rigorous safety inspection measures throughout the entire transport process [2]. Despite the widespread use of onboard sensors in many countries to monitor the real-time operating status of HazMat vehicles, the utilization efficiency of these data remains low, and most management measures are still reactive rather than proactive. Meanwhile, HazMat transportation typically features small shipment volumes, relatively fixed origin–destination pairs, and stable transport routes. Although driving styles vary across drivers, the temporal and spatial patterns of completing each segment of the trip tend to be consistent. If continuous trajectory data can be used to characterize individualized vehicle operating patterns from a spatiotemporal perspective and to extract differentiated trip-chain feature spectra, these insights can support the formulation of proactive control measures and enhance the safety and efficiency of each segment of the transport process. Therefore, a recognition framework for differentiated trip-chain feature spectra of hazardous materials transport vehicles is both necessary and of significant practical value.
The operation of HazMat vehicles is subject to stringent spatial constraints and industry-specific regulations [3]. For example, drivers must be bound to designated vehicles and comply with statutory limits on continuous driving time. HazMat transport vehicles must follow prescribed routes and stop only at designated locations. However, even under these constraints, substantial variability may still arise during the execution of individual transport orders, including differences in trip completion time, road traffic risk exposure, and driver behavior. These variations lead to heterogeneous risk levels across different trip executions. It is therefore necessary to distinguish subsegments within the trip chain and mine risk feature maps from extensive historical operational data, which can be utilized to accurately capture the personalized risk characteristics of HazMat trip chains.
Due to the special nature of the transported materials, HazMat transportation typically exhibits highly patterned operational characteristics, where cargo origins and consignees are relatively fixed, and the loading, unloading, and transport processes remain consistent across orders. Under such conditions, Global Navigation Satellite System (GNSS) positioning data, which can be obtained from Global Positioning System (GPS), BeiDou, Galileo, and other systems installed on HazMat vehicles by regulatory authorities, can be used to analyze trip-specific risks and generate a feature map. However, although GNSS is widely adopted for monitoring HazMat vehicles, the data transmission interval is generally 10–30 s to reduce communication and storage overhead. Such data can describe general operational states, but are insufficient for accurately depicting fine-grained operational risks [4]. Moreover, communication interruptions, device inaccuracies, and signal drift in complex traffic environments often lead to missing or abnormal trajectory points. Because HazMat transport routes are typically long and constrained to fixed corridors, these issues are particularly pronounced in such scenarios. Missing data not only impede the extraction of operational patterns, but may also directly undermine the reliability of risk modeling.
HazMat transportation often follows a single-origin pickup, multi-destination delivery pattern, which exhibits pronounced trip-chain characteristics. Given the long travel distances involved, vehicles commonly make multiple intermediate stop points, such as en-route unloading or temporary parking. Conventional dwell-point detection methods generally rely on geometric or temporal thresholds. Although these methods can identify the locations where vehicles remain stationary, they are unable to determine whether such dwell points are operationally relevant to the specific transport task. Consequently, approaches that lack domain knowledge frequently misclassify short-term or incidental stops as true origin–destination (OD) points. Such misclassification not only obscures the structure of trip-chain extraction but also reduces the specificity and interpretability of subsequent risk assessments. Another common approach is to infer operational dwell points based on surrounding Points of Interest (POIs). However, the nearest POI does not necessarily correspond to the functional purpose of the dwell event. Existing matching algorithms often struggle to differentiate among facilities with distinct operational roles, such as gas stations, warehouses, and dedicated HazMat loading/unloading sites, when linking facility categories to dwell points. Recent advances in text recognition and semantic feature enrichment offer promising solutions for enhancing POI extraction.
The precise and comprehensive control of HazMat transportation requires elucidating the transport patterns of specific vehicles. The trajectory feature map refers to a graph-based or vector-based representation of behavioral patterns, movement regularities, and risk distributions derived from multidimensional feature extraction and pattern analysis of trajectory data. It functions as a multidimensional “mapping” that characterizes integrated temporal–spatial–state–behavior patterns. Feature maps support large-scale travel pattern analysis and personalized route recommendation. Feature maps thus enable the transformation of discrete trajectory points and multi-source data into structured knowledge networks that reveal travel regularities and underlying risks. However, in the domain of HazMat transportation, such feature maps must further incorporate industry-specific characteristics and operational patterns to effectively support the management and control of HazMat transport processes.
1.2. Literature Review
1.2.1. Trajectory Imputation Methods
Due to communication interruptions, sensor limitations, and measurement noise, the trajectory data of HazMat transport vehicles often contain missing segments, which in turn impede accurate operational analysis and safety management. As a result, trajectory imputation has become a critical task. A wide spectrum of methods has been developed, spanning statistical modeling, deep learning, graph-based techniques, and tensor-completion frameworks. Although traditional time-series and predictive models remain widely used, hybrid approaches that integrate deep learning, such as Light Gradient Boosting Machine–Gated Recurrent Unit (LightGBM–GRU) and Seasonal Autoregressive Integrated Moving Average–Gated Recurrent Unit (SARIMA–GRU), with trajectory features (e.g., sampling interval, speed, and travel distance) have gained increasing attention for their ability to capture nonlinear temporal dependencies. By combining classical time-series modeling with residual-correction mechanisms, these models achieve high-precision imputation for missing ride-hailing trajectory data [5]. Furthermore, subsequence-to-sequence encoder–decoder architectures enhanced with spatiotemporal attention have been employed to reconstruct complete trajectory sequences. When jointly modeled with Kalman filtering, fine-grained covariance calibration further improves the accuracy and stability of trajectory reconstruction [6].
Deep learning methods have become increasingly prominent, particularly for handling complex missing-pattern challenges in HazMat transportation. One representative approach uses a Convolutional Neural Network (CNN)-based generator that takes as input the tensors constructed from the following-vehicle speed–headway relations and leading-vehicle trajectories. By incorporating an adversarial learning framework with a discriminator and a multi-objective loss function, this method enables accurate reconstruction of continuously missing trajectory segments across diverse missing scenarios [7]. Hybrid deep encoder–decoder architectures have demonstrated superior performance, achieving high-accuracy recovery of missing trajectories [8]. Conditional Generative Adversarial Network (cGAN)-based methods further exhibit advantages in maintaining spatiotemporal consistency during trajectory imputation [9]. Some studies transform sparse probe trajectories into spatiotemporal diagrams and feed them into a CNN-based encoder–decoder [10] to learn traffic-speed spatiotemporal dynamics and reconstruct full-section speed patterns; validation on Next Generation Simulation (NGSIM) indicates that satisfactory reconstruction can still be achieved at a 5% penetration rate, outperforming adaptive smoothing methods such as the Generalized Adaptive Smoothing Method (GASM), thereby supporting traffic state estimation and monitoring under low-observability conditions.
Following advanced methodological improvements, such as objective function design, regularization strategies, and coordinated architectural optimization, can be considered to address the key bottlenecks widely observed when applying Generative Adversarial Network (GAN) to vehicle trajectory imputation, namely unstable training, vanishing gradients, and mode collapse. A review of representative GAN variants and technical lineages, such as conditional modeling, distance-metric reconstruction, and regularization mechanisms, reveals that stabilizing training and improving generation quality have been the central themes driving the continuous evolution of this field [11]. For example, the Wasserstein distance [12] can be introduced into adversarial training to enhance convergence stability, while integrating Local Binary Pattern (LBP) texture features and TV loss strengthens texture fidelity and suppresses noise, which can mitigate instability and gradient vanishing in style-transfer tasks, thereby improving the recognizability and perceptual coherence of generated results. Variational autoencoders [13] may be incorporated into the adversarial framework to overcome the structural issue whereby discriminator dominance in adversarial games weakens generator gradients. When adversarial gradients approach zero, the VAE decoding pathway provides continuous and stable gradient compensation for the generator, alleviating gradient vanishing and improving convergence behavior and generative quality.
In trajectory and traffic spatiotemporal data imputation scenarios, GANs impose distribution-level constraints through their generate–discriminate mechanism, which enables the imputed segments to better match real data in terms of statistical properties and dynamic consistency. For example, to address long-segment missing data in car-following trajectories, external information such as the leading vehicle’s trajectory may be used as conditional input, and an adversarial module can be embedded into a convolutional imputation framework to enhance realism and robustness under large missing intervals [14]. Historical trajectory data can also serve as conditional inputs. For instance, Temporal Graph Convolutional Network (T-CGAN) [15] extracts conditional cues from historical trajectories to generate an initial trajectory, which is then used as a conditional input to a Conditional Generative Adversarial Network (CGAN) to guide the learning processes of both generator and discriminator. Combined with a GRU-based sequence model, this approach effectively handles irregular sampling and long missing spans, thereby improving the accuracy and robustness of trajectory imputation. For scenarios with high missing ratios, graph convolutional networks and GRUs [16] may be jointly used to explicitly model spatial topology and temporal dependencies. A dynamic multi-layer GAN can be designed to adapt to different missing levels and complex missing patterns, thereby maintaining strong generalization ability and stable imputation performance even under severe data loss conditions. Some studies have proposed a T-CGAN-based trajectory imputation framework [17], which constructs a directed graph on discrete spatiotemporal grids and employs Shape-Based Missing Trajectory Generation (SBMTG) to generate conditional trajectories via path optimization with a shape-based distance objective, thereby reducing redundant generations. Meanwhile, a GRU-based adversarial network is integrated to perform generative infilling for missing intervals, achieving high-precision, shape-constrained imputation and providing a research basis for trajectory recovery at single intersections and along consecutive intersections.
1.2.2. Trip-Chain Feature Analysis
HazMat transportation entails heightened traffic safety and environmental risks, which makes the accurate identification and classification of dwell points critical for effective supervision and risk prevention. However, dwell-point extraction methods commonly used in current practice, which rely solely on GPS trajectories, face several inherent limitations. GPS data are vulnerable to noise, drift, and irregular sampling intervals, often causing confusion between true operational dwell points and short-term temporary stops [18]. In addition, dwell behaviors do not necessarily correspond to HazMat-related operational facilities; some stops may reflect refueling or driver rest rather than loading, unloading, or transshipment activities [19]. Consequently, the determination of key locations within a trip chain, such as origins and destinations (ODs), based exclusively on vehicle speed or dwell-time thresholds is highly error-prone. Evidence from studies of heavy-duty trucks indicates that trajectory-based dwell features alone are insufficient for identifying true freight terminals. Contextual information from the road network and surrounding Points of Interest (POIs) must be incorporated for secondary verification [20]. Similar conclusions have been drawn in public-transport OD inference research, where the absence of semantic information related to stops and facilities significantly constrains inference accuracy [21]. Collectively, these findings underscore that GPS-only dwell-point identification is inadequate, highlighting the necessity of integrating richer semantic information in HazMat transportation scenarios.
Text-recognition and POI extraction techniques are increasingly applied in mobility analytics and spatial behavior modeling to improve the accuracy of dwell point classification. Deep learning-based road sign text recognition approaches [22] integrate extracted textual information with positional attributes, vehicle speed, and destination context to enhance scene understanding, which demonstrates the value of text recognition in contextual interpretation. Multi-source urban sensing frameworks that leverage street-view imagery, deep neural networks, and Optical Character Recognition (OCR) automatically extract text from urban environments to identify environmental elements and scene semantics. When jointly modeled with other spatiotemporal datasets, these frameworks enable fine-grained analysis of urban occupancy and mobility patterns [23] and support large-scale automated POI generation. Furthermore, multimodal fusion frameworks that combine textual and visual representations [24] have achieved high-accuracy POI semantic classification and refined scene discrimination. These advances suggest that text recognition and POI extraction can substantially enhance dwell point identification for HazMat transportation. By interpreting textual cues surrounding dwell locations, such as warehouse signage, industrial-park identifiers, or fuel-station markers, and integrating them with trajectory features, the operational relevance of dwell points to specific HazMat transport activities can be assessed with much greater reliability.
1.2.3. Feature Map Construction of Hazmat Transport Trip
HazMat transportation features high risk, operational complexity, and strong coupling among diverse factors. Constructing a comprehensive risk feature map requires not only characterizing vehicle operating behaviors but also integrating information on accident causation, spatial context, road conditions, and regulatory constraints. Traditional methods that rely on statistical modeling or single-source data are insufficient for capturing the multilayered and dynamic nature of HazMat transport risks [25]. With advances in knowledge graphs, spatiotemporal graphs, and semantic networks, the “graph” structures have increasingly been leveraged as key tools for complex traffic-system risk modeling and knowledge integration.
Knowledge graphs enable the structured representation of heterogeneous, multisource data for knowledge organization and information integration. For example, based on engineering specifications, inspection reports, and related textual data, deep learning-based extraction methods have been used to build a pavement knowledge graph, which demonstrates strong potential for infrastructure management applications [26]. Related work in the traffic domain integrates structured accident databases with unstructured accident reports, extracting core traffic entities and their relationships using natural language processing. The constructed traffic accident knowledge graphs systematically represent associations among accident factors, roadway environments, and safety risks, which support semantic querying and analysis [27]. Such studies highlight the potential of graph structures to transcend the limitations of traditional databases and provide a theoretical and technical foundation for constructing multi-factor risk-feature spectra in HazMat transportation.
Graph-based methods also show strong capabilities in causal relationship modeling. The integrated spatiotemporal-graph and knowledge-graph methods for maritime-traffic analysis have been used to reveal event propagation paths across time and space [28]. Urban traffic knowledge graph systems have been applied to traffic flow modeling and intelligent mobility services, demonstrating the usefulness of graph-based knowledge integration in complex traffic environments [29]. Based on higher-order network theory, a HazMat-transport accident causal network has been developed to characterize causal relationships among human, vehicle, road, environmental, and material attributes. This network reveals influential risk factors and their interactions, indicating the critical roles of HazMat categories, transport quantities, driver behaviors, and road conditions in accident evolution, and providing a basis for shifting from post-event response to proactive prevention [30]. In addition, Bayesian-network-based reasoning models [31] demonstrate strong causal-inference capabilities for highway safety risk assessment by building causal structures across personnel, equipment, environment, and management dimensions. These models enable probabilistic risk inference and scenario analysis under uncertainty, offering quantitative support for safety evaluation and preventive decision making.
The integration of graph representations and deep learning further advances traffic prediction and safety management. Knowledge graph embedding-based traffic flow prediction frameworks [32] have achieved notable improvements in predictive accuracy. These developments collectively demonstrate that combining graph embeddings with semantically enhanced modeling not only advances dynamic traffic prediction but also enables a more comprehensive depiction of the spatial, temporal, and facility-related distributions of HazMat-transport risk feature maps.
1.2.4. Research Gaps
Although existing studies have extensively examined freight logistics characteristics, including those of HazMat transportation, several limitations remain. (1) When using the most readily available GNSS data to analyze transportation characteristics, missing data often lead to inaccurate analytical results. Current algorithms exhibit low interpolation accuracy or poor training stability when completing missing trajectory points, particularly in cases of large-scale data gaps. Insufficient and inaccurate trajectory information makes it difficult to precisely capture the transportation characteristics of hazardous materials. (2) The risk associated with each trip sub-chain in HazMat transportation is continuously affected by dynamic factors such as cargo load and external environmental conditions. However, it remains challenging to distinguish temporary stops from key trip dwell points based solely on trajectory data, which makes the HazMat trip-chain information difficult to extract. (3) There are a lack of effective approaches for representing the spatiotemporal characteristics of HazMat trip data. Consequently, analyses of factor contributions and the mining of latent features remain insufficient.
1.3. Motivation and Contributions
The motivation of this research is to develop a recognition framework for personalized trip chain feature maps of hazardous materials transport vehicles. The major contributions are listed as follows: (1) A conditional Wasserstein Generative Adversarial Network model with Gradient Penalty (WGAN-GP) is designed to impute HazMat transport-vehicle trajectories under large-scale trajectory missingness, frequent GNSS drift, and unstable model training problems. This model captures the irregular operational characteristics of HazMat vehicles and enables efficient and accurate reconstruction of incomplete driving trajectories. (2) A trip chain recognition algorithm that integrates a multi-threshold adaptive clustering approach with a large language model is proposed to resolve the difficulty in identifying trip chain structures and distinguishing temporary stops from key trip dwell points. (3) A Threshold-Activated Feature Encoding Map (TAFEM)-based risk feature map generation method is developed to tackle the lack of clarity regarding the contributing factors of personalized trip chain features. The proposed method systematically characterizes trip-chain features, quantifies influencing factors, and enables comprehensive modeling of HazMat transportation feature maps.
The remainder of this research is organized as follows: Section 2 outlines the overarching research framework and introduces the logical structure guiding the entire study. The conditional WGAN-GP trajectory imputation methodology is presented in Section 3, demonstrating how the reconstructed trajectories provide a complete and coherent dataset for subsequent analytical tasks. Section 4 details the dual-layer clustering mechanism together with a POI semantic BERT model, which jointly support accurate identification of origins, destinations, and key trip-chain feature points. Section 5 then elaborates on the TAFEM-based trajectory feature-map construction procedure, illustrating how temporal–spatial variations of trip-chain attributes are systematically represented. The proposed methodology is validated using the LNG transportation trajectory data from Guangdong, China in Section 6, which demonstrates its effectiveness and robustness. Section 7 concludes the paper and discusses potential directions for future research.
2. Framework
Three critical challenges must be addressed to derive the characteristic spectrum of hazardous materials (HazMat) transport risk. (1) During transport operations, trajectory data are frequently missing due to occlusion, signal interference, and complex environments, rendering it impossible to extract vehicle operating features for the corresponding periods. (2) HazMat transport vehicles may present multiple operational types within a single trip, such as “single-receive–multi-deliver” and “single-receive–single-deliver.” As the carried cargo volume differs across trip segments, the associated risk characteristics also vary considerably. It is therefore essential to accurately identify the complete trip chain and the origin–destination points of each sub-chain, so that the operational properties of each sub-trip can be precisely characterized. (3) Although HazMat transport processes exhibit strong regularity, randomness remains in driver behavior, traffic conditions, and surrounding environments. An effective method is thus required to recognize the characteristic spectrum of each sub-trip chain.
The following methodological framework is then developed to effectively resolve these issues. (1) Leveraging the fact that trip trajectories and road environments exhibit inherent structural patterns, a conditional Wasserstein Generative Adversarial Network (WGAN) model is constructed. The generator learns from large-scale historical trajectory features to synthesize imputed data, while a multi-head attention mechanism is introduced to capture latent associations embedded in high-dimensional trajectory sequences. The following modifications are introduced to improve the robustness, efficiency and accuracy of the model: (a) The classifier in the original GAN is replaced with a discriminator; (b) an auxiliary loss term is incorporated when computing the Wasserstein distance between imputed and real trajectories; and (c) a gradient penalty (GP) is employed during optimization to jointly enhance imputation precision and efficiency. (2) Trajectory points typically cluster densely around stopping locations. A two-level clustering algorithm, KMETHOD, is proposed to mitigate the misclassification of low-speed or temporary stops by traditional algorithms. It integrates an adaptive mechanism and threshold rules, employs Bayesian optimization to search for the optimal DBSCAN parameters, and removes noise to identify valid vehicle stopping points. By further integrating surrounding POI information, a BERT-based semantic recognition model is applied to extract facility types relevant to HazMat transport. Combined with trip information, the proposed approach can identify the origins and destinations of trip chains and partition complete trips into sub-trip segments. (3) After the sub-trip segments are determined, a Threshold-Activated Feature Encoding Map (TAFEM) is proposed to reveal the operational patterns of each segment. By extracting segment-specific trajectory features, encoding the associated attributes, and identifying nodes with significant feature shifts, a multi-feature map representing the characteristic spectrum of the trip chain is constructed.
In summary, the proposed analytical framework achieves high-precision and efficient trajectory data completion through generative imputation, identifies trip chains and sub-trip segments via two-level clustering and textual semantic recognition, and derives personalized characteristic spectra through multi-feature extraction. The framework integrates strengths from both deep learning and traditional analytical approaches. The overall architecture is illustrated in Figure 1.
Figure 1.
Research framework.
3. Vehicle Trajectory Imputation Module
3.1. Module Design for Vehicle Trajectory Imputation
As shown in Figure 2, the trajectory imputation module is designed based on a Conditional Wasserstein Generative Adversarial Network with Gradient Penalty (Conditional WGAN-GP), which consists of two components: a generator and a discriminator. The generator integrates a multi-head self-attention mechanism with a BiGRU encoder to overcome the bias and distortion that traditional approaches often exhibit when imputing large-scale missing trajectory segments. This architecture effectively captures both long-range temporal dependencies and local dynamic variations in historical data (i.e., conditional inputs), which enables the generation of more accurate initial imputed trajectories. The refinement of the imputed trajectories is completed by the discriminator, which replaces the classifier in traditional generative models. In the discriminator, the conventional Jensen–Shannon divergence is substituted with the Wasserstein distance. Auxiliary loss functions, such as reconstruction loss and velocity-smoothing loss, are incorporated to quantify distributional discrepancies between real and generated trajectories. A gradient penalty (GP) is also introduced to enhance the stability of training and to ensure that the imputed trajectories adhere to physical constraints regarding spatiotemporal continuity and vehicular motion patterns.
Figure 2.
Architecture of the trajectory imputation module.
Compared with traditional trajectory imputation methods that rely on local imputation or simple sequential models, conditional WGAN-GP achieves realistic and physically plausible HazMat vehicle trajectory imputation through four core mechanisms: the multi-head attention mechanism, the Wasserstein adversarial mechanism, the gradient penalty, and the auxiliary loss functions. Through adversarial learning and the conditional generation paradigm, conditional WGAN-GP produces complete trajectories that remain consistent with historical patterns and environmental constraints while exhibiting greater smoothness and structural fidelity. The incorporation of the gradient penalty enhances training stability and prevents mode collapse, ensuring that the imputed results more closely match real transport behaviors in terms of speed, acceleration, and spatial trajectory form. Consequently, the proposed model significantly improves the accuracy and reliability of trajectory imputation.
3.2. Trajectory Generator
The trajectory generator in the trajectory imputation module is designed to take partially observed trajectories, external conditional information, and random noise as inputs. The generator completes the missing segments of the trajectory and produces physically plausible full trajectories that are consistent with transport environment characteristics by learning the temporal dependencies embedded in trajectory sequences. The generator first employs a BiGRU (Bidirectional Gated Recurrent Unit) to perform temporal modeling of the trajectory sequence, which can capture both forward and backward dynamic patterns and extract local temporal dependencies. The BiGRU is an extension of the GRU architecture that processes sequence data in both forward and backward directions, thereby enhancing performance in temporal modeling tasks. Compared with a conventional unidirectional GRU, a BiGRU can simultaneously capture bidirectional temporal dependencies and richer contextual information, which enables superior performance when dealing with long or structurally complex sequences. A multi-head self-attention mechanism is also introduced into the generator of the proposed trajectory imputation module to further enhance its ability to model global dependencies across the trajectory. This mechanism employs multiple parallel attention heads to learn inter-point dependencies within different subspaces, enabling simultaneous focus on both local and global temporal patterns. The dynamic variations in vehicle operational states can be captured more comprehensively through this design. Compared with models that rely solely on recurrent structures, the multi-head self-attention mechanism substantially improves the continuity and realism of imputed trajectories, ensuring that the generated trajectories exhibit more realistic spatial geometry and speed evolution consistent with actual transport behavior.
In the proposed module, the generator receives the observed trajectory with missing data , external conditional features , and random noise to construct the input space for trajectory generation. A BiGRU encoder extracts temporal dependency features , and the conditional vector is mapped into an embedding space and fused with noise to obtain a condition-modulated representation of . The decoder then predicts the missing trajectory points based on and generates the complete trajectory, achieving smooth spatiotemporal completion. This process is formulated in Equations (1)–(4).
where denotes the generated complete trajectory; represents the partially observed trajectory; is the generator; is the discriminator; is the conditional vector (including vehicle type, road classification, temporal period, POI semantic features, etc.); denotes the random noise vector; represents the temporal dependency features extracted by the encoder; denotes the temporal feature extraction module based on the BiGRU structure; is the embedded conditional vector; represents the condition modulation function that performs feature scaling and shifting for conditional fusion.
3.3. Optimization of Imputed Trajectories
We replace the classifier in the original GAN architecture with a discriminator and incorporate the Wasserstein adversarial mechanism within the discriminator to ensure that the initially imputed trajectories exhibit a statistical distribution close to that of the real trajectories. In the proposed Conditional WGAN, the optimization objective substitutes the Jensen–Shannon divergence with the Wasserstein distance to quantify the discrepancy between the generated and real distributions. This substitution provides the loss function with continuous differentiability and substantially improves training stability and convergence. During trajectory optimization, a gradient penalty (GP) is further introduced to enforce the 1-Lipschitz constraint on the discriminator. By constructing imputed samples between real and generated trajectories, the GP term penalizes deviations of the discriminator’s gradient norm from 1, thereby effectively suppressing gradient explosion and overfitting, and enhancing the convergence speed and stability of the adversarial training process.
Although the interaction between the generator and discriminator can approximate the ground-truth trajectory distribution during adversarial learning, the generated trajectories may still exhibit physical discontinuities or lack smooth motion characteristics. As shown in Equations (5)–(7), the proposed model introduces additional auxiliary losses alongside the adversarial loss to enhance physical plausibility and trajectory continuity, including a reconstruction-consistency loss and a smoothness-regularization loss.
where denotes the reconstruction loss, represents the state of the real trajectory at time step , denotes the state predicted by the generator. corresponds to the smoothness loss, represents the trajectory velocity at time step , denotes the overall optimization objective of the generator, while and are the weighting coefficients for the reconstruction and smoothness losses, respectively.
4. Trip Chain Identification Module
4.1. Module Design for Trip Chain Identification
HazMat transport vehicles typically exhibit prolonged stopping behaviors at loading and unloading locations corresponding to the origins and destinations of transport orders. Because these extended dwell periods provide a salient feature for potential stop identification, spatial clustering can be employed to extract candidate dwell points. Thus, a two-layer clustering model incorporating an adaptive mechanism and threshold-based filtering is developed to efficiently and accurately identify the valid dwell points. These designed mechanisms help the proposed model further eliminate disturbances caused by short-term temporary stops and trajectory drift. Subsequently, a large language model (LLM) is introduced to extract HazMat-related contextual information from the surrounding Points of Interest (POI) and to characterize each key dwell point within the trip chain. Specifically, we feed the POI textual fields retrieved from online map services (POI name, category, and address) into an LLM to perform semantic identification and categorization of areas surrounding the trajectories. The key dwell points include the origin, destination, and cargo off-loading locations within a trip. The complete trip chain of a HazMat transport vehicle can then be determined based on the sequence of identified origins, destinations, and unloading points, thereby establishing a robust basis for constructing a detailed trip-chain profile. The identification procedure is summarized in Figure 3.
Figure 3.
Architecture of the trip chain identification module.
4.2. KMETHOD Algorithm
A two-layer clustering algorithm termed KMETHOD is developed to accurately identify valid dwell points within hazardous materials (HazMat) transport trips. The KMETHOD algorithm is built upon the conventional DBSCAN (Density-Based Spatial Clustering of Applications with Noise) framework and integrates threshold-based filtering rules and adaptive parameter tuning to enhance the precision of dwell-point detection. The algorithm first employs an improved DBSCAN procedure to extract candidate dwell points, with parameters optimized by a dynamic Bayesian optimization strategy. The clustering output of the adaptive DBSCAN is subsequently refined using multiple thresholding rules and K-Means clustering to remove false dwell points, thereby ensuring accurate identification. The overall structure of the KMETHOD algorithm is illustrated in the first half of Figure 3.
DBSCAN is capable of detecting locally dense clusters of trajectory points, which is well-suited for extracting dwell points of HazMat vehicles. The algorithm effectively eliminates noise points generated by short stops, red-light waiting, and other transient behaviors. Two key parameters must be specified: the neighborhood radius ε and the minimum number of points MinPts. The ε-neighborhood refers to the set of neighboring points within radius ε, while MinPts denotes the minimum number of points required within this neighborhood.
Parameter selection has a significant impact on clustering accuracy. Therefore, an adaptive parameter search mechanism is incorporated, wherein Bayesian optimization is used to dynamically identify optimal values, with the Silhouette Coefficient serving as the evaluation metric. The optimization process consists of: (1) computing the Silhouette Coefficient under different parameter configurations; (2) selecting parameter sets that yield coefficients approaching 1, which indicates superior clustering quality; and (3) iteratively refining parameter values. The optimized parameters are then applied to perform spatial clustering on temporally ordered trajectory data with missing values removed, resulting in the determination of the optimal cluster count K.
Although the improved DBSCAN algorithm can effectively detect aggregated trajectory points, it may still yield a substantial number of false stops. Three filtering rules based on a speed threshold, a time threshold, and a distance threshold are introduced in the KMETHOD algorithm to extract valid dwell points in HazMat transport processes with higher precision. The speed threshold is designed to include points where the non-zero velocity arises from trajectory drift around the ground-truth dwell location, which must be set to a value greater than zero. The time threshold further removes stop events caused by temporary rest or traffic congestion. Since loading and unloading operations typically take longer than temporary stops such as refueling, this threshold is set to approximately 10% below the minimum loading/unloading duration. The distance threshold removes spatial variations caused by red light waiting and determines whether two dwell points should be merged. The integration of these three thresholds substantially reduces false detections and improves the reliability of dwell-point identification.
4.3. Trip Chain Identification and Sub-Chain Segmentation
The dwell points of HazMat transport vehicles identified through the KMETHOD algorithm cannot be directly mapped to specific locations using latitude–longitude information. If we simply match the nearest Point of Interest (POI) to the dwell point, it often leads to misclassification due to semantic irrelevance or geographic noise. A BERT (Bidirectional Encoder Representations from Transformers)-based model is adopted to understand and classify the semantic content of POI information to obtain accurate origins and destinations of HazMat transport trips. This enables the selection of the most representative location description for each dwelling point. Compared with traditional text classification methods, such as TextCNN or LOTClass, BERT leverages multilayer transformer structures to capture contextual semantic dependencies, achieving stronger language understanding and higher semantic discrimination accuracy. It is therefore particularly suitable for identifying critical semantics associated with HazMat transport.
After obtaining high-confidence POI labels for the identified dwell points, the BERT model is also used to classify their functional attributes within the trip chain according to their POI characteristics. In this study, the POI texts retrieved within the spatial buffer of each dwell point (including fields such as POI name, category, and address) are used as inputs. A Chinese pretrained BERT model (bert-base-chinese) is adopted as the text encoder, and a lightweight classification head is attached to the semantic representation to perform POI category discrimination and semantic normalization, thereby selecting the POI semantic label that best matches the function of the dwell point. For example, in LNG transport, trip origins are often associated with LNG terminals or energy bases, whereas intermediate unloading points or destinations commonly correspond to factories or LNG refueling stations. Based on POI semantics, the dwell points can be further categorized into origins, unloading points, and destinations, thereby enabling reconstruction of the complete trip chain. According to their structural properties, trip chains can be divided into simple chains and complex chains. Simple chains typically represent linear transportation processes directly from origin to destination, without intermediate dwell points. In contrast, complex chains exhibit pronounced multi-stage operational characteristics, including multiple intermediate stops, nested sub-chains, and local detours, and their trajectory patterns correspond closely with the POI types identified.
5. Personized Trip Chain Feature Map Module
5.1. Module Design for Personized Trip Chain Feature Map Construction
To construct a personalized trip chain feature map for HazMat transport vehicles, three essential issues must be addressed: determining the trip attribute system for the feature map, designing both the feature encoding mechanism and threshold determination, and developing a multidimensional trip chain feature mapping method. The risk associated with HazMat transport is inherently dynamic and influenced by multiple interacting factors. Heterogeneity across sub-trip segments, such as variations in the probability of risk occurrence, transported HazMat quantity, and surrounding environmental conditions, leads to significant differences in potential risk losses. As a result, static, single-dimensional, or difficult-to-obtain indicators are insufficient to support dynamic risk characterization and full-process management. Accordingly, the construction of a risk indicator system must capture real-time variations in risk levels, support the identification of risk probabilities under different operational contexts, and incorporate the severity of risk consequences. On this basis, composite risk indicators can be developed. A Threshold-Activated Feature Encoding Map (TAFEM) is then developed to further analyze personalized risk across the trip-chain segments. Unlike conventional static visualization methods that rely on feature normalization, TAFEM adopts a “threshold activation–feature event encoding–map representation” paradigm to achieve unified spatiotemporal visualization of multisource trajectory features.
TAFEM can transform continuous features into discrete behavioral events, thereby enabling high-dimensional integration and the expression of vehicle operating mechanisms. The application of TAFEM to the construction of HazMat transport trip chain feature maps consists of three steps. (1) Construction of a personalized trip chain risk indicator system. Based on risk characterization principles, indicators are categorized into risk probability indicators and risk loss indicators, where risk loss indicators include both external and internal risk loss measures. These indicators jointly support the formation of composite risk metrics. (2) Data encoding and adaptive threshold determination. The normalization of the chosen data is required to accurately represent heterogeneous multidimensional features. Because the risk feature map only reflects feature events that exert a significant influence on risk, only those indicators exceeding a specific threshold need to be visualized. An adaptive threshold calibration mechanism is therefore necessary across all feature dimensions. (3) Construction of the personalized trip chain risk feature map. The feature map of the trip chain can be generated by representing indicators that exceed the threshold according to their temporal or spatial relationships. In summary, the architecture for constructing the personalized trip chain risk feature map for HazMat transport vehicles is illustrated in Figure 4.
Figure 4.
Architecture of the personized trip chain feature map module.
5.2. Trip Chain Risk Feature Indicator System
In the risk theory, risk is the possibility of something bad happening, comprising uncertainty about the effects and implications of an activity. Thus, the trip chain risk feature indicator system should be divided into two categories: indicators describing the probability of risk occurrence and indicators representing the potential consequences associated with risk events. In the context of HazMat transport, the probability of risk occurrence is primarily influenced by risky driving behaviors (e.g., speeding, fatigued driving, frequent acceleration or deceleration) and adverse road conditions (e.g., complex road geometry, low road class, and traffic congestion). Accordingly, six indicators are selected to characterize risk probability: over speeding value, vehicle speed standard deviation, driving duration, road alignment complexity, road level, and traffic status. Factors influencing the potential consequences include internal elements such as the vehicle’s current kinetic energy and the consequences of hazardous material leakage, as well as external elements such as surrounding population density. Therefore, three indicators are selected to describe these aspects: vehicle kinetic energy, hazardous material category, and surrounding POI density. The calculation methods for each indicator are summarized in Table 1.
Table 1.
Featured indicators for chain risk assessment.
Here, denotes the maximum speed limit at the -th trajectory point, denotes the heading angle at the -th trajectory point; represents the positioning timestamp of the i-th trajectory point; represents the vehicle speed at the -th trajectory point; denotes the speed standard deviation; denotes the number of POI points within a 100 m radius centered at the -th trajectory point, and denotes the area within a 100 m radius centered at the -th trajectory point.
The thresholds in Table 1 were primarily determined through empirical calibration based on the HazMat-transport-related data. Because the operating characteristics of HazMat transport exhibit pronounced regional heterogeneity and context dependence, directly applying fixed thresholds may lead to threshold mismatch and biased risk stratification. Therefore, we selected the thresholds adaptively according to the statistical distributions of our data.
5.3. Data Encoding and Adaptive Threshold
TAFEM employs a data-distribution-based adaptive threshold discrimination mechanism. For each type of feature, a quantile-based threshold is calculated for the selected segment. When a given feature value exceeds its corresponding threshold, it is identified as a “behavioral event.” The event intensity is normalized to the interval [0.5, 1.0] through a linear mapping function to quantify the degree of abnormality. Features exhibiting abnormal values are then visually annotated according to the magnitude of their deviations. The threshold definition is given in Equation (8), the threshold discrimination rule in Equation (9), the abnormal-event intensity function in Equation (10), and the marker-size calculation in Equation (11).
where denotes the selected category of feature; represents the quantile of the absolute values of the selected feature; denotes the minimum lower bound of the threshold to prevent excessively small thresholds that may result in numerous false events; denotes the value of the -th feature at the -th trajectory point, with the corresponding threshold denoted as ; represents the threshold triggering indicator for the -th feature at the -th trajectory point; represents the event intensity function of the -th feature at the -th trajectory point, with ; denotes the visualization marker size when the -th feature at the -th trajectory point triggers the threshold, where and correspond to the minimum and maximum marker sizes used in visualization; and is a small constant introduced to avoid division by zero.
A weighted linear combination is then employed to integrate the risk probability indicators and risk-consequence indicators to obtain a more intuitive comprehensive risk score for the road segment and to quantitatively characterize the overall risk level of the hazardous materials transport trip chain. The comprehensive risk indicator can be calculated by Equations (12) and (13).
where denotes the comprehensive risk indicator; represents the normalized risk intensity of the -th feature, which is numerically equivalent to the abnormal-event intensity function ; denotes the weight coefficient assigned to the corresponding indicator.
The weight coefficients for all indicators should be calibrated according to specific management requirements. As this study focuses on validating the spatiotemporal heterogeneity and abnormality clustering characteristics of different risk factors within the trip chain, the detailed weight calibration will be addressed in future work. In the present study, an equal-weight assumption is adopted in the computation of the comprehensive risk indicator, so that all indicators contribute uniformly under the same normalized scale, thereby avoiding subjective bias and highlighting the intrinsic abnormal information in the data. Accordingly, is selected as the weight.
5.4. Generation of TAFEM-Based Feature Map
All feature events derived from the selected indicators should be mapped onto a unified two-dimensional coordinate system in the feature-map generation stage. The TAFEM-based feature map adopts travel distance as the horizontal axis. The vertical axis consists of nine selected feature layers, where each layer denotes the correspondence between a feature event and its associated travel distance. Each marker in the feature map represents a feature event whose indicator value exceeds a predefined threshold at that specific location. The position of the marker indicates where the event occurs. Its size reflects the severity or intensity of the abnormality. Gray dashed lines are used to connect the sequence in which events are triggered. Indicators with strong spatiotemporal dependencies are fully connected, while those with weaker dependencies retain only the lines reflecting their sequential relationships. The resulting multilayer feature map intuitively reveals the spatial distribution of diverse behavioral patterns during HazMat transportation, the locations of abnormal-event clusters, and the influence of road environments on driving behavior. Through this continuous mapping mechanism, events of different types and occurring at different positions can be compared on a unified scale, facilitating the global identification of a small number of critical high-risk road segments.
6. Case Study
6.1. Data Description
The dataset of LNG (Liquefied Natural Gas) transportation vehicles in Guangdong Province is selected to validate the proposed method. The dataset contains the trajectory data of all LNG transport vehicles operating within Guangdong Province from 10 May to 10 June 2024, with a sampling interval of 30 s. Each trajectory record includes the unique encrypted vehicle ID, latitude and longitude coordinates, heading angle and instantaneous speed at each time point. A total of 15,740 trip trajectories generated by 690 LNG transportation vehicles are included in this dataset. Meanwhile, the corresponding road network and POIs of the studied area were obtained from OpenStreetMap (OSM), which comprises 29,359 motor-vehicle roads and approximately 628,703 road segments with a total length of 312,973 km. The studied area with trajectories from 50 randomly selected vehicles and POIs in the industrial and port categories are represented in Figure 5a,b, respectively.
Figure 5.
Trajectory analysis of LNG transport vehicles and distribution of industry and ports in Guangdong. (a) Preliminary clustering results of vehicle trajectories; (b) Distribution of vehicle stopping points and valid origin–destination points.
6.2. Trajectory Imputation Results
A total of 11,873 trip records from 637 LNG transport vehicles with complete trajectory-point data were selected to construct the database used to validate the effectiveness of the improved trajectory imputation algorithm. Eighty percent of the data in the constructed test database were used for training, with the remaining 20% reserved for validation. A portion of the trajectory points in the validation set was randomly removed to simulate scenarios with missing data points. Depending on the proportion of missing data, the missing-data scenarios were categorized into high, medium, and low missing rate conditions, with thresholds set at 50% and 20%.
Three baseline methods, simple denoising based automatic imputation, prior-information based imputation, and an unimproved generative neural network, were selected to benchmark the proposed trajectory imputation model. The simple denoising based imputation employed the Denoising Stacked Auto-Encoder (DSAE), which reconstructs the missing segments by continuously learning the hidden features of incomplete trajectories through the encoder. This method relies solely on available data for modeling and may degenerate into linear interpolation when data availability is limited. The Bayesian Temporal Matrix Factorization (BTMF) approach was adopted as the prior information-based imputation method, which learns latent factors and temporal dependency structures from historical data and computes posterior predictive distributions for missing values. The posterior predictive distribution is primarily used during model training, where complete ground-truth trajectories provide posterior constraints and guide parameter optimization to enhance the model’s ability to learn missingness patterns. In the actual imputation stage, the model takes only trajectory data with missing segments as inputs. By capturing the spatiotemporal distribution patterns of vehicle trajectories, BTMF reconstructs missing segments via Bayesian inference. Compared with probabilistic factorization methods such as BTMF, Generative Adversarial Networks (GANs) demonstrate stronger capabilities in modeling complex distributions, restoring nonlinear trajectory patterns, and handling sparse-missing scenarios. Therefore, DSAE, BTMF, and GAN were selected as benchmark approaches for comparison with the proposed trajectory imputation method. The evaluation metrics included the Mean Absolute Error (MAE), the Mean Absolute Percentage Error (MAPE), and Dynamic Time Warping (DTW). The evaluation results are presented in Figure 6 and Table 2.
Figure 6.
Performance comparison of trajectory imputation models.
Table 2.
Measurement of effectiveness of selected trajectory imputation models.
As illustrated in Figure 6 and Table 2, the proposed trajectory imputation model consistently maintained low error rates across various missing rate scenarios, with the error increase being relatively small. These results indicate that the proposed model exhibits good stability and adaptability across different missing rate levels. Specifically, during the high missing rate phase, although all models showed a significant increase in error, the MAE of the proposed model remained below 3.5, demonstrating its strong predictive performance even under high data missing rates. The DTW metric measures the overall similarity between the imputed trajectory and the ground-truth trajectory after temporal alignment, and it is therefore selected to reflect the consistency in trajectory shape and dynamic evolution. The DTW values of the proposed model also exhibit a consistently lower trend compared with the other models, indicating demonstrates that the proposed model is more effective in capturing the temporal variation characteristics of trajectory data.
Table 3 presents the training times of DSAE, BTMF, GAN, and the proposed model. The training times of DSAE and BTMF are shorter than those of GAN and the proposed model, which is attributable to their relatively simple model structures. Although the proposed model requires one additional gradient-norm computation compared with GAN, its overall training time is nevertheless shorter than that of the conventional GAN. This is because GANs often suffer from unstable training and frequent collapse, whereas the proposed trajectory imputation model demonstrates high training stability and does not exhibit any collapse during the training process.
Table 3.
Comparison of training time for trajectory interpolation models.
6.3. Identification of Trip Chain Characteristics for HazMat Transport
6.3.1. Origin, Destination and Featured Dwell Points
The KMETHOD approach is employed to identify the origin and destination points within trajectory data, which are essential for determining the trip-chain characteristics of HazMat transport vehicles. In the initial stage, the DBSCAN algorithm with an adaptive mechanism is applied to perform preliminary clustering of vehicle trajectories, as illustrated in Figure 7a. To effectively detect temporary stop points caused by trajectory drift, the 85th percentile speed of the low-speed trajectory cluster is selected as the speed threshold, resulting in a value of 1.09 km/h. Trajectory points with speeds below this threshold are classified as vehicle-stop states. For the retained points, consecutive points with identical latitude and longitude values (reported to four decimal places, approximately a 10 m resolution) are merged into a single stop point. The spatial distribution of identified stop points for LNG transport vehicles across Guangdong Province is shown in Figure 7b.
Figure 7.
Results of the origin and destination identifications for LNG transport vehicles in Guangdong. (a) Preliminary Clustering Results of Vehicle Trajectories; (b) Distribution of Vehicle Dwell Points and Origin-Destination Points.
When multiple adjacent stop points in the preliminary clustering results fall within the same functional zone (e.g., industrial facilities, filling stations), they may correspond to the same physical stop location. KMETHOD utilizes spatial and temporal thresholds to merge such effective stop points into origin and destination points. Analysis of the spatial distribution of adjacent stop points after clustering indicates that more than 95% are located within 2 km of the cluster centroid; thus, a 2 km distance threshold is adopted. Valid stop points within this range are merged, and the mean latitude and longitude of the original points are used as the coordinates of the merged stop location. A temporal threshold is then applied to remove short-duration stops. Based on the observed distribution of stop durations and typical dwell times of LNG transport vehicles at loading and unloading sites, consecutive stop durations shorter than 26 min are discarded. The preliminary origin and destination candidates for the transport process are obtained by jointly applying the distance, time, and speed thresholds.
Subsequently, the K-Means algorithm is applied to cluster these preliminary origin and destination candidates. After removing noise points, a total of 2852 valid origin and destination points are identified, as shown in Figure 7b. The spatial pattern in Figure 7b demonstrates that valid origin and destination points are mainly concentrated in industrial and urban areas along coastal ports and export corridors, which are consistent with the actual industrial distribution. This spatial correspondence further confirms the accuracy and applicability of the KMETHOD approach in identifying the origin and destination points of LNG transport vehicles.
The performance of origin destination identification was evaluated across four methods: the PID self-tuning parameter correction algorithm, the A-DBSCAN algorithm, the SA-DBSCAN algorithm, and the KMETHOD algorithm, with the comparative results presented in Table 4. The PID-based approach exhibited a substantially higher noise ratio, leading to noticeably degraded clustering performance. Although the identification accuracy of both A-DBSCAN and SA-DBSCAN was comparable to that of KMETHOD, the noise ratio achieved by KMETHOD was 65.4% and 90.4% lower than that of A-DBSCAN and SA-DBSCAN, respectively. Furthermore, the average silhouette coefficient obtained by KMETHOD exceeded those of A-DBSCAN and SA-DBSCAN by 49.9% and 21.5%, respectively. These findings demonstrate that the KMETHOD algorithm offers pronounced advantages in terms of clustering accuracy and noise suppression.
Table 4.
Comparisons of adaptive tuning algorithms.
6.3.2. Characteristics of Featured Locations
A total of 123,795 valid POI records within a 1 km radius of the identified origins and destinations were retrieved using the Amap API 2.0. The BERT model was employed to classify POI names into LNG-related and non-LNG-related categories, which enables accurately extract POIs associated with LNG transport operations. If at least one LNG related POI was detected within the vicinity of a valid origin or destination, that point was designated as a true HazMat transportation start or end point. Using this procedure, the BERT model identified 2805 origins and destinations with complete latitude, longitude, and timestamp attributes, achieving an overall classification accuracy of 98.35%.
All labeled origin–destination and non-origin–destination samples were randomly split into training and test sets in an 8:2 ratio to further evaluate model performance. Classification accuracy (Acc) was adopted as the primary evaluation metric. As shown in Figure 8a, the model achieved performance levels exceeding 91% across all evaluation indicators, including accuracy, precision, recall, and F1-score. Notably, the recognition accuracy for destination points was slightly higher than that for origin points.
Figure 8.
Identification performance for the addressed of origins and destinations. (a) Recognition Performance of the BERT Model; (b) Acc of the POI Information Recognition Model.
The POI-based recognition performance for origins and destinations was also compared across four algorithms: UDA (Unsupervised Data Augmentation), TextCNN, LOTClass, and BERT, with the results presented in Figure 8b. BERT achieved the highest classification accuracy, outperforming TextCNN, LOTClass, and UDA by 5.94%, 10.59%, and 8.80%, respectively. These results demonstrate that the BERT model more effectively captures LNG-related semantic information, thereby significantly improving the accuracy of POI label identification. The performance improvement in our model primarily stems from the transferability of BERT’s pretrained semantic representations to POI text, as well as the task data and training strategy, rather than from any novel BERT architecture design.
6.3.3. Trip Chain and Characteristics
Once the origin destination points and intermediate stops of each vehicle are identified, the corresponding trip chain can be determined. Taking the trip data of two LNG transport vehicles on 8 June 2024 as examples, the proposed method is applied to identify their trajectories, origins destinations, and associated trip chain characteristics, as illustrated in Figure 9. The vehicle shown in Figure 9a exhibits a relatively complex single day activity pattern. It first departs from the energy base after loading, unloads at a natural-gas refueling station, returns to the LPG transport company to reload, and then proceeds to another natural-gas refueling station for unloading. The vehicle thus completes two trips during the day. Each trip represents a simple trip chain characterized by a direct movement from a loading point to an unloading point. These two trips, together with the connecting segment between them, constitute the complete trip chain for the vehicle throughout the day. In contrast, the vehicle shown in Figure 9b has a relatively simpler single day travel pattern. Its trip includes a partial unloading operation at an LNG refueling station, which makes this trip a complex trip chain. Figure 9c,d further abstract the two vehicles’ trip chains into schematic diagrams, where different colors are used to distinguish trip relationships, attributes, distances, and the name of the origins and destinations are annotated.
Figure 9.
Simple and complex trip chain. (a) Example of Two Simple Trip Chains; (b) Example of One Complex Trip Chain; (c) Diagram of Two Complex Trip Chains; (d) Diagram of One Complex Trip Chain.
We randomly selected the full-day transport operations of 50 vehicles during June 2024 to evaluate the proposed method, and the results were validated using transport order information from the three days before and after each selected date. The five-day window was necessary because, in Chinese HazMat transport operations, transport orders are typically pre-generated, which leads to imprecise location and time information for the recorded origins and destinations. Therefore, corresponding order records within the five-day window must be matched for effective validation. Based on joint analysis of transport orders and trajectory data, the 50 selected LNG transport vehicles completed a total of 86 trips, with an average of 1.72 trips per vehicle per day and an average daily travel distance of 218.53 km. The proposed method achieved a trip identification accuracy of 94.18%. The five misidentifications were attributed to overnight trips whose origins did not appear in the same day’s trajectory data. After expanding the dataset to include trajectory points containing the actual origins, the proposed approach successfully identified all trip segments. These results demonstrate that the proposed method can effectively detect the origins and destinations of HazMat transport vehicles and accurately extract trip-chain information.
6.4. Personalized Feature Map of HazMat Transport
The TAFEM method is applied to construct the vehicle’s trajectory map and the feature maps of selected trajectory segments using the trip chain of the LNG transport vehicle shown in Figure 10 (license plate: Xiang C***71, Three digits were masked to protect privacy). The vehicle departed at 00:06:18 on 8 June 2024, and completed its operations at 20:48:16 on the same day. Figure 10 illustrates the spatial trajectory of the vehicle along a complete trip chain, as well as the variations in its comprehensive risk level and speed. As discussed in Section 5.3, the primary objective of this study is to construct feature maps capable of characterizing trip chain properties. Thus, the contribution weights of different indicators to the composite risk metric are not systematically calibrated. Nevertheless, Figure 10 still provides an intuitive representation of the vehicle’s overall safety risk pattern along the trip chain, where a larger number of indicators exceeding their respective thresholds corresponds to a higher level of risk. Since vehicle speed is also an important risk related factor, the trajectory visualization uses variations in line width to represent local speed states, enabling a direct interpretation of the spatial risk distribution across the entire trip. The results show that the majority of freeway segments are represented by wide green lines, indicating high speeds and low composite risk. In contrast, when the vehicle enters interchanges, ramps, curved sections, or urban transition areas, the risk level increases while the line width decreases, which suggests elevated risk levels.
Figure 10.
Schematic diagram of a trip chain.
Figure 11 presents the multidimensional feature maps for two trajectory segments with comparatively higher risk. Multiple feature layers exhibit event triggering phenomena at similar distance positions, which reflect the coupled interactions among driving behavior, road geometry, and external risk context. For example, in the first trajectory segment shown in Figure 11a, simultaneous high-intensity events occur in the direction-change-rate (R), low-speed deviation (L), and kinetic energy (E) layers within the 2–3 km interval, which indicates that the vehicle performs substantial speed adjustments while navigating curved road sections, accompanied by notable fluctuations in kinetic energy. Concurrent triggers in the E and road-class (G) layers suggest a transition from a high-grade roadway to a lower-grade facility near the 6 km location, where changes in driving resistance and speed control occur simultaneously. In the 8–9 km interval, frequent and intensified events in the direction change rate layer align with the multi-curve and speed drop sections visible in the trajectory map. In Figure 11b, the road alignment complexity (R) layer shows multiple event triggers, particularly around the 4–6 km and 12 km zones, characterized by larger and more continuous markers. These triggers correspond to clusters of tight curves in the trajectory, indicating substantial disturbances to vehicle dynamic posture. Events in the low-speed deviation (L) and overspeed deviation (O) layers appear sporadically, mainly around the 4–5 km and 6 km intervals, which matches the line-width transitions in the trajectory map. These patterns suggest minor speed deviations when the vehicle passes through curved segments and port area entrances, which is consistent with the actual road environment and further validates the behavioral expressiveness of the TAFEM feature maps.
Figure 11.
Trip chain risk featured map for selected segment. (a) Segment 1 Trajectory feature map; (b) Segment 2 Trajectory feature map.
Overall, the spatial trajectory map provides an intuitive representation of vehicle movement patterns, while the featured maps integrate multiple risk scores into a unified spatial coordinate system. Together, the two visualizations reveal the dynamic characteristics of HazMat transport vehicles under varying road environments and provide a robust basis for subsequent risk identification, critical segment screening, and safety management strategy development. In this study, the sampling frequency of vehicle trajectory points is 30 s per point. Under the long-distance transport scenarios, the spatial separation between consecutive samples is relatively small, and the risk values can be approximately regarded as varying continuously.
7. Conclusions
A personalized trip chain risk mapping framework based on trajectory data is developed to accurately capture the risk related features of HazMat transport vehicles. The proposed framework consists of three components: a Conditional WGAN-GP based trajectory imputation module, a KMETHOD based sub-trip chain segmentation module, and a TAFEM based feature map construction module. The experimental results using LNG transport trajectory data from Guangdong Province, China demonstrate that the proposed method can effectively identify the complete risk feature map of an individual HazMat transport vehicle’s trip chain.
The results indicate that, after effectively learning the historical transport patterns of each vehicle, the proposed trajectory imputation module is capable of reconstructing missing trajectory segments with high accuracy even under missing rates as high as 80%, without exhibiting training collapse, thereby outperforming conventional imputation algorithms in both robustness and stability. The KMETHOD module achieves an origin–destination identification accuracy of 98.35%, while the BERT-based model attains a POI recognition accuracy of 92.83% for valid origin–destination points. These results confirm that the proposed framework can accurately identify LNG vehicle trip chains and their subchains, providing reliable support for subsequent trip-chain segmentation and feature extraction. In addition, the TAFEM feature-map construction method enables a detailed analysis of the risk states and contributing factors associated with each trip chain of a given vehicle, thereby revealing not only the overall distribution of risks along the transport process but also the key causal factors underlying risk variations across different trip segments.
Future work will integrate more historical transport data with additional multidimensional information, such as economic and industrial attributes, to support comprehensive modeling and data mining. This operation may uncover potential personalized behavioral patterns across all vehicles during transport. In addition, efforts will be made to quantify the contribution of individual factors to hazardous materials transport risk, which can enhance the practical applicability and adaptability of the proposed method.
Author Contributions
Conceptualization, B.C. and Y.L. (Yan Li); methodology, B.C. and J.M.; validation, J.M. and B.C.; formal analysis, Y.L. (Yikai Luo) and L.C.; investigation, B.C. and J.M.; resources, B.C. and J.M.; data curation, B.C. and Y.L. (Yan Li); writing—original draft preparation, J.M., B.C. and Y.L. (Yikai Luo); writing—review and editing, B.C., J.M. and Y.L. (Yan Li); visualization, B.C. and J.M.; supervision, J.M.,B.C. and Y.L. (Yan Li); funding acquisition, B.C. and Y.L. (Yan Li). All authors have read and agreed to the published version of the manuscript.
Funding
This work was supported by the Natural Science Basic Research Plan in Shaanxi Province of China (Grant No. 2025JC-YBMS-367, 2025JC-YBQN-524).
Institutional Review Board Statement
Not applicable.
Informed Consent Statement
Not applicable.
Data Availability Statement
The raw data are available on request.
Conflicts of Interest
Author Bangju Chen is currently a Ph.D. student of Beijing Institute of Technology. Meantime, he is also employed by China Transport InfoJet Technologies Co., Ltd. and China Transport Telecommunications & Information Center. The remaining authors declare that the research was conducted in the absence of any commercial or financial relationships that could be construed as a potential conflict of interest.
References
- Ren, C.; Yang, M. Risk assessment of hazmat road transportation accidents before, during, and after the accident using Bayesian network. Process Saf. Environ. Prot. 2024, 190, 760–779. [Google Scholar] [CrossRef] [Scilit]
- Macioszek, E. Essential techniques for fastening loads in road transport. Zesz. Naukowe. Transp./Politech. Śląska 2021, 110, 97–104. [Google Scholar] [CrossRef] [Scilit]
- Zhigerbayeva, G.; Yang, M. A safety function deployment approach to risk management of HazMat highway transportation. ACS Chem. Health Saf. 2021, 28, 348–357. [Google Scholar] [CrossRef] [Scilit]
- Liu, Z.; Shi, X.; Hui, Y. Study of Operational Characteristics of HAZMAT Vehicles Based on GPS Data. In ICCTP 2009; American Society Civil Engineers: Reston, VA, USA, 2012; pp. 1–7. [Google Scholar]
- Wang, J.; Deng, W.; Guo, Y. New Bayesian combination method for short-term traffic flow forecasting. Transp. Res. Part C Emerg. Technol. 2014, 43, 79–94. [Google Scholar] [CrossRef] [Scilit]
- Wang, J.; Wu, N.; Lu, X.; Zhao, W.X.; Feng, K. Deep Trajectory Recovery with fine-grained calibration using Kalman filter. IEEE Trans. Knowl. Data Eng. 2021, 33, 921–934. [Google Scholar] [CrossRef] [Scilit]
- Zhao, D.; Zhang, Y.; Wang, W.; Hua, X.; Yang, M. Car-following trajectory data imputation with adversarial convolutional neural network. IET Intell. Transp. Syst. 2023, 17, 960–972. [Google Scholar] [CrossRef] [Scilit]
- Shao, H.; Li, W.; Lin, J.; Min, Z. Multi-mode data augmentation and fault diagnosis of gearbox using improved ACGAN. J. Traffic Transp. Eng. 2023, 23, 188–197. [Google Scholar]
- Xu, J.; Li, X.; Lu, W.; Rakotonirainy, A.; Li, Y. A trajectory-conditional generative adversarial network model for missing vehicle trajectory imputation. Phys. A Stat. Mech. Its Appl. 2025, 676, 130881. [Google Scholar] [CrossRef] [Scilit]
- Zhao, J.; Nie, Y.; Ni, S.; Sun, X. Traffic data imputation and prediction: An efficient realization of deep learning. IEEE Access 2020, 8, 46713–46722. [Google Scholar] [CrossRef] [Scilit]
- Zhang, J.; Zhang, Z.; Hui, L. GNN-RM: A trajectory completion algorithm based on graph neural networks and regeneration modules. Int. J. Cogn. Comput. Eng. 2024, 5, 297–306. [Google Scholar] [CrossRef] [Scilit]
- Huang, X.; Zhao, Y.; Ma, C.; Yang, J.; Ye, X.; Zhang, C. TrajGraph: A graph-based visual analytics approach to studying urban network centralities using taxi trajectory data. IEEE Trans. Vis. Comput. Graph. 2016, 22, 160–169. [Google Scholar] [CrossRef] [Scilit]
- Liao, L.; Lin, Y.; Li, W.; Zou, F.; Luo, L. Traj2Traj: A road network constrained spatiotemporal interpolation model for traffic trajectory restoration. Trans. GIS 2023, 27, 1021–1042. [Google Scholar] [CrossRef] [Scilit]
- Wang, X.; Wu, Y.; Zhuang, D.; Sun, L. Low-rank hankel tensor completion for traffic speed estimation. IEEE Trans. Intell. Transp. Syst. 2023, 24, 4862–4871. [Google Scholar] [CrossRef] [Scilit]
- Chen, X.; Chen, Y.; Saunier, N.; Sun, L. Scalable low-rank tensor learning for spatiotemporal traffic data imputation. Transp. Res. Part C Emerg. Technol. 2021, 129, 103226. [Google Scholar] [CrossRef] [Scilit]
- Chen, X.; Cheng, Z.; Cai, H.; Saunier, N.; Sun, L. Laplacian Convolutional representation for traffic time series imputation. IEEE Trans. Knowl. Data Eng. 2024, 36, 6490–6502. [Google Scholar] [CrossRef] [Scilit]
- Li, Y.; Chen, G.; Luo, Y.; Chen, B.; Shao, J.; Li, Y. A personalized driving risk assessment and rolling prediction method by integrating multiple indicators. Accid. Anal. Prev. 2025, 221, 108201. [Google Scholar] [CrossRef] [Scilit]
- Hashem, I.A.; Usmani, R.S.; Almutairi, M.S.; Ibrahim, A.O.; Zakari, A.; Alotaibi, F.; Alhashmi, S.M.; Chiroma, H. Urban Computing for sustainable smart cities: Recent advances, taxonomy, and open research challenges. Sustainability 2023, 15, 3916. [Google Scholar] [CrossRef] [Scilit]
- Liu, K.; Yin, L.; Lu, F.; Mou, N. Visualizing and exploring POI configurations of urban regions on POI-type semantic space. Cities 2020, 99, 102610. [Google Scholar] [CrossRef] [Scilit]
- Xu, X.; Simbeye, P.C.; Yang, Y.; Hu, J.; Zhang, X. Identification of freight-related stop points based on truck trajectory data. Comput. Ind. Eng. 2025, 210, 111545. [Google Scholar] [CrossRef] [Scilit]
- Jin, M.; Wang, M.; Gong, Y.; Liu, Y. Spatio-temporally constrained origin–destination inferring using public transit fare card data. Phys. A Stat. Mech. Its Appl. 2022, 603, 127642. [Google Scholar] [CrossRef] [Scilit]
- Tabernik, D.; Skočaj, D. Deep Learning for Large-Scale Traffic-Sign Detection and Recognition. IEEE Trans. Intell. Transp. Syst. 2020, 21, 1427–1440. [Google Scholar] [CrossRef] [Scilit]
- Wang, S.; Zuo, Z.; Liu, Y. Study on Location of Bus Stop in Subway Service Area Based on Residents’ Travel Accessibility. Sustainability 2023, 15, 4517. [Google Scholar] [CrossRef] [Scilit]
- Tao, Y.; Liu, W.; Chen, J.; Gao, J.; Li, R.; Wang, X.; Zhang, Y.; Ren, J.; Yin, S.; Zhu, X.; et al. A graph-based multimodal data fusion framework for identifying urban functional zone. Int. J. Appl. Earth Obs. Geoinf. 2025, 136, 104353. [Google Scholar] [CrossRef] [Scilit]
- Guo, J.; Luo, C. Risk assessment of hazardous materials transportation: A review of research progress in the last thirty years. J. Traffic Transp. Eng. (Engl. Ed.) 2022, 9, 571–590. [Google Scholar]
- Jiao, Y.; Cai, X. Knowledge graph-based intelligent QA system for pavement design. Intell. Transp. Infrastruct. 2025, 4, liaf031. [Google Scholar] [CrossRef] [Scilit]
- Zhang, L.; Zhang, M.; Tang, J.; Ma, J.; Duan, X.; Sun, J.; Hu, X.; Xu, S. Analysis of traffic accident based on knowledge graph. J. Adv. Transp. 2022, 2022, 3915467. [Google Scholar] [CrossRef] [Scilit]
- Gan, L.; Ye, B.; Huang, Z.; Xu, Y.; Chen, Q.; Shu, Y. Knowledge graph construction based on ship collision accident reports to improve maritime traffic safety. Ocean Coast. Manag. 2023, 240, 106660. [Google Scholar] [CrossRef] [Scilit]
- Wang, H.; Yu, Q.; Liu, Y.; Jin, D.; Li, Y. Spatio-temporal urban knowledge graph enabled mobility prediction. Proc. ACM Interact. Mob. Wearable Ubiquitous Technol. 2021, 5, 184. [Google Scholar] [CrossRef] [Scilit]
- Ma, X.; Xing, Y.; Lu, J. Causation analysis of hazardous material road transportation accidents by Bayesian network using genie. J. Adv. Transp. 2018, 2018, 6248105. [Google Scholar] [CrossRef] [Scilit]
- Zhang, L.; Wu, X.; Skibniewski, M.J.; Zhong, J.; Lu, Y. Bayesian-network-based safety risk analysis in construction projects. Reliab. Eng. Syst. Saf. 2014, 131, 29–39. [Google Scholar] [CrossRef] [Scilit]
- Zhang, Y.; Wang, Y.; Gao, S.; Raubal, M. Context-aware knowledge graph framework for traffic speed forecasting using graph neural network. IEEE Trans. Intell. Transp. Syst. 2025, 26, 3885–3902. [Google Scholar] [CrossRef] [Scilit]
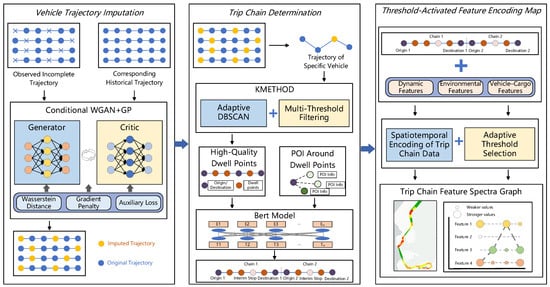
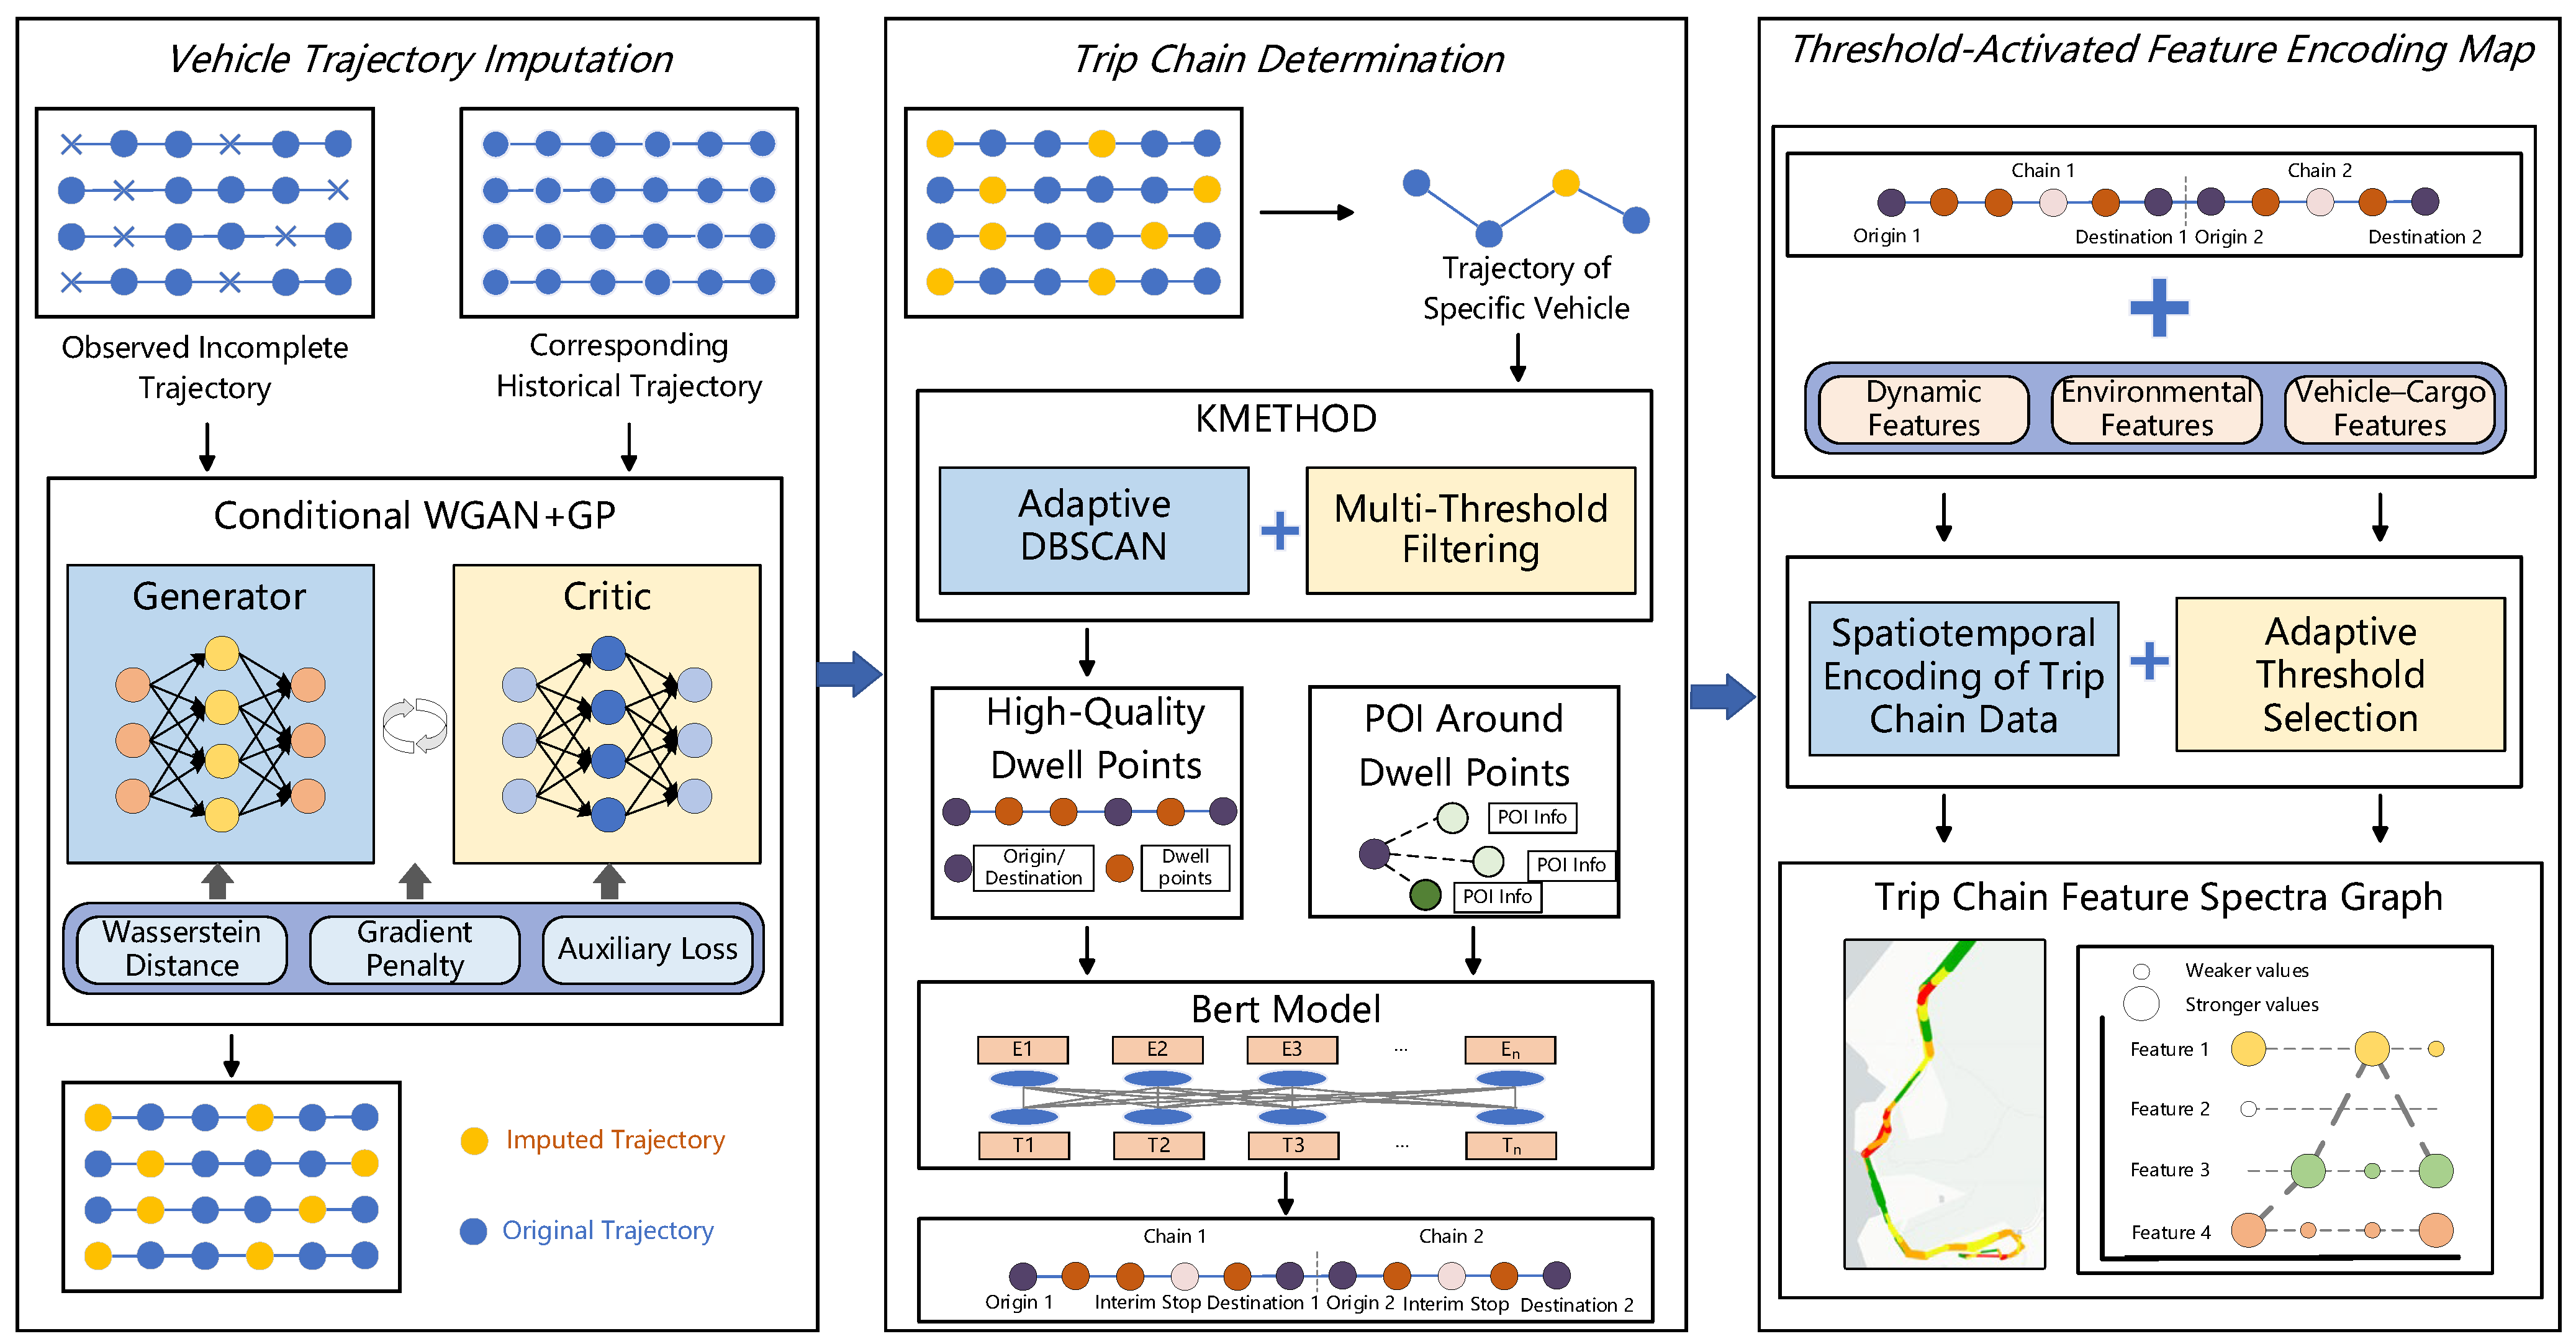
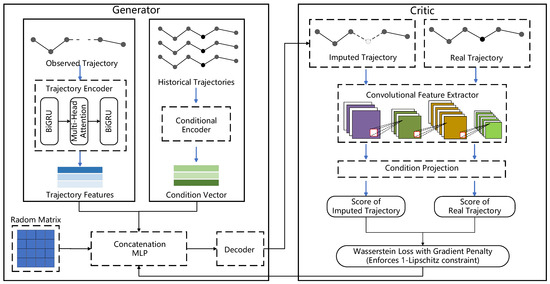
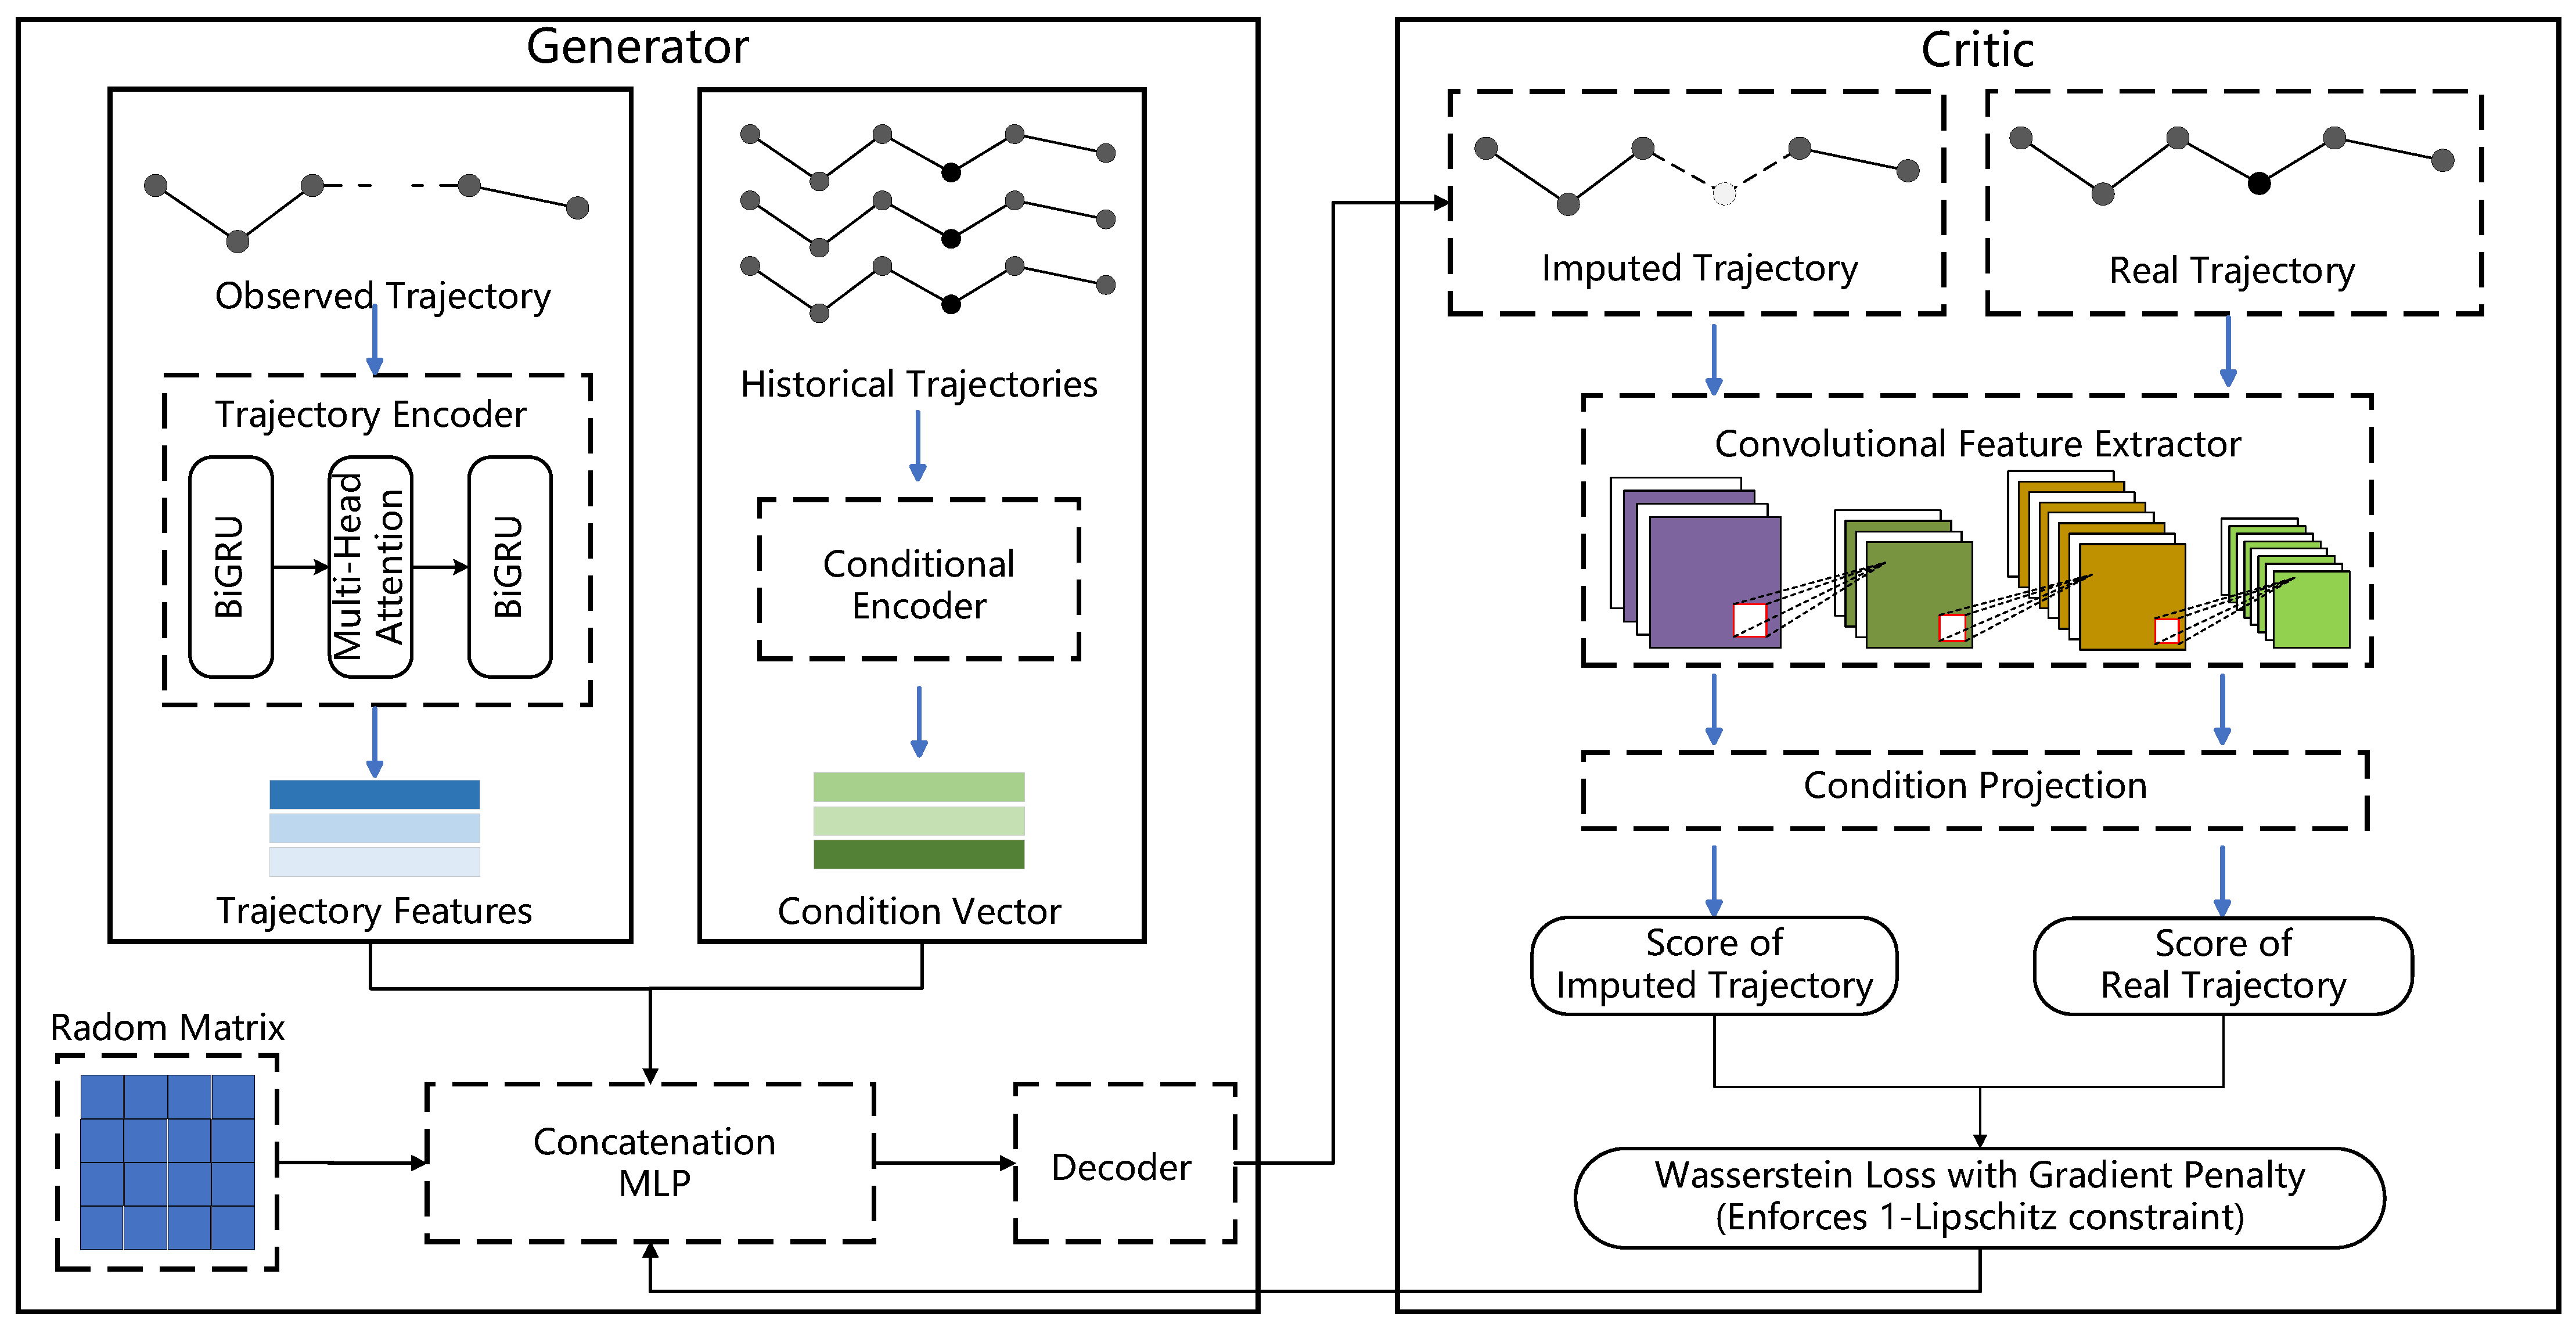
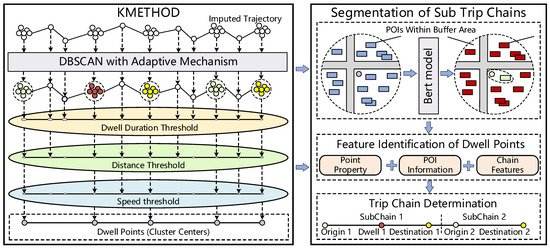
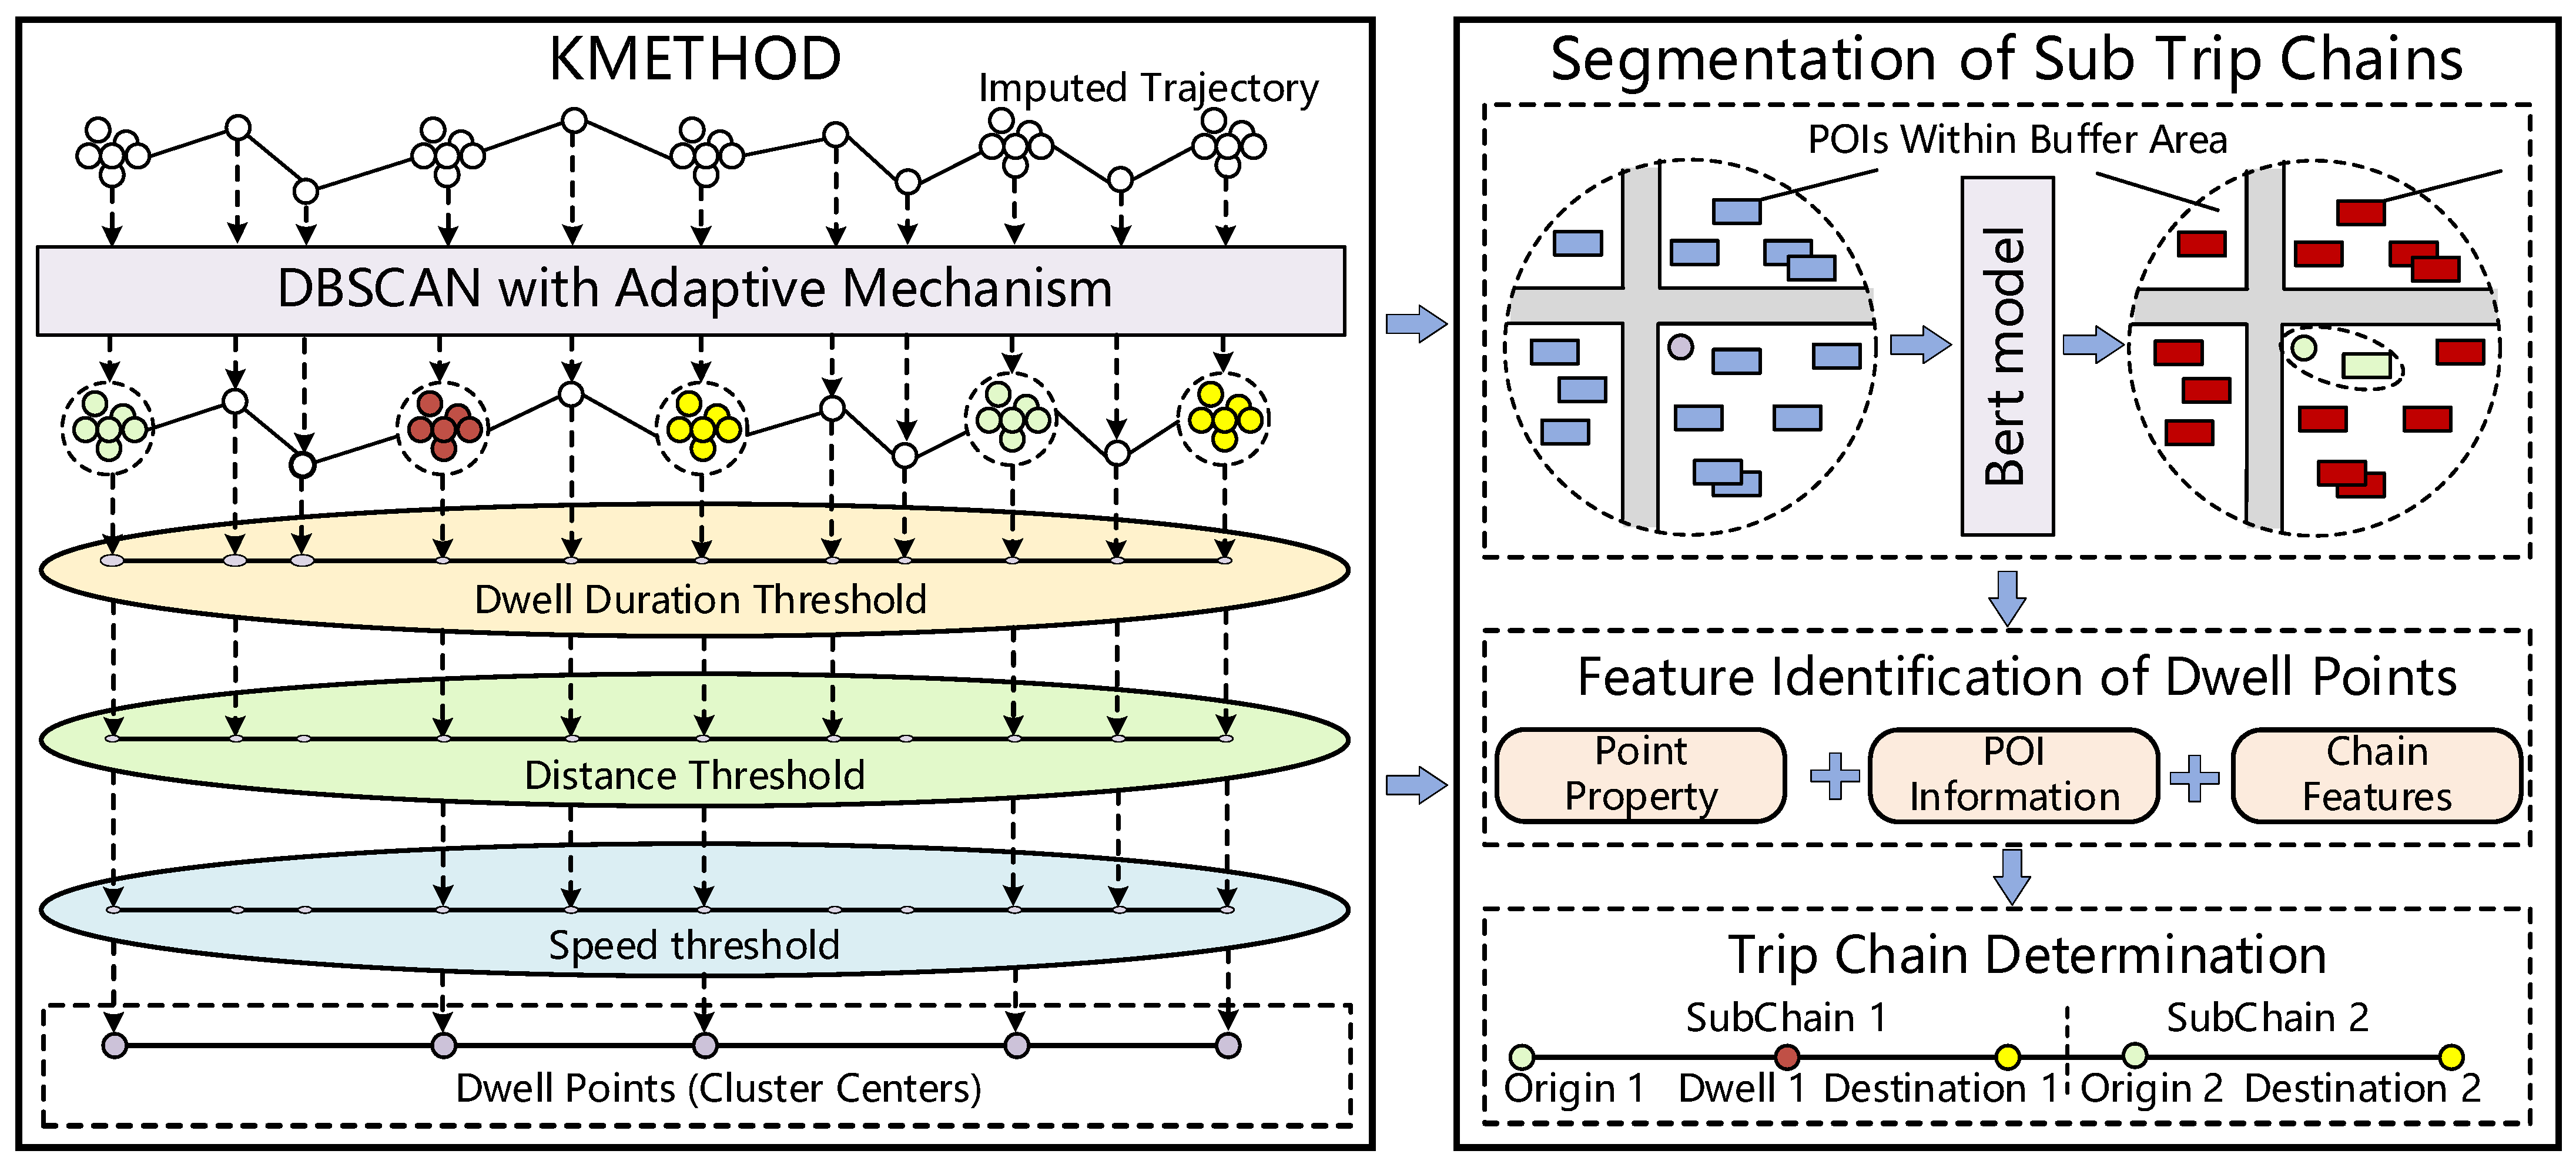
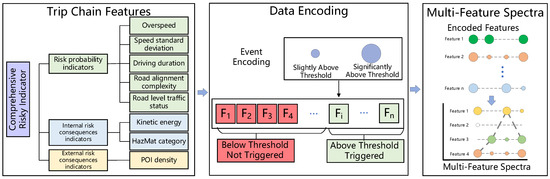
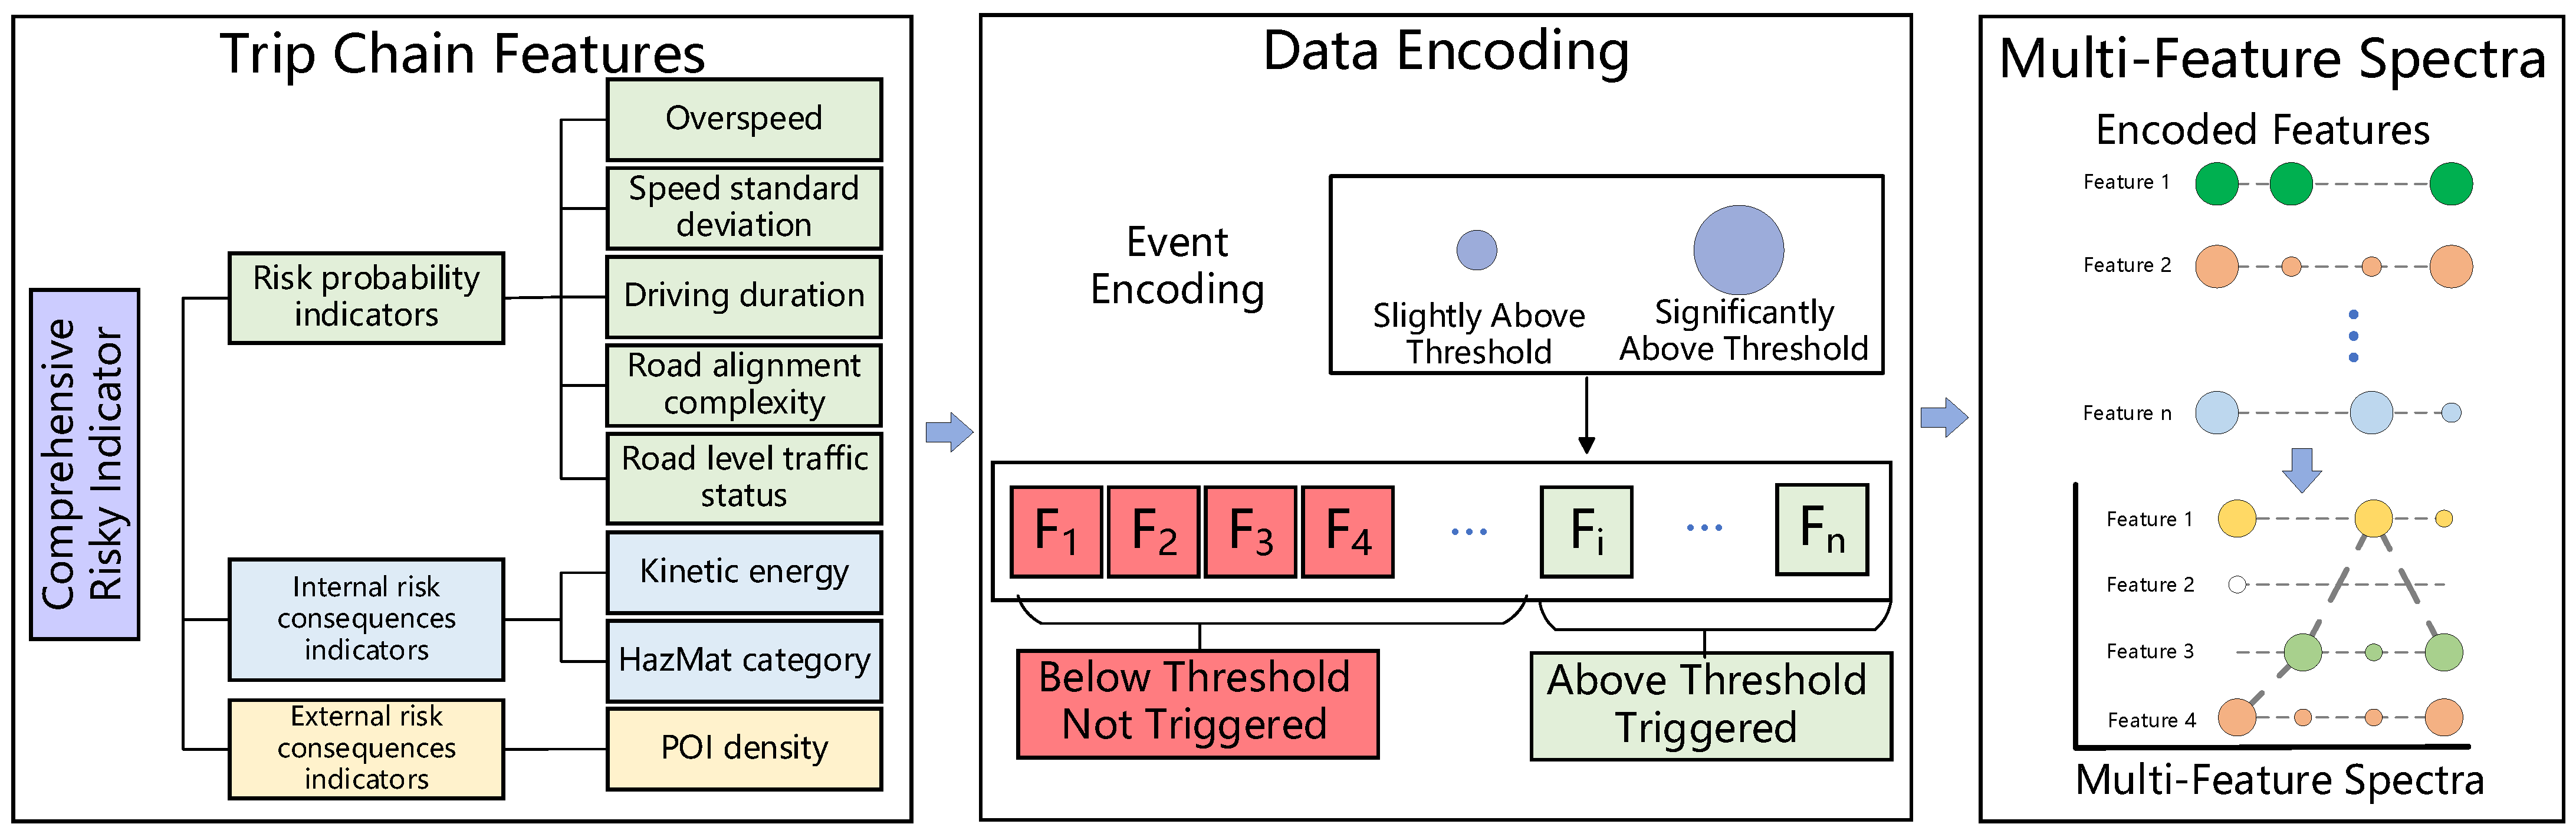
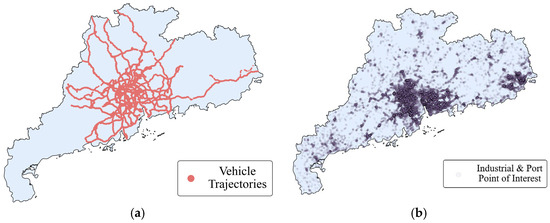
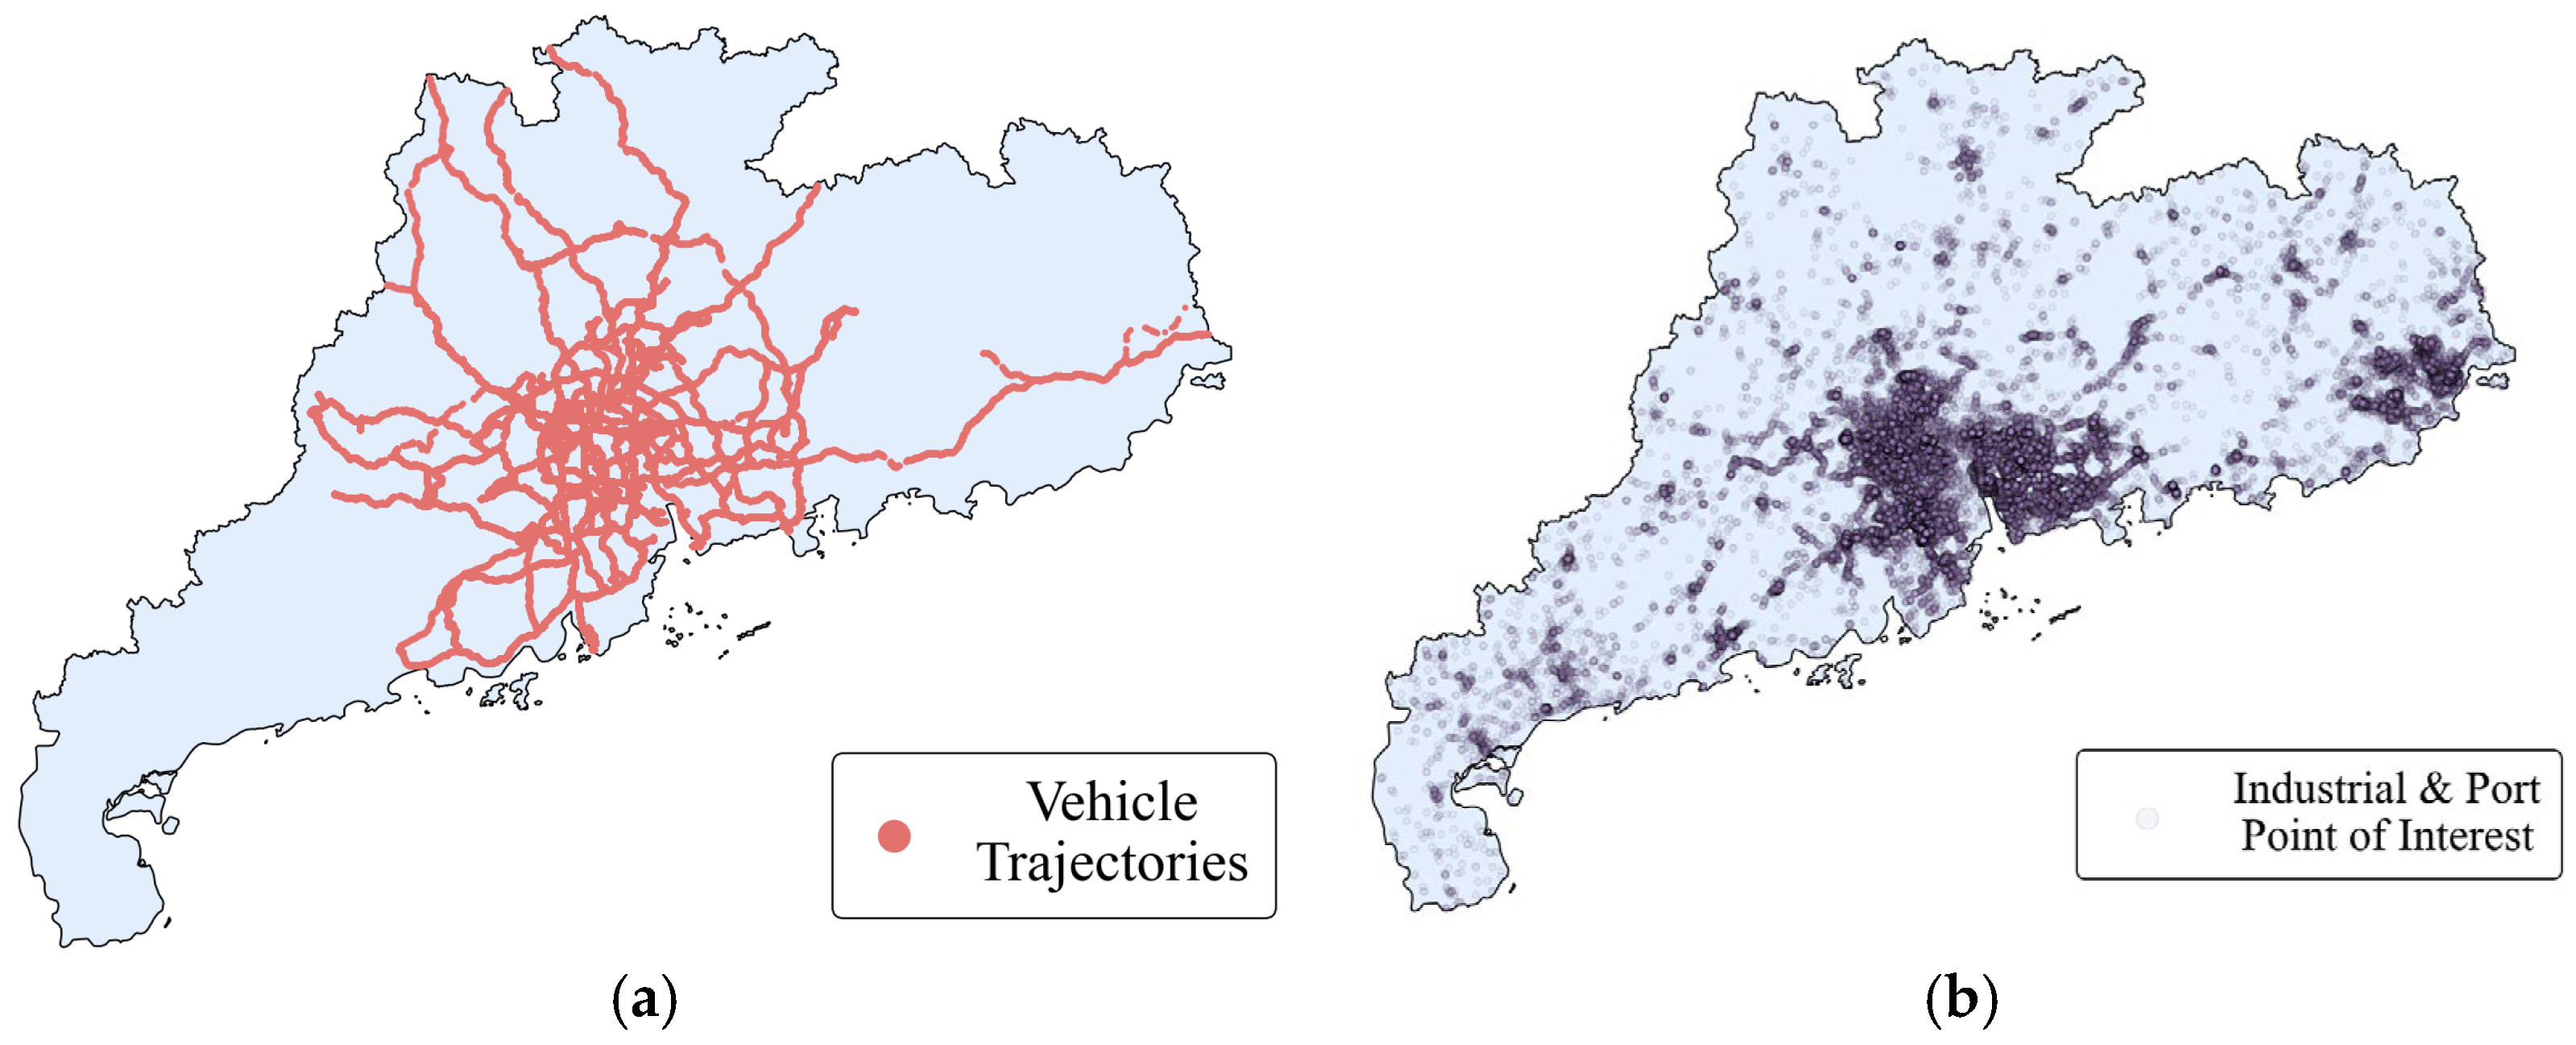
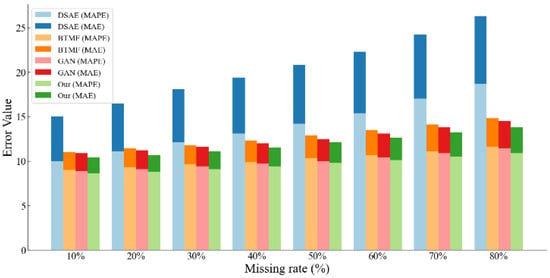
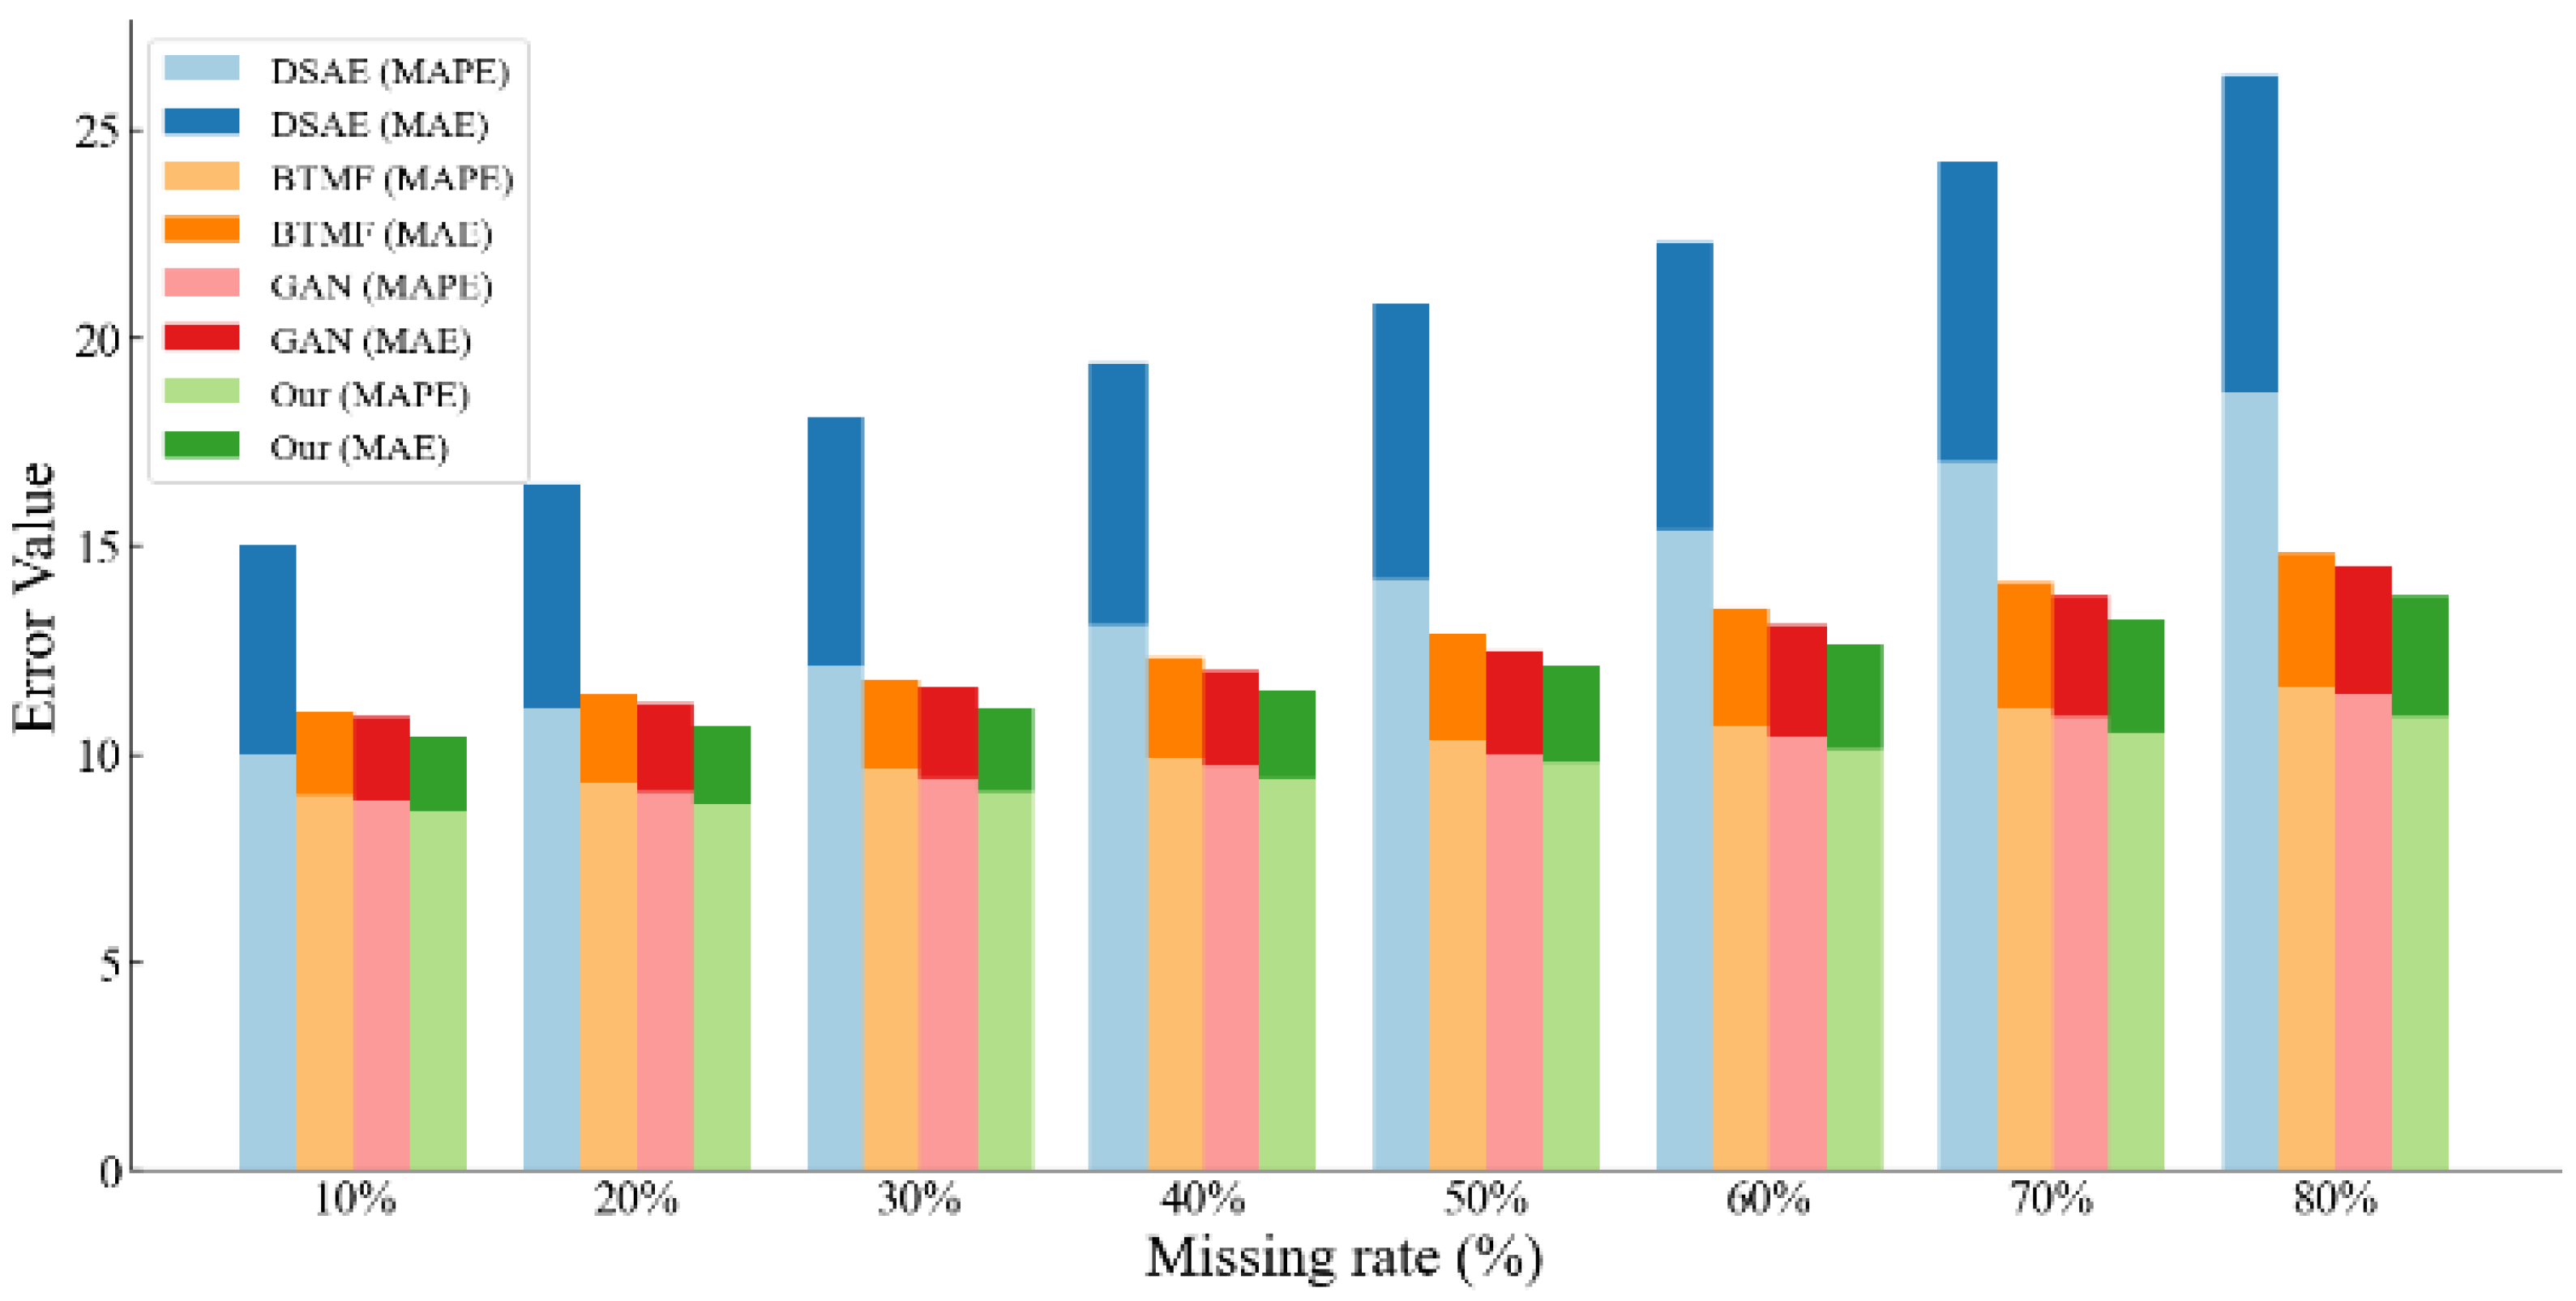
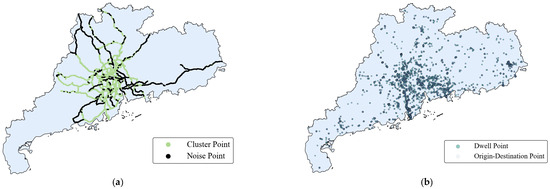
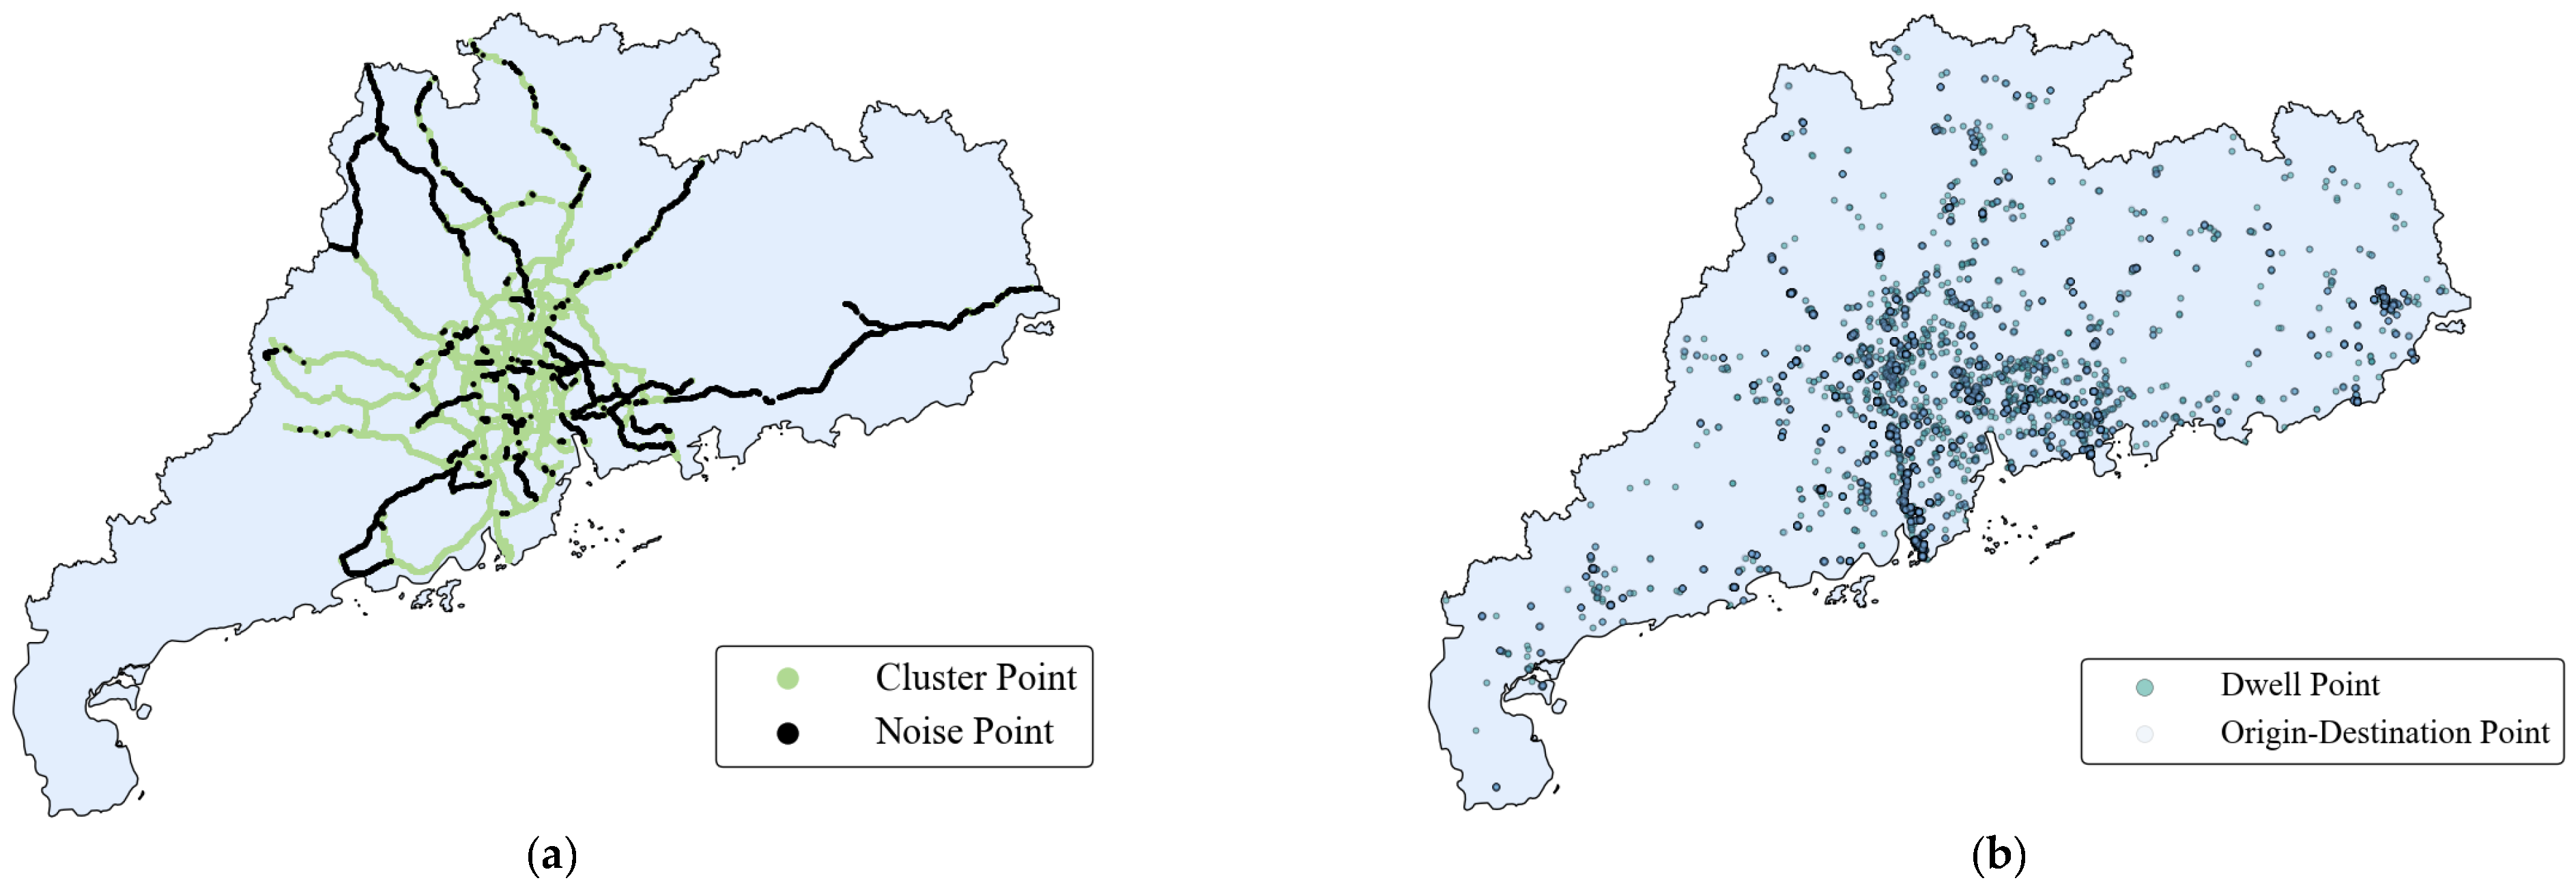
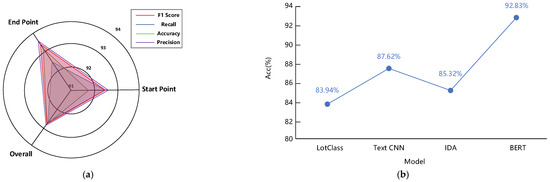
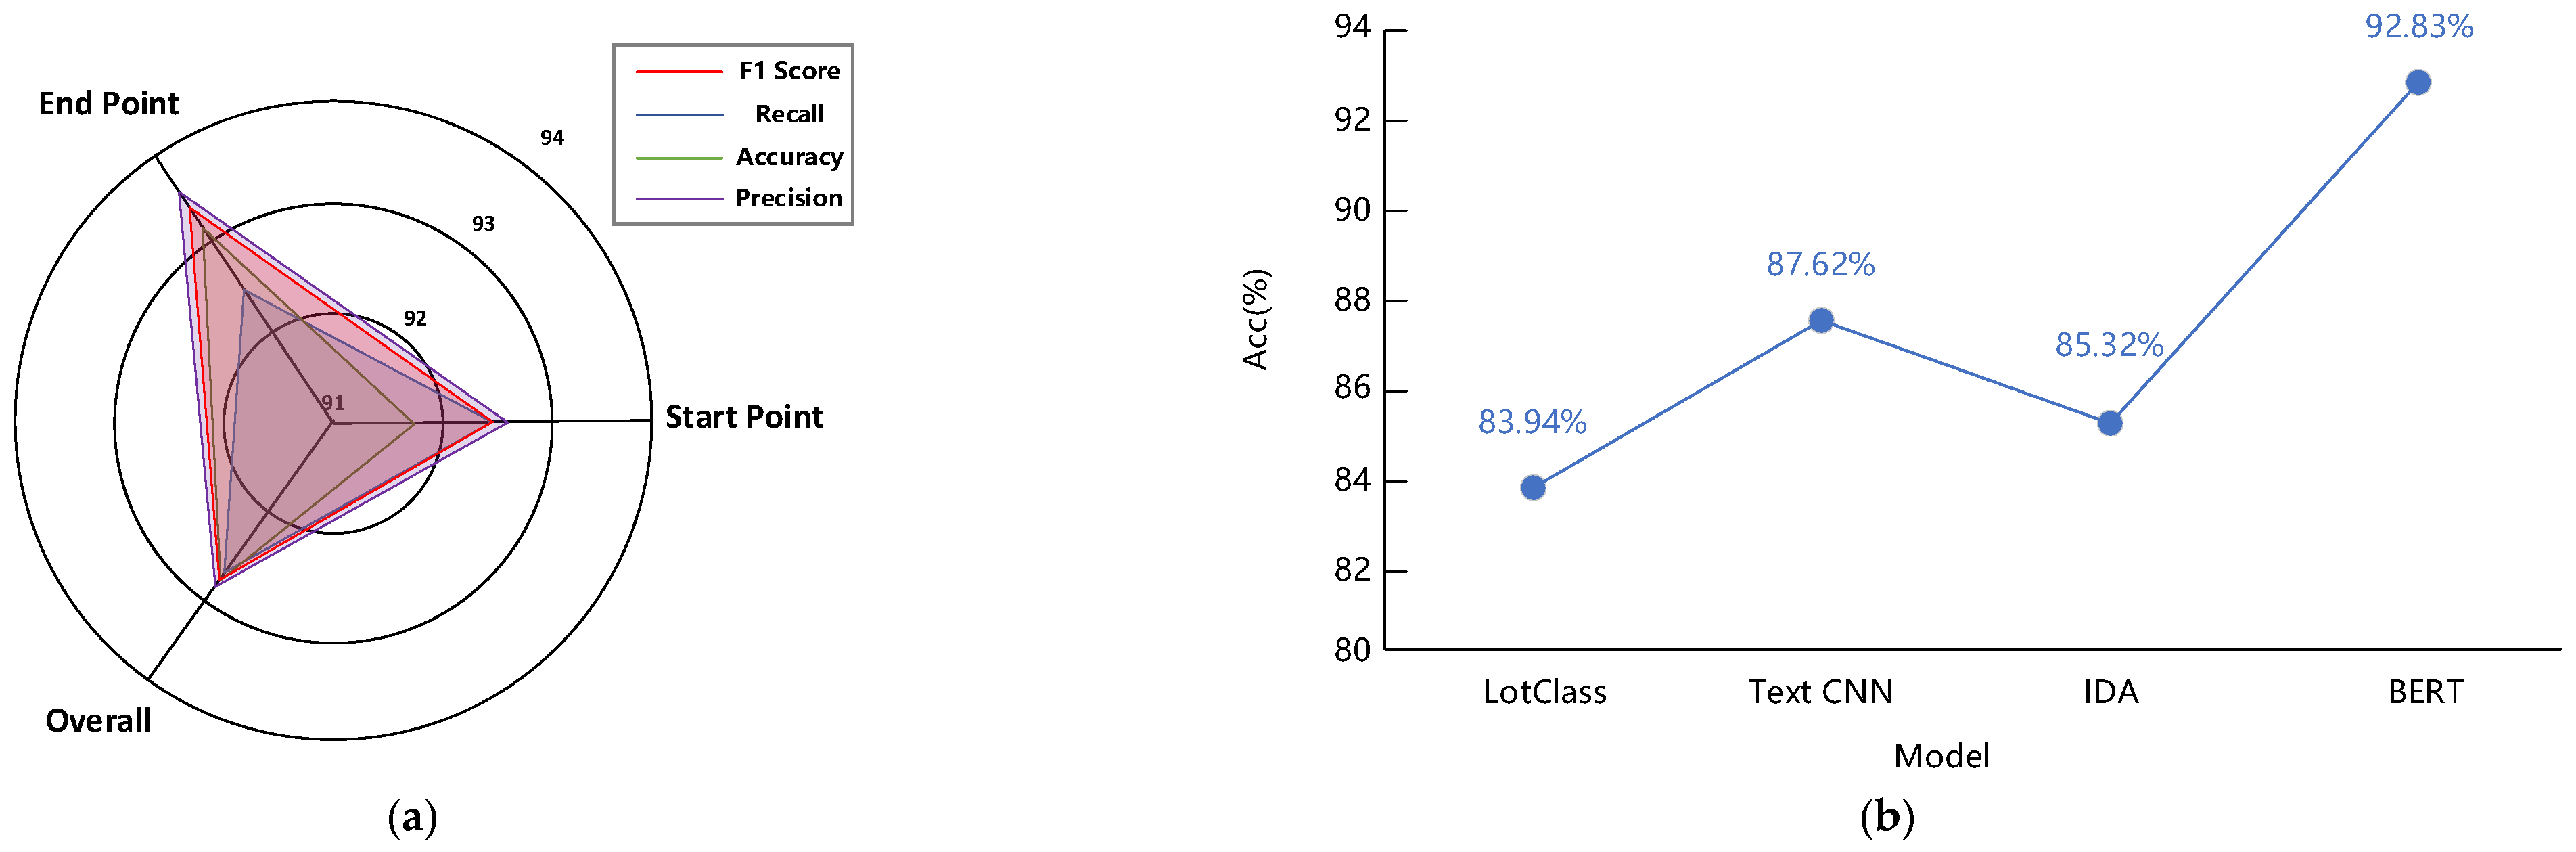
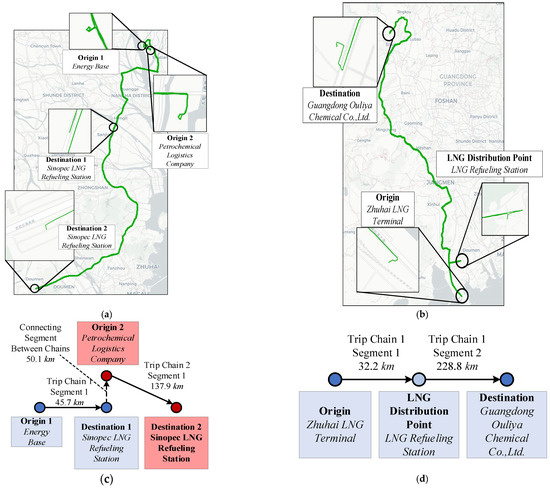
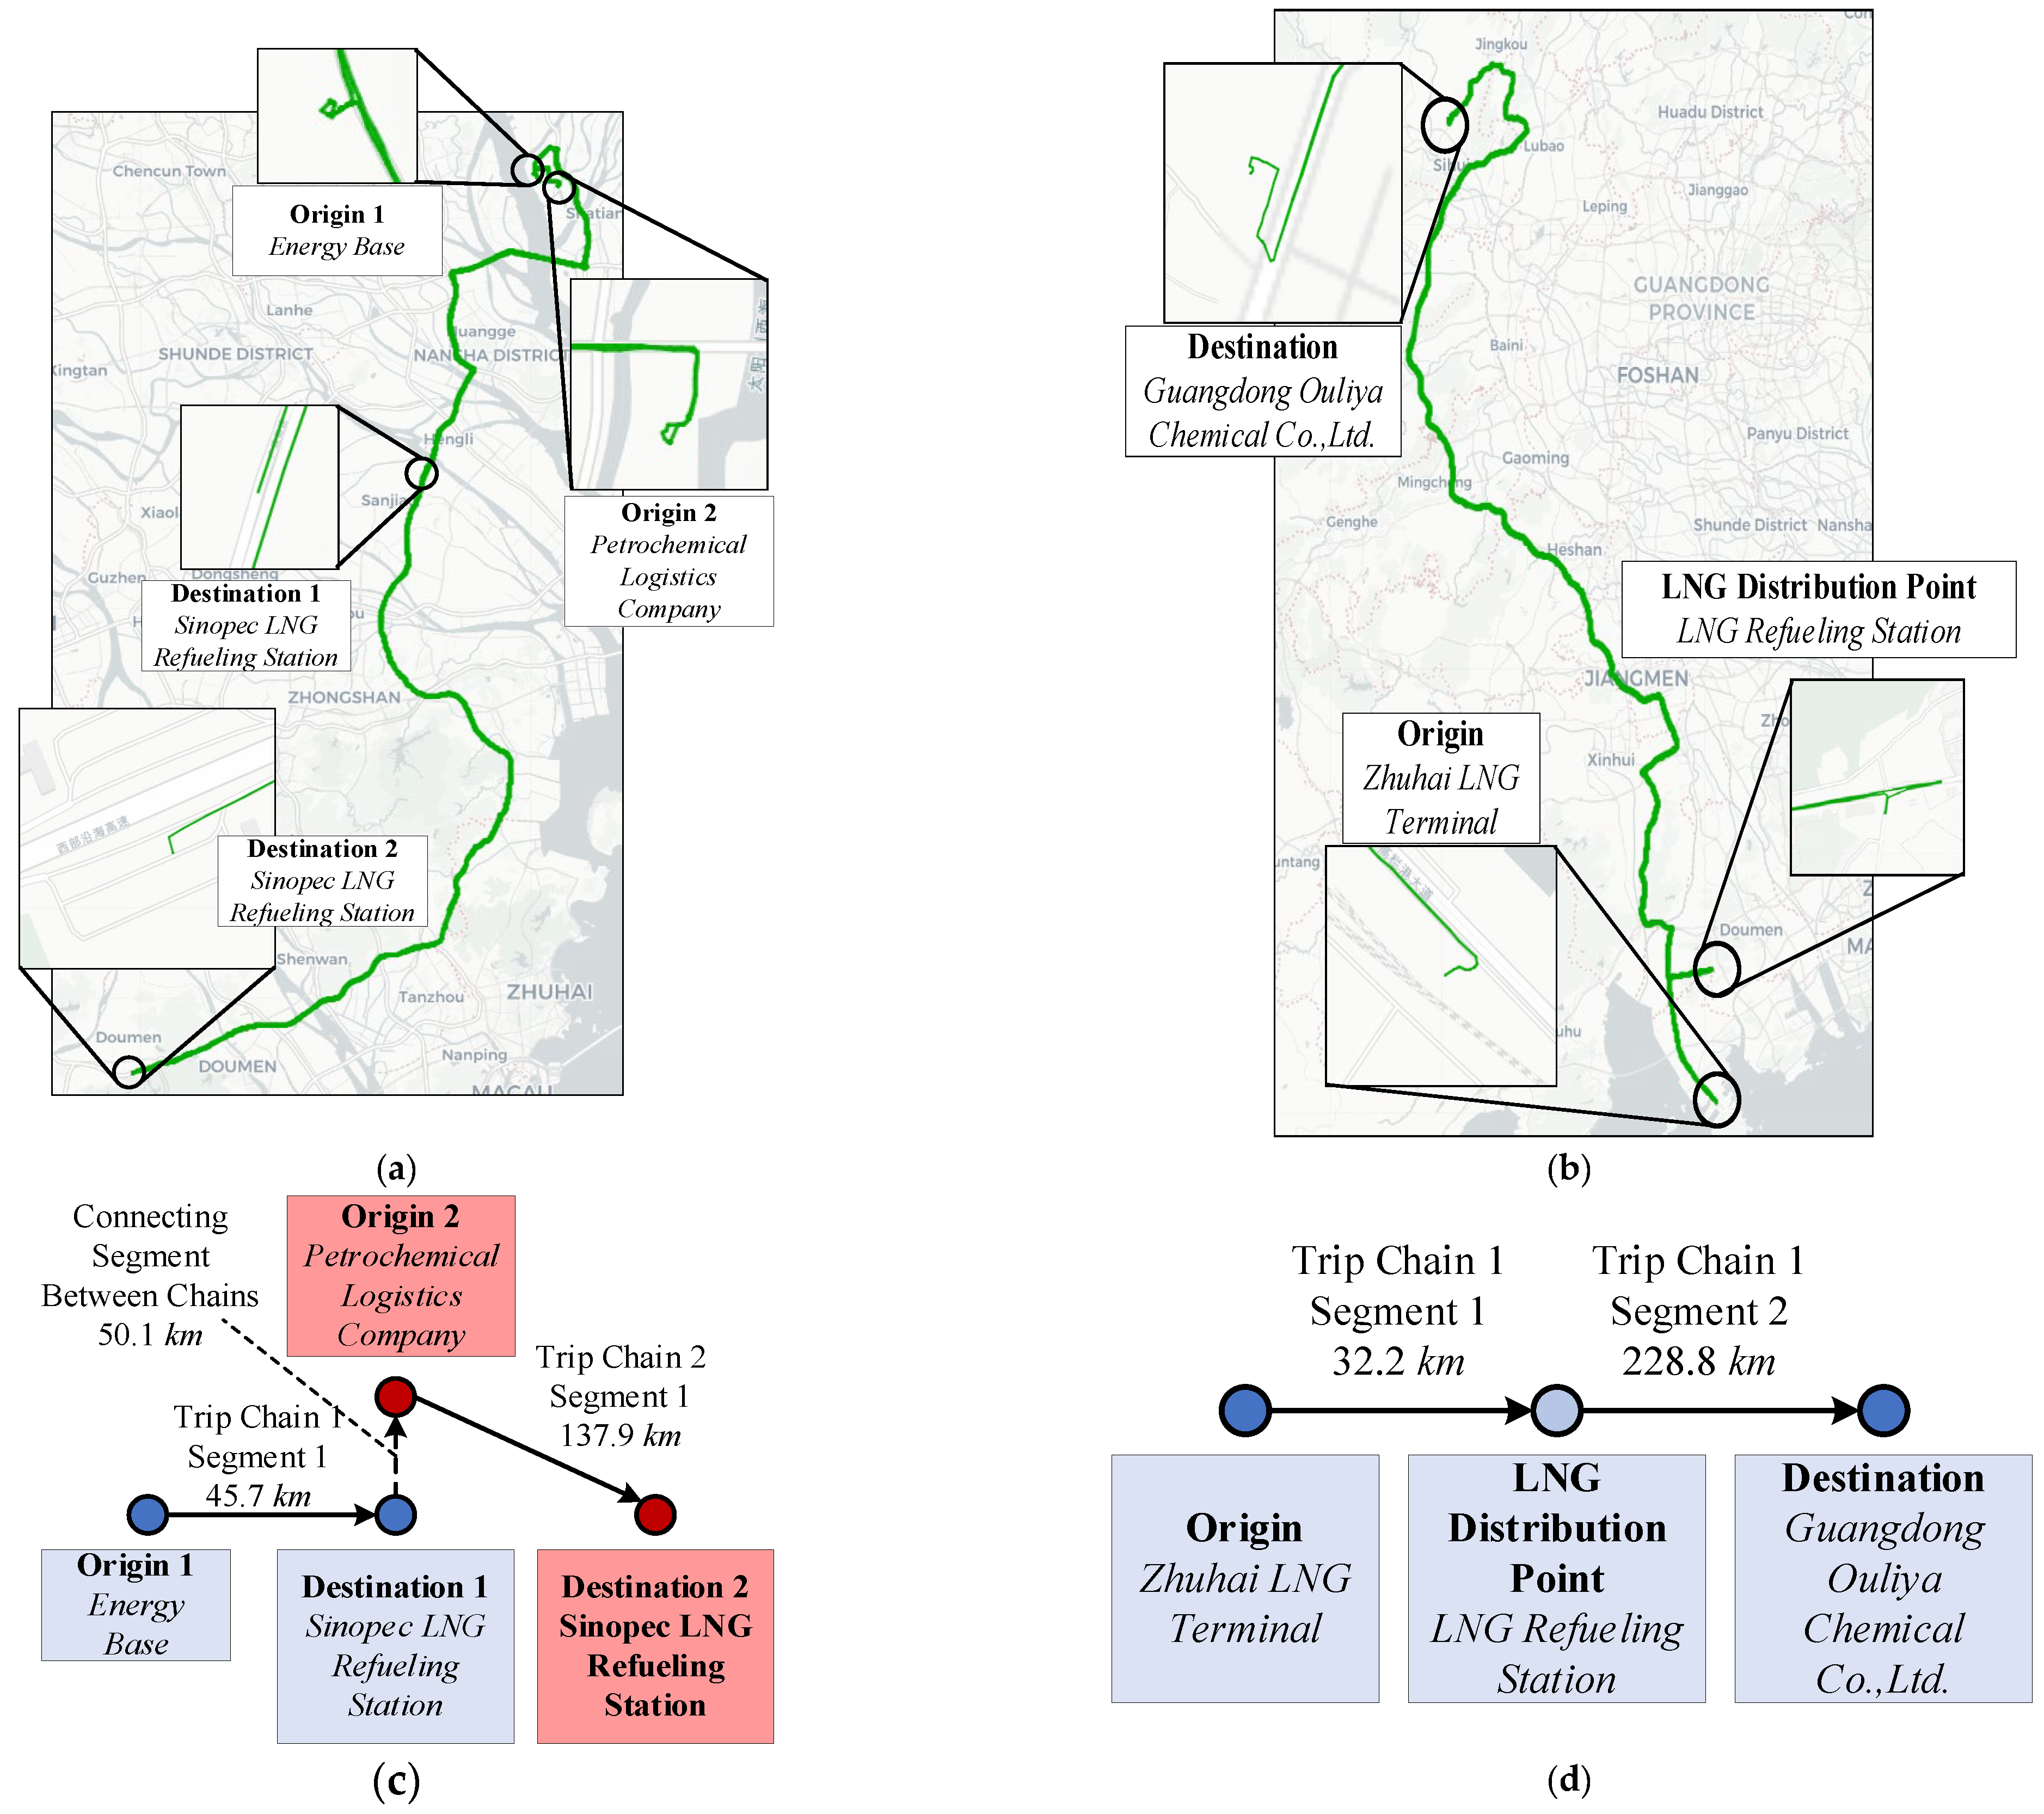
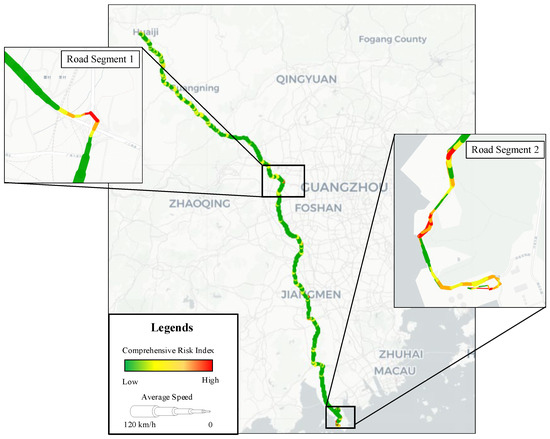
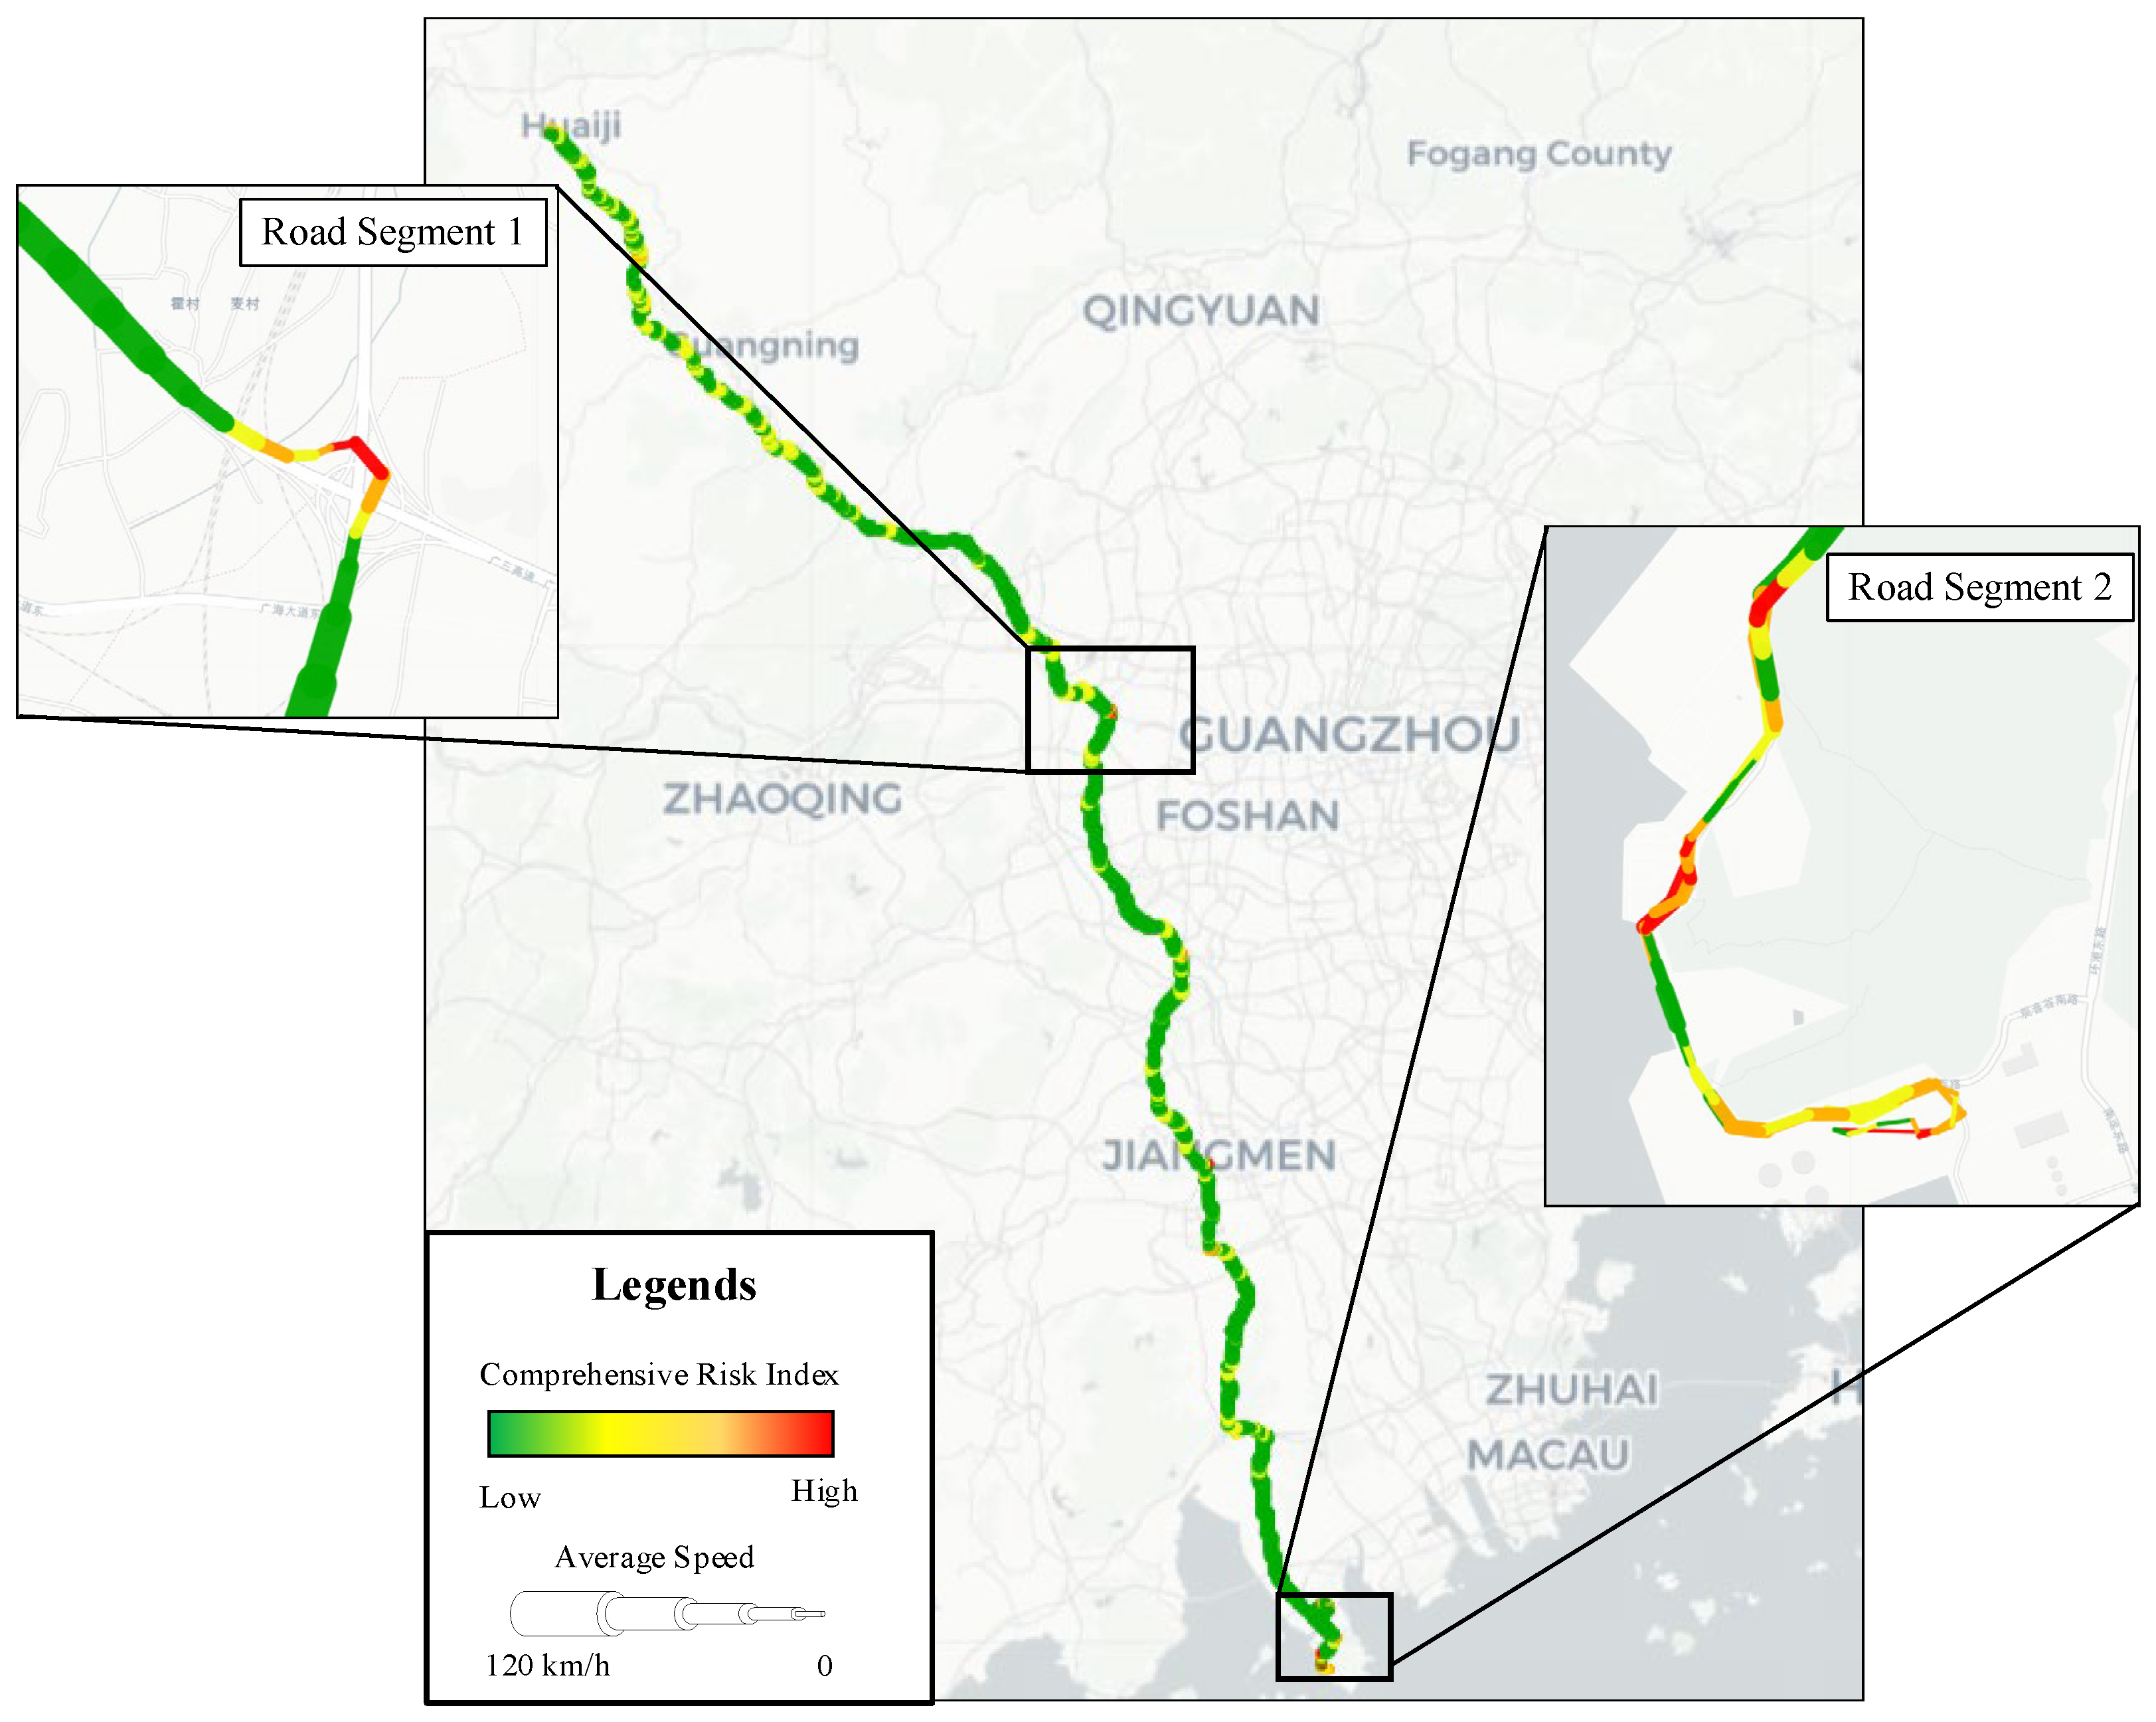
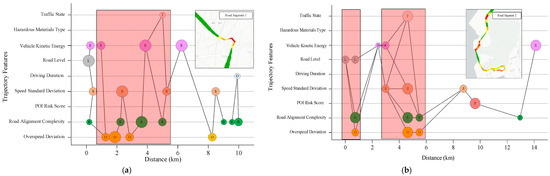
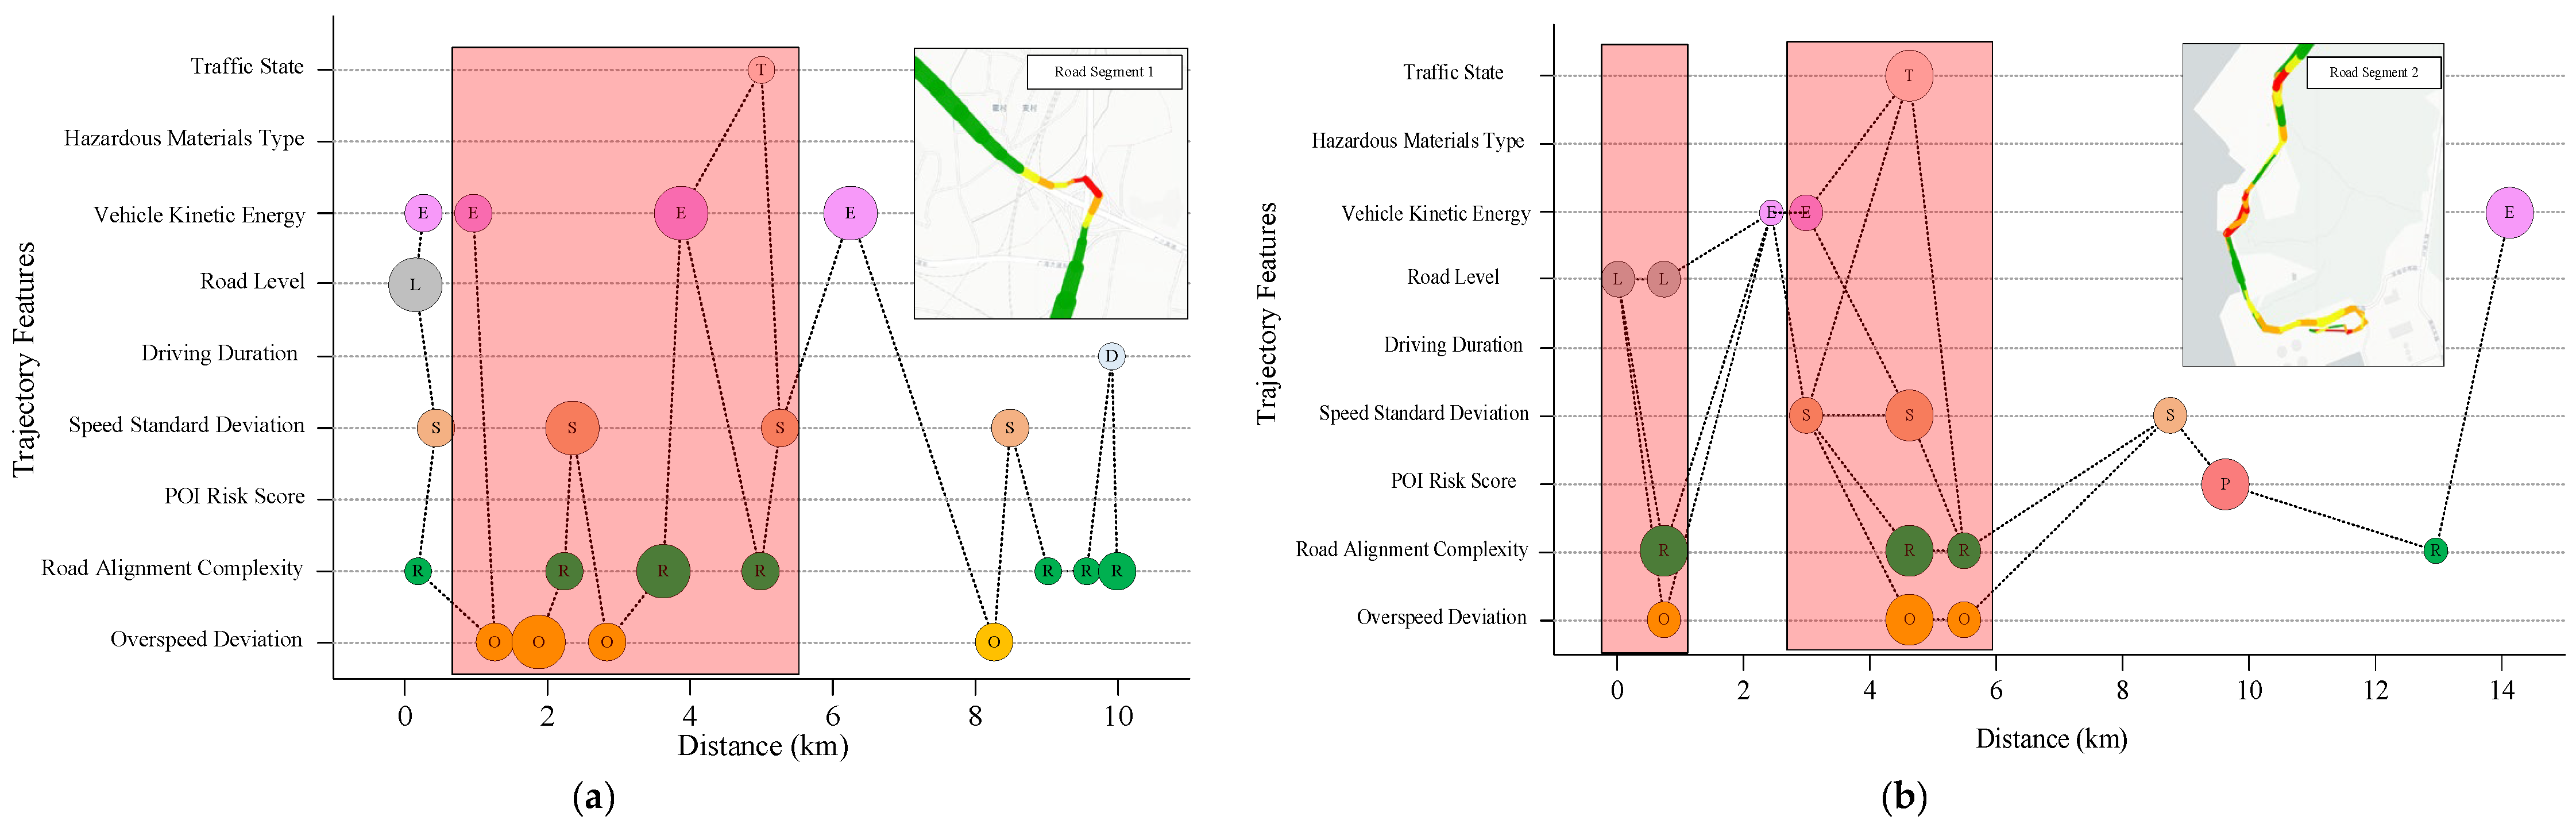

Disclaimer/Publisher’s Note: The statements, opinions and data contained in all publications are solely those of the individual author(s) and contributor(s) and not of MDPI and/or the editor(s). MDPI and/or the editor(s) disclaim responsibility for any injury to people or property resulting from any ideas, methods, instructions or products referred to in the content. |
© 2026 by the authors. Licensee MDPI, Basel, Switzerland. This article is an open access article distributed under the terms and conditions of the Creative Commons Attribution (CC BY) license.