


Abstract
The discharge of untreated paper mill effluent poses significant ecological risks due to its high organic and nutrient loads. This study aimed to assess the phytoremediation potential of Azolla pinnata for treating paper mill effluent. Response Surface Methodology (RSM) and Artificial Neural Network (ANN) modeling approaches were applied and optimization was used for pollutant removal and plant biomass production. Experiments were designed using a Central Composite Design with two independent variables: effluent concentration (0, 50, and 100%) and plant density (10, 20, and 30 g per container). The responses measured were biochemical oxygen demand (BOD), chemical oxygen demand (COD) removal efficiencies, and final biomass yield after 16 days of exposure. RSM produced statistically significant (p < 0.05) second-order regression models for all three responses (coefficient of determination; R2 > 0.98), while ANN showed slightly lower prediction errors within the experimental range studied. Maximum observed removal efficiencies were 91.74% for BOD, 80.91% for COD, and 92.66 g biomass yield under 50% effluent concentration and 30 g plant density. Optimization via both models suggested closely comparable operating conditions (79% effluent concentration and 29 g biomass) for optimal performance. The results indicate that A. pinnata demonstrates potential as a low-cost, nature-based treatment system for industrial effluent remediation under controlled conditions. The integration of data-driven optimization with biological treatment contributes to sustainable effluent management strategies by reducing chemical inputs, minimizing energy demand, and enabling biomass generation with potential downstream valorization.
1. Introduction
The rapid growth of paper and pulp industries around the globe has intensified concerns over their effluent management due to the discharge of highly polluted effluents into freshwater systems [1,2]. Management of paper mill effluent is particularly challenging as it contains a complex mixture of biodegradable and recalcitrant organic compounds, suspended solids, high levels of biochemical oxygen demand (BOD), chemical oxygen demand (COD), lignin derivatives, and nutrient-rich substances such as nitrogen and phosphorus [3]. Discharge of such untreated or partially treated effluents into aquatic ecosystems leads to oxygen depletion, eutrophication, and long-term ecological degradation [4,5]. Traditional treatment technologies such as activated sludge, chemical coagulation, and advanced oxidation processes, though effective, are resource-intensive and often unsustainable for small- and medium-scale industries due to high operational costs, technical complexity, and energy demands [6]. Thus, there is an increasing interest in exploring nature-based and cost-effective remediation approaches that utilize the assimilative capacity of aquatic macrophytes under controlled or semi-natural conditions [7].
Among the available biological treatment systems, phytoremediation has gained recognition as a viable and eco-friendly alternative for managing organic and inorganic pollutants in effluent. Aquatic ferns such as Azolla pinnata are particularly suitable for such applications due to their rapid growth, high nutrient uptake efficiency, and symbiotic association with nitrogen-fixing cyanobacteria (Anabaena azollae), which enhances their ability to thrive in polluted waters [8,9]. A. pinnata not only demonstrates considerable resilience against chemical stressors but also shows high biomass productivity under optimal conditions, making it a dual-purpose candidate for both effluent remediation and biomass valorization [10]. Several studies have reported its efficacy in removing BOD, COD, total nitrogen (TKN), phosphorus, and heavy metals from domestic and industrial effluents [11]. However, the performance of such biological systems depends critically on environmental factors such as plant density, effluent concentration, light availability, and exposure duration, necessitating precise control and optimization to achieve consistent outcomes [12].
Conventional one-factor-at-a-time (OFAT) experimentation, though widely practiced in preliminary screening, fails to capture the interactive and nonlinear effects of multiple input variables on system performance [13,14]. This limitation can be addressed using multivariate optimization techniques such as Response Surface Methodology (RSM), which integrates statistical and mathematical tools to model complex relationships and identify optimal operational conditions with reduced experimental effort [15,16,17]. RSM is particularly effective in quantifying the contribution of individual factors and their interactions through well-structured experimental designs like Central Composite Design (CCD) [18,19]. However, while RSM is robust for linear and quadratic approximations, its predictive accuracy diminishes when system behavior is highly nonlinear or involves threshold-dependent responses [20]. In such contexts, Artificial Neural Networks (ANN), a class of machine learning models inspired by biological neural systems, offer a flexible and powerful alternative for capturing complex input–output relationships without assuming a predefined functional form [21]. ANN models, once trained on experimental datasets, can generalize patterns and provide high-fidelity predictions for untested conditions, thereby aiding in decision-making and process control [22,23].
Over the past decade, RSM has been widely applied in environmental biotechnology to optimize operational variables influencing pollutant removal, including heavy metal biosorption, nutrient removal, and organic load reduction in effluent systems. Its strength lies in a structured experimental design and statistical interpretation of factor interactions. However, RSM performance may decline when system responses exhibit strong nonlinear or threshold-dependent behavior. ANNs have therefore been increasingly applied to effluent treatment modeling, including electrochemical, biological, and hybrid systems, due to their ability to approximate complex nonlinear relationships without predefined functional assumptions. In phytoremediation research, ANN has demonstrated high predictive accuracy in modeling biomass growth and pollutant removal under variable environmental conditions, although its application remains comparatively limited relative to conventional treatment technologies.
Despite these advances, systematic comparative studies integrating RSM and ANN for optimization of macrophyte-based phytoremediation using real industrial effluents remain scarce. Most available studies focus either on synthetic effluent systems or solely on pollutant removal without simultaneously optimizing biomass production. The present study addresses this gap by conducting a structured comparative evaluation of RSM and ANN modeling for predicting and optimizing BOD removal, COD removal, and biomass production of A. pinnata in paper mill effluent. This work is novel in terms of: (i) the simultaneous optimization of pollutant reduction and biomass yield, (ii) the application of both statistical and machine learning approaches under identical experimental conditions, and (iii) validation using real industrial effluent rather than synthetic media. This integrated framework advances data-driven optimization strategies for macrophyte-based industrial effluent remediation.
From a sustainability perspective, the transition toward low-energy, biologically driven effluent treatment technologies is essential to reduce the environmental footprint of industrial discharge. Nature-based systems such as floating macrophyte treatment platforms offer advantages including minimal external energy requirements, reduced chemical dependency, carbon sequestration potential, and opportunities for biomass reuse. Integrating statistical and machine learning optimization tools further improves process efficiency while maintaining environmental compatibility. Therefore, evaluating A. pinnata-based phytoremediation within a sustainability framework strengthens its relevance for decentralized and resource-constrained treatment contexts.
2. Materials and Methods
2.1. Collection of Experimental Materials
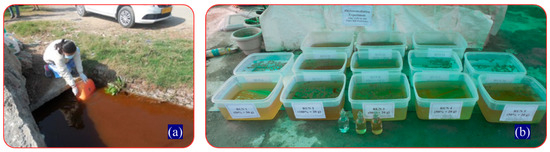
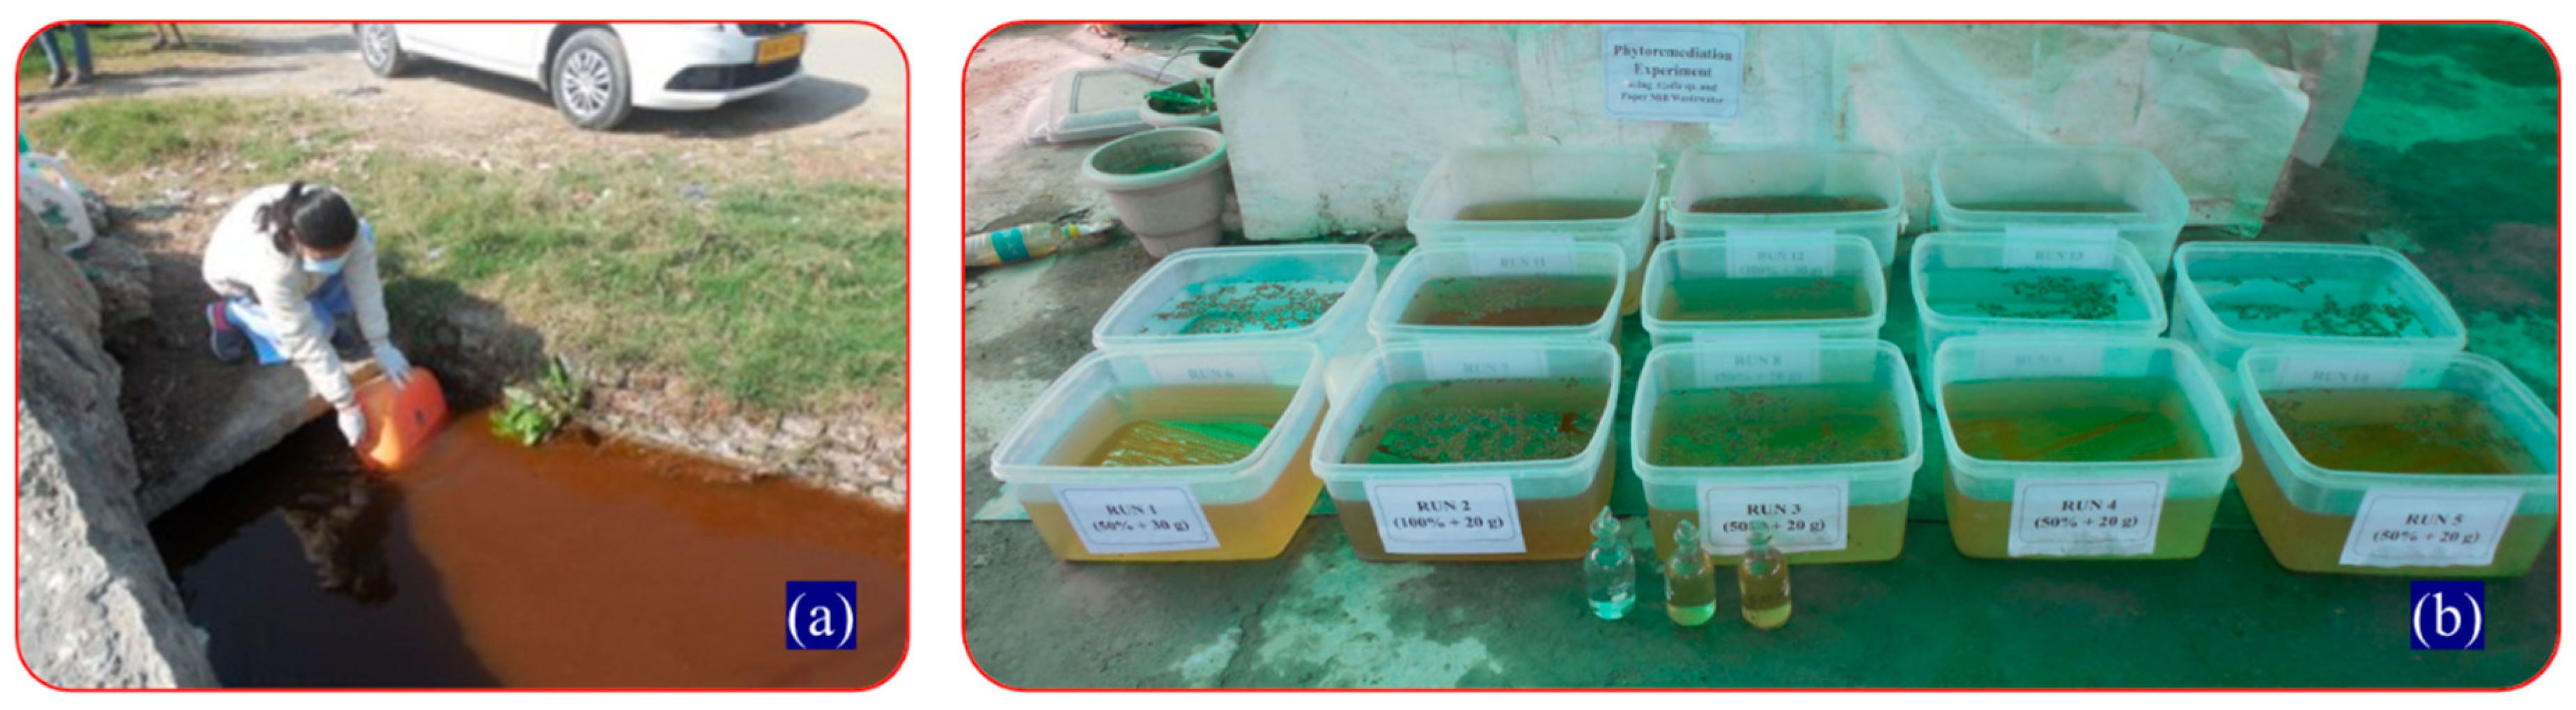
The effluent used in this study was collected from the discharge channel of Star Paper Mill, located in Paragpur village (29°55′51.8″ N and 77°35′25.7″ E), Saharanpur district, Uttar Pradesh, India (Figure 1a). This period coincided with peak discharge activity and stable climatic conditions in the region. The samples were collected in 20 L plastic containers and immediately transported to the laboratory for further analysis and experimentation. Effluent and borewell water were collected during a single representative sampling event. For physicochemical characterization, triplicate analytical measurements were performed on each sample to ensure instrumental precision. These replicates represent technical (analytical) replication rather than independent temporal or spatial biological replicates. Upon arrival at the laboratory, effluent samples were passed through a 1 mm nylon mesh to remove coarse suspended debris and stored in clean, airtight polyethylene containers at 4 °C before experimentation. All experiments and physicochemical analyses were initiated within 48 h of sample collection to minimize physicochemical alterations and microbial degradation. Before the experimental setup, the effluent was homogenized by gentle manual shaking and allowed us to reach ambient temperature (25 ± 2 °C). No chemical preservatives were added to avoid interference with biological treatment processes. The test aquatic fern, i.e., A. pinnata, was sourced from the abandoned sections of the old Ganga canal near Dhanori village in the Haridwar district (29°56′15.3″ N and 77°57′02.0″ E). The plant was acclimatized in a greenhouse for 7 days before its utilization in the final experiments.
Figure 1.
Photos showing (a) collection of paper mill effluent from the discharge channel and (b) experimental setup for phytoremediation using A. pinnata.
2.2. Experimental Design and Operation
The experiments were conducted under controlled environmental conditions at the Greenhouse Facility of Gurukula Kangri (Deemed to be University), Haridwar, during February 2024 (29°55′10.5″ N and 78°07′09.0″ E). This period coincided with the natural proliferation phase of A. pinnata in the Ganga River system, allowing for optimal growth conditions during the experimental run. Greenhouse conditions were maintained to minimize external variability and to simulate natural semi-aquatic environments. A two-factor face-centered Central Composite Design (CCD) was adopted to evaluate linear, interaction, and quadratic effects of effluent concentration (X1) and plant density (X2). For k = 2 factors, the CCD consisted of 4 factorial points (22), 4 axial points located at the faces of the factorial cube (α = 1), and 5 center points, resulting in 13 unique design combinations. The face-centered configuration (α = 1) was selected to maintain experimental feasibility within practical factor limits while enabling estimation of second-order polynomial effects (Table 1a). Each treatment was carried out in a 20 L polyvinyl chloride (PVC) container (Figure 1b).
Table 1.
(a). Face-centered CCD (coded levels) used in this study. (b). Variable setup for A. pinnata cultivation in paper mill effluent.
Three levels of effluent concentration were tested: 0% (control), 50%, and 100%. The 0% concentration was achieved using 15 L of borewell water, the 50% using 7.5 L of borewell water and 7.5 L paper mill effluent, while the 100% using 15 L of undiluted effluent. Each treatment container was inoculated with A. pinnata at varying biomass levels (10, 20, or 30 g), as per the experimental matrix (Table 1b).
Initial plant density was determined as fresh weight (FW). Prior to weighing, plants were gently rinsed with distilled water to remove attached debris and allowed to drain on absorbent paper for 5 min to eliminate excess surface water. Final biomass was measured at day 16 using the same standardized fresh weight protocol to maintain consistency across treatments. The plants were exposed for a period of 16 days, with ambient conditions maintained to simulate natural semi-aquatic environments. A natural photo period of 10 h of darkness and 14 h of light was maintained. During the experimental period, the greenhouse temperature was maintained at 25 ± 2 °C during the day and 20 ± 2 °C at night, monitored using a digital thermo-hygrometer. Relative humidity ranged between 60 and 70%. Light intensity at the plant canopy level averaged 350–450 µmol m−2 s−1 photosynthetically active radiation (PAR). These environmental conditions were maintained consistently throughout the 16-day exposure period to support optimal growth of A. pinnata and minimize external variability. Water loss due to evaporation was monitored daily and compensated with borewell water to maintain a constant volume. Total replacement volume across the 16-day period did not exceed approximately 3–5% of the initial 15 L working volume. Given the low BOD and COD levels in borewell water, the influence of replenishment on overall concentration dynamics was negligible and consistent across treatments. Although replenishment volumes were minimal and applied uniformly across treatments, small dilution effects associated with evaporation compensation cannot be entirely excluded.
2.3. RSM and ANN Modeling
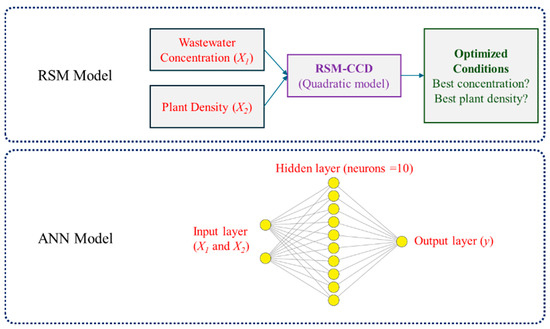
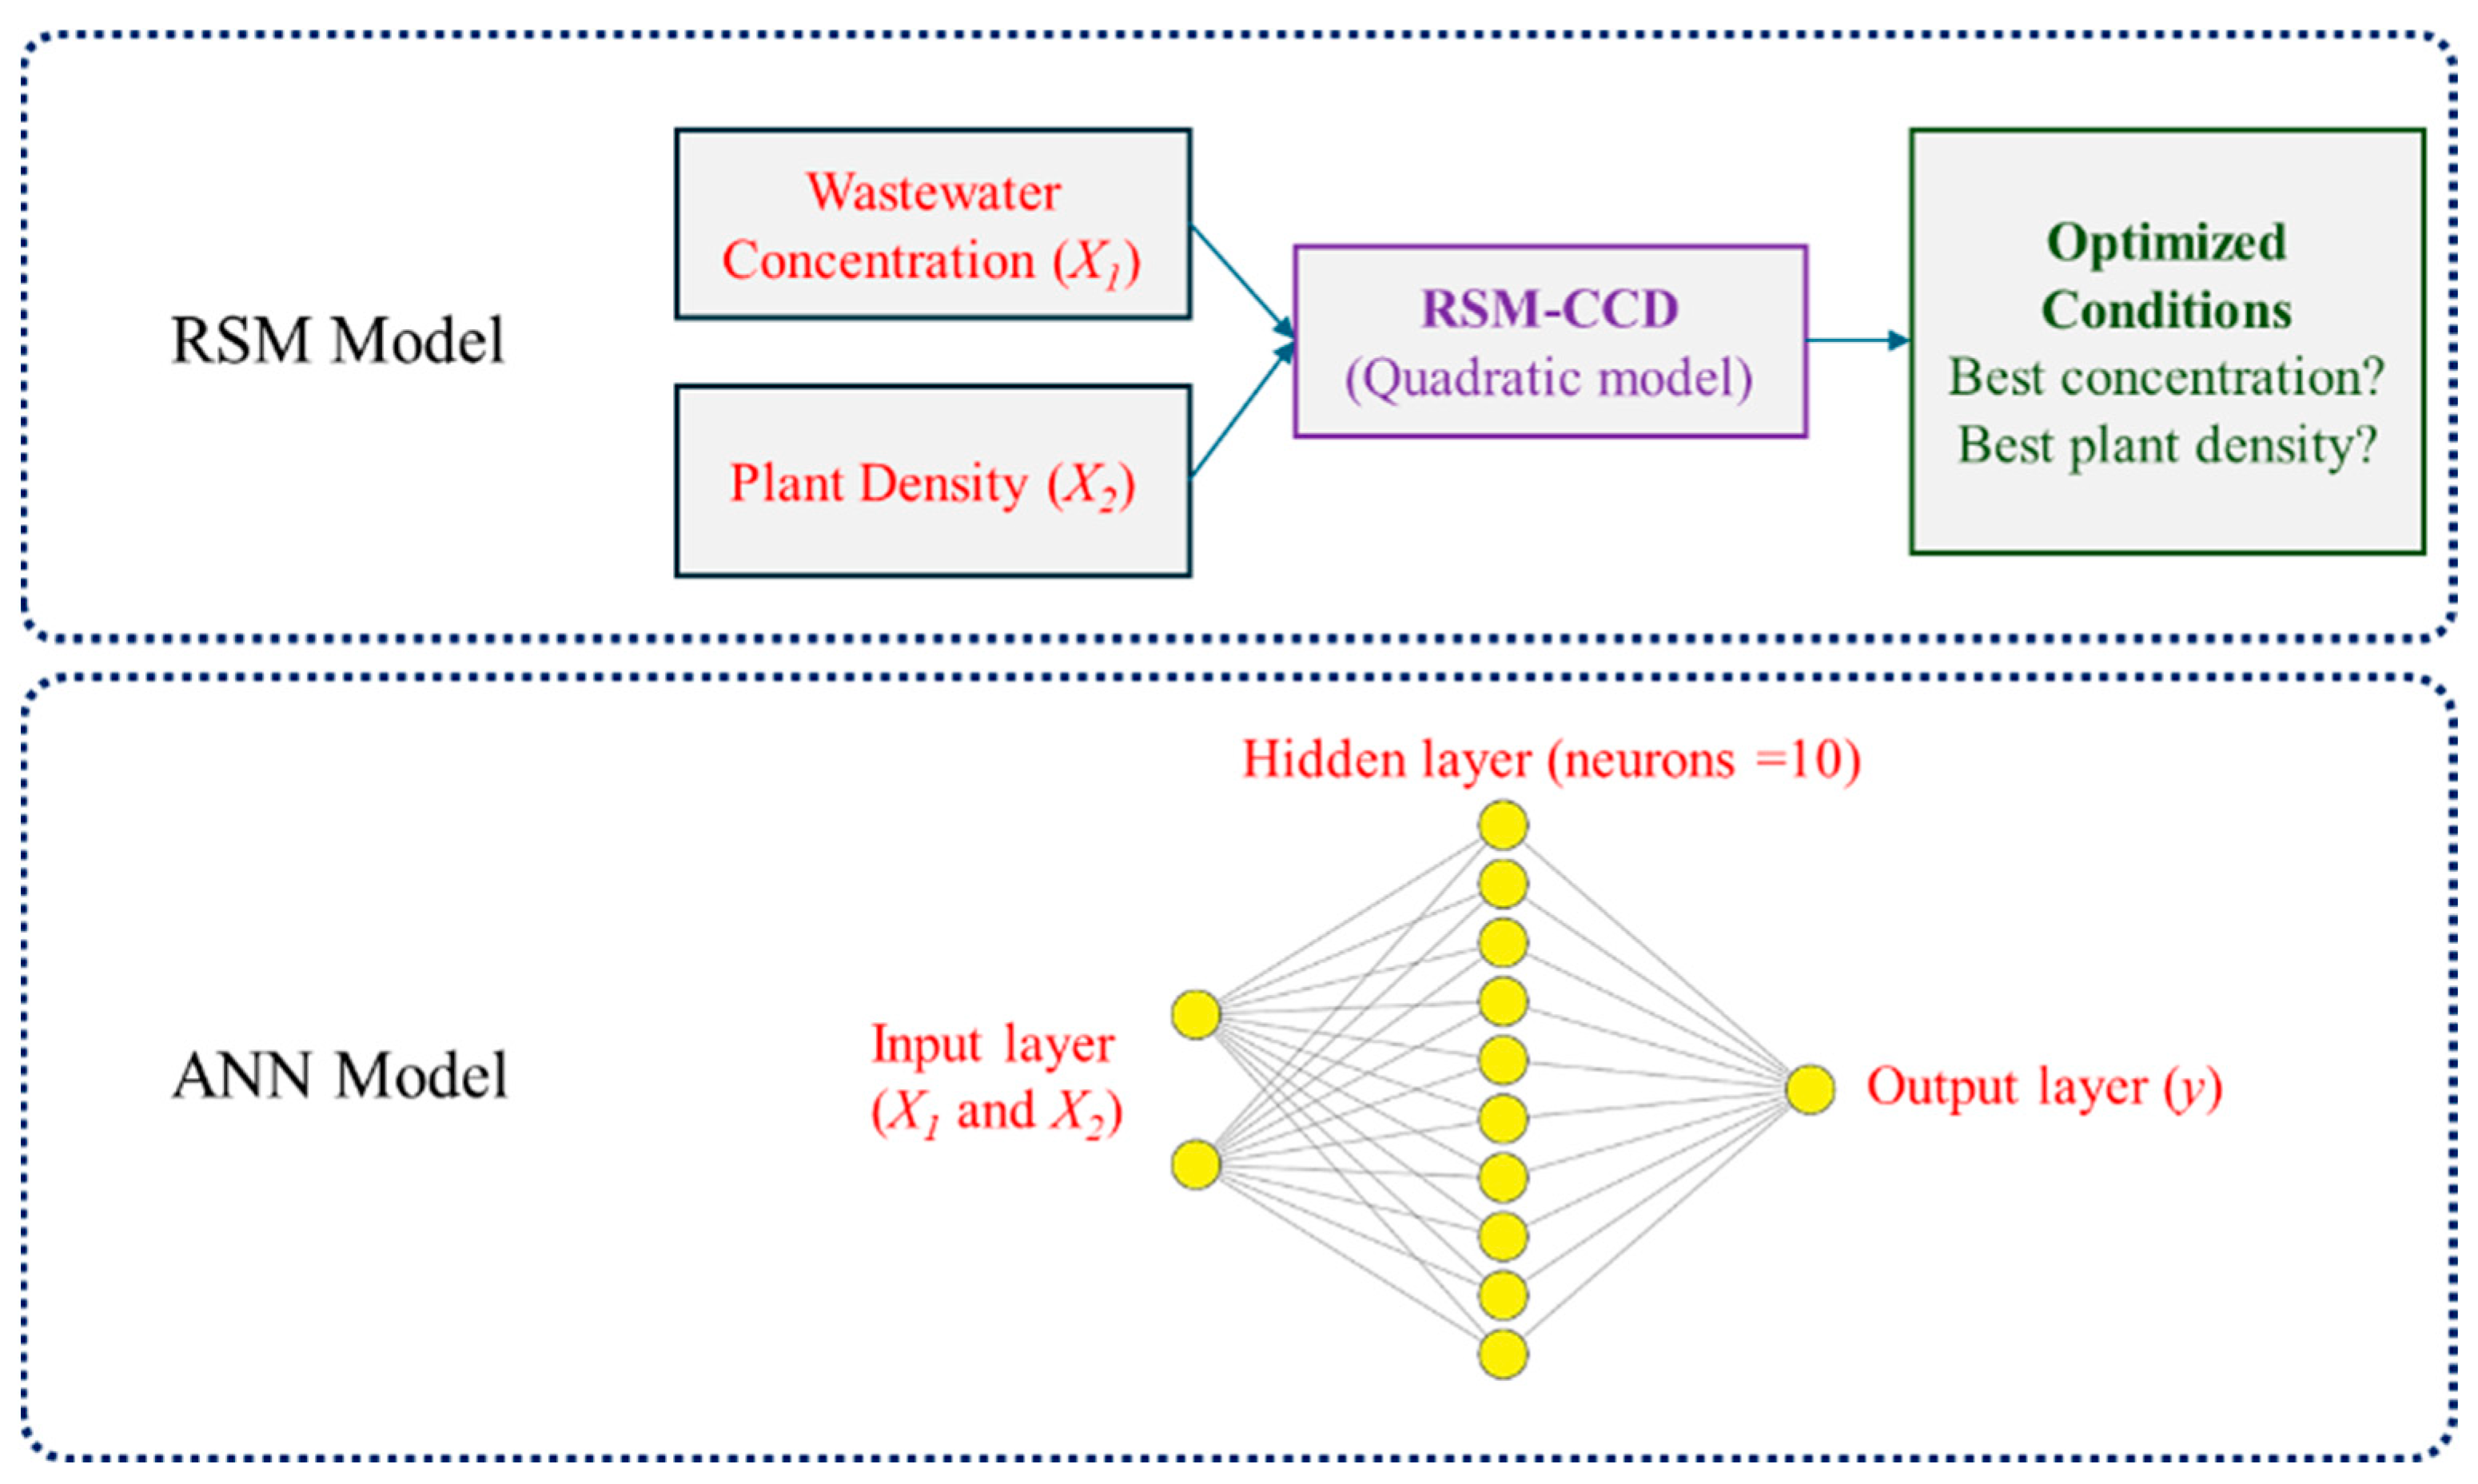
To investigate and optimize the phytoremediation process, two modeling approaches, i.e., Response Surface Methodology (RSM) and Artificial Neural Network (ANN), are shown in Figure 2. The RSM modeling was carried out using a Central Composite Design (CCD) comprising 13 experimental runs. In this experiment, two independent variables were selected, i.e., effluent concentration (X1) at three levels 0% (control), 50%, and 100%, and plant density (X2) at 10 g, 20 g, and 30 g per container. These variables were coded as low (−1), medium (0), and high (+1) to facilitate statistical modeling. The primary responses evaluated were biochemical oxygen demand (BOD) removal percentage, chemical oxygen demand (COD) removal percentage, and final fresh biomass yield (g, FW basis). The three response variables monitored were biochemical oxygen demand (BOD) removal percentage, chemical oxygen demand (COD) removal percentage, and final plant biomass (g). A second-order polynomial (quadratic) model was used to fit the experimental data [24]:
where represents the predicted response; is the intercept term; and are linear coefficients; represents the interaction coefficient; and and denote quadratic coefficients for and , respectively. All treatments were maintained under controlled greenhouse conditions for 16 days.
Figure 2.
Design of RSM-CCD and ANN model used for prediction studies.
Also, an Artificial Neural Network (ANN) model was developed using MATLAB’s Neural Network Toolbox to predict the nonlinear behavior of each response variable. The ANN model was applied as a nonlinear comparative modeling tool within the defined experimental design space rather than as a large-sample predictive machine learning model. A feed-forward backpropagation architecture was implemented, consisting of an input layer with two neurons (corresponding to the input variables X1 and X2), a single hidden layer comprising ten neurons, and an output layer with one neuron representing each response (BOD removal %, COD removal %, and plant biomass). The network was trained using the Levenberg–Marquardt algorithm over 1000 epochs, with the dataset divided into training (70%), validation (15%), and testing (15%) subsets to prevent overfitting and ensure generalization. The number of hidden neurons (n = 10) was selected after preliminary testing within a range of 5–12 neurons, balancing convergence stability and validation performance. Training was performed using the Levenberg–Marquardt backpropagation algorithm with a maximum of 1000 epochs. Early stopping based on validation performance was employed to prevent overfitting. Network weights were initialized using MATLAB’s default random initialization. The selected architecture provided stable convergence without divergence between training and validation errors within the defined experimental design space.
Prior to ANN training, all input and output variables were normalized to the range [0–1] using min–max scaling to improve numerical convergence. RMSE and MSE values reported for ANN were calculated on the normalized scale, while predicted values presented in tables and figures were back-transformed to original units for comparison with experimental data.
The activation function employed in the hidden and output layers was the logistic sigmoid function, defined as [25]:
This function maps the input into a bounded output between 0 and 1, enabling effective modeling of nonlinear relationships. The output of the ANN for each sample was computed using:
where xi are the input variables, wij(1) and wj(2) are the connection weights from input to hidden and hidden to output layers, respectively, and bj(1) and b(2) are the corresponding biases. Separate ANN models were trained for each response to assess the predictive ability and compare performance with the RSM model. Prior to ANN training, all input and output variables were normalized to the interval [0,1] using min–max scaling:
where is the original value and and are the minimum and maximum observed values of the respective variable.
After prediction, normalized outputs were transformed back to original units using inverse scaling:
RMSE and MSE for ANN were calculated on normalized outputs to ensure consistency with network training, whereas values reported in tables and figures represent denormalized predictions in original units.
2.4. Analytical Methods
All physicochemical analyses of the effluent samples were conducted following standard procedures recommended by the American Public Health Association [26]. pH and EC were measured using a calibrated digital multimeter (Model 181, ESICO Int., India) (APHA Method 4500-H+ B and APHA Method 2510 B). Total Dissolved Solids (TDS) were measured using a microprocessor-based meter (Model 1602, ESICO Int., India) (APHA Method 2540 C). Biochemical Oxygen Demand (BOD) was analyzed by the 5-day BOD test at 20 °C (APHA Method 5210 B). Chemical Oxygen Demand (COD) was estimated using the open reflux titrimetric method (APHA Method 5220 B). Total Kjeldahl nitrogen (TKN) was determined via macro-Kjeldahl digestion and distillation (APHA Method 4500-Norg B). Total phosphorus (TP) was measured using a UV-vis spectrophotometer (Cary 60, Agilent, USA) after persulfate digestion (APHA Method 4500-P E). Turbidity was assessed using a nephelometric turbidity meter (APHA Method 2130 B). Calcium (Ca) concentrations were quantified by EDTA titration (APHA Method 3500-Ca B), and magnesium (Mg) levels were determined by complexometric titration after calcium removal (APHA Method 3500-Mg B). All laboratory-grade chemicals and reagents were procured from Merck India Pvt. Ltd. All analytical measurements were performed in accordance with APHA standard protocols. Instruments were calibrated using certified standard solutions prior to analysis. Reagent blanks were included to correct background interference, and selected samples were analyzed in duplicate to verify analytical precision. For turbidity measurements exceeding the instrument range, samples were diluted with distilled water, and appropriate dilution factors were applied to obtain final values within the calibrated measurement range.
2.5. Data Analysis
Biomass production refers to the final fresh weight measured at day 16. Since identical draining and weighing procedures were applied to both initial and final measurements, net biomass increase was implicitly captured within the final biomass response variable. Removal efficiency is defined as the percentage reduction in a contaminant’s concentration from the initial to the final stage of treatment, indicating the effectiveness of the treatment process [27]. BOD and COD removal were quantified using removal efficiency, calculated as:
where Ci is the initial concentration, and Cf is the final concentration after treatment. This formula was applied to assess pollutant reduction across all experimental runs. Initial concentrations for each dilution level (0%, 50%, and 100%) were predetermined by volumetric mixing and remained constant across corresponding design runs.
To evaluate and validate the predictive accuracy of both the RSM and ANN models, multiple statistical performance indicators were employed. The coefficient of determination (R2) was used to indicate the proportion of variance explained by the model [28]:
where yi is the observed value, ŷ is the predicted value, and ȳ is the mean of observed values.
Model efficiency (ME) was calculated using the Nash–Sutcliffe efficiency formulation [29]. Under the present formulation, ME is mathematically equivalent to the coefficient of determination (R2). Therefore, both metrics are reported only to facilitate interpretative comparison within environmental modeling literature and should not be interpreted as independent performance indicators. Under the present formulation, ME is mathematically equivalent to the R2. Both metrics are reported to facilitate interpretative comparison within environmental modeling contexts rather than as independent performance indicators.
Root mean square error (RMSE) and mean square error (MSE) were used to quantify prediction errors [30]:
These validation parameters collectively assessed the models’ precision, reliability, and generalization capability.
2.6. Software and Statistics
All statistical analyses and graphical representations for RSM were performed using Design-Expert software (version 12, Stat-Ease Inc., Minneapolis, MN, USA). Artificial neural network modeling was conducted in MATLAB (R2023a, MathWorks Inc., Natick, MA, USA) using the Neural Network Toolbox. Data preprocessing, normalization, and performance evaluation metrics were computed within MATLAB. Student’s t-test, descriptive statistics, and data validation were performed using Microsoft Excel 2021. All statistical analyses were conducted at a 95% confidence level (p < 0.05), and model adequacy was confirmed through residual diagnostics and goodness-of-fit criteria.
3. Results and Discussion
3.1. Properties of Experimental Effluent
As shown in Table 2, the physicochemical properties of the paper mill effluent had significantly high pollutant loads compared to borewell water, with all parameters differing at statistically significant levels (p < 0.05). Specifically, the pH (8.14) of effluent approached the upper irrigation limit, which indicated moderate alkalinity potentially probably arising from alkali-based pulping chemicals. Also, EC (5.33 dS/m), TDS (1439.22 mg/L), BOD (817.21 mg/L), and COD (1765.07 mg/L) showed high organic and oxidizable load that surpassed the Central Pollution Control Board’s permissible discharge limits [31]. This might be due to the presence of lignin, cellulose derivatives, and residual bleaching agents in the effluent. On the other hand, nutrient parameters such as TKN (111.60 mg/L) and TP (90.99 mg/L) exceeded the recommended irrigation thresholds. High turbidity (1844 NTU) also indicated the presence of fine suspended solids and colloidal matter. Although Ca and Mg levels remain within irrigation limits, their combined hardness may affect long-term soil structure. Thus, the results showed the unsuitability of paper mill effluent for direct agricultural use and indicate the necessity for effective pre-treatment before discharge on open-lands or water bodies. The present investigation focused primarily on organic load reduction (BOD and COD) and biomass production. Heavy metal bioaccumulation in plant tissues was not analyzed, as the effluent characterization indicated that major pollutant concern was associated with high organic and nutrient loads rather than elevated trace metal concentrations. Nevertheless, assessment of metal uptake and potential toxicity in harvested biomass remains important for determining downstream biomass utilization pathways and warrants targeted investigation in future studies.
Table 2.
Physicochemical properties of paper mill effluent and borewell water, with statistical comparison and irrigation suitability limits.
Similar findings were reported by [33] who observed that paper mill effluent had alkaline (pH~8.8), EC~1800 µS/cm (≈1.80 dS/m), TDS >2091 mg/L, TSS~1018 mg/L, and BOD~520 mg/L, showing high pollutant loads. Recently, Shankar [2] also recorded that paper mill effluent had pH 1.8–9.84; TDS 1518–3032 ppm; TSS 200–1220 ppm; turbidity 113–481 NTU; BOD 356–1342 mg/L; and COD 882–2710 mg/L, which corroborate the results of the present study.
3.2. Effect of Effluent Concentration and Plant Density on Responses
The results of this study showed that both factors (effluent concentration and plant density) significantly influence BOD and COD removal, as well as biomass production by A. pinnata (Table 3). At moderate effluent concentration (50%) and higher plant density (30 g), the experiment exhibited the highest BOD (91.74%) and COD (80.91%) removal, along with maximum biomass yield (92.66%). These results suggest that A. pinnata grows optimally under balanced nutrient availability and sufficient plant coverage, which may facilitate organic matter assimilation and rhizosphere-associated microbial processes, as reported in floating macrophyte systems. In contrast, low effluent concentrations (0%) resulted in minimal removal efficiencies and biomass production, indicating nutrient limitation. Similarly, high effluent concentrations (100%) combined with low plant density (10–20 g) led to reduced performance, likely due to toxicity from excessive organic load and insufficient plant coverage to support remediation processes. It was evident that increasing plant density improves pollutant removal at all effluent levels, thus making a positive contribution of biomass to treatment capacity. Also, center-point replicates (50% effluent, 20 g density) produced consistent responses, reinforcing the reliability of observed trends. In this, medium effluent concentration (50%) could have provided balanced nutrient availability without imposing toxic stress, thereby facilitating optimal metabolic activity and pollutant uptake by A. pinnata. Also, high plant density enhanced the overall surface area for nutrient assimilation and microbial interactions, improving the efficiency of pollutant removal and biomass accumulation. Overall, the results indicate that both effluent strength and plant density must be co-optimized to ensure effective phytoremediation and sustainable biomass accumulation.
Table 3.
Central composite design (CCD) matrix of response surface methodology (RSM) for prediction of BOD/COD removal and A. pinnata biomass production using paper mill effluent.
The consistently higher removal efficiency observed for BOD compared to COD across treatments can be attributed to differences in pollutant composition. BOD primarily represents the biodegradable fraction of organic matter that can be metabolized by microbial communities associated with A. pinnata and its rhizosphere. In contrast, COD measures the total oxidizable organic load, including recalcitrant compounds such as lignin derivatives, chlorinated phenolics, and complex aromatic structures commonly present in paper mill effluent. These constituents are not readily biodegradable within the 16-day exposure period, resulting in comparatively lower COD removal. Therefore, the observed discrepancy between BOD and COD reduction reflects selective biodegradation of labile organic compounds, while persistent fractions contribute to residual COD levels. The present study did not include direct measurements of dissolved oxygen, redox potential, microbial community dynamics, or nutrient transformation kinetics. Therefore, proposed mechanisms are interpreted in light of established phytoremediation literature rather than direct biochemical verification. Detailed mechanistic investigations would require dedicated process-level experimentation beyond the modeling objective of this study.
Comparable removal trends have been reported for A. pinnata treating other effluent types. In dairy effluent systems, BOD and COD reductions above 80% have been documented under moderate nutrient loading, primarily driven by rapid biomass proliferation and microbial symbiosis [9]. Similarly, studies on domestic sewage have demonstrated effective nutrient assimilation and organic load reduction, though performance varies depending on hydraulic retention time and initial pollutant strength [34]. In mixed industrial effluents, removal efficiencies tend to decline when refractory compounds predominate, consistent with the comparatively lower COD removal observed in the present work. However, the biomass yield recorded in this study (up to 92.66 g) exceeds several reports for municipal effluent, likely due to elevated nitrogen and phosphorus levels in paper mill effluent that stimulate vegetative propagation. These comparisons indicate that A. pinnata maintains broad applicability across effluent types, while treatment performance remains strongly influenced by influent composition and pollutant biodegradability.
In a previous study, Ahmad [35] evaluated A. pinnata alongside Scirpus grossus and Salvinia molesta in greenhouse experiments using pulp and paper mill effluent with an initial COD of approximately 72.4 mg/L. They observed substantial color removal and near-complete COD reduction over a 28-day period. However, it is important to note that the influent COD in that study was considerably lower than that used in the present investigation (1765.07 mg/L). Higher organic loads typically present greater treatment complexity due to increased refractory fractions. Therefore, while percentage removal comparisons indicate consistent phytoremediation potential, performance should be interpreted within the context of initial pollutant concentration and treatment duration. The present study extends previous findings by evaluating optimization under high-load industrial effluent conditions.
3.3. Comparative Evaluation of RSM and ANN Models
The CCD matrix indicates strong concordance between measured and predicted values across all three responses, with the ANN model providing slightly closer estimations to measured values within the experimental design space evaluated in this study (Runs 1, 5, and 12). The RSM-derived regression models for BOD, COD, and biomass exhibited high statistical significance (p < 0.05) with strong goodness-of-fit metrics: R2 values of 0.9913, 0.9902, and 0.9898, respectively, and high adequate precision values (>30), indicating strong signal-to-noise ratios. The difference between adjusted and predicted R2 values for all responses was less than 0.06, well below the commonly accepted threshold of 0.2 for adequate predictive agreement. Residual diagnostics, including normal probability plots and residuals versus predicted values, were examined to verify normality and homoscedasticity assumptions. No systematic trends or variance inflation were observed, supporting the adequacy of the quadratic models. The insignificant lack-of-fit p-values (p > 0.05) support the adequacy of the RSM models within the studied experimental range. The face-centered CCD enabled independent estimation of quadratic effects (X12 and X22) due to inclusion of axial and replicated center points. Variance inflation factor (VIF) values for all model terms were below 5, indicating absence of severe multicollinearity among predictors. Experimental variance was estimated from replicated center points, as customary in CCD analysis. This allowed separation of residual error into lack-of-fit and pure error components despite single observations at factorial and axial locations. The adequacy of the quadratic model was further confirmed through agreement between adjusted and predicted R2 values and residual diagnostics. Significant influential factors across responses were linear and interaction effects of effluent concentration (X1) and plant density (X2), while the quadratic term X22 was consistently non-significant, as shown in the ANOVA results of the RSM model in Table 4. Detailed ANOVA tables including individual term statistics, lack-of-fit analysis, and pure error components are provided in the Supplementary Material (Table S1). The following second-order polynomial equations can be used for RSM-based prediction of BOD and COD removal and A. pinnata biomass production:
y (BOD removal) = 74.94 + 17.75 X1 + 16.98 X2 + 13.86 X1X 2 − 39.48 X12 − 2.25 X22
y (COD removal) = 67.42 + 16.19 X1 + 15.16 X2 + 11.37 X1X2 − 33.56 X12 − 4.31 X22
y (Biomass production) = 75.71 + 12.59 X1 + 17.70 X2 + 14.83 X1X2 − 39.43 X12 − 2.13 X22
Table 4.
Summary of developed RSM model parameters and significant terms.
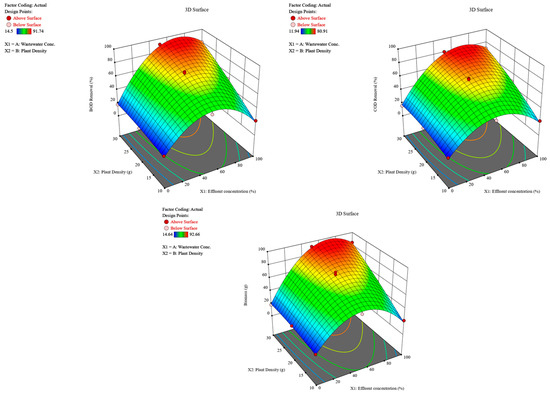
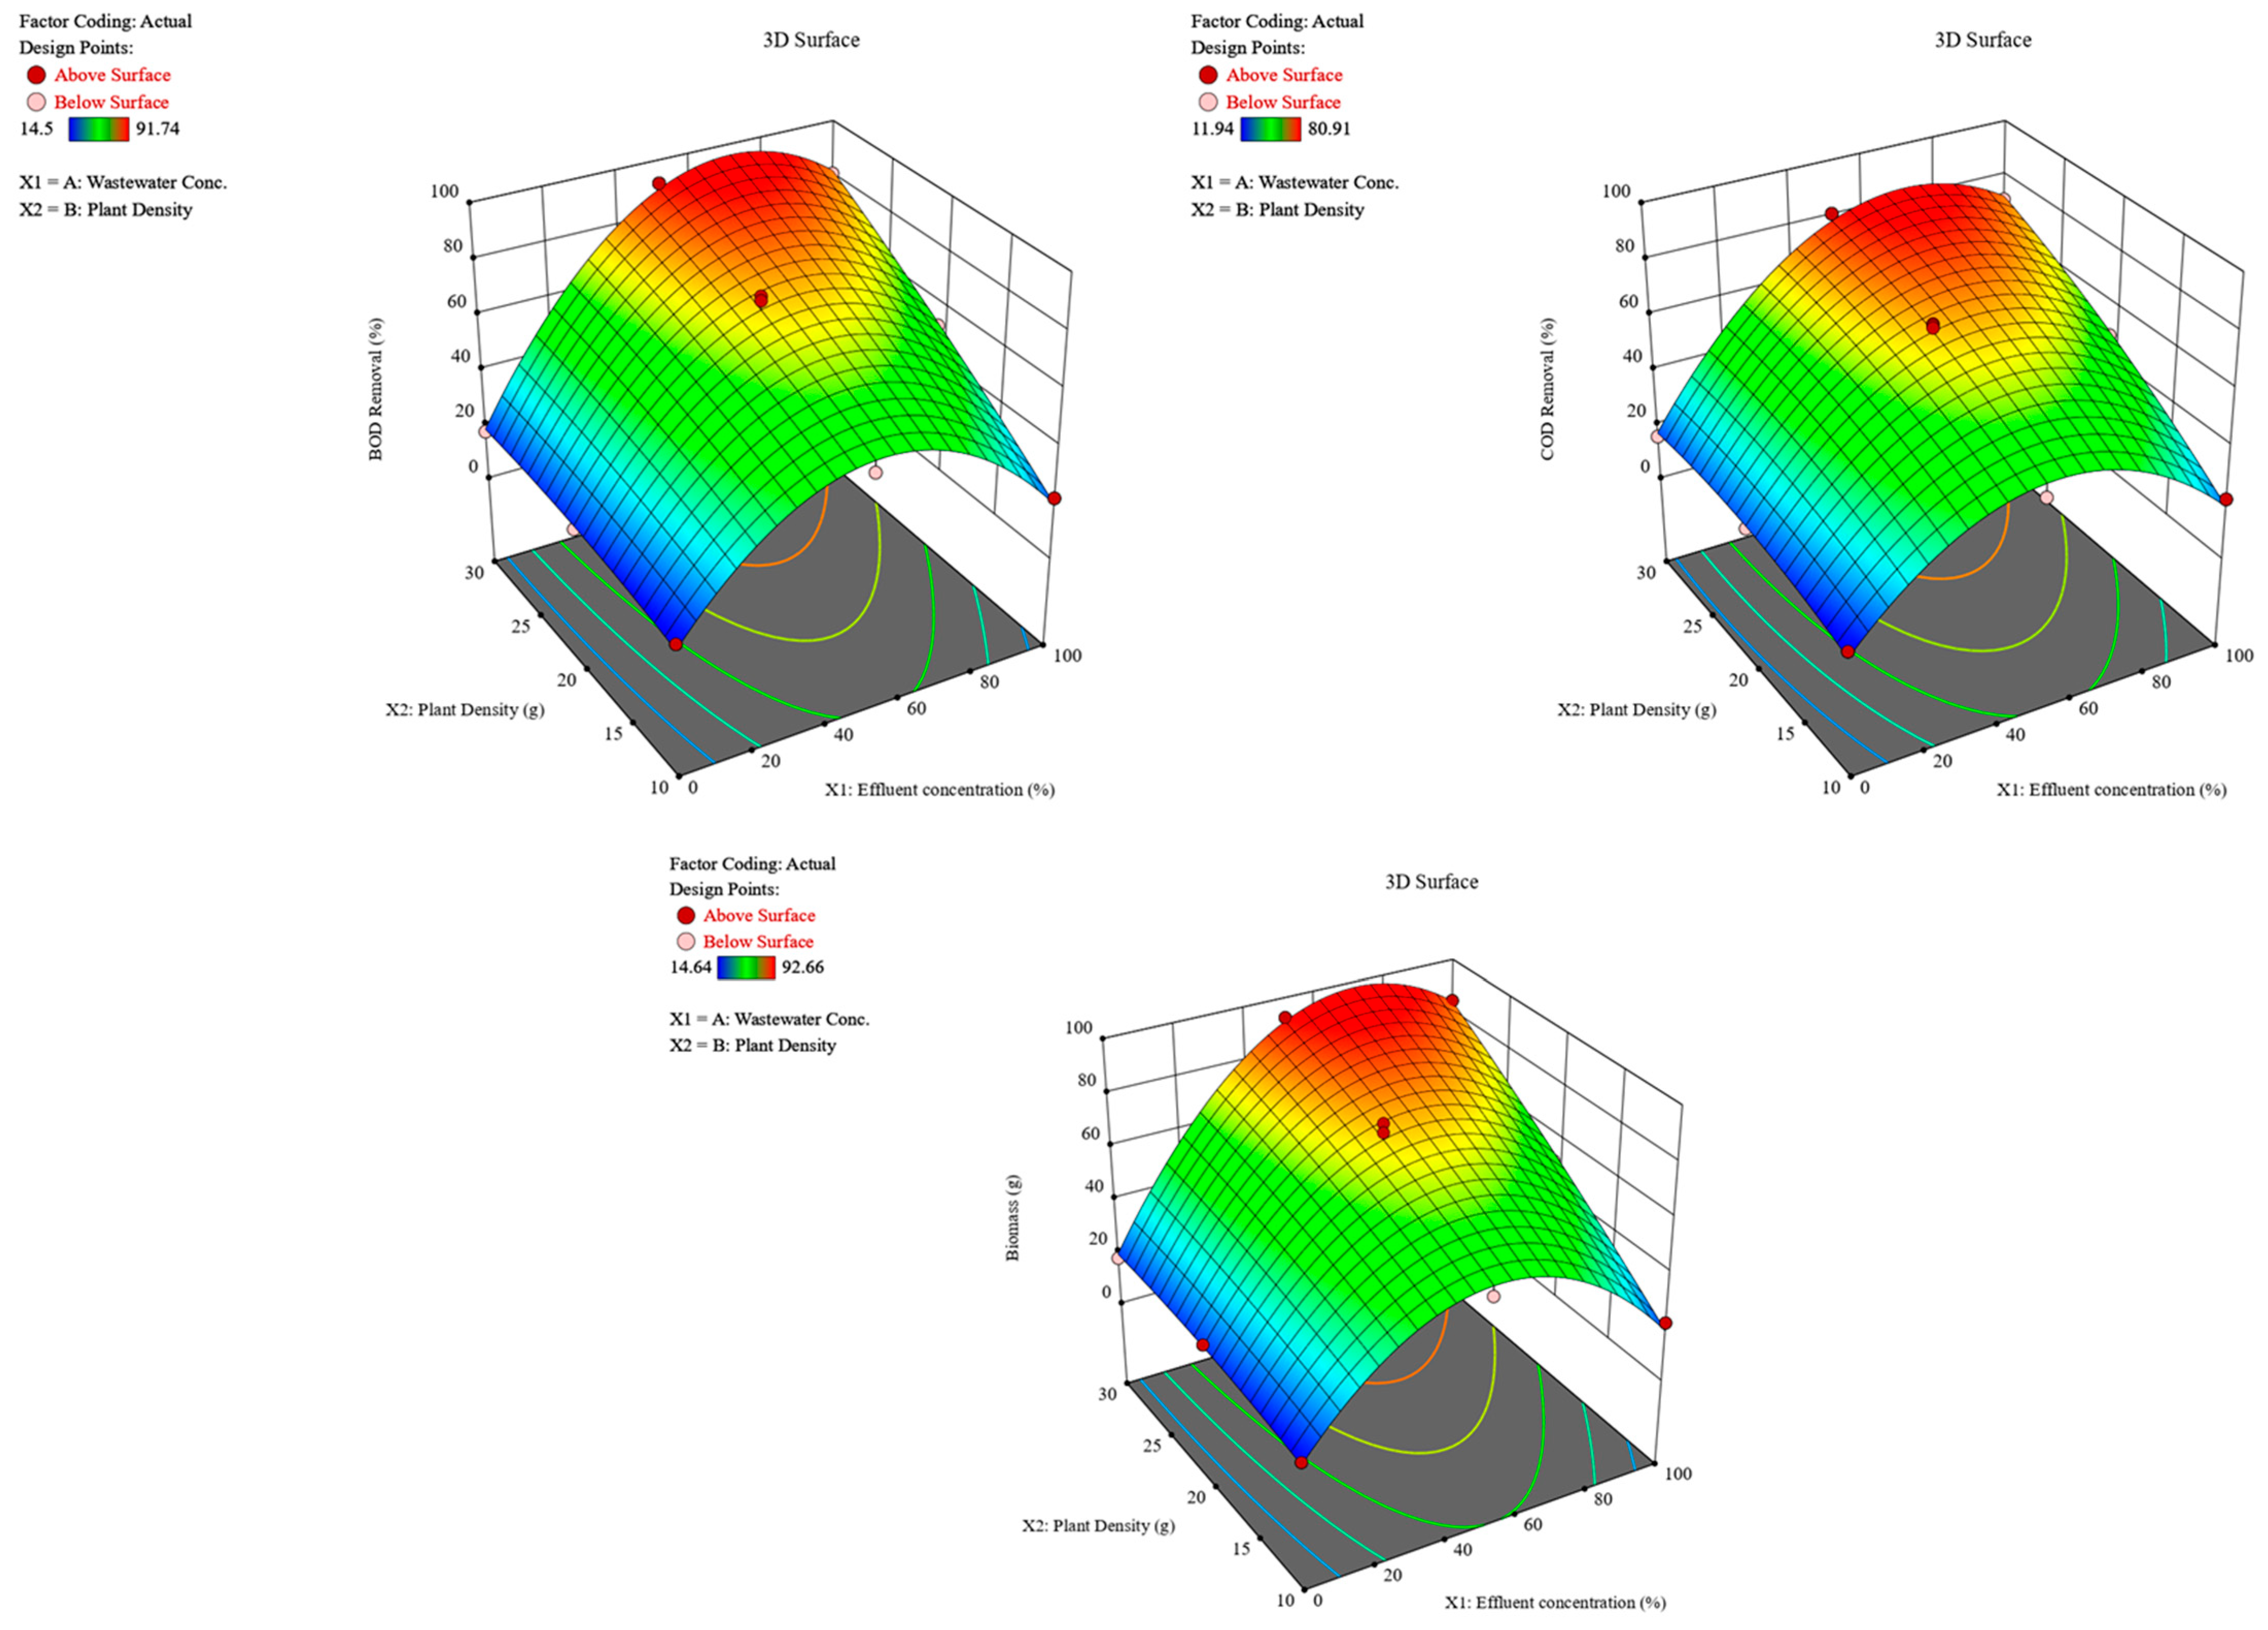
The 3D response surface plots shown in Figure 3 indicated the interactive influence of effluent concentration and plant density on BOD and COD removal efficiencies and A. pinnata biomass yield. All three surfaces exhibit a distinct curvature, indicating significant second-order effects, with maxima observed at moderate-to-high plant density (30 g) and effluent concentration near 50–75%. These trends align with the quadratic regression model findings, where both linear and interaction terms were significant. The contour patterns confirm that excessive or minimal levels of either factor lead to diminished response values.
Figure 3.
Three-dimensional response surface plots illustrating the effects of effluent concentration and plant density on BOD removal, COD removal, and biomass production of A. pinnata.
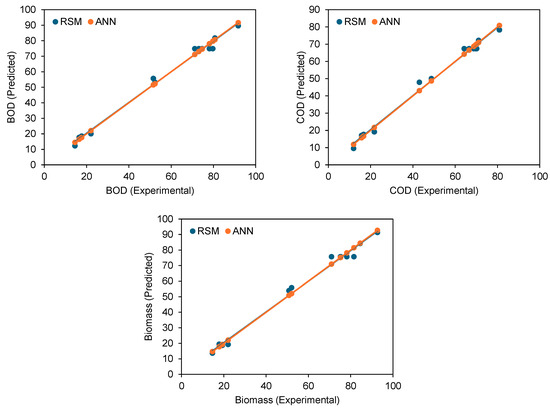
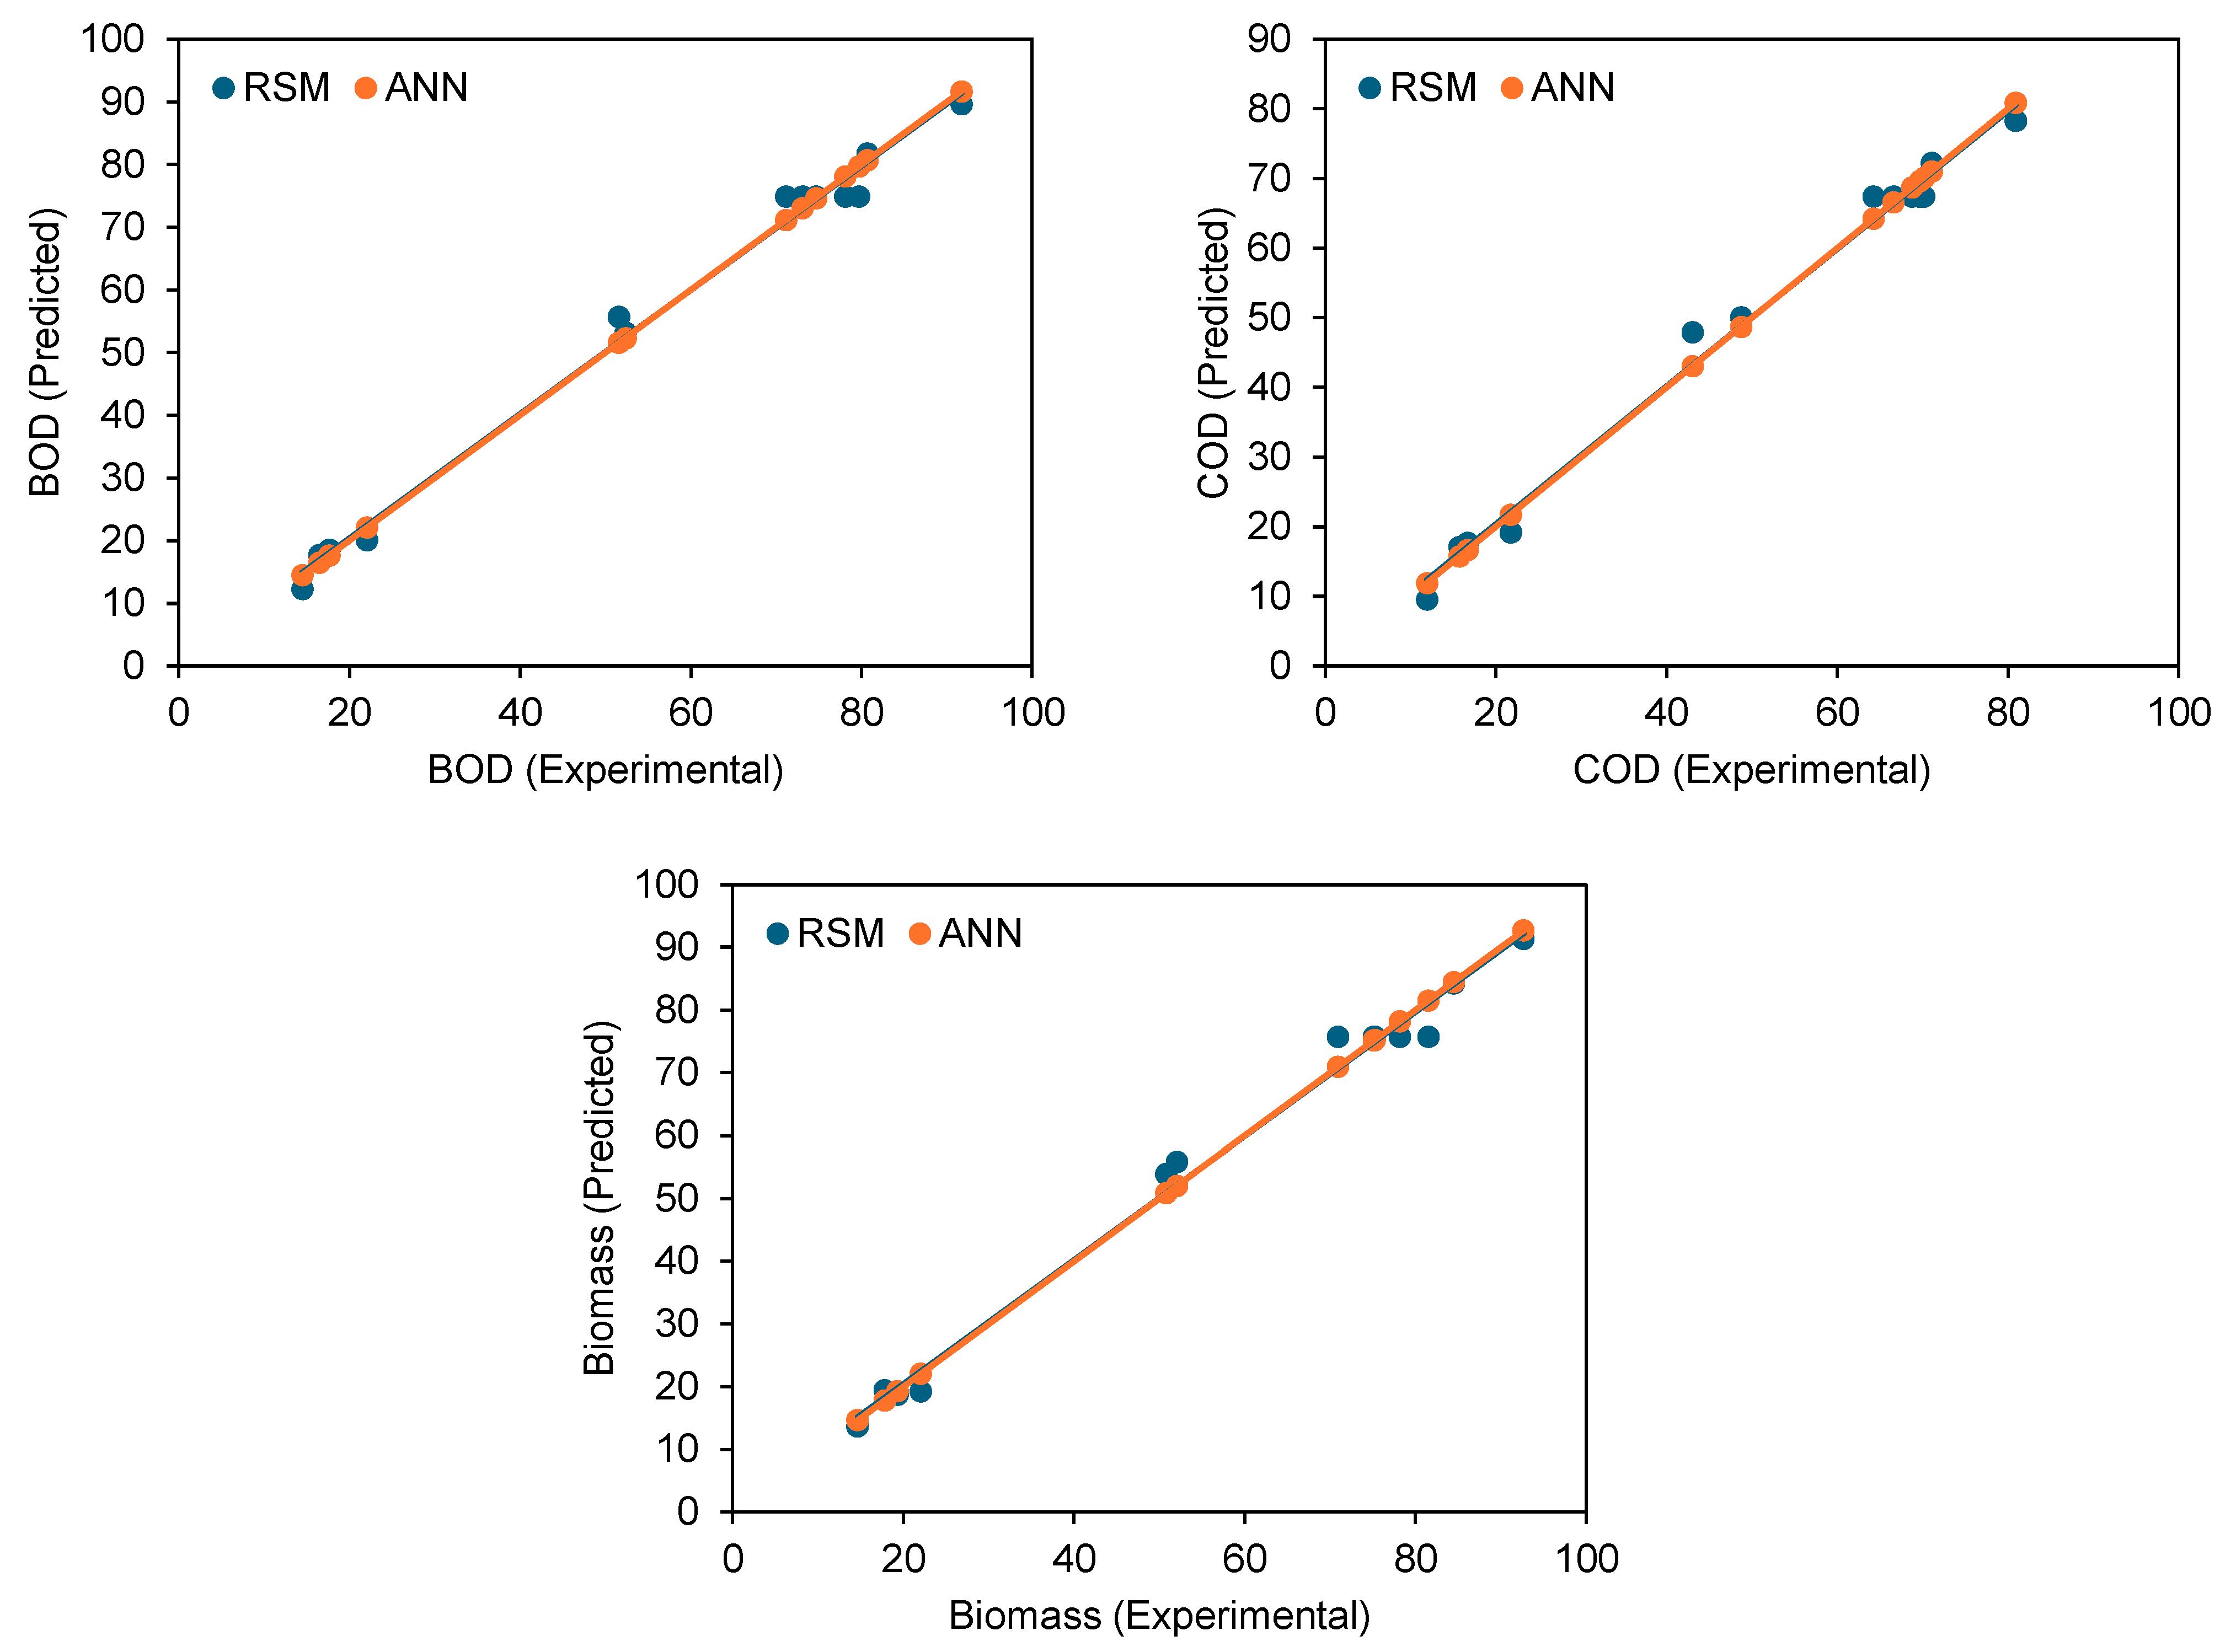
On the other hand, the ANN model captured subtle non-linearities in some response trends with greater precision, particularly for biomass prediction, where predicted values nearly matched measured outputs even at design extremes. This behavior may reflect the flexibility of ANN in capturing nonlinear relationships within the limited dataset used in the present experimental design. However, RSM offers clear analytical interpretability through its mathematical equations, enabling insight into the direction and strength of variable effects. Collectively, both models demonstrate high accuracy and complementarity; RSM has valuable mechanistic understanding and statistical inference, while ANN demonstrates good predictive performance within the studied parameter range. The parity plots given in Figure 4 further validate model accuracy by showing a tight clustering of predicted versus experimental values along the 1:1 line for all three parameters. Therefore, both RSM and ANN models display high predictive fidelity; however, ANN predictions align slightly more closely with the ideal diagonal line, particularly for biomass data.
Figure 4.
Experimental vs. RSM and ANN predicted BOD/COD removal and biomass production.
RSM and ANN approaches have been widely accepted in phytoremediation and other studies. Out of them, Sumathi et al. [36] found that under a semi-batch fermenter with paper industry effluent, RSM and ANN reached R2 > 0.9627 in dissolved-oxygen prediction. Similarly, Adeogun et al. [37] conducted experiments for pollutant removal and energy consumption from pulping effluent and found that the ANN model produced a near-perfect fit (R2 > 0.999, MSE ≈ 0.0075), outperforming the RSM-based regression in modeling COD and other pollutant removals. Also, Kermet-Said et al. [38] observed that during the treatment of pharmaceutical effluent and predicting suspended solids removal efficiency and COD removal efficiency, the ANN achieved R2 values of 0.9783 and 0.9826, respectively, indicating better accuracy over RSM.
3.4. Validation and Optimization of RSM and ANN Models
Table 5 shows the model validation results of both RSM and ANN, which exhibited acceptable predictive capabilities for BOD and COD removal and A. pinnata biomass production, with R2 values consistently above 0.98. However, the ANN model exhibited lower numerical RMSE values within the defined CCD experimental space. This indicates that while both models capture the original data trends, ANN produced marginally smaller residual errors within the constrained experimental design space evaluated in this study. The ME values for both RSM and ANN were consistently high (0.99). Because ME is mathematically equivalent to the coefficient of determination (R2) under the formulation used in this study, both metrics reflect the same goodness-of-fit and are presented only for interpretative comparison. However, the MSE values were markedly lower for ANN (0.04–0.07) compared to RSM (5.71–7.78), indicating low prediction variance for both modeling approaches within the studied experimental range. On the other hand, optimization results given in Table 6 further corroborate the models’ utility in identifying ideal experimental conditions. The optimized values, i.e., effluent concentration at 79.37% and plant density at 29.25 g, represent model-derived optimum conditions predicted by the RSM–ANN optimization framework: 93.07% BOD removal, 81.87% COD removal, and 95.04 g biomass yield. These model predictions are in close numerical proximity to experimentally observed values obtained within the CCD experimental runs (91.74%, 80.91%, and 92.66 g), supporting the internal consistency of the fitted models within the tested design space. Experimental values obtained at 50% effluent concentration and 30 g plant density approximate the predicted optimum region, indicating coherence between modeled trends and observed data within the investigated parameter range. ANN performance metrics represent aggregated results obtained from the full dataset after completion of training, validation, and testing phases within the defined CCD space. Overall, the integrated modelling and optimization approach adopted in this study could be a reliable decision-making tool for efficient phytoremediation using A. pinnata. However, the optimized conditions reported here represent statistical optima derived from the fitted models and have not yet been independently verified through additional confirmatory experiments.
Table 5.
Comparative analysis of model validation parameters for both RSM and ANN.
Table 6.
Model-derived optimization results for enhanced BOD/COD removal and biomass production of A. pinnata using paper mill effluent.
The optimized conditions represent numerical optima derived within the bounded design space of the CCD model. While independent confirmatory experimentation at the exact predicted coordinates is desirable for scale-up purposes, the present study focuses on model-based optimization and comparative predictive performance. Experimental validation under optimized conditions will be reported separately in subsequent applied investigations. Optimization of effluent treatment conditions is crucial for system performance and suitability. In previous studies, Irfan et al. [39] studied the removal of pollutants from synthetic effluent and found that optimum operating parameters were: 44 rpm disk rotational speed, a 1.07 membrane-to-disk gap, and a 10.2 g COD/m2 d organic loading rate.
From a sustainability assessment standpoint, the observed high removal efficiencies under moderate effluent concentrations indicate that biological treatment could reduce reliance on energy-intensive tertiary processes. The simultaneous production of biomass suggests potential integration with biomass-based value chains, thereby aligning effluent remediation with circular resource recovery principles.
4. Conclusions
The present study demonstrates that A. pinnata can be applied for biological treatment of paper mill effluent while simultaneously generating biomass. Model-based optimization identified operating conditions predicted to enhance BOD and COD reduction; however, these values represent statistical optima derived from the modeling framework and require independent experimental validation while promoting biomass production of A. pinnata under moderate effluent concentration and high plant density. Comparative modeling indicated that while both RSM and ANN demonstrated strong predictive capabilities within the studied conditions, ANN captured nonlinear trends with slightly lower residual errors within the experimental conditions evaluated. However, the predictive performance of the ANN model should be interpreted within the limited dataset and defined CCD space used in the present investigation. RSM provided critical information about experimental control factor interactions. The combination of both approaches can provide better model validation, facilitate decision-making, and improve scaling the system for real-world applications. The results indicate that A. pinnata demonstrates potential suitability for decentralized effluent treatment applications under controlled conditions, pending further pilot-scale and field-based validation.
From a sustainability perspective, the integration of phytoremediation with computational optimization supports the development of low-energy, nature-based effluent management systems suitable for decentralized industrial applications. The approach reduces dependency on chemical-intensive treatment technologies while enabling biomass generation that could potentially contribute to circular bioresource utilization pathways.
Future investigations should quantify metal uptake, assess biochemical stress markers, and evaluate safe utilization strategies for harvested biomass to enable comprehensive environmental risk assessment. The experimental findings are derived from controlled greenhouse-scale systems and therefore do not directly account for hydraulic complexity, seasonal environmental fluctuations, pest dynamics, long-term operational stability, or shock loading conditions encountered in field applications. Scale-up feasibility requires dedicated pilot-scale validation incorporating engineering, ecological, and operational considerations. These optimized values represent numerical solutions derived from statistical modeling and require independent experimental confirmation for field-scale validation.
Supplementary Materials
The following supporting information can be downloaded at: https://www.mdpi.com/article/10.3390/su18063036/s1, Table S1: ANOVA tables.
Author Contributions
Conceptualization, M.G., V.K. and A.B.; Methodology, M.G., V.K. and A.B.; Software, M.G., I.Š. and Ž.A.; Validation, A.B., I.Š. and Ž.A.; Formal analysis, M.G.; Investigation, M.G.; Resources, V.K. and A.B.; Data curation, M.G., I.Š. and Ž.A.; Writing—original draft, M.G.; Writing—review & editing, V.K., A.B., I.Š. and Ž.A.; Visualization, I.Š.; Supervision, V.K. and A.B.; Project administration, A.B.; Funding acquisition, I.Š. and Ž.A. All authors have read and agreed to the published version of the manuscript.
Funding
This study received no external funding.
Institutional Review Board Statement
The test aquatic fern, i.e., A. pinnata, was sourced from the abandoned sections of the old Ganga canal near Dhanori village in the Haridwar district (29°56′15.3″ N and 77°57′02.0″ E). The plant was acclimatized in a greenhouse for 7 days before its utilization in the final experiments.
Informed Consent Statement
Not applicable.
Data Availability Statement
Data will be made available on reasonable request to the corresponding author.
Acknowledgments
The authors are grateful to their host institutions for providing the necessary facilities to complete this study.
Conflicts of Interest
The authors declare no conflicts of interest.
References
- Mandeep; Gupta, G.K.; Liu, H.; Shukla, P. Pulp and Paper Industry–Based Pollutants, Their Health Hazards and Environmental Risks. Curr. Opin. Environ. Sci. Health 2019, 12, 48–56. [Google Scholar] [CrossRef] [Scilit]
- Shankar, S.U. Assessment of Physicochemical Characteristics of Effluents from Paper Mill in the State of Uttar Pradesh, India. Int. J. Eng. Res. 2020, 9, 313–318. [Google Scholar] [CrossRef] [Scilit]
- Sharma, P.; Iqbal, H.M.N.; Chandra, R. Evaluation of Pollution Parameters and Toxic Elements in Wastewater of Pulp and Paper Industries in India: A Case Study. Case Stud. Chem. Environ. Eng. 2022, 5, 100163. [Google Scholar] [CrossRef] [Scilit]
- Hubbe, M.A.; Metts, J.R.; Hermosilla, D.; Blanco, M.A.; Yerushalmi, L.; Haghighat, F.; Lindholm-Lehto, P.; Khodaparast, Z.; Kamali, M.; Elliott, A. Wastewater Treatment and Reclamation: A Review of Pulp and Paper Industry Practices and Opportunities. Bioresources 2016, 11, 7953–8091. [Google Scholar] [CrossRef] [Scilit]
- Zhu, Y.; Xing, W.; Al-Dhabi, N.A.; Luo, K.; Jiang, K.; Tang, W. Hollow MnO2 Nanotube with Carbon Encapsulation and Sulfur Doping Mediated Electron Transfer between Organic Pollutants and Permanganate for Water Decontamination and Biotoxicity Elimination. Chem. Eng. J. 2026, 530, 173409. [Google Scholar] [CrossRef] [Scilit]
- Satyam, S.; Patra, S. The Evolving Landscape of Advanced Oxidation Processes in Wastewater Treatment: Challenges and Recent Innovations. Processes 2025, 13, 987. [Google Scholar] [CrossRef] [Scilit]
- Tran, P.Y.N.; Dao, T.V.H.; Vo, T.K.Q.; Hoang, M.N.; Le, L.T.; Phan, N.N.; Huynh, K.P.H.; Tran, T.D.; Dao, T.S.; Lens, P.N.L.; et al. Fundamentals of Floating Treatment Wetlands: Functions, Design, and Maintenance. Nat. Based Solut. Urban Sustain. 2025, 41, 41–60. [Google Scholar] [CrossRef] [Scilit]
- Goala, M.; Bachheti, A.; Kumar, V. A Comprehensive Review of Recent Advances in Phytoremediation of Wastewaters Using Azolla Species. 3 Biotech 2025, 15, 238. [Google Scholar] [CrossRef] [Scilit]
- Goala, M.; Yadav, K.K.; Alam, J.; Adelodun, B.; Choi, K.S.; Cabral-Pinto, M.M.S.; Hamid, A.A.; Alhoshan, M.; Ali, F.A.A.; Shukla, A.K. Phytoremediation of Dairy Wastewater Using Azolla Pinnata: Application of Image Processing Technique for Leaflet Growth Simulation. J. Water Process Eng. 2021, 42, 102152. [Google Scholar] [CrossRef] [Scilit]
- Liaqat, W.; Altaf, M.T.; Barutçular, C.; Yasmin, S. Bioenergy Crops in the Perspective of Climate Change. In Biotechnology and Omics Approaches for Bioenergy Crops; Springer Nature Singapore: Singapore, 2023; pp. 1–27. ISBN 9789819949540. [Google Scholar]
- Jayasundara, P. Wastewater Treatment by Azolla: A Review. Diyala Agric. Sci. J. 2022, 14, 40–46. [Google Scholar] [CrossRef] [Scilit]
- Carey, R.O.; Migliaccio, K.W. Contribution of Wastewater Treatment Plant Effluents to Nutrient Dynamics in Aquatic Systems. Environ. Manag. 2009, 44, 205–217. [Google Scholar] [CrossRef] [Scilit]
- Xiao, Q.; Joseph, V.R.; Ray, D.M. Maximum One-Factor-At-A-Time Designs for Screening in Computer Experiments. Technometrics 2023, 65, 220–230. [Google Scholar] [CrossRef] [Scilit]
- Yu, I.T. Factor Screening with Modified One-Factor-at-a-Time Experiments. Commun. Stat. Simul. Comput. 2024, 53, 4449–4463. [Google Scholar] [CrossRef] [Scilit]
- Elfghi, F.M. A Hybrid Statistical Approach for Modeling and Optimization of RON: A Comparative Study and Combined Application of Response Surface Methodology (RSM) and Artificial Neural Network (ANN) Based on Design of Experiment (DOE). Chem. Eng. Res. Des. 2016, 113, 264–272. [Google Scholar] [CrossRef] [Scilit]
- Nair, A.T.; Makwana, A.R.; Ahammed, M.M. The Use of Response Surface Methodology for Modelling and Analysis of Water and Wastewater Treatment Processes: A Review. Water Sci. Technol. 2014, 69, 464–478. [Google Scholar] [CrossRef] [Scilit]
- Bayuo, J.; Rwiza, M.J.; Mtei, K.M. Modeling and Optimization of Trivalent Arsenic Removal from Wastewater Using Activated Carbon Produced from Maize Plant Biomass: A Multivariate Experimental Design Approach. Biomass Convers. Biorefin. 2024, 14, 24809–24832. [Google Scholar] [CrossRef] [Scilit]
- Khoshraftar, Z.; Ghaemi, A.; Hemmati, A. Comprehensive Investigation of Isotherm, RSM, and ANN Modeling of CO2 Capture by Multi-Walled Carbon Nanotube. Sci. Rep. 2024, 14, 5130. [Google Scholar] [CrossRef] [Scilit]
- Ghosh, V.; Lonhare, A. Response Surface Methodology: A Statistical Tool to Optimize Process Parameters (Quantitative Data) to Maximize the Microbial Biomass and Their Bioactive Metabolites. In Industrial and Manufacturing Designs: Quantitative and Qualitative Analysis; Scrivener Publishing LLC: Beverly, MA, USA, 2024; pp. 139–171. [Google Scholar] [CrossRef] [Scilit]
- Thiemicke, A.; Neuert, G. Rate Thresholds in Cell Signaling Have Functional and Phenotypic Consequences in Non-Linear Time-Dependent Environments. Front. Cell Dev. Biol. 2023, 11, 1124874. [Google Scholar] [CrossRef] [Scilit] [PubMed]
- Abiodun, O.I.; Jantan, A.; Omolara, A.E.; Dada, K.V.; Mohamed, N.A.E.; Arshad, H. State-of-the-Art in Artificial Neural Network Applications: A Survey. Heliyon 2018, 4, e00938. [Google Scholar] [CrossRef] [Scilit] [PubMed]
- Madhuranthakam, C.M.R.; Hourfar, F.; Elkamel, A. Artificial Neural Network Modeling in the Presence of Uncertainty for Predicting Hydrogenation Degree in Continuous Nitrile Butadiene Rubber Processing. Processes 2024, 12, 999. [Google Scholar] [CrossRef] [Scilit]
- Abaza, B.F.; Gheorghita, V. Artificial Neural Network Framework for Hybrid Control and Monitoring in Turning Operations. Appl. Sci. 2025, 15, 3499. [Google Scholar] [CrossRef] [Scilit]
- Alkorbi, A.S.; Tanveer, M.; Shahid, H.; Qadir, M.B.; Ahmad, F.; Khaliq, Z.; Jalalah, M.; Irfan, M.; Algadi, H.; Harraz, F.A. Comparative Analysis of Feed-Forward Neural Network and Second-Order Polynomial Regression in Textile Wastewater Treatment Efficiency. AIMS Math. 2024, 9, 10955–10976. [Google Scholar] [CrossRef] [Scilit]
- Mjalli, F.S.; Al-Asheh, S.; Alfadala, H.E. Use of Artificial Neural Network Black-Box Modeling for the Prediction of Wastewater Treatment Plants Performance. J. Environ. Manage. 2007, 83, 329–338. [Google Scholar] [CrossRef] [Scilit]
- APHA. Standard Methods for the Examination of Water and Wastewater, 23rd ed.; American Public Health Association: Washington DC, USA, 2017. [Google Scholar]
- Burch, K.D.; Han, B.; Pichtel, J.; Zubkov, T. Removal Efficiency of Commonly Prescribed Antibiotics via Tertiary Wastewater Treatment. Environ. Sci. Pollut. Res. 2019, 26, 6301–6310. [Google Scholar] [CrossRef] [Scilit]
- Jaafari, J.; Yaghmaeian, K. Optimization of Heavy Metal Biosorption onto Freshwater Algae (Chlorella Coloniales) Using Response Surface Methodology (RSM). Chemosphere 2019, 217, 447–455. [Google Scholar] [CrossRef] [Scilit]
- Eid, E.M.; Alrumman, S.A.; Galal, T.M.; El-Bebany, A.F. Regression Models for Monitoring Trace Metal Accumulations by Faba Sativa Bernh. Plants Grown in Soils Amended with Different Rates of Sewage Sludge. Sci. Rep. 2019, 9, 5443. [Google Scholar] [CrossRef] [Scilit]
- Sabour, M.R.; Amiri, A. Comparative Study of ANN and RSM for Simultaneous Optimization of Multiple Targets in Fenton Treatment of Landfill Leachate. Waste Manag. 2017, 65, 54–62. [Google Scholar] [CrossRef] [Scilit]
- IS 11624:1986; Guidelines for Quality of Irrigation Water (Reaffirmed 2012). CPCB: Delhi, India, 2012.
- Ayers, R.S.; Westcot, D.W. Water Quality for Agriculture; FAO Irrigation and Drainage, Paper 29; Food and Agriculture Organization: Rome, Italy, 1985. [Google Scholar]
- Mishra, S.; Mohanty, M.; Pradhan, C.; Patra, H.K.; Das, R.; Sahoo, S. Physico-Chemical Assessment of Paper Mill Effluent and Its Heavy Metal Remediation Using Aquatic Macrophytes—A Case Study at JK Paper Mill, Rayagada, India. Environ. Monit. Assess. 2013, 185, 4347–4359. [Google Scholar] [CrossRef] [Scilit]
- Akinbile, C.O.; Ogunrinde, T.A.; Che bt Man, H.; Aziz, H.A. Phytoremediation of Domestic Wastewaters in Free Water Surface Constructed Wetlands Using Azolla Pinnata. Int. J. Phytoremediation 2016, 18, 54–61. [Google Scholar] [CrossRef] [Scilit] [PubMed]
- Ahmad, J.; Abdullah, S.R.S.; Hassan, H.A.; Rahman, R.A.A.; Idris, M. Saringan Tumbuhan Akuatik Tropika Tempatan Untuk Rawatan Penyudahan Sisa Pulpa Dan Kertas. Malays. J. Anal. Sci. 2017, 21, 105–112. [Google Scholar] [CrossRef] [Scilit]
- Sumathi, J.; Arulmozhi, M.; Sundaram, S. RSM and ANN Modeling of Dissolved Oxygen Response Using Paper Industry Effluent in Semi Batch Fermenter. Desalination Water Treat. 2020, 188, 140–150. [Google Scholar] [CrossRef] [Scilit]
- Adeogun, A.I.; Bhagawati, P.B.; Shivayogimath, C.B. Pollutants Removals and Energy Consumption in Electrochemical Cell for Pulping Processes Wastewater Treatment: Artificial Neural Network, Response Surface Methodology and Kinetic Studies. J. Environ. Manage. 2021, 281, 111897. [Google Scholar] [CrossRef] [Scilit] [PubMed]
- Kermet-Said, H.; Ladeg, S.; Moulai-Mostefa, N. Prediction of the Removal of Solid Suspensions and Chemical Oxygen Demand from a Pharmaceutical Wastewater Plant Using a Neural Network Approach. Desalination Water Treat. 2024, 317, 100059. [Google Scholar] [CrossRef] [Scilit]
- Irfan, M.; Waqas, S.; Arshad, U.; Khan, J.A.; Legutko, S.; Kruszelnicka, I.; Ginter-Kramarczyk, D.; Rahman, S.; Skrzypczak, A. Response Surface Methodology and Artificial Neural Network Modelling of Membrane Rotating Biological Contactors for Wastewater Treatment. Materials 2022, 15, 1932. [Google Scholar] [CrossRef] [Scilit] [PubMed]

Disclaimer/Publisher’s Note: The statements, opinions and data contained in all publications are solely those of the individual author(s) and contributor(s) and not of MDPI and/or the editor(s). MDPI and/or the editor(s) disclaim responsibility for any injury to people or property resulting from any ideas, methods, instructions or products referred to in the content. |
© 2026 by the authors. Licensee MDPI, Basel, Switzerland. This article is an open access article distributed under the terms and conditions of the Creative Commons Attribution (CC BY) license.