


Abstract
This paper investigates the deployment of four electric vehicle (EV) fast-charging stations (FCSs) in a commercial facility’s parking area, where multiple service centers operate on varying schedules. The commercial load demand is modeled using Monte Carlo Simulation (MCS), introducing realistic stochastic variability and overlapping power patterns with FCS operations. A single-point sensing strategy at the point of common coupling (PCC) is adopted for load disaggregation. Continuous Wavelet Transform (CWT) is employed for feature extraction, and multiclass classification is performed using Error-Correcting Output Codes (ECOC). Under commercial load interference, conventional machine-learning classifiers achieve a macro classification accuracy of 89.53%, with the lowest class accuracy dropping to 76.74%. To address this limitation, a deep learning (DL)-based framework is implemented. Simulation results demonstrate that the proposed DL approach improves overall classification accuracy from 89.53% to 100%, corresponding to a 10.47 percentage-point absolute improvement, an 11.7% relative gain, and complete elimination of misclassification errors. Notably, the most affected charging station class (FCS2) accuracy increases from 76.74% to 100%. These results demonstrate that the proposed deep learning framework reliably detects FCS activations even under overlapping, variable, and high-power commercial load conditions, enabling more efficient energy management and optimal utilization of electrical resources, reduced energy waste, and enhanced sustainability of EV charging infrastructure within commercial facilities.
1. Introduction
1.1. Background
Over the past three decades, there has been a shift from fossil fuels to renewable energy sources, driven by rising electricity demand and the urgent need to reduce CO2 emissions [1]. This transition has significantly increased the integration of renewable energy into low- and medium-voltage grids, which is vital for meeting the energy needs of future smart grids [2]. The incorporation of diverse energy sources has enhanced overall system efficiency and reduced carbon emissions. In contrast, the transportation sector—particularly internal combustion engine vehicles—continues to contribute significantly to global greenhouse gas emissions. This has prompted governments worldwide to pursue decarbonization strategies, with transportation electrification emerging as a viable solution [3]. Electric vehicles (EVs), supported by an expanding charging infrastructure, play a pivotal role in this transition. Moreover, coupling EV charging stations with renewable energy and energy storage systems can further optimize energy usage and support grid sustainability [4]. However, the large-scale integration of renewable energy and EV charging infrastructure introduces several challenges, including transmission congestion and the overloading of grid components such as transformers and cables. These issues are further exacerbated by the high instantaneous demand associated with fast-charging events, especially in commercial settings. While this work focuses on battery-electric vehicles (EVs) and their charging infrastructure, it is acknowledged that alternative zero-emission technologies, such as Fuel Cell Electric Vehicles (FCEVs), also play a complementary role in decarbonizing the transportation sector, particularly for heavy-duty or long-haul applications [5,6]. In recent years, research on FCEV energy management has increasingly focused on data-driven and intelligent control strategies, reflecting a broader shift toward integrating real-time sensing and machine learning in complex transportation energy systems. For instance, a recent cutting-edge study [7] proposes a passenger-aware reinforcement learning-based energy management strategy for fuel cell buses, in which real-time estimates of passenger count and gender are incorporated into a deep reinforcement learning controller. This controller optimally coordinates fuel cell power output with auxiliary loads, including the air-conditioning system, to achieve superior operational performance. The approach demonstrates significant improvements in energy efficiency, operational costs, and component durability under real-world driving conditions, surpassing conventional rule-based or static control strategies. By explicitly accounting for passenger-induced variations in vehicle mass and cabin thermal load, this work highlights the critical contribution of human-centric data integration to enhancing system-level efficiency. Collectively, these advancements illustrate how intelligent sensing and learning frameworks can improve both energy efficiency and robustness, providing valuable insights for the design of data-driven energy management strategies across electrified transportation technologies, including EV charging infrastructure and FCEV operations. Future studies may consider integrating energy management strategies for such vehicles alongside EV charging infrastructures, enabling coordinated optimization across heterogeneous low-carbon transportation technologies and further supporting resilient energy systems.
1.2. Previous Work
Load disaggregation is a technique used to identify and separate the energy consumption of individual appliances or systems from aggregated data, without requiring individual meters. This enables detailed analysis and optimization of energy use, contributing to improved resource allocation and reduced waste. Load disaggregation has been applied successfully in residential [8] and commercial sectors [9,10,11]. Two general approaches are commonly used: intrusive load monitoring (ILM), which requires individual sensors on each load [12], and non-intrusive load monitoring (NILM), which relies on a single sensing point at the system level [13,14,15]. While ILM provides accurate measurements with simpler data processing, it involves complex and costly hardware deployments. NILM, on the other hand, offers a cost-effective solution by relying on advanced signal processing and machine-learning (ML) techniques for feature extraction and classification [16]. Feature extraction in NILM typically relies on steady-state [17], transient [18], or a hybrid signal characteristics [19]. Various ML models, including decision trees, support vector machines (SVMs), and clustering algorithms [20], have been employed using both supervised [21] and unsupervised learning approaches [22,23]. Despite promising results, many ML-based methods depend heavily on manual feature engineering and preprocessing, which limits scalability and impedes real-time deployment in complex environments [1].
Moreover, their performance is sensitive to the accuracy of feature selection and signal processing methods. These challenges limit scalability and make real-time implementation more difficult in commercial or dynamic environments. To overcome these challenges, deep learning (DL) techniques have gained traction due to their ability to automatically extract hierarchical features from raw data. DL models, such as convolutional neural networks (CNNs), enable end-to-end classification without manual feature extraction, reducing human intervention and improving model robustness in NILM applications. Recent work has extended NILM for EV load disaggregation, including a Serial Multi-task Transformer with Attention (SMTA) that improves load separation by capturing interactions between appliances [24], and an evidence-based method for local EV energy projections that incorporates demographic and socio-economic factors using a Bayesian framework [25].
Although recent studies have explored DL-based NILM in residential settings, limited research has focused on disaggregating high-power, overlapping loads such as EV fast-charging stations (FCSs) in commercial environments. To the best of the authors’ knowledge, no prior work has addressed multiclass classification, which is essential for distinguishing simultaneous FCS operations. This gap is highlighted in Table 1, which summarizes the key features of related studies.
Table 1.
Comparative analysis of load disaggregation techniques.
1.3. Objectives of the Current Work
This study aims to address the aforementioned research gap by proposing a DL-based NILM framework for multiclass classification of EV FCSs in commercial settings. The proposed method employs single-point sensing at the point of common coupling (PCC), and applies Continuous Wavelet Transform (CWT) to extract time–frequency features from current signals. These features are then input into a Convolutional Neural Network (CNN), enabling automatic feature learning and robust classification. The primary objectives of this work are
- To improve energy management strategies at FCSs by enhancing load visibility and classification accuracy.
- To reduce stress on aging grid infrastructure through precise identification of high-demand events.
- To assist utilities in resolving customer complaints and conducting operational diagnostics using accurate load identification.
- To enable surplus energy estimation for better planning and reduced annual generation costs.
By achieving these goals, the proposed approach contributes to the advancement of intelligent monitoring and control strategies for EV infrastructure in commercial environments.
1.4. Contributions
The key contributions of this work are
- Novel Deep Learning Framework: A DL-based NILM method is developed using the ResNet-50 architecture combined with Error-Correcting Output Codes (ECOC) for multiclass classification of FCS activation events. To the best of the authors’ knowledge, this is the first study to apply this combination in the context of commercial EV charging.
- Performance Evaluation Under Realistic Conditions: The performance of a Support Vector Machine (SVM) binary learner is evaluated under varying power quality conditions and in the presence of background commercial loads. Among four ECOC design strategies tested, the sparse random coding approach achieved 100% accuracy, along with the highest precision, recall, and F1-score.
- Robust Multiclass Load Disaggregation: The proposed framework effectively disaggregates overlapping FCS events even in the presence of background noise and power disturbances, demonstrating practical applicability and scalability in real-world commercial scenarios.
Collectively, these contributions advance the effectiveness of NILM in dynamic, high-variability environments and offer valuable insights for utilities, researchers, and system planners involved in energy monitoring and smart grid development.
2. Research Methodology
2.1. Distribution Test System Modeling
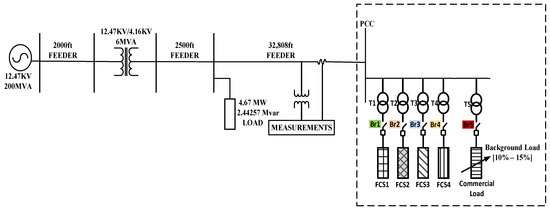
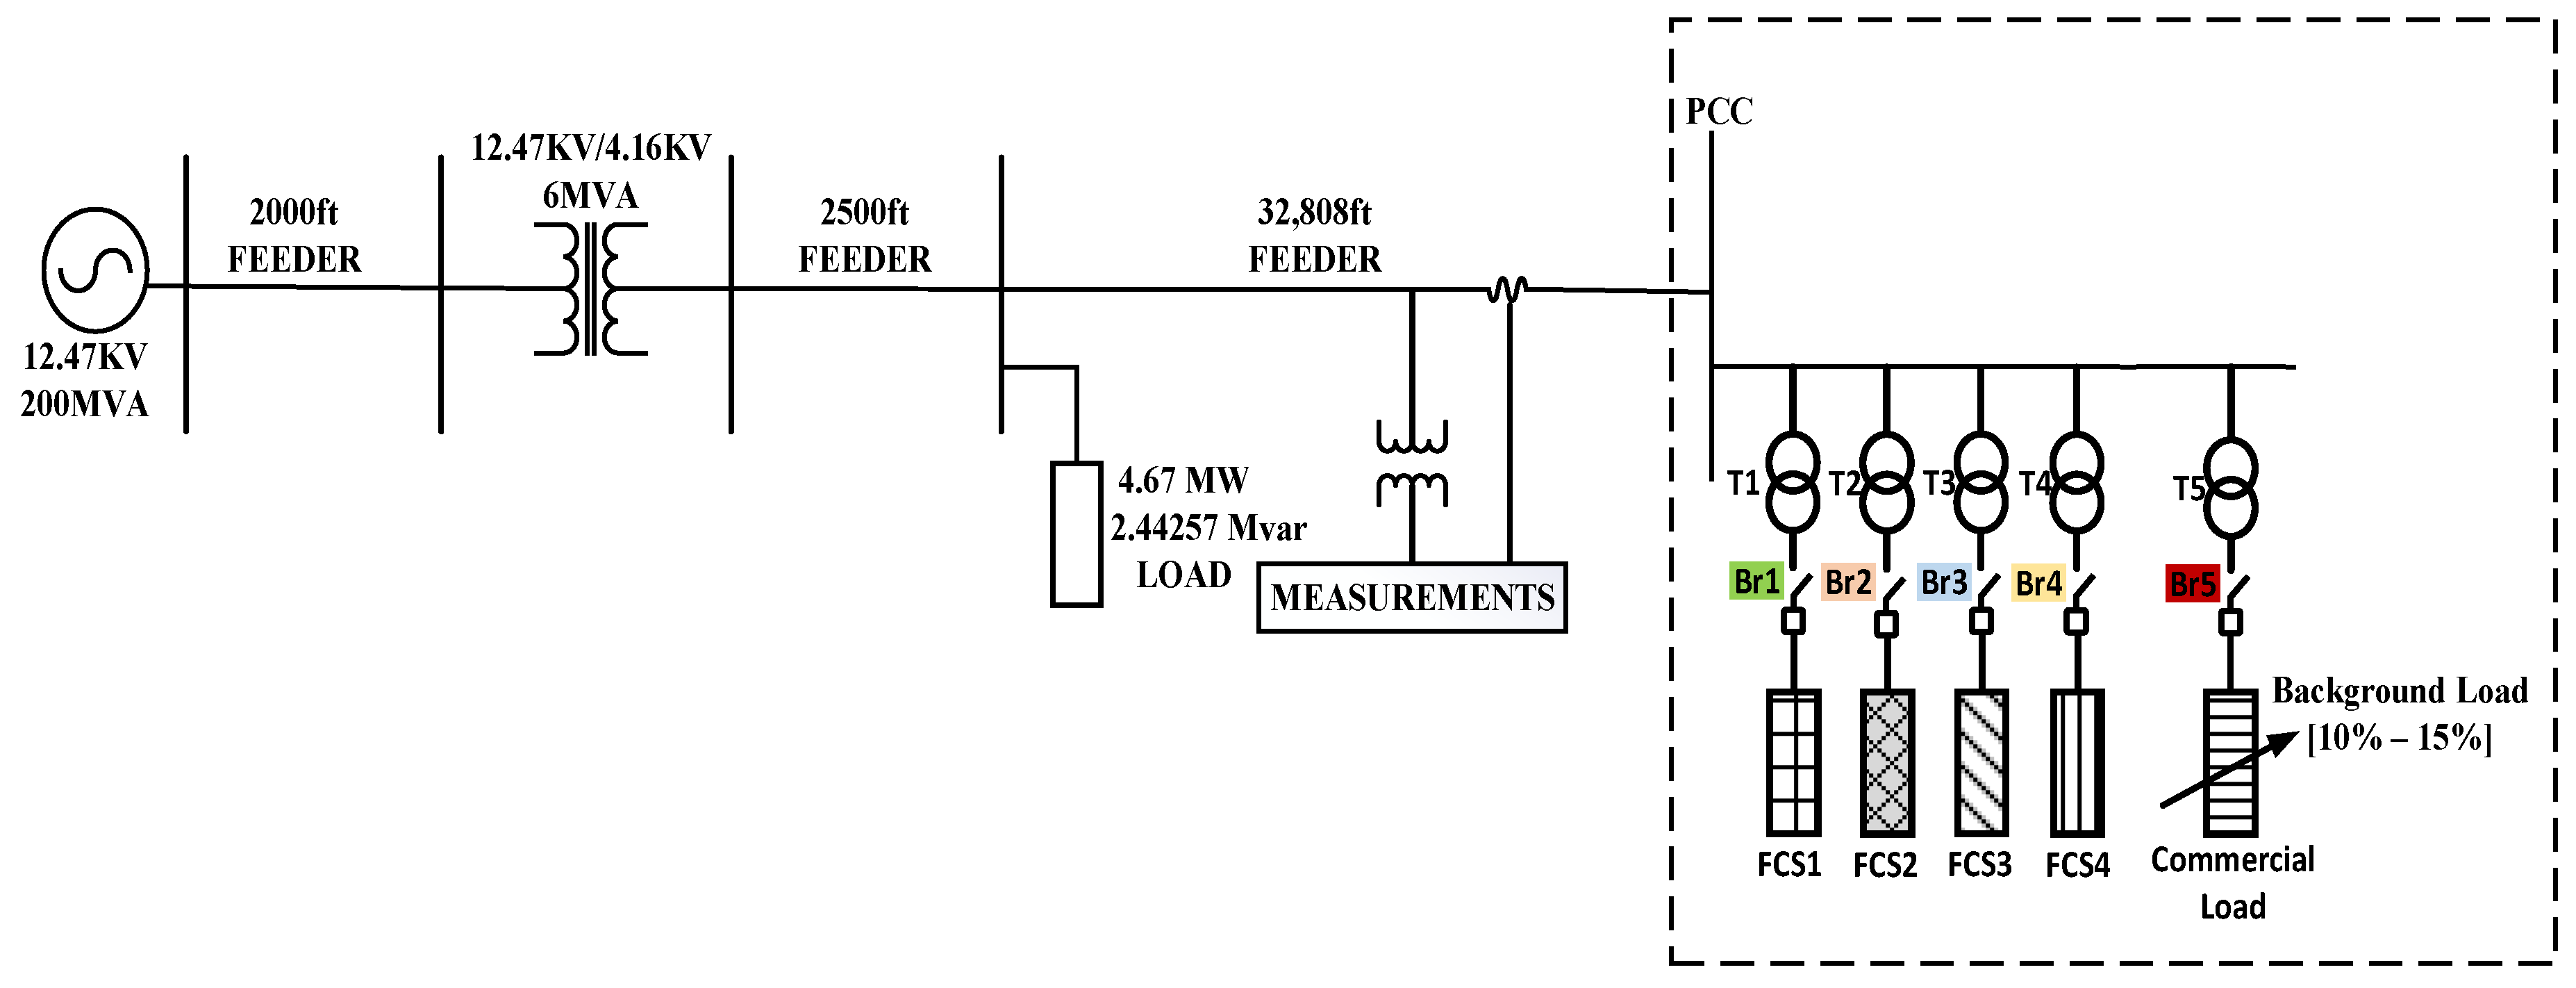
The proposed framework is evaluated on a modified IEEE 4-bus distribution test system. The nominal primary voltage is 12.47 kV, which is stepped down to 4.16 kV using a three-phase transformer rated at 6000 kVA. In the original configuration, the transformer’s secondary was delta-connected and supplied three downstream spot loads rated at 1.5 MVA, 2.0 MVA, and 2.5 MVA, operating at lagging power factors of 0.85, 0.9, and 0.9, respectively [21]. For this study, the secondary configuration has been modified to a balanced wye (Y) connection to ensure symmetrical loading across all three phases. The configuration of the modified test system, including the commercial facility and FCSs, is illustrated in Figure 1. The downstream loads have been replaced with a composite load comprising a commercial facility and four FCSs. The combined load demand is approximately 5400 kW at a 0.9 lagging power factor. The commercial facility is modeled after a typical supermarket, including a variety of end-use components such as refrigeration systems, lighting, and HVAC equipment. The inclusion of FCSs and the commercial facility introduces temporal and spatial variability in load patterns, necessitating accurate modeling of power flows, power factor, and demand behavior for robust system planning, control, and load disaggregation.
Figure 1.
IEEE 4-bus modified system.
2.2. Integration of Fast-Charging Stations (FCSs)
The four FCSs are connected to the system at the PCC via individual step-down transformers, each stepping down from 4.16 kV to 0.48 kV. Each FCS, denoted as , is connected through a dedicated transformer and a corresponding circuit breaker , where . The breaker operates in two discrete states: “on”, indicating that the breaker is closed and is active and drawing power; and “off”, indicating that the breaker is open and the corresponding FCS is inactive. This configuration allows for independent control, monitoring, and selective activation of each charging station, facilitating dynamic load scheduling and accurate load attribution during disaggregation analysis. The FCSs are rated at 50 kW, 90 kW, 150 kW, and 350 kW to capture the full range of commercially deployed DC fast chargers, providing diverse load signatures for realistic modeling and robust evaluation under practical grid conditions.
2.3. Commercial Load Integration
2.3.1. Objective
The commercial facility is assumed to house the four FCSs, all co-located at the PCC. The objective is to enable load disaggregation by distinguishing between the energy consumption of the FCSs and that of the broader commercial load using temporal power consumption patterns. Due to the heterogeneous nature of commercial operations—including multiple zones with independent schedules—the total load exhibits non-stationary and non-linear behavior, which can obscure FCS-related events. This dynamic load behavior is explicitly incorporated in the modeling process to improve disaggregation accuracy using deep learning techniques.
2.3.2. Load Profile Generation
The commercial load is modeled using benchmark data for supermarkets published by the U.S. Department of Energy [26]. These benchmarks provide hourly load profiles for an entire year (8760 h) across 936 U.S. cities [27], representing various climate zones determined by geographic coordinates [28]. A three-step procedure is adopted to generate realistic and variable commercial load profiles:
- Data Matrix Construction: A matrix of dimensions 8760 × 936 is constructed, where each column represents the hourly load profile of a specific city.
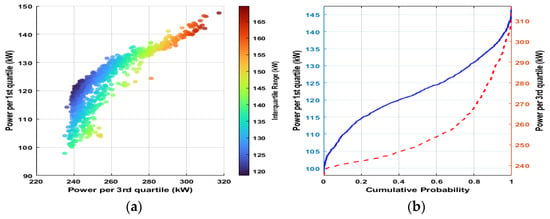
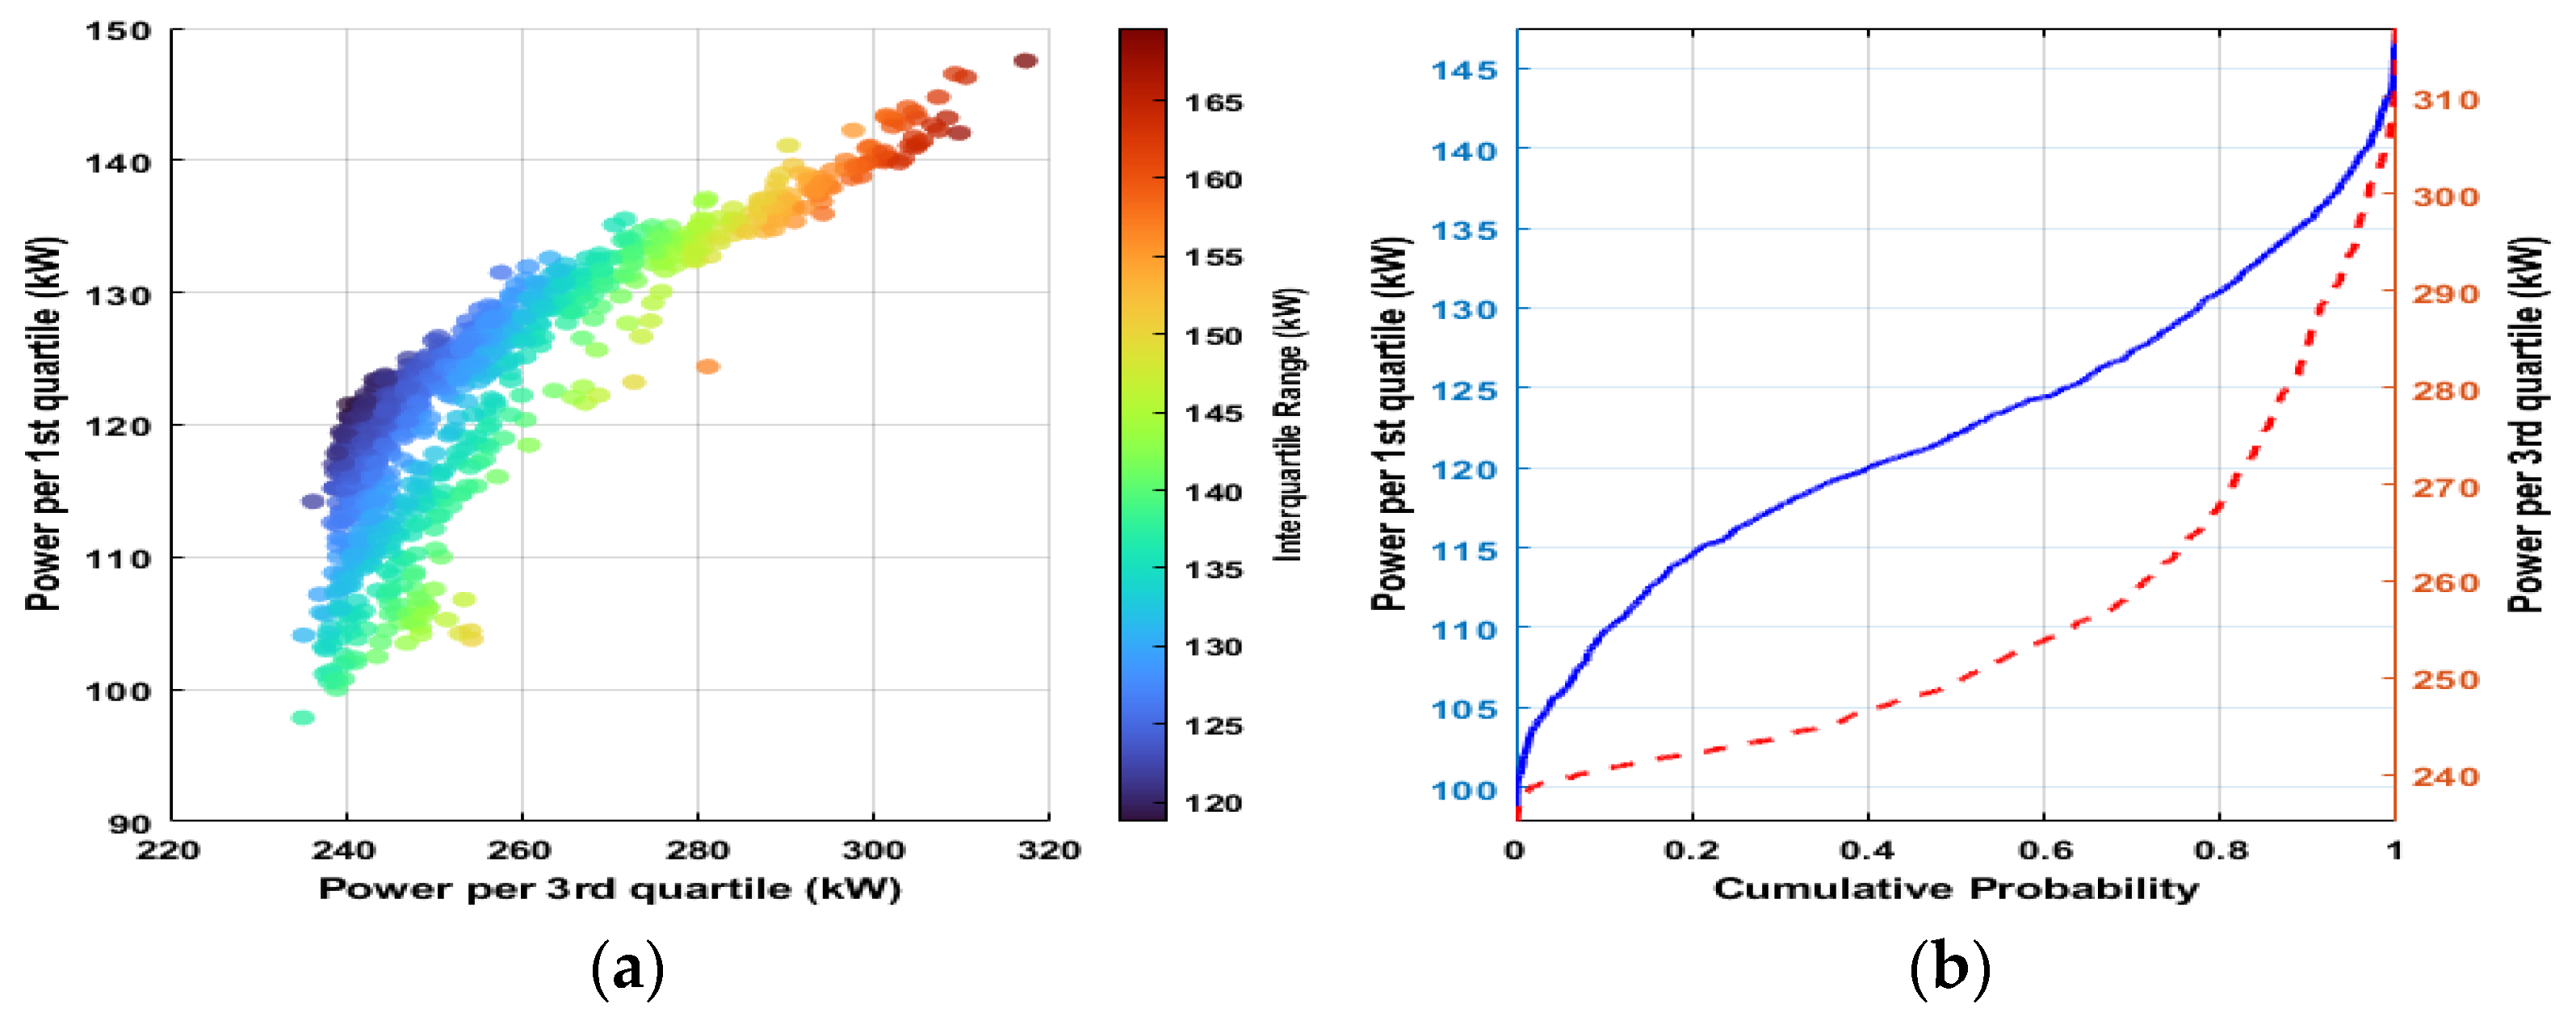
- Statistical Characterization: For each city, the 25th and 75th percentiles are calculated to capture typical lower and upper bounds of demand. These percentiles are used to construct empirical cumulative distribution functions (ECDFs).
- Monte Carlo Sampling: A stochastic load value is selected by sampling from the ECDF-defined bounds using inverse transform sampling.
The detailed implementation is outlined in Algorithm 1. The generated commercial load is applied to the commercial node in the distribution system shown in Figure 1. This approach captures the temporal and spatial variability of supermarket load profiles and provides a realistic basis for voltage and current analysis at the PCC, enabling accurate load disaggregation in downstream analysis. Although the modeling uses U.S. benchmark data, the Monte Carlo load generation and time–frequency-based disaggregation methods are not geographically restricted and can be readily adapted using locally representative commercial building datasets, enabling generalization to diverse international contexts.
| Algorithm 1: Estimation of commercial load profile using Monte Carlo Simulation. | |
| 1: Start | |
| 2: Input: Collect the annual load profile (kW) of each supermarket located in 936 cities from 50 States in U.S. | |
| 3: Input: Number of scenarios simulated in this case study, . | |
| 4: A load matrix of 8760 rows and 935 columns (8760 hours’ × 935 cities) is generated. | |
| 5: For each column of the load matrix find the 25th percentile and store it in a matrix called the 1st quartile matrix whereas this matrix consists of one row and 935 columns. | |
| 6: For each column of the load matrix find the 75th percentile and store it in a matrix called the 3rd quartile matrix whereas this matrix consists of one row and 935 columns | |
| 7: From the 1st quartile matrix, generate an empirical cumulative distribution function called . | |
| 8: From the 3rd quartile matrix, generate an empirical cumulative distribution function called . | |
| 9: For scenario do | |
| 10: Generate a uniform random variable called , in the range (0,1). | |
| 11: Generate another uniform random variable called , in the range (0,1). | |
| 12: Given the and from the empirical cumulative distribution function , determine the lower bound of the estimated kW power () based on the inverse transform method where . | |
| 13: Given the and from the empirical cumulative distribution function , determine the upper bound of the estimated kW power () based on the inverse transform method where . | |
| 14: Generate a random integer number () uniformly distributed over the interval ( to represent the total power consumption of the commercial building (supermarket) at that instance of time in simulated scenario. | |
| 15: From MATLAB (R2024a)(Matrix Laboratory), export the stochastic selected integer into PSCAD (v5.0.2)(Power Systems Computer Aided Design) and affix it to the rated real power of the background load shown in Figure 1. | |
| 16: Run the PSCAD model of the distribution test system. | |
| 17: Monitor the voltage and current signals using one single point at the PCC. | |
| 18: Save scenario results | |
| 19: End For | |
| 20: Output: | |
| A total of Three-phase current data for each simulated scenario. | |
| A total of Three-phase voltage data for each simulated scenario. | |
| Breakers’ status of each simulated scenario. | |
| 21: End | |
2.4. Feature Extraction Strategies
2.4.1. Continuous Wavelet Transform
The Continuous Wavelet Transform (CWT) is used to analyze non-stationary signals by providing a localized time-scale representation. It offers improved resolution over the Short-Time Fourier Transform (STFT), particularly for transient and rapidly changing events. Given a signal and a selected mother wavelet , the CWT, , is defined as in [29].
where and denote the translation and scale parameters, respectively, is the complex conjugate of the mother wavelet. When a complex-valued wavelet is used, the CWT coefficients are complex and can be represented by their magnitude and phase-angle . In contrast, real-valued wavelets yield zero imaginary components and an undefined phase. Therefore, a complex wavelet is adopted to retain both amplitude and phase information in the signal [30]. This study employs the Morlet wavelet, which provides effective localization in both time and frequency domains. It is defined as in [31].
where is the central frequency of the wavelet. The second term in (2) is a correction factor introduced to ensure the wavelet has zero mean, satisfying the admissibility condition. However, for sufficiently large values of , this term becomes negligible. This is because the oscillatory component dominates the behavior of the wavelet, while the Gaussian envelope remains localized in time. As a result, the wavelet effectively maintains zero mean without the need for the correction term. For practical applications involving large , the Morlet wavelet is commonly approximated as [31]:
2.4.2. Wavelet Power Spectrum
The wavelet power spectrum, or scalogram, is derived from the squared magnitude of the CWT coefficients and provides a two-dimensional time-scale representation of signal energy. It is defined as [32]:
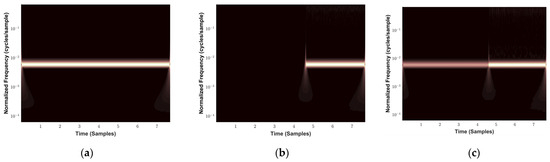
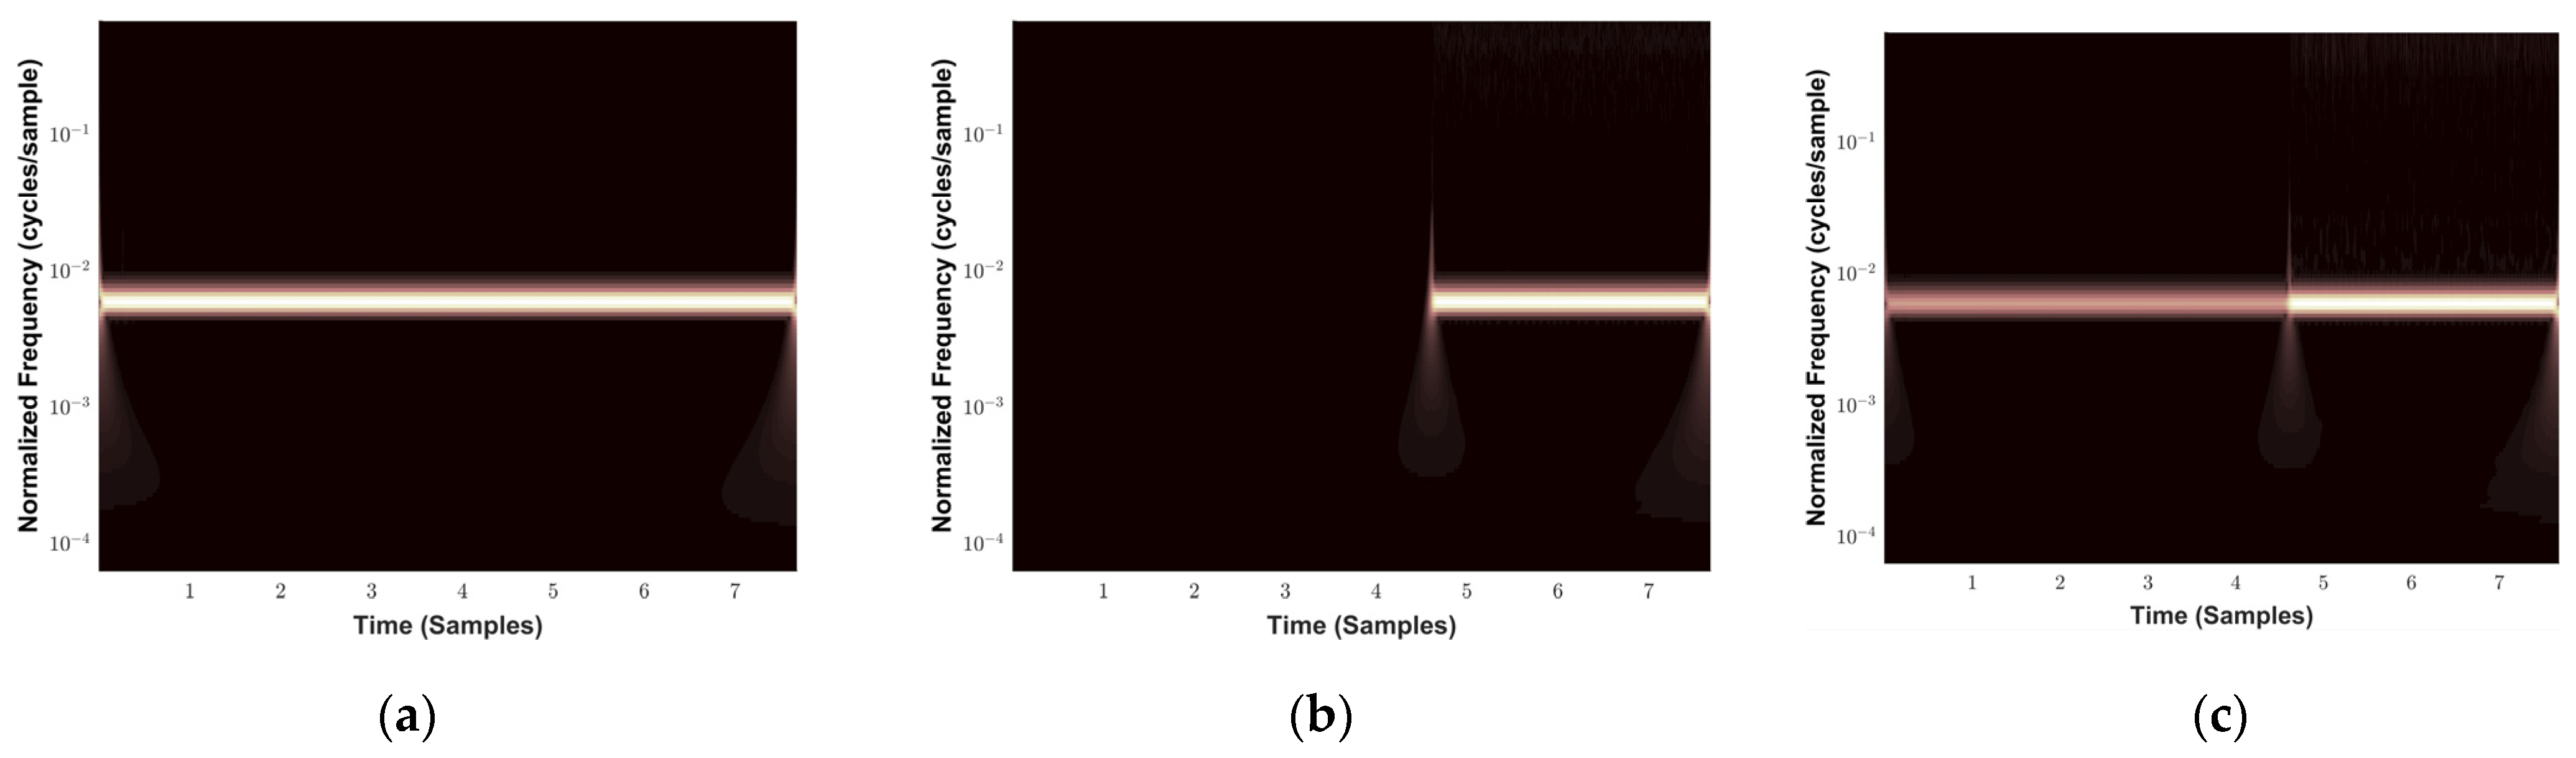
The scalogram represents time on the horizontal axis and scale (or frequency) on the vertical axis, with intensity indicating the energy content. This representation effectively captures abrupt changes, oscillations, and localized frequency events. In this work, scalograms are computed from single-phase current signals (e.g., Phase A at the Point of Common Coupling, PCC) and serve as input features for the deep learning (DL) model. Figure 2 presents the scalogram of current , showing the time–frequency response during the activation of a fault current source (FCS), initiated at 3 s into a 5 s simulation interval. Two cycles of data are analyzed, corresponding to samples 46,080 to 46,592. The system is sampled at 15.36 kHz (256 samples/cycle × 60 cycles = 15.36 kHz) as the sampling frequency. Figure 3 shows the spectrogram of the current signal at the PCC under different switching conditions.
Figure 2.
Quartile-based analysis of power consumption. (a) Scatter plot of first (Q1, 25th percentile) and third (Q3, 75th percentile) quartile power values, color-coded by the interquartile range (IQR). (b) Cumulative distribution functions (CDFs) of Q1 and Q3.
Figure 3.
Spectrogram of current signal at PCC. (a) Only is switched on. (b) Only is switched on at 3 s. (c) is switched on at 3 s, while was switched on earlier.
2.5. Deep Learning for Load Disaggregation
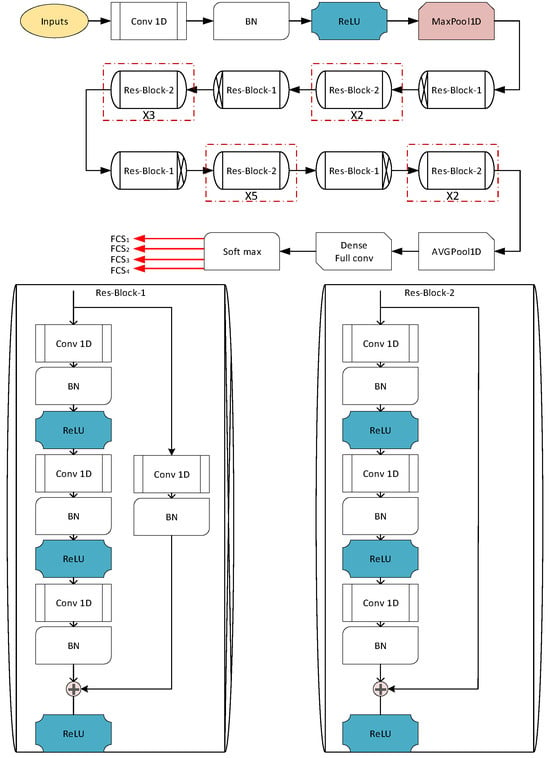
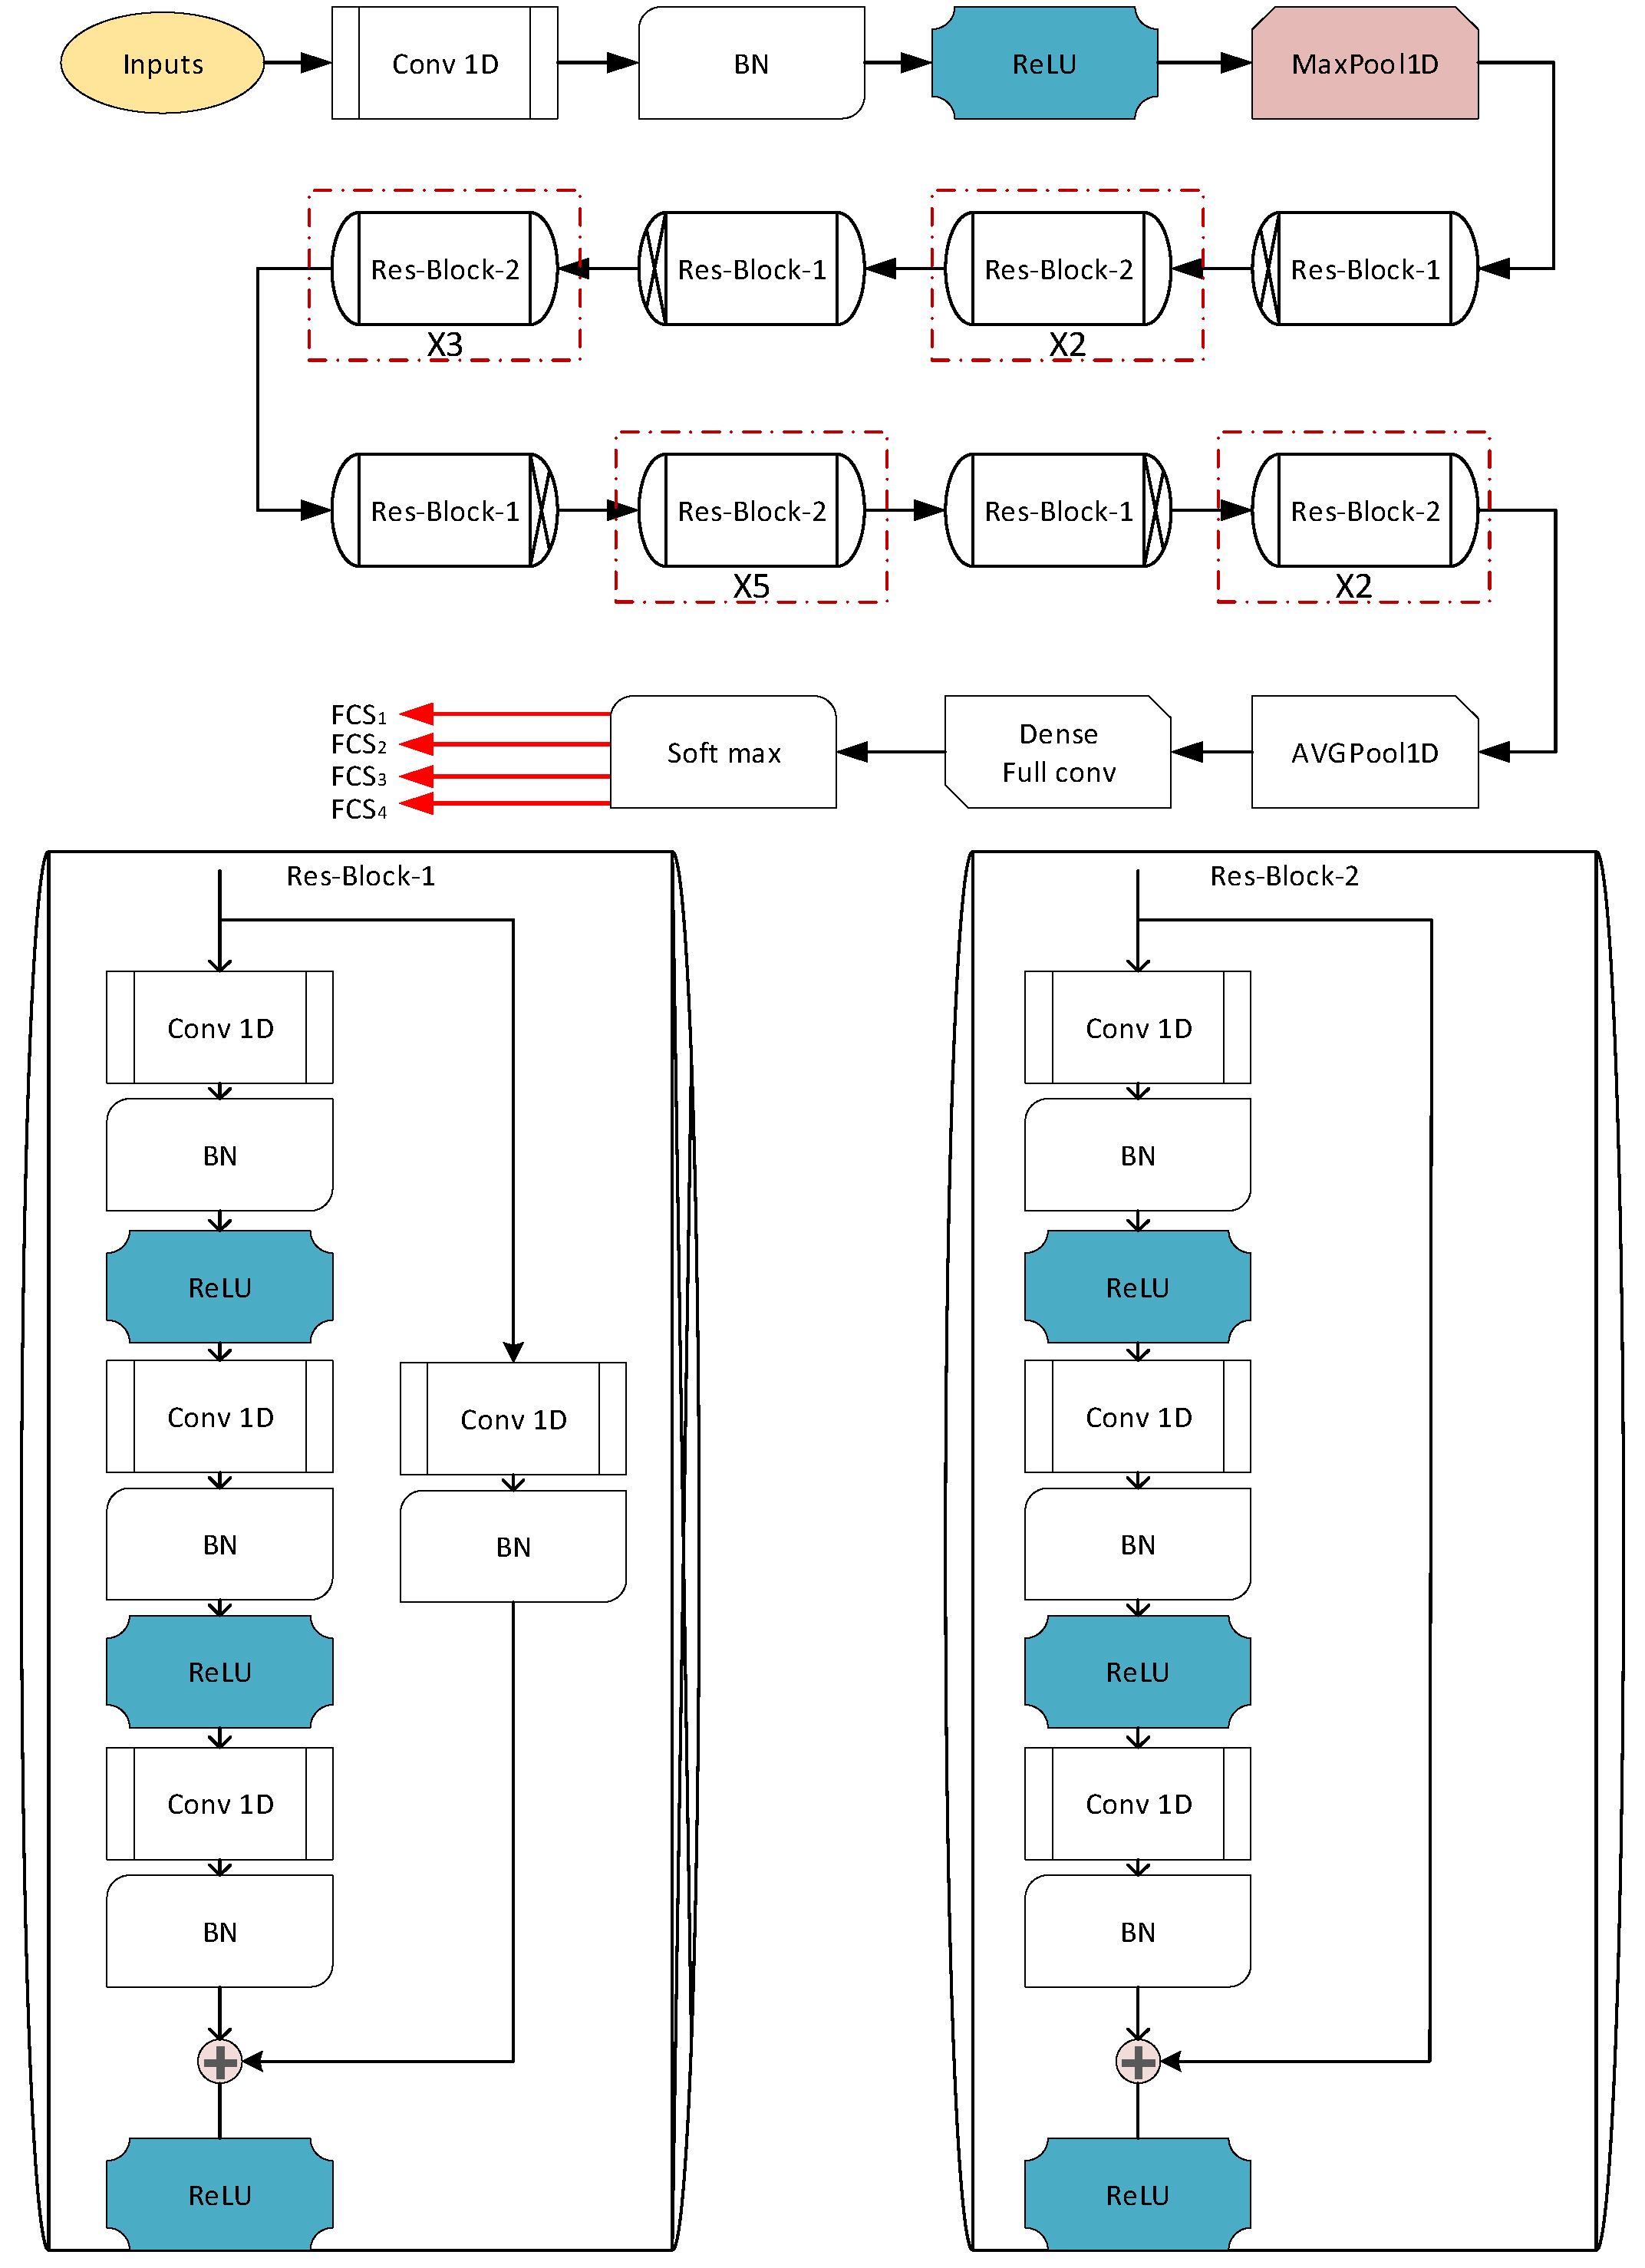
Load disaggregation aims to identify and classify individual electrical appliances and their combinations from aggregated consumption data. Accurately distinguishing device-level loads facilitates a more detailed understanding of consumption patterns and enables enhanced energy management. After extracting relevant features from the signal, a deep learning (DL) model is trained to generalize these features and classify loads effectively. During training, the model learns the complex relationships between the extracted features and their corresponding appliance classes. Once trained, the model can classify unseen data, enabling real-time appliance identification. Among various DL architectures, convolutional neural networks (CNNs) have demonstrated superior performance in feature extraction and classification tasks due to their ability to capture spatial and temporal dependencies [33]. To the best of the authors’ knowledge, this study pioneers the application of the pre-trained ResNet-50 CNN architecture for load disaggregation in power systems. Figure 4 illustrates the overall architecture of ResNet-50. Although lighter CNNs reduce computational complexity, the load disaggregation task involves high-dimensional time–frequency scalograms under stochastic commercial load conditions and power quality disturbances. ResNet-50 was selected for its residual learning capability, deep hierarchical feature extraction, and superior generalization. Transfer learning further stabilizes training and mitigates overfitting. The increased architectural complexity is therefore justified by the resulting gains in classification accuracy and resilience to load and voltage variations. The following subsections provide a detailed description of the model components.
Figure 4.
Schematic diagram illustrating the sequential steps in ResNet-50.
2.5.1. ResNet-50 Architecture
The ResNet-50 architecture begins with a convolutional layer that processes the input image through convolution operations. In this layer, filters slide across the input image, capturing spatial patterns based on the filter size (F) and stride (S). The filter size determines the receptive field, while the stride defines the step size of the filter movement. The output of this operation is referred to as the feature map or activation map, denoted by O. For multi-channel inputs (e.g., RGB images), the convolution operation at layer is mathematically represented as [34]:
where
- ⊗ denotes the convolution operator,
- k indexes the kth output feature map and the kth convolution kernel set,
- c indexes input channels,
- represents the convolution kernel weights for the input channel in the kernel set,
- is the bias term for the kernel set,
- is the input feature map to layer i.
2.5.2. Activation Layer
To introduce nonlinearity and enable the network to learn complex mappings, activation functions are applied to the convolutional outputs. The Rectified Linear Unit (ReLU) is widely adopted due to its computational efficiency and ability to mitigate the vanishing gradient problem [35]:
where x represents an element of the input feature map.
2.5.3. Pooling Layer
Pooling layers reduce the spatial dimensions of feature maps and the number of trainable parameters, which aids in preventing overfitting and reduces computational cost. Max-pooling is the most common technique, which selects the maximum value within a sliding window (pooling kernel) over the feature map [36]. Formally, the max-pooling operation at layer i for feature map k is given by [37]:
where
- is the pixel value at spatial location in the input activation map,
- S and H are the pooling window width and height, respectively,
- is the pooled output.
The pooled feature maps are then processed through a series of residual blocks.
2.5.4. Residual Blocks
ResNet-50 introduces residual learning via residual blocks to alleviate the vanishing gradient problem in deep networks [38]. Each residual block consists of two convolutional layers and a shortcut connection that bypasses these layers. The output of the residual block is the sum of the input and the output of the convolutional layers , followed by ReLU activation:
where is the input to the residual block and are the associated weights.
2.5.5. Fully Connected Layer and Multiclass Classification
The final fully connected (FC) layer maps the high-level features extracted by the residual blocks to output neurons, each corresponding to a specific fast-charging load class. While deep learning models are often applied to binary classification tasks, load disaggregation presents a multiclass classification challenge due to the presence of multiple charging devices operating concurrently. To address this, the mmulticlassproblem is decomposed into several binary classification tasks using Error-Correcting Output Codes (ECOC).
3. Error-Correcting Output Code for Multiclass Classification
Error-Correcting Output Codes (ECOC) provide a principled framework to address multiclass classification by decomposing it into multiple binary classification tasks. The ECOC process consists of two main stages: encoding and decoding [39].
3.1. Encoding Stage
Let be the number of target classes and the number of binary classifiers, with . For notational convenience, each class is denoted by , where represents class with ECOC employs a coding matrix , where each row corresponds to a class and each column corresponds to a binary classifier. Each element specifies the role of class in classifier as:
In the one-versus-one (OVO) scheme, each binary classifier is trained on a unique class pair , where and . Classes outside the pair are excluded, resulting in l-th.
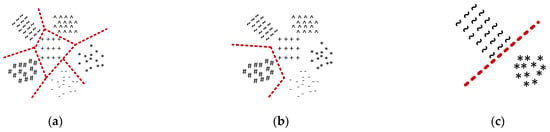
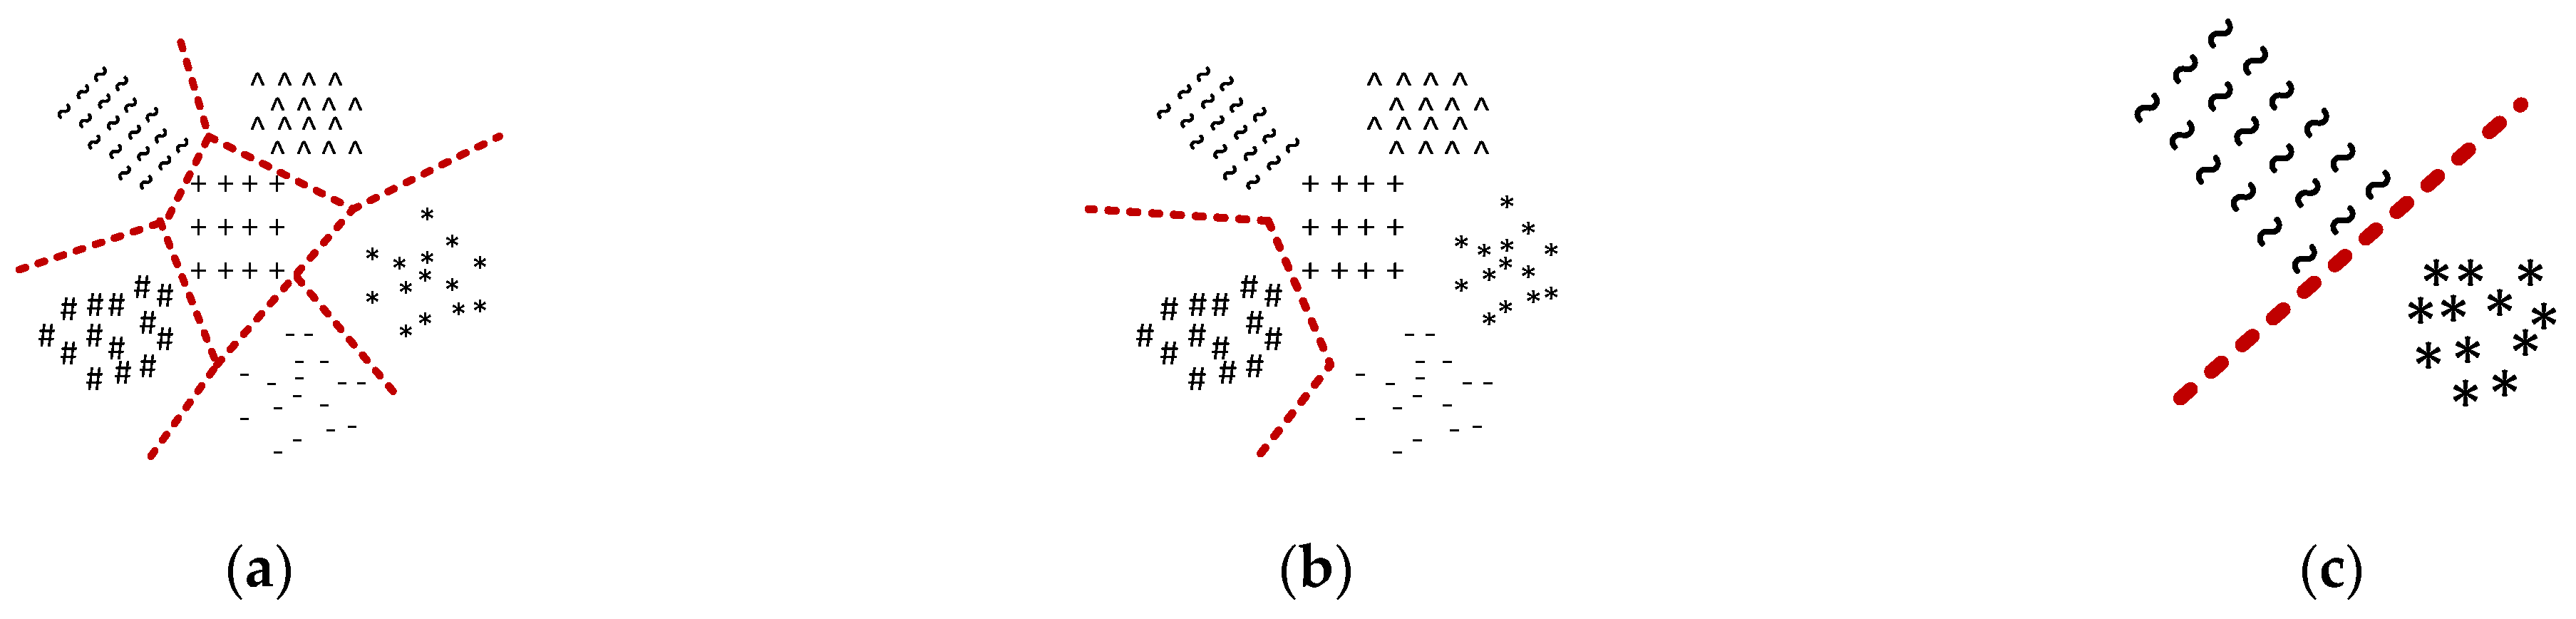
This strategy ensures that the coding matrix is highly sparse and systematic, as illustrated in Figure 5 [40]. The coding strategy for round robin classification is elaborated on in the subsequent section.
Figure 5.
Binarization using round robin techniques for a 6-class problem: (a) single classifier for multiclass learning, (b) one-versus-all learning employing N classifiers, each specialized in separating one class from the rest, and (c) round robin learning establishing N (N − 1)/2 classifiers, each dedicated to a unique class pair.
3.2. Decoding Stage
Let denote the decision score of the l-th binary classifier on a test instance. The predicted class label minimizes the normalized aggregate loss between classifier outputs and codewords [41]:
where measures the discrepancy between the expected code bit and classifier output . Common loss functions include hinge loss, squared loss, and logistic loss. The term ensures only relevant classifiers contribute.
3.3. Codebook Optimization
The ECOC system’s robustness is improved by maximizing the minimum pairwise Hamming distance between class codewords [41]:
where . Here, measures bitwise disagreement, while ensures only classifiers involving both classes contribute. The factor normalizes the difference magnitude.
3.4. Coding Design
Common ECOC coding strategies include
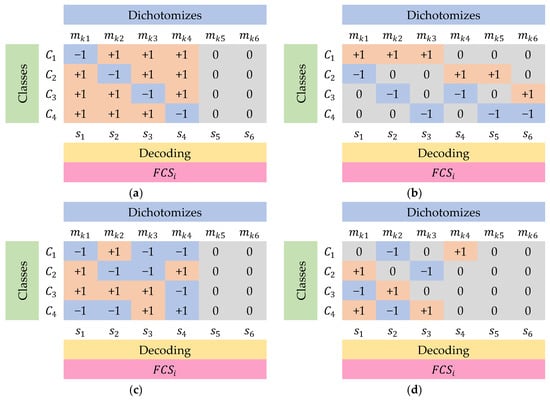
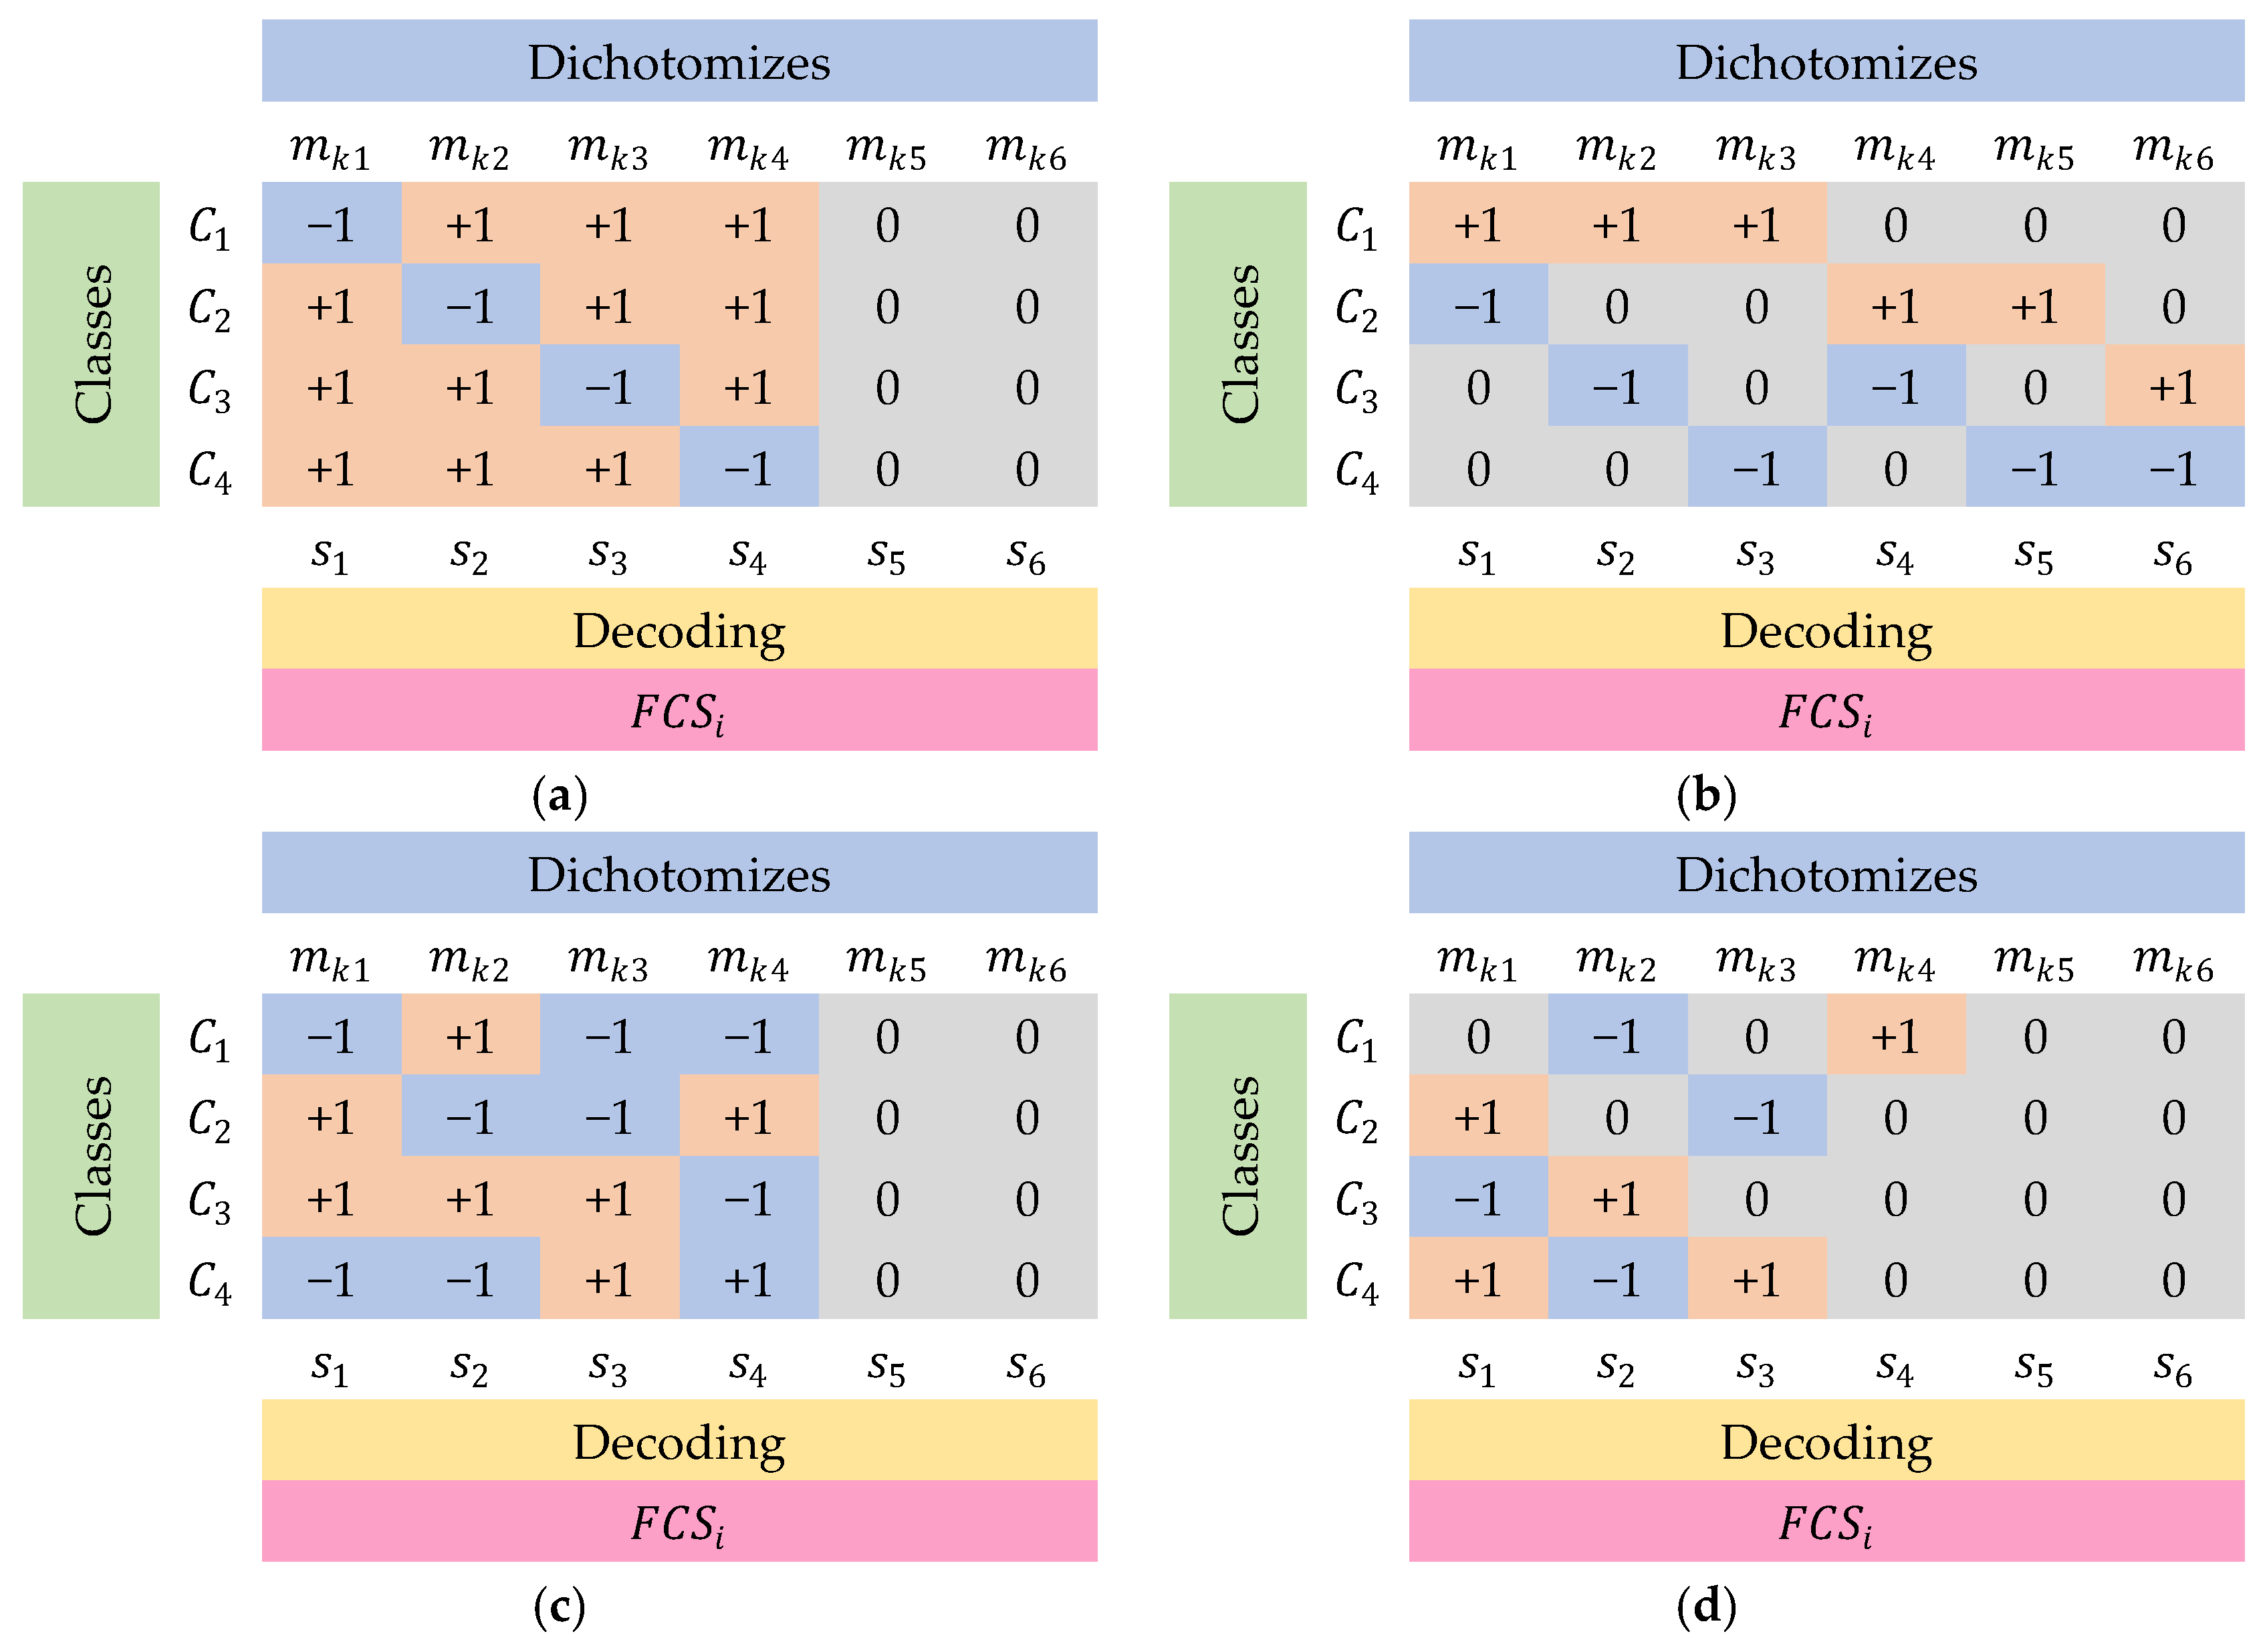
- One-Versus-All (OVA): Constructs B = N classifiers with coding matrix entries [42]:
- One-Versus-One (OVO): Constructs classifiers, each trained on a distinct class pair, yielding sparse codes in [42].
- Random Coding: Assigns class memberships randomly [43].
- -
- Dense Random: Each class is randomly assigned +1 or −1 with equal probability.
- -
- Sparse Random: Classes are assigned +1, −1, or 0 with probabilities 0.25, 0.25, and 0.5, respectively.
The different error-correcting output code design strategies used for the 4-class classification problem are illustrated in Figure 6.
Figure 6.
Error-correcting output code (ECOC) designs for a 4-class problem: (a) one-versus-one (OVO), (b) one-versus-all (OVA), (c) dense random coding, and (d) sparse random coding.
3.5. Binary Learners’ Training and Testing
This section describes the methodology used to construct the dataset for training and testing the binary learner classifiers. The objective is to capture a wide range of operating conditions involving Fast-Charging Station (FCS) activation events, both with and without a commercial load facility, while incorporating power quality disturbances. All scenarios are modeled in PSCAD/EMTDC, and the resulting dataset forms the basis for evaluating the performance of the proposed binary learners in FCS classification and load disaggregation. To initiate an electric vehicle (EV) charging process, a breaker (as shown in Figure 1) must be switched on, thereby connecting the fast charger to the distribution grid. The activation of indicates that an EV occupies the corresponding charging slot, marking the start of a charging event. The system is analyzed under multiple scenarios defined by the switching states of the breakers. In each case, one breaker is activated at a specific instant , while the remaining breakers may already be in either the on or off state. The commercial load demand is estimated using the procedure described in Section 2.3. The dataset construction considers the following factors:
- Breaker Switching Combinations: The operating states are determined by the on/off combinations of the breakers. In general, the number of possible switching combinations is given by where N denotes the number of breakers. For , this yields eight unique combinations.
- Voltage Variations: Grid voltage is varied between −5% and +5% in 1% increments, producing 11 voltage levels. This results in 88 cases for a single FCS, and 352 cases across four FCSs.
- Harmonic Distortions: Power quality disturbances are modeled by injecting a fifth-harmonic component into the system. Distortion levels are varied between 1% and 5% in 1% increments, resulting in 40 cases per FCS, and 160 cases for four FCSs.
- Frequency Variations: Frequency is varied between 55 Hz and 65 Hz in 1 Hz increments (11 steps). This produces 88 cases per FCS, and 352 cases for four FCSs.
By combining all conditions, the complete dataset consists of 864 cases, with 216 cases corresponding to each FCS. The dataset is divided into training and testing subsets using an 80–20% split: 172 cases per FCS are allocated for training, while 43 cases per FCS are reserved for testing. Table 2 presents the switching sequence under various scenarios considering the activation of the fast charger.
Table 2.
Switching sequence considering various scenarios based on activation of fast charger.
3.6. Evaluation Metrics
To quantitatively assess classification performance, four standard evaluation metrics are employed: accuracy (), precision (), recall (), and the F-measure () [44]. These are expressed as:
where denotes correctly identified positive cases, denotes correctly identified negative cases, corresponds to negative cases misclassified as positive, and corresponds to positive cases misclassified as negative.
4. Simulation Results
In this section, a comprehensive evaluation of the ML classifier and the binary learner, specifically SVM, is undertaken to discern between FCSs turn-On events and commercial load facility load disaggregation. The primary objective extends beyond mere detection of load disaggregation to accurately classifying FCSs charging events. To address imbalanced classification challenges within the dataset, several indices, including classification accuracy, precision, and recall, are employed. The assessment comprises three distinct scenarios: firstly, the detection without commercial facility load serves to establish a baseline performance; secondly, detection with commercial load facility but without the DL technique is analyzed to underscore the limitations of the ML classifier and emphasize the need for the deep learning approach. The third scenario involves detection with commercial load facility using both deep learning and the binary learner approach to underscore its suitability in load disaggregation of these events and assessing real-world robustness. The results are systematically categorized, offering valuable insights into the models’ effectiveness in performing load disaggregation and accurately classifying FCSs turn-On events under diverse conditions, as elaborated in the following section.
4.1. Case 1: Disaggregation of FCSs While Breaker Is Deactivated
In this case, breaker is intentionally deactivated, thereby disconnecting the commercial facility load from the distribution system. The dataset therefore consists exclusively of charging events from the four FCSs. Each event is simulated under diverse power quality disturbances, including voltage variations, harmonic injections, and frequency deviations, to evaluate the robustness of the classifier. The objective of Case 1 is to evaluate the ability of the SVM-based binary learner to correctly distinguish among FCS activation events in the absence of commercial load interference. This case provides a baseline reference for comparison with subsequent cases in which the commercial facility load is connected. Table 3 presents the confusion matrix for Case 1. The classifier achieves perfect separation: all 43 events for each FCS are correctly classified, with no misclassifications across the four classes.
Table 3.
Confusion matrix of the SVM-based binary learner for Case 1, corresponding to FCS activation events without the commercial facility load.
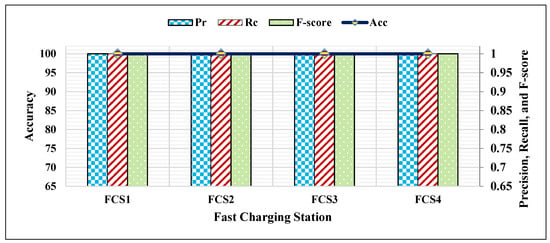
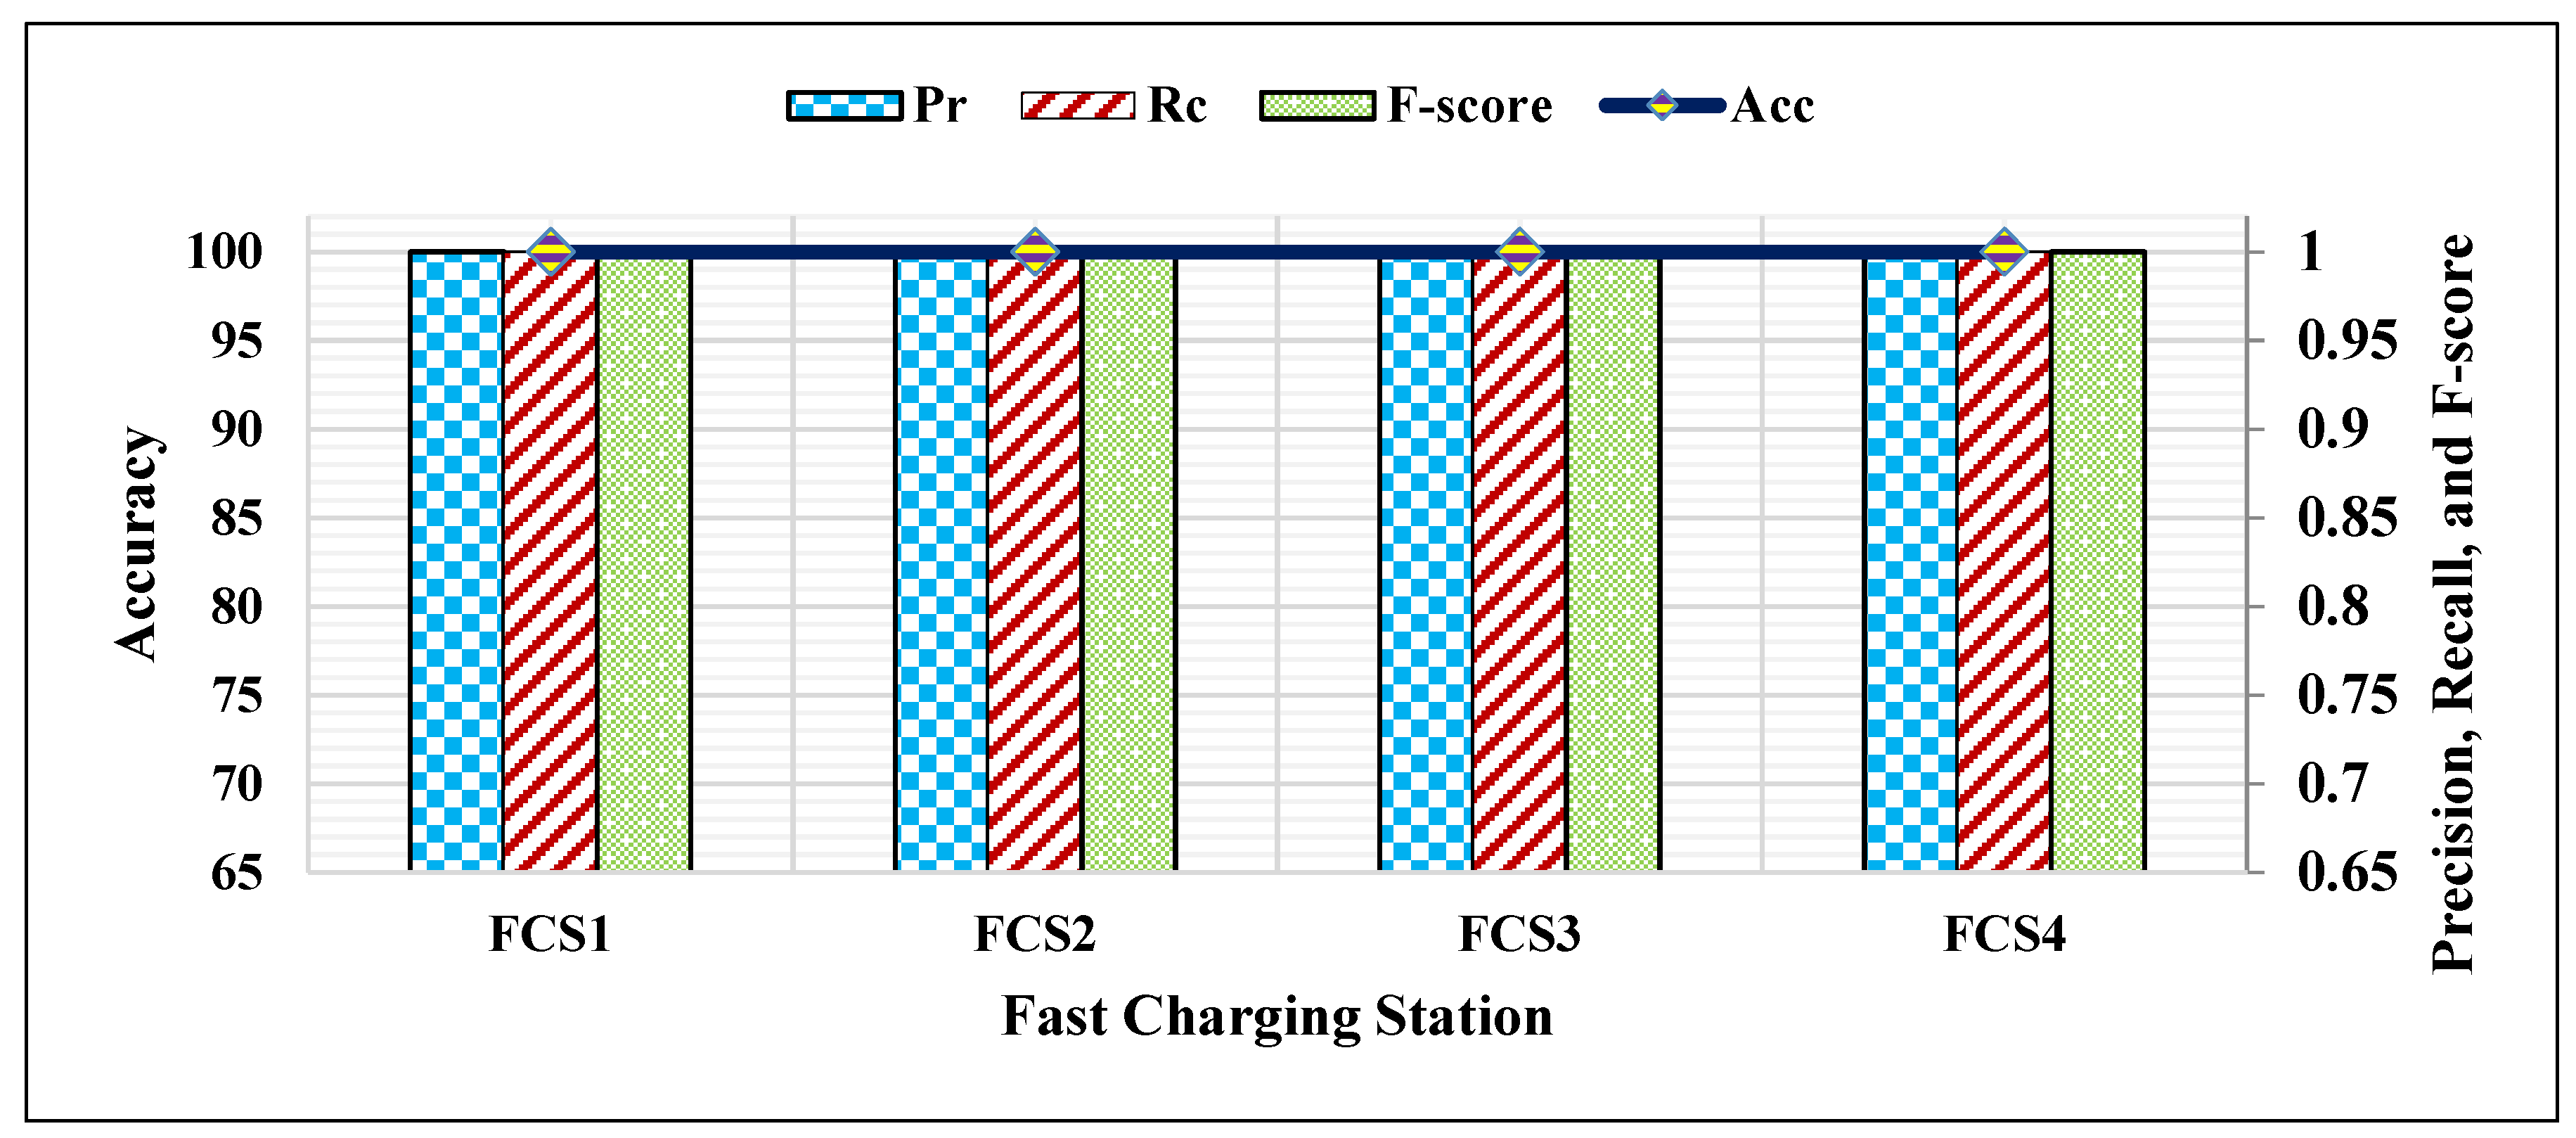
The classifier achieves 100% accuracy across all classes. In addition, precision, recall, and F-measure all equal unity for each class, as illustrated in Figure 7. The significance of these findings is twofold. First, they demonstrate that in the absence of commercial load interference, the binary learner is capable of reliably discriminating among FCS activation events, even under varying power quality conditions. Second, this perfect classification performance establishes a baseline against which the influence of the commercial load and the role of advanced learning approaches (evaluated in Cases 2 and 3) can be assessed. This case confirms that under simplified operating conditions, the SVM classifier achieves perfect disaggregation of FCS activation events. The following cases demonstrate how the inclusion of commercial load increases the classification complexity.
Figure 7.
Classification performance of the SVM-based binary learner for Case 1, showing precision, recall, F-measure, and accuracy for the four FCS activation events without the commercial facility load.
4.2. Case 2: Non-Deep Learning-Based Disaggregation of FCSs While Breaker Is Activated
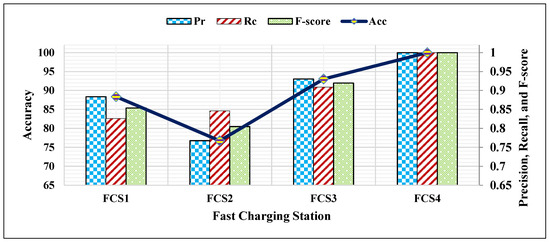
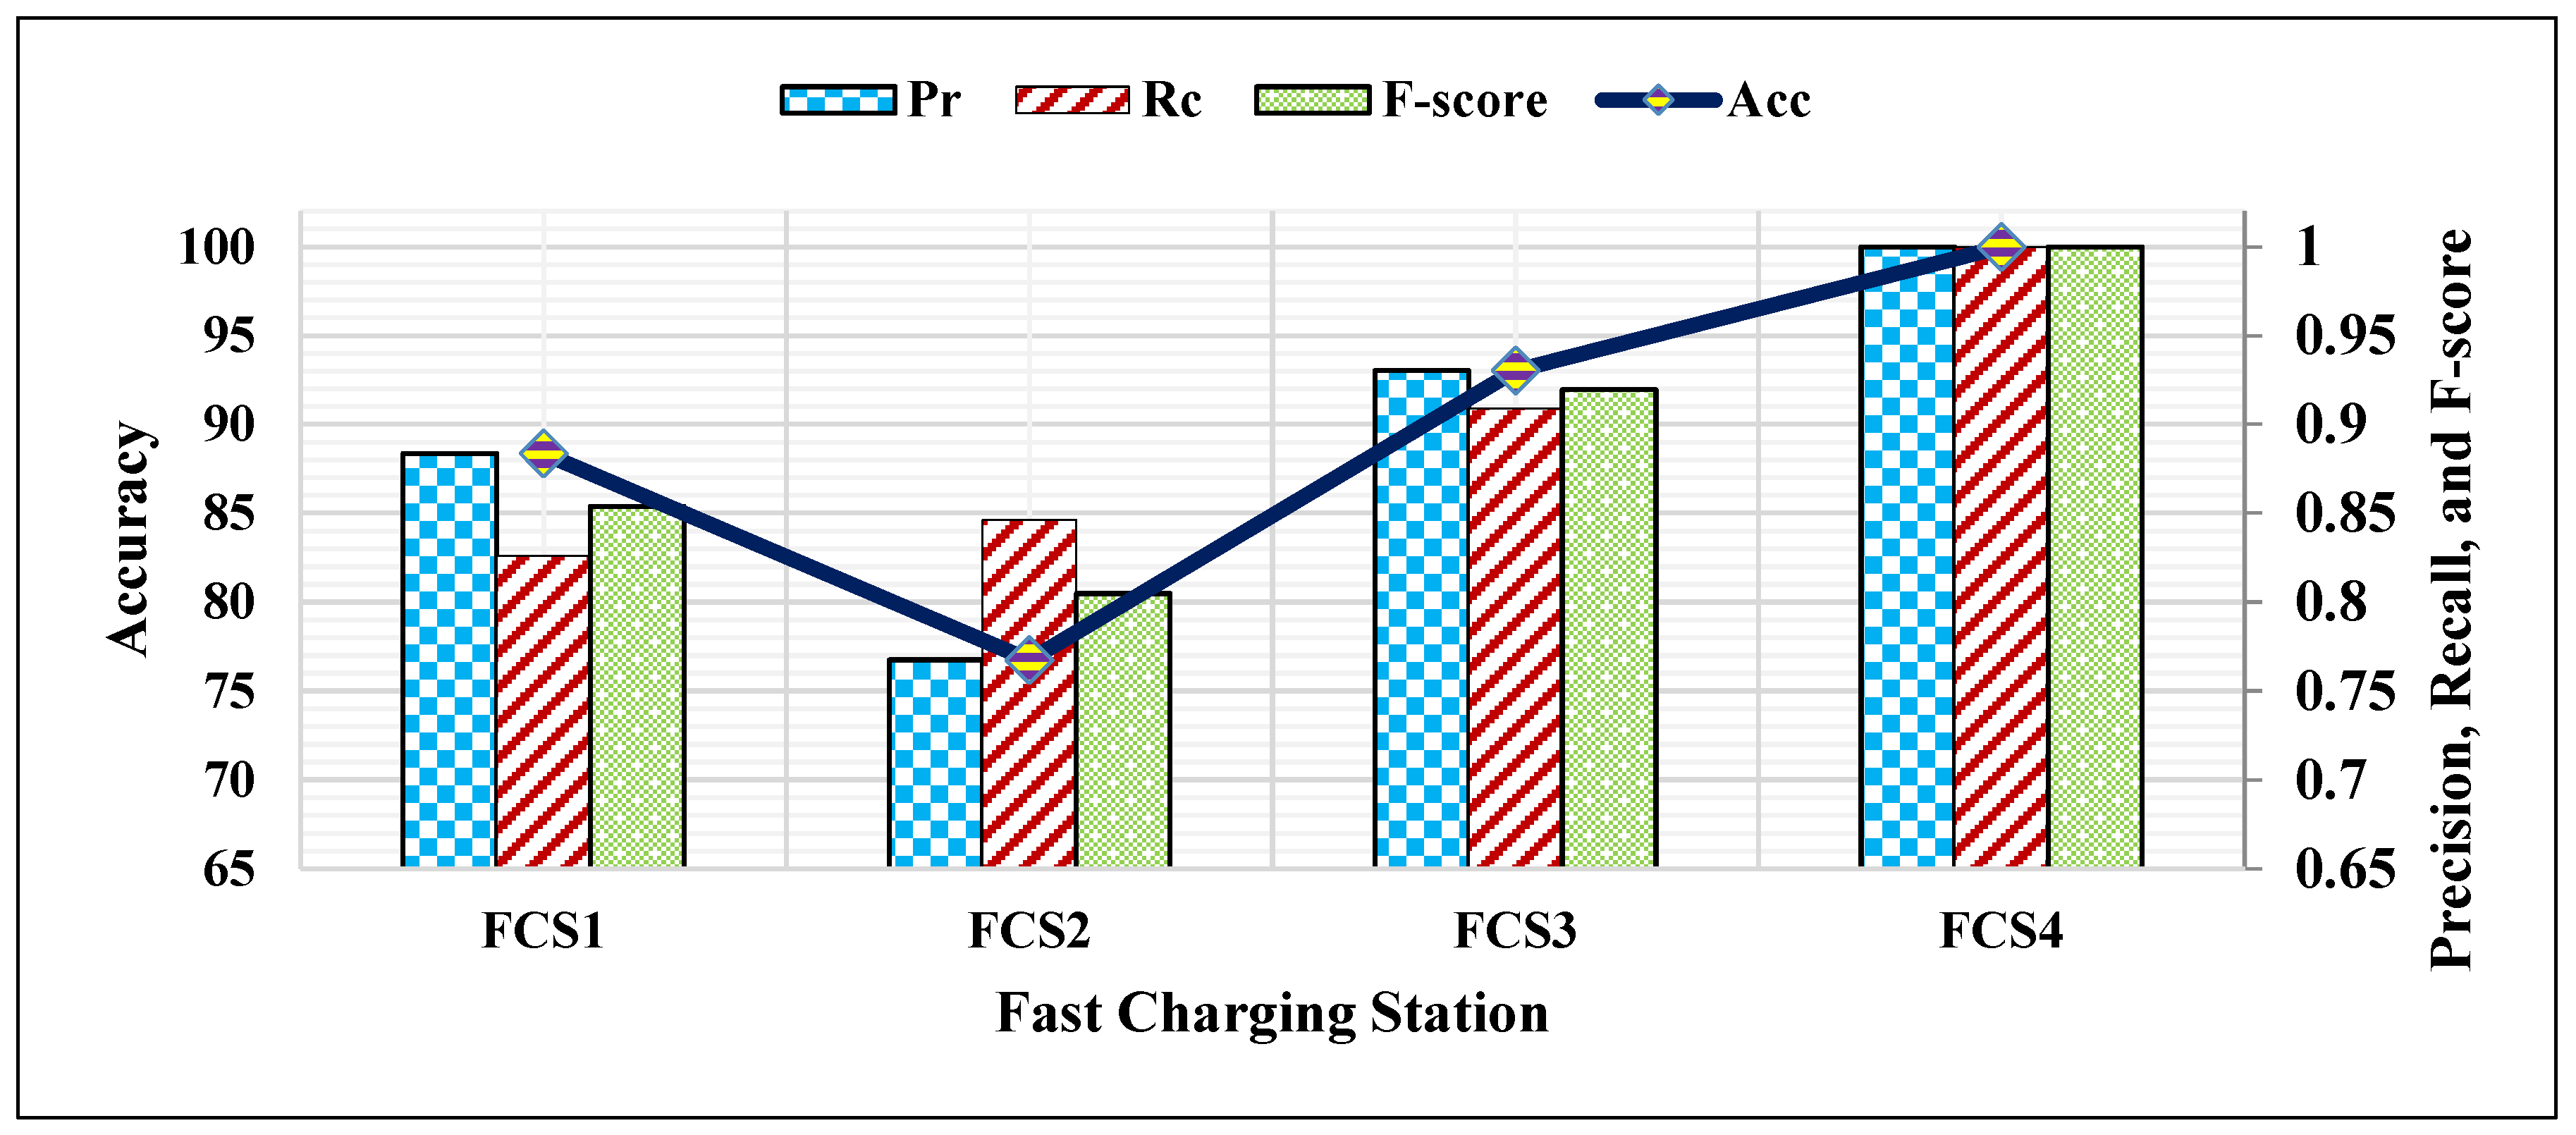
In Case 2, breaker is activated, thereby connecting the commercial facility load to the distribution system. The presence of this load introduces significant complexity into the disaggregation process, as its profile is estimated using Monte Carlo simulation (MCS) based on empirical cumulative distribution functions (ECDFs). This leads to overlapping power consumption patterns between the commercial load and the FCSs. The performance of the SVM-based binary learner under these conditions is summarized in Table 4. Compared with Case 1, the classifier exhibits reduced accuracy due to the influence of the commercial load. Specifically, all 43 events of are correctly classified, while 40 of the 43 events of are accurately detected. By contrast, the classifier achieves lower accuracy for , where misclassifications occur.
Table 4.
Confusion matrix of the SVM-based binary learner for Case 2, corresponding to FCS activation events in the presence of the commercial facility load.
The evaluation metrics are further detailed in Figure 8. The classifier achieves the highest performance for , with precision, recall, and F-measure all equal to unity. Strong performance is also observed for . However, for , the classifier records the lowest F-measure, reflecting difficulty in distinguishing activation events from the commercial load profile. These results highlight the limitations of conventional machine-learning classifiers in scenarios where the commercial load is active. While the SVM-based approach performs adequately for some FCSs, it struggles in the presence of overlapping load patterns. This motivates the integration of deep learning-based feature extraction, as considered in Case 3, to enhance the robustness and accuracy of load disaggregation under realistic operating conditions.
Figure 8.
Classification performance of the SVM-based binary learner for Case 2, illustrating precision, recall, F-measure, and accuracy across the four FCS classes.
4.3. Deep Learning-Based Disaggregation of FCSs While Breaker Is Activated
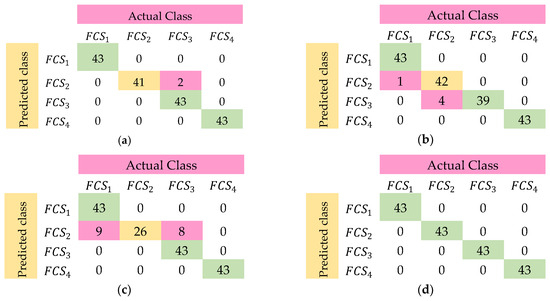
Case 3 addresses the challenges observed in Case 2, where the presence of the commercial load facility (connected through breaker ) reduced the accuracy of conventional machine-learning classification. To improve performance, a deep learning framework is employed. As described in Section 3, the approach combines SVM as the binary learner with the Error-Correcting Output Codes (ECOC) method to extend classification to the multiclass problem. Four ECOC coding strategies are evaluated: one-vs-one (OVO), one-vs-all (OVA), dense random, and sparse random. The confusion matrices for all four coding designs are presented in Figure 9. Among the evaluated strategies, the sparse random coding method achieves perfect classification, correctly identifying all 43 activation events for each FCS. The OVO method also provides strong performance, while the OVA and dense random methods show reduced accuracy, particularly in the classification of .
Figure 9.
Confusion matrices of the DL-based binary learner under four ECOC coding strategies: (a) OVO, (b) OVA, (c) dense random, and (d) sparse random.
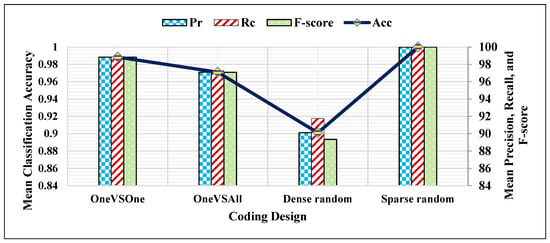
A more detailed performance comparison is provided in Figure 10, which illustrates the precision, recall, F-measure, and accuracy for each ECOC strategy. The sparse random method, in combination with the deep learning framework, achieves 100% accuracy across all FCSs, with precision, recall, and F-measure all equal to unity. These results confirm that the proposed deep learning approach significantly enhances classification robustness in the presence of the commercial facility load. In particular, the sparse random ECOC coding design enables reliable disaggregation of FCS activation events under complex operating conditions. This improvement is critical for utilities, as accurate classification of load components facilitates more precise forecasting of power usage, supports advanced energy management strategies, and contributes to optimized planning and resource allocation in mixed FCS–commercial load environments.
Figure 10.
Classification performance of the DL-based binary learner using four ECOC coding strategies (OVO, OVA, dense random, sparse random) in terms of precision, recall, F-measure, and accuracy.
To evaluate robustness under realistic and varying measurement noise conditions, additive white Gaussian noise (AWGN) was injected with randomly selected SNR levels ranging from 10 to 50 dB for each independent run. Each class comprised 43 test samples, ensuring balanced evaluation across all categories. Under these mixed noise conditions, the proposed framework achieved an overall classification accuracy of 97.09%, with class-wise F1-scores of 0.976 (), 0.943 (), 0.966 (), and 1.000 (). Despite the inclusion of severe noise levels as low as 10 dB, the model consistently maintained high precision and recall across all classes. The limited performance degradation under randomized noise conditions demonstrates that the learned mid-level convolutional features effectively capture stable and discriminative patterns, thereby enabling reliable EV fast charger identification in the presence of realistic and dynamically varying measurement noise. To assess real-time deployment feasibility, representative layers of the ResNet-50 model were profiled for inference time and memory usage to evaluate real-time deployment feasibility. The results indicate low-latency inference with moderate memory requirements, confirming suitability for embedded or edge-device implementation.
5. Discussion
The proposed framework extends beyond performance evaluation and contributes to sustainable development across environmental, economic, and infrastructure dimensions. Its relevance is discussed in relation to established sustainability objectives and practical energy system requirements.
5.1. Environmental Sustainability
The framework supports environmental sustainability by enabling accurate, real-time identification of fast-charging station (FCS) activation events. This capability provides the operational basis for intelligent charging management, including temporal load shifting toward periods of high renewable energy availability, such as peak solar generation. By facilitating better alignment between EV charging demand and renewable supply, the approach has the potential to reduce the effective carbon intensity of charging operations. In addition, improved load disaggregation enhances visibility into commercial energy consumption patterns, allowing inefficient usage to be identified and addressed. More accurate demand characterization can also reduce grid stress and improve forecasting accuracy. These improvements may help defer infrastructure upgrades, thereby reducing material use and lifecycle emissions associated with grid expansion.
5.2. Economic and Socio-Economic Sustainability
From an economic perspective, the single-point sensing strategy at the point of common coupling (PCC) offers a cost-effective alternative to extensive sub-metering. By avoiding instrumentation at each FCS and load node, the framework reduces installation complexity, capital expenditure, and maintenance requirements. This lower cost of deployment improves accessibility, particularly for small- and medium-sized enterprises, and supports wider adoption of intelligent energy management solutions. Accurate identification of FCS operation also enables transparent and fair allocation of electricity costs in multi-tenant commercial facilities. For utilities, improved load classification enhances demand forecasting and operational planning, potentially reducing balancing costs and supporting more efficient distribution network investment.
Infrastructure and Technological Sustainability
The proposed non-intrusive monitoring approach supports sustainable infrastructure development by achieving high monitoring accuracy without requiring physical intervention at individual load points. The use of a single measurement location combined with advanced deep learning techniques enables scalable deployment as EV charging infrastructure expands. Furthermore, compatibility with edge computing platforms, demonstrated through low-latency inference using the ResNet-50 architecture, supports decentralized monitoring architectures. Local processing reduces dependence on centralized data systems, improves resilience to communication disruptions, and limits data transmission requirements.
6. Conclusions
This paper has presented a load disaggregation framework for FCSs located in a commercial facility parking area, consisting of four charging slots rated between 50 kW and 350 kW. Both the FCSs and the commercial facility are connected to the grid at the PCC. To model the commercial load profile, an MCS approach was employed, while current signals were processed using the CWT and corresponding scalograms as inputs to the DL model. A comprehensive dataset of 864 cases was generated to ensure rigorous training and evaluation. The dataset accounts for a wide range of power quality disturbances—including harmonic distortion, frequency deviations, and voltage fluctuations—as well as scenarios with and without the commercial facility load, thereby reflecting realistic operating conditions. To address the multiclass nature of the classification problem, the ECOC framework was applied with an SVM binary learner. Simulation results demonstrate that the DL-based disaggregation approach, when combined with the SVM learner and sparse random ECOC coding, achieves 100% classification accuracy across all four FCSs. This confirms the robustness of the proposed method in handling complex load interactions and diverse power quality conditions. The ability to reliably disaggregate FCS activation events and distinguish them from commercial load contributions provides utilities with valuable insights for accurate load forecasting and the design of effective energy management strategies. The proposed framework therefore offers a practical and scalable solution for enhancing system planning and operation in environments where FCSs and commercial facilities are jointly integrated with the grid. While the framework demonstrates robust performance for a single commercial facility, future work will focus on validating its generalizability across different building types and grid configurations, as well as extending it to scenarios with integrated renewable energy sources to study the impact of variable generation on disaggregation accuracy.
Funding
This work was funded by the Deanship of Graduate Studies and Scientific Research at Jouf University under grant No. (DGSSR-2023-02-02215).
Institutional Review Board Statement
Not applicable.
Informed Consent Statement
Not applicable.
Data Availability Statement
The original contributions presented in this study are included in the article. Further inquiries can be directed to the corresponding author.
Conflicts of Interest
The author declare no conflicts of interest.
References
- Shafiei, M.; Ghasemi-Marzbali, A. Electric Vehicle Fast Charging Station Design by Considering Probabilistic Model of Renewable Energy Source and Demand Response. Energy 2023, 267, 126545. [Google Scholar] [CrossRef] [Scilit]
- Feng, J.; Hu, Z.; Duan, X. EV Fast Charging Station Planning Considering Competition Based on Stochastic Dynamic Equilibrium. IEEE Trans. Ind. Appl. 2023, 59, 3795–3809. [Google Scholar] [CrossRef] [Scilit]
- Li, D.; Zouma, A.; Liao, J.-T.; Yang, H.-T. An Energy Management Strategy with Renewable Energy and Energy Storage System for a Large Electric Vehicle Charging Station. eTransportation 2020, 6, 100076. [Google Scholar] [CrossRef] [Scilit]
- Brinkel, N.B.G.; Gerritsma, M.K.; AlSkaif, T.A.; Lampropoulos, I.; van Voorden, A.M.; Fidder, H.A.; van Sark, W.G.J.H.M. Impact of Rapid PV Fluctuations on Power Quality in the Low-Voltage Grid and Mitigation Strategies Using Electric Vehicles. Int. J. Electr. Power Energy Syst. 2020, 118, 105741. [Google Scholar] [CrossRef] [Scilit]
- Munsi, M.S.; Joshi, R.P. Comprehensive Analysis of Fuel Cell Electric Vehicles: Challenges, Powertrain Configurations, and Energy Management Systems. IEEE Access 2024, 12, 145459–145482. [Google Scholar] [CrossRef] [Scilit]
- Sahin, H.; Esen, H. Performance and Energy Analysis of a Fuel Cell Electric Vehicle. IEEE Access 2025, 13, 29206–29219. [Google Scholar] [CrossRef] [Scilit]
- Jia, C.; Liu, W.; Chau, K.T.; He, H.; Zhou, J.; Niu, S. Passenger-Aware Reinforcement Learning for Efficient and Robust Energy Management of Fuel Cell Buses. eTransportation 2026, 27, 100537. [Google Scholar] [CrossRef] [Scilit]
- Zhao, H.; Yan, X.; Ma, L. Training-Free Non-Intrusive Load Extracting of Residential Electric Vehicle Charging Loads. IEEE Access 2019, 7, 117044–117053. Available online: https://ieeexplore.ieee.org/document/8808920 (accessed on 28 April 2023). [CrossRef] [Scilit]
- Ling, Z.; Tao, Q.; Zheng, J.; Xiong, P.; Liu, M.; Xiao, Z.; Gang, W. A Nonintrusive Load Monitoring Method for Office Buildings Based on Random Forest. Buildings 2021, 11, 449. [Google Scholar] [CrossRef] [Scilit]
- Rafsanjani, H.N.; Moayedi, S.; Ahn, C.R.; Alahmad, M. A Load-Disaggregation Framework to Sense Personalized Energy-Use Information in Commercial Buildings. Energy Build. 2020, 207, 109633. [Google Scholar] [CrossRef] [Scilit]
- Zhou, M.; Shao, S.; Wang, X.; Zhu, Z.; Hu, F. Deep Learning-Based Non-Intrusive Commercial Load Monitoring. Sensors 2022, 22, 5250. [Google Scholar] [CrossRef] [Scilit]
- Ridi, A.; Gisler, C.; Hennebert, J. A Survey on Intrusive Load Monitoring for Appliance Recognition. In Proceedings of the 2014 22nd international Conference on Pattern Recognition, Stockholm, Sweden, 24–28 August 2014; IEEE: Piscataway, NJ, USA, 2014; pp. 3702–3707. [Google Scholar]
- Norford, L.K.; Leeb, S.B. Non-Intrusive Electrical Load Monitoring in Commercial Buildings Based on Steady-State and Transient Load-Detection Algorithms. Energy Build. 1996, 24, 51–64. [Google Scholar] [CrossRef] [Scilit]
- Lu, S.; Feng, X.; Lin, G.; Wang, J.; Xu, Q. Non-Intrusive Load Monitoring and Controllability Evaluation of Electric Vehicle Charging Stations Based on K-Means Clustering Optimization Deep Learning. World Electr. Veh. J. 2022, 13, 198. [Google Scholar] [CrossRef] [Scilit]
- Meier, A.; Cautley, D. Practical Limits to the Use of Non-Intrusive Load Monitoring in Commercial Buildings. Energy Build. 2021, 251, 111308. [Google Scholar] [CrossRef] [Scilit]
- Kang, J.-S.; Yu, M.; Lu, L.; Wang, B.; Bao, Z. Adaptive Non-Intrusive Load Monitoring Based on Feature Fusion. IEEE Sens. J. 2022, 22, 6985–6994. [Google Scholar] [CrossRef] [Scilit]
- Hart, G.W. Nonintrusive Appliance Load Monitoring. Proc. IEEE 1992, 80, 1870–1891. [Google Scholar] [CrossRef] [Scilit]
- Liang, J.; Ng, S.K.; Kendall, G.; Cheng, J.W. Load Signature Study—Part I: Basic Concept, Structure, and Methodology. IEEE Trans. Power Deliv. 2009, 25, 551–560. [Google Scholar] [CrossRef] [Scilit]
- Chang, H.-H.; Chen, K.-L.; Tsai, Y.-P.; Lee, W.-J. A New Measurement Method for Power Signatures of Nonintrusive Demand Monitoring and Load Identification. IEEE Trans. Ind. Appl. 2012, 48, 764–771. [Google Scholar] [CrossRef] [Scilit]
- Rehman, A.U.; Lie, T.T.; Vallès, B.; Tito, S.R. Comparative Evaluation of Machine Learning Models and Input Feature Space for Non-Intrusive Load Monitoring. J. Mod. Power Syst. Clean Energy 2021, 9, 1161–1171. [Google Scholar] [CrossRef] [Scilit]
- Moreno Jaramillo, A.F.; Laverty, D.M.; Del Rincon, J.M.; Hastings, J.; Morrow, D.J. Supervised Non-Intrusive Load Monitoring Algorithm for Electric Vehicle Identification. In Proceedings of the 2020 IEEE International Instrumentation and Measurement Technology Conference (I2MTC), Dubrovnik, Croatia, 25–28 May 2020; IEEE: Dubrovnik, Croatia, 2020; pp. 1–6. [Google Scholar]
- Thokala, N.K.; Paresh, S.; Chandra, M.G. An Effective Electrical Load Disaggregation Approach for Low-Sampled Smart Meter Data. In Proceedings of the 9th ACM International Conference on Systems for Energy-Efficient Buildings, Cities, and Transportation, Boston, MA, USA, 9–10 November 2022; Association for Computing Machinery: New York, NY, USA, 2022; pp. 149–158. [Google Scholar]
- Eskander, M.M.; Silva, C.A. A Complementary Unsupervised Load Disaggregation Method for Residential Loads at Very Low Sampling Rate Data. Sustain. Energy Technol. Assess. 2021, 43, 100921. [Google Scholar] [CrossRef] [Scilit]
- Yang, N.; Wang, Y.; Zhang, Y.; Yuan, D. Non-Intrusive Load Monitoring for Energy Management in Smart Grids Incorporating EVs. IEEE Trans. Consum. Electron. 2025, 71, 1696–1706. [Google Scholar] [CrossRef] [Scilit]
- Karmakar, G.; Battula, S.K.; Naha, R.; Shah, R.; Kamruzzaman, J.; Tania, S.; Islam, S.; Shahriar Shafin, S. Regional-Level Disaggregation of EV Uptake Energy Consumption Using Bottom-Up Approach. IEEE Trans. Transp. Electrif. 2025, 11, 14075–14086. [Google Scholar] [CrossRef] [Scilit]
- Deru, M.; Field, K.; Studer, D.; Benne, K.; Griffith, B.; Torcellini, P.; Liu, B.; Halverson, M.; Winiarski, D.; Rosenberg, M. US Department of Energy Commercial Reference Building Models of the National Building Stock. 2011. Available online: https://www.osti.gov/biblio/1009264 (accessed on 6 June 2020).
- Alshareef, S.M.; Morsi, W.G. Probabilistic Commercial Load Profiles at Different Climate Zones. In Proceedings of the 2017 IEEE Electrical Power and Energy Conference (EPEC), Saskatoon, Canada, 22–25 October 2017; pp. 1–7. [Google Scholar] [CrossRef] [Scilit]
- Ong, S.; Clark, N. Commercial and Residential Hourly Load Profiles for All TMY3 Locations in the United States; National Renewable Energy Laboratory: Golden, CO, USA, 2014. [Google Scholar]
- Rioul, O.; Vetterli, M. Wavelets and Signal Processing. IEEE Signal Process. Mag. 1991, 8, 14–38. [Google Scholar] [CrossRef] [Scilit]
- Farge, M. Wavelet transforms and their applications to turbulence. Annu. Rev. Fluid Mech. 1992, 24, 395–458. [Google Scholar] [CrossRef]
- Addison, P. Introduction to Redundancy Rules: The Continuous Wavelet Transform Comes of Age. Philos. Trans. R. Soc. A Math. Phys. Eng. Sci. 2018, 376, 20170258. [Google Scholar] [CrossRef] [Scilit] [PubMed]
- Aguiar-Conraria, L.; Soares, M.J. The Continuous Wavelet Transform: A Primer; NIPE—Universidade do Minho: Braga, Portugal, 2011. [Google Scholar]
- Alzubaidi, L.; Zhang, J.; Humaidi, A.J.; Al-Dujaili, A.; Duan, Y.; Al-Shamma, O.; Santamaría, J.; Fadhel, M.A.; Al-Amidie, M.; Farhan, L. Review of Deep Learning: Concepts, CNN Architectures, Challenges, Applications, Future Directions. J. Big Data 2021, 8, 53. [Google Scholar] [CrossRef] [Scilit]
- Xia, M.; Li, T.; Xu, L.; Liu, L.; de Silva, C.W. Fault Diagnosis for Rotating Machinery Using Multiple Sensors and Convolutional Neural Networks. IEEE/ASME Trans. Mechatron. 2018, 23, 101–110. [Google Scholar] [CrossRef] [Scilit]
- LeCun, Y.; Bengio, Y.; Hinton, G. Deep Learning. Nature 2015, 521, 436–444. [Google Scholar] [CrossRef] [Scilit] [PubMed]
- Gong, W.; Chen, H.; Zhang, Z.; Zhang, M.; Wang, R.; Guan, C.; Wang, Q. A Novel Deep Learning Method for Intelligent Fault Diagnosis of Rotating Machinery Based on Improved CNN-SVM and Multichannel Data Fusion. Sensors 2019, 19, 1693. [Google Scholar] [CrossRef] [Scilit]
- Kopalidis, T.; Solachidis, V.; Vretos, N.; Daras, P. Advances in Facial Expression Recognition: A Survey of Methods, Benchmarks, Models, and Datasets. Information 2024, 15, 135. [Google Scholar] [CrossRef] [Scilit]
- He, K.; Zhang, X.; Ren, S.; Sun, J. Deep Residual Learning for Image Recognition. In Proceedings of the 2016 IEEE Conference on Computer Vision and Pattern Recognition (CVPR), Las Vegas, NV, USA, 27–30 June 2016; pp. 770–778. [Google Scholar]
- Escalera, S.; Pujol, O.; Radeva, P. On the Decoding Process in Ternary Error-Correcting Output Codes. IEEE Trans. Pattern Anal. Mach. Intell. 2010, 32, 120–134. [Google Scholar] [CrossRef] [Scilit]
- Fürnkranz, J. Round Robin Classification. J. Mach. Learn. Res. 2002, 2, 721–747. [Google Scholar] [CrossRef]
- Escalera, S.; Pujol, O.; Radeva, P. Separability of Ternary Codes for Sparse Designs of Error-Correcting Output Codes. Pattern Recognit. Lett. 2009, 30, 285–297. [Google Scholar] [CrossRef] [Scilit]
- Oh, S.-G.; Kim, T. Facial Expression Recognition by Regional Weighting with Approximated Q-Learning. Symmetry 2020, 12, 319. [Google Scholar] [CrossRef] [Scilit]
- Escalera, S.; Pujol, O.; Radeva, P. Error-Correcting Ouput Codes Library. J. Mach. Learn. Res. 2010, 11, 661–664. [Google Scholar]
- Powers, D. Evaluation: From Precision, Recall and F-Factor to ROC, Informedness, Markedness & Correlation. Mach. Learn. Technol. 2008, 2, 2229–3981. [Google Scholar]

Disclaimer/Publisher’s Note: The statements, opinions and data contained in all publications are solely those of the individual author(s) and contributor(s) and not of MDPI and/or the editor(s). MDPI and/or the editor(s) disclaim responsibility for any injury to people or property resulting from any ideas, methods, instructions or products referred to in the content. |
© 2026 by the author. Licensee MDPI, Basel, Switzerland. This article is an open access article distributed under the terms and conditions of the Creative Commons Attribution (CC BY) license.