


Abstract
Resource-based cities in the Yellow River Basin are important pillars of national energy security and regional coordinated development, and their green transformation is closely related to the overall strategy of ecological protection and high-quality development in the basin. This study takes 34 resource-based cities within the basin as the research objects and employs a combination of methods, including the Super Slacks-Based Measure (SBM) model, the Malmquist–Luenberger index, the standard deviational ellipse, the Dagum Gini coefficient, and the geographical detector, to systematically analyze the spatio-temporal evolution characteristics and driving mechanisms of green development efficiency from 2012 to 2022. The results indicate that: (1) green development efficiency shows an overall upward trend, forming a pattern of leading performance in the lower reaches, lagging development in the middle reaches, and accelerated catching-up in the upper reaches, with efficiency improvements jointly driven by technical efficiency enhancement and technological progress; (2) the gravity center of efficiency shifts southwestward overall, and interregional disparities constitute the main source of overall differences; (3) economic development level, science and technology investment, fiscal expenditure, and energy intensity are the key driving factors, with significantly strengthened interactions among multiple factors. From the dual perspectives of basin location and the urban life cycle, this study constructs a multidimensional analytical framework that provides a reference for categorized regulation and coordinated regional governance of resource-based cities.
1. Introduction
Against the backdrop of growing global resource scarcity and escalating climate change challenges, green development has become a widely shared value and objective within the international community. Since the United Nations Conference on Sustainable Development in 2012, this issue has attracted extensive attention and emerged as a central topic in international cooperation and policy discourse [1]. In recent years, China has actively responded to global sustainability initiatives by continuously advancing its green development strategy and building an ecological civilization framework suited to national conditions, with the aim of achieving coordinated economic growth and environmental protection [2]. While the long-standing consumption model dominated by coal and oil has supported China’s rapid economic expansion, it has also resulted in excessive resource depletion, environmental degradation, and structural imbalances, underscoring the urgent need for a green transformation of socio-economic development. Resource-based cities, in particular, despite their significant contributions to national economic growth, commonly face challenges such as lagging tertiary industries, population outflow, and fragile ecosystems [3].
The Yellow River Basin, as a critical ecological security barrier and the most energy-resource-rich region among China’s major river basins, holds a prominent strategic position [4]. In September 2019, “Ecological Protection and High-Quality Development in the Yellow River Basin” was elevated to a major national strategy, marking a strategic shift toward integrated basin governance and regional coordination. To implement this strategy, the State Council issued the Outline of the Plan for Ecological Protection and High-Quality Development of the Yellow River Basin in October 2021, setting the overarching goal of fundamentally improving the ecological environment and achieving coordinated socio-economic development by 2035 [5]. Within this framework, the green transformation of resource-based cities is regarded as a key pillar for advancing ecological restoration and industrial upgrading.
Resource-based cities are densely distributed across the Yellow River Basin. According to the National Plan for the Sustainable Development of Resource-Based Cities (2013–2020), such cities account for 30.5% of China’s total, forming a crucial region for national energy security and regional economic development [6]. However, these cities face multiple constraints. More than half are experiencing resource depletion, and the share of energy-related industrial value added in large-scale industry significantly exceeds the national average, particularly in coal-dependent cities. Meanwhile, extensive development patterns have caused severe environmental problems, including soil erosion, land subsidence, and water pollution, intensifying conflicts between resource exploitation and ecological protection. This complex interplay of factors increases the urgency and difficulty of green transformation, making the shift from extensive growth toward green, low-carbon, and efficient development an inevitable path for resource-based cities to achieve sustainable and high-quality growth.
Green development serves as a critical model of sustainable development, with its core lying in enhancing green development efficiency [7]. Green development efficiency not only deepens the understanding of green development but also addresses the limitations of traditional development models, which rely solely on factor inputs while neglecting environmental costs. It has gradually become a key indicator for evaluating high-quality socioeconomic development and advancing global sustainable development [8]. The concept of the “green economy,” introduced by foreign scholars such as Pierce in 1989, laid the foundation for related research [9]. International studies have primarily focused on developed countries, with research content emphasizing social issues in mining communities at the post-industrial stage, including social structural systems, changes in employment and labor markets, and community development [10,11]. In 2002, the United Nations Development Programme (UNDP) published the China Human Development Report: Green Development, the Inevitable Choice, which systematically articulated the environmental challenges facing China and pathways for green development [12], thereby stimulating scholarly discussions on green development within the country [13,14]. Driven by policy initiatives, domestic research has gradually formed a systematic framework in terms of theory, methodology, and regional practices.
In terms of research content, domestic scholars often regard green development efficiency as a crucial indicator for measuring economy–ecology coordination. Related research has gradually evolved into an analytical framework integrating multiple perspectives. On the one hand, research perspectives encompass areas such as environmental pollution control [15], environmental policy [16], and the transformation of resource-based cities [17], focusing on the guiding role of institutions, policies, and governance structures in the green transition. On the other hand, as research deepens, scholars have progressively incorporated the interaction and coordination relationships between green development efficiency and dimensions like economic growth [18] and technological innovation [19] into the analytical framework. Alternatively, they systematically analyze the comprehensive impact of various factors, including economic development [20] and regional technological transformation [21], on green efficiency, thereby further expanding the theoretical connotation and extension of green development.
In terms of research subjects, domestic studies have progressively extended to multiple specific industry sectors, reflecting the broad practical application of the green development concept. Research in the agricultural sector [22] primarily focuses on resource conservation and the application of eco-friendly technologies. Tourism research [23] emphasizes exploring ecotourism and low-carbon operation models. Studies on manufacturing [24] and industry [25] mainly concentrate on cleaner production, energy structure optimization, and the regulation of emission intensity. Research concerning marine fisheries [26] highlights synergistic pathways for sustainable fishing and marine ecological conservation.
In terms of research methodology, green development efficiency is mainly measured using evaluation indicator systems and total factor productivity approaches. Commonly used methods include Stochastic Frontier Analysis (SFA) and Data Envelopment Analysis (DEA). Due to the limitations of SFA in handling undesirable outputs and the failure of traditional DEA to fully account for slack improvement, improved DEA models, such as SBM-DEA [27], Super-SBM [28], and SBM–GML [29], have gradually become mainstream tools for measuring regional development efficiency. Regarding the investigation of influencing mechanisms, scholars generally agree that natural geographical conditions, socio-economic factors, and policy interventions jointly shape green development efficiency [30]. Existing research widely employs various econometric models, chosen according to the characteristics of the research questions. To address the censored nature of efficiency values as the dependent variable, studies frequently adopt the Tobit model [31]. To examine spillover effects between regions, spatial econometric models are extensively applied [32]. Furthermore, to reveal the spatial non-stationarity of driving factors, the Geographically Weighted Regression model [33] is used to visually illustrate the localized patterns of influence for each driver. Based on these methods, a multi-dimensional analytical framework for influence mechanisms has been progressively constructed.
In terms of research scale, relevant studies have gradually expanded from national [34], urban agglomeration [35,36], or provincial levels [37] to finer spatial units such as river basins [38,39,40] and counties [41], exhibiting a trend shifting from macro to micro levels and deepening from overall to local perspectives. However, most current findings remain concentrated at the prefectural city level, indicating a need for further expansion of research at more micro-level scales.
Overall, existing studies have made certain progress in the measurement of green development efficiency and the transformation of resource-based cities. However, notable gaps remain for resource-based cities in the Yellow River Basin as a distinctive spatial unit characterized by both resource dependence and ecological sensitivity. First, a systematic analytical framework that integrates the “locational differences of the Yellow River Basin” with the “life cycle of resource-based cities” is lacking, making it difficult to reveal the multidimensional heterogeneity within the basin. Second, most studies focus on static efficiency measurement, with insufficient attention to the dynamic evolution of efficiency and the decomposition of its sources, particularly the roles of technical efficiency change and technological progress. Third, analyses of influencing mechanisms are mostly based on traditional regression approaches, making it difficult to identify synergistic driving mechanisms arising from multi-factor interactions.
Accordingly, this study focuses on three core questions: What are the spatial–temporal evolution characteristics of green development efficiency? How do regional locational differences and life-cycle stages shape the pattern of efficiency differentiation? Is efficiency improvement mainly driven by technical efficiency change or technological progress, and does its driving mechanism exhibit a synergistic enhancement effect arising from multi-factor interactions?
To address these questions, the objective of this research is to establish a framework for green development efficiency evaluation system that incorporates undesirable outputs. Taking resource-based cities in the Yellow River Basin as the research object, the study systematically characterizes the spatial–temporal evolution of green development efficiency from 2012 to 2022, reveals differentiation patterns under different basin locations and urban life-cycle stages, and identifies key driving factors and their interaction mechanisms. The findings provide a scientific basis for optimizing green transformation pathways and policy formulation for resource-based cities, thereby supporting the development of an efficient, low-carbon, and sustainable regional development model.
The innovations of this study are mainly reflected in two aspects. First, in terms of research perspective, this study moves beyond the conventional macro-level approach that focuses on national cities or general regions. Instead, it concentrates on the Yellow River Basin, which exhibits the dual characteristics of resource dependence and ecological vulnerability. A dual classification framework based on basin location and urban life-cycle stage is constructed, jointly considering the gradient disparities across the upper, middle, and lower reaches and the characteristics of various phases of urban development, thus revealing the multidimensional differentiation structure and evolutionary logic of green development efficiency. Second, in terms of the research framework, this study develops a multidimensional analytical framework that integrates efficiency measurement, dynamic decomposition, spatial evolution, identification of disparity sources, and detection of interaction mechanisms. At the same time, it moves beyond the limitations of traditional single-factor analysis by emphasizing the role of multi-factor interactions in shaping green development efficiency. This framework provides more targeted transformation pathways and policy combinations for different sections and types of resource-based cities.
2. Materials and Methods
2.1. Overview of the Study Area
The Yellow River Basin, as a major ecological security barrier and energy–economic belt in China, spans nine provinces and autonomous regions, encompasses three major geomorphic steps and multiple climate zones, and constitutes a distinctive region characterized by ecological fragility and resource abundance (Figure 1). The basin contains China’s most significant reserves of coal, oil, and natural gas, and the share of energy-related industrial value added in resource-based cities is markedly higher than the national average. As a result, the basin serves as a strategic energy base of national importance, playing a critical role in energy security and regional economic development. However, while driving economic growth, these cities exhibit typical features of resource-dependent development, including highly specialized economic structures, path dependence on extractive industries, industrial homogeneity, rigid development patterns, and mounting ecological pressures [42]. Compared with other resource-based cities nationwide, the tendency toward industrial convergence is more pronounced, with economic growth heavily reliant on resource extraction and primary processing, making transformation and upgrading more challenging.
Figure 1.
Map of the Study Area: (a) Administrative divisions of the seven provinces/autonomous regions within the Yellow River Basin; (b) Spatial distribution of resource-based cities in the study area, with the study region highlighted in yellow; (c) Classification of resource-based cities based on their life-cycle stage.
Owing to differences in resource endowments, development stages, and locational conditions, resource-based cities across different sections of the basin display pronounced developmental gradients in both performance and transformation pressure. According to the classification criteria of the National Plan for the Sustainable Development of Resource-Based Cities (2013–2020) issued by the State Council [43], this study selects 34 resource-based cities as the research sample and constructs an analytical framework from the perspectives of urban life cycle theory and geographical location. From the life cycle perspective, cities are categorized into growing, mature, declining, and regenerative types. Growing cities are in the early stage of resource development, with abundant reserves, rapid population growth, and a strong dependence on resource industries, requiring regulated exploitation and the cultivation of emerging industries. Mature cities are in the mid-to-late stage of development, characterized by high resource utilization intensity, rigid industrial structures, and rising environmental pressure, necessitating industrial upgrading and ecological governance. Declining cities face resource depletion, economic transition difficulties, population outflow, and heavy ecological restoration tasks, making them key targets of policy support. Regenerative cities have largely reduced resource dependence, achieved industrial restructuring, and shown initial success in green development, and should further strengthen innovation-driven growth and urban functions. From the geographical perspective, the basin is divided into upstream, midstream, and downstream regions. This pronounced intra-basin heterogeneity provides a solid empirical basis and research value for examining the spatio-temporal differentiation and driving mechanisms of green development efficiency in resource-based cities of the Yellow River Basin. The administrative affiliations and classifications of the sample cities are presented in Table 1.
Table 1.
Categories of Resource-based Cities in the Yellow River Basin.
2.2. Variable Selection and Indicator System Construction
The key objective of transforming resource-based cities lies in achieving sustainable development and high-quality growth, which requires coordinated harmony among the ecological environment, natural resources, economic development, and social progress. This study draws on the Green Development Indicator System [44] and employs an analytical framework based on input and output dimensions. Building on existing academic research, a comprehensive assessment framework was ultimately constructed, as presented in Table 2. This system incorporates input indicators such as capital, labor, and energy [45,46], as well as output indicators covering economic development, social well-being, and environmental sustainability [47,48].
Table 2.
Indicator System for Measuring Green Development Efficiency.
In terms of input indicators, fixed-asset investment serves as a core measure of capital input in the green development process of resource-based cities and plays a critical role in promoting industrial structure optimization. Labor input is measured by the number of employed persons at year-end. Built-up area is introduced to represent land resource input, reflecting the intensity of urban land development and the level of spatial resource allocation and intensive use. Total urban water supply is used to capture water resource input, as its consumption is closely linked to the scale of economic activity and resource use efficiency. Considering the high statistical reliability of electricity data and its strong correlation with gross domestic product (GDP) elasticity and overall energy consumption, total electricity consumption of the whole society is selected as the indicator of energy input. By integrating these multidimensional inputs, the constructed indicator system comprehensively reflects factor allocation in the green development of cities and provides a solid basis for subsequent efficiency measurement.
In terms of desirable outputs, the objective of green development in resource-based cities is to promote coordinated progress across the economic, social, and environmental dimensions. Accordingly, GDP is used to represent economic growth, average wage of employees to reflect improvements in livelihoods, and park green space area as a key indicator of environmental enhancement.
In terms of undesirable outputs, resource-based cities rely heavily on resource-intensive industries such as mining and processing, which are characterized by significant pollution. To capture environmental constraints on sustainable development, this study selects industrial sulfur dioxide emissions, industrial smoke and dust emissions, and industrial wastewater discharge as the three core indicators to comprehensively assess environmental impacts.
2.3. Research Methodology
To systematically reveal the spatio-temporal patterns and formation mechanisms of green development efficiency, this study constructs a stepwise and in-depth analytical framework, as illustrated in Figure 2.
Figure 2.
Framework of the Research Methodology.
First, the undesirable-output-included Super-SBM model is employed to measure the static green development efficiency of each city. By effectively incorporating environmental constraints, this model generates efficiency values that are closer to real conditions and provides reliable baseline data for all subsequent analyses, thereby answering the question of “what is the level of efficiency.” Second, the centroid and standard deviational ellipse methods project the efficiency data onto geographical space. Through the centroid migration trajectory and the standard deviational ellipse, the spatial agglomeration and diffusion characteristics of the overall efficiency distribution are depicted, offering an intuitive visualization of the spatial–temporal transformation of the efficiency pattern and addressing the question of “what is the spatial pattern.” Third, the Dagum Gini coefficient decomposition model identifies the structural sources of the overall disparities from the perspectives of the basin’s geographical sections and the life-cycle stages of resource-based cities, decomposing the disparities into within-group differences, between-group differences, and trans-variation density. This step addresses the structural question of “where do the differences come from.” Finally, the geographical detector model explains “why the differences arise” by using the q statistic and interaction detection to identify the key driving factors influencing spatial differentiation and their synergistic effects, thereby advancing the analysis from structural decomposition to mechanism identification.
These interconnected methods sequentially address the core questions of “what is the level of efficiency,” “what is the spatial pattern,” “where do the differences come from,” and “why do the differences arise,” enabling a progressive investigation from static to dynamic analysis, from spatial patterns to structural sources, and from describing phenomena to exploring underlying mechanisms.
2.3.1. Super-SBM Model Incorporating Undesirable Outputs
Traditional Data Envelopment Analysis (DEA) models, such as the input-oriented CCR or BCC models, are radial and oriented. They assume that inputs or outputs must be adjusted simultaneously by a fixed proportion, struggle to effectively handle undesirable outputs commonly present in real-world production processes, and fail to fully account for slack improvement in inputs and outputs. To address these limitations, Tone [49] proposed a Slacks-Based Measure (SBM) model, which is a non-radial and non-oriented DEA model. However, the efficiency scores measured by the aforementioned methods range between 0 and 1, preventing further discrimination among efficient decision-making units (DMUs). Building on this, Tone [50] further introduced the Super-SBM model, which allows efficiency scores for efficient DMUs to exceed 1, enabling a complete ranking. Subsequently, Tone [51] developed an SBM model incorporating undesirable outputs based on the original SBM framework. In this model, the indicator system for each DMU includes three categories: inputs, desirable outputs, and undesirable outputs.
The efficiency values were calculated using MATLAB R2024a. The related parameter formulas are as follows.
where denotes the efficiency evaluation score . A larger value of indicates higher efficiency of the decision-making unit. When , the DMU is considered relatively efficient; when , it is considered relatively inefficient, indicating that the input–output proportions require further adjustment to achieve optimal efficiency. represents the number of DMUs. , and are the slack variables for inputs, desirable outputs, and undesirable outputs, respectively. , and denote the numbers of inputs, desirable outputs, and undesirable outputs. is the weight vector. , and represent the input, desirable output, and undesirable output of the DMU, respectively. denotes the set of constraints.
2.3.2. Gravity Center and Standard Deviational Ellipse
The standard deviational ellipse (SDE) is a core tool for characterizing the spatial distribution and dynamic evolution of geographic phenomena [52]. It analyzes the spatio-temporal distribution of green development efficiency through parameters including the gravity center, azimuth (orientation), and the standard deviations of the major and minor axes. The standard deviations of the major and minor axes describe the dispersion of efficiency values along the principal trend direction and the perpendicular direction, respectively [53]. The rotation angle represents the orientation of the ellipse’s major axis, indicating the dominant spatial trend of green development efficiency. The gravity center reflects the spatial concentration of central tendency; its migration captures the trajectory of changes in green development efficiency. Distances and angles of interannual gravity-center movements are used to describe migration patterns. The centroid migration trajectory and standard deviational ellipse were calculated and mapped using ArcGIS 10.8. The related parameter formulas are as follows.
Gravity-center coordinates:
where denote the longitude and latitude of the gravity center of resource-based cities in year ; is the green development efficiency value; and represent the longitude and latitude of the geographic center.
Gravity-center migration distance (interannual spatial displacement):
where is the migration distance; is the longitude–latitude to planar distance conversion constant (set to 111.11 km); with and denote the gravity-center coordinates in years and , respectively.
Gravity-center deviation angle and standard deviations of the axes:
Major axis:
Minor axis:
where is the deviation (azimuth) angle of the gravity center (0° due north, measured clockwise); and denote the coordinate deviations of each city from the mean gravity center; and are the standard deviations along the axes and axes, respectively.
2.3.3. Dagum Gini Coefficient
The Dagum Gini coefficient model is utilized to measure and reveal the degree of disparity and its evolution among cities across geographical locations and urban life cycle stages. The Dagum Gini coefficient features strong additivity and decomposability, allowing overall inequality to be further decomposed into within-region differences, between-region differences, and transvariation intensity, thereby providing a more nuanced understanding of the structural sources of regional imbalance. This approach overcomes limitations of the Theil index and the traditional Gini coefficient, such as data overlap and crossing issues, and effectively captures the contributions of different sources of disparity [54]. The Gini coefficients were calculated using MATLAB R2024a.
(1) Overall Gini Coefficient
The overall Gini coefficient captures the magnitude of disparities among resource-based cities at the aggregate level and serves as a fundamental measure for assessing regional coordination and balance. It also provides the basis for identifying which components dominate overall inequality. According to the Dagum Gini coefficient and its subgroup decomposition, the overall Gini coefficient can be decomposed into three components: the within-region contribution , the between-region contribution , and the transvariation intensity contribution , such that . This decomposition reveals the structural sources of the overall inequality .
where denotes the overall Gini coefficient; is the mean efficiency value; is the number of resource-based cities in the study ( = 34); is the number of regions; is the number of resource-based cities in region ; and denotes the efficiency value of city in region .
(2) Within-Region Contribution
represents the sum of contributions from disparities within regions to the overall inequality, reflecting internal structural imbalance, that is, the contribution of differences among provinces or autonomous regions within the same region to total disparity.
where denotes the within-region contribution to overall inequality; is the Gini coefficient of region; represents the share of resource-based cities in region relative to the total; denotes the share of efficiency contributed by region to the overall efficiency; and is the mean development efficiency of region .
(3) Between-Region Contribution
measures the contribution of differences between regions to overall inequality, that is, the gaps among the mean coordination levels of the upper, middle, and lower reaches, which constitute an important form of structural imbalance.
where is the between-region contribution; is the Gini coefficient between regions and ; denotes the relative impact between regions and ; is the difference in efficiency values between regions; is the first-order transvariation distance; and and represent the cumulative density distribution functions for regions and , respectively.
(4) Transvariation Intensity Contribution
represents the additional contribution to overall inequality arising from overlapping distributions between regions. When the coordination-level distributions of two regions overlap substantially, even a small difference in their means can generate a large contribution to overall inequality due to strong distributional crossing.
where denotes the transvariation intensity contribution, and all other symbols have the same meanings as defined above.
2.3.4. Geographical Detector
The geographical detector is a statistical approach designed to explain the driving forces behind spatial differentiation of variables and to detect the explanatory power of interactions between two factors [55]. When the sample size is less than 30, it is considered more reliable than classical regression approaches. The method is applicable to both quantitative and qualitative data and has been widely used in studies of ecological and environmental change as well as socioeconomic development. The detection values of influencing factors were calculated using ArcGIS 10.8. The formula is given as follows.
where denotes the explanatory power; and represent the sample size and variance, respectively; is the number of explanatory factors; and and denote the sample size and variance of stratum . The value of ranges from 0 to 1, with a larger indicating stronger explanatory power.
2.4. Data Sources
Based on the definitions outlined in the Comprehensive Planning for the Yellow River Basin and the National Sustainable Development Plan for Resource-based Cities, this study selected 34 typical resource-based cities within the Yellow River Basin from 2012 to 2022 as research subjects. These sample cities are distributed across seven provincial-level regions. The research data primarily originated from the China City Statistical Yearbook, municipal statistical yearbooks, and official bulletins. For missing data, scientific interpolation methods were applied. Due to data availability and the issue of basin affiliation, the Aba Tibetan and Qiang Autonomous Prefecture was not included in the analysis.
2.5. Paper Structure
The remainder of the paper is organized as follows. Section 3 presents the core empirical analysis, examining spatio-temporal evolution, spatial patterns, disparities, and the spatial heterogeneity of influencing factors. Section 4 provides a comprehensive discussion, proposes policy implications, and outlines future research directions. Section 5 concludes with the main findings.
3. Results Analysis
3.1. Characteristics of the Spatio-Temporal Evolution of Green Development Efficiency
3.1.1. Temporal Evolution
This study employs violin plots to visualize the distribution of green development efficiency in resource-based cities across different years, as shown in Figure 3. The contour of each violin represents a kernel density-estimated probability density curve, whose horizontal width reflects the relative data density, with wider areas indicating a higher concentration of cities within a given efficiency range. The shapes at both ends of the contour capture the sparsity of observations near boundary values. Overlaid points denote the actual observed efficiency values of individual cities, illustrating their positions and dispersion.
Figure 3.
Green Development Efficiency Values of Resource-based Cities: (a) Provincial-level Efficiency Values; (b) Efficiency Values of Upstream Cities; (c) Efficiency Values of Midstream Cities; (d) Efficiency Values of Downstream Cities.
The Yellow River Basin’s seven provinces’ green development efficiency shows an overall, erratic rising tendency, as seen in Figure 3a. From 2012 to 2017, the distribution of green development efficiency shifted upward overall while dispersion expanded, which may be closely related to differences among provinces in policy implementation capacity and stages of economic structural transformation, leading to pronounced regional divergence in green development performance. During 2018–2020, the overall distribution of green development efficiency became more concentrated, with marked improvements in low-efficiency cities and slight declines in high-efficiency ones, reflecting enhanced regional coordination. Meanwhile, amid the COVID-19 shock in 2020, the implementation of the “Six Stability” and “Six Guarantees” policies played a positive role in stabilizing investment, promoting innovation, and safeguarding ecological conditions. According to the Statistical Communiqué of the People’s Republic of China on the 2020 National Economic and Social Development and subsequent annual communiqués, national fixed-asset investment gradually resumed growth, expenditure on science and technology continued to increase, energy consumption per unit of GDP kept declining, and overall ecological environmental quality improved. These trends suggest that macroeconomic regulation policies mitigated the risk of a decline in green development efficiency to a certain extent. The COVID-19 shock and subsequent macro policies may have exerted stage-specific impacts on the input factors and undesirable outputs of green development efficiency by influencing fiscal expenditure structures, energy consumption patterns, and the pace of industrial adjustment. For example, policies aimed at stabilizing investment may temporarily increase energy demand, whereas green infrastructure construction and innovation support policies may contribute to improvements in long-term technical efficiency and green total factor productivity. From 2021 to 2022, following the implementation of the Outline of the Plan for Ecological Protection and High-Quality Development of the Yellow River Basin, provinces within the basin entered a phase of coordinated and stable high-quality development under unified planning guidance, resulting in a steady rise in overall efficiency.
As shown in Figure 3b, green development efficiency in upstream resource-based cities exhibits a stage-wise upward trend, reflecting a transition from initial exploration toward structural optimization in the process of green transformation and high-quality development. During 2012–2017, the efficiency distribution was wide and multi-modal, indicating substantial inter-city disparities and the absence of a stable growth pattern. In 2018–2020, the distribution range narrowed, with efficiency values clearly concentrated in the 0.4–0.8 interval, suggesting progress among low-efficiency cities while the number of high-efficiency cities declined. With the clarification of the “dual-carbon” targets in 2021 and the implementation of the Outline of the Plan for Ecological Protection and High-Quality Development of the Yellow River Basin, the transformation process accelerated. During 2021–2022, the distribution further contracted and shifted to a higher range of 0.9–1.2, displaying a pronounced unimodal pattern, which indicates an overall improvement in efficiency and the emergence of a more balanced, high-efficiency green development structure in upstream cities.
As illustrated in Figure 3c, the midstream region’s green development efficiency evolved from a fluctuating drop to a stable improvement between 2012 and 2022. During 2012–2015, overall efficiency remained low, characterized by declining high values and stable low values. This phenomenon may be attributed to the early stage of urban development, during which cities faced trade-offs between environmental governance and economic growth, resulting in limited improvements in ecological performance. After 2016, with the comprehensive implementation of supply-side structural reform, major energy-producing provinces accelerated the elimination of outdated capacity and promoted industrial technological upgrading, while the 13th Five-Year Plan for Ecological and Environmental Protection strengthened pollution control and energy-saving management, jointly driving an overall rebound in efficiency. By 2021–2022, the efficiency distribution shifted further upward with a wider range, indicating continuous improvement in regional green development levels, while inter-city disparities became more pronounced.
As shown in Figure 3d, green development efficiency in downstream resource-based cities exhibits stage-wise fluctuations with an overall upward trend. During 2012–2015, efficiency values increased slightly. In 2015, efficiency declined in some cities and the distribution became more dispersed, indicating divergence in green development trajectories among cities. During 2016–2019, efficiency in downstream cities gradually improved and formed a bimodal pattern. This bimodal distribution reflects structural stratification in green development levels among downstream cities, whereby some cities achieved early green breakthroughs while others remained at the initial stage of transformation. Efficiency values increased gradually after 2020, demonstrating the long-term benefits of the national strategies as well as the progressive success of initiatives to create a circular economy and optimize energy structures in cities downstream.
3.1.2. Spatial Evolution
Using ArcGIS 10.8, a spatial visualization analysis was conducted on the green development efficiency across resource-based cities. The findings are presented in Figure 4. From 2012 to 2022, the overall green development level of the study area improved. Cities with high efficiency were relatively dispersed in spatial distribution, primarily concentrated in areas rich in energy resources and with substantial transformation investments. In contrast, cities with low efficiency exhibited a contiguous distribution pattern, mostly located in regions with relatively lagging economic development and a singular industrial structure.
Figure 4.
Spatial Distribution and Evolution Characteristics of Green Development Efficiency in Resource-Based Cities.
In 2012, the number of high-efficiency cities was limited, mainly including Ordos among a total of eight cities that performed relatively well in green transformation. Relatively high-efficiency cities included Baotou, Shizuishan, Puyang, and Tai’an. Medium-efficiency cities, including Pingliang and Tongchuan among six cities, formed an intermediate group and generally faced pronounced conflicts between resource exploitation and ecological protection, resulting in slower transformation. Lower-efficiency cities constituted the largest group and represented the majority of resource-based cities in the basin, indicating substantial room for overall improvement in green development. Low-efficiency cities, such as Longnan, Xinzhou, and Yuncheng, were constrained by weak economic foundations, unfavorable locational conditions, and highly single industrial structures, facing considerable challenges in green transformation.
By 2016, the structure of high-efficiency cities had undergone a notable adjustment. Cities such as Baotou and Shizuishan advanced into the high-efficiency category, while several mid- and upstream cities, including Pingliang and Puyang, experienced marked efficiency improvements, which may be closely associated with industrial structure optimization and intensified environmental governance. In contrast, cities such as Ordos and Datong, which ranked in the high-efficiency tier in 2012, declined in 2016 to the relatively high-efficiency range, reflecting the sensitivity of resource-based cities to fluctuations in resource prices and transformation policies. Meanwhile, some regions remained at mid- to low-efficiency levels, and the number of low-efficiency cities increased, indicating a worsening of intra-regional development imbalance.
In 2019, overall green development efficiency improved further. Cities in the highest-efficiency range included Shizuishan, Wuhai, Baoji, Tongchuan, Datong, Jiaozuo, Hebi, Puyang, Zibo, and Dongying, all of which achieved notable progress in industrial upgrading and environmental governance. The second-highest range comprised Qingyang, Xianyang, Yangquan, Luoyang, Tai’an, and Jining, where green technological innovation advanced alongside stable economic growth, although deeper transformation remained needed. Cities such as Wuwei, Baotou, Yulin, and Shuozhou fell into the medium-efficiency range, while a large number of cities remained in the lower-efficiency range, particularly in the midstream region, where transformation progressed slowly and internal disparities persisted.
By 2022, the number of cities in the highest-efficiency category declined again, leaving only representative cities such as Qingyang, Luoyang, Yangquan, and Zibo, which achieved significant green transformation through sustained industrial restructuring and environmental investment. Cities including Ordos, Shizuishan, Baoji, and Tongchuan shifted to the second-highest range, indicating a transition toward more stable green development. In contrast, cities in Shanxi Province and southern Shaanxi were largely concentrated in the lowest-efficiency range, forming a clear spatial clustering pattern that underscores the severe challenges facing regional coordinated transformation.
Overall, over the past decade, green development efficiency has evolved from pronounced polarization toward a pattern of overall improvement with localized lagging areas. This distribution not only reveals the gradient differences in green development levels but also reflects deeper disparities among cities in terms of resource endowments, development stages, and transformation capacity.
3.2. Migration of the Gravity Center and Directional Distribution of Green Development Efficiency
Figure 5 illustrates the evolution of the migration trajectory and spatial configuration of the gravity center of green development efficiency. From 2012 to 2022, the gravity center was located between 110.82–111.55° E and 36.78–37.09° N, moving consistently within Lvliang, Jinzhong, and Linfen in Shanxi Province and exhibiting an overall southwestward shift. Specifically, the center migrated from (111.49° E, 37.09° N) to (110.82° E, 36.80° N), with a cumulative displacement of 204.61 km. The migration shows clear stage-specific characteristics: a steady southwestward movement during 2012–2014, with annual shifts exceeding 20 km; a relatively stable phase during 2015–2017; renewed fluctuations during 2018–2021, peaking at 41.02 km in 2021, likely reflecting heterogeneous regional responses following the implementation of the national strategy; and a sharp contraction in 2022 to 7.38 km, indicating a transition toward a more stable green development pattern. The southwestward shift further suggests that upstream regions experienced faster efficiency improvements than downstream areas, consistent with gains driven by ecological protection and energy structure optimization.
Figure 5.
Centroid Migration Trajectory and Standard Deviational Ellipse of Green Development Efficiency: (a) Overall View of the Historical Standard Deviational Ellipses and Centroid Migration Trajectory; (b) Enlarged View of the Centroid Migration Trajectory; (c) Enlarged View of the Standard Deviational Ellipse.
According to the standard deviational ellipse analysis, the spatial extent exhibits a dynamic pattern of initial expansion followed by contraction. The major axis length expanded from 621.25 km in 2012 to 652.39 km in 2016, fluctuated thereafter, peaked at 654.81 km in 2020, and finally contracted to 630.59 km in 2022. The minor axis shows a fluctuating upward trend, increasing from 379.70 km to 396.72 km by 2016, contracting in 2018, and rebounding to 395.25 km in 2022. The azimuth angle adjusted from 94.90° to 90.17°, indicating a shift from a near east–west orientation toward a strict east–west alignment, which implies a relative strengthening of green development momentum in the eastern basin. The major-to-minor axis ratio remained above 1.5, confirming a persistent directional pattern, while the expansion of the minor axis suggests a gradual narrowing of regional disparities perpendicular to the dominant direction.
3.3. Spatial Differences and Decomposition of Green Development Efficiency
3.3.1. Spatial Differences from a Geographical Perspective
The Dagum Gini coefficient decomposition method was applied to analyze the dynamics and structure of efficiency spatial differentiation. Figure 6a shows that the overall Gini coefficient for green development efficiency exhibited a continuous decline, from 0.309 in 2012 to 0.169 in 2022. This suggests a gradual reduction in green development disparities among cities, leading to a more balanced outcome distribution. From 2012 to 2017, the coefficient declined gradually, suggesting policy effects were initially unfolding. After 2017, the decline accelerated, with a pronounced drop post-2020, reflecting heightened emphasis on green, low-carbon development at national and local levels. The implementation of policies on ecological restoration, industrial optimization, and energy control significantly promoted regionally balanced green development. This trend underscores the notable impact of green transition policies in advancing ecological civilization and coordinated regional development within the basin.
Figure 6.
Decomposition and Contribution Rates of Spatial Differences in Green Development Efficiency from a geographical Perspective. (a) Overall disparities; (b) intra-regional disparities; (c) inter-regional disparities; (d) contribution rates.
Figure 6b shows a general decline in intra-regional disparities of green development efficiency. The downstream region had the largest disparity, followed by the midstream region, with the upstream region being the most balanced. The upstream area showed the most notable convergence, due to shared ecological constraints and comparable industrial development stages, especially after 2017 when national policies such as farmland-to-forest conversion and mining-area restoration were implemented. The midstream region’s disparity narrowed steadily owing to its solid industrial base and coordinated policy execution. Although the downstream region’s disparity decreased slightly in later years, the change was limited, reflecting varied industrial diversification among its cities, with industrially advanced cities like Zibo and Dongyang transforming faster. By 2022, disparities in all three regions had decreased significantly from 2012 levels and tended to stabilize, indicating improved balance in green development efficiency within each region.
Figure 6c reveals a fluctuating decline in inter-regional disparities from 2012 to 2022, suggesting convergence in green development levels. The disparity between the midstream and downstream regions remained the most pronounced, reflecting fundamental differences in industrial structure and transformation pathways: downstream cities transformed faster thanks to industrial diversification and innovation, while midstream cities lagged due to dependence on traditional energy sectors. Disparities between the upstream and downstream regions generally declined, indicating that ecological compensation and regional cooperation policies helped coordinate development. Disparities between the upstream and midstream regions were the smallest and remained stable, consistent with their similar resource endowments and coordinated upgrading strategies.
Figure 6d reveals distinct structural characteristics in the sources of overall disparity in green development efficiency. In terms of contribution rates, inter-regional disparity has been the dominant factor (contributing 38–54%), except in 2012 and 2013, and its share increased notably in later years. This highlights the systemic development gaps among the upper, middle, and lower reaches due to policy orientation and industrial structure. Meanwhile, the contribution of transvariation density showed a fluctuating decline, falling from 39% initially to 15% by the end of the period, indicating that the complex disparities arising from overlapping distributions and cross-regional influences have diminished over time. The contribution of intra-regional disparity remained relatively stable, fluctuating between 27% and 35%. The shifting balance between inter-regional and transvariation density contributions has gradually established inter-regional disparity as the primary source of overall differentiation.
3.3.2. Spatial Differences from the Perspective of Urban Life Cycle
Based on urban life cycle theory, the overall differences in green development efficiency among the four types of resource-based cities, namely growing, mature, shrinking, and revitalizing cities, follow the same pattern as that observed in the previous section. Figure 7b shows that the internal disparities within each city type all exhibit fluctuating downward trends. The decline is most pronounced for Growing cities, closely linked to their early development stage and the gradual narrowing of gaps in policy response and transition initiation. Mature cities show a stable convergence trend, reflecting the alignment of development paths during their industrial upgrading. Although the internal disparity of Shrinking cities displays a declining trend, it experienced several fluctuations during the study period, particularly with rebounds in 2016 and 2019. This indicates differentiation among these resource-depleted cities due to varying foundational conditions and policy effectiveness during transition. The evolution of internal disparity in Revitalizing cities is unique, with a relatively small overall decline and an anomalous low in 2019, possibly related to the concentrated enforcement of stringent environmental regulations. This reflects that while maintaining their distinct development paths, these cities also preserve a relatively stable internal disparity structure.
Figure 7.
Decomposition and Contribution Rates of Green Development Efficiency from the Perspective of Urban Life Cycle Classification. (a) Overall disparities; (b) intra-regional disparities; (c) inter-regional disparities; (d) contribution rates.
Figure 7c shows a clear convergence trend in green development gaps between different city types, with disparity values for all type combinations declining fluctuatively. The convergence between Growing and Shrinking cities, as well as between Mature and Shrinking cities, is most pronounced, dropping sharply from 0.309 and 0.317 to 0.075 and 0.074, respectively. This indicates significant convergence in green transition among cities at different development stages. Meanwhile, disparities between Growing and Mature cities remained low and continued to narrow, reflecting high similarity in transition pathways among cities at similar development stages. Although disparities involving Revitalizing cities also declined overall, they were generally higher than other combinations, especially in 2022, when values for Growing-Revitalizing and Mature-Revitalizing remained high at 0.210 and 0.192, indicating persistent structural gaps between successfully revitalized cities and other types.
Figure 7d shows a notable structural evolution in the sources of green development efficiency disparities among different life-cycle types from 2012 to 2022. The contribution of inter-type disparity showed a continuous and significant increase, rising from 16% to 50% and becoming the primary source of overall difference. This highlights systematic divergence in green development paths due to varying transition foundations and development stages across city life-cycle groups. The contribution of transvariation density declined markedly from 52% to 17%, indicating that early complex influences from overlapping city types have diminished, while characteristics common to each type have become more pronounced. The contribution of intra-regional disparity remained relatively stable, suggesting that although regions faced transformation pressures, policy interventions helped maintain relatively balanced development internally.
3.4. Influencing Factors of Green Development Efficiency
Previous studies have shown that regional green development efficiency is primarily driven by human socio-economic activities [56]. Drawing on existing research [57,58] and considering the conditions of the basin, the factors listed in Table 3 were selected as measurement indicators.
Table 3.
Selection and Definition of Influencing Factors.
Economic development level is a fundamental variable influencing green development efficiency. According to the Environmental Kuznets Curve (EKC) theory, as GDP per capita increases, regions become more capable of allocating resources to pollution control and green innovation, thereby supporting green transformation. Openness to the outside world may promote cleaner production through technological spillover effects, but it may also increase environmental pressure by attracting pollution-intensive industries. Including this variable in the model helps examine its overall impact. Science and technology investment, along with technological progress, can improve resource utilization efficiency and reduce pollutant emissions, representing a key pathway for resource-based cities to achieve green substitution. Population agglomeration can generate economies of scale and knowledge spillovers; however, excessive concentration may intensify environmental pressure, thus exerting a dual effect on green development efficiency. The advancement of industrial structure reflects the degree of economic transformation. An increased share of the service sector generally implies lower energy intensity and reduced pollution, thereby capturing the role of industrial upgrading in promoting green development. Moderate government intervention can strengthen environmental regulation, whereas excessive intervention may lead to resource misallocation. Including the degree of government intervention in the model helps examine the influence of institutional factors. Education expenditure represents the level of human capital accumulation. A highly skilled labor force facilitates the application of green technologies, thus improving green development efficiency. A well-developed financial system can offer funding for green technological innovation and thus constitutes an important institutional determinant of green development. Energy consumption intensity reflects the level of energy use per unit of output; higher values indicate greater energy consumption and lower resource utilization efficiency, capturing the quality of economic growth under resource constraints.
3.4.1. Individual Factor Effects
As can be seen from Figure 8, the effects of the explanatory variables on green development efficiency vary markedly across periods. X1 shows strong explanatory power in the early stage; although its influence declines over time, it remains relatively high in 2022, indicating that the economic foundation still underpins green development. The diminishing marginal effect of economic growth suggests a shift from “increment-driven” to “quality-driven” development. The impact of X2 remains high in 2016 and 2022, implying that improvements in the quality of openness facilitate green transformation under high-quality development. The effect of X3 increases substantially, consistent with the intensified implementation of China’s innovation-driven development strategy since 2016 and sustained growth in R&D investment. X4 fluctuates and is weak in most years except 2016, reflecting the complex trade-off between population agglomeration and resource–environment carrying capacity. After reaching a trough in 2019, the influence of X5 rebounds in 2022, indicating the stage-specific nature of industrial restructuring and aligning with accelerated upgrading following the national strategy. X6 is particularly prominent in 2016 and 2022, suggesting that shaping an institutional environment for green development through public services, ecological governance spending, green infrastructure, and industrial guidance funds has made fiscal support a new leading factor. X7 declines after a relatively high level in 2012 but rises again in 2022, reflecting adjustments in fiscal inputs and the longer-term contribution of education and human capital. X8 stays high early on, drops sharply in 2019, and rebounds in 2022, indicating fluctuations in the availability of green investment enabled by financial support. X9 has a strong early effect but weakens after 2016, suggesting that energy structure optimization, energy-saving technologies, and cuts in energy-intensive capacity have achieved phased results. This implies that improvements in green efficiency no longer rely primarily on conventional energy-consumption control, but are increasingly driven by deeper forces such as technological innovation, industrial upgrading, and institutional arrangements. Overall, green development in these cities has moved from an initial factor-driven stage toward a new phase characterized by innovation-led growth and coordinated structural optimization.
Figure 8.
Single-Factor Impact Values on the Green Development Efficiency.
3.4.2. Interactive Factor Effects
The interaction detection results in Figure 9 show that the interaction values between factors are consistently higher than their individual effects, with all pairwise interactions exhibiting bivariate or nonlinear enhancement. This indicates that green development efficiency resulted from the combined effect of multiple factors.
Figure 9.
Interactive Factor Impact Values on the Green Development Efficiency.
In 2012, the highest interaction value was observed between X1 and X5, highlighting the key role of the interplay between economic growth and industrial restructuring in improving green development efficiency. The interaction value between X2 and X3 was 0.72, indicating that the combination of an open economy and technological innovation effectively facilitated the introduction and application of green technologies, reflecting policy outcomes in promoting cleaner production and energy-saving industries. Meanwhile, the interaction between X5 and X9 was also enhanced, suggesting a certain spatial matching relationship between industrial structure and energy consumption. The interaction value between X3 and X7 was 0.72, showing a positive interplay between innovation capacity and human capital accumulation. Under the guidance of the national 12th Five-Year Plan for Scientific and Technological Innovation, this interaction provided important support for the development of cities.
By 2016, the interaction structure underwent notable adjustments. The dominance of X1 declined, while interactions involving X5 with X2, X3, and X8 remained strong. Notably, interactions between X8 and X5 or X3 strengthened significantly, indicating that China’s supply-side structural reforms, enhanced energy conservation and emission reduction efforts, and industrial technological upgrades increased the role of industrial restructuring, technological investment, and technology imports through openness in green development. Coinciding with the launch of China’s 13th Five-Year Plan (2016–2020) and the new development philosophy, elevated openness facilitated knowledge and technology flows, while increased education expenditure further enhanced technology absorption and innovation capacity, creating dual drivers for green development.
In 2019, the interactions among influencing factors were generally complex, with interaction detection values mostly lower than in 2016, indicating a weakening of synergistic effects and a gradual shift in dominant drivers toward structural optimization and technological innovation. Overall, factors such as X5, X4, and X9 stood out in the interaction analysis, suggesting that industrial upgrading, urban agglomeration effects, and energy utilization efficiency remained key to promoting green development. The interaction value between X5 and X4 was 0.55, showing a positive interplay between industrial upgrading and urban agglomeration. As regional economic restructuring deepened in the later phase, the service sector and green industries became important pathways for the transformation of cities, while population agglomeration provided both consumer markets and labor support for tertiary industries, thereby positively contributing to green efficiency improvement. The interaction value between X3 and X9 reached 0.59, indicating that the combination of technological innovation and energy efficiency played a significant role in driving green development.
Compared with 2019, interactions were significantly stronger in 2022. High interaction values were observed between X1 and X6, X5 and X6, and X3 and X6, suggesting that fiscal investment played a central role in promoting regional economic restructuring and green transformation. At the same time, strong interactions were found between X3 and X5, X4 and X3, among others, indicating that with the deepening of the innovation-driven strategy and coordinated urban agglomeration development, the coupling effect between technology diffusion and population agglomeration became more pronounced. Moreover, the relatively high interaction values between X9 and X1 as well as X6 reflected a tighter link between economic growth and energy efficiency, signaling that green and low-carbon transition entered a substantive implementation phase. This shift may be attributed to the national clarification of the “dual carbon” goals and the introduction of a series of policy documents after 2020, which increased green fiscal investment and industrial restructuring efforts, thereby fostering multidimensional linkages among fiscal policy, technology, and industry.
4. Discussion
The Yellow River Basin, as a major cradle of Chinese civilization and a key energy–economic corridor, hosts a large concentration of resource-based cities. Long reliant on natural resources, these cities have followed an extensive development model and now face the dual challenges of environmental degradation and slowing economic growth. In the context of achieving the “dual-carbon” goals, promoting green transformation in resource-based cities of the Yellow River Basin is not only an inherent requirement of the national strategy for “Ecological Protection and High-quality Development of the Yellow River Basin” but also an inevitable path toward regional sustainability.
The measurement of green development efficiency has been widely applied at different regional scales. For example, studies on the Yangtze River Economic Belt have employed the Super-SBM model combined with the Malmquist–Luenberger index to conduct dynamic decomposition analyses of regional green total factor productivity [14]. Research on Northeast China has also explored the spatio-temporal evolution of green efficiency based on the SBM or GML framework [59]. In the context of resource-based cities in the Yellow River Basin, some scholars have measured efficiency levels and decomposed their sources using the SBM-GML model [60]. At the level of industrial parks or national high-tech zones, several studies have applied the super-efficiency SBM-DEA model to identify differences in the structure of inputs, desirable outputs, and undesirable outputs [61]. These studies provide useful methodological references for measuring green efficiency across different spatial scales.
Building upon these mainstream efficiency measurement and dynamic decomposition approaches, this study further integrates the centroid–standard deviational ellipse, Dagum Gini decomposition, and geographical detector models to establish a systematic linkage between efficiency measurement and mechanism identification. Under conditions of data availability, this analytical framework is not only applicable to resource-based cities in the Yellow River Basin but can also be extended to other river basins or groups of resource-based cities for structural comparative studies, thereby enhancing the external interpretability of the results and the transferability of the methodology.
4.1. Comparison of Basin-Wide Efficiency Patterns and Efficiency Characteristics by City Type
This section further conducts a comparative analysis from two dimensions: the overall spatial structure of the basin and the urban life cycle. As shown in Figure 10a, from 2012 to 2022, green development efficiency across different regions of the basin, as well as the basin overall, exhibits a general upward trend, though with pronounced regional disparities. The upper reaches record the largest growth but experience a mid-period decline, during which relatively weak mechanisms of inter-city green coordination constrained the scale effects of optimized resource allocation and joint pollution control. From 2019 to 2022, efficiency rises rapidly, indicating that the national strategy has significantly promoted ecological restoration, water conservation, pollution control, and efficient resource utilization in the upper reaches. The middle reaches remain consistently below the upper and lower reaches, reflecting the path dependence of energy-intensive industries, which makes it difficult to achieve green upgrading in the short term. In contrast, the lower reaches maintain a relatively high and stable efficiency level with steady growth. Supported by a stronger economic base, higher technological capacity, and greater investment in environmental governance, green transformation in the lower reaches has progressed more smoothly, sustaining a leading position. At the basin level, overall efficiency increases steadily in the early stage and accelerates in the later period, reflecting cumulative policy-driven effects under the strengthened national environmental protection policies. Overall, regional efficiency disparities stem not only from differences in resource endowments and development stages, but also from spatially uneven policy implementation and industrial transformation.
Figure 10.
Green development efficiency by geographical location and urban life cycle. (a) Comparison of spatial structures within the basin; (b) Comparison of urban life cycle types.
Traditional research on resource-based cities emphasizes that resource dependence leads to specialized economic structures and difficult transformation, and argues that transformation capacity and pathways vary across life cycle stages [62]. As shown in Figure 10b, all four types exhibit a general upward trend in green development efficiency, but with clear stage-specific differences and alternating leadership. Growing cities show larger fluctuations but accelerated growth in the later period, indicating that these cities possess stronger flexibility in structural optimization and the adoption of clean technologies. Mature cities fluctuate slightly yet remain broadly stable during the study period, suggesting that industrial inertia and the cost of technological retrofitting require long-term institutional innovation and sustained technological investment. Declining cities follow a fluctuating upward path, shifting from “decline” to “recovery” through measures such as structural capacity reduction and ecological restoration of mining areas. Regenerative cities record the highest efficiency levels and the most pronounced improvement, but experience a sharp drop in 2018, likely because the deepening of supply-side structural reform around that time accelerated the phase-out of outdated industries in many resource-based cities, temporarily contracting output and reducing overall efficiency in the short term. In the later period of the study, regenerative cities recovered rapidly and resumed growth.
Overall, this study finds that growing and regenerative cities achieved rapid efficiency gains through emerging-industry cultivation and governance innovation; mature cities improved more steadily but faced limited room for further gains under structural inertia; and declining cities moved from low to higher efficiency under policy impetus and ecological restoration. This differentiated pattern highlights the dynamic interplay among national policy orientation, stages of economic transition, and the urban development cycle, and reveals spatio-temporal heterogeneity in policy transmission effects.
4.2. Dynamic Decomposition of Green Development Efficiency Based on the Malmquist–Luenberger Index
The Super-SBM model is suitable for static measurement of green development efficiency but cannot capture intertemporal dynamics. The Malmquist–Luenberger productivity index reflects dynamic changes in green total factor productivity (GML) and decomposes GML into efficiency change (EC) and technological change (TC) [63]. The EC index mainly captures the effects of policies and institutional reforms on allocative efficiency, while TC reflects shifts in the green technology frontier driven by innovation and the adoption of advanced green technologies. Formulae follow the cited literature [64]. Kernel density estimation is used to visualize the dynamic distributions of GML, EC, and TC.
Figure 11 presents kernel density curves of green development efficiency for 2013–2022. In the early period, distributions concentrate at low values, with the center gradually shifting rightward, indicating overall improvement. From 2013–2015, the curves are relatively steep, implying limited inter-city disparity. During 2016–2019, peaks increase and extend toward higher efficiency, especially after 2018, when routine environmental inspections and targeted actions such as the “Blue Sky Defense” constrained energy-intensive industries. By 2022, most observations cluster in the 1.0–1.8 range, showing efficiency gains via technological progress and industrial restructuring. The rightward extension of the tail indicates a growing number of high-efficiency cities and stronger diffusion of green production modes, becoming more pronounced after 2020 in line with the dual-carbon targets and wider deployment of green and low-carbon technologies. All years exhibit a unimodal distribution, suggesting a relatively coordinated evolution of green development efficiency across the basin.
Figure 11.
Dynamic evolution of the GML index.
Based on the ML index decomposition shown in Figure 12, green development efficiency exhibits a steady upward trend during 2013–2022. Efficiency growth is jointly driven by EC and TC, though with distinct mechanisms and stage-specific features. In the early period, both EC and TC are relatively low with limited dispersion, indicating that most cities were still at an initial stage of green transition. During 2016–2019, EC improves most markedly, suggesting that supply-side structural reform, environmental inspections, and the exit of outdated capacity enhanced factor-use efficiency and promoted stock efficiency gains. Over the same period, TC shifts rightward, reflecting early progress in green innovation and cleaner production upgrades. After 2020, TC clearly becomes the dominant source of efficiency growth; the lengthening right tail indicates technological breakthroughs in areas such as energy-saving and environmental protection equipment, marking a shift from regulation-driven to innovation-driven green development.
Figure 12.
Decomposition of the GML index into EC and TC.
Consistent with the literature [65,66] emphasizing innovation as a long-term driver of green transition in resource-based cities, the TC results here confirm the central role of technological progress. Meanwhile, the rapid improvement in EC also supports findings that environmental regulation and structural adjustment can raise production efficiency. However, the widening dispersion in TC reveals uneven diffusion of green technologies across cities. From a policy perspective, the GML decomposition yields clear implications: improving EC requires sustained pressure through stringent environmental regulation and energy-efficiency standards to compress high-energy, low-efficiency activities; enhancing TC calls for stronger innovation investment, green finance, and regional collaborative innovation platforms. Given the emerging first-mover advantages in some cities, basin-wide technology-sharing mechanisms should be established to narrow technological gaps. As TC has become the primary driver in recent years, future policy should shift from governance pressure alone toward innovation incentives, green value-chain development, and the construction of a sustainable technological ecosystem.
4.3. Dynamic Evolution and Implications of Gravity-Center Migration and Ellipse Morphology
The gradual southwestward shift in the spatial gravity center indicates that improvements in green development efficiency have been faster in upstream areas than in midstream and downstream cities. This finding aligns with studies [67] suggesting that green efficiency gains in central and western regions exceed those in the east. The continuous southwestward movement observed here implies that geographical location is not the dominant determinant of green efficiency; rather, policy intensity, ecological functional positioning, and stages of resource development play more decisive roles in spatial evolution. This provides a complementary perspective to traditional regional gradient development theories.
The migration of the gravity center also carries important practical implications. On the one hand, it suggests that a new spatial structure of green development is gradually emerging within the basin. On the other hand, the midstream region, which previously exhibited pronounced fluctuations in the gravity center, should accelerate technological upgrading to narrow the gap with upstream and downstream areas.
The standard deviational ellipse analysis further reveals the spatial distribution pattern of green development efficiency. Toward the end of the study period, the contraction of the major axis and the gradual expansion of the minor axis indicate that regional disparities perpendicular to the main direction are gradually narrowing, further confirming enhanced overall coordination in green development efficiency. It should be noted, however, that while gravity-center and ellipse methods effectively capture overall trends, they cannot reveal specific inter-city interactions or technological spillover pathways.
4.4. Structural Decomposition of Green Development Disparities and Regional Coordination Pathways
From both the regional and urban life-cycle perspectives, the continuous decline in the transvariation intensity contribution indicates that early cross-regional overlap has gradually weakened as region-specific, classification-guided development paths have become clearer, with city development patterns increasingly reflecting their regional attributes. The relative stability of the within-region contribution reflects the effectiveness of basin-wide coordinated development policies in promoting regionally differentiated development, while also highlighting the importance of further enhancing intra-regional balance as a policy focus for achieving overall green coordination within the basin. At the same time, the gradual expansion of between-region disparities suggests that future efforts to promote coordinated green development among resource-based cities should place greater emphasis on addressing deeper institutional and systemic constraints that hinder regional coordination. Strengthening basin-wide planning and interregional linkage will therefore be essential for improving overall green development efficiency.
4.5. Stage Transitions of Dominant Drivers and Multi-Factor Synergistic Dynamics
Based on geographical detector results, the impacts of driving factors reveal a transition from economic-base dominance to innovation investment and fiscal support dominance. This finding aligns closely with innovation-driven transition theory, while existing studies [68] also emphasize that innovation investment and fiscal support are key drivers for greening traditional industries and improving efficiency. Interaction detection further shows that the explanatory power of two-factor interactions is generally higher than that of single-factor effects, and most interactions exhibit “two-factor enhancement” or “nonlinear enhancement.” This indicates that green development efficiency is not a linear function of a single variable but rather the result of multiple factors acting jointly in a coupled system. In other words, improvements in green development efficiency require the coordinated matching of economic conditions, technological capability, industrial foundations, and institutional inputs.
From the perspective of stage evolution, around 2012 the improvement in green efficiency relied mainly on governance capacity provided by the economic base and the emission-reduction space released by industrial structural adjustment, whose synergy produced initial efficiency gains. Around 2016, interactions among industrial structure, innovation investment, and financial development intensified, suggesting that during the process of supply-side structural reform and technological upgrading, industrial transformation needed to be supported by innovation investment and financial resources to generate more significant efficiency improvements. After 2019, the interactions between innovation investment and energy efficiency, as well as between industrial structure and population agglomeration, became more prominent, indicating that technological progress promoted green efficiency by reducing energy consumption per unit of output and optimizing resource allocation. By 2022, the interactions between fiscal expenditure and economic foundations, technological investment, and industrial structure were significantly strengthened. This suggests that under the “dual-carbon” targets and the high-quality development strategy, fiscal support has become an important institutional lever for promoting innovation diffusion and structural upgrading.
Therefore, the q-statistic not only reveals the transformation path of resource-based cities from factor-driven to innovation-driven development and from extensive growth to structural optimization, but also highlights the amplification effects of different factors under synergistic interactions. This implies that regional policy design should shift from a single-instrument orientation toward coordinated multi-factor allocation. Only by dynamically adjusting policy combinations according to changes in dominant interaction structures can the continuous enhancement of efficiency and the reduction in regional disparities be achieved.
4.6. Policy Implications and Future Outlook
Based on the preceding systematic analysis of the measurement, dynamics, spatial evolution, and determinants of green development efficiency, it is evident that green transition trajectories differ markedly across regions. Accordingly, policy design should be grounded in these regional heterogeneities.
- (1)
- Although green development efficiency in upstream cities accelerated significantly in the later stage of the study period, the contribution of technological progress (TC) remained relatively unstable, indicating that efficiency improvements still partly rely on factor optimization and strengthened governance, while the foundation of innovation-driven development needs further consolidation. Therefore, policy priorities in upstream cities should gradually shift from solely increasing ecological governance investment toward the sustained cultivation of innovation capacity. Efforts should focus on improving the linkage between R&D investment and industrial application in areas such as clean energy utilization, energy-saving and environmental protection technologies, and ecological restoration projects. Meanwhile, as the explanatory role of fiscal expenditure strengthened in the later period, a higher proportion of fiscal resources should be directed toward green technological upgrading and low-carbon infrastructure, enabling fiscal investment to better leverage technological advancement and industrial substitution.
- (2)
- Midstream cities have long maintained relatively low levels of green development efficiency and their transformation has progressed slowly, making them a major constraint on basin-wide green development. ML decomposition indicates that improvements in EC constitute the primary source of efficiency gains. Therefore, policy priorities in the midstream region should focus on improving the efficiency of existing industries and promoting structural optimization. For energy-intensive and high-emission sectors, process upgrading, equipment renewal, and digitalized management should be adopted to enhance output efficiency while gradually reducing energy intensity. Given that fiscal expenditure shows strong explanatory power in the later period and exhibits enhanced interactions with industrial upgrading and technological investment, midstream cities should advance industrial upgrading and technological investment simultaneously. This can be achieved through measures such as establishing special funds for green transition, implementing fiscal interest subsidies and incentive-based subsidies, and introducing performance-based constraints, thereby promoting the coordinated advancement of efficiency improvement and structural upgrading.
- (3)
- In contrast, downstream cities maintain relatively high levels of green development efficiency, with technological progress making a more prominent contribution to efficiency improvement, indicating their potential to form a regional frontier of green technology as well as sources of institutional demonstration. Therefore, policy priorities in downstream regions should not be limited to further improving regional efficiency, but should also emphasize their roles in technological diffusion and institutional demonstration. By promoting the diffusion of advanced technologies, management experience, and coordinated industrial chains to upstream and midstream areas, downstream cities can help alleviate the widening of interregional disparities. Given that both financial development and fiscal support show significant explanatory power, downstream cities can further utilize green financial instruments to support cross-regional green projects and facilitate the rational flow of innovation resources within the basin. By acting as technological frontiers and coordination hubs, downstream regions can maintain their efficiency advantages while simultaneously driving improvements in the overall level of green development across the basin.
First, the sample only covers 34 resource-based cities in the Yellow River Basin over the period 2012–2022, which may limit the applicability of the findings to other basins or non-resource-based cities, and the relatively short time series may make it difficult to fully identify long-term trends. Second, the measurement of green development efficiency depends on the selection of indicators. Due to data constraints, several indicators reflecting green innovation and governance quality, such as firm-level pollution-control investment, patent quality, and carbon intensity, were not included, which may introduce measurement error. In addition, without adopting causal identification strategies such as exogenous shocks, instrumental variables, or quasi-experimental designs, it is difficult to completely rule out potential biases arising from reverse causality and omitted variables. Moreover, the results of the geographical detector may be influenced to some extent by the discretization of variables, the number of strata, and the treatment of extreme values. Future research should broaden the sample scope and prolong the observation period to test the generalizability of the findings; incorporate micro-level or high-frequency data to more accurately capture innovation quality and governance inputs; combine alternative grouping schemes with spatial econometric or quasi-experimental methods to improve robustness and causal identification; and introduce institutional variables such as local governance capacity and public participation to further refine the analytical framework for green transition dynamics.
5. Conclusions
Using a sample of 34 resource-based cities in the Yellow River Basin, this study systematically examines the spatio-temporal evolution of green development efficiency from 2012 to 2022, reveals heterogeneity in green transition across different geographical locations and life cycle stages, and identifies key drivers of efficiency disparities. The main findings are as follows:
- (1)
- Green development efficiency shows an overall upward trend. Improvements are most pronounced in upstream cities, relatively slower in midstream cities, while downstream cities maintain consistently higher levels. The distribution evolves from low-value concentration toward overall improvement, with a clear rightward shift. Combined with Malmquist–Luenberger index decomposition, dynamic changes are jointly driven by efficiency improvement and technological progress, with technological change becoming the dominant driver in the later period.
- (2)
- Gravity-center migration indicates a shift in green development efficiency from northeast to southwest, reflecting notable progress in ecological governance and green industry development in upstream areas. Standard deviational ellipse results show a gradual stabilization of the spatial distribution and a trend toward greater balance. Spatial disparities exhibit a converging tendency, with between-region differences constituting the main source of overall disparity, while intra-region imbalances persist to some extent.
- (3)
- Economic development level, technological investment, fiscal expenditure, and energy intensity are the primary drivers of green development efficiency. The influence of technological investment and fiscal support strengthens over time, whereas the explanatory power of economic development and energy intensity declines. Significant interaction effects exist among factors, indicating that multi-factor synergy is a critical pathway for enhancing green development efficiency.
Author Contributions
All authors participated in the conception and design of the study. Material preparation, data collection, and data analysis were carried out by X.H., J.D. and Y.G. The initial draft of the manuscript was prepared by F.L. and X.X. and all authors reviewed and provided comments on earlier versions of the manuscript. The authors confirm that due diligence has been exercised to ensure the integrity of the research, and that this manuscript has not been published or submitted for publication elsewhere. All authors have read and agreed to the published version of the manuscript.
Funding
The authors declare that no funds, grants, or other support were received during the preparation of this manuscript.
Institutional Review Board Statement
Not applicable.
Informed Consent Statement
Not applicable.
Data Availability Statement
The dataset is available on request from the authors.
Conflicts of Interest
Author Yunzheng Gong was employed by the company State Grid Corporation of China. The remaining authors declare that the research was conducted in the absence of any commercial or financial relationships that could be construed as a potential conflict of interest.
References
- Makower, J.; Pike, C. Strategies for the Green Economy: Opportunities and Challenges in the New World of Business; McGraw Hill Professional: New York, NY, USA, 2008. [Google Scholar]
- Li, H. Systematic identification and prospect of eco-environmental issues in the Yellow River Basin. Res. Environ. Sci. 2024, 37, 1–10. [Google Scholar] [CrossRef]
- Fan, F.; Zhang, X. Transformation effect of resource-based cities based on PSM-DID model: An empirical analysis from China. Environ. Impact Assess. Rev. 2021, 91, 106648. [Google Scholar] [CrossRef] [Scilit]
- Gong, W.; Wang, C.; Men, D.; Zhang, M.; Xu, A. The Synergistic Evolution Characteristics and Influencing Factors of Tourism Economy and Urban Green Development Efficiency in the Yellow River Basin. Sustainability 2024, 16, 8519. [Google Scholar] [CrossRef] [Scilit]
- The State Council of the People’s Republic of China. Outline of the Plan for Ecological Conservation and High-Quality Development of the Yellow River Basin. People’s Daily, 9 October 2021; p. 001. [CrossRef]
- Li, Q.; Zeng, F.; Liu, S.; Yang, M.; Xu, F. The effects of China’s sustainable development policy for resource-based cities on local industrial transformation. Resour. Policy 2021, 71, 101940. [Google Scholar] [CrossRef] [Scilit]
- Zhang, S.Y.; Wang, Q.X.; Yuan, J.X.; Wang, J.W. Spatiotemporal Differentiation Characteristics of the Coupling between Resilience Level and Green Development Efficiency in Resource-based Cities. J. Zhejiang Univ. (Sci. Ed.) 2024, 51, 753–768. [Google Scholar] [CrossRef]
- Dou, R.Y.; Jiao, B.B.; Zhang, W.J.; Zhang, P.F. Spatiotemporal Differentiation and Driving Forces of Green Development Efficiency in Western Resource-based Cities. J. Nat. Resour. 2023, 38, 238–254. [Google Scholar] [CrossRef] [Scilit]
- Pearce, D.; Markandya, A.; Barbier, E.B. Blueprint for a Green Economy: A Report; Earthscan Publications Ltd.: London, UK, 1989. [Google Scholar]
- Hayter, R.; Nieweler, S. The local planning-economic development nexus in transitioning resource-industry towns: Reflections (mainly) from British Columbia. J. Rural Stud. 2018, 60, 82–92. [Google Scholar] [CrossRef] [Scilit]
- Louw, H.; Marais, L. Mining and municipal finance in Kathu, an open mining town in South Africa. Extr. Ind. Soc.-Int. J. 2018, 5, 278–283. [Google Scholar] [CrossRef] [Scilit]
- United Nations Development Programme (UNDP). Human Development Report 2002: Deepening Democracy in a Fragmented World; UNDP: New York, NY, USA, 2002. [Google Scholar] [CrossRef] [Scilit]
- Liu, H.J.; Wu, Q.M. The path of green development in China during the first decade of the new era. China Popul. Resour. Environ. 2024, 34, 102–111. [Google Scholar] [CrossRef]
- Peng, S.; Yu, Y. Green development efficiency measurement and influencing factors analysis in the Yangtze River economic Belt, China. Ecol. Indic. 2024, 162, 112025. [Google Scholar] [CrossRef] [Scilit]
- Chen, Y.; Mei, L. Coordinated evolution of society-economy-environment in the transformation of resource-based cities in Northeast China. Geogr. Res. 2018, 37, 307–318. [Google Scholar] [CrossRef]
- Guo, B.; Hu, P.; Zhang, H.; Weng, X.; Hu, F. The improvement of energy-consuming right trading policy on the efficiency of urban green development. Front. Environ. Sci. 2023, 11, 1123608. [Google Scholar] [CrossRef] [Scilit]
- Yu, Y.; Xu, Z.; Shen, P.; Zhang, L.; Ni, T. Efficiency Evaluation and Influencing Factors of Green Innovation in Chinese Resource-Based Cities: Based on SBM-Undesirable and Spatial Durbin Model. Int. J. Environ. Res. Public Health 2022, 19, 13772. [Google Scholar] [CrossRef] [Scilit]
- Yang, G.; Cheng, S.; Gui, Q.; Chen, X. The Coupling and Coordination Characteristics and Influencing Factors of Green Innovation Efficiency (GIE) and Economic Development Levels in China. Sustainability 2022, 14, 14085. [Google Scholar] [CrossRef] [Scilit]
- Sun, F.H.; Guo, J.; Huang, X.; Shang, Z.; Jin, B. Spatio-temporal characteristics and coupling coordination relationship between industrial green water efficiency and science and technology innovation: A case study in China. Ecol. Indic. 2024, 159, 111651. [Google Scholar] [CrossRef] [Scilit]
- Ma, X.W.; Li, C.; Li, Q.; Sun, Q. Toward urban agglomerations’ sustainable development: Impact of economic agglomeration on green economic efficiency. Econ. Anal. Policy 2025, 87, 1342–1360. [Google Scholar] [CrossRef] [Scilit]
- Li, Z.C.; Song, Z.Y. Green finance reform and innovation pilot zones: A catalyst for green development efficiency in Chinese cities. J. Clean. Prod. 2025, 525, 146576. [Google Scholar] [CrossRef] [Scilit]
- Ejeta, T.T.; Bai, X. Does the adoption of agricultural green production technologies improve eco-efficiency? Evidence from wheat farmers in Ethiopia. Agric. Syst. 2025, 231, 104517. [Google Scholar] [CrossRef] [Scilit]
- Shi, Y.M.; CShao, F.; Zhang, Z.Y. Efficiency and Driving Factors of Green Development of Tourist Cities Based on Ecological Footprint. Sustainability 2020, 12, 8589. [Google Scholar] [CrossRef] [Scilit]
- Zhou, Q. The impact and mechanism of the digital economy on the green development of manufacturing industry. Soc. Sci. Nanjing 2023, 11, 67–78. [Google Scholar] [CrossRef]
- Yu, X. An assessment of the green development efficiency of industrial parks in China: Based on non-desired output and non-radial DEA model. Struct. Change Econ. Dyn. 2023, 66, 81–88. [Google Scholar] [CrossRef] [Scilit]
- Zhou, Y.; Li, G.; Zhou, S.; Hu, D.; Zhang, S.; Kong, L. Spatio-temporal differences and convergence analysis of green development efficiency of marine economy in China. Ocean Coast. Manag. 2023, 238, 106560. [Google Scholar] [CrossRef] [Scilit]
- Yu, Y.B.; Yi, Z.H.; Jia, J.H. The Efficiency Evolution and Risks of Green Development in the Yangtze River Economic Belt, China. Sustainability 2022, 14, 10417. [Google Scholar] [CrossRef] [Scilit]
- Gu, R.; Li, C.; Yang, Y.; Zhang, J. The impact of industrial digital transformation on green development efficiency considering the threshold effect of regional collaborative innovation: Evidence from the Beijing-Tianjin-Hebei urban agglomeration in China. J. Clean. Prod. 2023, 420, 138145. [Google Scholar] [CrossRef] [Scilit]
- Zhang, C.Q.; Wang, Z.X. Analysis of spatiotemporal difference and driving factors of green total factor energy efficiency in RCEP members: Insights from SBM-GML and Tobit models. Environ. Sci. Pollut. Res. 2023, 30, 15623–15640. [Google Scholar] [CrossRef] [Scilit]
- Zhe, C.H.; Han, Y. Spatio-temporal differentiation and spatial driving forces of green development efficiency in the Yellow River Basin. Stat. Decis. 2022, 38, 87–92. [Google Scholar] [CrossRef]
- Zou, W.; Yang, Y.; Yang, M.; Zhang, X.; Lai, S.; Chen, H. Analyzing efficiency measurement and influencing factors of China’s marine green economy: Based on a two-stage network DEA model. Front. Mar. Sci. 2023, 10, 1020373. [Google Scholar] [CrossRef] [Scilit]
- Qian, J.Z. Study on the Spatio-Temporal Differentiation Characteristics and Influencing Factors of Green Development Efficiency in the Yellow River Basin; Anhui University of Finance and Economics: Bengbu, China, 2021. [Google Scholar] [CrossRef]
- Yu, H.Y.; Wang, J.; Xu, J.; Ding, B. Does digital economy agglomeration promote green economy efficiency? A spatial spillover and spatial heterogeneity perspective. Environ. Dev. Sustain. 2025, 27, 7379–7406. [Google Scholar] [CrossRef] [Scilit]
- Liu, P.X.; Zhong, F.L.; Han, N. Efficiency and equity: Effect of urban agglomerations’ spatial structure on green development efficiency in China. Sustain. Cities Soc. 2024, 108, 105504. [Google Scholar] [CrossRef] [Scilit]
- Li, X.Z.; Han, L.; Yang, L.; Zhang, T. Green Development Efficiency and Spatial Characteristics of Urban Clusters: A Case of Yangtze River Delta City Cluster. Emerg. Mark. Financ. Trade 2023, 59, 1993–2007. [Google Scholar] [CrossRef] [Scilit]
- Yang, T.; Zhou, K.L.; Zhang, C. Spatiotemporal patterns and influencing factors of green development efficiency in China’s urban agglomerations. Sustain. Cities Soc. 2022, 85, 104069. [Google Scholar] [CrossRef] [Scilit]
- Li, Q.C.; Zhang, P.; Chen, J.H. Does energy transformation improve green development efficiency? Evidence from Sichuan Province, China. Energy Rep. 2024, 12, 861–871. [Google Scholar] [CrossRef] [Scilit]
- Liu, L.; Yang, Y.; Liu, S.; Gong, X.; Zhao, Y.; Jin, R.; Duan, H.; Jiang, P. A comparative study of green growth efficiency in Yangtze River Economic Belt and Yellow River Basin between 2010 and 2020. Ecol. Indic. 2023, 150, 110214. [Google Scholar] [CrossRef] [Scilit]
- Shi, P.F.; Wang, M.J.; Zhang, H.H.; Li, Y.; Li, X.M. Differentiation characteristics of urban green development efficiency and the driving effect of digital economy in the Yellow River Basin. Econ. Geogr. 2025, 45, 85–94. [Google Scholar] [CrossRef]
- Li, J.; Gao, R.Z.; Wang, X.Q.; Liu, T.Q. Spatio-temporal differentiation and influencing mechanism of green development efficiency in resource-based cities in the Yangtze River Economic Belt. Resour. Environ. Yangtze Basin 2025, 34, 1193–1207. [Google Scholar] [CrossRef]
- Kuang, W.H.; Yang, T.R.; Yan, F.Q. Examining urban land-cover characteristics and ecological regulation during the construction of Xiong’an New District, Hebei Province, China. J. Geogr. Sci. 2018, 28, 109–123. [Google Scholar] [CrossRef] [Scilit]
- Zhao, J.G.; Yu, S.Q.; Li, A.R. Analysis of the Impact of the Digital Economy on Industrial Structure Upgrading in the Yellow River Basin. J. Shandong Technol. Bus. Univ. 2024, 38, 59–72. [Google Scholar] [CrossRef]
- Wang, J. Did China’s “National Sustainable Development Plan of Resource-Based Cities” Promote Economic Growth? Sustainability 2022, 14, 8222. [Google Scholar] [CrossRef] [Scilit]
- Wang, Y.; Zhang, R.H.; Zu, Z.S.; Wang, L.Y.; Dai, X.L. Measurement of the Coordinated Development Level and Its Dynamic Evolution of Energy Digitalization and Greening in China’s Provinces. J. Min. Sci. 2025, 1–10. [Google Scholar] [CrossRef]
- Luo, K.; Liu, Y.; Chen, P.F.; Zeng, M. Assessing the impact of digital economy on green development efficiency in the Yangtze River Economic Belt. Energy Econ. 2022, 112, 106127. [Google Scholar] [CrossRef] [Scilit]
- Yu, Y.S.; Wei, P. Measurement of Green Total Factor Productivity in Chinese Cities. Ecol. Econ. 2021, 37, 43–52. [Google Scholar]
- Liu, B.L.; Ding, C.J.; Ahmed, A.D.; Huang, Y.; Su, Y. Carbon emission allowances and green development efficiency. J. Clean. Prod. 2024, 463, 142246. [Google Scholar] [CrossRef] [Scilit]
- Li, F.; Du, J.; Li, H.; Du, X.; Xu, X. Analysis of coupling coordination and spatio-temporal of water resource carrying capacity and regional economic development-taking Henan Province as an example. Environ. Dev. Sustain. 2024. [Google Scholar] [CrossRef] [Scilit]
- Tone, K. A slacks-based measure of efficiency in data envelopment analysis. Eur. J. Oper. Res. 2001, 130, 498–509. [Google Scholar] [CrossRef] [Scilit]
- Tone, K. A slacks-based measure of super-efficiency in data envelopment analysis. Eur. J. Oper. Res. 2002, 143, 32–41. [Google Scholar] [CrossRef] [Scilit]
- Tone, K. Dealing with undesirable outputs in DEA: A slacks-based measure(SBM) approach. Natl. Grad. Inst. Policy Stud. 2003, 7, 44–45. [Google Scholar]
- Deng, Y.J.; Wang, W.J.; Hai, Y.F.; Zhang, M.; Dang, H.G.; Duan, M.X.; Peng, M.H.; Zhang, M.; Hou, M.Y. Synergy of carbon reduction and pollution abatement in the Chengdu-Chongqing economic circle: Spatio-temporal patterns, regional differences, and dynamic evolution. Environ. Sci. 2025, 1–20. [Google Scholar] [CrossRef]
- Liu, K.-D.; Shi, D.; Xiang, W.; Zhang, W. How has the efficiency of China’s green development evolved? An improved non-radial directional distance function measurement. Sci. Total Environ. 2022, 815, 152337. [Google Scholar] [CrossRef] [Scilit]
- Dagum, C. A new approach to the decomposition of the Gini income inequality ratio. Empir. Econ. 1997, 22, 515–531. [Google Scholar] [CrossRef] [Scilit]
- Song, Y.Z.; Wang, J.; Ge, Y.; Xu, C. An optimal parameters-based geographical detector model enhances geographic characteristics of explanatory variables for spatial heterogeneity analysis: Cases with different types of spatial data. Gisci. Remote Sens. 2020, 57, 593–610. [Google Scholar] [CrossRef] [Scilit]
- Zhou, L.; Che, L.; Zhou, C.H. Spatio-temporal evolution characteristics and influencing factors of urban green development efficiency in China. Acta Geogr. Sin. 2019, 74, 2027–2044. [Google Scholar] [CrossRef]
- Guo, Y.H.; Tong, L.J.; Mei, L. The effect of industrial agglomeration on green development efficiency in Northeast China since the revitalization. J. Clean. Prod. 2020, 258, 120584. [Google Scholar] [CrossRef] [Scilit]
- Zhou, L.; Zhou, C.; Che, L.; Wang, B. Spatio-temporal evolution and influencing factors of urban green development efficiency in China. J. Geogr. Sci. 2020, 30, 724–742. [Google Scholar] [CrossRef] [Scilit]
- Duan, P.; Du, P.; Ruan, Z. Spatio-temporal pattern evolution of green development efficiency in Northeastern China and its driving factors. Heliyon 2024, 10, e32119. [Google Scholar] [CrossRef] [Scilit] [PubMed]
- Huang, S.; Wang, J. Evaluation of green development efficiency in resource-based cities based on the SBM-GML model: A case study of the Yellow River Basin. Environ. Ecol. 2025, 7, 167–174. [Google Scholar] [CrossRef]
- Qiang, B.B.; Zhang, X.Y.; Li, X.; Zang, N.; Li, Y.C.; Chen, L.J. Analysis of green development efficiency of national high-tech zones based on the super-efficiency SBM-DEA model. J. Saf. Environ. 2026, 26, 398–408. [Google Scholar] [CrossRef]
- Ruan, F.L.; Yan, L.; Wang, D. The complexity for the resource-based cities in China on creating sustainable development. Cities 2020, 97, 102571. [Google Scholar] [CrossRef] [Scilit]
- Färe, R.; Grosskopf, S.; Lindgren, B.; Roos, P. Productivity changes in Swedish pharamacies 1980–1989: A non-parametric Malmquist approach. J. Product. Anal. 1992, 3, 85–101. [Google Scholar] [CrossRef] [Scilit]
- Lu, P.; Li, Z.H.; Wu, H.W. Investigating the effects of industrial transformation and agglomeration on industrial eco-efficiency for green development: Evidence from enterprises in the Yangtze River Economic Belt. J. Clean. Prod. 2024, 479, 143949. [Google Scholar] [CrossRef] [Scilit]
- Liu, X.P.; Lu, X.H. Developing new quality productive forces according to local conditions: Growth potential and enhancement paths of green innovation performance in China’s old industrial bases and resource-based cities. Stat. Res. 2025, 42, 45–58. [Google Scholar] [CrossRef]
- Lu, S.; Xia, S.Y.; Zhang, W.Z. The impact of global value chain upgrading on the low-carbon transition of China’s resource-based cities: Evidence from resource-based and non-resource-based industries. Resour. Sci. 2025, 47, 2062–2078. [Google Scholar] [CrossRef] [Scilit]
- Huang, H.; Huang, H.; Xiao, Y.; Shang, X. Industrial structure upgrading, government attention to eco-environment, and green innovation efficiency: Evidence from 115 resource-based cities in China. J. Nat. Resour. 2024, 39, 104–124. [Google Scholar] [CrossRef] [Scilit]
- Zhu, B.Z.; Zhang, M.; Huang, L.; Wang, P.; Su, B.; Wei, Y.-M. Exploring the effect of carbon trading mechanism on China’s green development efficiency: A novel integrated approach. Energy Econ. 2020, 85, 104601. [Google Scholar] [CrossRef] [Scilit]
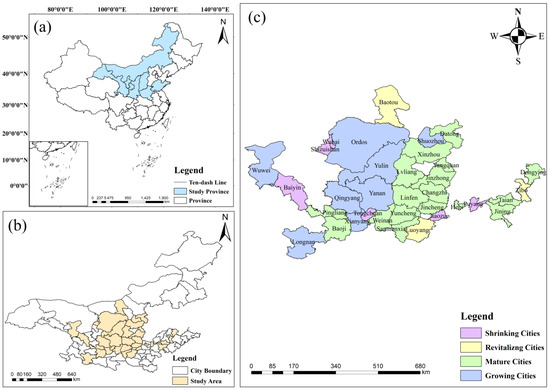
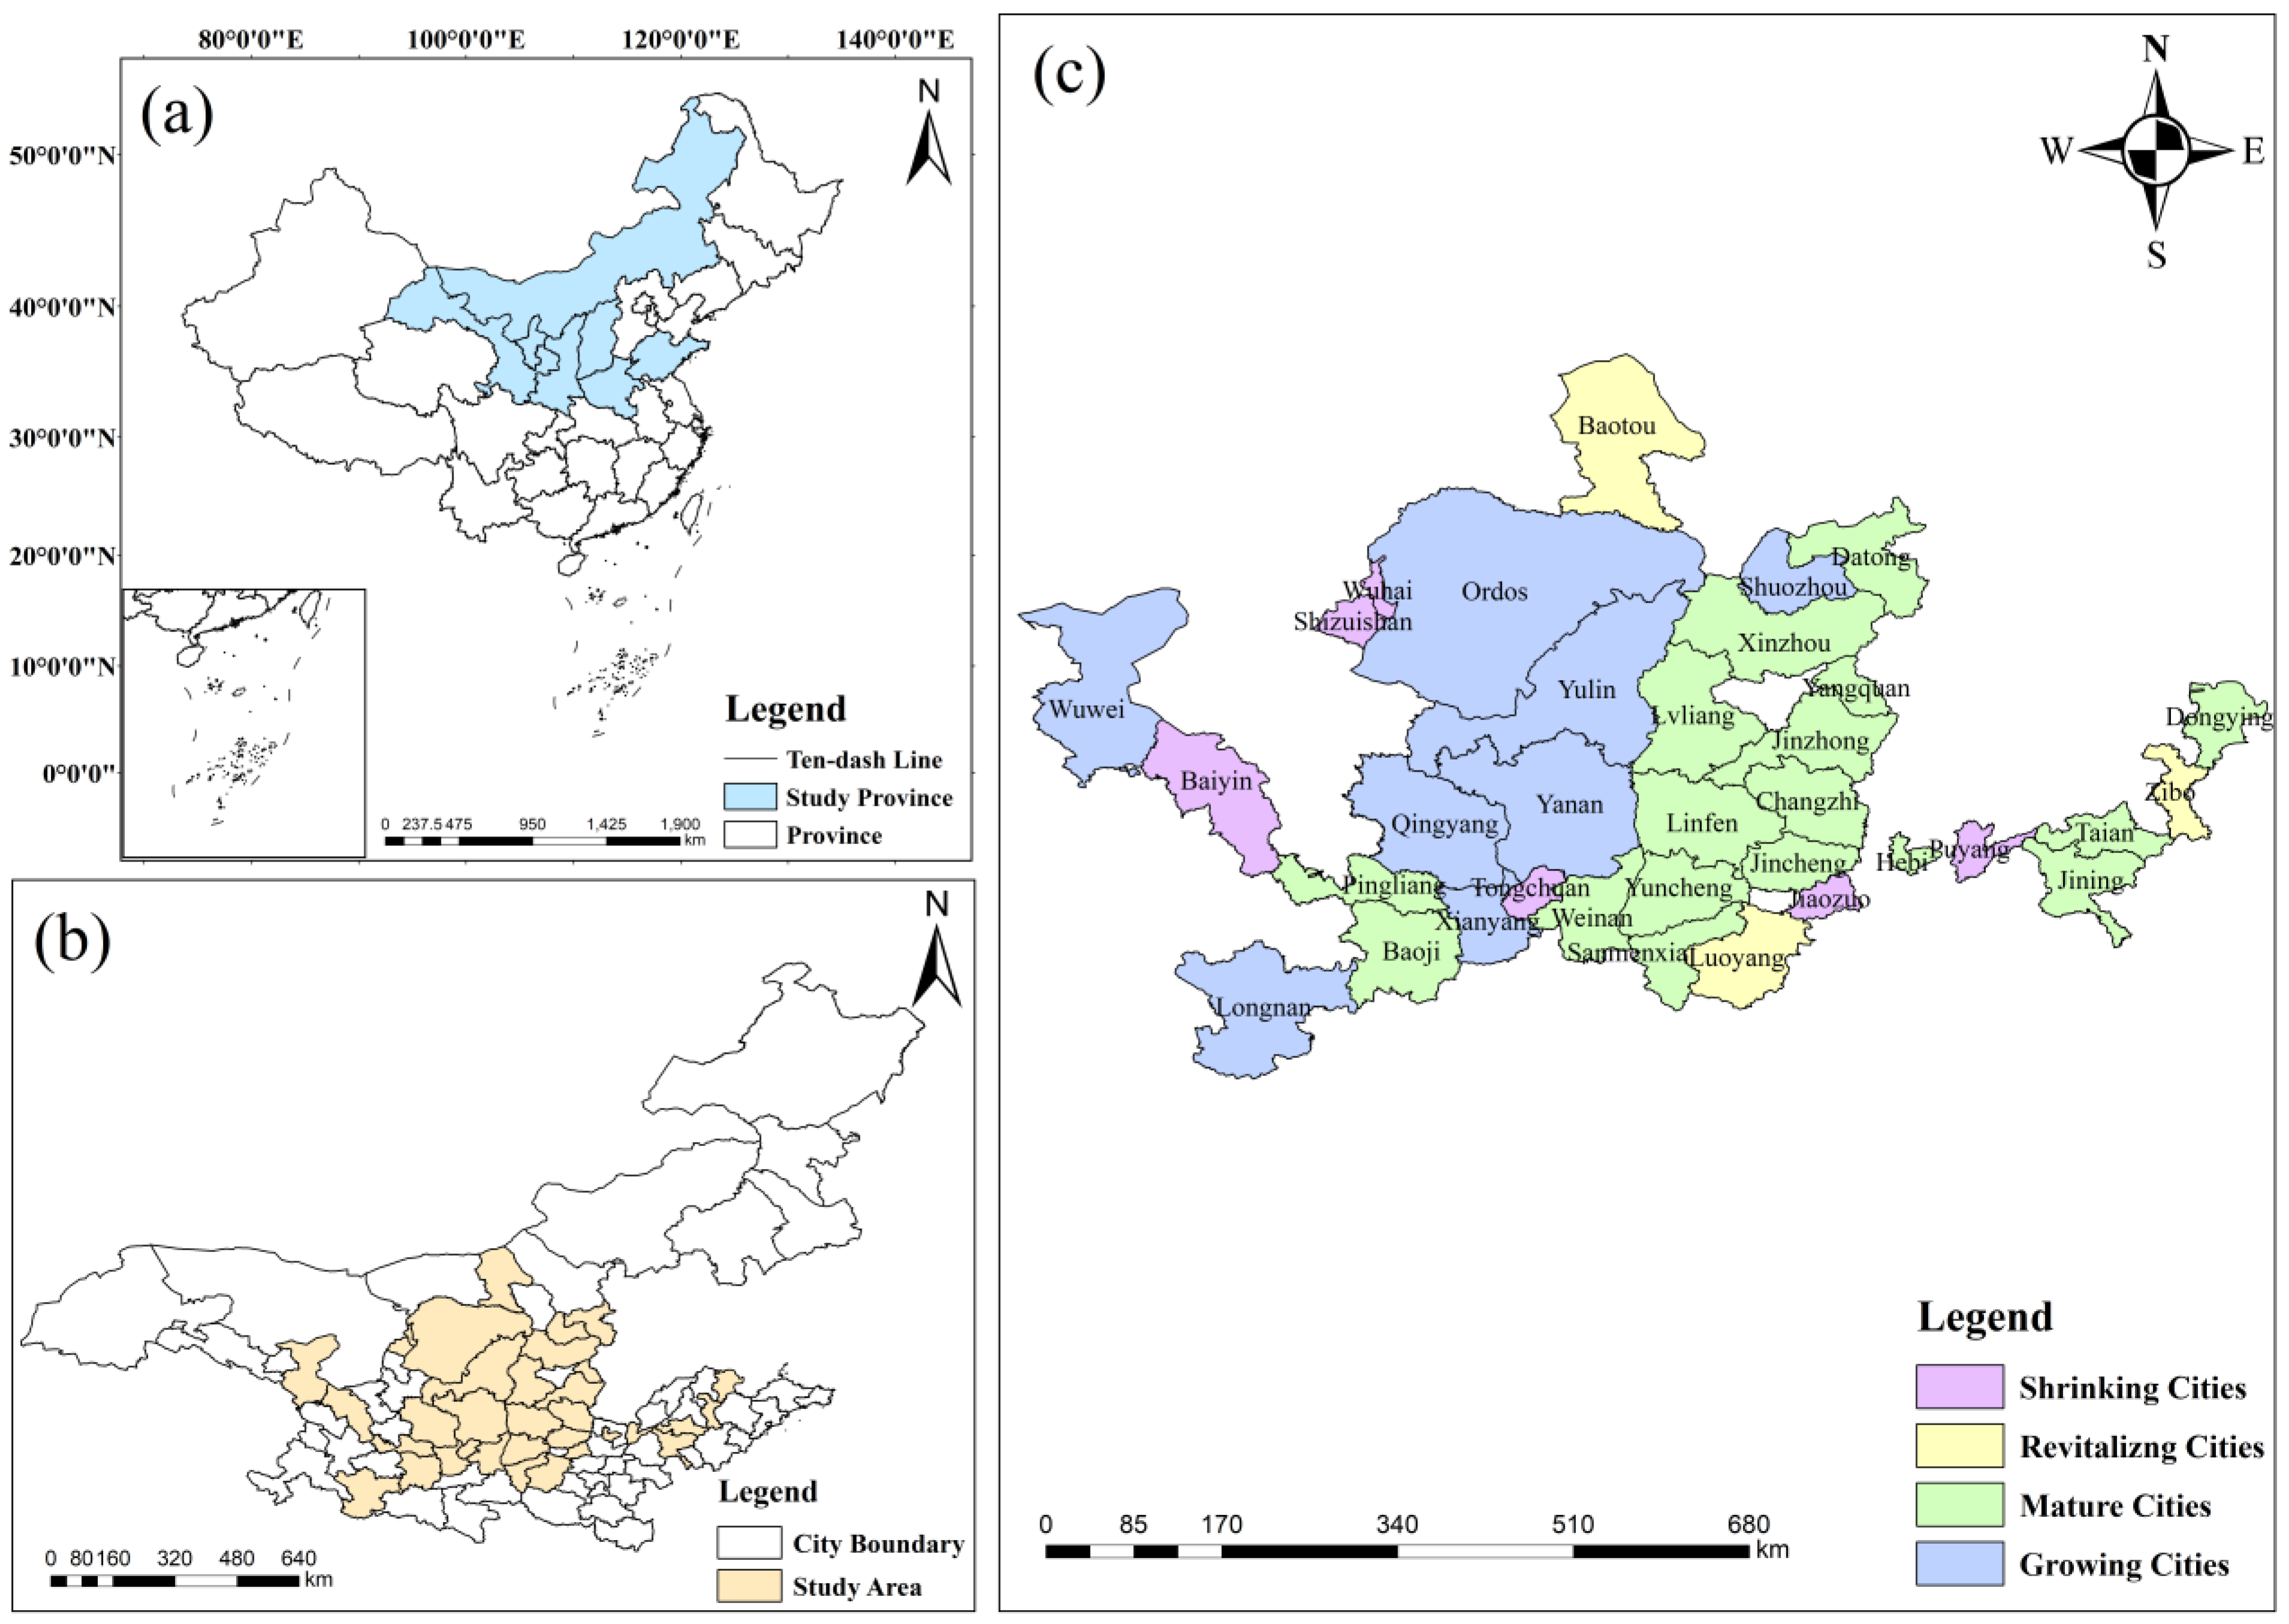
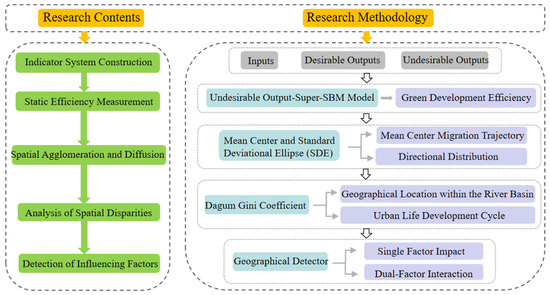
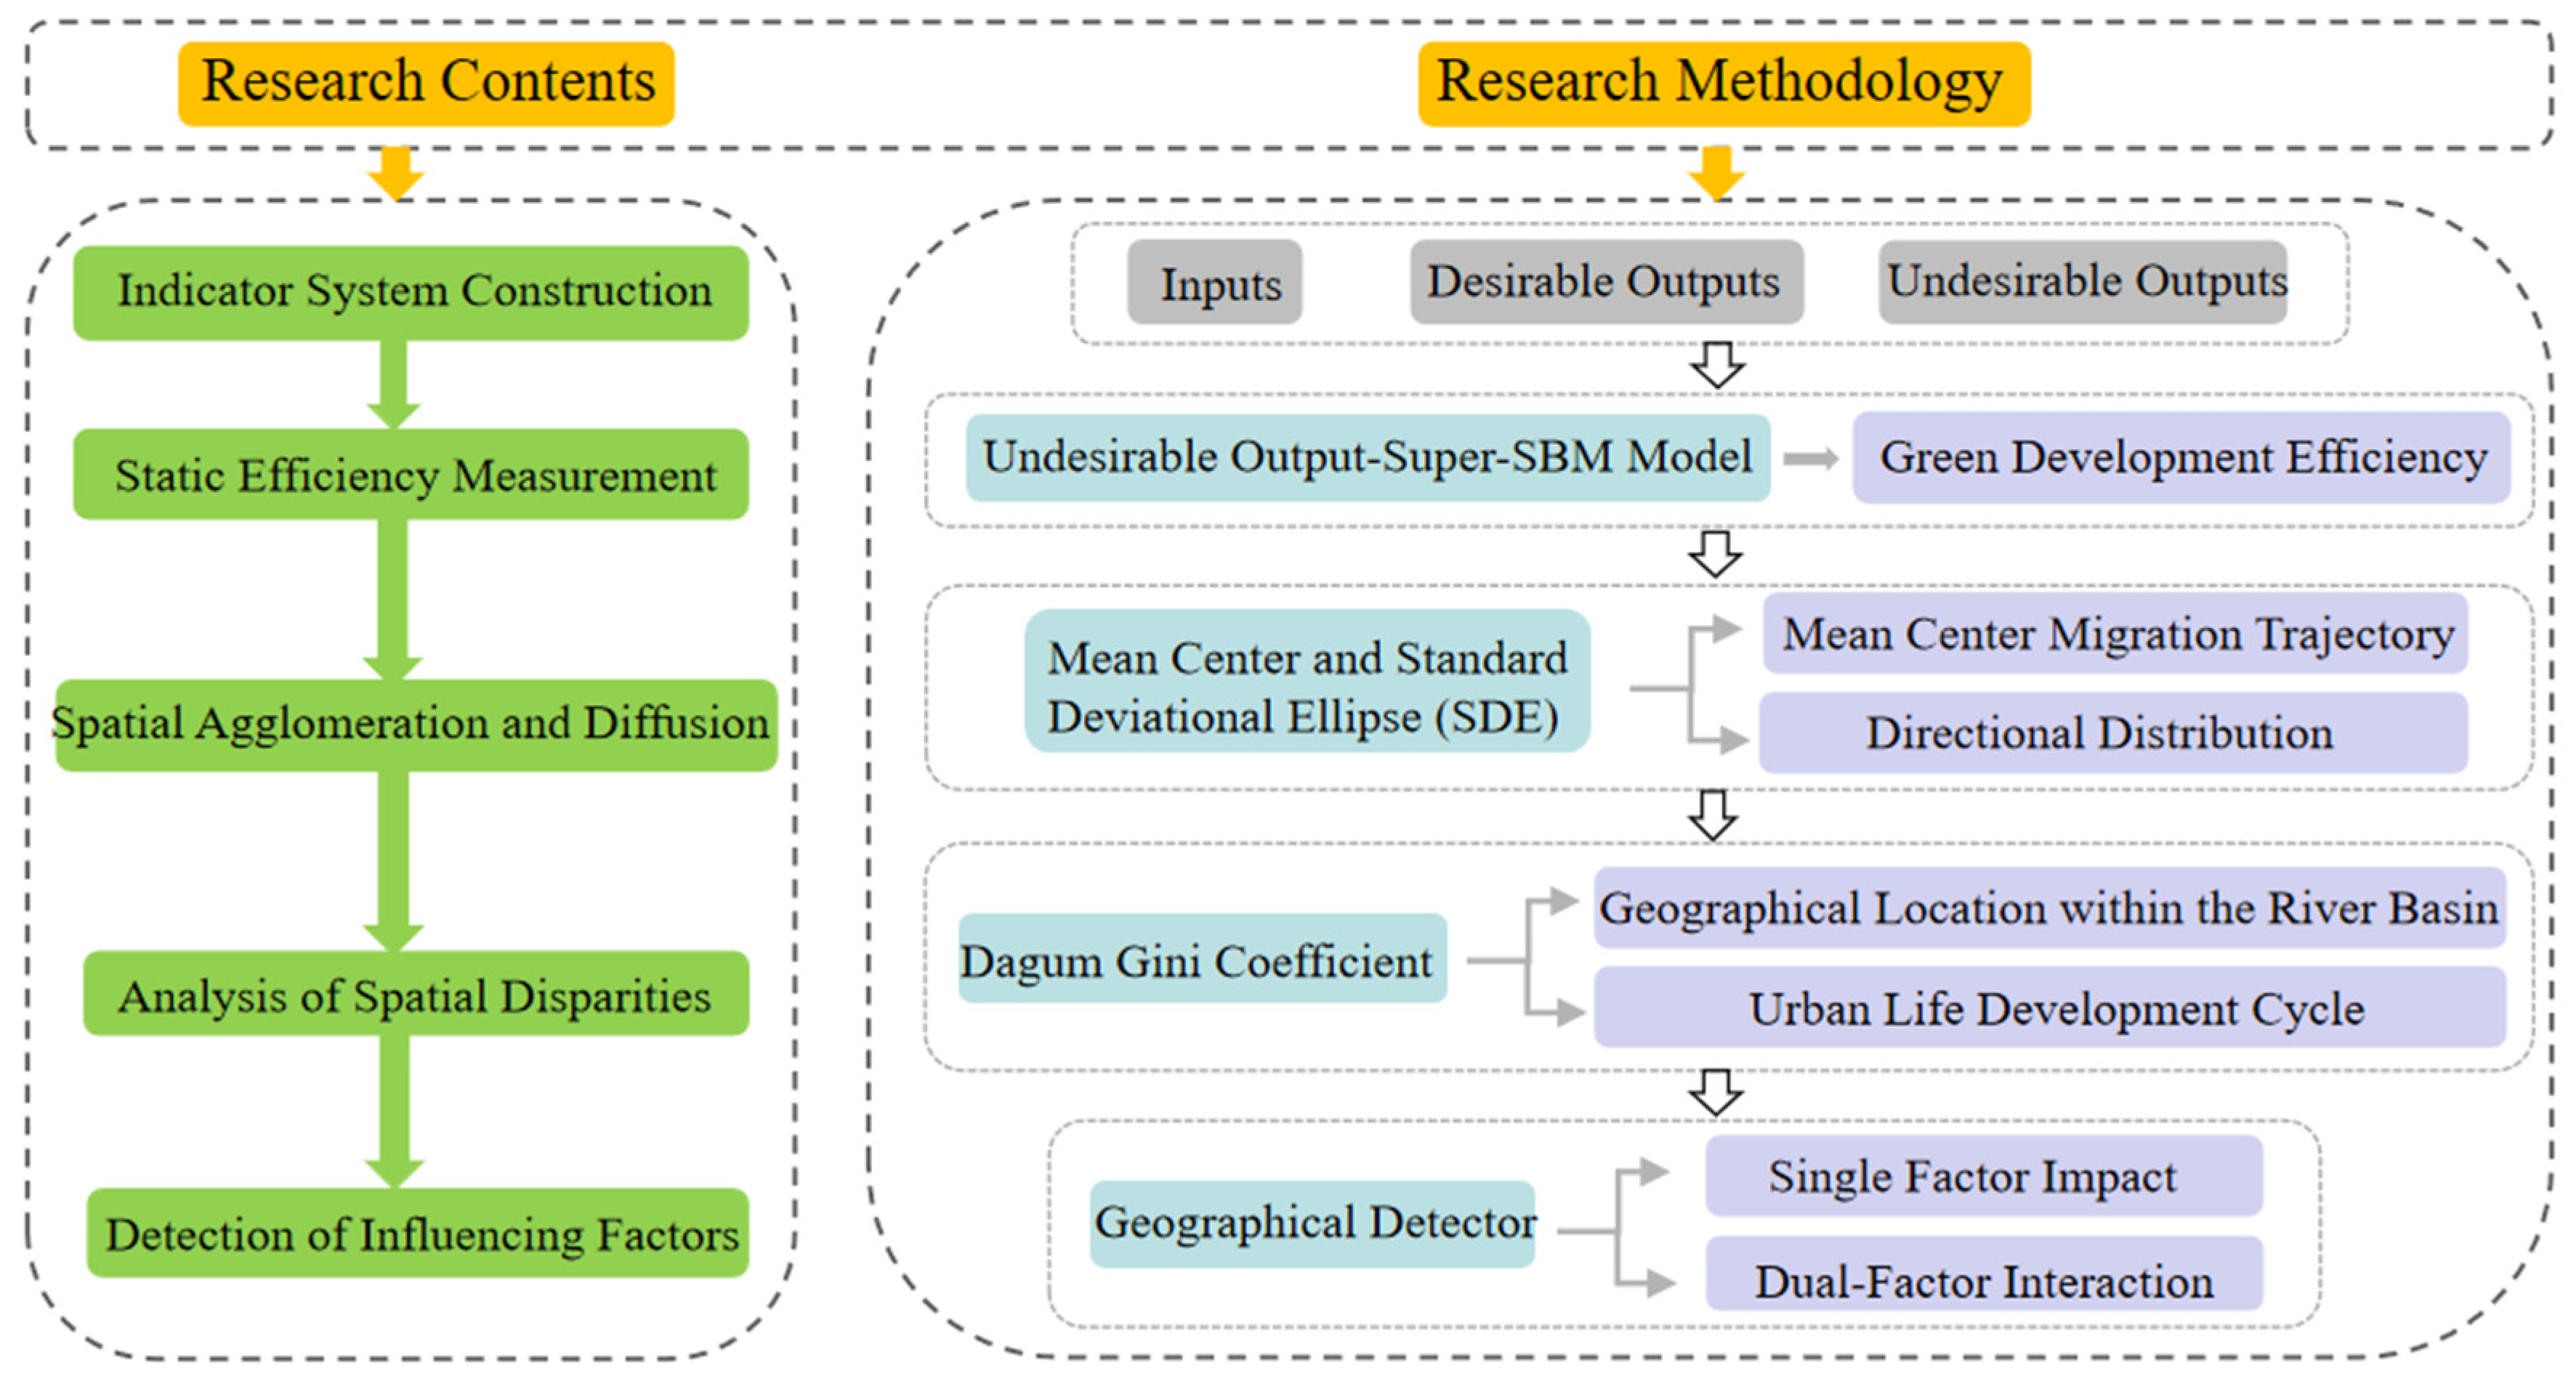
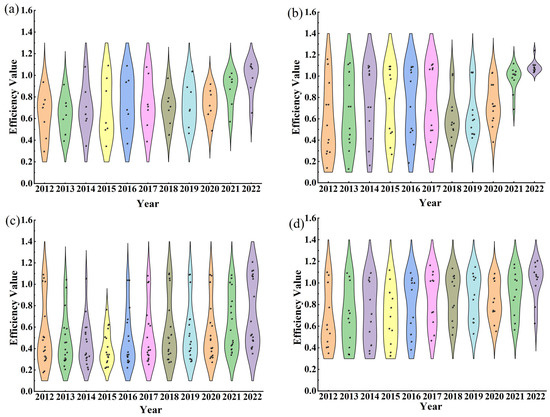
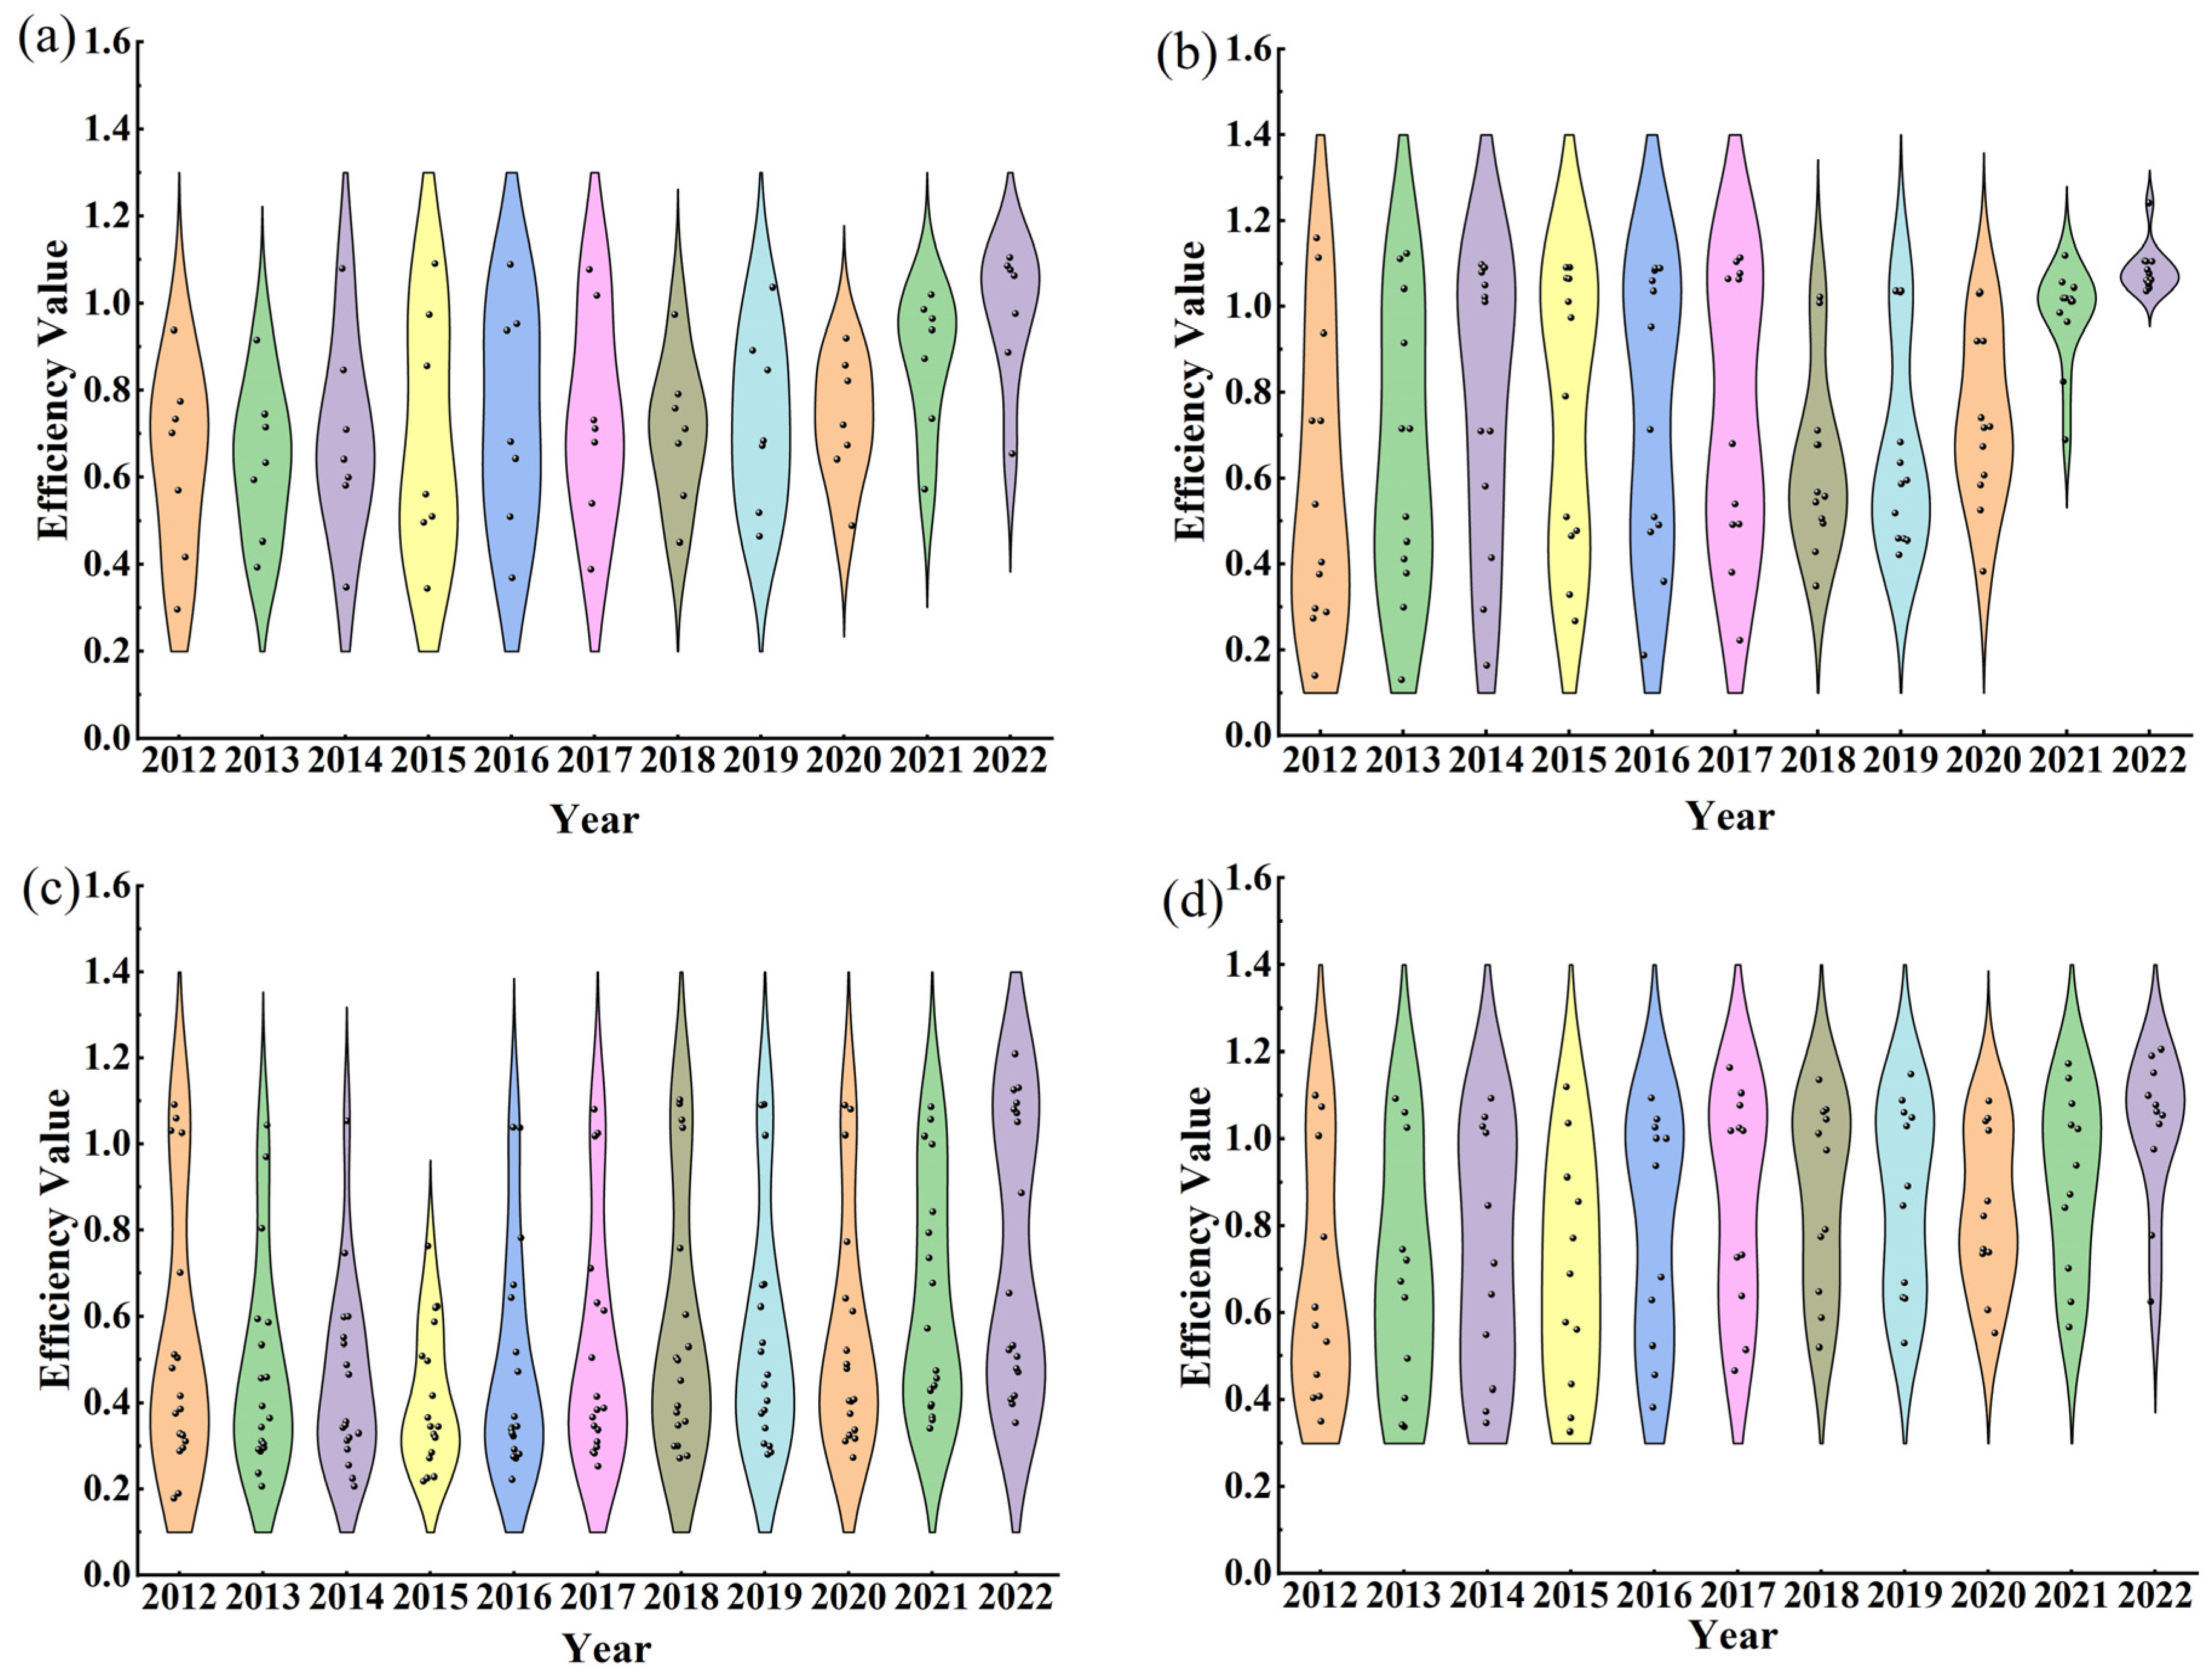
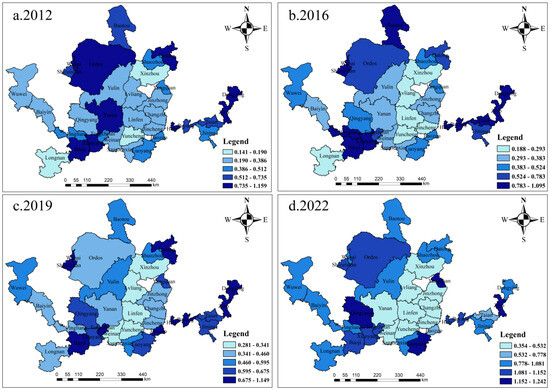
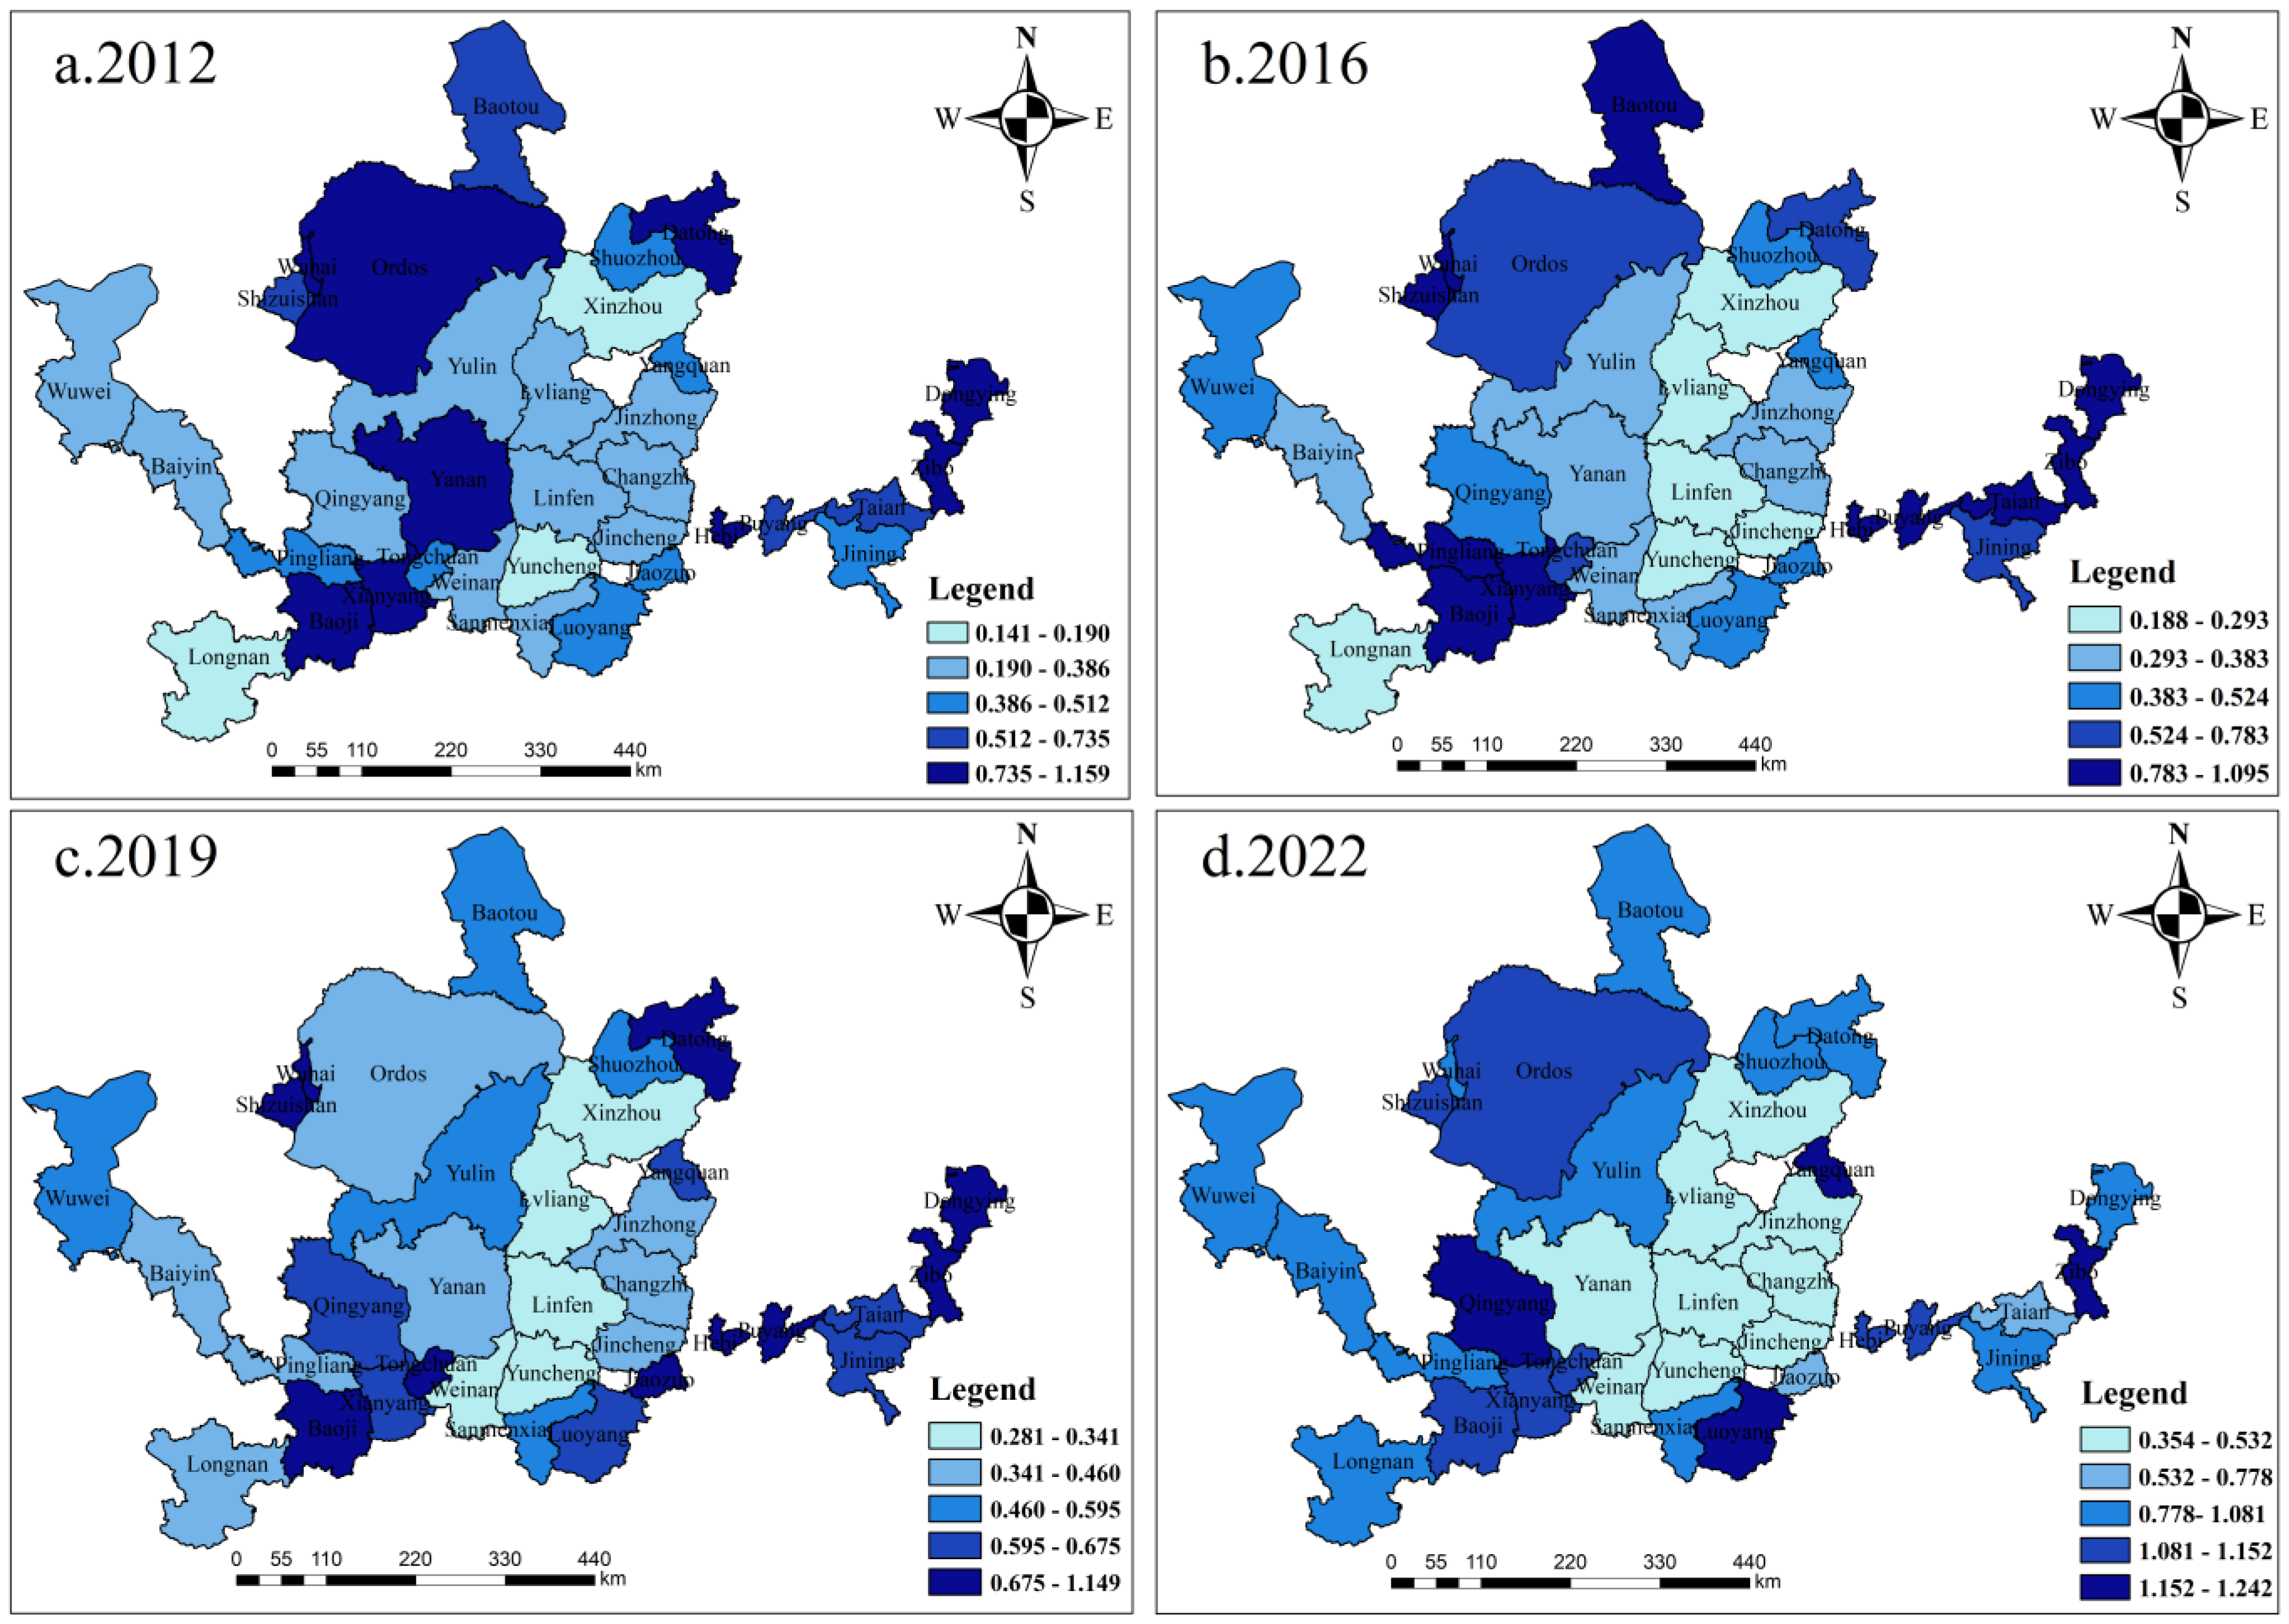
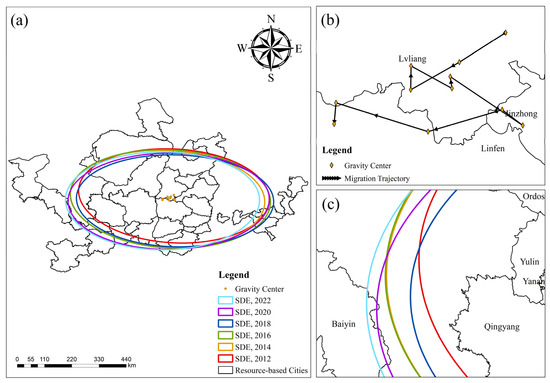
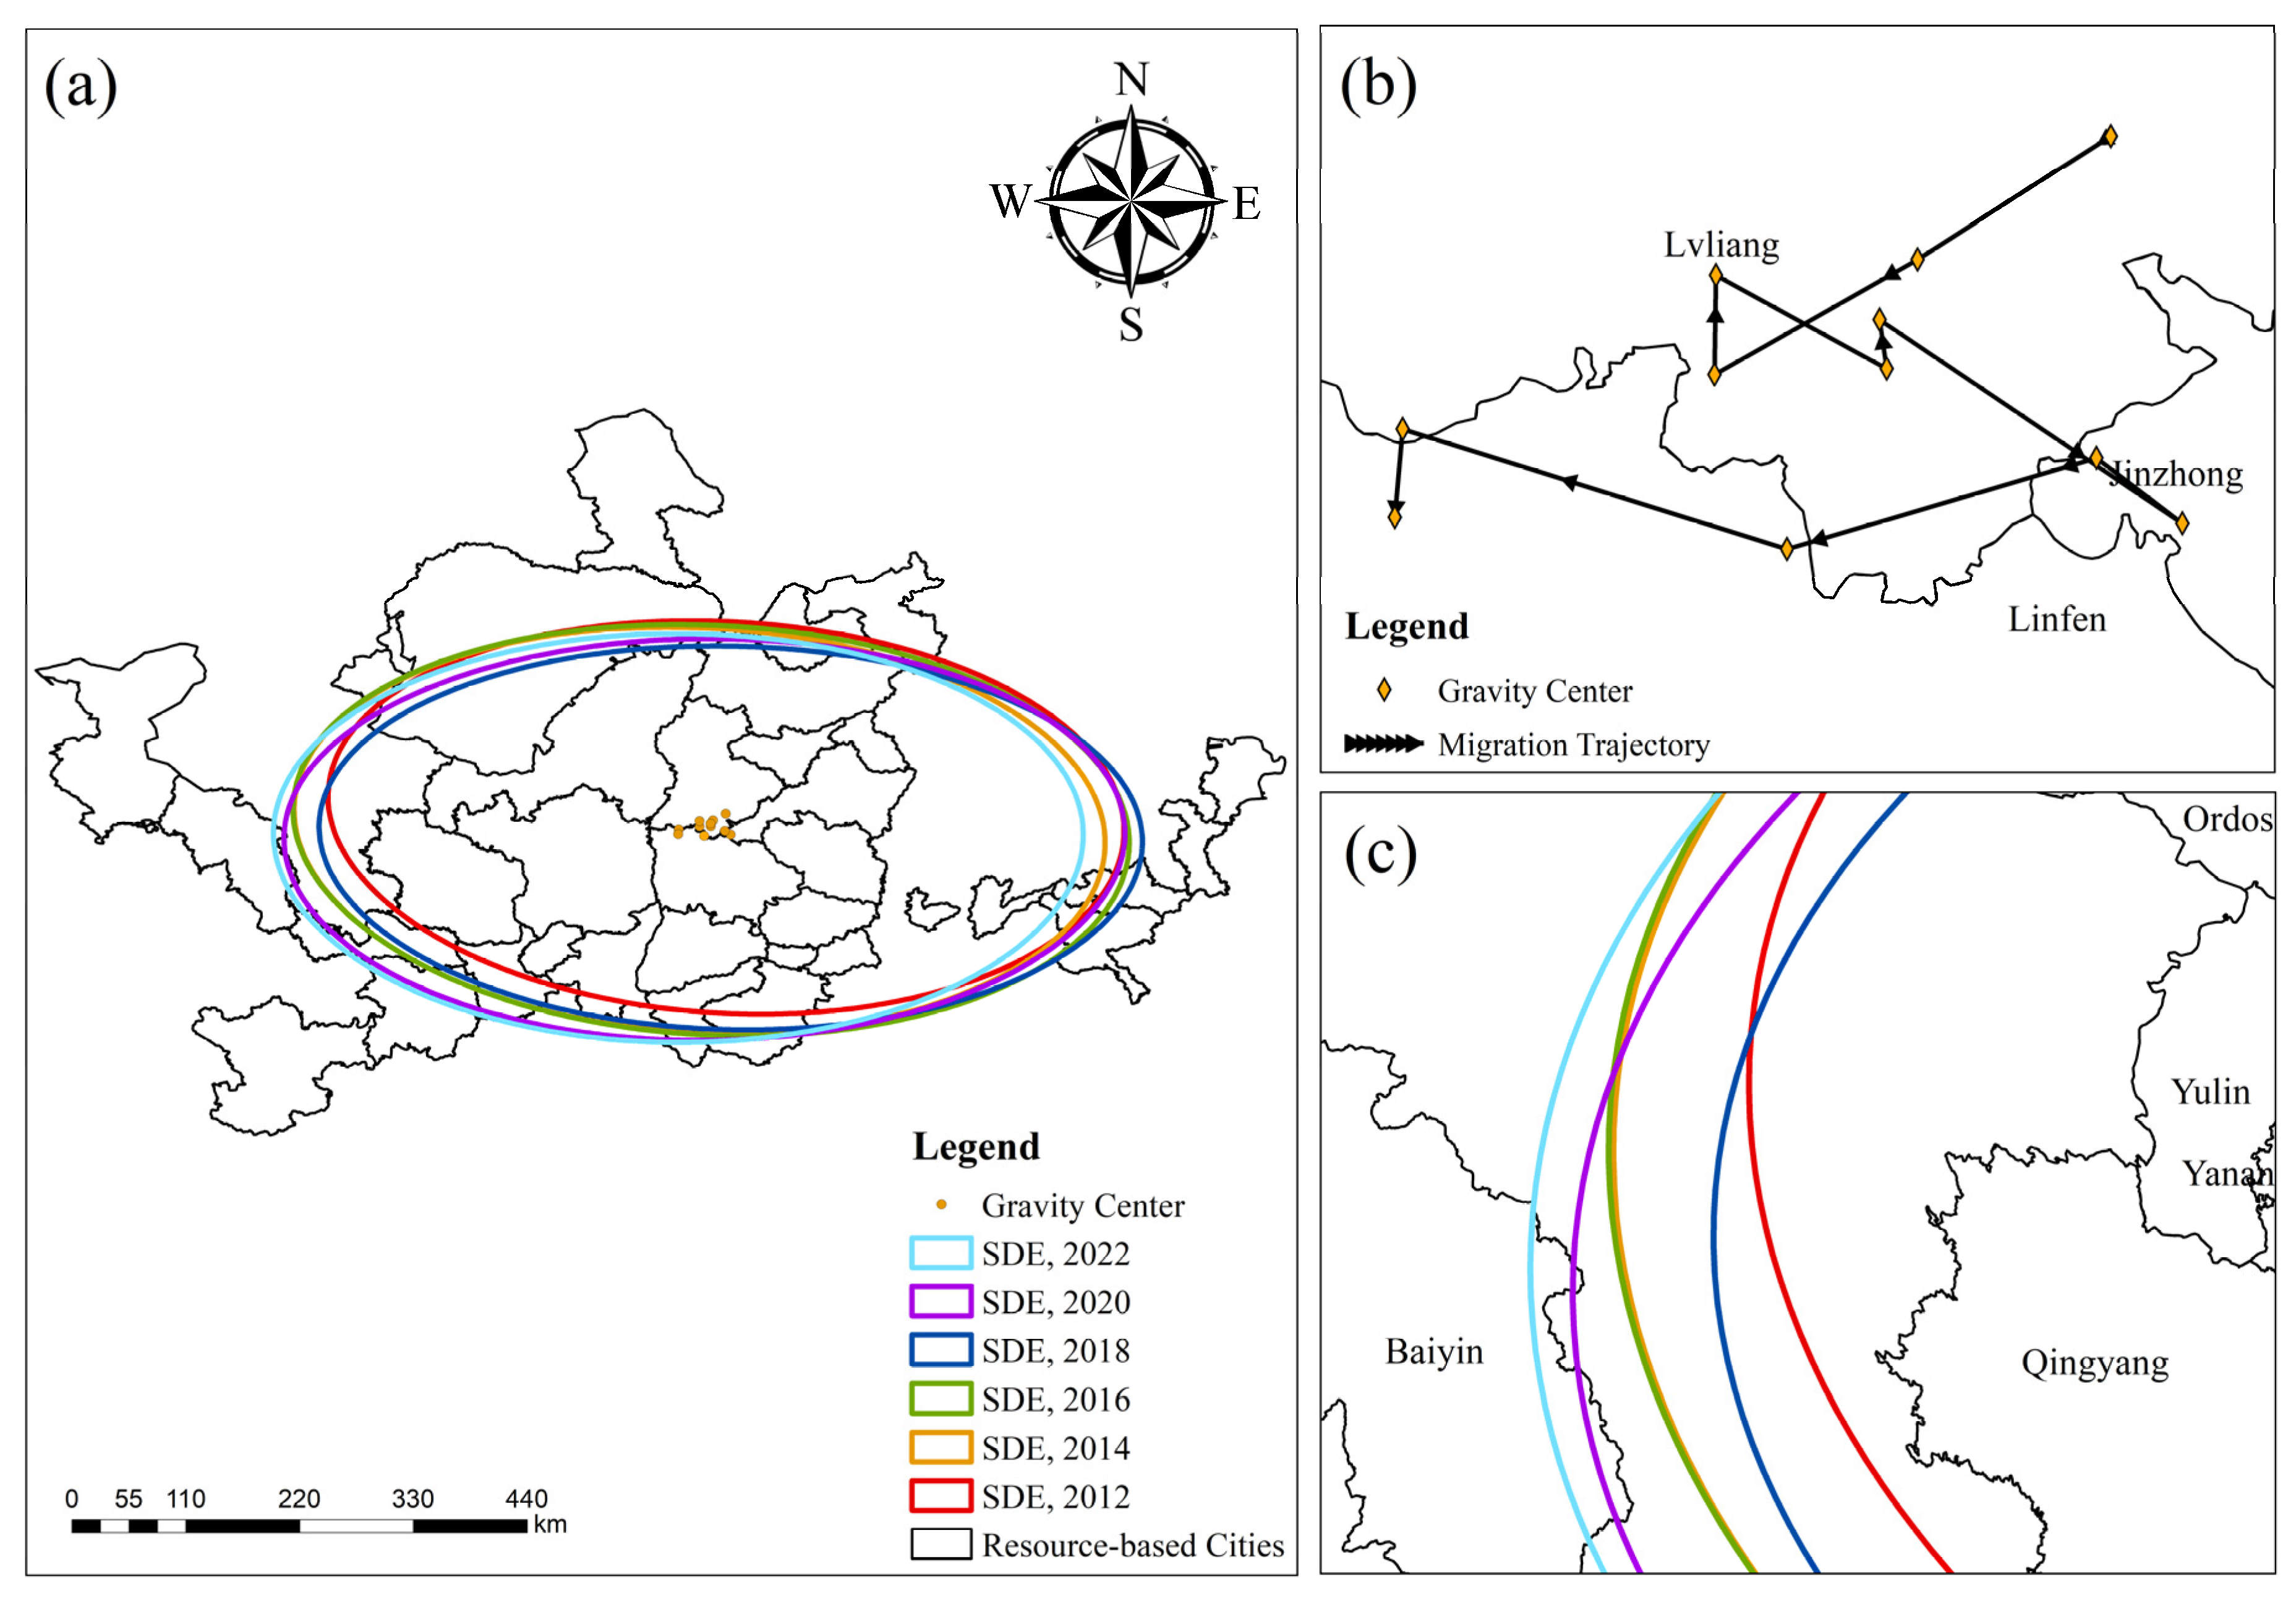
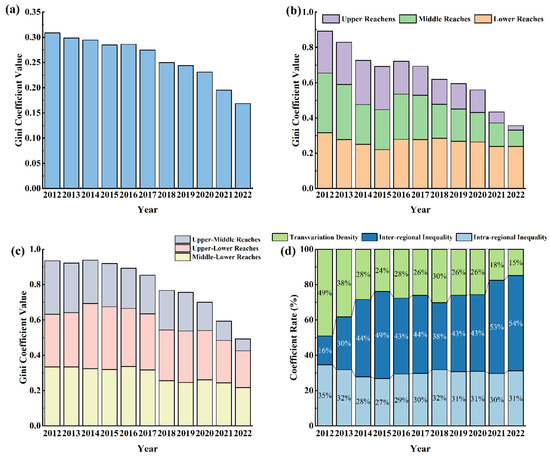
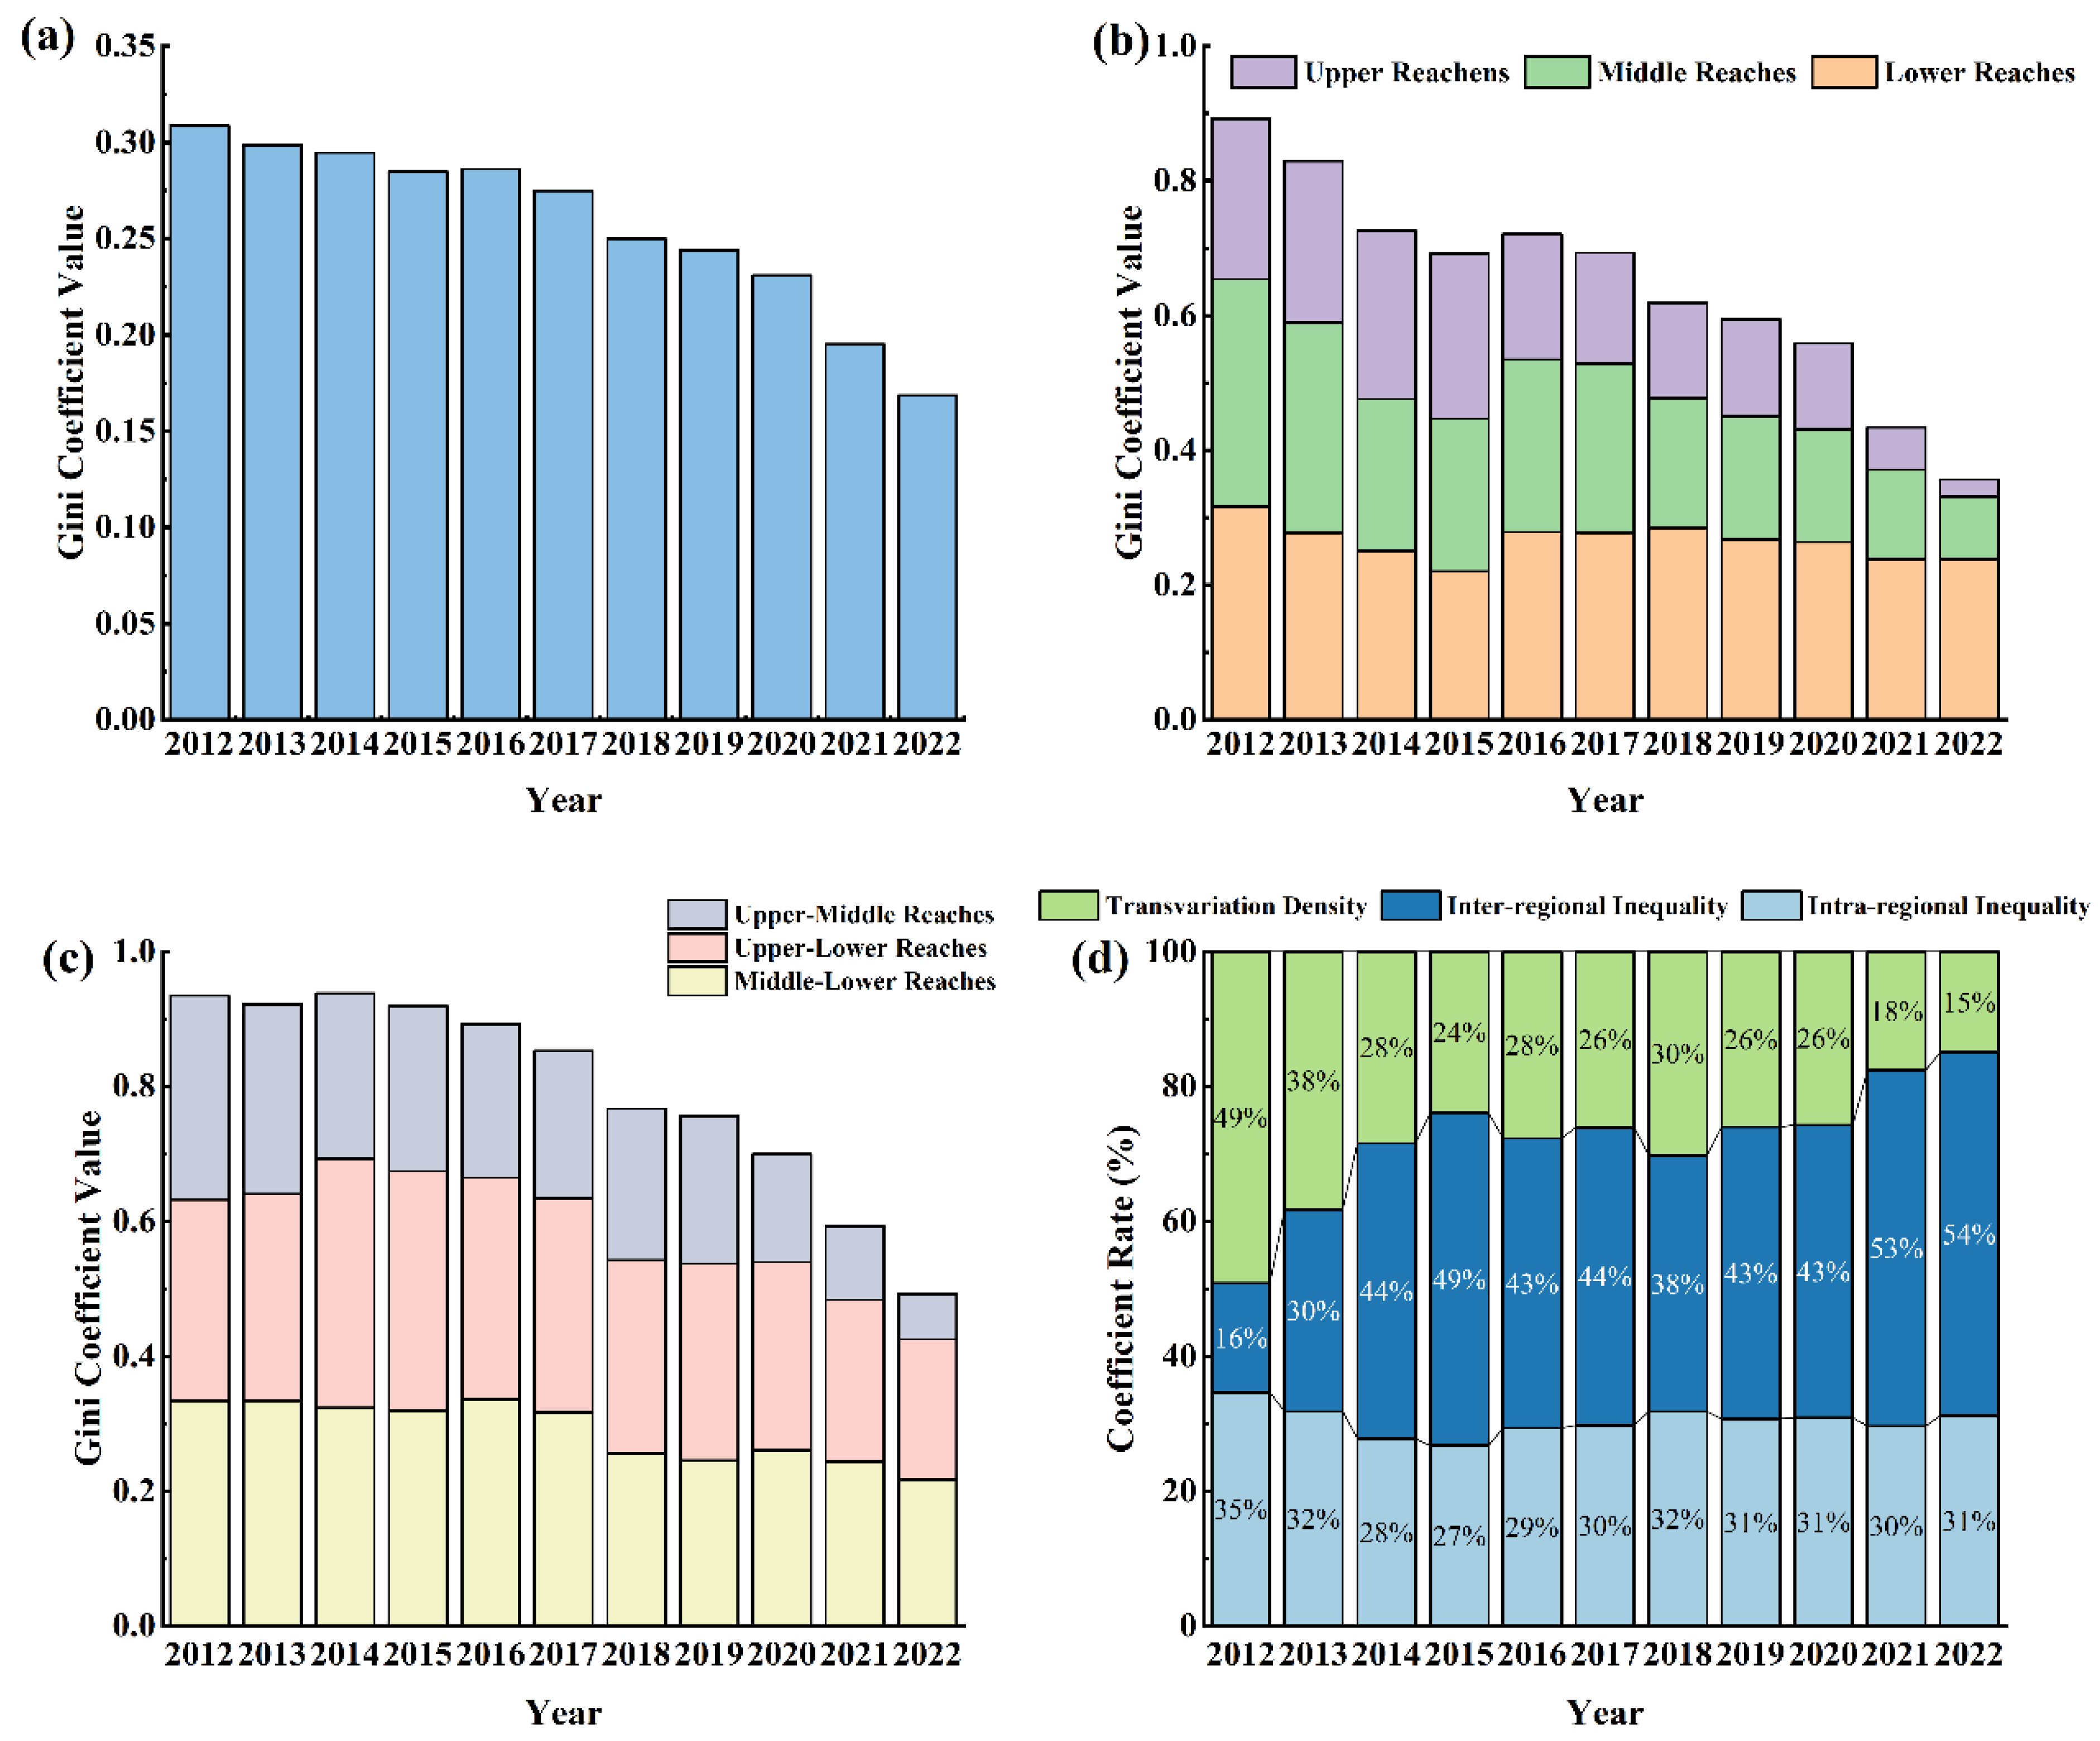
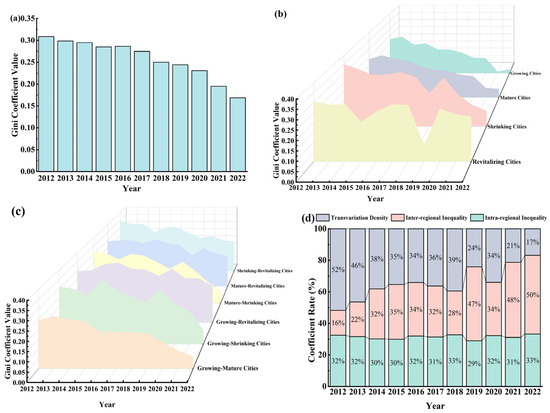
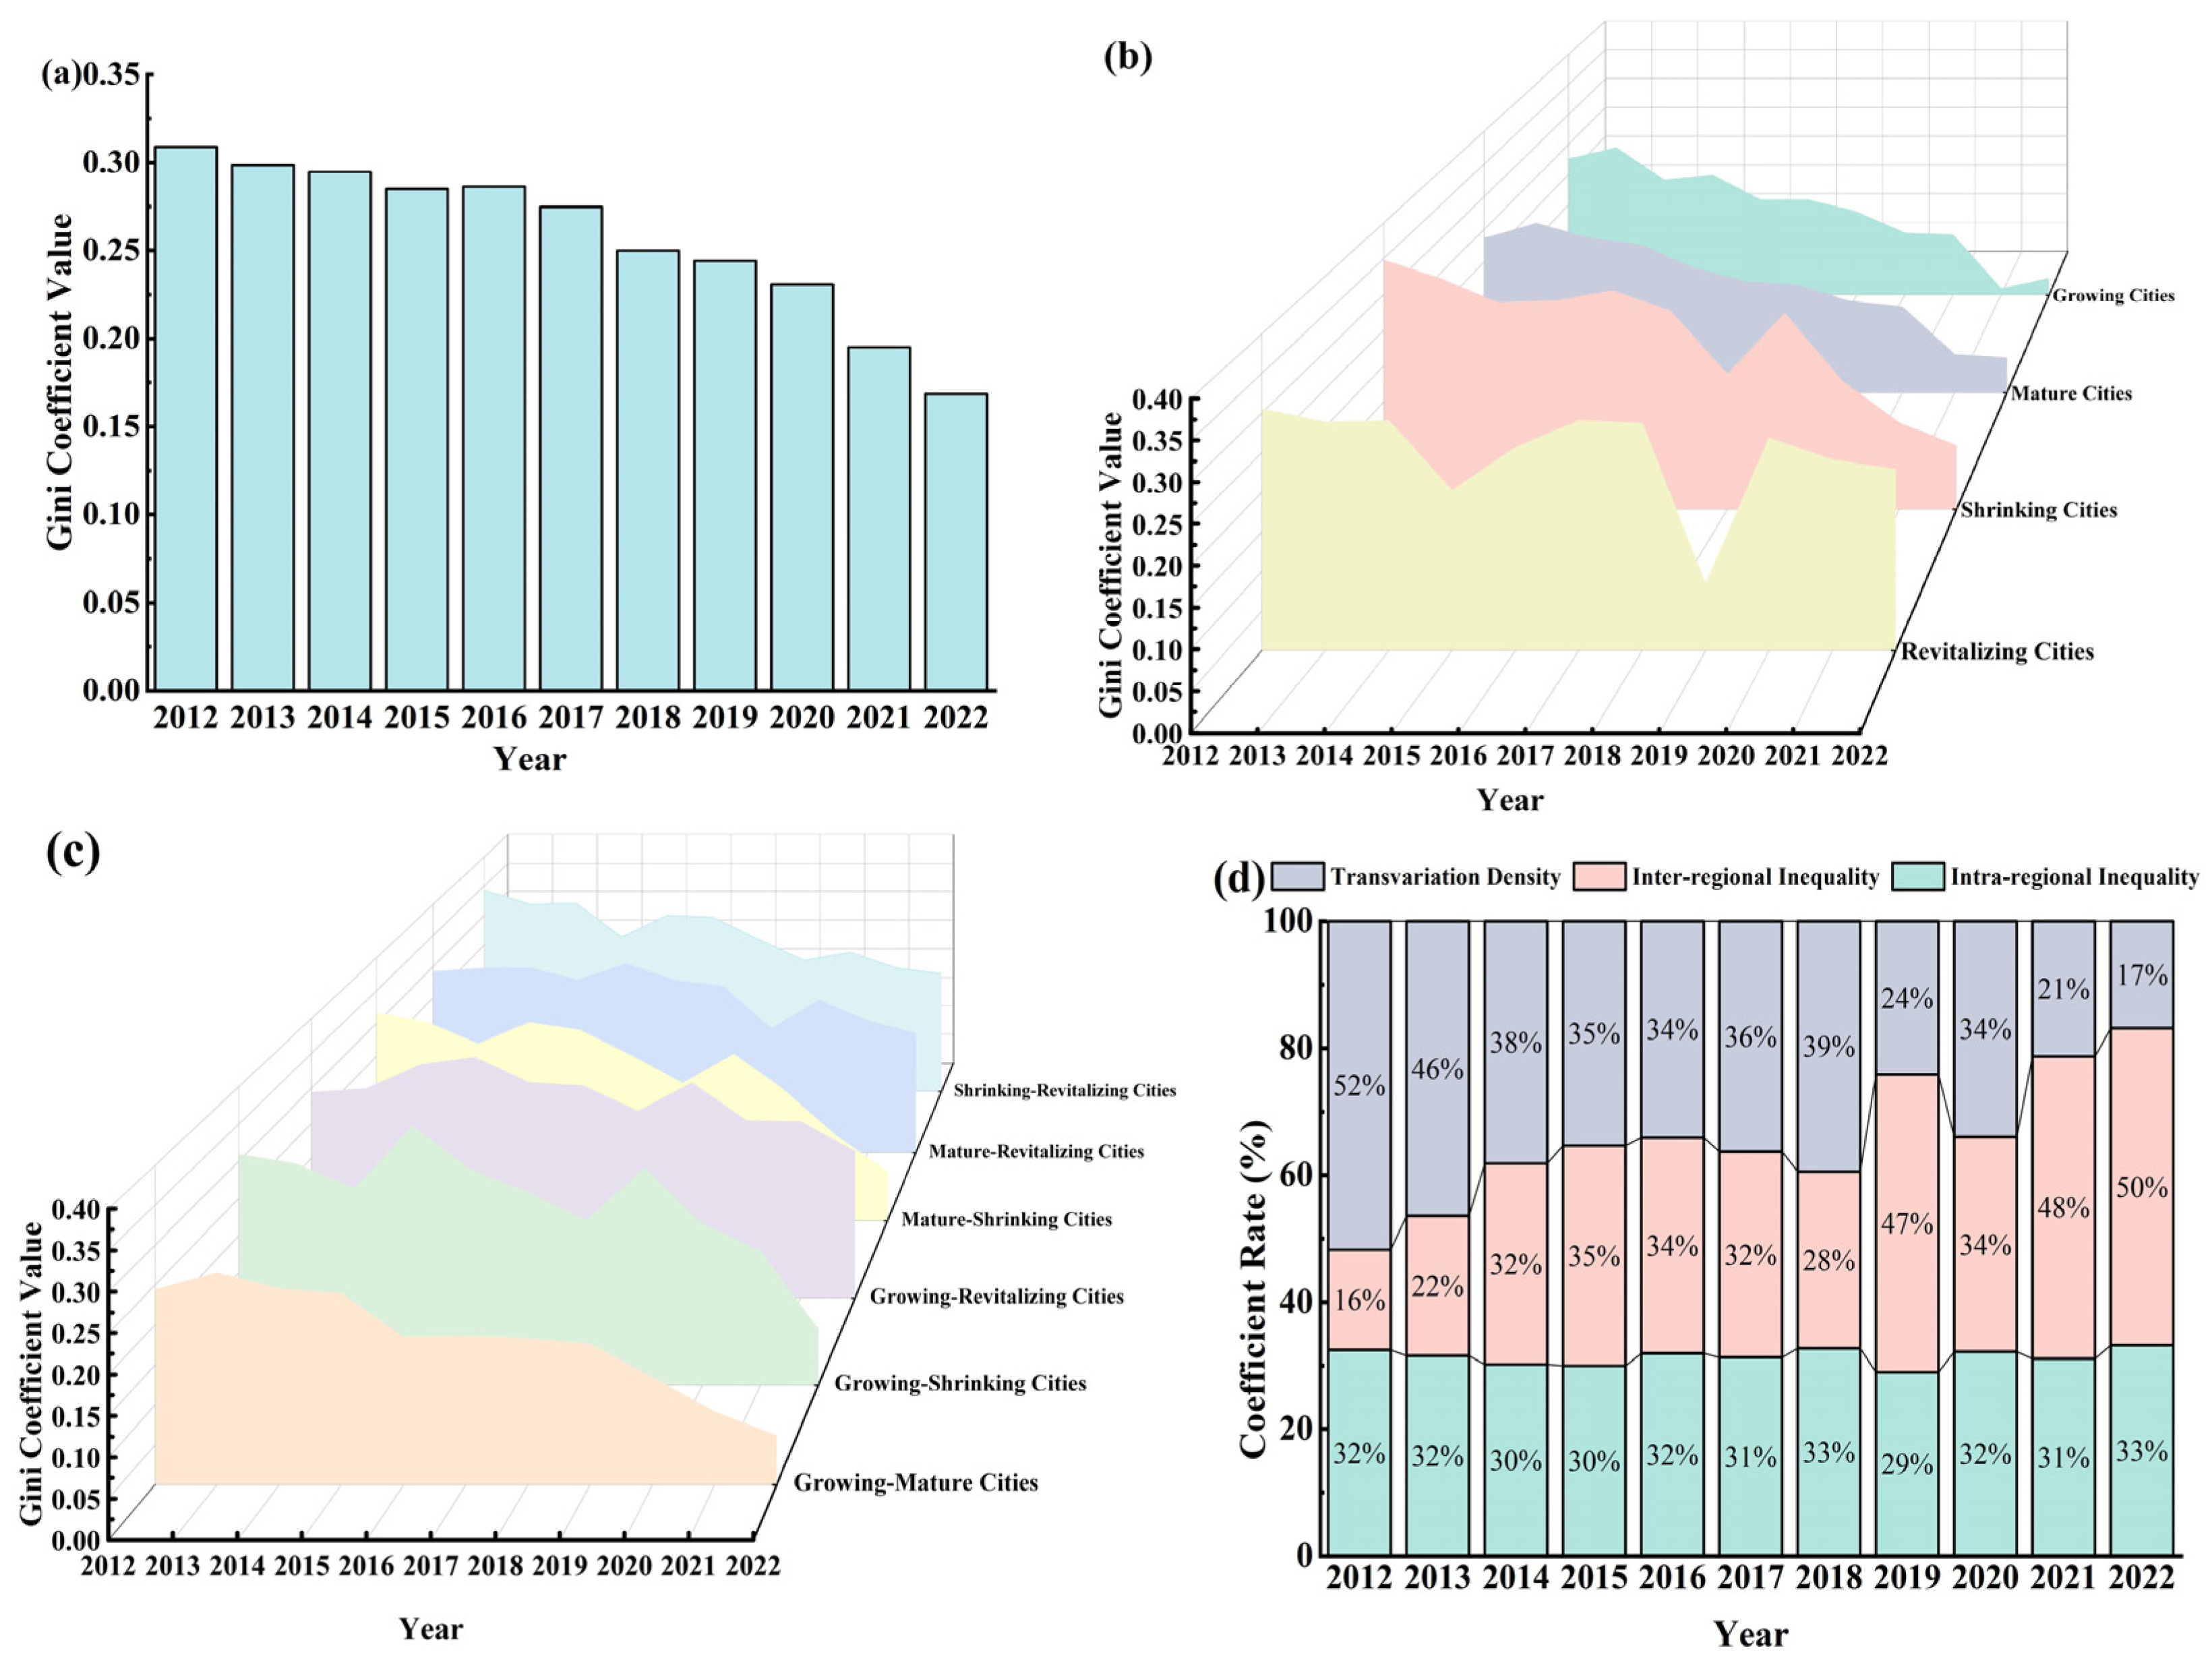
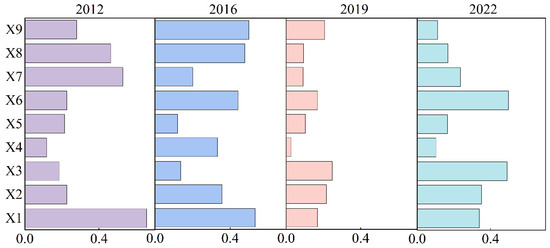
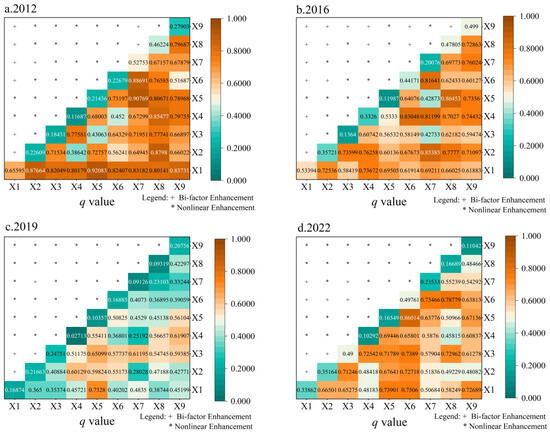
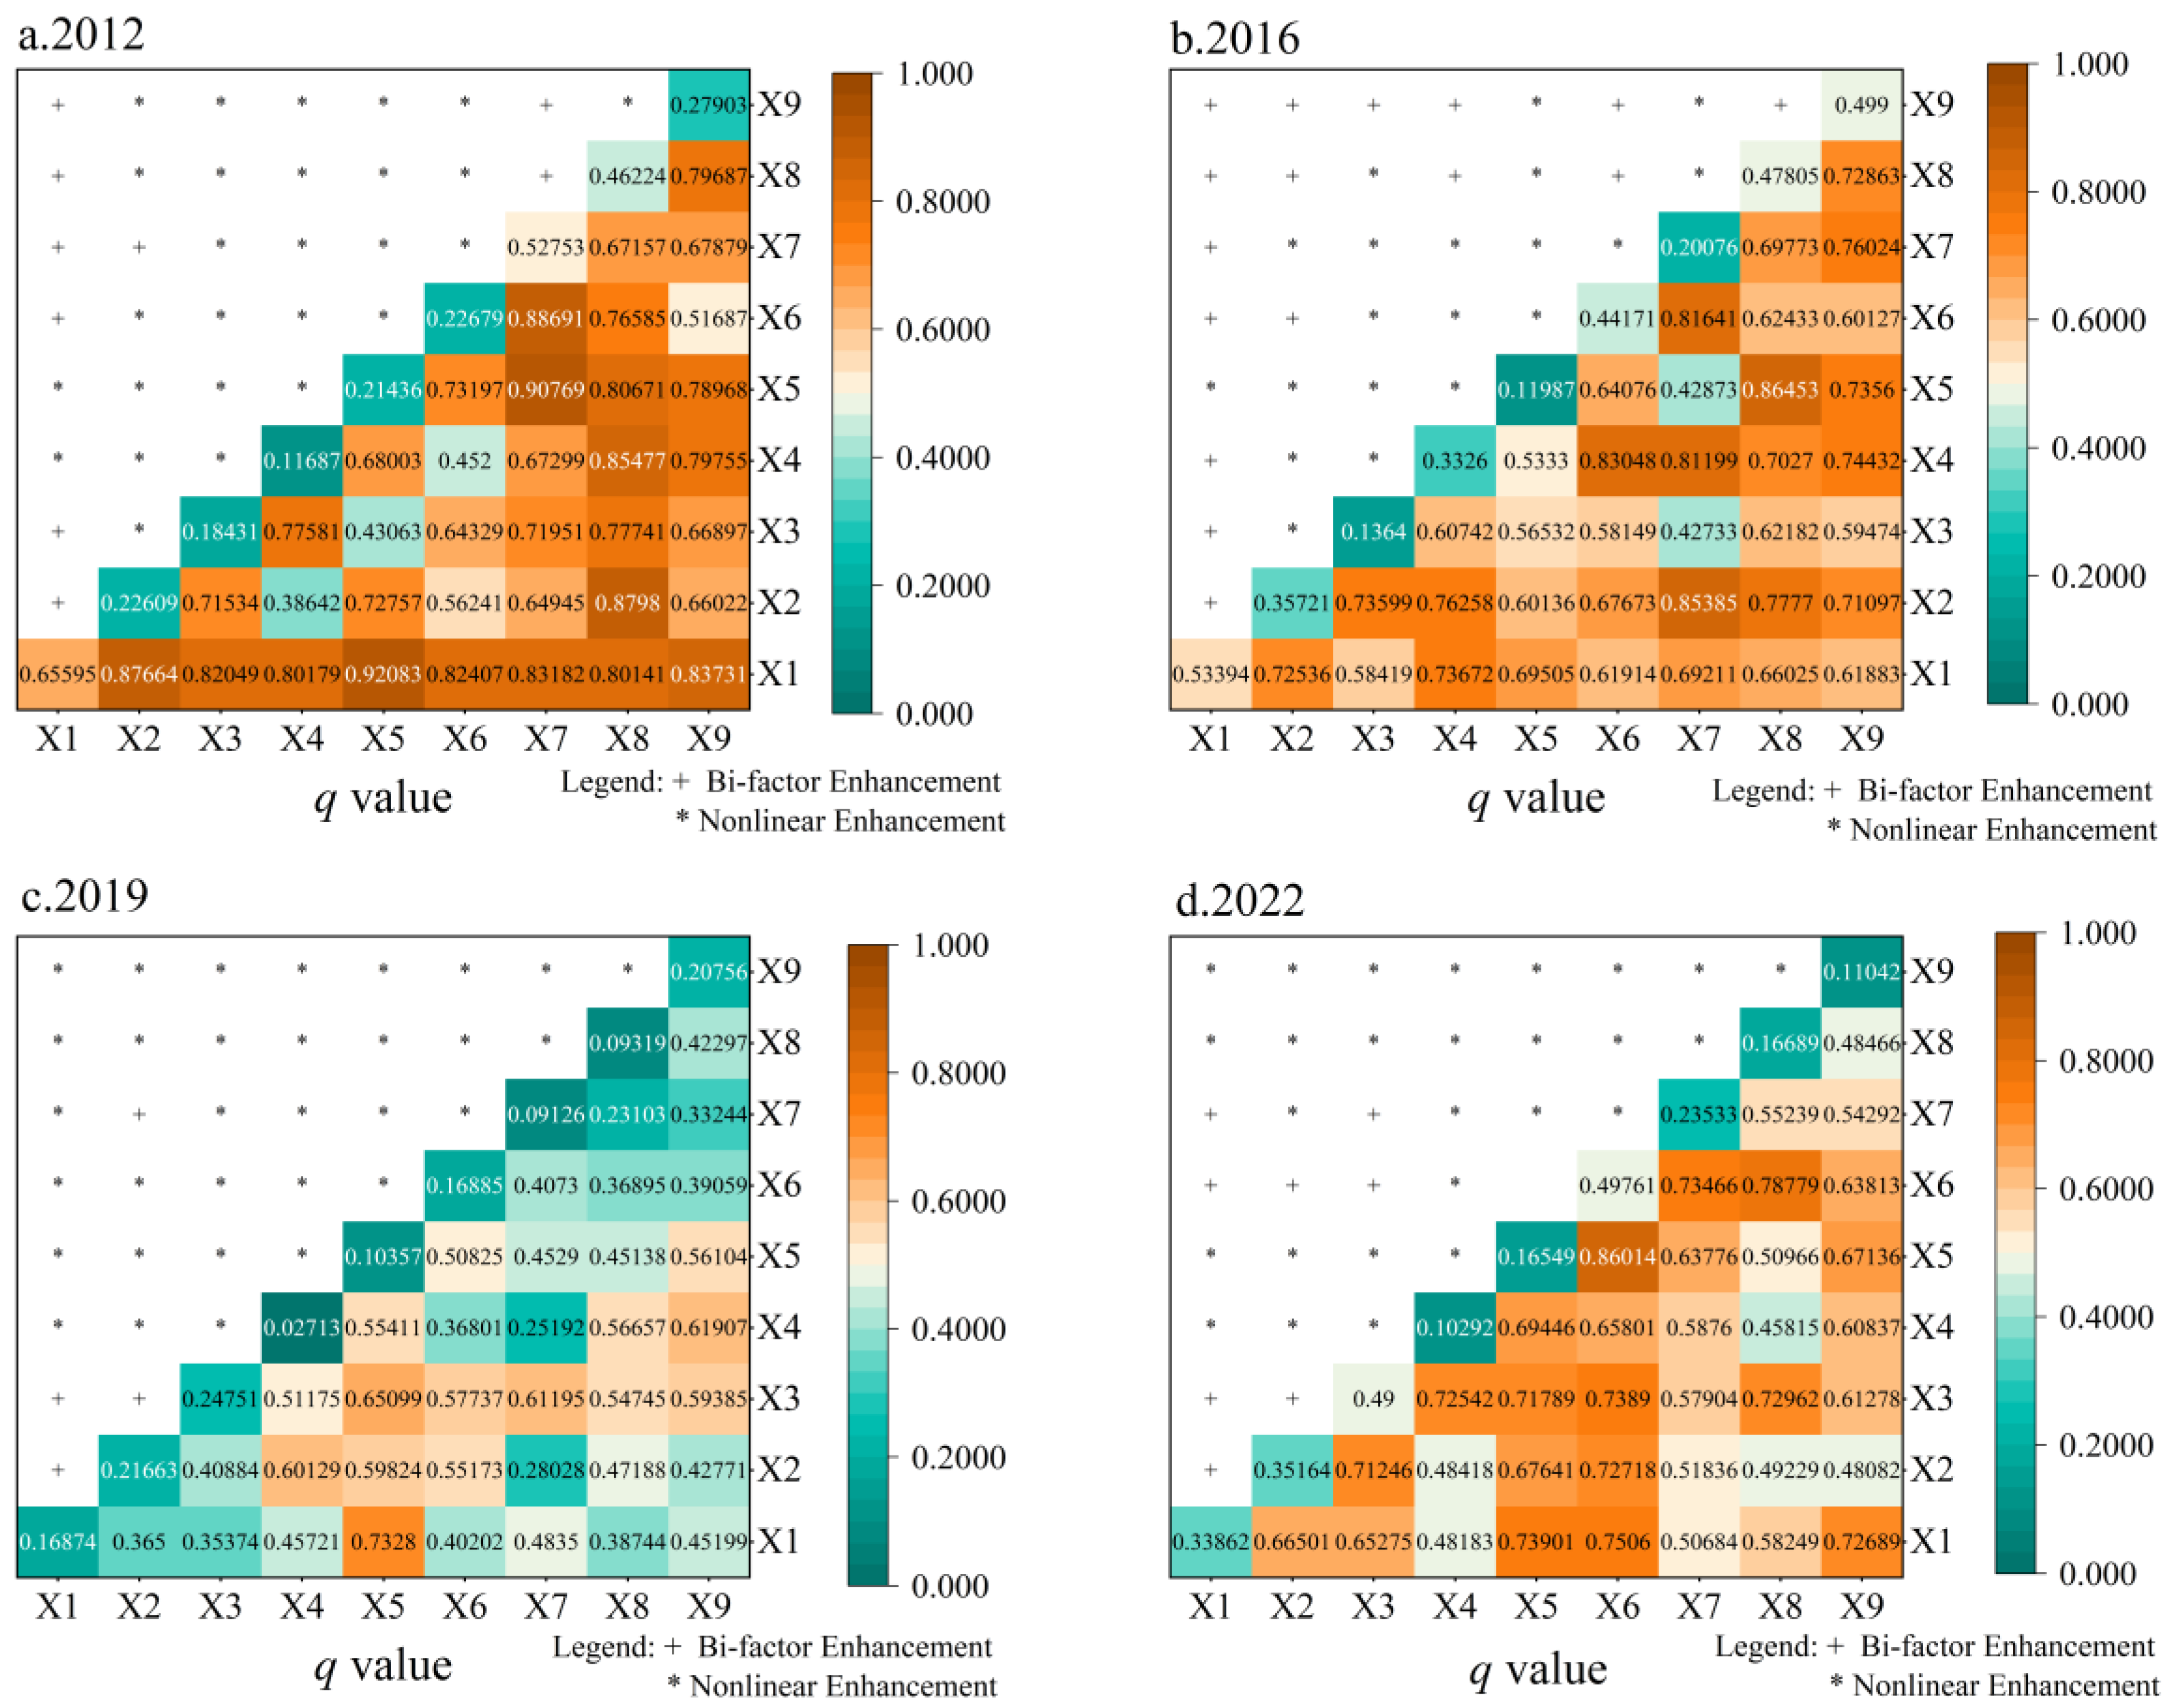
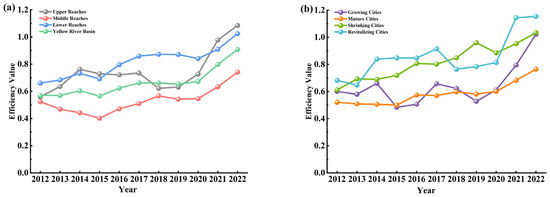
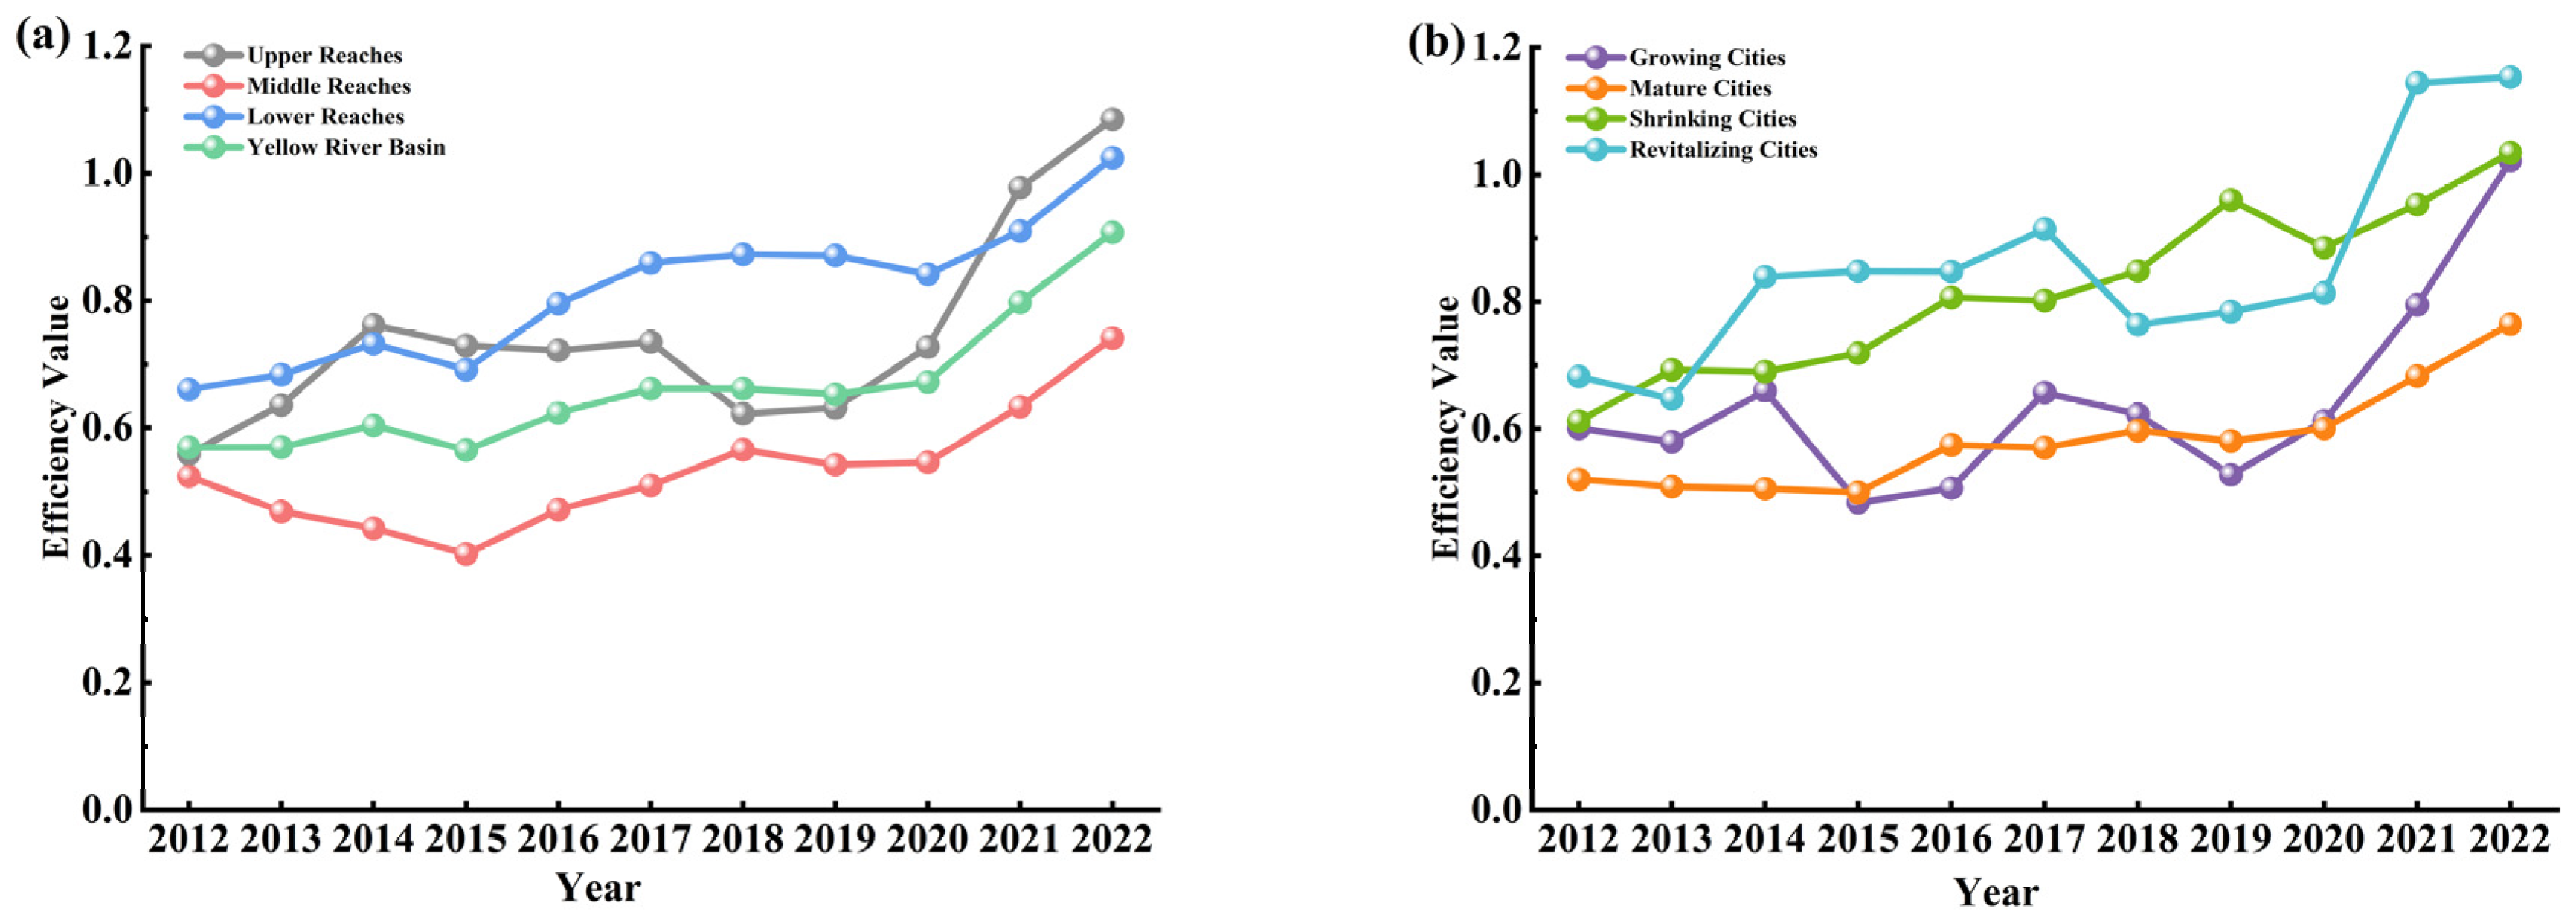
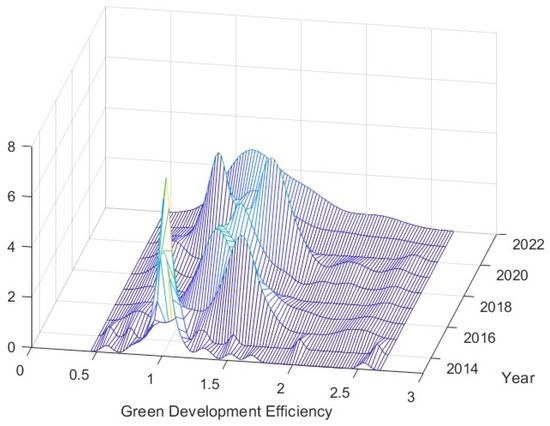
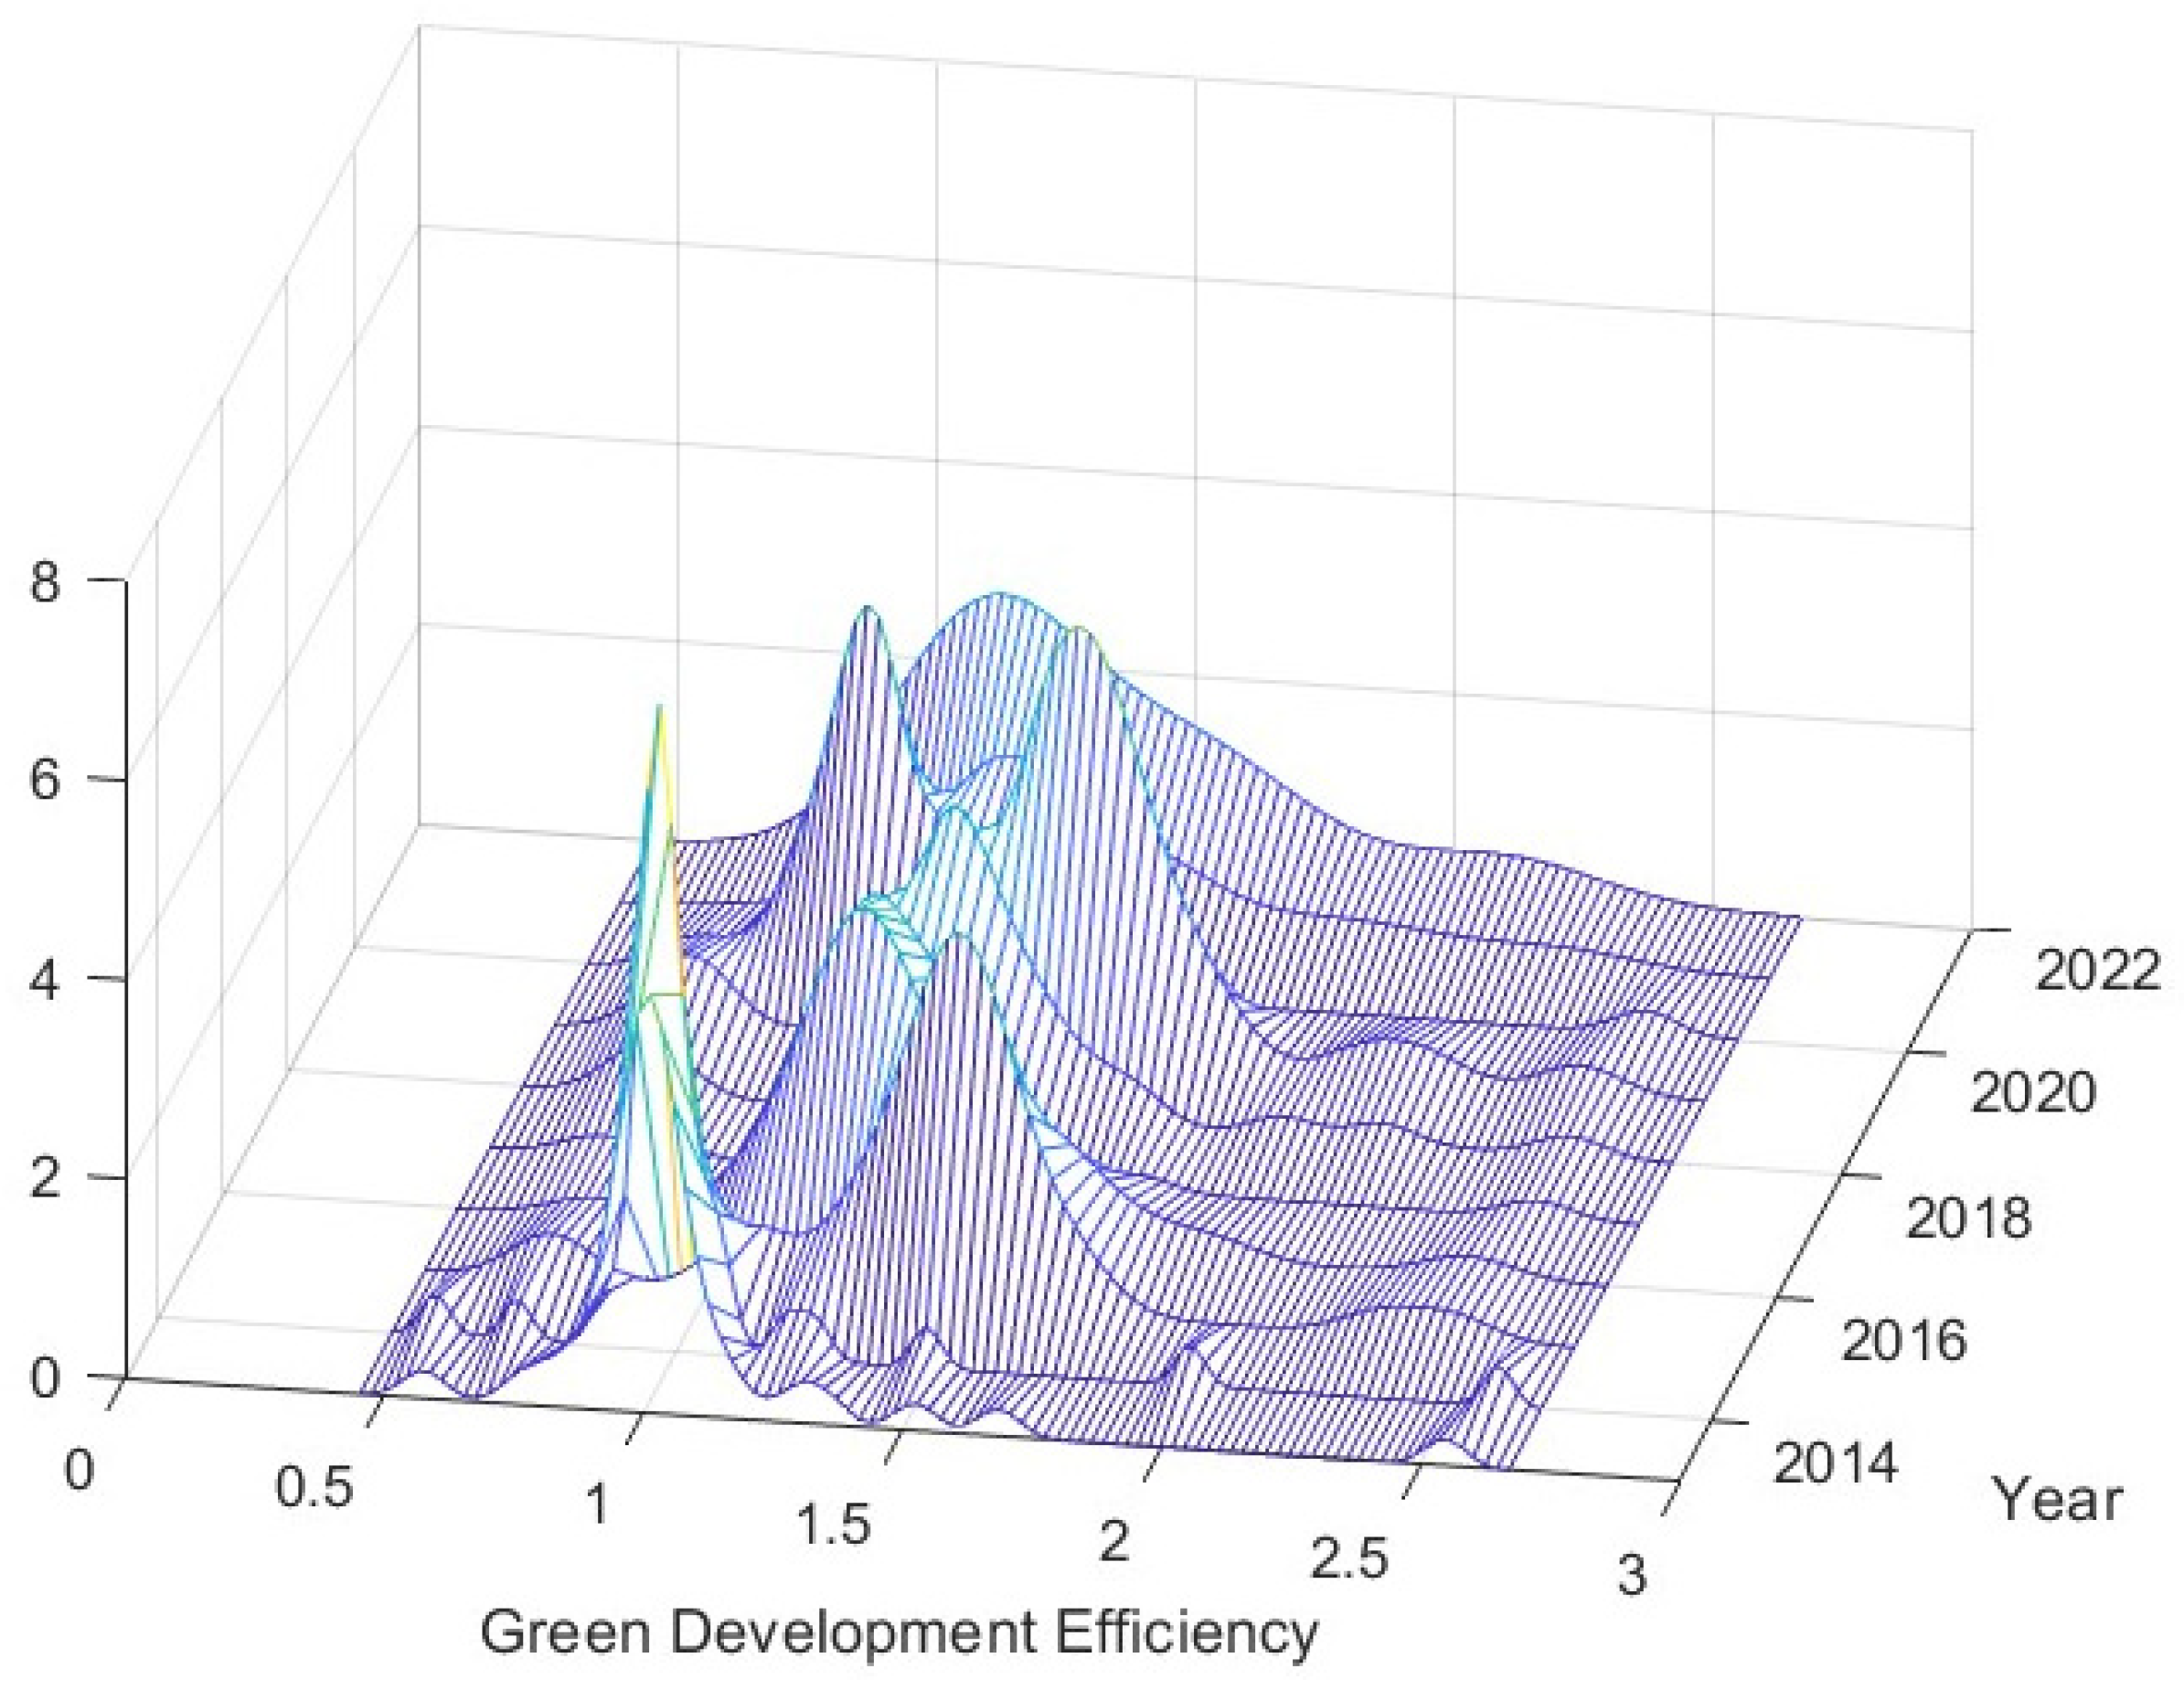
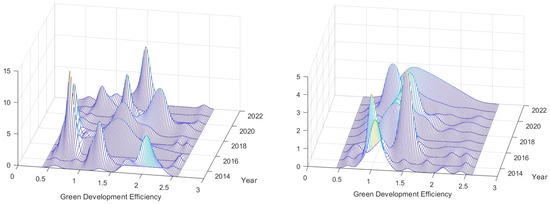
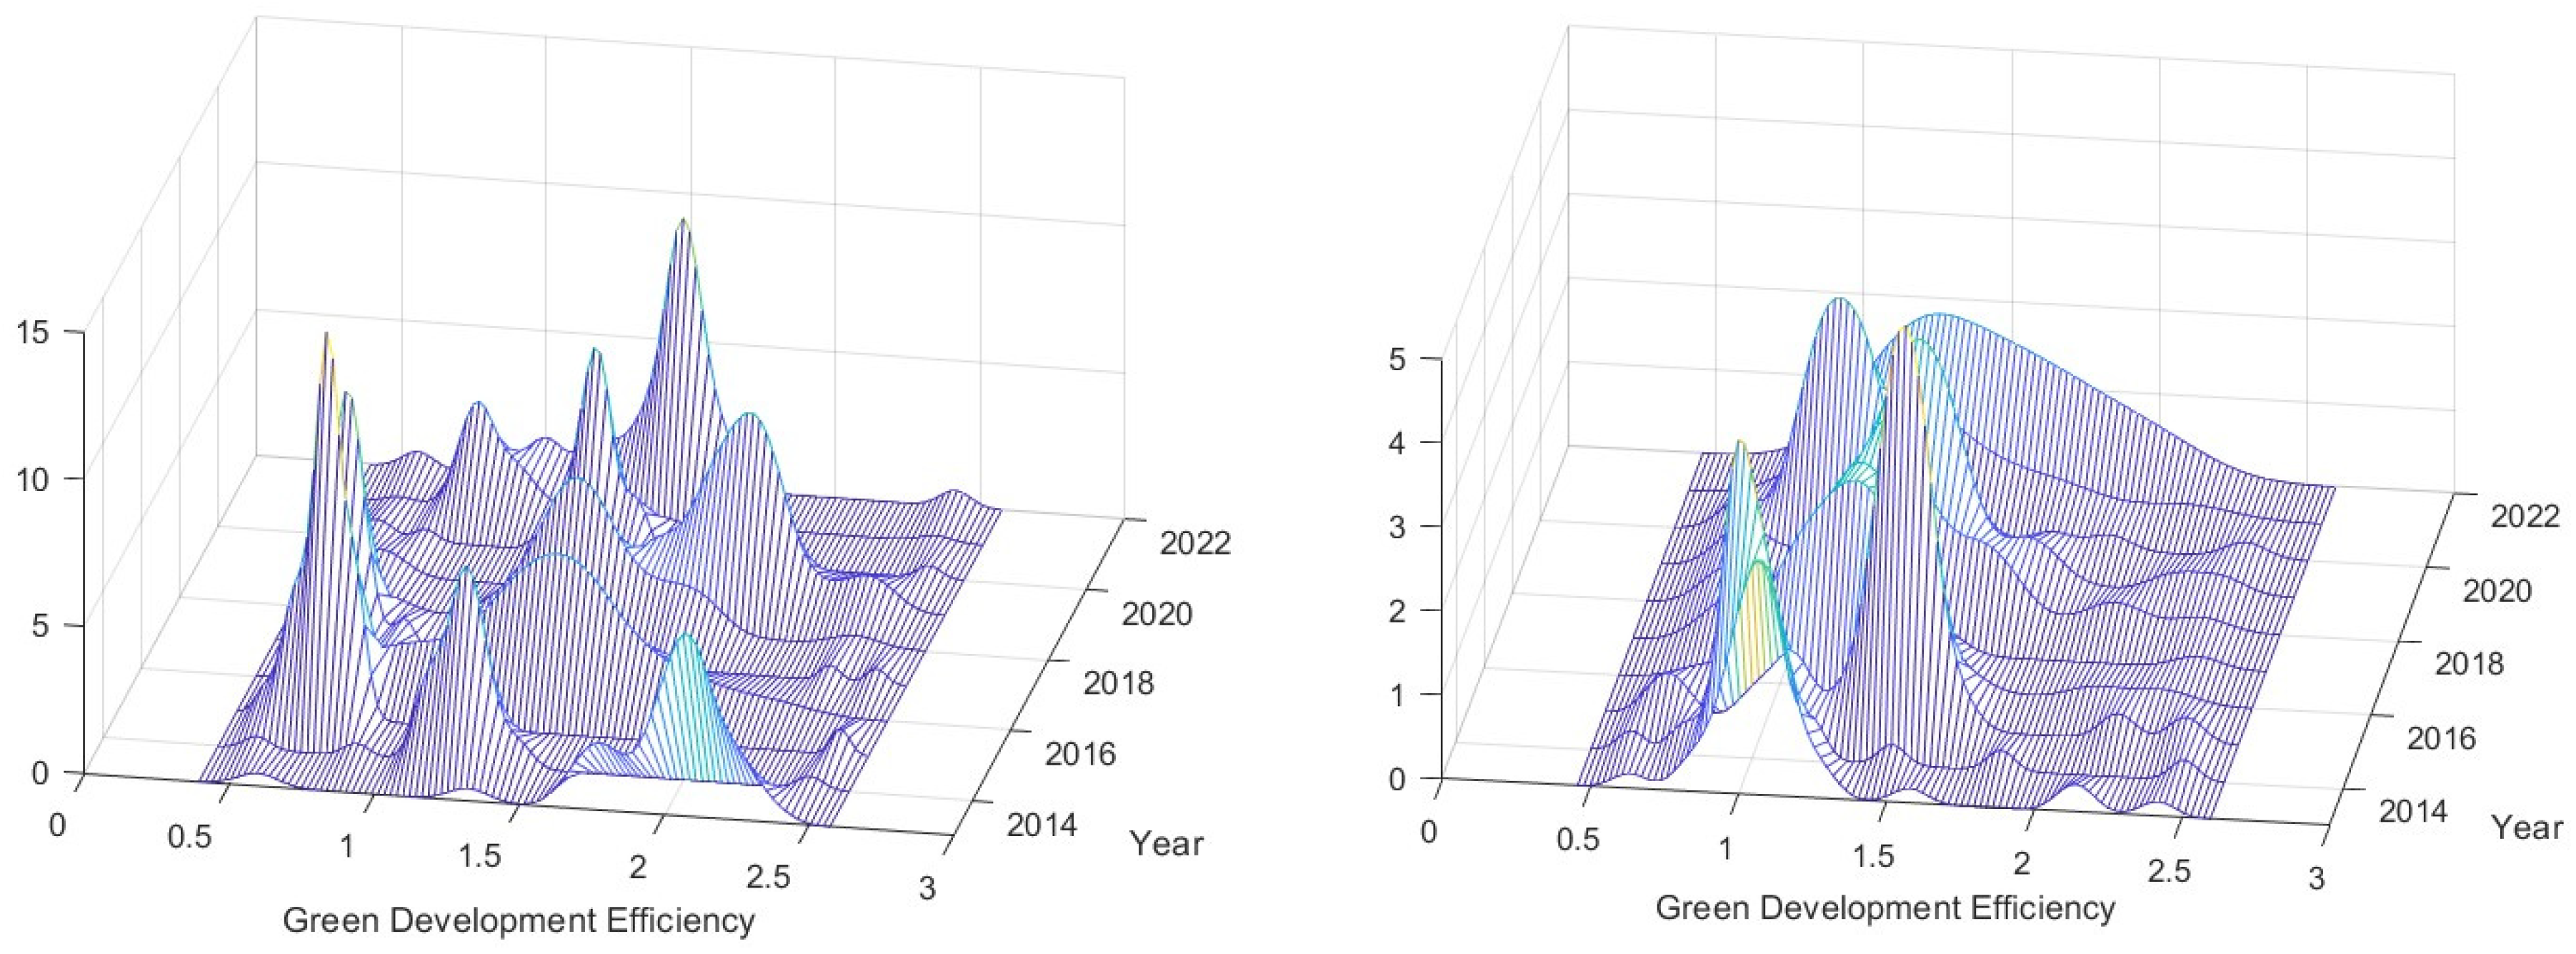

Disclaimer/Publisher’s Note: The statements, opinions and data contained in all publications are solely those of the individual author(s) and contributor(s) and not of MDPI and/or the editor(s). MDPI and/or the editor(s) disclaim responsibility for any injury to people or property resulting from any ideas, methods, instructions or products referred to in the content. |
© 2026 by the authors. Licensee MDPI, Basel, Switzerland. This article is an open access article distributed under the terms and conditions of the Creative Commons Attribution (CC BY) license.