


Abstract
The global output of organic solid residues (e.g., crop straw) is substantial, creating an urgent sustainability need for low-impact pathways that avoid open burning or disposal while recovering renewable energy. Dry anaerobic digestion (AD) offers a water-saving, high-solids valorization route for straw-rich substrates, but its deployment is often constrained by acidification that suppresses methanogenesis, reducing reliability and limiting practical adoption. Here, at laboratory scale, we formulated a co-digestion substrate dominated by wheat straw (50%) with swine manure and household organic waste, and evaluated whether co-supplementation of trace metals (Fe, Ni, Co) can enhance process stability and energy recovery, thereby strengthening the sustainability of high-solids straw treatment. System performance was assessed by pH, biogas production, volatile fatty acids (VFAs), functional genes, and microbial community profiles to elucidate micronutrient effects and microbial responses. Micronutrient addition stabilized pH (minimum 6.5) and enhanced biogas output. Specific yields in the supplemented digester were 260.64 ± 11.83 mL g−1 TS and 319.89 ± 14.27 mL g−1 VS, compared with 220.31 ± 9.45 mL g−1 TS and 270.33 ± 11.72 mL g−1 VS in the control; cumulative gas production was higher by 18.33%. Community analyses showed marked enrichment of Methanosarcina, increasing from 7.28% on day 10 to 44.00% on day 30. Molecular ecological network analysis indicated a transition from a sparse, fragmented configuration to a highly connected, centralized one: the number of nodes decreased from 74 to 70; the number of edges increased from 46 to 223 (a 4.85-fold rise); network density increased from 0.0170 to 0.0923; mean degree increased from 1.24 to 6.37; the number of modules declined from 39 to 5; and the proportion of positive versus negative links shifted from 85%/15% to 70%/30%, evidencing stronger interspecies coupling and functional robustness. Consistently, methyl-coenzyme reductase subunit A gene copy numbers were about 1.60-fold higher on day 30 and about 1.51-fold higher on day 50 than in the control. Overall, Fe-Ni-Co co-supplementation enhances methane potential and suppresses acidification in straw-rich dry anaerobic digestion, providing a low-input and practical strategy to stabilize high-solids systems. By improving microbial robustness, this approach enables efficient renewable energy recovery with reduced water demand and lower risk of process failure, thereby supporting scalable straw valorization and advancing circular bioeconomy pathways for agricultural and organic solid residues.
1. Introduction
Wheat straw is among the most important agricultural residues worldwide. Recent assessments indicate that wheat residues account for roughly 1.25 × 10⁹ t annually—second only to maize and comparable to rice—underscoring both the scale of the disposal challenge and the opportunity for resource recovery [1]. As a major producer and consumer of agricultural products, China ranks near the top in wheat-straw generation; for example, its 2015 output was estimated at 1.40 × 10⁸ t, with approximately 0.91 × 10⁸ t considered technically available for utilization [2]. Although open-field burning has been widely practiced as the simplest and fastest means to remove straw, it wastes valuable biomass and contributes substantially to PM2.5 and greenhouse gas emissions [3]. Consequently, converting large volumes of straw into clean, renewable energy with high efficiency has become a priority [4]. Wheat straw typically contains 30–40% cellulose, 20–30% hemicellulose, and 10–20% lignin. After anaerobic digestion, the relative lignin fraction increases, while cellulose and hemicellulose together can still remain near 50% and may be reused for further biogas production [5]. Compared with aerobic treatments, anaerobic digestion (AD) offers lower energy inputs and sludge yields, valuable biogas as an energy product, and minimal odor due to its closed-system operation [6]. On a solids basis, AD is commonly classified as low (<15%), medium (15–20%), or high (20–40%) total solids (TS). Wet systems generally operate at <15% TS, whereas dry anaerobic digestion (DAD) operates above this threshold; systems exceeding ~25% TS are considered dry and stackable [7,8]. Relative to wet digestion—which requires substantial dilution water—DAD is particularly attractive in water-scarce regions, can achieve higher volumetric production rates, produces less leachate, and yields a fertilizer co-product without an additional drying step [8,9]. These attributes make DAD a feasible and practical option across a wide range of settings.
Process stability remains central to successful DAD. Acetic acid is both a key intermediate and the principal carbon source for methanogenesis [10]. If acetate is insufficient, methane production slows; if excessive, process inhibition and even acidosis can occur [11]. Using straw as the sole substrate increases the likelihood of acidosis, as higher straw fractions in the feed tend to elevate the acetate proportion within the volatile fatty acid (VFA) pool [12]. Reported acetate shares during straw digestion can reach ~46% of total VFAs, whereas systems fed with livestock manure often exhibit ~40% [13]. Co-digestion with livestock manure or household organic waste can therefore help buffer acid accumulation and lower the risk of acidosis. In practice, DAD has been applied more extensively to source-separated single-stream organic wastes than to multi-source mixtures [14,15]. Mono-substrate systems, however, impose additional burdens on waste collection and separation, complicating large-scale deployment. Although co-digestion has gained attention, many studies still consider only binary mixtures [16,17,18]. Technically, AD is mature, yet field implementation often underperforms due to instability in the terminal degradation stage (methanogenesis), where methanogens—owing to slow growth and stringent nutritional requirements—are highly sensitive to environmental fluctuations and deficiencies [19]. A consistent body of evidence shows that optimally dosed trace elements enhance AD performance by improving stability, lowering VFA accumulation, and increasing biogas yields. For instance, iron-amended systems have shown increases in both methane production and productivity [20], and stimulatory effects of additional trace metals can persist even when total metal concentrations are already high [21]. Supplementing Ni (at appropriate concentrations) to chicken-manure digesters has been reported to increase biogas production [19]. Overall, trace quantities of Fe, Ni, and Co are frequently cited as beneficial for methane potential [22,23], and combined supplementation has been proposed to further enhance bioenergy recovery [24].
Against this background, the present study addresses the dual needs of consuming large quantities of wheat straw and reducing the risk of acidosis by co-digesting straw with swine feces and household organic waste, while replenishing Fe, Co, and Ni to accelerate digestion and stabilize the process. Specifically, the objectives of this study aimed to determine (1) the feasibility of dry anaerobic digestion (DAD) with micronutrient supplementation for resource recovery from straw and other typical rural mixed organic wastes; (2) quantify how micronutrients mitigate acidification and improve biogas performance during DAD of mixed substrates; and (3) elucidate the response mechanisms of methanogenic communities to micronutrient amendment.
2. Materials and Methods
2.1. Feedstock Sample Preparation
The feedstock, including household organic trash and agricultural waste (straw stalk and swine feces), was collected in Shenzhou City, Hebei, China. The straw stalk was air-dried and smashed to particles with a diameter of 1–2 cm by a pulverizer. The swine feces were dried in a cool place and avoided direct sun exposure until its moisture dropped to 60%. All samples were stored at a temperature of −20 °C. The substrate mass ratio of 2:1:1 (straw:swine feces:household waste) was selected to mitigate the risk of acidosis and provide a more favorable fermentation environment. This ratio yields a mixture containing 50% wheat straw with an overall C/N ratio of approximately 24, which lies within the range considered suitable for anaerobic digestion, while still representing a high-straw scenario relevant to rural straw management [21]. Before use, the straw stalk was pre-treated with 0.5% urea for ammonification for 5 days. The initial feedstock content was 800 g, which contained 400 g of straw stalk, 200 g of swine feces, and 200 g of household trash, and was fully stirred before using. The anaerobic inoculant was taken from the Gaobeidian Wastewater Treatment Plant (Baoding, Hebei Province, China) and domesticated with the pre-treated waste sample for 30 days at a temperature of 35 ± 1 °C. The inoculum percentage was 40% of the feedstock wet weight. Preliminary measurements showed that the unadjusted mixture had a slightly acidic pH (below the optimal range for methanogens; pH around 6.3), so the deionized water was added to make total solid to be 25%, and the initial pH was adjusted to 7.3 (Table 1).
Table 1.
Experimental raw material characteristic.
2.2. Experimental Design
Batch dry anaerobic digestion experiments were conducted in sealed laboratory-scale fermentation flasks placed in a water bath at 35 ± 1 °C. For each run, 800 g of the mixed feedstock described in Section 2.1 (400 g of wheat straw, 200 g of swine feces, and 200 g of household organic waste) and acclimated inoculum corresponding to 40% of the feedstock wet weight were loaded into the flask. Deionized water was then added to adjust the total solids content to 25% and the initial pH to 7.3. Two digester conditions were set up: (i) a control digester without trace element addition and (ii) a trace element-supplemented digester, in which Fe-Ni-Co solution was added via the recirculated leachate. Because the high-solids mixture limits mass transfer, leachate was withdrawn from the bottom of each flask every two days, mixed with 1 mL of the Fe-Ni-Co trace element solution (treatment) or 1 mL of deionized water (control), and sprayed back onto the surface of the solid feedstock. The solution of trace element supplementation was prepared following the table below, and the well-mixed trace elements solution contains Fe 8.0 g/L, Co 0.8 g/L, and Ni 1.6 g/L (Table S1). The Fe-Ni-Co concentrations in the trace element solution were selected based on ranges reported to be beneficial for anaerobic digestion in previous studies [20,21,24,25] and kept below levels associated with inhibition or toxicity. After each operation, the headspace was purged with N2 for 10 min to maintain anaerobic conditions. The fermentation proceeded for 60 days, and sampling and analytical procedures are described in Section 2.3, Section 2.4 and Section 2.5.
2.3. Gas Production Measurement
The volume of biogas produced from each digester was measured once every 24 h using a calibrated drum-type wet gas meter (Milligascounter MGC-1, Ritter, Winnweiler, Germany). Before each experimental run, the meter was calibrated with a known volume of air delivered by a precision syringe to ensure measurement accuracy. The biogas composition (CH4, CO2, and N2) was analyzed using a gas chromatograph (GC-2010, Shimadzu, Kyoto, Japan) equipped with a packed column (Porapak Q, 2 m × 3 mm i.d., Shimadzu) and high-purity N2 as the carrier gas at a flow rate of 30 mL·min−1. The injector, column, and detector temperatures were set at 100 °C, 50 °C, and 150 °C, respectively. A thermal conductivity detector (TCD) was used for quantification. The leachate was collected every four days and centrifuged at approximately 7200× g, then the pH of the supernatant was measured and recorded. Agilent-1260-HPLC (Agilent Technologies, Santa Clara, CA, USA) was adopted for the concentrations of the supernatant filtered by 0.45 μm filter membranes. The chromatographic conditions were the column, Athena C18-WP (2.1 × 150 mm, 3 μm, ANPEL Laboratory Technologies (Shanghai) Inc., Shanghai, China); mobile phase, 0.1% phosphoric acid; flow rate, 0.2 mL/min; injection volume, 5 μL; column temperature, 35 °C; and detection wavelength, 210 nm [21]. During the fermentation, a 3-layer rotating solid sampler (Bürkle GmbH, Bad Bellingen, Germany) was used to take the solid sample every 20 days and stored with liquid nitrogen. All specific biogas yields reported below are calculated on a per-gram TS (added) and per-gram VS (added) basis.
2.4. Microbial Determination and Analysis
Microbial genomic DNA was extracted immediately after sampling with the Water DNA Kit (OMEGA, Norcross, GA, USA) and further purified using the AxyPrep DNA Gel Extraction Kit (Axygen, Tewksbury, MA, USA). DNA was stored at −80 °C. Shotgun libraries (~350 bp inserts) were prepared and sequenced on an Illumina platform to generate PE150 reads (San Diego, CA, USA). Raw reads were adapter/quality-trimmed with fastp. Taxonomic profiles were inferred using Kraken2 (v2.1.5) with Bracken (v3.1) against the Genome Taxonomy Database (GTDB; release 10-RS226, 16 April 2025), which resolves archaeal lineages including methanogens. For functional evidence, reads were assembled with MEGAHIT (v1.2.9); open reading frames were predicted using Prodigal and searched against KEGG Ortholog HMMs with KOfamScan to identify methanogenesis markers (e.g., mcrA K00399, mcrB K00400, mcrG K00401; mtrA–H; hdrA–C). Read counts were obtained by mapping quality-filtered reads back to ORFs and normalized to TPM. Methanogen presence/abundance was reported when GTDB-based archaeal assignments co-occurred with mcrA detection. Quantitative PCR of methanogens targeted the methyl-coenzyme reductase subunit A gene (mcrA) using primers mlas (5′-GGYGGTGTMGGDTTCACMCARTA-3′) and mcrA-rev (5′-CGTTCATBGCGTAGTTVGGRTAGT-3′) [26]. Each 20 µL SYBR Green reaction contained 0.4 µM of each primer and ~1–10 ng template DNA [27]. Cycling conditions were 95 °C 3 min; 40 cycles of 95 °C 15 s, 55 °C 30 s, and 72 °C 30 s; followed by melt-curve analysis to confirm specificity [28]. Absolute copies were calculated from 10-fold plasmid standards; runs were accepted only if efficiency was 90–110% and R2 ≥ 0.99. All samples were measured in technical triplicate and, where applicable, normalized to DNA mass.
2.5. Statistical Analysis
To explore the co-occurrence patterns of methanogens under the influence of trace elements, we inferred molecular ecological networks using the MENAP framework based on random matrix theory (RMT) [29]. Prior to network construction, species present in more than 20% of the samples and with a relative abundance ≥ 0.01% were retained. The resulting species-based molecular ecological networks were constructed in MENAP, and global/topological attributes (e.g., modularity and standard network metrics) were calculated [30]. Other variables, such as methane production, were analyzed using IBM SPSS Statistics 24.0 (IBM, Armonk, NY, USA). Group differences were evaluated by one-way ANOVA, with statistical significance set at p < 0.05.
3. Results
3.1. pH Changes in Anaerobic Digestion Systems
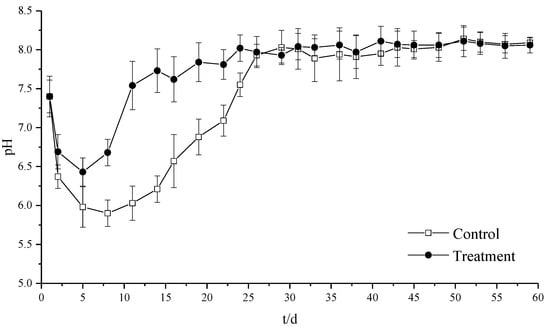
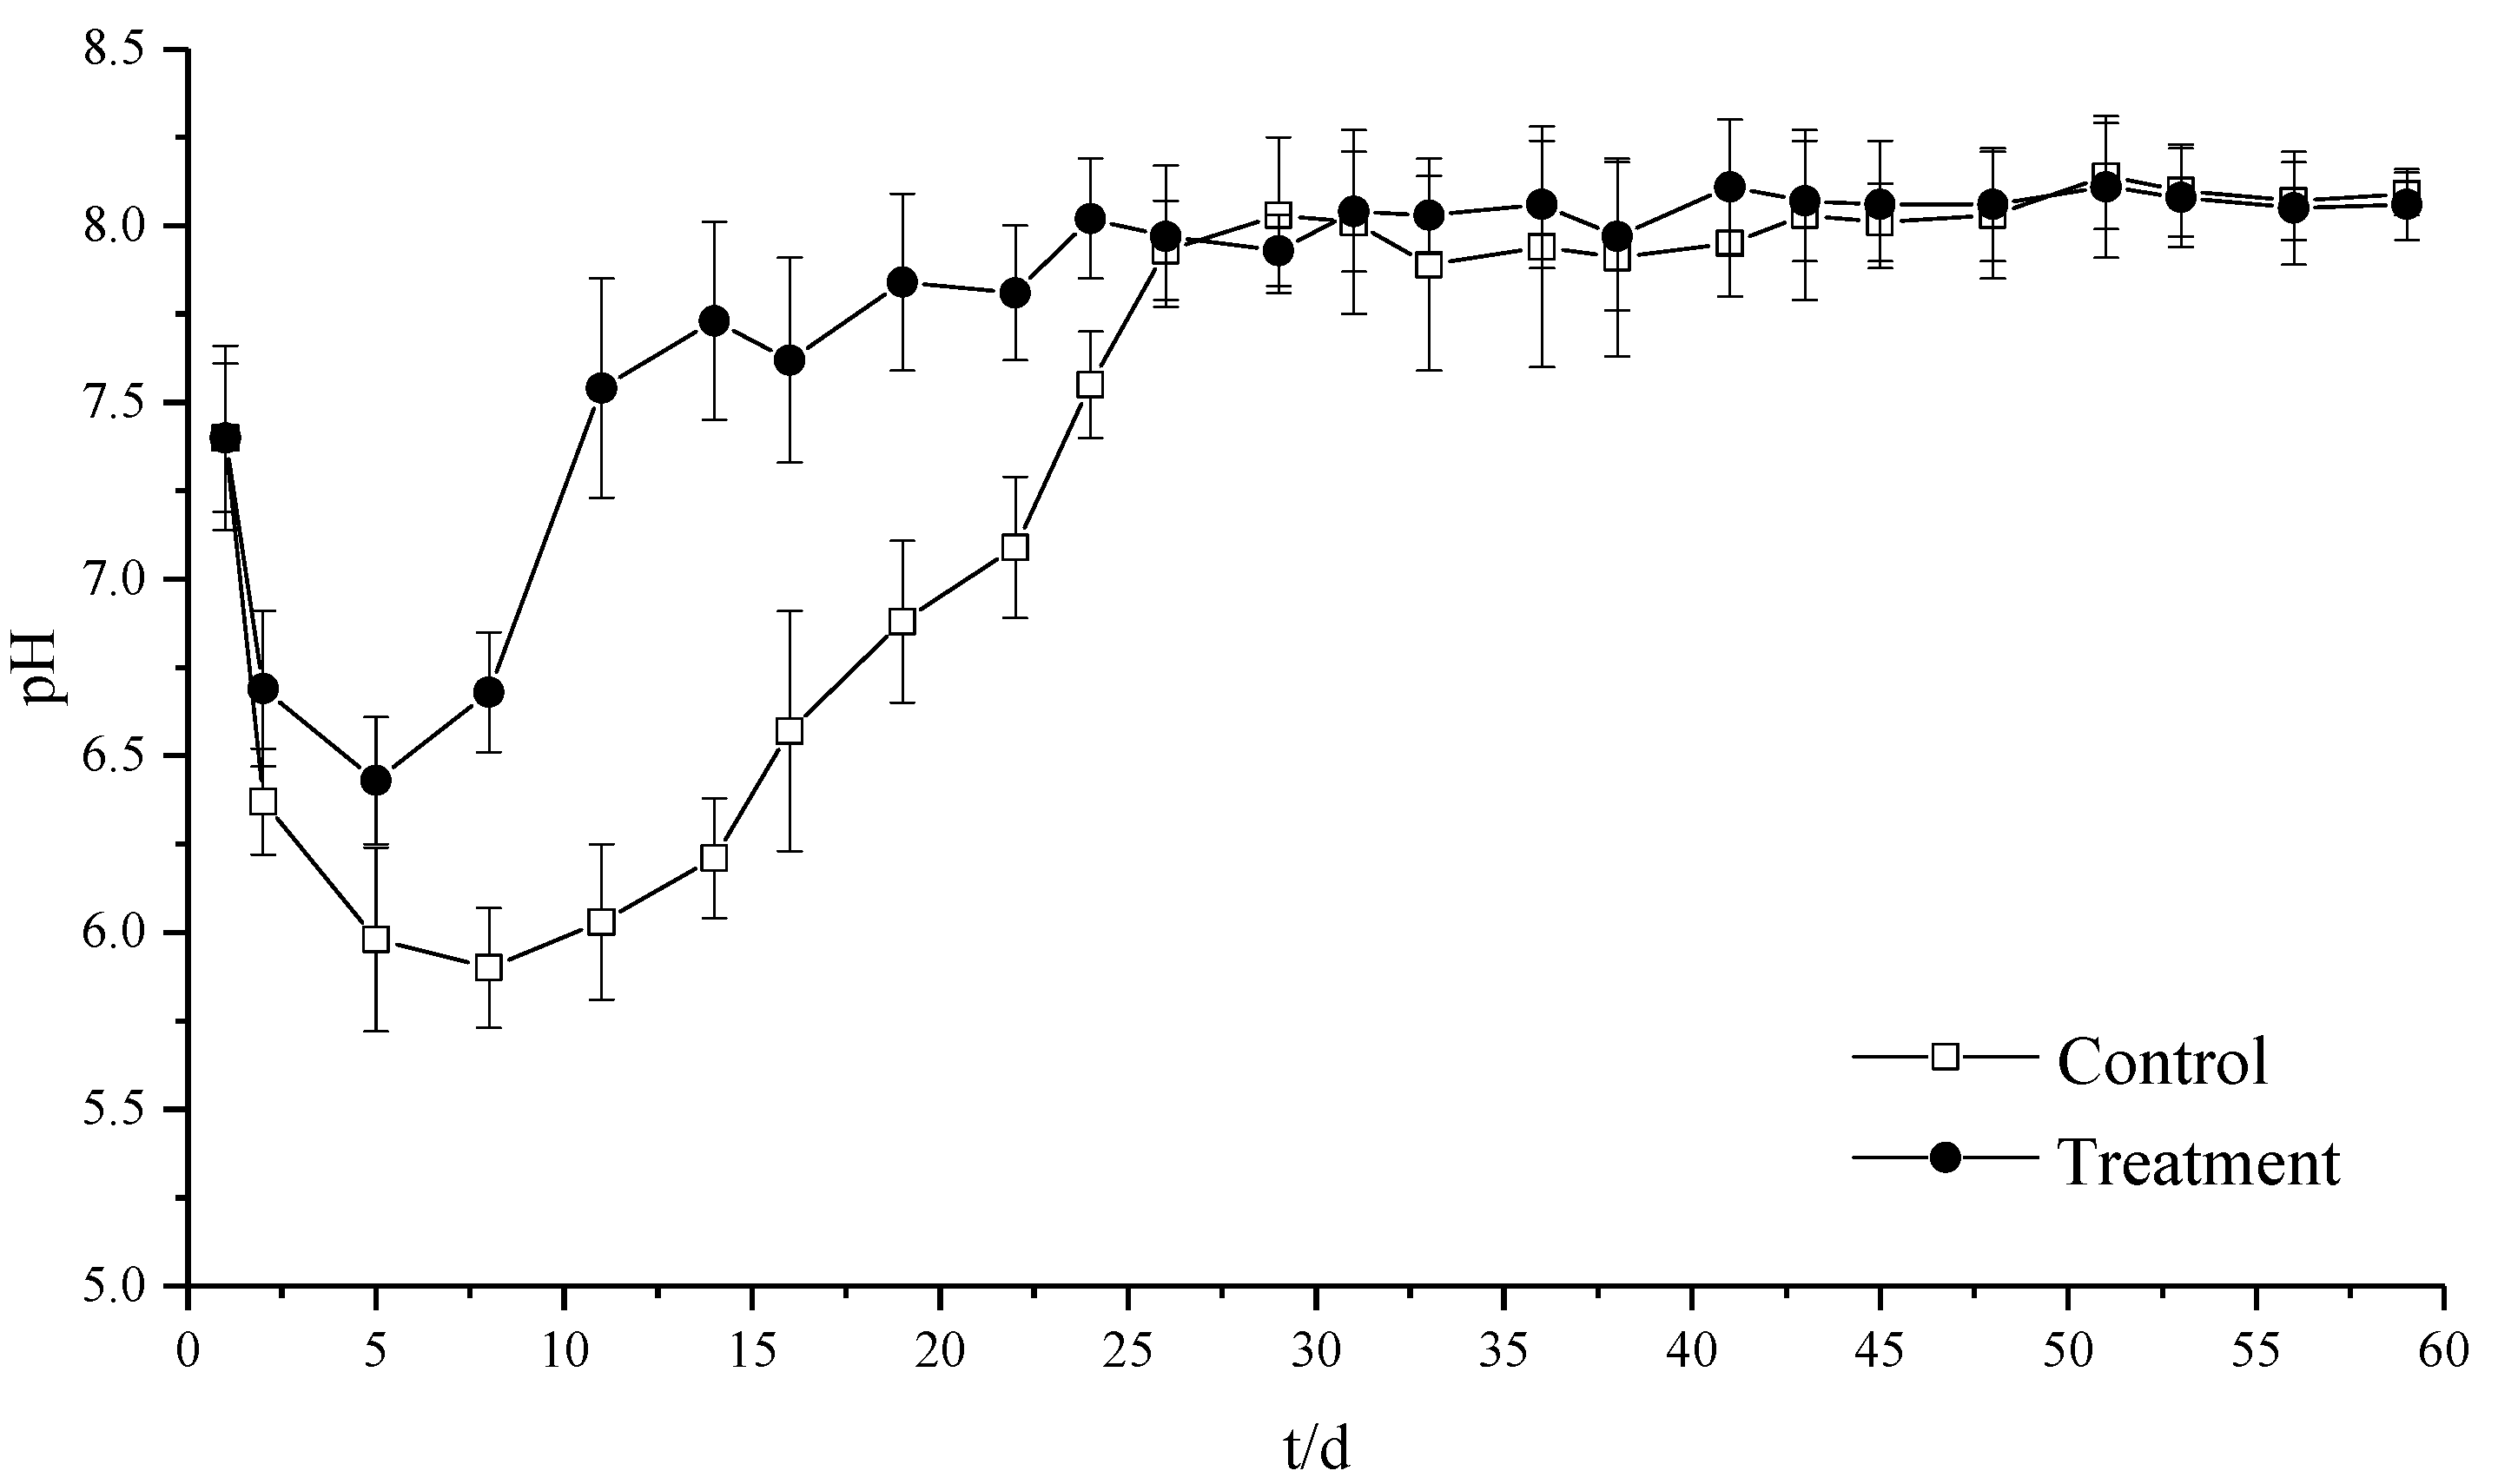
pH is a critical parameter for methane production because methanogens is sensitive to pH, and the optimal pH is between 6.5 and 8.0 [31]. Although the intermediate derivative, ammonia, can neutralize hydrogen ions and the methanogenesis process also consumes protons, the overall system has a decreasing pH trend when there remain plenty of input materials. However, as the input materials are reducing, and no more inputs are added, the system pH will finally increase to alkalescence. As Figure 1 shows, the pH of both groups decreased rapidly in the first 5 to 10 days of the experiment, then increased slowly, and finally reached a steady pH around 8.0. As for the control group, it had a larger pH variation, dropped faster, and increased more slowly (p < 0.05). It took almost 8 days for the control group to reach its lowest pH (~5.8), where the system is already inhibited, while the treatment group hit the bottom pH around 6.5 on the day 5. The treatment group had its pH back above 7.5 on day 11, while the control group took 24 days to increase its pH to 7.5.
Figure 1.
pH changes in the two groups over time (control: 7.42 ± 0.20; treatment: 7.77 ± 0.19).
3.2. Gas Production
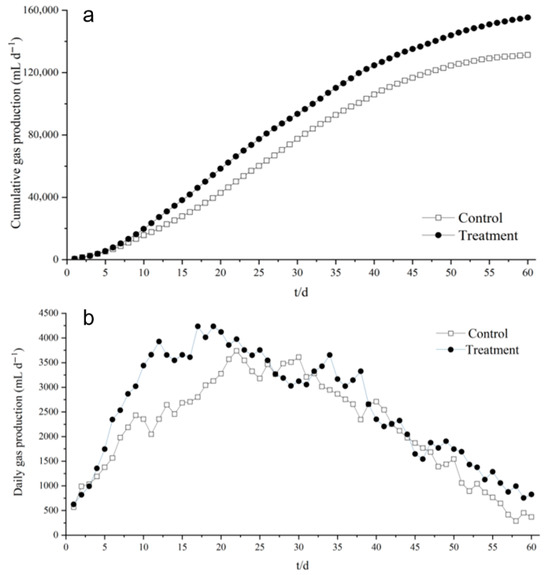
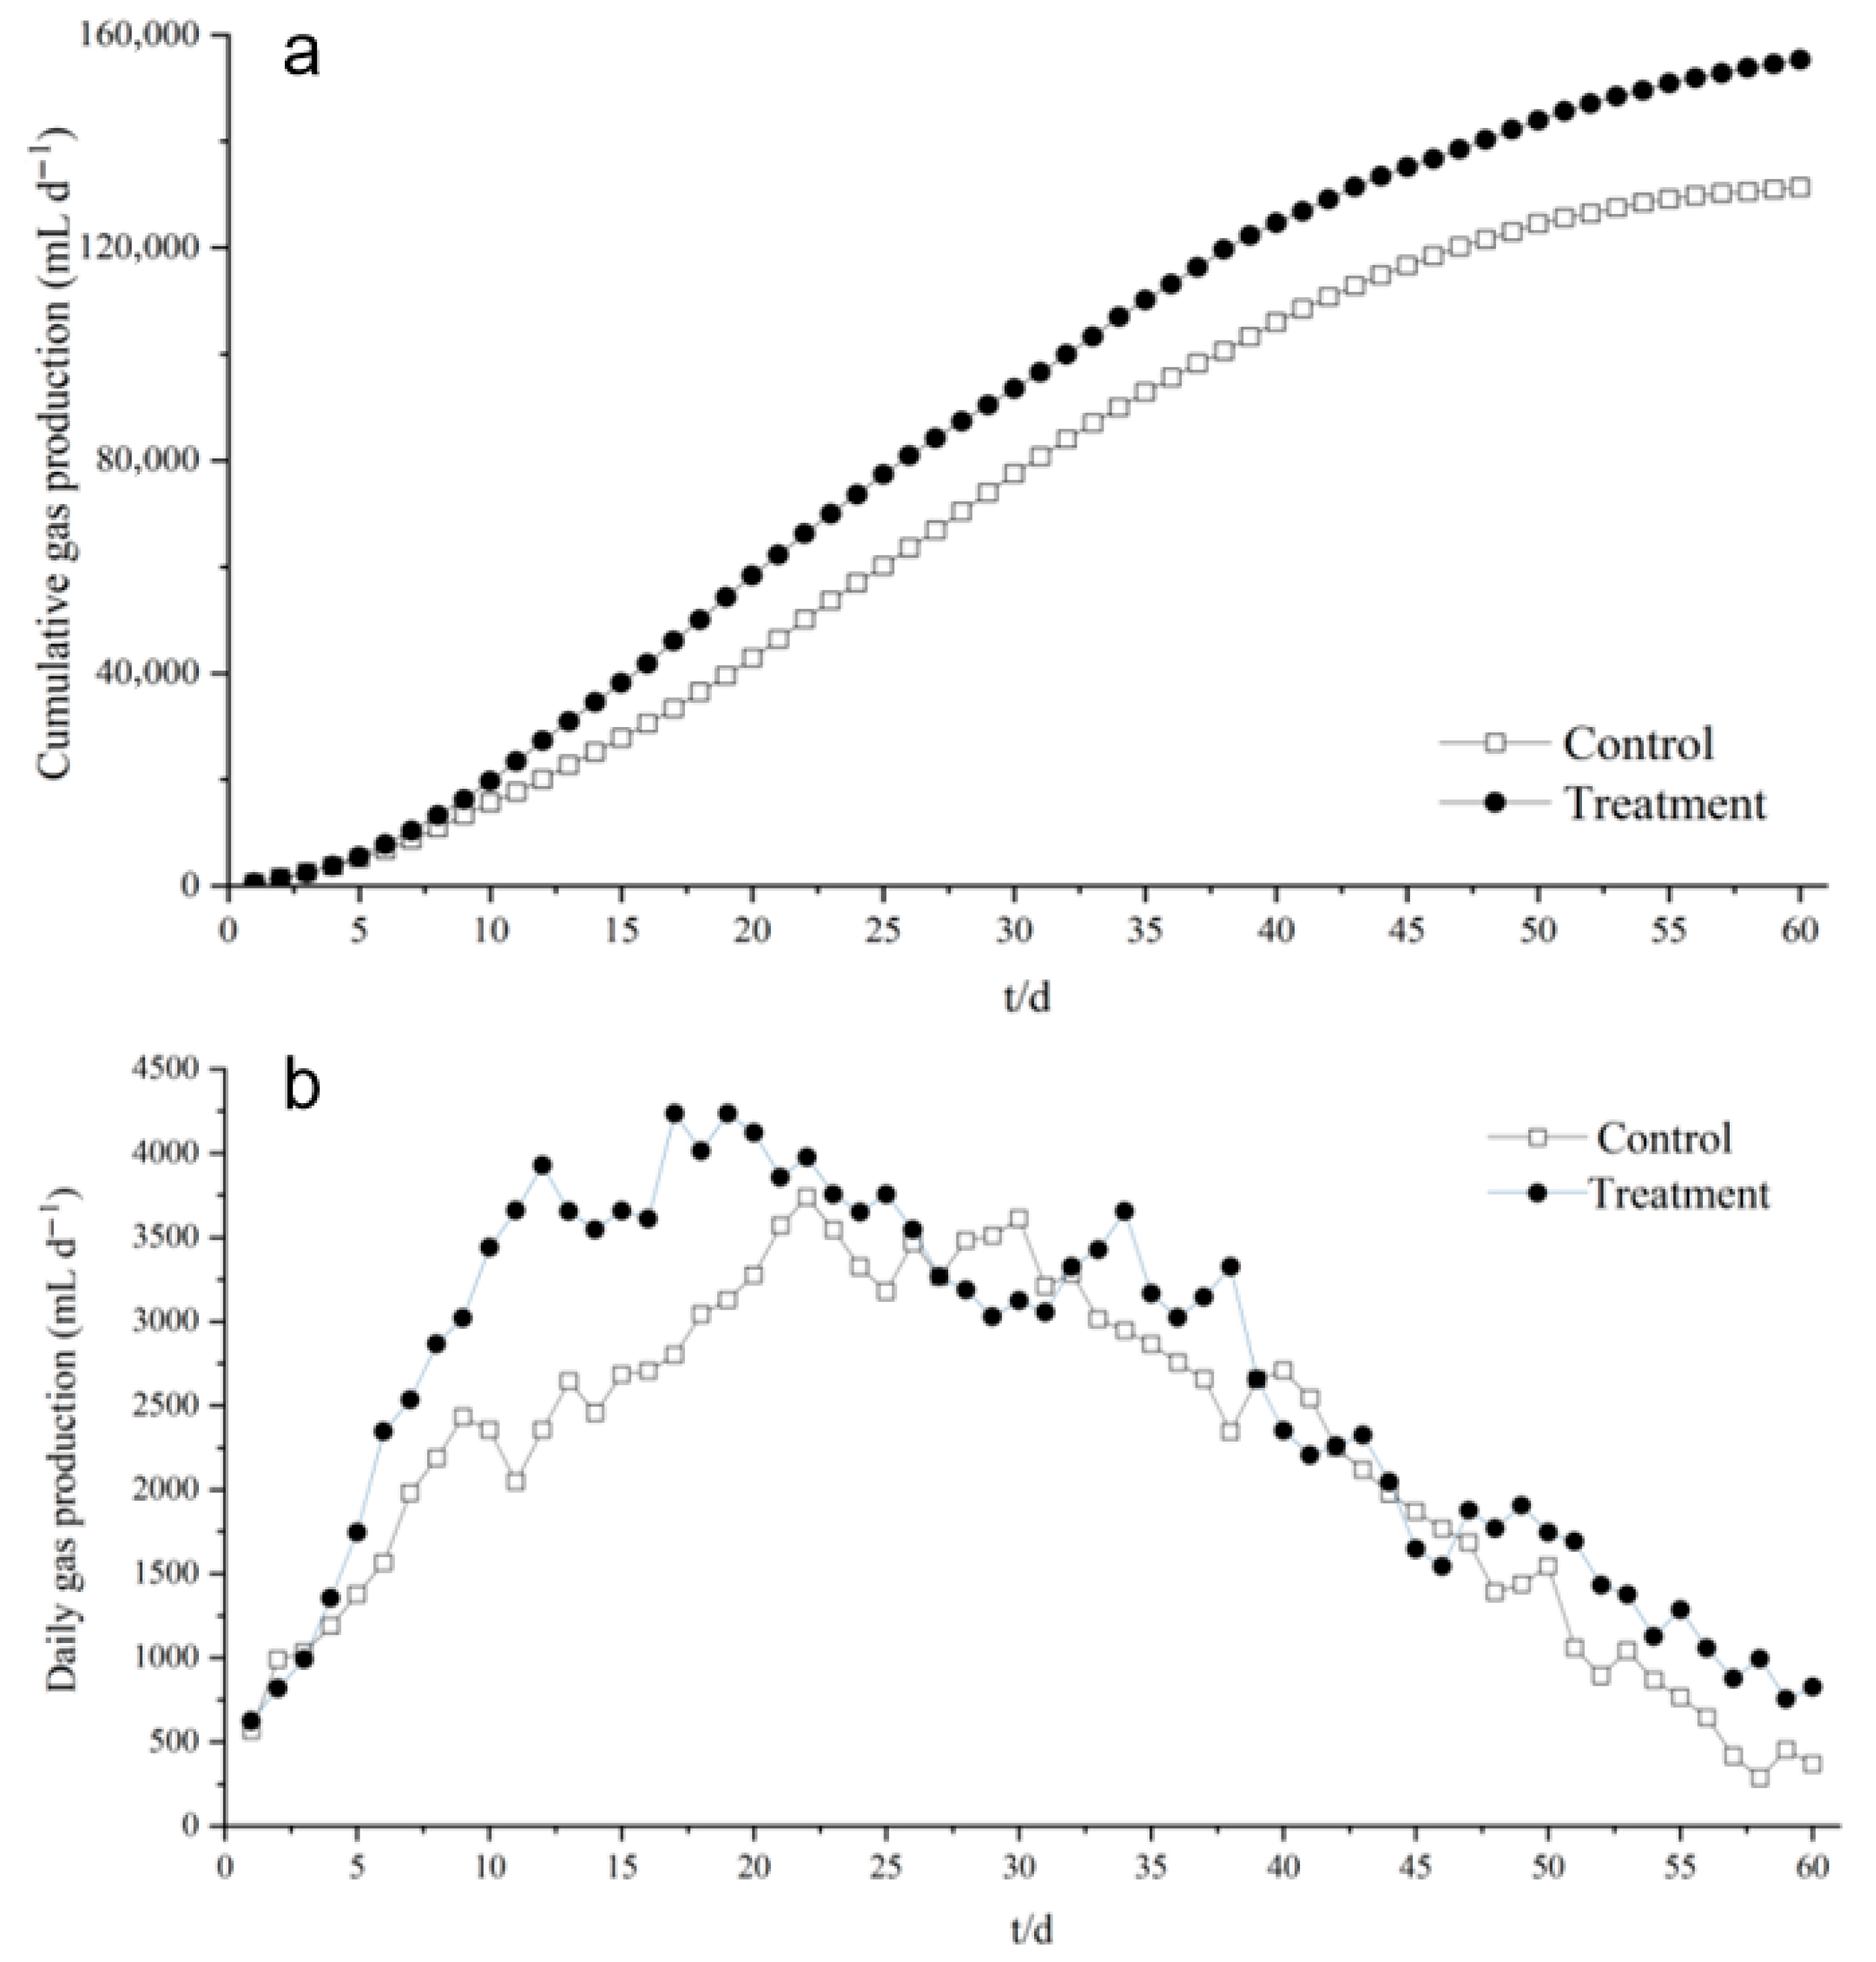
Because methane is the desired final product and both methane and carbon dioxide are the main components emitted from the system, we measured the cumulative gas production and the daily gas production rate to find out the impact of the trace elements on the dry anaerobic fermentation. Figure 2a indicates that the treatment group always had the larger gas production amount than the control group. At the end of the experiment, though the system was still producing the gas, the daily gas production was very low because the fermentation entered the death phase. The total amount of gas production was 155,385 ± 6800 mL for the treatment group and 131,312 ± 5900 mL for the control group, so the treatment group was 18.33% more than the control group. The conversion rate of the control group was 220.31 ± 9.45 mL/g TS and 270.33 ± 11.72 mL/g VS, while the treatment group had the conversion rate of 260.64 ± 11.83 mL/g TS and 319.89 ± 14.27 mL/g VS. Especially, the cumulative biogas yield in the trace element-supplemented digester (260.64 ± 11.83 mL/g TS (added)) was significantly higher than that in the control (220.31 ± 9.45 mL/g TS (added), p < 0.05). Thus, the supplementation of trace elements greatly improved the system potential of bioenergy recovery. Figure 2b records daily gas production of two groups. The rates of gas production in two groups both increased first and then decreased, which matched with the fermentation pattern. However, the treatment group reached the first peak of daily gas production on day 12 with an amount of 3927 ± 180 mL and reached the second peak on day 19 with a daily amount of 4234 ± 195 mL. The control group had its highest daily gas production on day 22 with an amount of 3738 ± 170 mL. On the last day of the experiment, though the system was still producing the gas, the daily amount was so small which indicated the fermentation went to the death phase. The gas production boost from day 10 to day 25 in the treatment group and from day 18 to day 32 indicates more bacteria were working on methanogenesis because methanogenesis is the main step to produce the biogas. On the one hand, pH recovery benefited from methanogenesis, because the methane production consumes acids. The less acidic the environment is, the better for the methanogenetic archaea to grow. The time lag between the treatment group and the control group indicates the positive effect of the trace elements on the system. In addition, the methane content of the produced biogas was determined periodically, which is typical for biogas used for combined heat and power generation (Figure S1). Overall, the treatment maintained consistently higher methane fractions than the control throughout the 60 d digestion. In the treatment, the methane content started at approximately 35%, increased rapidly to about 60% within the first 10 d, and reached ~65% around 15–20 d; thereafter, it remained relatively stable between 64% and 67%, with only minor fluctuations. In contrast, the methane content in the control remained near 30% before ~5 d, then gradually increased to a maximum of ~55% at around 30–35 d, followed by a slight decline and fluctuations around 50% toward the end of the run. These results indicate that the supplement of the trace elements markedly increased the methane fraction and, thus, the quality of the produced biogas.
Figure 2.
Gas production of the two groups over time: (a) cumulative gas production, (b) daily gas production.
3.3. The Component Concentrations of VFAs
VFA concentration is another important parameter of methane production during the anaerobic fermentation. VFAs, as intermediate products, also work as the substrate for methanogenesis. Compared to non-methanogenetic archaea, methanogens have a higher requirement to the environment. If there is an environmental change, methanogenesis is easily affected, less methane will be produced, and more VFAs will accumulate. What is worse, the VFA accumulation will further acidize the environment, make it worse for methanogens to grow, and slow down the methane production rate. To some extent, VFA concentration corresponds to the efficiency of the methane production. So, monitoring the concentration of VFAs is essential when designing the system.
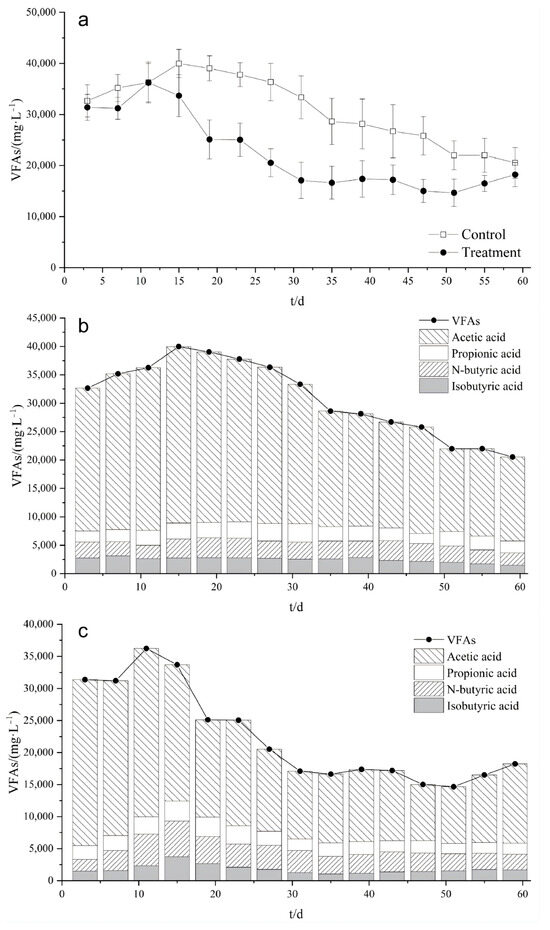
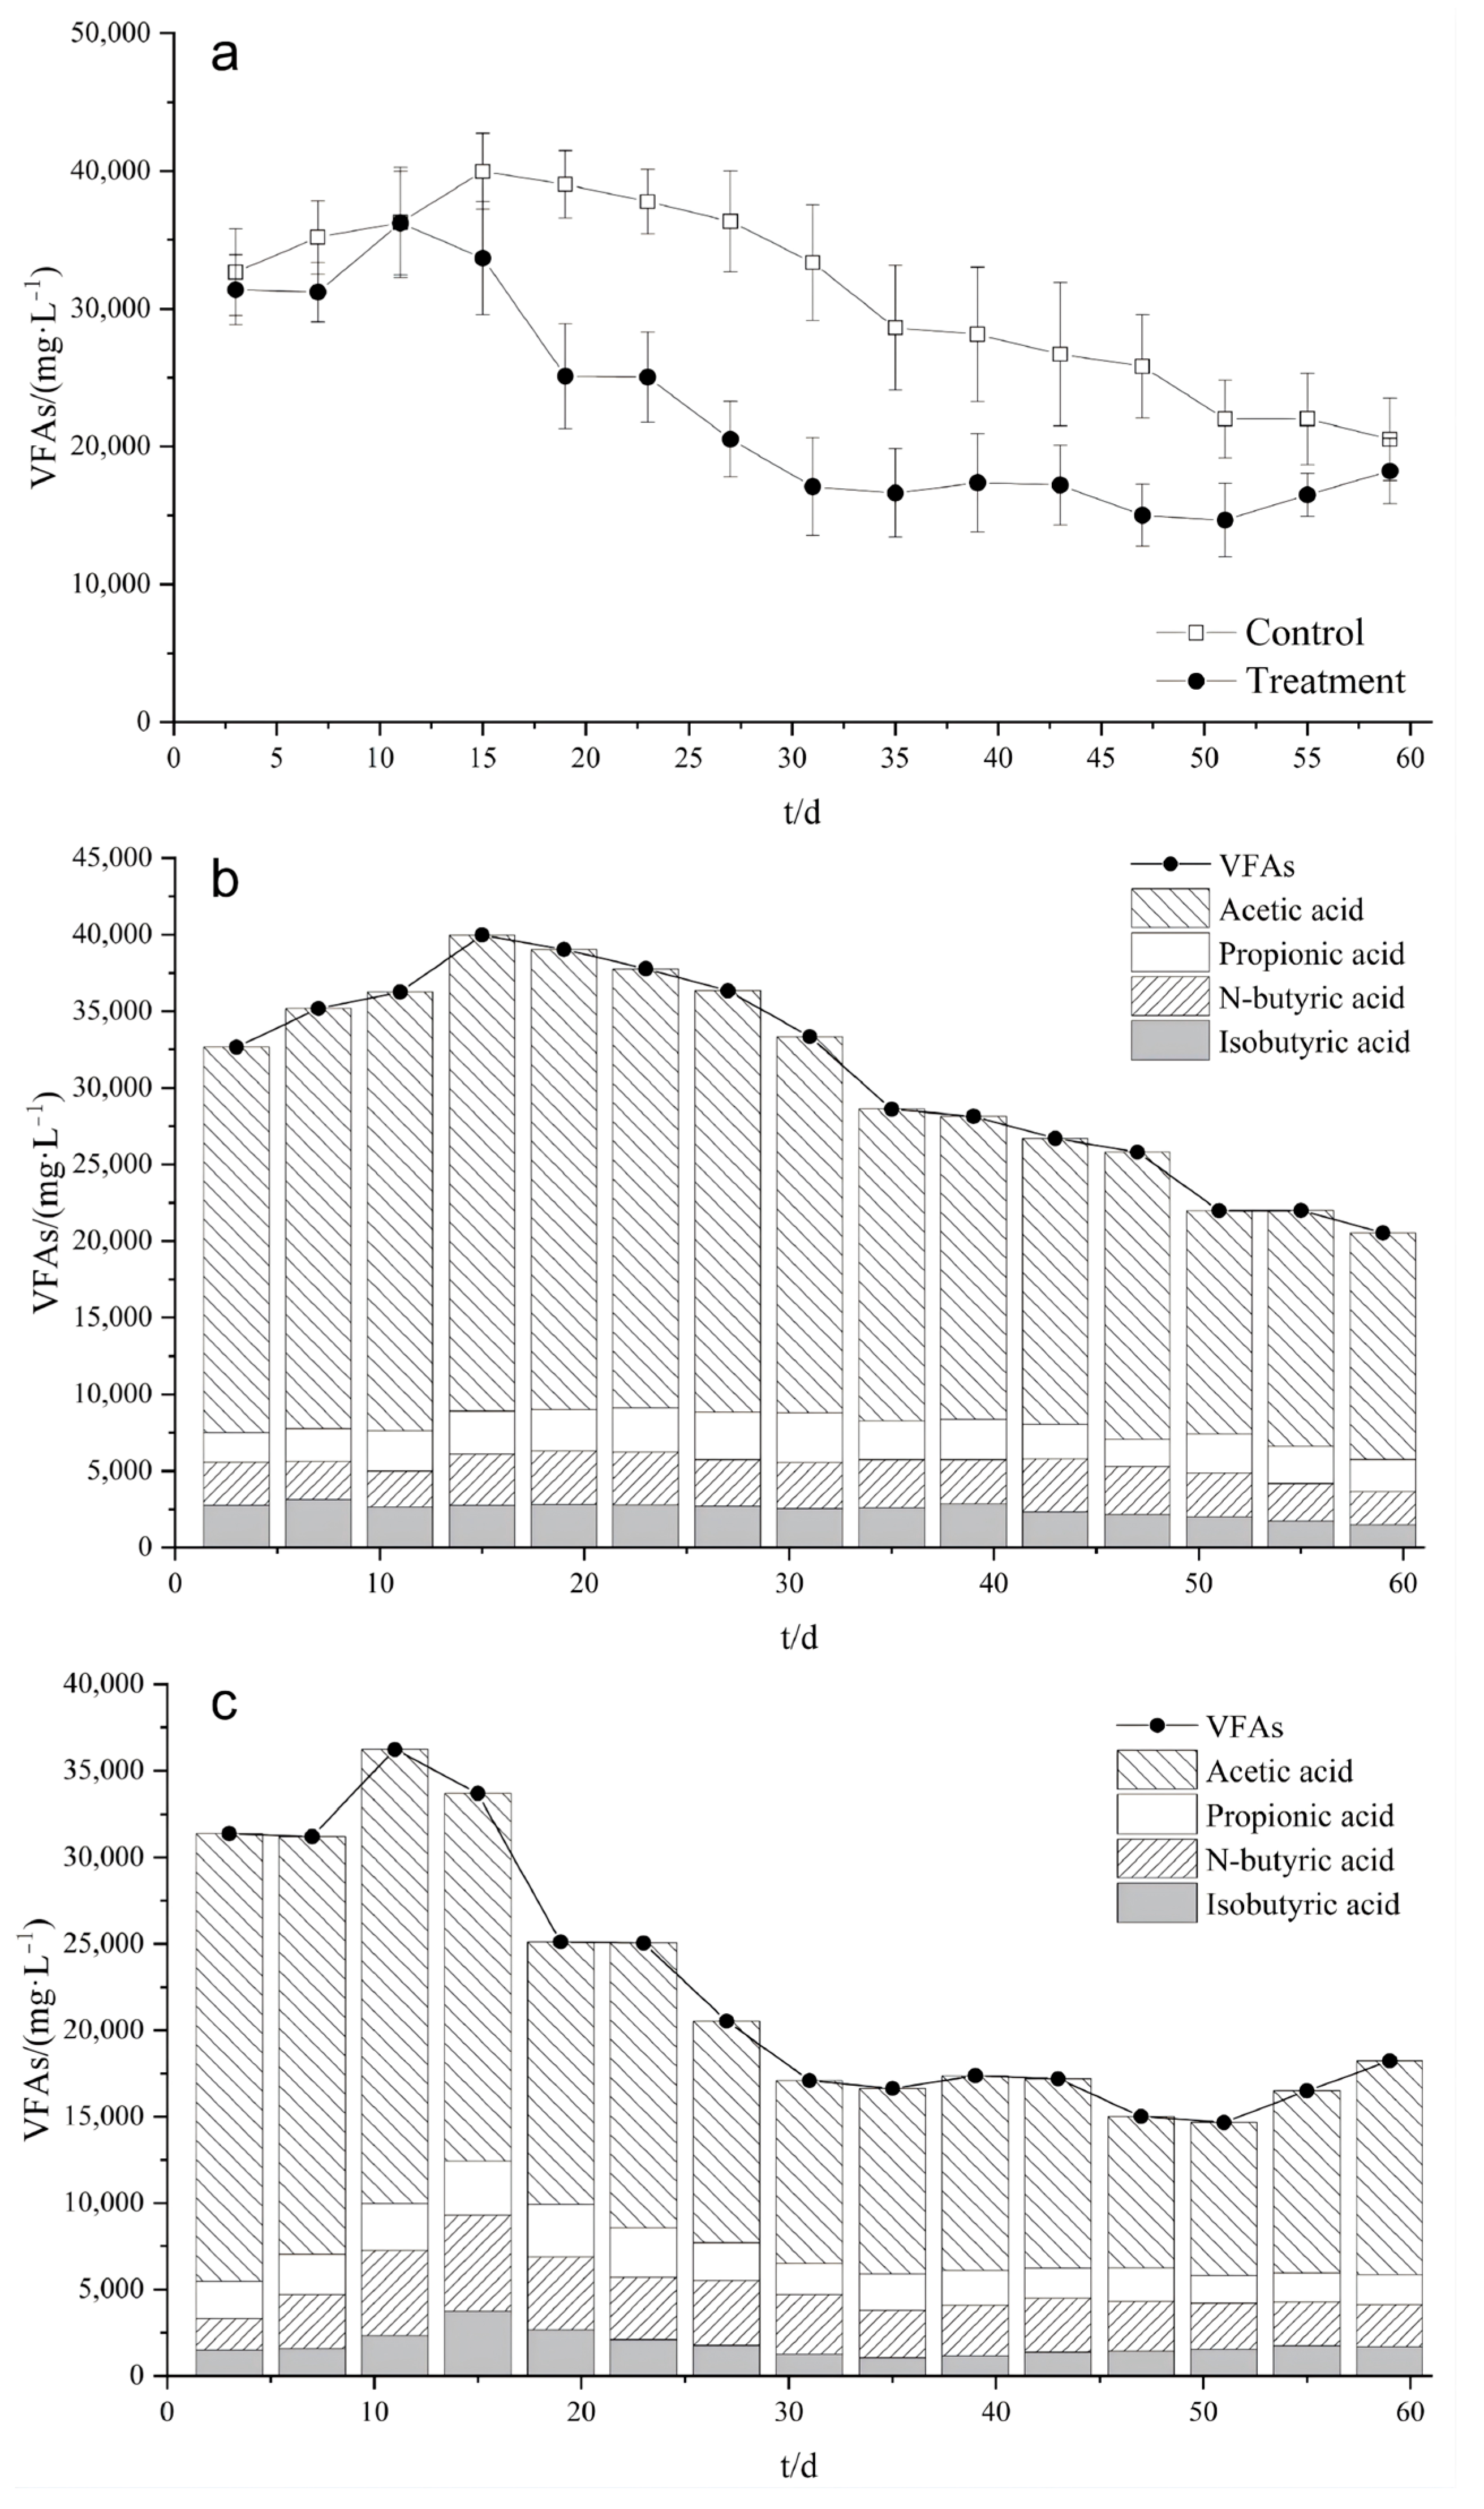
Figure 3a represents the total VFA concentrations of the two groups changing with time. In the early stage (0~10 days) of the dry, anaerobic fermentation, the VFA concentrations in both groups were close. But after 10 days, a significant difference was observed between the two groups (p < 0.05). Although both groups had decreasing trends, the treatment group had its VFAs decreased much faster than the control group. The treatment group reached a steady stage on day 30, whereas the control group required nearly 60 days to reach a comparable level (p < 0.05). VFAs contained multiple acids; in order to have a clear knowledge of concentration changes in each component of VFAs, our team measured the concentrations of acetic acid, propionic acid, ethacetic acid, and isobutyric acid in VFAs. Figure 3b,c represents the control group and the treatment group. It is easy to find that acetic acid was the main component in VFAs, and it also had the largest variation. The concentration change in VFAs was mainly contributed by the acetic acid.
Figure 3.
Volatile fatty acid (VFA) concentrations over time: (a) total VFAs in both groups, (b) VFA components in the control group, (c) VFA components in the treatment group.
From the figures above, in the first 10 days, VFAs were accumulating. This is because only a few methanogens were producing the methane, and the majority of bacteria focused on growing. In contrast to methanogenesis, which consumes VFAs, hydrolysis, acidogenesis, and acetogenesis would create many intermediate products, especially acetic acids. From day 10 to day 30, an increasing number of methanogens began to work, and many VFAs were consumed. While metabolic waste accumulated a lot and no more fresh substrate was added, more bacteria entered the death phase, so the VFA concentration stayed in a relatively steady level. Although both the treatment group and the control group had a similar trend, trace elements facilitated the system to enter the methanogenesis phase earlier and consume more VFAs for methane production.
3.4. Methanogenic Community Structure and Functional Potential
Alpha diversity metrics for methanogens are summarized in Table 2 (10 a/30 a/50 a: control; 10 b/30 b/50 b: treatment). Library coverage exceeded 0.999 for all samples, indicating sufficient sequencing depth. Shannon diversity ranked as 50 a > 50 b > 10 a ≈ 30 b > 10 b > 30 a, showing generally higher diversity at later fermentation stages. Richness metrics showed consistent trends: Chao ranked 50 b > 50 a > 30 b > 10 b > 30 a > 10 a, and observed richness (sobs) ranked 50 b = 50 a = 30 b > 30 a > 10 b > 10 a. Taken together, diversity and richness tended to increase over time, with modestly higher richness in the treatment at days 30 and 50.
Table 2.
Alpha diversity of methanogens with different fermentation periods.
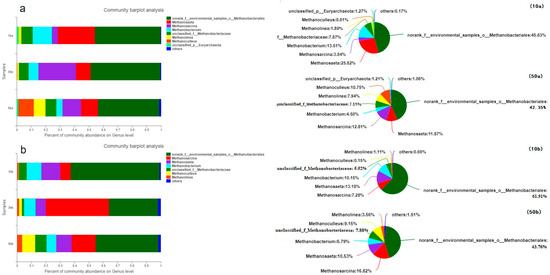
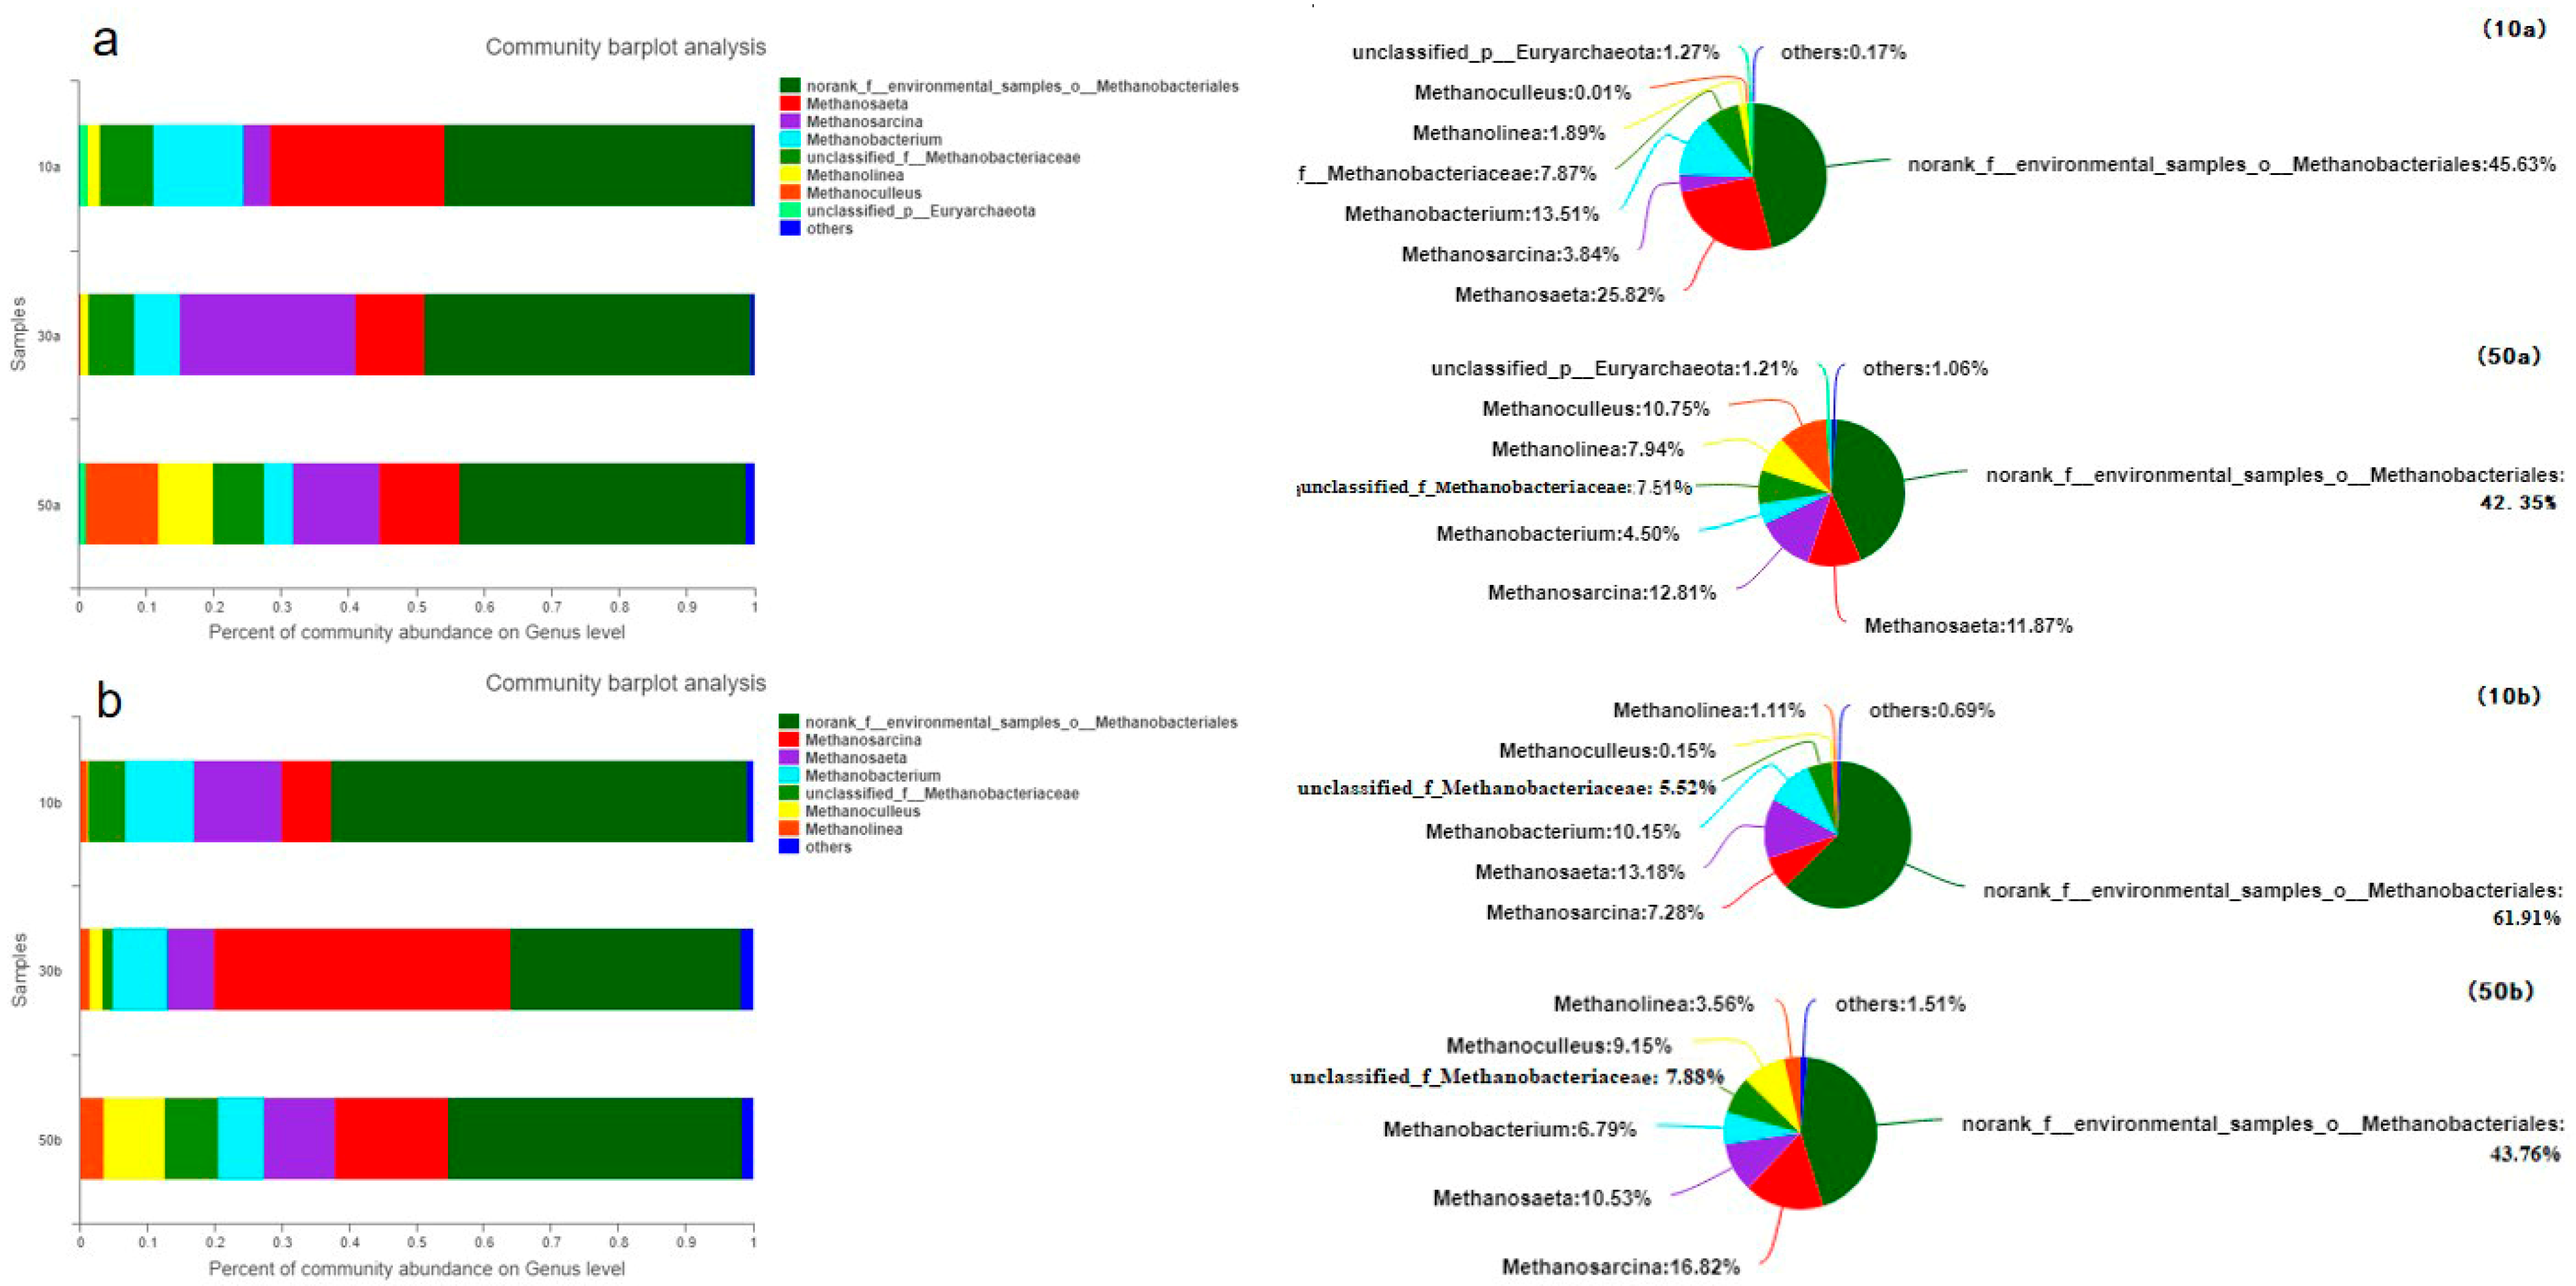
Across fermentation, both groups were consistently dominated by norank_Methanobacteriales. Across the temporal series of all samples, norank_Methanobacteriales remained the most abundant genus, whereas Methanosarcina exhibited pronounced temporal variability (Figure 4). norank_Methanobacteriales accounted for 45.63% at 10 d, 48.34% at 30 d, and 42.35% at 50 d; Methanosarcina increased from 3.84% (10 d) to 26.03% (30 d) and then declined to 12.81% (50 d). In the treatment, communities were similarly dominated by norank_Methanobacteriales at 10 d (61.91%) and 50 d (43.76%), whereas Methanosarcina surged at 30 d to 44.00%, a significantly higher relative abundance than in the control at the same time point (p < 0.05), and then decreased to 16.82% at 50 d. Early communities (10 d) in the two groups shared the same three leading genera—norank_Methanobacteriales, Methanosaeta, and Methanobacterium—followed by a mid-stage shift characterized by the rise in Methanosarcina, and a late-stage return to norank_Methanobacteriales predominance.
Figure 4.
Methanogenic community over time during anaerobic digestion: (a) control; (b) treatment.
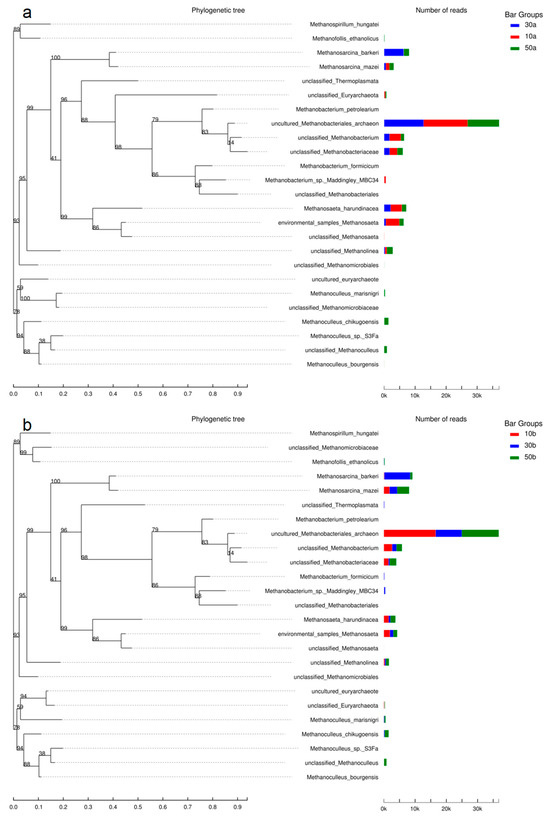
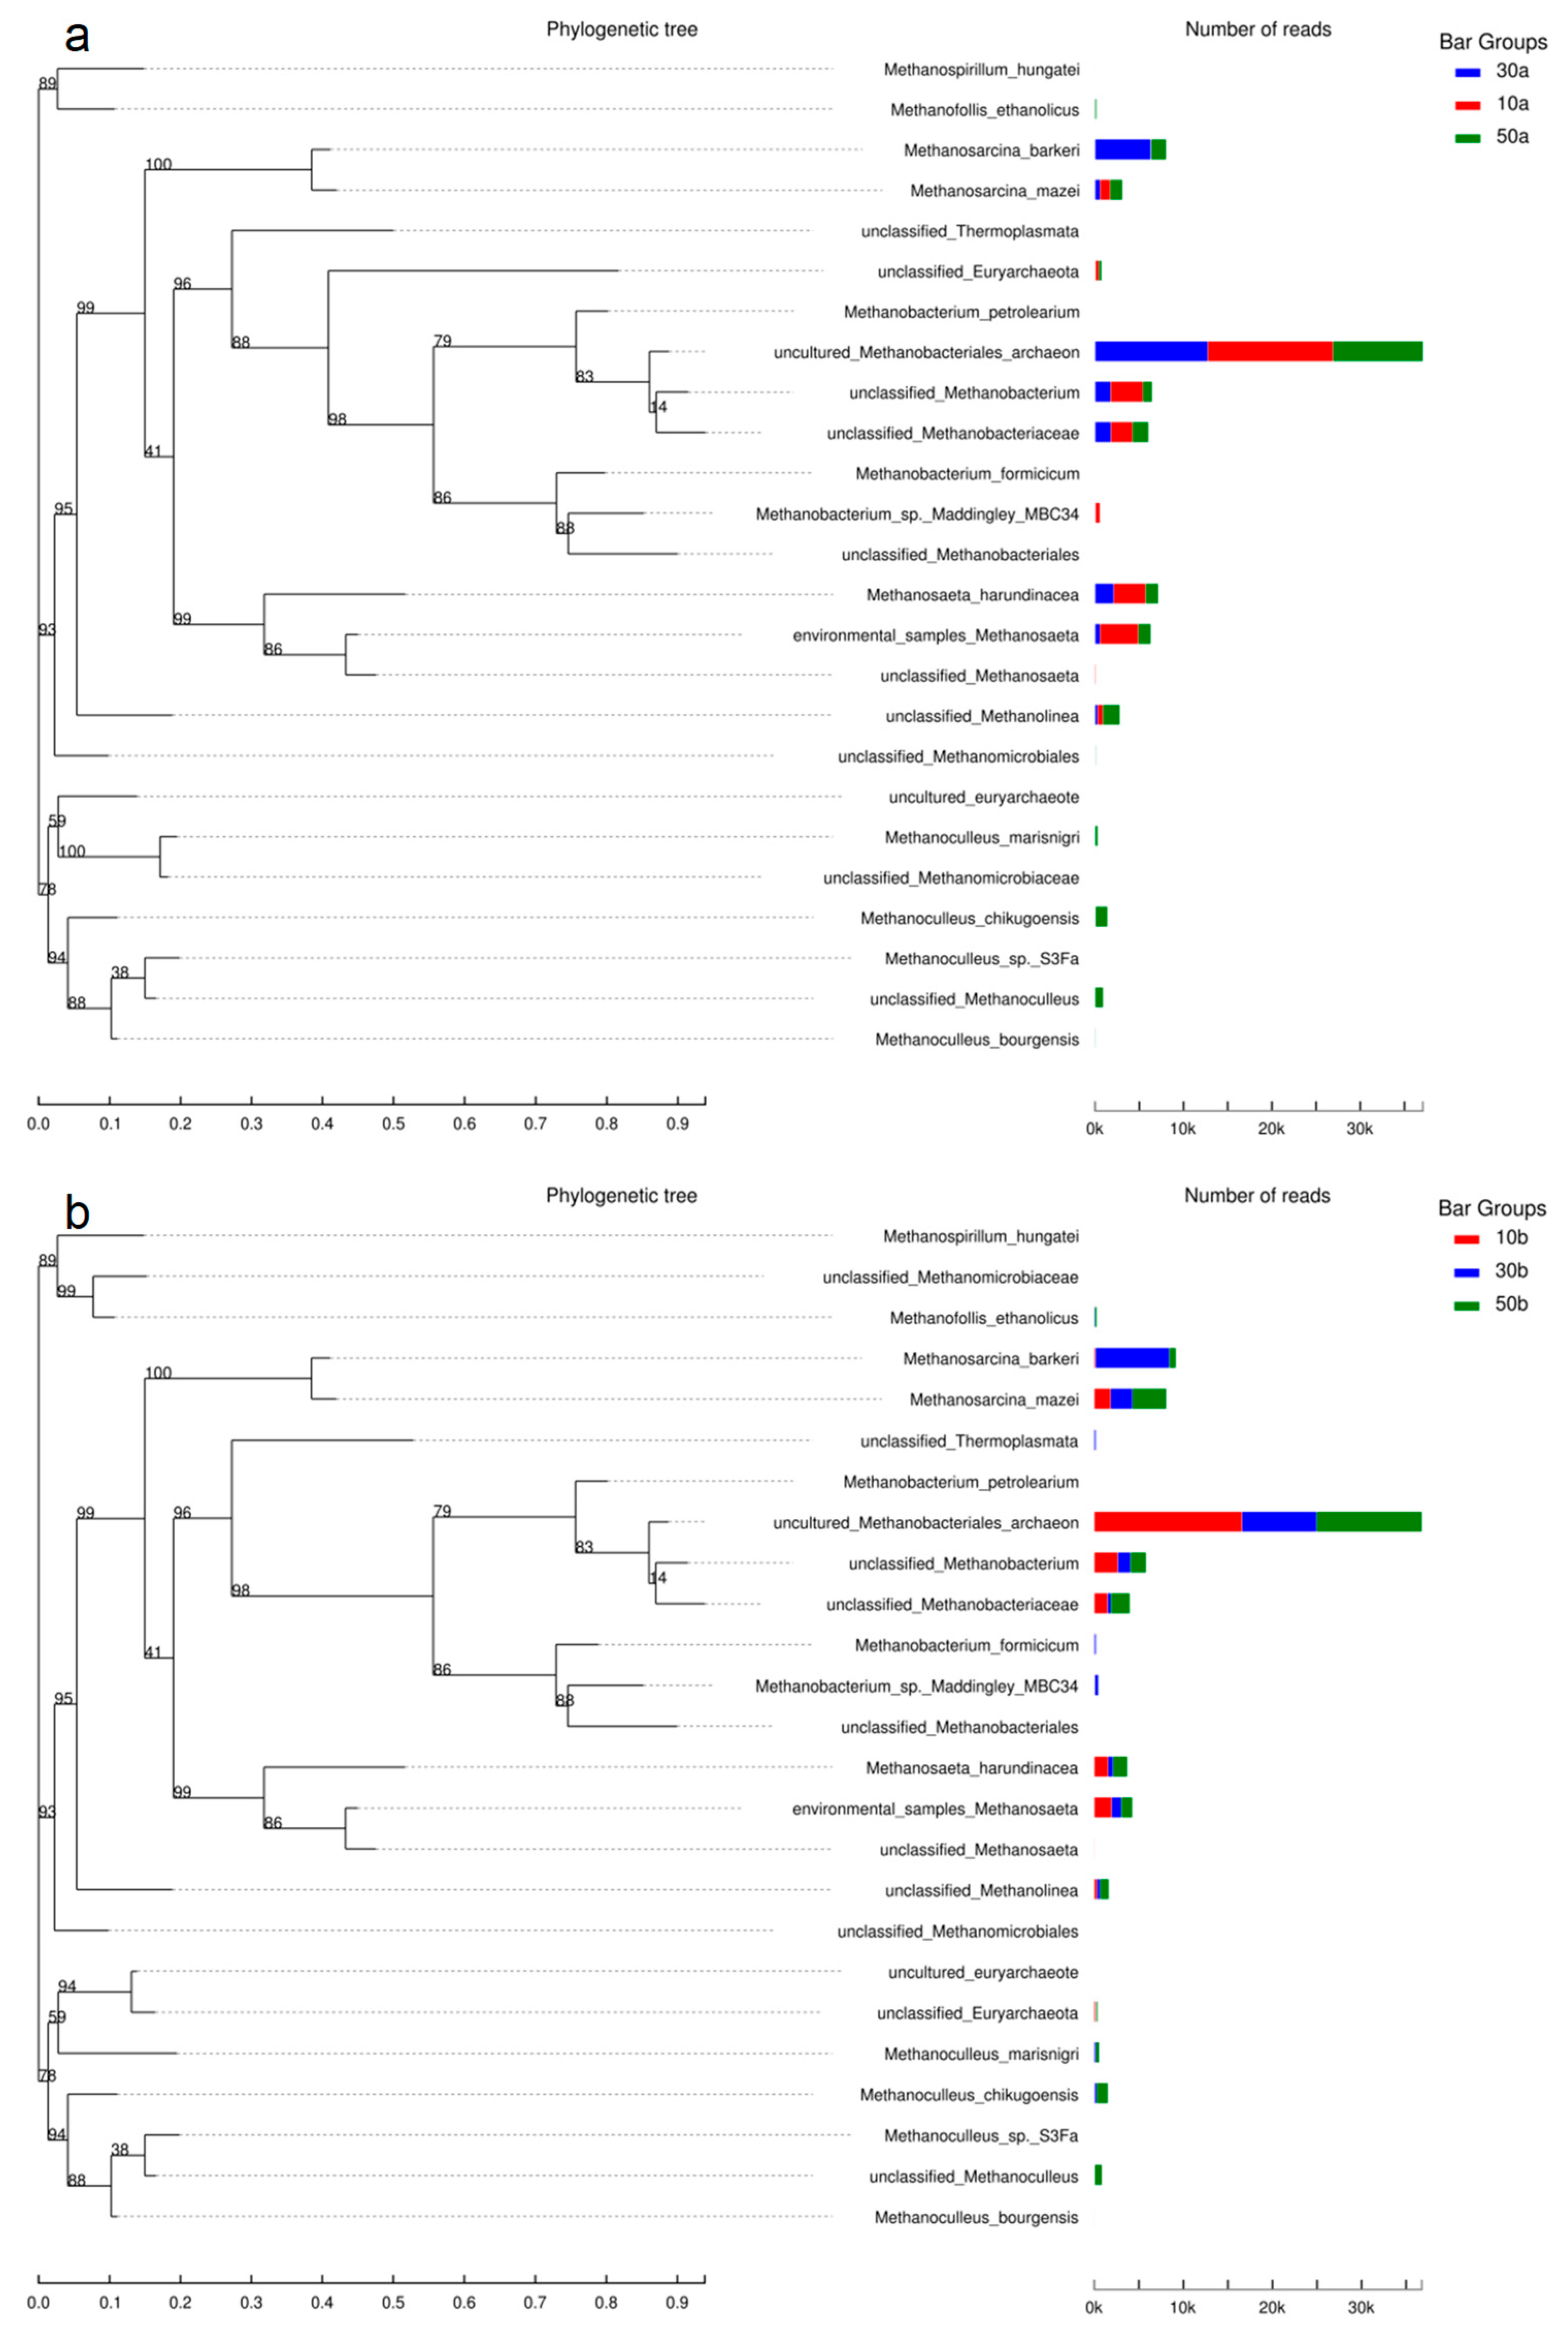
The dendrograms (Figure 5) corroborate these patterns. Taken together, the two dendrograms show that communities at 10 and 50 d are similar within each condition, whereas 30 d diverges, with a much longer separation in the treatment than in the control (p < 0.05). The accompanying contribution bars indicate that this divergence is driven mainly by reciprocal shifts in Methanosarcina and norank_Methanobacteriales, consistent with a temporary redistribution between acetoclastic/methylotrophic and hydrogenotrophic methanogenesis. By 50 d, the treated community clusters back toward its 10 d state, suggesting recovery after this mid-course shift. Functionally, such a pulse would increase acetate-consumption capacity at mid-run without preventing later convergence, implying that the timing and intensity of trace element dosing can be used to nudge pathway balance while maintaining overall process stability.
Figure 5.
Cluster dendrograms and relative abundance profiles of methanogenic communities: (a) control group; (b) treatment group.
3.5. Methanogenic Microbial Networks and Functional Gene Dynamics
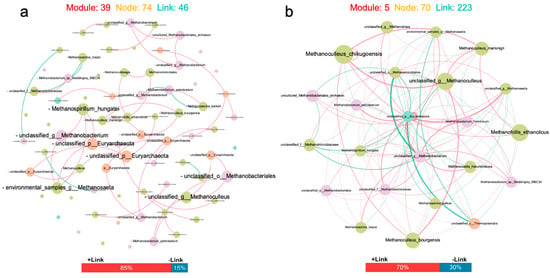
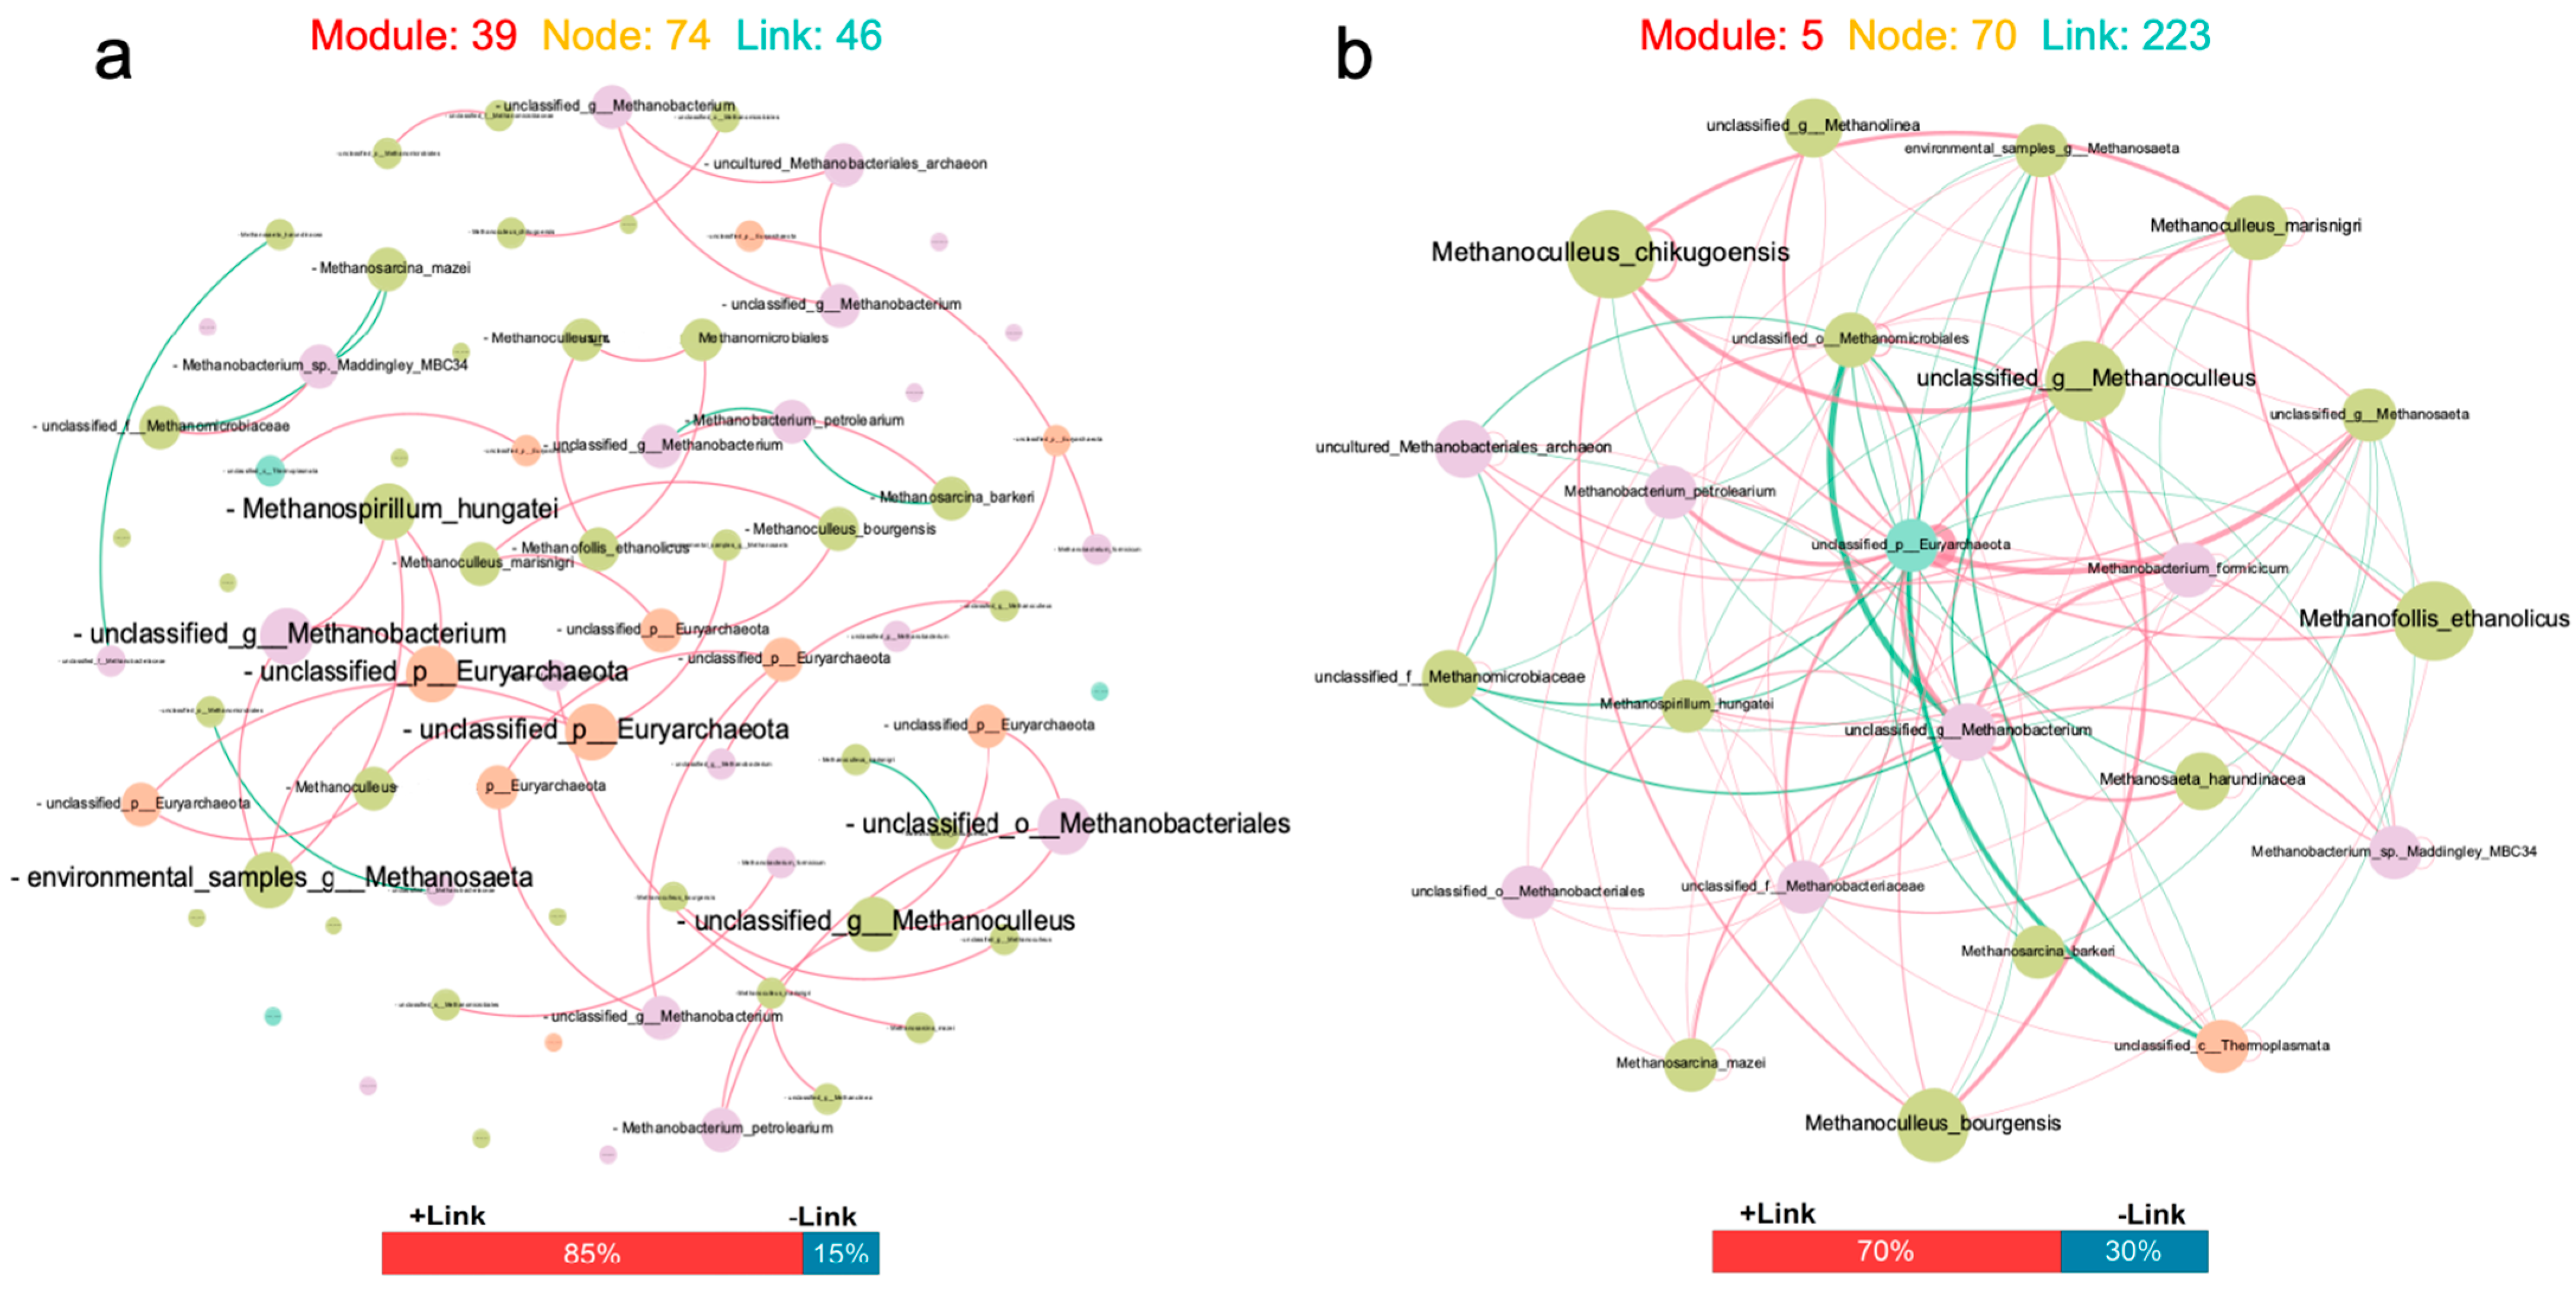
Compared with the control network (Figure 6a), the treatment network (Figure 6b) contained fewer nodes but many more connections. Nodes decreased slightly from 74 to 70, whereas edges increased from 46 to 223 (+177; 4.85-fold). Correspondingly, network density rose from 0.0170 to 0.0923 (5.42-fold), and the average degree increased from 1.24 to 6.37 (5.12-fold) (Table 3). In contrast, global transitivity declined from 0.907 to 0.0710, and the average clustering coefficient decreased from 0.374 to 0.0715. The number of modules annotated in the figure dropped from 39 (control) to 5 (treatment). Edge polarity also shifted: positive links accounted for 85% in control and 70% in treatment, whereas negative links increased from 15% to 30%. Visually, the control network was sparse and fragmented, with larger nodes such as Methanospirillum hungatei, Methanosaeta (environmental samples), and unclassified Methanobacteriales (Table S2). The treatment network formed a dense, highly connected structure, with prominent nodes including Methanoculleus chikugoensis, unclassified genus Methanoculleus, Methanofollis ethanolicus, and Methanoculleus bourgensis.
Figure 6.
Successional patterns in methanogenic microbial molecular ecological networks: (a) control group; (b) treatment group. Red edges indicate positive correlations, whereas green edges indicate negative correlations.
Table 3.
Network attributes of methanogenic microbial molecular ecology.
The methyl-coenzyme reductase subunit A gene, a methanogen-specific gene, encodes the methyl-coenzyme M reductase (MCR), which catalyzes the terminal step in methanogenesis. Studies show the positive correlation between mcrA gene copy numbers and the methane production rates [6]. It could be understood that the more mcrA gene copies, the more methanogens. By using QF-PCR, mcrA abundance worked as a biomarker to measure the capability of methane production in the system. At day 10, the mcrA copy numbers were similar between the two groups (Table 4), with values of 6.86 × 10⁴ and 7.23 × 10⁴ for the control and treatment groups, respectively (approximately 1.05-fold difference). By day 30, the mcrA abundance in the treatment group increased to 1.79 × 10⁵, about 1.60 times higher than that in the control group (1.12 × 10⁵). At day 50, mcrA copy numbers declined in both groups compared with day 30, reaching 6.13 × 10⁴ in the treatment and 4.05 × 10⁴ in the control, yet the treatment still maintained a higher abundance (approximately 1.51-fold difference; p < 0.05). Overall, from day 30 onward, the treatment group consistently exhibited greater mcrA copy numbers than the control.
Table 4.
The number of mcrA gene copies with different treatments.
4. Discussion
The pH trajectories in the two groups indicate a beneficial effect of trace elements (Fe, Ni, Co) on stabilizing system acidity. The treatment group exhibited a smaller pH range, a slower decline, and a faster rebound. When the control reached its minimum pH (~5.8), methanogens were likely exposed to acid stress. These improvements were consistent with gas production and VFA profiles, as the treatment produced biogas more efficiently than the control. Community analysis further showed that the trace elements greatly facilitated the growth of Methanosarcina, rendering it one of the dominant methanogens during the rapid gas-production phase. Given that Methanosarcina can use all three methanogenic pathways and is often regarded as a “heavy-duty” methanogen, its rapid expansion aligns with accelerated acetate consumption via the acetoclastic route [32]. Although norank_Methanobacteriales remained highly abundant for much of the run, part of its dominance likely reflected the initial composition of the inoculum rather than process development alone [33]. In addition, co-occurrence network analysis indicated that trace element supplementation markedly increased community interconnectedness. The treatment network contained 70 nodes linked by 223 edges within only 5 modules, whereas the control had 74 nodes but just 46 edges distributed across 39 small modules. This contrast points to a more cohesive and interactive community under supplementation. Network connectivity is a useful indicator of effective microbial cooperation in anaerobic digestion [34]. The highly connected treatment network suggests stronger syntrophic linkages among key partners, with methanogens clustering alongside bacteria involved in upstream conversions, consistent with efficient transfer of intermediates (e.g., H2 and acetate) to methanogenesis. Such an integrated structure aligns with the higher biogas yields and enhanced pH stability observed in the treatment, as coordinated communities can more rapidly draw down VFAs and mitigate acidosis [35]. By comparison, the fragmented control network implies isolated “cliques” with weaker coordination, matching the slower VFA turnover, deeper pH dips, and delayed methane production. The networks also hint at a shift in methanogenic strategy: the supplemented digester was organized around acetoclastic Methanosarcina, whereas the unsupplemented control relied more on hydrogenotrophic Methanobacteriales with fewer interconnections—together indicating that trace elements reshape not only community composition but also its interaction architecture, reinforcing stability and methanogenic efficiency [25]. Consistent with the tighter interaction network, quantitative fluorescence PCR of the mcrA gene showed higher copy numbers in the treatment than in the control, indicating a larger methanogenic population under trace element supplementation [33]. While supplementation is unlikely to drive the evolution of new species, it can promote the growth of existing taxa and shift their relative abundances.
As acidosis frequently complicates dry anaerobic fermentation with straw, the control likely experienced acid inhibition from day 5 to day 12 when pH fell below 6.0, whereas the treatment remained above ~6.4 and avoided acidosis. The inhibition is also reflected by shifts in methanogen composition [4]. Some studies proposed that common diversity metrics (richness, evenness, diversity) may not predict failure, and suggested that replacement of dominant Methanosaeta spp. could serve as an early warning of acidosis [36,37]. Other authors have proposed Methanosarcina thermophila-related taxa as early indicators of acidification in overloaded fed-batch systems digesting maize silage [38,39]. However, Delfosse’s study did not detect Methanosarcina spp. before or during acidosis, underscoring that reliable indicator species for process imbalance remain under debate [40]. The bacterial dynamics provide an intuitive process view. During the first ~10 days, microorganisms adapted to the new environment; hydrolysis, acidogenesis, and acetogenesis dominated, generating acidic intermediates and producing an initial pH drop (the methanogens’ lag phase). At this stage, mcrA copy numbers were similar between groups. The trace elements likely helped the treatment enter methanogenesis earlier, as only methane formation consumes hydrogen; accordingly, the treatment showed smaller pH fluctuations [41]. From day 10 to day 30, the treatment displayed a sharp decline in VFAs— especially acetate—together with a surge in biogas production, signaling a high share of methanogenesis. Across pH, gas, and VFA curves, the control lagged behind the treatment, indicating more time was required to fully transition into methanogenesis [25]. In the final ~30 days, with no additional feed, the community entered a decline phase, metabolic by-products accumulated, pH stabilized around a plateau, and daily gas production approached zero.
Beyond the observed community shifts, the functional role of Fe, Ni, and Co helps explain why trace element supplementation improved process performance [25,42]. Iron and nickel are key cofactors of [NiFe]-hydrogenases and ferredoxin-dependent oxidoreductases, which mediate interspecies electron transfer via H2 and formate. An adequate supply of these metals supports rapid oxidation of VFAs and other reduced intermediates by syntrophic bacteria, keeping hydrogen partial pressure low and thermodynamically enabling downstream methanogenesis [43]. Nickel is also the central metal in cofactor F430 of methyl-coenzyme M reductase, the terminal enzyme of all methanogenic pathways, so Ni limitation can directly constrain methane formation [44]. Cobalt, in turn, is an essential component of cobalamin-dependent methyltransferases that catalyze key one-carbon transfer reactions in both acetogenic and methanogenic metabolisms [45]. Thus, Fe, Ni, and Co jointly sustain the activity of the main enzymatic machinery driving the conversion of complex organics to methane. In our reactors, higher pH stability, faster VFA removal, and greater abundance of Methanosarcina in the treatment are consistent with this biochemical role of trace elements. Methanosarcina uses Ni- and Co-dependent enzymes in all three methanogenic routes (acetoclastic, hydrogenotrophic, and methylotrophic), so sufficient trace metal availability favors its competitive growth over more specialized or metal-sensitive methanogens [46]. At the community scale, the denser and more integrated co-occurrence network under supplementation suggests that trace elements did not simply increase total biomass but reinforced functional linkages among hydrolytic, acidogenic, syntrophic, and methanogenic partners. Therefore, the trace element addition enhances anaerobic digestion primarily by relieving metal-cofactor limitations on key redox and methyl-transfer reactions, which in turn accelerates VFA turnover, stabilizes pH, and selects for a more cohesive and efficient methanogenic community [47]. The 18.33% increase in cumulative biogas production in the supplemented digester reflects both direct and indirect effects of trace elements on methanogenesis. On the one hand, Fe, Ni, and Co serve as essential cofactors in hydrogenases, methyl-coenzyme M reductase, and other key enzymes, thereby directly enhancing methane-forming capacity. On the other hand, the stimulated methanogenic activity accelerates VFA consumption and prevents their excessive accumulation, which in turn stabilizes pH within the optimal range of 6.5–8.0 for methanogens. Thus, trace element supplementation improves process performance not only by directly increasing the enzymatic potential for methane production but also by indirectly maintaining a favorable physicochemical environment through faster VFA turnover and pH stabilization.
While this work aims to provide a practical approach for farmers to recycle straw, the batch mode required additional labor for feed handling. Future research should develop continuous operation. To further enhance efficiency while considering costs, especially at scale, other economically attractive metals involved in methanogenesis merit evaluation based on performance-to-expense ratios [48,49,50,51]. Metal speciation also affects bioavailability. Although chlorides were used here, interactions with phosphates, sulfides, carbonates, or EDTA may alter metal forms and process outcomes [52,53]. Identifying the most effective chemical forms could inform dosing strategies that maximize facilitation of anaerobic digestion.
5. Conclusions
High-solids anaerobic digestion of straw tends to suffer from acidification, but our findings demonstrate that this challenge can be overcome by co-digestion and micronutrient supplementation, leading to a much more stable and productive process. Trace elements (Fe, Ni, Co) played a pivotal mechanistic role in the enhanced performance. These micronutrients serve as essential cofactors for methanogenic enzymes and alleviate nutritional limitations in straw-rich substrates. By providing critical metals for key enzymes, the supplementation stimulated methanogenic activity and allowed the microbial community to more rapidly consume volatile fatty acids (especially acetate) that would otherwise accumulate. This prevented excessive acid build-up and a drop in pH, effectively mitigating acid inhibition. The dramatic proliferation of Methanosarcina in the treated digester highlights a shift in the methanogenesis pathway: as a versatile “heavy-duty” methanogen capable of utilizing acetate, hydrogen, and methylated compounds, Methanosarcina became dominant and accelerated acetate conversion into methane. In contrast, the control group relied more on hydrogenotrophic archaea (e.g., Methanobacteriales) and lacked sufficient acetoclastic capacity, making it more prone to acid accumulation. The addition of Fe/Ni/Co thus restructured the methanogenic community towards one better equipped to handle high acetate loads, fostering a balanced acetoclastic–hydrogenotrophic synergy. Moreover, network analysis of microbial interactions (co-occurrence patterns) suggested that the supplemented community developed stronger inter-species connections and functional resilience, reinforcing overall stability and methane productivity in the system. The study holds valuable practical implications for rural waste management and provides a clear strategy for efficient resource utilization.
Supplementary Materials
The following supporting information can be downloaded at https://www.mdpi.com/article/10.3390/su18031395/s1. Figure S1: Methane content with different treatment conditions. Table S1: The solution of trace elements. Table S2: Community roles in microbial ecological networks under different treatments.
Author Contributions
Conceptualization, Y.W.; Data Curation, Y.Q.; Formal Analysis, Y.D.; Funding Acquisition, Q.Z.; Methodology, Y.H. and K.J.; Resources, H.Z. and D.W.; Software, W.L.; Supervision, Q.Z.; Writing—Original Draft, G.L.; Writing—Review and Editing, W.L. and Q.Z. All authors have read and agreed to the published version of the manuscript.
Funding
This work was jointly supported by the National Key Research and Development Program of China (2023YFC3208804), the National Natural Science Foundation of China (52121006, 52309096, and U2040209), the China Postdoctoral Science Foundation (2023TQ0163 and 2024M751470), and the Jiangsu Water Conservancy Science and Technology Project (2025026).
Institutional Review Board Statement
Not applicable.
Informed Consent Statement
Not applicable.
Data Availability Statement
The original contributions presented in this study are included in the article/Supplementary Materials. Further inquiries can be directed to the corresponding author.
Conflicts of Interest
The authors declare no conflicts of interest.
References
- Boakye-Yiadom, K.A.; Ilari, A.; Bisinella, V.; Duca, D. Environmental Impact of Poultry Manure Gasification Technology for Energy and Ash Valorization. Sustainability 2024, 16, 9941. [Google Scholar] [CrossRef] [Scilit]
- Yang, Q.; Wu, S.; Lou, R.; Lv, G. Erratum to “Analysis of Wheat Straw Lignin by Thermogravimetry and Pyrolysisâ–gas Chromatography/Mass Spectrometry” [J. Anal. Appl. Pyrol. 87 (2009) 65–69]. J. Anal. Appl. Pyrolysis 2010, 87, 291. [Google Scholar] [CrossRef] [Scilit]
- Shi, Z.; Liang, F.; Marinello, F.; Pezzuolo, A. Integrating Building Footprints and Bioenergy Potential to Support Effective Decentralised Energy Planning: A Scalable Framework Based on Open Data. Sustain. Dev. 2025, 34, 1309–1325. [Google Scholar] [CrossRef] [Scilit]
- Ramakrishna, G.; Patil, B. Characterisation of Faecal Sludge from Different Nature-Based Treatment Processes for Agricultural Application. Sustainability 2025, 17, 5683. [Google Scholar] [CrossRef] [Scilit]
- Xi, Y.; Chang, Z.; Ye, X.; Xu, R.; Du, J.; Chen, G. Methane Production from Wheat Straw with Anaerobic Sludge by Heme Supplementation. Bioresour. Technol. 2014, 172, 91–96. [Google Scholar] [CrossRef] [Scilit] [PubMed]
- Alvarado, A.; Montañez-Hernández, L.E.; Palacio-Molina, S.L.; Oropeza-Navarro, R.; Luévanos-Escareño, M.P.; Balagurusamy, N. Nagamani Ebalagurusamy Microbial Trophic Interactions and mcrA Gene Expression in Monitoring of Anaerobic Digesters. Front. Microbiol. 2014, 5, 597. [Google Scholar] [CrossRef] [Scilit]
- Heinrichs, D.M. Dry Anaerobic Digestion of Municipal Solid Waste. Master’s Thesis, University of Manitoba, Winnipeg, MB, Canada, 1990. [Google Scholar]
- Kothari, R.; Pandey, A.K.; Kumar, S.; Tyagi, V.V.; Tyagi, S.K. Different Aspects of Dry Anaerobic Digestion for Bio-Energy: An Overview. Renew. Sustain. Energy Rev. 2014, 39, 174–195. [Google Scholar] [CrossRef] [Scilit]
- Ten Brummeler, E. Full Scale Experience with the BIOCEL Process. Water Sci. Technol. 2000, 41, 299–304. [Google Scholar] [CrossRef] [Scilit] [PubMed]
- Chernysh, Y.; Chubur, V.; Shtepa, V.; Alekseevsky, D.; Bataltsev, Y.; Roubík, H. Anaerobic Digestion of Poultry Manure with Phosphogypsum Using Microbial Electrolysis and Ultrasound: A Neural Network Approach. Environ. Process. 2025, 12, 52. [Google Scholar] [CrossRef] [Scilit]
- Zhang, W.; Dai, K.; Xia, X.-Y.; Wang, H.-J.; Chen, Y.; Lu, Y.-Z.; Zhang, F.; Zeng, R.J. Free Acetic Acid as the Key Factor for the Inhibition of Hydrogenotrophic Methanogenesis in Mesophilic Mixed Culture Fermentation. Bioresour. Technol. 2018, 264, 17–23. [Google Scholar] [CrossRef] [Scilit]
- Datar, R.; Huang, J.; Maness, P.; Mohagheghi, A.; Czemik, S.; Chornet, E. Hydrogen Production from the Fermentation of Corn Stover Biomass Pretreated with a Steam-Explosion Process. Int. J. Hydrogen Energy 2007, 32, 932–939. [Google Scholar] [CrossRef] [Scilit]
- Yang, F.-L.; Li, W.-Z.; Li, Q.; Li, P.-F.; Wang, Z.-J.; Luo, L.-N. Unravelling the Influence of Sulfate Loading on Enhancing Anaerobic Co-Digestion of Corn Stover and Bio-Kerosene Production Wastewater. J. Biosci. Bioeng. 2018, 127, 99–106. [Google Scholar] [CrossRef] [Scilit] [PubMed]
- Zhen, G.; Lu, X.; Kobayashi, T.; Li, Y.-Y.; Xu, K.; Zhao, Y. Mesophilic Anaerobic Co-Digestion of Waste Activated Sludge and Egeria Densa: Performance Assessment and Kinetic Analysis. Appl. Energy 2015, 148, 78–86. [Google Scholar] [CrossRef] [Scilit]
- Pastor, L.; Ruiz, L.; Pascual, A.; Ruiz, B. Co-Digestion of Used Oils and Urban Landfill Leachates with Sewage Sludge and the Effect on the Biogas Production. Appl. Energy 2013, 107, 438–445. [Google Scholar] [CrossRef] [Scilit]
- GarcÃ-a-Gen, S.; RodrÃ-guez, J.; Lema, J.M. Control Strategy for Maximum Anaerobic Co-Digestion Performance. Water Res. 2015, 80, 209–216. [Google Scholar] [CrossRef] [Scilit]
- Wang, M.; Sahu, A.K.; Rusten, B.; Park, C. Anaerobic Co-Digestion of Microalgae Chlorella Sp. and Waste Activated Sludge. Bioresour. Technol. 2013, 142, 585–590. [Google Scholar] [CrossRef] [Scilit]
- Zhang, C.; Xiao, G.; Peng, L.; Su, H.; Tan, T. The Anaerobic Co-Digestion of Food Waste and Cattle Manure. Bioresour. Technol. 2013, 129, 170–176. [Google Scholar] [CrossRef] [Scilit]
- Williams, C.M.; Shih, J.C.H.; Spears, J.W. Effect of Nickel on Biological Methane Generation from a Laboratory Poultry Waste Digester. Biotechnol. Bioeng. 1986, 28, 1608–1610. [Google Scholar] [CrossRef] [Scilit] [PubMed]
- Wei, J.; Hao, X.; van Loosdrecht, M.C.M.; Li, J. Feasibility Analysis of Anaerobic Digestion of Excess Sludge Enhanced by Iron: A Review. Renew. Sustain. Energy Rev. 2018, 89, 16–26. [Google Scholar] [CrossRef] [Scilit]
- Zandvoort, M.H.; Van Hullebusch, E.D.; Fermoso, F.G.; Lens, P.N.L. Trace Metals in Anaerobic Granular Sludge Reactors: Bioavailability and Dosing Strategies. Eng. Life Sci. 2006, 6, 293–301. [Google Scholar] [CrossRef] [Scilit]
- Ilangovan, K.; Fuentes-D, M.; Monroy-H, O. Transport of Heavy Metals during Anaerobic Digestion of Water Hyacinth. Biotechnol. Lett 1990, 12, 387–392. [Google Scholar] [CrossRef] [Scilit]
- Yue, Z.-B.; Yu, H.-Q.; Wang, Z.-L. Anaerobic Digestion of Cattail with Rumen Culture in the Presence of Heavy Metals. Bioresour. Technol. 2007, 98, 781–786. [Google Scholar] [CrossRef] [Scilit] [PubMed]
- Pobeheim, H.; Munk, B.; Lindorfer, H.; Guebitz, G.M. Impact of Nickel and Cobalt on Biogas Production and Process Stability during Semi-Continuous Anaerobic Fermentation of a Model Substrate for Maize Silage. Water Res. 2011, 45, 781–787. [Google Scholar] [CrossRef] [Scilit]
- Wintsche, B.; Glaser, K.; Sträuber, H.; Centler, F.; Liebetrau, J.; Harms, H.; Kleinsteuber, S. Trace Elements Induce Predominance among Methanogenic Activity in Anaerobic Digestion. Front. Microbiol. 2016, 7, 2034. [Google Scholar] [CrossRef] [Scilit] [PubMed]
- Steinberg, L.M.; Regan, J.M. mcrA-Targeted Real-Time Quantitative PCR Method to Examine Methanogen Communities. Appl. Environ. Microbiol. 2009, 75, 4435–4442. [Google Scholar] [CrossRef] [Scilit]
- Wilkins, D.; Lu, X.Y.; Shen, Z.; Chen, J.; Lee, P.K. Pyrosequencing of mcrA and Archaeal 16S rRNA Genes Reveals Diversity and Substrate Preferences of Methanogen Communities in Anaerobic Digesters. Appl. Environ. Microbiol. 2015, 81, 604–613. [Google Scholar] [CrossRef] [Scilit]
- Luton, P.E.; Wayne, J.M.; Sharp, R.J.; Riley, P.W. The mcrA Gene as an Alternative to 16S rRNA in the Phylogenetic Analysis of Methanogen Populations in Landfill. Microbiology 2002, 148, 3521–3530. [Google Scholar] [CrossRef] [Scilit]
- Deng, Y.; Jiang, Y.-H.; Yang, Y.; He, Z.; Luo, F.; Zhou, J. Molecular Ecological Network Analyses. BMC Bioinform. 2012, 13, 113. [Google Scholar] [CrossRef] [Scilit]
- Yuan, M.M.; Guo, X.; Wu, L.; Zhang, Y.; Xiao, N.; Ning, D.; Shi, Z.; Zhou, X.; Wu, L.; Yang, Y. Climate Warming Enhances Microbial Network Complexity and Stability. Nat. Clim. Change 2021, 11, 343–348. [Google Scholar] [CrossRef] [Scilit]
- Yang, L.; Huang, Y.; Zhao, M.; Huang, Z.; Miao, H.; Xu, Z.; Ruan, W. Enhancing Biogas Generation Performance from Food Wastes by High-Solids Thermophilic Anaerobic Digestion: Effect of pH Adjustment. Int. Biodeterior. Biodegrad. 2015, 105, 153–159. [Google Scholar] [CrossRef] [Scilit]
- De Vrieze, J.; Hennebel, T.; Boon, N.; Verstraete, W. Methanosarcina: The Rediscovered Methanogen for Heavy Duty Biomethanation. Bioresour. Technol. 2012, 112, 1–9. [Google Scholar] [CrossRef] [Scilit]
- Menzel, T.; Neubauer, P.; Junne, S. Effect of Bioaugmentation with Paenibacillus Spp. and Thin Slurry Recirculation on Microbial Hydrolysis of Maize Silage and Bedding Straw in a Plug-Flow Reactor. Biomass Convers. Biorefin. 2024, 14, 19139–19154. [Google Scholar] [CrossRef] [Scilit]
- Du, C.; Li, G.; Xia, R.; Li, C.; Zhu, Q.; Li, X.; Li, J.; Zhao, C.; Tian, Z.; Zhang, L. New Insights into Cyanobacterial Blooms and the Response of Associated Microbial Communities in Freshwater Ecosystems. Environ. Pollut. 2022, 309, 119781. [Google Scholar] [CrossRef] [Scilit]
- Guo, B.; Zhang, L.; Sun, H.; Gao, M.; Yu, N.; Zhang, Q.; Mou, A.; Liu, Y. Microbial Co-Occurrence Network Topological Properties Link with Reactor Parameters and Reveal Importance of Low-Abundance Genera. npj Biofilms Microbiomes 2022, 8, 3. [Google Scholar] [CrossRef] [Scilit] [PubMed]
- Tsachidou, B.; Calusinska, M.; Hissler, C.; Gennen, J.; Daigneux, B.; Piutti, S.; Laflotte, A.; George, I.; Delfosse, P. Impact of Different Nitrogen Fertilizers on the Diversity and Abundance of Bacterial and Fungal Communities in Grassland Soils: The Emerging Case of Ammonium Sulfate and Sulfammox Process. GCB Bioenergy 2025, 17, e70050. [Google Scholar] [CrossRef] [Scilit]
- D’Silva, T.C.; Isha, A.; Chandra, R.; Vijay, V.K.; Subbarao, P.M.V.; Kumar, R.; Chaudhary, V.P.; Singh, H.; Khan, A.A.; Tyagi, V.K. Enhancing Methane Production in Anaerobic Digestion through Hydrogen Assisted Pathways–A State-of-the-Art Review. Renew. Sustain. Energy Rev. 2021, 151, 111536. [Google Scholar] [CrossRef] [Scilit]
- Kampmann, K.; Ratering, S.; Geißler-Plaum, R.; Schmidt, M.; Zerr, W.; Schnell, S. Changes of the Microbial Population Structure in an Overloaded Fed-Batch Biogas Reactor Digesting Maize Silage. Bioresour. Technol. 2014, 174, 108–117. [Google Scholar] [CrossRef] [Scilit]
- Lackner, N.; Hintersonnleitner, A.; Wagner, A.O.; Illmer, P. Hydrogenotrophic Methanogenesis and Autotrophic Growth of Methanosarcina Thermophila. Archaea 2018, 2018, 4712608. [Google Scholar] [CrossRef] [Scilit]
- Goux, X.; Calusinska, M.; Lemaigre, S.; Marynowska, M.; Klocke, M.; Udelhoven, T.; Benizri, E.; Delfosse, P. Microbial Community Dynamics in Replicate Anaerobic Digesters Exposed Sequentially to Increasing Organic Loading Rate, Acidosis, and Process Recovery. Biotechnol. Biofuels 2015, 8, 122. [Google Scholar] [CrossRef] [Scilit] [PubMed]
- Zhao, W.; Xia, W.; Du, Y.; Li, D.; You, J.; Zhao, Q.; Wei, L. Enhanced Bioavailability of Trace Elements for Improving Anaerobic Digestion of Food Waste Using Sludge Extracellular Polymeric Substances. Chem. Eng. J. 2025, 515, 163589. [Google Scholar] [CrossRef] [Scilit]
- Johnson, J.L.; Bastian, N.R.; Schauer, N.L.; Ferry, J.G.; Rajagopalan, K.V. Identification of Molybdopterin Guanine Dinucleotide in Formate Dehydrogenase from Methanobacterium Formicicum. FEMS Microbiol. Lett. 1991, 77, 213–216. [Google Scholar] [CrossRef]
- Salazar-Batres, K.J.; Moreno-Andrade, I. Review of the Effects of Trace Metal Concentrations on the Anaerobic Digestion of Organic Solid Waste. BioEnergy Res. 2025, 18, 24. [Google Scholar] [CrossRef] [Scilit]
- Choong, Y.Y.; Norli, I.; Abdullah, A.Z.; Yhaya, M.F. Impacts of Trace Element Supplementation on the Performance of Anaerobic Digestion Process: A Critical Review. Bioresour. Technol. 2016, 209, 369–379. [Google Scholar] [CrossRef] [Scilit]
- Wintsche, B.; Jehmlich, N.; Popp, D. Metabolic Adaptation of Methanogens in Anaerobic Digesters upon Trace Element Limitation. Front. Microbiol. 2018, 9, 405. [Google Scholar] [CrossRef] [Scilit]
- Thauer, R.K. Methyl (Alkyl)-Coenzyme M Reductases: Nickel F-430-Containing Enzymes Involved in Anaerobic Methane Formation and in Anaerobic Oxidation of Methane or of Short Chain Alkanes. Biochemistry 2019, 58, 5198–5220. [Google Scholar] [CrossRef] [Scilit]
- Matthews, R.G.; Koutmos, M.; Datta, S. Cobalamin-Dependent and Cobamide-Dependent Methyltransferases. Curr. Opin. Struct. Biol. 2008, 18, 658–666. [Google Scholar] [CrossRef] [Scilit] [PubMed]
- Kurade, M.B.; Saha, S.; Salama, E.S. Acetoclastic Methanogenesis Led by Methanosarcina in Anaerobic Co-Digestion of Fats, Oil and Grease for Enhanced Production of Methane. Bioresour. Technol. 2019, 272, 351–359. [Google Scholar] [CrossRef] [Scilit]
- Fermoso, F.G.; van Hullebusch, E.D.; Guibaud, G. Fate of Trace Metals in Anaerobic Digestion. In Biogas Science and Technology; Springer: Cham, Switzerland, 2015; Volume 150, pp. 171–195. [Google Scholar]
- Schauer, N.L.; Ferry, J.G. Properties of Formate Dehydrogenase in Methanobacterium Formicicum. J. Bacteriol. 1982, 150, 1. [Google Scholar] [CrossRef] [Scilit]
- Kryukov, G.V.; Gladyshev, V.N. The Prokaryotic Selenoproteome. EMBO Rep. 2004, 5, 538–543. [Google Scholar] [CrossRef] [Scilit]
- Stock, T.; Rother, M. Selenoproteins in Archaea and Gram-Positive Bacteria. BBA—Gen. Subj. 2009, 1790, 1520–1532. [Google Scholar] [CrossRef] [Scilit] [PubMed]
- Thanh, P.M.; Ketheesan, B.; Yan, Z.; Stuckey, D. Trace Metal Speciation and Bioavailability in Anaerobic Digestion: A Review. Biotechnol. Adv. 2016, 34, 122–136. [Google Scholar] [CrossRef] [Scilit] [PubMed]

Disclaimer/Publisher’s Note: The statements, opinions and data contained in all publications are solely those of the individual author(s) and contributor(s) and not of MDPI and/or the editor(s). MDPI and/or the editor(s) disclaim responsibility for any injury to people or property resulting from any ideas, methods, instructions or products referred to in the content. |
© 2026 by the authors. Licensee MDPI, Basel, Switzerland. This article is an open access article distributed under the terms and conditions of the Creative Commons Attribution (CC BY) license.