


Abstract
The prevention and control of desertification in northern China is currently in a critical stage of transitioning from large-scale governance to precise adaptation. Identifying potential risk areas during the ecological restoration process is a scientific prerequisite for achieving long-term governance. This study focuses on the typical ecologically fragile area of Ordos City, where high-resolution grazing pressure grid data and a night-time light index were innovatively integrated into the assessment system to develop a desertification sensitivity evaluation framework that couples climatic, vegetative, soil, and human activity (CVSH) factors. Compared to linear models, the CVSH framework enhances dynamic assessment accuracy by coupling human activity indicators, particularly addressing the policy lag effect inherent in PSR models. The study systematically tracked the temporal and spatial differentiation process of desertification sensitivity from 2000 to 2024, finding that the spatial pattern shows a significant “the west is high while the east is low” concentration, and the time series has experienced a phased turning point of “first suppression then growth”. Mechanism analysis indicates that climate aridification and vegetation degradation are the dominant stress factors, while intense human activities have significantly exacerbated the vulnerability of local ecosystems through nonlinear interactions, leading to the re-expansion of high-sensitivity zones after 2018, with their area proportion increasing sharply from 15.52% to 30.07%. This study reveals the fragility of ecological engineering effectiveness and the complexity of risk evolution under the combined influence of climate fluctuations and human interference, providing a direct scientific picture and decision support for achieving differentiated ecological risk management and sustainable land management in different regions.
1. Introduction
Desertification is a serious environmental problem facing the entire world [1]. With the vigorous development of the global economy, the demand for resources by humans has significantly increased. However, the rapid economic growth has also led to the unreasonable exploitation and utilization of natural resources. In the pursuit of short-term economic benefits, humans often ignore natural laws and unrestrainedly damage the environment, resulting in a sharp deterioration of the ecological environment and triggering a series of serious problems, such as a decline in biodiversity, the degradation of forests and wetlands, and the expansion of desertified land [2]. According to the United Nations Environment Programme, more than a quarter of global land is at risk of desertification, affecting over 1 billion people [3]. Desertification not only causes damage to the resource system and poverty, but also threatens social stability and economic development, and it has far-reaching impacts on global climate change, food security, and water resource supply [4]. In 1994, the United Nations signed the United Nations Convention to Combat Desertification (UNCCD), aiming to promote sustainable land management and ecological restoration, in order to slow down and reverse land desertification and enhance the livelihoods and ecosystem stability of affected areas. Additionally, international conventions and frameworks such as the United Nations Framework Convention on Climate Change (UNFCCC) and the United Nations 2030 Agenda with its 17 sustainable development goals have also been implemented successively, providing important legal and policy support for global desertification governance. Thus, desertification governance has become one of the core issues of global sustainable development. The United Nations Educational, Scientific and Cultural Organization (UNESCO) proposed an initial definition of desertification sensitivity in the 1970s, and the concept has matured against the backdrop of global concern over land degradation and desertification. Thomas et al. first discussed the concept of desertification sensitivity in 1994, highlighting its close relationship with land use, climate change, and socio-economic factors [5]. Desertification sensitivity refers to the susceptibility of a region or ecosystem to the desertification process, involving the ecosystem’s capacity to respond to drought, wind erosion, and human intervention [6]. It reflects the vulnerability of arid and semi-arid regions to environmental changes under specific environmental conditions [7], as well as the risk and potential impact of desertification on land and ecosystems in the face of climate change, human activities, and other external pressures. At the same time, it provides an important indicator for assessing land degradation and ecosystem health [8].
The assessment of desertification sensitivity serves as a crucial basis for desertification control and land management. The methodology system for this assessment has been continuously evolving and improving in research. Currently, a multi-method collaborative assessment framework has been established both domestically and internationally, with the main methods including field investigation, remote sensing and geographic information technology, index system construction, and model simulation. Among these, the field investigation method obtains key parameters such as soil and vegetation through on-site observation and sampling, providing basic data and verification support for the assessment. Remote sensing and geographic information technology, leveraging their macroscopic and dynamic nature, achieve sensitive monitoring and spatial mapping on a large scale and with a long time series; the index system construction method decomposes complex driving factors into specific indicators through the construction of a hierarchical and quantifiable evaluation system, and realizes comprehensive assessment through weighted integration; while the model simulation method reveals the driving mechanisms of desertification sensitivity through mechanism modeling, data-driven approaches, and scenario simulation, and predicts its future trends.
The assessment of desertification sensitivity serves as an important foundation for scientific desert control. Its methodology has been continuously evolving and improving during development. Among them, the MEDALUS model, as an internationally widely used evaluation framework, was initially designed for the Mediterranean region and gradually expanded to a global scale. To address this issue, scholars optimized indicator weights through the analytic hierarchy process (AHP) [9,10], improved the authenticity of the results through factor analysis [11] and introduced higher-precision remote sensing inversion methods such as the CASA model [12], significantly enhancing the regional adaptability and assessment accuracy of the model. Dominant factors influencing desertification sensitivity exhibit significant regional heterogeneity, necessitating dynamic optimization based on local ecological conditions and socio-economic characteristics. In high-rainfall regions of Southwest Asia, groundwater quality plays a significant role in land degradation [13]. A revised version of MEDALUS, incorporating groundwater and soil erosion indicators, has been effectively integrated with fuzzy logic methods [14]. In areas with extensive farming practices, adding water quality and geomorphological indices significantly improved the model’s classification accuracy for high-risk zones [15]. In the Aksu region of China, land use type was identified as the primary driver of desertification, making it a key reference in evaluations for more scientifically grounded results [16]. In Algeria, practical applications of the model have been extended to include topographic quality indicators related to landforms and geology [17]. Furthermore, to reflect the sharp increase in livestock numbers, overgrazing, and its direct impact on soil and vegetation degradation, some studies have introduced a grazing quality index [18].
Early research on land desertification sensitivity in China was often conducted within a comprehensive ecological sensitivity framework. For example, a national-scale assessment found that the desert margins and sandy lands in arid and semi-arid regions exhibited the highest ecological sensitivity [19]. Some scholars constructed an evaluation system incorporating six indicators, including land desertification, to reveal the spatiotemporal evolution characteristics of ecological sensitivity in China’s terrestrial ecosystems. As research deepened, increasing attention was paid to the regional characteristics of specific ecological and environmental issues. Scholars began developing specialized assessment methods targeting desertification [20], such as decomposing comprehensive ecological sensitivity into single elements for analysis at scales such as the Tibetan Plateau [21], the Yellow River Basin [22], national parks [23], and municipal regions [24]. In the Hexi Corridor region, Deng Xiaohong et al. coupled a general land desertification sensitivity assessment method with a spatial distance index model, using grid coding to analyze the spatiotemporal fluctuation patterns of sensitivity [25]. You Nanshan et al. integrated ecological sensitivity with ecosystem services to conduct a comprehensive assessment of the Heihe River Basin, performing ecological functional zoning to provide responsive measures for ecosystem management [26]. A team led by Zhao Mingyue, based on the Technical Guidelines for Ecological Function Zoning, achieved precise regionalization of desertification sensitivity at the watershed scale through spatial overlay of single-factor sensitivity evaluation maps, providing a scientific basis for ecological function zoning [27]. Desertification assessment in China faces challenges due to the uneven spatial distribution of meteorological data, especially in the northwest, where sparse weather stations limit the accuracy of traditional interpolation methods. To address this, Hu Mengtian et al. [28] introduced soil moisture and wind factors from the Revised Wind Erosion Equation (RWEQ) model, optimizing the calculation methods for high-wind days and aridity indices, significantly improving the accuracy of wind erosion risk assessment in arid regions. Research indicates that slope affects vegetation cover and soil water retention capacity [29], thus showing a significant positive correlation with desertification sensitivity. Based on this, another study incorporated slope and aspect factors into the identification of agricultural land use conflicts and land degradation risk [30]. An assessment in Xinjiang included slope indicators, verifying their explanatory power for the desertification process [31].
In the process of exploring a more systematic and dynamic evaluation framework, the press-state-response (PSR) model has demonstrated potential in the research on desertification sensitivity in China. This model, by establishing a causal chain of “human activity stress—ecosystem state—management policy response”, provides a new perspective for understanding the desertification process under the coupling of human and land. Based on the PSR framework, scholars have, through coupling spatial distance indices and drawing long-term spatiotemporal evolution maps, initially revealed the dynamic patterns of desertification sensitivity in typical regions such as Inner Mongolia, and attempted to serve ecological functional zoning [32]. However, the models are often based on linear and instantaneous response assumptions, making it difficult to depict the complex policy lag effects and nonlinear ecological restoration processes behind major projects such as “ecological migration” and “reversion of farmland to forest”. This leads to deviations between the assessment conclusions and the actual degradation on the ground, and the handling of human activities is often simplified, failing to precisely distinguish the different roles of positive restoration behaviors and negative interference behaviors in the driving chain, and lacking integration of the deep social and economic factors.
In response to these challenges, the CVSH coupled assessment framework developed in this research has achieved significant development and deepening in both theoretical basis and regional adaptability. The MEDALUS model, originally designed for the Mediterranean region, has preset ecological processes and dominant factors that significantly differ from the desertification dominant mechanisms in the arid and semi-arid regions of northern China, making its direct application limited. The core breakthrough of the CVSH framework is that it not only reconstructs the index library based on regional characteristics, such as introducing soil moisture content, high-resolution grazing pressure, and night-time light index, but also emphasizes the dynamic and nonlinear coupling feedback between subsystems in the mechanism. This design enables it to reveal the internal evolution process and critical points of sensitivity under the interactive drive of climate fluctuations and human activities. Compared to the PSR framework’s linear causal chain of pressure-state-response, the CVSH framework treats human activities as dynamic subsystems within the system and quantifies their enhanced interaction effects with natural factors, thereby being able to depict the lag and vulnerability of policy benefits in the context of ecological engineering in China. Regarding system structure, it incorporates the comprehensive multi-dimensional assessment of MEDALUS, but upgrades it from a static overlay to a dynamic coupling. In its causal logic, it adopts the perspective of PSR that focuses on human pressure, but breaks through its one-way linear chain and constructs a two-way feedback loop between human and nature. As for the final output, the CVSH framework can provide deeper insights into the critical points of system evolution, dominant interaction mechanisms, and management measures’ vulnerability, providing more precise scientific basis for differentiated and adaptive ecological risk management. Therefore, the CVSH framework is not only a localized calibration and theoretical expansion of international mainstream methods, but also provides a more regionally explanatory analytical tool for understanding the mutation mechanism of desertification sensitivity in the human–land coupling area of northern China and the adaptability issues of ecological engineering.
This study has applied the CVSH framework in depth in the forceful human–environment interaction area of Ordos, conducting empirical tests on the nonlinear feedback mechanism between human activities and the natural subsystems. It particularly verified its ability to analyze complex dynamic processes such as the turning points of ecological engineering benefits and the re-expansion of risks. In terms of the indicator system construction, a breakthrough was achieved for the first time, integrating high-resolution grazing pressure and night-time light index data simultaneously in the regional assessment, providing a new solution for the precise quantification and spatial explicit expression of human activity factors. In terms of spatial analysis methods, it integrated dynamic transfer matrices, LISA spatiotemporal path analysis, and geographic detector interactive detection, forming a set of integrated analysis methods that can systematically answer questions such as how to change, where to change, and why to change from process to pattern to mechanism. In addition, the study selected municipal administrative units as the assessment scale, which combines ecological process integrity and management practice compatibility. Its assessment conclusions can directly connect with municipal territorial spatial planning and provide a direct basis for differentiated control at the flag and county levels, achieving effective connection between scientific assessment and governance decision-making. The findings of this study provide direct data support for the planning, layout, and effectiveness evaluation of major ecological projects such as the “Three-North” Shelterbelt Program, contributing to the optimization and enhancement of such initiatives. Furthermore, accurately understanding desertification sensitivity and its future trends serves as a cornerstone for balancing regional economic development and ecological conservation, formulating scientific and rational territorial spatial planning, and devising sustainable development strategies. This directly aligns with the core objectives of the United Nations Convention to Combat Desertification (UNCCD) and holds long-term strategic significance for strengthening the national ecological security barrier in northern China and advancing ecological civilization construction.
Based on the theoretical advantages of the CVSH framework in characterizing nonlinear coupling and the fine representation of human activities, as well as the regional characteristics of the coexistence of ecological vulnerability and energy development intensity in Ordos, this study proposes the following core hypotheses: (1) The temporal and spatial evolution trajectory of the desertification sensitivity in the Ordos region is not linear. The dynamic process of desertification has a critical turning point that is jointly dominated by the stress of climate aridification and the interference of intense human activities. (2) The surface achievements of ecological restoration projects may not be firmly established, and they are prone to degradation or reversal under external pressures. Compared with traditional indicators, coupling high-resolution grazing pressure with the night-time light index can significantly enhance the ability to identify the vulnerability of ecological engineering effectiveness and the latent accumulation and early explicit expansion of desertification risks.
2. Materials and Methods
2.1. Overview of the Study Area
Ordos City is located in the southwestern part of the Inner Mongolia Autonomous Region, situated within the great bend of the Yellow River. Its geographical coordinates range from 37°35′24″ N to 40°51′40″ N and 106°42′40″ E to 111°27′20″ E. The city covers a total area of 87,000 km2 and administers seven banners (county-level divisions) and two districts, with a permanent population of approximately 2.24 million. Located in an ecological transition zone, Ordos has a fragile ecological environment. The Hobq Desert and the Mu Us Sandy Land traverse the city, resulting in a high proportion of desertified land. The ecosystem is predominantly characterized by grasslands and deserts. The region experiences a temperate continental climate with sparse precipitation and intense evaporation. The northern, eastern, and western sides are closely encircled by the main stream of the Yellow River, while the southern side connects with other areas of the Loess Plateau and the southern edge of the Mu Us Sandy Land. The internal topography of the plateau is mainly composed of deserts, sandy lands, and hills. The famous Hobq Desert stretches across the northern part of the plateau, and the Mu Us Sandy Land covers the southern part (Figure 1).
Figure 1.
Overview map of Ordos city region.
2.2. Data Sources
The data and sources used in this study are presented in the table below (Table 1). The data on soil organic matter, soil depth, and soil texture are based on the average values from 2010 to 2018, while the other data are based on single-year data. All data were uniformly resampled to a spatial resolution of 1 km, with the projection set as the Albers equal-area conic projection. The administrative boundary vector data of Ordos City was used to clip all raster data. The bilinear interpolation method was employed for resampling to identify and address outliers; for missing values, temporal interpolation using valid observations from the same pixel point at different time points was prioritized; for minor missing areas in static data such as soil properties, the ordinary Kriging interpolation method was used. All indicators were standardized using Z-Score to eliminate the influence of units, ensuring their comparability in the CVSH assessment framework and the rigor of integrated analysis.
Table 1.
Lists of quality indicators and sources of datasets.
The year 2000 marked the first year of policies for desertification control in China. Subsequently, the “Law of the People’s Republic of China on Sand Control and Desertification Prevention” was promulgated, indicating that the prevention and control efforts had entered the legal framework and major projects were initiated. The Beijing–Tianjin Wind/Sand Source Control Project was launched urgently in 2000, while the “Three North” Forest Shelter System Construction Project was in the final stage of the fourth phase (1996–2000) and had entered the stage of continuous construction. Based on the above background, this study selected five time points—2000, 2006, 2012, 2018, and 2024—for comparative analysis. The aim was to capture the response and evolution of the desertification sensitivity in the Ordos region under different ecological protection strategies over the past 25 years in China. These years correspond to the milestone moments of China’s ecological protection policies and regulations, the key nodes of the five-year plans, and the phased periods of major ecological projects such as the “Three North” projects. This facilitates the assessment of the coupling effect between macro policies and natural processes on a long-term scale.
2.3. Methods
2.3.1. The CVSH Framework
To systematically evaluate the sensitivity of land desertification, this study has constructed a coupled assessment framework of climate–vegetation–soil–human activities. The core of the CVSH framework lies in depicting the multi-directional dynamic coupling feedback among the climate–vegetation–soil–human activity subsystems: Climate fluctuations directly stress the vegetation coverage, and the degradation of vegetation further exacerbates local climate aridity by altering the surface energy balance, forming a “climate–vegetation” positive feedback loop. The decline in vegetation coverage weakens the soil protection function, leading to intensified soil erosion, and subsequently, the deterioration of soil moisture and nutrient conditions restricts vegetation restoration, constituting a “vegetation–soil” degradation cycle. Human activities directly intervene in the surface structure and processes, accelerating soil erosion and vegetation degradation, and the decline in land productivity will in turn affect human livelihood strategies, forming a “human-surface” two-way stress. Soil conditions restrict the reconstruction of vegetation from the physical, chemical and ecological dimensions, making the system prone to fall into a “soil constraint—slow recovery—continuous soil degradation” unstable state trap. These feedback loops interweave and overlap in time and space and interact nonlinearly, jointly driving the sudden change, lag, and spatial heterogeneity evolution of desertification sensitivity and constituting the fundamental theoretical basis of the CVSH framework that distinguishes it from traditional linear assessment models.
This framework inherits and develops the core idea of the internationally recognized MEDALUS model on a theoretical basis to identify the sensitive areas of the desertification environment. The CVSH framework deepens the management quality into a spatially definable and dynamically quantifiable “human activity quality”; it changes the geometric mean synthesis method of the quality indices of each subsystem to a weighted linear synthesis based on regional characteristics, in order to more flexibly reflect the differences in the relative importance of each subsystem, emphasizing the bidirectional feedback mechanism between subsystems, providing a theoretical basis for the subsequent analysis of driver factor interactions.
At the model calculation level, CVSH employs a weighted linear combination model to calculate the indices of each subsystem (Equations (1)–(4)), and then obtains the comprehensive index of desertification sensitivity (CIDS) through quadratic weighted synthesis (Equation (5)). C represents the standardized value of the i-th indicator under the categories of climate, vegetation, soil and human activities, and w is the corresponding weight of the indicator. This process retains the independent information of each subsystem and reflects the synergy and antagonism between systems, ultimately achieving a refined analysis of the spatiotemporal pattern and evolution mechanism of regional desertification sensitivity.
2.3.2. Analytic Hierarchy Process (AHP) Hierarchical Analysis
In the assessment of desertification sensitivity, the contributions of different criterion layers and their subordinate indicators to desertification are not equal. Therefore, this study uses the AHP to scientifically determine the weights of each indicator. The theoretical core of AHP lies in decomposing complex higher-order systems into ordered lower-level hierarchical structures, converting decision-making problems into the ranking of different schemes, and based on the judgment matrix, selecting the optimal scheme from the overall ranking while ensuring consistency. AHP establishes a hierarchical architecture model, constructs judgment matrices, conducts hierarchical single ranking and consistency checks, calculates the consistency index (CI) to test the consistency of the judgment matrix and the desertification sensitivity identification process. Finally, when the consistency ratio CR (Consistent Ratio) is less than 0.1, it is considered that the judgment matrix has passed the consistency check [36].
This study used the Yaahp v12.1 software to complete the establishment of the desertification sensitivity evaluation index system and the determination of the weights. The Yaahp software is a meta-decision-making tool based on the AHP analytic hierarchy process and fuzzy logic method, and has been widely applied in risk assessment, resource evaluation, and multi-criteria decision-making and other research fields. This study invited a group of experts covering ecology, geography, and land resource management to conduct a pairwise comparison of the relative importance of elements within the criterion layer and each index layer using the classic 1–9 scale method, thereby constructing a judgment matrix. The CR values of all hierarchical judgment matrices were all <0.1, indicating that the expert judgments had good consistency and the weight allocation was reasonable and reliable. To test the robustness of the evaluation model in setting the index weights, the weights were tested using the sensitivity analysis function built into Yaahp. The analysis observed the potential impact of perturbing the weights of a single indicator on the final comprehensive sensitivity index ranking. The results showed that the allowable change range of all criterion layers and index layers’ weights did not include the critical reversal point, and the change range was relatively wide. This confirmed that the weight system determined based on AHP has good stability. The evaluation results of this study are not sensitive to minor changes in weights, and the conclusion is robust.
2.3.3. Analysis of the Driving Mechanism of Desertification Sensitivity
The geodetector is a spatial statistical method used to assess the spatial pattern of the dependent variable and the relationship with potential explanatory factors [37]. This method is suitable for identifying and quantifying the contribution of different factors to the spatial heterogeneity of land degradation [38]. During the spatiotemporal changes in land desertification sensitivity, with the interaction of various factors, obvious spatial differentiation characteristics will be produced. Identifying and analyzing the patterns of spatial differentiation is of great significance in managing land desertification [39]. This study employs two modules: factor detection and interaction detection, to explore the influence mechanism of internal factors on the sensitivity to degradation. Among them, the factor detector quantifies the degree of explanation of explanatory variables on the spatial differentiation of the land degradation sensitivity index through the q statistic (Equations (6)–(8)). The closer the q value is to 1, the stronger the explanatory power of the factor on the sensitivity to land degradation. The interaction detector is used to analyze the enhancing or weakening effect on the dependent variable when two factors interact. This analysis calculates the q values of two independent variables and their interaction q value, and classifies the interaction into five types based on the comparison results: dual-factor enhancement, nonlinear enhancement, independence, nonlinear weakening, and single-factor weakening.
To overcome the limitations of a single method, this study adopts a strategy combining geographical detectors and principal component analysis. The geographical detector is used to quantitatively test the independent influence of each factor selected beforehand on the spatial differentiation of sensitivity, and to determine whether there are any interactive effects such as synergy or weakening between any two factors. Principal component analysis is used to objectively extract the most significant variation directions from all factor data in order to identify the core driving patterns composed of multiple factors and avoid missing key information due to subjective selection. The combination of these two methods enhances the robustness of the mechanism analysis.
2.3.4. Spatial Clustering Analysis
Spatial autocorrelation reflects the relationship between the proximity of elements in geographical spatial positions and the similarity of their attribute values. Local spatial autocorrelation refers to the calculation and analysis of the degree of spatial correlation between each spatial object within an area and its neighboring objects. Compared with global spatial autocorrelation, local spatial autocorrelation calculates and analyzes the local characteristic differences existing in the distribution of spatial objects, reflecting the spatial heterogeneity and instability within the local area [40].
3. Results
3.1. Desertification Sensitivity Index System Based on the CVSH Framework
The model first selects sub-indicators related to soil, vegetation, climate and human activity, and then classifies and assigns weights to the selected sub-indicators according to the AHP (Table 2). Secondly, based on the selected sub-indicators, the soil quality index, vegetation quality index, climate quality index and human activity quality index are calculated, respectively. Finally, the four quality indices of soil, vegetation, climate and human activity are superimposed to generate the desertification sensitivity index.
Table 2.
Index system for the assessment of desertification sensitivity in Ordos.
3.2. Analysis of Desertification Sensitivity Quality Index
3.2.1. Climate Quality Index
Climate quality is an important indicator for assessing sensitivity to desertification [41]. The study selected four indicators—temperature, precipitation, wind speed, and dryness—to evaluate climate quality. Precipitation is the fundamental source of water for ecosystems in arid and semi-arid regions; temperature dominates the evaporation on the surface and the transpiration process of plants; the dryness index is defined as the ratio of precipitation to potential evapotranspiration, which comprehensively reflects the water balance situation of the region. The lower the dryness value, the more severe the water deficit, the greater the water stress on plant growth, and the more fragile the ecosystem, and the higher the sensitivity to desertification. In wind erosion-dominated areas like Ordos, wind speed is a key indicator for measuring the potential dynamic intensity of desertification. Therefore, selecting these four types of climate factors can reveal the driving mechanism of climate on the sensitivity to desertification from two dimensions: water balance and dynamic conditions. The study classified and assigned scores to these four indicators based on the natural breakpoint method, and performed raster overlay using the CVSH model to obtain the climate quality index results for five periods—2000, 2006, 2012, 2018, and 2024 (Figure 2).
Figure 2.
Climate quality index of Ordos from 2000 to 2024.
The results show that the overall climate quality index in the Ordos region generally exhibits a trend where the western regions have higher quality while the eastern regions have lower quality. The areas with better climate quality expand from the northeastern part of the city to the central part, while the areas with poorer climate quality remain relatively stable. Looking at the counties separately, the climate quality in Daratui County, Dongsheng District, Kangbaishan District and Yijinhuoluo County is relatively good, while the climate quality in Hangjin County and the western and northern parts of Etoqiu County is poor, with higher climate sensitivity. Over the past 20 years, the climate conditions in the study area have shown a significant and continuous downward trend of sensitivity to desertification. In other words, from a climate perspective, the regional ecological environment has become more stable and less prone to desertification. This may be the result of the combined effect of favorable climate factors such as increased precipitation and reduced wind speed during this period, or it may be related to large-scale climate cycle fluctuations or regional climate changes. During the period from 2008 to 2024, the climate sensitivity increased, and there was a significant spatial differentiation in the climate sensitivity within the region.
3.2.2. Vegetation Quality Index
Vegetation plays a significant role in climate regulation, soil and water conservation, wind prevention and sand fixation, etc. [42]. In this study, vegetation coverage, net primary productivity, erosion prevention, and vegetation drought index were selected as sub-indicators of vegetation quality index. Vegetation coverage is a fundamental indicator for assessing desertification sensitivity, as it measures the process of vegetation degradation and recovery; the level of net primary productivity directly reflects the health and productivity of the ecosystem, and a decrease in net primary productivity indicates a decline in ecosystem function, weakening the ecosystem’s ability to resist external disturbances such as drought and grazing and making it more prone to the vicious cycle of degradation and desertification; erosion prevention refers to the inherent ability of different vegetation types to prevent soil erosion due to their morphology and structure, and is a supplement to the coverage indicator; in the early stage of desertification, the vegetation drought index can provide earlier warnings of the ecological condition compared to other indicators. These four indicators were classified and weighted, and the final results are shown in Figure 3.
Figure 3.
Vegetation quality index of Ordos from 2000 to 2024.
The results show that the overall vegetation quality index in the Ordos region shows a trend where the western areas have higher quality while the eastern areas have lower quality. The areas with better vegetation quality expand from the northeastern part of the city to the central part, while the areas with poorer vegetation quality remain relatively stable. Looking at the counties separately, the vegetation quality in Daratui County, Dongsheng District, Kangbaishan District, and Yijinhuoluo County is relatively good, while the vegetation sensitivity in Hangjin County and the western and northern parts of Etoqiu County is relatively high. The area around Kubuqi Desert in Hangjin County has poor vegetation quality and showed no significant improvement during the study period. Additionally, the sensitivity of the Muwuoshan Desert area in the southwest showed a more obvious upward trend. Over the past 25 years, the overall pressure on the vegetation system has not been fundamentally alleviated. There was a slight improvement from 2000 to 2006, but a significant deterioration occurred from 2006 to 2012, which was the worst level during the entire period. From 2012 to 2018, there was a significant improvement, and it basically stabilized by 2024. The responses of vegetation in different areas within the region to environmental pressure are becoming increasingly inconsistent. The spatial differences in vegetation sensitivity are expanding slowly but steadily, with some areas’ vegetation possibly recovering while others continue to deteriorate, resulting in a widening gap between good and poor conditions.
3.2.3. Soil Quality Index
Soil can maintain biological productivity and profoundly affects the sensitivity of land desertification [43]. In this study, five sub-indicators, namely soil depth, soil moisture, terrain slope, soil texture, and soil organic matter, were selected to evaluate soil quality, covering the chemical and physical properties of the soil, including soil salinity, water retention capacity, and fertility. Soil depth determines the vegetation site conditions. The shallower the soil, the more fragile the ecosystem is and the more sensitive it is to desertification. Soil moisture can enhance the adhesion force between soil particles, improving the soil’s resistance to wind erosion and water erosion. Slope is the main factor affecting the speed of surface runoff and erosion force. The greater the slope, the worse the surface stability is, and the more sensitive it is to erosion-induced desertification. Soil texture and organic matter are factors that characterize the system’s ability to resist land degradation risks. The study classified and assigned weights to these five indicators based on the natural break point method. The results are shown in Figure 4.
Figure 4.
Soil quality index of Ordos from 2000 to 2024.
The results show that over the past 25 years, the soil quality in the Ordos region has presented a pattern where the northeastern and southwestern areas have relatively lower-quality soil, while the northwestern and southeastern areas have relatively higher-quality soil. There has been no continuous improvement trend like that in terms of climate quality throughout the entire period, nor has there been a drastic deterioration fluctuation as observed for vegetation quality. From 2000 to 2006, there was a significant improvement trend, and then from 2006 to 2012, the sensitivity increased, and by 2018, the quality improved to a good level; from 2018 to 2024, the soil quality slightly deteriorated. This indicates that there are continuous and significant spatial differences in soil quality in different areas of the study region. This difference may be due to inherent soil-forming parent materials, topographic conditions, or imbalanced human activities such as excessive farming in some areas while others remain undisturbed. From 2006 to 2012, the climate continued to improve, but vegetation and soil deteriorated simultaneously. During this period, non-climatic and non-natural factors were at play, and human activities were the main driving force. From 2012 to 2018, the policy effects led to a significant improvement in vegetation and soil quality simultaneously under favorable climatic conditions. Previous destructive human activities may have been controlled, such as the effectiveness of ecological engineering and strengthened policy control, enabling the benefits of climate improvement to be smoothly transformed into ecological restoration. Due to the sharp deterioration of climate conditions from 2018 to 2024, vegetation has barely maintained stability, but soil quality has begun to decline. Soil degradation may have a lag effect, and the damage caused by climate and human activities in the past few years is now beginning to manifest in soil quality.
3.2.4. Human Activity Quality Index
Human management of the land can affect the growth patterns of vegetation and the trend of climate change. Large-scale deforestation, endless grazing, and improper land utilization all increase the risk of land desertification [44]. As an energy economy-dominated region, Ordos represents human activities such as energy development, infrastructure construction, and urban expansion; moreover, Ordos is a traditional livestock farming area, and overgrazing is one of the most direct human factors causing grassland degradation and desertification. Therefore, this study uses three indicators—land use intensity, night-time light index, and grazing intensity—to assess the management quality. Based on the natural breakpoint method and the CVSH model, these three indicators are classified and weighted, and the results are shown in Figure 5.
Figure 5.
Human activity quality index of Ordos from 2000 to 2024.
Specifically, the average value of the human activity quality index in 2000 was 1.401 with a standard deviation of 0.167; in 2006, the average value was 1.444 with a standard deviation of 0.159; in 2012, the average value was 1.470 with a standard deviation of 0.143; in 2018, the average value was 1.449 with a standard deviation of 0.153; in 2024, the average value was 1.421 with a standard deviation of 0.171. From 2000 to 2012, it was in a continuously deteriorating period. The human activity quality rose from 1.401 to 1.470, indicating that during these 12 years, the negative pressure of human activities on the environment continued to increase, and the management measures that were implemented failed to effectively curb desertification sensitivity. In the next stage from 2012 to 2024, the human activity quality fluctuated and improved, starting from the peak of 1.470, then fluctuating and dropping to 1.421, which indicates that the management situation has improved, the negative impact of human activities has begun to be controlled and reduced. The standard deviation decreased from 0.167 in 2000 to 0.143 in 2012 and then gradually expanded to 0.171 in 2024, meaning that in the context of the overall deterioration of management quality in the entire region, the management differences between different regions have been narrowing. In the following decade or so, in the context of overall improvement, the improvement degrees in different regions were not the same, leading to a widening of the management effectiveness differences between regions.
3.3. Evaluation of the Comprehensive Index of Desertification Sensitivity
The CVSH model first selects sub-indicators related to soil, vegetation, climate, and human activity, then classifies and assigns weights to the selected sub-indicators; next, based on the selected sub-indicators, it calculates the soil quality index, vegetation quality index, climate quality index, and human activity quality index, respectively. Finally, according to the AHP analytic hierarchy process, it calculates the geometric mean of the four quality indices based on the weights of each quality index (Table 3) and generates the desertification sensitivity index. The larger the index, the higher the desertification sensitivity and the greater the desertification risk. The desertification sensitivity is divided into 5 levels using the natural breakpoint method, namely non-sensitivity, mild sensitivity, moderate sensitivity, severe sensitivity, and extremely severe sensitivity.
Table 3.
Weights of desertification sensitivity quality index.
The results show that the distribution of desertification sensitivity in Ordos presents a general pattern of being lower in the east and higher in the west. Looking at the counties separately, in the northwest of Hangjin County and Otog County, the CIDS is between 1.75 and 1.86, belonging to the extremely sensitive area; in the west of Daratai County, the north of Wusun County and the west of Otog Qian County, the CIDS is between 1.60 and 1.74, belonging to the high-sensitivity zone; in Dongsheng County, Kangbashi District and Yijinhuoluo County, most of the CIDS is between 1.35 and 1.59, belonging to the moderately sensitive zone; while in the eastern part of Junggar County and the southern part of Wusun County, the CIDS is between 1.08 and 1.34, belonging to the low-sensitivity zone (Figure 6).
Figure 6.
Comprehensive index of desertification sensitivity in Ordos from 2000 to 2024.
By statistically analyzing the area of land with different levels of desertification sensitivity (Table 4, Figure 7), it was found that between 2000 and 2024, the desertification sensitivity in Ordos underwent significant changes, which were roughly divided into two stages. From 2000 to 2018, the area of non-sensitive land increased from 7956 km2 to 19,772.5 km2, with a net increase of 11,816.5 km2. The proportion rose from 9.19% to 22.84%, an increase of 13.65 percentage points, which was the most significant improvement among all levels. The moderately sensitive land, as the largest category, decreased from 37,446.5 km2 to 20,754.5 km2, with a net reduction of 16,692 km2, and the proportion dropped from 43.25% to 23.97%, a decrease of 19.28 percentage points. This indicates that a large area of intermediate state land has shifted to a more favorable state. Meanwhile, the area of severe sensitivity decreased by 2576.5 km2, with the proportion dropping from 18.49% to 15.52%, and the area with extremely severe sensitivity decreased by 1149 km2, with the proportion falling from 9.27% to 7.94%. The lightly sensitive land first increased and then stabilized. It reached its peak in 2006 and became one of the main recipients of the transformation from moderate- to high-sensitivity land. In 2018, its proportion was 29.74%. During the improvement period from 2000 to 2018, Ordos implemented a series of ecological projects, such as returning farmland to forests, returning grazing land to grassland, the Beijing–Tianjin sand source control project, and the construction of the Three North Shelter Forest System, which increased the area of non-sensitive regions from 9.19% to 22.84% and decreased the area of moderately sensitive regions from 43.25% to 23.97%. At the same time, the area of extremely severe sensitivity also decreased from 9.27% to 7.94%. From 2018 to 2024, the proportion of areas with severe sensitivity increased from 15.52% to 30.07%, which is usually the core area of sensitivity deterioration. At the same time, the proportion of non-sensitive areas decreased from 22.84% to 16.14%, and the recovery of the ecosystem may face new pressures or the effectiveness of the original measures may encounter bottlenecks.
Table 4.
Area and proportion of different levels of desertification sensitivity from 2000 to 2024.
Figure 7.
Transfer map of desertification sensitivity in Ordos from 2000 to 2024 (Sangki diagram).
3.4. Spatial Aggregation Pattern of Desertification Sensitivity
This study analyzed spatial autocorrelation through the Local Moran’s I statistic, identifying spatial clustering and distribution patterns related to CIDS [45]. These clusters were classified into four categories: high–high (HH), low–low (LL), high–low (HL), and low–high (LH). The Local Moran’s I indices for the years 2000, 2006, 2012, 2018, and 2024 were 0.82, 0.85, 0.79, 0.84, and 0.78, respectively, with all p values being less than 0.001. This indicates that the desertification sensitivity in Ordos has a very strong spatial autocorrelation in each year. The data show that the high–high aggregation areas are mainly in the northwest of Hengjin County and the northern edge of Otog, while the low–low aggregation areas are distributed in the east of Junggar and the south of Wusu. The high–low and low–high aggregations are located in the west of Daralat County and the north of Wusu County. The model shows that the concentration of highly vulnerable and key CIDS categories in the northern and central regions has been continuously increasing, which is consistent with the HH clustering characteristics identified in the spatial autocorrelation analysis. Over the past 25 years, the HH and LL patch patterns have remained unchanged, but since 2012, HH has continued to shrink, LL has accelerated to form large patches, the high–low and low–high transition zone has significantly narrowed, and the desertification risk is locked in the two HH core areas in the northwest corner (Figure 8 and Figure 9).
Figure 8.
Local spatial autocorrelation of desertification sensitivity in Ordos from 2000 to 2024.
Figure 9.
Map of desertification sensitivity hotspots in Ordos from 2000 to 2024.
3.5. Component Analysis of Factors Affecting Desertification Sensitivity
3.5.1. Single-Factor Driving Force Analysis Based on Geographical Detector
This study, based on the factor detection and interactive factor detection modules in the geographic detector, explores the driving effect of internal factors on the sensitivity of desertification. Figure 10 shows the degree of influence of soil quality index, vegetation quality index, climate quality index, and human activity quality index on the sensitivity of desertification. The results indicate that the influence of the four indicators on the sensitivity of desertification in different years, ranked by the q value, is as follows: climate quality index > vegetation quality index > human activity quality index > soil quality index; this suggests that the climate factor has the greatest impact on the sensitivity of land desertification in China, followed by the vegetation factor, while the soil and human activity factors have relatively lower impacts. Among them, the fluctuations of the vegetation quality index and climate quality index are very small, while the fluctuations of the soil quality index and human activity quality index are relatively large. This indicates that the human activity factor is the main driving force for the transformation of desertification sensitivity from 2018 to 2024 (Figure 10).
Figure 10.
The q values of the climate quality index (a), vegetation quality index (b), soil quality index (c), and human activity quality index (d) in different years.
The results show that the q values of each sub-indicator fluctuated to varying degrees, but the relative importance did not change. The core driving factors include the annual average precipitation, drought resistance, soil depth, grazing pressure, and the soil moisture content in the later stage. The important synergistic factors include vegetation coverage, annual average temperature, net primary productivity, soil texture, and the fluctuating dryness index. The secondary factors have relatively weak explanatory power, including soil organic matter, land use intensity, erosion protection, average wind speed, slope, and night light index. The annual average precipitation, as the most stable core driving factor, has continuously strengthened its explanatory power, highlighting the fundamental role of water resources in this research ecosystem. The explanatory power of soil moisture content showed a significant increase in 2024, together with the drought resistance of vegetation, forming the most influential driving factor. This transformation indicates that the dominant mechanism of desertification sensitivity differentiation has evolved from the macro precipitation pattern to the soil–vegetation system, possibly reflecting the intensification of regional climate aridity and the deepening of its ecological effects. In contrast, factors such as soil depth and grazing pressure maintained relatively high and stable explanatory power, constituting the foundation for the desertification sensitivity pattern in the Ordos region (Table 5, Figure 11).
Table 5.
Results of single-factor sensitivity analysis of desertification from 2000 to 2024.
Figure 11.
Single-factor detection results for different years.
3.5.2. Factor Interaction Analysis Based on Geodetectors
The results of the interaction factor detection show that the influence of each pair of sub-indicators on the sensitivity to desertification is manifested as an enhancement (dual-factor enhancement or nonlinear enhancement), indicating that the explanatory power of the interaction between the factors is greater than that of the factors themselves. Taking the year 2000 as an example, the q value after any two factors interact is greater than the independent q values of the two factors. There are complex interdependencies and amplification effects among the driving factors. Among them, the interaction between soil depth and precipitation has the strongest explanatory power. This indicates that in arid and semi-arid regions, the thickness of the soil layer is a prerequisite for the effective utilization of limited precipitation, and the two factors jointly determine the water-carrying capacity of the ecosystem and the potential for vegetation recovery. Additionally, the interaction between grazing pressure and dryness is one of the key interactions of natural and human factors. This shows that in regions with dry climates, excessive grazing will directly lead to irreversible degradation of vegetation and soil desertification (Figure 12).
Figure 12.
Interactive diagram of factors influencing desertification sensitivity from 2000 to 2024.
3.5.3. Principal Component Analysis Based on PCA
To enhance the robustness of the CVSH model in identifying the key drivers of desertification sensitivity, this study employed the Principal Component Analysis (PCA) method to explore the driving mechanism of desertification sensitivity in the study area. The dependent variable data extracted from five time points of 2000, 2006, 2012, 2018, and 2024 included four quality indicators and 16 sub-indicators, while the independent variable data was CIDS. The results showed that the two principal components, respectively, explained 65.9%, 65.2%, 65.1%, 65.5%, and 65.4% of the total variance, all exceeding 60%, indicating the reliability of the model. PC1 had prominent loadings on the drought index, soil moisture content, and precipitation indicators, comprehensively reflecting the dominant role of regional water limitation in ecosystem sensitivity. PC2 had significant loadings on grazing pressure, night light index, and vegetation coverage, revealing the coupling relationship between human disturbance and vegetation degradation (Figure 13).
Figure 13.
The principal component analysis results of the four quality indices and 16 sub-indicators of desertification sensitivity from 2000 to 2024.
Through the five-period PCA from 2000 to 2024, it was found that the explanatory power of PC1 was relatively stable, indicating that climate aridification and soil moisture stress gradually became the core factors driving desertification sensitivity. During the period of ecological engineering implementation from 2000 to 2012, the contribution rate of PC2 decreased, reflecting the control of human disturbance; but after 2018, the contribution rate rose again, and the increase was closely related to the intensification of human activities in local areas. The interaction analysis of the geographic detector showed that the q value of “drought index ∩ grazing pressure” significantly increased after 2018, corresponding to the coordinated change mechanism of PC1 and PC2. This indicates that the evolution of desertification sensitivity is a nonlinear process driven by “increased natural stress” and “reactivation of human disturbance”, and the coupling effect of the two dimensions has significantly strengthened in the later stage. The dual-dimensional driving pattern revealed by PCA indicates that a single ecological engineering measure may be limited in effectiveness under the background of continuous climate aridification, and it is necessary to combine dynamic stocking rate management or energy zone ecological restoration to form an adaptive governance path.
3.6. Analysis of the Driving Mechanism of the Spatial Pattern of Desertification Sensitivity
Based on the above research results, the spatial pattern and evolution of desertification sensitivity in the Ordos region were analyzed. The natural background laid the basic framework for the east–west differentiation. The results of the geographical detector showed that the climate quality index and soil quality index were the most stable dominant factors in explaining the spatial differentiation. The western region is located in the center of aridity, with low annual precipitation, high aridity index, and strong sandy soil and thin soil layer. The fragile natural background makes its ecosystem stability inherently insufficient, constituting the basis of high sensitivity. At the same time, human activities are the key to the evolution of the pattern and local hotspots: the interaction detector found that “grazing pressure ∩ aridity index” has a very strong nonlinear enhancement effect. This indicates that in the western arid area, even moderate grazing intensity will be amplified by the arid climate, making it difficult for vegetation to recover, thereby maintaining and intensifying the high sensitivity in the west. Spatially, the high grazing pressure area is highly coincident with the high-sensitivity hotspots. Secondly, the local disturbances caused by energy development and urban expansion have led to a significant spatial correlation between the high-value areas of the night light index and the new or intensified high-sensitivity patches that emerged after 2018. This indicates that such high-intensity human activities have formed new sensitive areas in the local area through direct destruction of surface cover and alteration of hydrological processes. Finally, based on the spatial heterogeneity of the ecological engineering benefits, the overall sensitivity of Ordos improved from 2000 to 2018, but the improvement degree was uneven in space. The eastern region has better water, heat and soil conditions, and the effects of projects such as returning farmland to forest and grassland are significant, forming a stable low-sensitivity area. However, in the areas with extremely poor natural background in the west, although there are also engineering covers, the improvement is limited and unstable, revealing that the effect of ecological engineering is constrained by the regional natural carrying capacity.
4. Discussion
This study evaluated the spatiotemporal pattern of desertification sensitivity in Ordos City from 2000 to 2024 using the CVSH model and revealed the driving mechanisms of its evolution. This chapter aims to deeply explore the scientific significance of the above results, the dialogue with existing studies, the applicability and limitations of the research methods, and preliminarily explain the implications for ecological governance based on the regional reality.
4.1. The Causes and Significance of the Spatiotemporal Pattern of Desertification Sensitivity
The spatial pattern of desertification sensitivity in Ordos City, which was discovered in this study, shows a “lower east and higher west” distribution, which is highly consistent with the regional natural geographical background [46]. The highly sensitive areas (such as the northwest of Hangjin County and the northwest of Otog County) are precisely located in the core and marginal areas of the Kubuqi Desert and the Maowusu Sandy Land. These areas have sandy soil texture, arid climate, and low original vegetation coverage, making the ecosystem background extremely fragile. This is consistent with the conclusion drawn by Liu Junhui at the national scale [19], which states that the ecological sensitivity of the desert edge in arid and semi-arid areas is the highest. While the eastern areas such as Qiange County have lower sensitivity, this is related to relatively better water and heat conditions, loess coverage, and long-term water and soil conservation management achievements [25].
The overall improvement trend of sensitivity from 2000 to 2018 was highly consistent with the temporal and spatial coverage and continuous advancement of a series of major ecological projects implemented by the country and localities, such as the “Three North” Shelter Forest Project, the Beijing–Tianjin Wind Desert Source Control Project, and the reforestation and grassland restoration projects under the “return farmland to forest and grassland” policy [47]. The dynamic transfer matrix of this study clearly reveals the dominant paths of transition from moderate and severe sensitivity to mild and non-sensitive states, providing quantitative evidence for the regional ecological benefits of these macro projects. However, the reversal trend that emerged from 2018 to 2024—especially the rapid expansion of the area of severely sensitive regions—issued an important warning. This turning point was coupled with the rebound of the climate quality index and the slowdown in the improvement of human activity quality index during the same period. This suggests that in the context of climate change [48], the marginal benefits of early ecological projects may enter a plateau or face new climate pressures, and the continuous impact of human activities cannot be ignored [49,50]. This is in line with the viewpoint of Jiang Xuhai et al. in their study in Inner Mongolia, which pointed out the volatility and uncertainty of the desertification reversal process [51]. In order to gain a deeper understanding of the driving mechanism behind this crucial turning point, this study further integrated detailed data on climate, soil, and human activities for an attribution analysis.
4.2. The 2018 Inflection Point: Underlying Mechanisms and Synergistic Effects
The evolution of desertification sensitivity in Ordos presented a significant turning point around 2018, marking a shift from a continuous improvement phase (2000–2018) to a phase of significant reversal (2018–2024). A quantitative indicator of this turning point is the sharp re-expansion of highly sensitive areas, with their spatial proportion increasing from 15.52% in 2018 to 30.07% in 2024. This reversal is the core finding of this study, indicating an increase in regional ecosystem vulnerability.
The primary natural driving force behind this turning point is the intensification of climate aridity, which has evolved from precipitation deficiency to severe soil moisture stress. After 2018, the climate quality index showed a significant deterioration (Figure 2), and the climate conditions in the study area became increasingly sensitive to desertification. The average value from 2000 to 2018 continuously declined from 1.464 to 1.352. In other words, from a climatic perspective, the regional ecological environment became more stable and less prone to desertification. However, from 2008 to 2024, the average value rebounded from 1.352 to 1.430. This was specifically manifested in a continuous increase in the aridity index and a significant decrease in soil moisture content during the growing season. Key evidence comes from the geographical detector analysis, where the explanatory power of the soil moisture content factor rose sharply in 2024, becoming one of the core factors driving spatial differentiation (Table 4). This transformation indicates that the climatic driver has shifted from atmospheric water shortage to a more direct and ecologically decisive soil–vegetation water deficit, severely stressing the restored ecosystem.
Meanwhile, human pressure has not been effectively alleviated and has produced amplifying disturbances in the context of a drier climate. Human activity quality data show that grazing pressure and energy/town expansion pressure did not significantly decline simultaneously during this period (Figure 5). This result indicates that under the increasingly arid climate conditions after 2018, the ecological impact of human activities of a given intensity has been disproportionately amplified. In summary, the turning point in 2018 was not caused by a single factor but by the nonlinear coupling of intensified soil moisture stress and continuous human pressure. Even if significant investment has been made in ecological restoration in the past, if human activities are not simultaneously and strictly regulated when climatic conditions turn unfavorable, the ecological achievements already made can still be rapidly offset.
4.3. Spatial Clustering Pattern of Desertification Sensitivity
The “high–high” (HH) and “low–low” (LL) significantly clustered patterns revealed by spatial autocorrelation analysis have important ecological and management significance. The spatial stability of the high–high aggregation areas indicates that the high-risk of desertification in the northwest of Ordos is not distributed in isolated points but forms contiguous vulnerable geographical units. This stability may stem from the relatively homogeneous and harsh natural background conditions in this area, which make its response to external disturbances consistent and persistent. Even during the overall improvement period from 2000 to 2018, the contraction of these core HH aggregation areas was relatively limited, demonstrating the “ecological memory” effect and the difficulty of recovery.
The expansion of the low–low aggregation areas and the enhancement of their connectivity, especially after 2012, reflect the more significant and more contiguous achievements of ecological engineering measures in the relatively favorable eastern and southern regions, which may have promoted the initial formation of a regional ecological security pattern. However, the existence and evolution of high–low (HL) and low–high (LH) outlier areas also deserve attention. These transitional or marginal areas, such as parts of western Daratui and northern Wusu, demonstrate the spatial heterogeneity and instability of the ecosystem state, and may be the result of the combined effects of different land use patterns, the intensity of governance measures, or micro-topographic and climatic differences. They are also often the sensitive frontiers where ecological degradation or recovery occurs first.
This remarkable spatial clustering pattern suggests that desertification control policies need to go beyond the homogeneous thinking approach and should respect and respond to this inherent spatial self-organizing law. For stable HH aggregation areas, the most intense and sustainable protection and restoration measures should be taken; while for the HL/LH transitional zones, monitoring and adaptive management should be strengthened to prevent their transformation in an unfavorable direction.
4.4. The Driving Mechanisms of Natural and Human Factors
The results of the geophysical detector and principal component analysis are consistent in indicating that climate quality and vegetation quality are the most dominant factors driving the spatial differentiation of desertification sensitivity in the Ordos region. This confirms that in arid and semi-arid areas, water availability is the primary limiting factor for ecosystem stability. It is notable that the explanatory power of the soil moisture factor has significantly increased in 2024, possibly reflecting the intensification of climate aridification in recent years, which has led to soil moisture stress becoming a more direct limiting factor, causing the desertification process to evolve from being controlled by the macro precipitation pattern to a more direct relationship between soil and vegetation moisture. One of the key findings of this study is that the majority of the interaction types among the influencing factors are of the “non-linear enhancement” type. This indicates that in ecologically fragile areas like Ordos, the negative effects of a single factor are often significantly amplified when combined with other factors. For instance, the strong interaction of “grazing pressure ∩ dryness index” suggests that in dry years or regions, even moderate grazing intensity may trigger severe grassland degradation and desertification; while the interaction of “land use intensity ∩ vegetation coverage” reveals the direct squeezing and interference effect of human land development expansion on the space for vegetation restoration. This supports the view of Burrell that human activities are the key catalysts for accelerating land degradation in arid areas into deserts. Therefore, future risk management must shift from managing individual factors to regulating the coupling relationships among factors.
4.5. Methodological Applicability, Limitations, and Future Research Prospects
The CVSH model adopted in this study enhanced its applicability and explanatory power at the local scale by using the AHP method for weighting and incorporating regional indicators, such as grazing pressure and night light index. However, this study still has certain limitations that need to be addressed in subsequent research.
Firstly, there is the issue of data accuracy and timeliness. Some social and economic data are lagging behind. The acquisition of high-resolution and real-time human activity data remains challenging. In the future, multiple sources of remote sensing data and social sensing data can be integrated to enhance the spatiotemporal resolution of desertification sensitivity monitoring. Secondly, the current assessment is mainly based on historical data and fails to dynamically simulate the future evolution of sensitivity under different climate change scenarios (SSPs) and human development paths (RCPs). By coupling models such as CA-Markov, dynamic predictions and scenario analyses of future trends can be achieved. In addition, the model is essentially an indicator-weighted superposition model, which lacks sufficient depiction of the mechanisms such as ecological hydrological processes and vegetation dynamics. In the future, it can be attempted to combine with process models or machine learning methods to deepen the understanding of the threshold and critical points of desertification.
This study still focuses on the quantification of human activity quality based on pressure indicators, and lacks assessment of the response efficacy of specific policies or projects. In the future, it can be combined with the PSR or DPSIR framework to systematically incorporate policy response indicators into the evaluation system.
5. Conclusions
This study took Ordos City as a case study. By improving the desertification sensitivity assessment model and integrating multi-source data and spatial analysis methods within the CVSH framework, it systematically evaluated the temporal and spatial evolution patterns and driving mechanisms of regional desertification sensitivity from 2000 to 2024. The main conclusions are as follows:
1. The desertification sensitivity in Ordos City shows significant spatial heterogeneity and phased evolution characteristics. Spatially, it presents a general pattern of “lower in the east and higher in the west”. The high-sensitivity areas are mainly concentrated in the northwest’s Kubuqi Desert and the core and marginal areas of the Maowusu Sandy Land. Temporally, from 2000 to 2018, the sensitivity improved overall, and the areas of non-sensitive and slightly sensitive regions significantly increased, reflecting the positive effects of large-scale ecological projects. However, from 2018 to 2024, the situation underwent a critical reversal. The area of severely sensitive regions expanded sharply, becoming the highest proportion category, indicating that the regional ecosystem remains fragile, and the risk of desertification has risen under the pressure of climate change and continuous human activities.
2. The sensitivity to desertification exhibits a strong spatial autocorrelation and clustering effect. Both global and local spatial autocorrelation analyses indicate that the sensitivity is not randomly distributed but forms significant spatial clusters of “high–high” and “low–low”. The “high–high” aggregation areas (hotspot areas) have relatively stable spatial positions and are the core target areas that require the most attention and continuous monitoring in desertification prevention and precise policy implementation.
3. Desertification sensitivity is the result of the nonlinear synergy between natural background and human activities. The results of geographical detectors and principal component analysis show that climatic quality and vegetation quality are the dominant natural factors explaining the spatial variation in sensitivity. More importantly, the interaction among various driving factors generally exhibits a “nonlinear enhancement” effect, indicating that human activities such as grazing, land use changes in fragile ecological environments, when combined with unfavorable natural conditions, will superimpose and significantly amplify the risk of desertification. The recent increase in the explanatory power of soil moisture content suggests that the intensification of aridification may be causing the dominant mechanism of desertification to evolve towards a more direct process of soil–vegetation water stress.
4. Based on the above discussion, the results of this study provide preliminary insights for the prevention and control of desertification in Ordos City.
Adhere to the principle of zoning and classification, and implement targeted policies: We must attach great importance to and continuously monitor the stable “high–high” concentrated areas in the northwest region, and implement the strictest protection and targeted recovery measures. For the improved areas in the east, efforts should be made to consolidate the achievements and prevent a relapse.
Adapting to climate change and enhancing system resilience: In ecological engineering planning and species selection, the trend of future climate warming and drying must be fully considered. Species that are drought-resistant and resilient should be given priority. An elastic ecosystem should be constructed to cope with the risks brought about by climate fluctuations.
Regulate key human-induced pressures and manage interaction risks: It is necessary to strictly supervise and scientifically plan activities such as energy development and livestock farming, paying particular attention to their cumulative effects in unfavorable climatic years or vulnerable areas. Through measures like grass–cattle balance and seasonal grazing, the negative interaction effects between grazing and climate can be alleviated.
Promoting dynamic monitoring and adaptive management: A regional desertification sensitivity dynamic monitoring and early warning platform integrating remote sensing, ground monitoring and socio-economic data should be established to achieve the transformation from static assessment to dynamic simulation, and from post-event governance to pre-event warning, thereby supporting adaptive management decisions.
5. Based on the driving mechanisms and spatial patterns revealed by this study, we propose the following strategies that directly serve desertification control and ecological security management: Firstly, the spatially stable “high–high” sensitive aggregation areas should be designated as the core control zones within the ecological red line and subject to the strictest human activity restrictions. Secondly, ecological restoration projects should shift to a climate-adaptive model, prioritizing the use of deep-rooted native drought-tolerant plants and water-saving technologies to cope with soil moisture stress. Thirdly, a “climate-herding” linkage early warning system should be established, automatically triggering the regulation of livestock carrying capacity when drought warnings are issued, to avoid nonlinear disaster risks. Finally, for energy bases, an “exploitation-governance-restoration” ecological closed-loop management system should be implemented, through strict limiting of operation areas and the implementation of a restoration guarantee system, to achieve a dynamic balance between development and protection. These measures collectively constitute a precise control framework that supports the coordinated sustainable development of the ecological barrier and energy base in Ordos.
Author Contributions
Conceptualization, Q.Q. and Y.H.; methodology, M.Z.; investigation, G.S.; writing—original draft, M.Z.; supervision, Y.H. and W.Z.; funding acquisition, Y.H. and W.Z. All authors have read and agreed to the published version of the manuscript.
Funding
This research was funded by National Key Research and Development Program of China. The third topic: Research on Multi-Scale Assessment Technologies for Ecological Impacts of Emergencies (2024YFF1306203), Sub-topic One: Research on Spatiotemporal Patterns of Ecological Impacts of Emergencies.
Institutional Review Board Statement
Not applicable.
Informed Consent Statement
Not applicable.
Data Availability Statement
The original contributions presented in this study are included in the article. Further inquiries can be directed to the corresponding author.
Conflicts of Interest
The authors declare no conflicts of interest.
References
- You, Y.; Zhao, H.; Zhou, N.; Wang, Y.D. The International Cooperation Process and Prospects of Desertification Control in China. World For. Res. 2021, 4, 72–76. [Google Scholar]
- Daily, G.C. Restoring value to the world’s degraded lands. Science 1995, 269, 350–354. [Google Scholar] [CrossRef] [Scilit]
- Elnashar, A.; Zeng, H.; Wu, B.; Gebremicael, T.G.; Marie, K. Assessment of environmentally sensitive areas to desertification in the Blue Nile Basin driven by the MEDALUS-GEE framework. Sci. Total Environ. 2022, 815, 152925. [Google Scholar] [CrossRef] [Scilit] [PubMed]
- Zhang, Y.; Hou, K.; Qian, H.; Gao, Y.; Fang, Y.; Xiao, S.; Tang, S.; Zhang, Q.; Qu, W.; Ren, W. Characterization of soil salinization and its driving factors in a typical irrigation area of Northwest China. Sci. Total Environ. 2022, 837, 155808. [Google Scholar] [CrossRef] [Scilit] [PubMed]
- Thomas, D.S.G.; Middleton, N.J. Desertification: Exploding the Myth; John Wiley & Sons: Chichester, UK, 1994. [Google Scholar]
- Reynolds, J.F.; Smith, D.M.S.; Lambin, E.F.; Turner, B.L.; Mortimore, M.; Batterbury, S.P.; Downing, T.E.; Dowlatabadi, H.; Fernández, R.J.; Herrick, J.E.; et al. Global desertification: Building a science for dryland development. Science 2007, 316, 847–851. [Google Scholar] [CrossRef] [Scilit]
- Safriel, U.; Adeel, Z. Development paths of drylands: Thresholds and sustainability. Sustain. Sci. 2008, 3, 117–123. [Google Scholar] [CrossRef] [Scilit]
- Zhang, F.; Wang, J.; Zou, X.; Mao, R.; Gong, D.; Feng, X. Wind erosion climate change in northern China during 1981–2016. Int. J. Disaster Risk Sci. 2020, 11, 484–496. [Google Scholar] [CrossRef] [Scilit]
- Budak, M.; Günal, H.; Çelik, I.; Yıldız, H.; Acir, N.; Acar, M. Environmental sensitivity to desertification in northern Mesopotamia: Application of modified MEDALUS by using analytical hierarchy process. Arab. J. Geosci. 2018, 11, 481. [Google Scholar] [CrossRef] [Scilit]
- Ren, Y.; Zhang, B.; Chen, X.D. Assessment of Land Desertification Sensitivity in the Horqin Sandy Land. J. Desert Res. 2023, 43, 159–169. [Google Scholar]
- Abuzaid, A.S.; Abdelatif, A.D. Assessment of desertification using modified MEDALUS model in the north Nile Delta, Egypt. Geoderma 2022, 405, 115400. [Google Scholar] [CrossRef] [Scilit]
- Ogbue, C.; Igboeli, E.; Ajaero, C.; Ochege, F.U.; Yahaya, I.I.; Yeneayehu, F.; You, Y.; Wang, Y. Remote sensing analysis of desert sensitive areas using MEDALUS model and GIS in the Niger River Basin. Ecol. Indic. 2024, 158, 111404. [Google Scholar] [CrossRef] [Scilit]
- Afzali, S.F.; Khanamani, A.; Maskooni, E.K.; Berndtsson, R. Quantitative assessment of environmental sensitivity to desertification using the modified MEDALUS model in a semiarid area. Sustainability 2021, 13, 7817. [Google Scholar] [CrossRef] [Scilit]
- Mashhadi, A.; Jafari, R. Mapping and quantitative identification of regions sensitive to land degradation in south of Isfahan Province using modified MEDALUS model. J. Geogr. Environ. Hazards 2022, 11, 57–75. [Google Scholar]
- Prăvălie, R.; Patriche, C.; Săvulescu, I.; Sîrodoev, I.; Bandoc, G.; Sfîcă, L. Spatial assessment of land sensitivity to degradation across Romania: A quantitative approach based on the modified MEDALUS methodology. Catena 2020, 187, 104407. [Google Scholar] [CrossRef] [Scilit]
- Zheng, J.; Sun, G.; Su, X.; Ran, Y.; Zheng, X. Desertification Change Trends and Driving Factors in the Aksu Region. Bull. Soil Water Conserv. 2022, 42, 278–285. [Google Scholar]
- Alliouche, A.; Kouba, Y. Modelling the spatiotemporal dynamics of land susceptibility to desertification in Algeria. Catena 2023, 232, 107437. [Google Scholar] [CrossRef] [Scilit]
- Ferrara, A.; Salvati, L.; Sateriano, A.; Nolè, A. Performance evaluation and cost assessment of a key indicator system to monitor desertification vulnerability. Ecol. Indic. 2012, 23, 123–129. [Google Scholar] [CrossRef] [Scilit]
- Liu, J.H.; Gao, J.X.; Ma, S.; Wang, W.J.; Zou, C.X. Evaluation of Ecological Environment Sensitive Areas in China. J. Nat. Resour. 2015, 30, 1607–1616. [Google Scholar]
- Li, Z.Y.; Wei, W.; Zhou, L.; Liu, C.F.; Guo, Z.C.; Pang, S.F.; Zhang, J. Spatiotemporal Evolution Characteristics of Ecological Sensitivity in China’s Terrestrial Ecosystems. Acta Geogr. Sin. 2022, 77, 150–163. [Google Scholar]
- Zhao, Z.Y.; Zhang, Y.L.; Li, T.; Lu, Y.; Wang, C.; Wu, X. Comprehensive Ecological Sensitivity Assessment and Spatiotemporal Evolution Analysis of the Tibetan Plateau Based on a Spatial Distance Index. Acta Ecol. Sin. 2022, 42, 7403–7416. [Google Scholar]
- Dong, X.; Xu, D.; Shi, X.; Du, S. Ecological sensitivity evaluation of the Gansu section of the Yellow River: A case study of Guanghe County. Arid. Land Geogr. 2024, 47, 599–621. [Google Scholar]
- Tang, Y.P.; Shu, M.R.; Wu, Y.J.; Xuan, Y. Ecological Sensitivity Evaluation and Spatial Pattern Analysis of Minjiang Estuary National Wetland Park based on GIS. J. Resour. Ecol. 2024, 15, 33–43. [Google Scholar] [CrossRef] [Scilit]
- Sun, G.L.; Li, X.; Liu, Y.Y.; Zheng, J.; Ma, J.; Ran, Y. Dynamic Changes and Driving Forces of Desertification Risk in Turpan City. Arid. Land Geogr. 2022, 45, 401–412. [Google Scholar]
- Deng, X.H.; Song, Y.L.; Li, Z.S.; Zhao, T. Evolution Pattern and Zonal Management of Ecological Sensitivity in the Hexi Region. J. Desert Res. 2023, 43, 232–240. [Google Scholar]
- You, N.S.; Meng, J.J. Ecological Function Zoning and Ecosystem Management in the Middle Reaches of the Heihe River Based on Ecological Sensitivity and Ecosystem Services. J. Desert Res. 2017, 37, 186–197. [Google Scholar]
- Zhao, M.Y.; Zhao, W.W.; Jin, T.; An, Y.; Xu, H. Sensitivity Assessment of Land Desertification in the Qinghai Lake Basin. Chin. Agric. Sci. Bull. 2012, 28, 237–242. [Google Scholar]
- Hu, M.T.; Zhang, H.; Gao, J.X.; Qiu, K.B.; Wang, Y.S.; Lv, J.J.; Ju, C.H. Land Desertification Sensitivity Assessment Based on RWEQ Model Modification. Res. Soil Water Conserv. 2021, 28, 368–372. [Google Scholar]
- Guo, B.H.; Zhang, X.M.; Liu, J.P.; You, M.; Gan, X.; Yang, Y. Effects of Slope Gradient on Soil Properties and Desertification Performance of Highway Slope Protection in Alpine Meadow. Acta Prataculturae Sin. 2022, 31, 15–24. [Google Scholar]
- Dong, G.L.; Wang, J.; Wang, H.; Cheng, W.; Liu, Z.; Zhang, W. Identification of Agricultural Land Use Conflicts and Land Degradation Risk in the Ili River Valley from a Spatial Matching Perspective. Resour. Sci. 2024, 46, 2419–2433. [Google Scholar]
- Sun, B.F.; Wang, X.K. Sensitivity Assessment of Desertification in Xinjiang. J. Southwest China Norm. Univ. (Nat. Sci. Ed.) 2015, 40, 108–112. [Google Scholar]
- Tian, L.; Qiu, S.J.; Peng, J.; Hu, Y.; Jia, J.; Mao, Q. Assessment of desertification sensitivity in Inner Mongolia Autonomous Region based on PSR framework. Prog. Geogr. 2018, 37, 1682–1692. [Google Scholar]
- Yang, J.; Huang, X. The 30 m annual land cover dataset and its dynamics in China from 1990 to 2019. Earth Syst. Sci. Data 2021, 13, 3907–3925. [Google Scholar] [CrossRef] [Scilit]
- Wang, D.; Peng, Q.; Li, X.; Zhang, W.; Xia, X.; Qin, Z.; Ren, P.; Liang, S.; Yuan, W. A long-term high-resolution dataset of grasslands grazing intensity in China. Sci. Data 2024, 11, 1194. [Google Scholar] [CrossRef] [Scilit] [PubMed]
- Chen, Z.; Yu, B.; Yang, C.; Zhou, Y.; Yao, S.; Qian, X.; Wang, C.; Wu, B.; Wu, J. An extended time series (2000–2018) of global NPP-VIIRS-like nighttime light data from a cross-sensor calibration. Earth Syst. Sci. Data 2021, 13, 889–906. [Google Scholar] [CrossRef] [Scilit]
- Wang, K.F.; Li, N. Evaluation of geological environment carrying capacity in Shandong Peninsula based on coupled AHP and GIS model. China Popul. Resour. Environ. 2015, 25, 224–227. [Google Scholar]
- Wang, J.-F.; Li, X.-H.; Christakos, G.; Liao, Y.-L.; Zhang, T.; Gu, X.; Zheng, X.-Y. Geographical detectors-based health risk assessment and its application in the neural tube defects study of the Heshun region, China. Int. J. Geogr. Inf. Sci. 2010, 24, 107–127. [Google Scholar] [CrossRef] [Scilit]
- Wang, X.; Meng, Q.; Zhang, L.; Hu, D. Evaluation of urban green space in terms of thermal environmental benefits using geographical detector analysis. Int. J. Appl. Earth Obs. Geoinf. 2021, 105, 102610. [Google Scholar] [CrossRef] [Scilit]
- Wei, W.; Guo, Z.; Shi, P.; Zhou, L.; Wang, X.; Li, Z.; Pang, S.; Xie, B. Spatiotemporal changes of land desertification sensitivity in northwest China from 2000 to 2017. J. Geogr. Sci. 2021, 31, 46–68. [Google Scholar] [CrossRef] [Scilit]
- Wang, Y.; Lv, W.; Wang, M.; Chen, X.; Li, Y. Application of improved Moran’s in the evaluation of urban spatial development. Spat. Stat. 2023, 54, 100736. [Google Scholar] [CrossRef] [Scilit]
- Song, C.; Kim, W.; Kim, J.; Gebru, B.M.; Adane, G.B.; Choi, Y.E.; Lee, W.K. Spatial assessment of land degradation using MEDALUS focusing on potential afforestation and reforestation areas in Ethiopia. Land Degrad. Dev. 2022, 33, 79–93. [Google Scholar] [CrossRef] [Scilit]
- Shao, W.; Wang, Q.; Guan, Q.; Zhang, J.; Yang, X.; Liu, Z. Environmental sensitivity assessment of land desertification in the Hexi Corridor, China. CATENA 2023, 220, 106728. [Google Scholar] [CrossRef] [Scilit]
- Borrelli, P.; Panagos, P.; Alewell, C.; Ballabio, C.; Fagundes, H.d.O.; Haregeweyn, N.; Lugato, E.; Maerker, M.; Poesen, J.; Vanmaercke, M.; et al. Policy implications of multiple concurrent soil erosion processes in European farmland. Nat. Sustain. 2023, 6, 103–112. [Google Scholar] [CrossRef] [Scilit]
- Jiang, L.; Jiapaer, G.; Bao, A.; Kurban, A.; Guo, H.; Zheng, G.; De Maeyer, P. Monitoring the long-term desertification process and assessing the relative roles of its drivers in Central Asia. Ecol. Indic. 2019, 104, 195–208. [Google Scholar] [CrossRef] [Scilit]
- Anselin, L. Local Indicators of Spatial Association—LISA. Geogr. Anal. 1995, 27, 93–115. [Google Scholar] [CrossRef] [Scilit]
- Wei, C.J.; Meng, J.J. Ecological sensitivity assessment and spatial pattern analysis of land resources in China. J. Peking Univ. (Nat. Sci. Ed.) 2022, 58, 157–168. [Google Scholar]
- Tu, Z.F.; Li, M.X.; Sun, T. Results and Analysis of the Fifth National Monitoring of Desertification and Sandy Desertification. For. Resour. Manag. 2016, 1, 1–5+13. [Google Scholar]
- Legg, S. IPCC. 2021: Climate change 2021-the physical science basis. Interaction 2021, 49, 44–45. [Google Scholar]
- Fan, Z.M.; Li, S.B. Spatio-temporal pattern change of desertification and its driving factors analysis in China-Mongolia-Russia economic corridor. Acta Ecol. Sin. 2020, 40, 4252–4263. [Google Scholar]
- Burrell, A.L.; Evans, J.P.; De Kauwe, M.G. Anthropogenic climate change has driven over 5 million km2 of drylands towards desertification. Nat. Commun. 2020, 11, 3853. [Google Scholar] [CrossRef] [Scilit]
- Jiang, X.; Han, L.; Bai, Z.F.; Liu, H. Spatiotemporal evolution patterns and trend analysis of desertification sensitivity in the Inner Mongolia Autonomous Region. Acta Ecol. Sin. 2023, 43, 364–378. [Google Scholar]
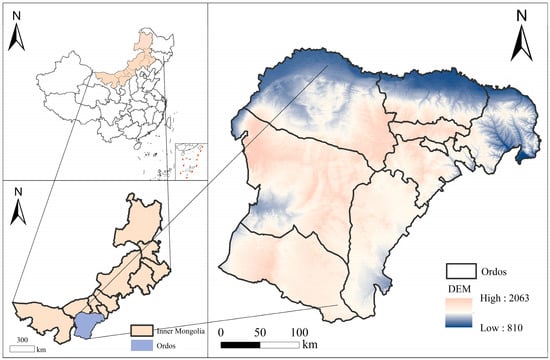
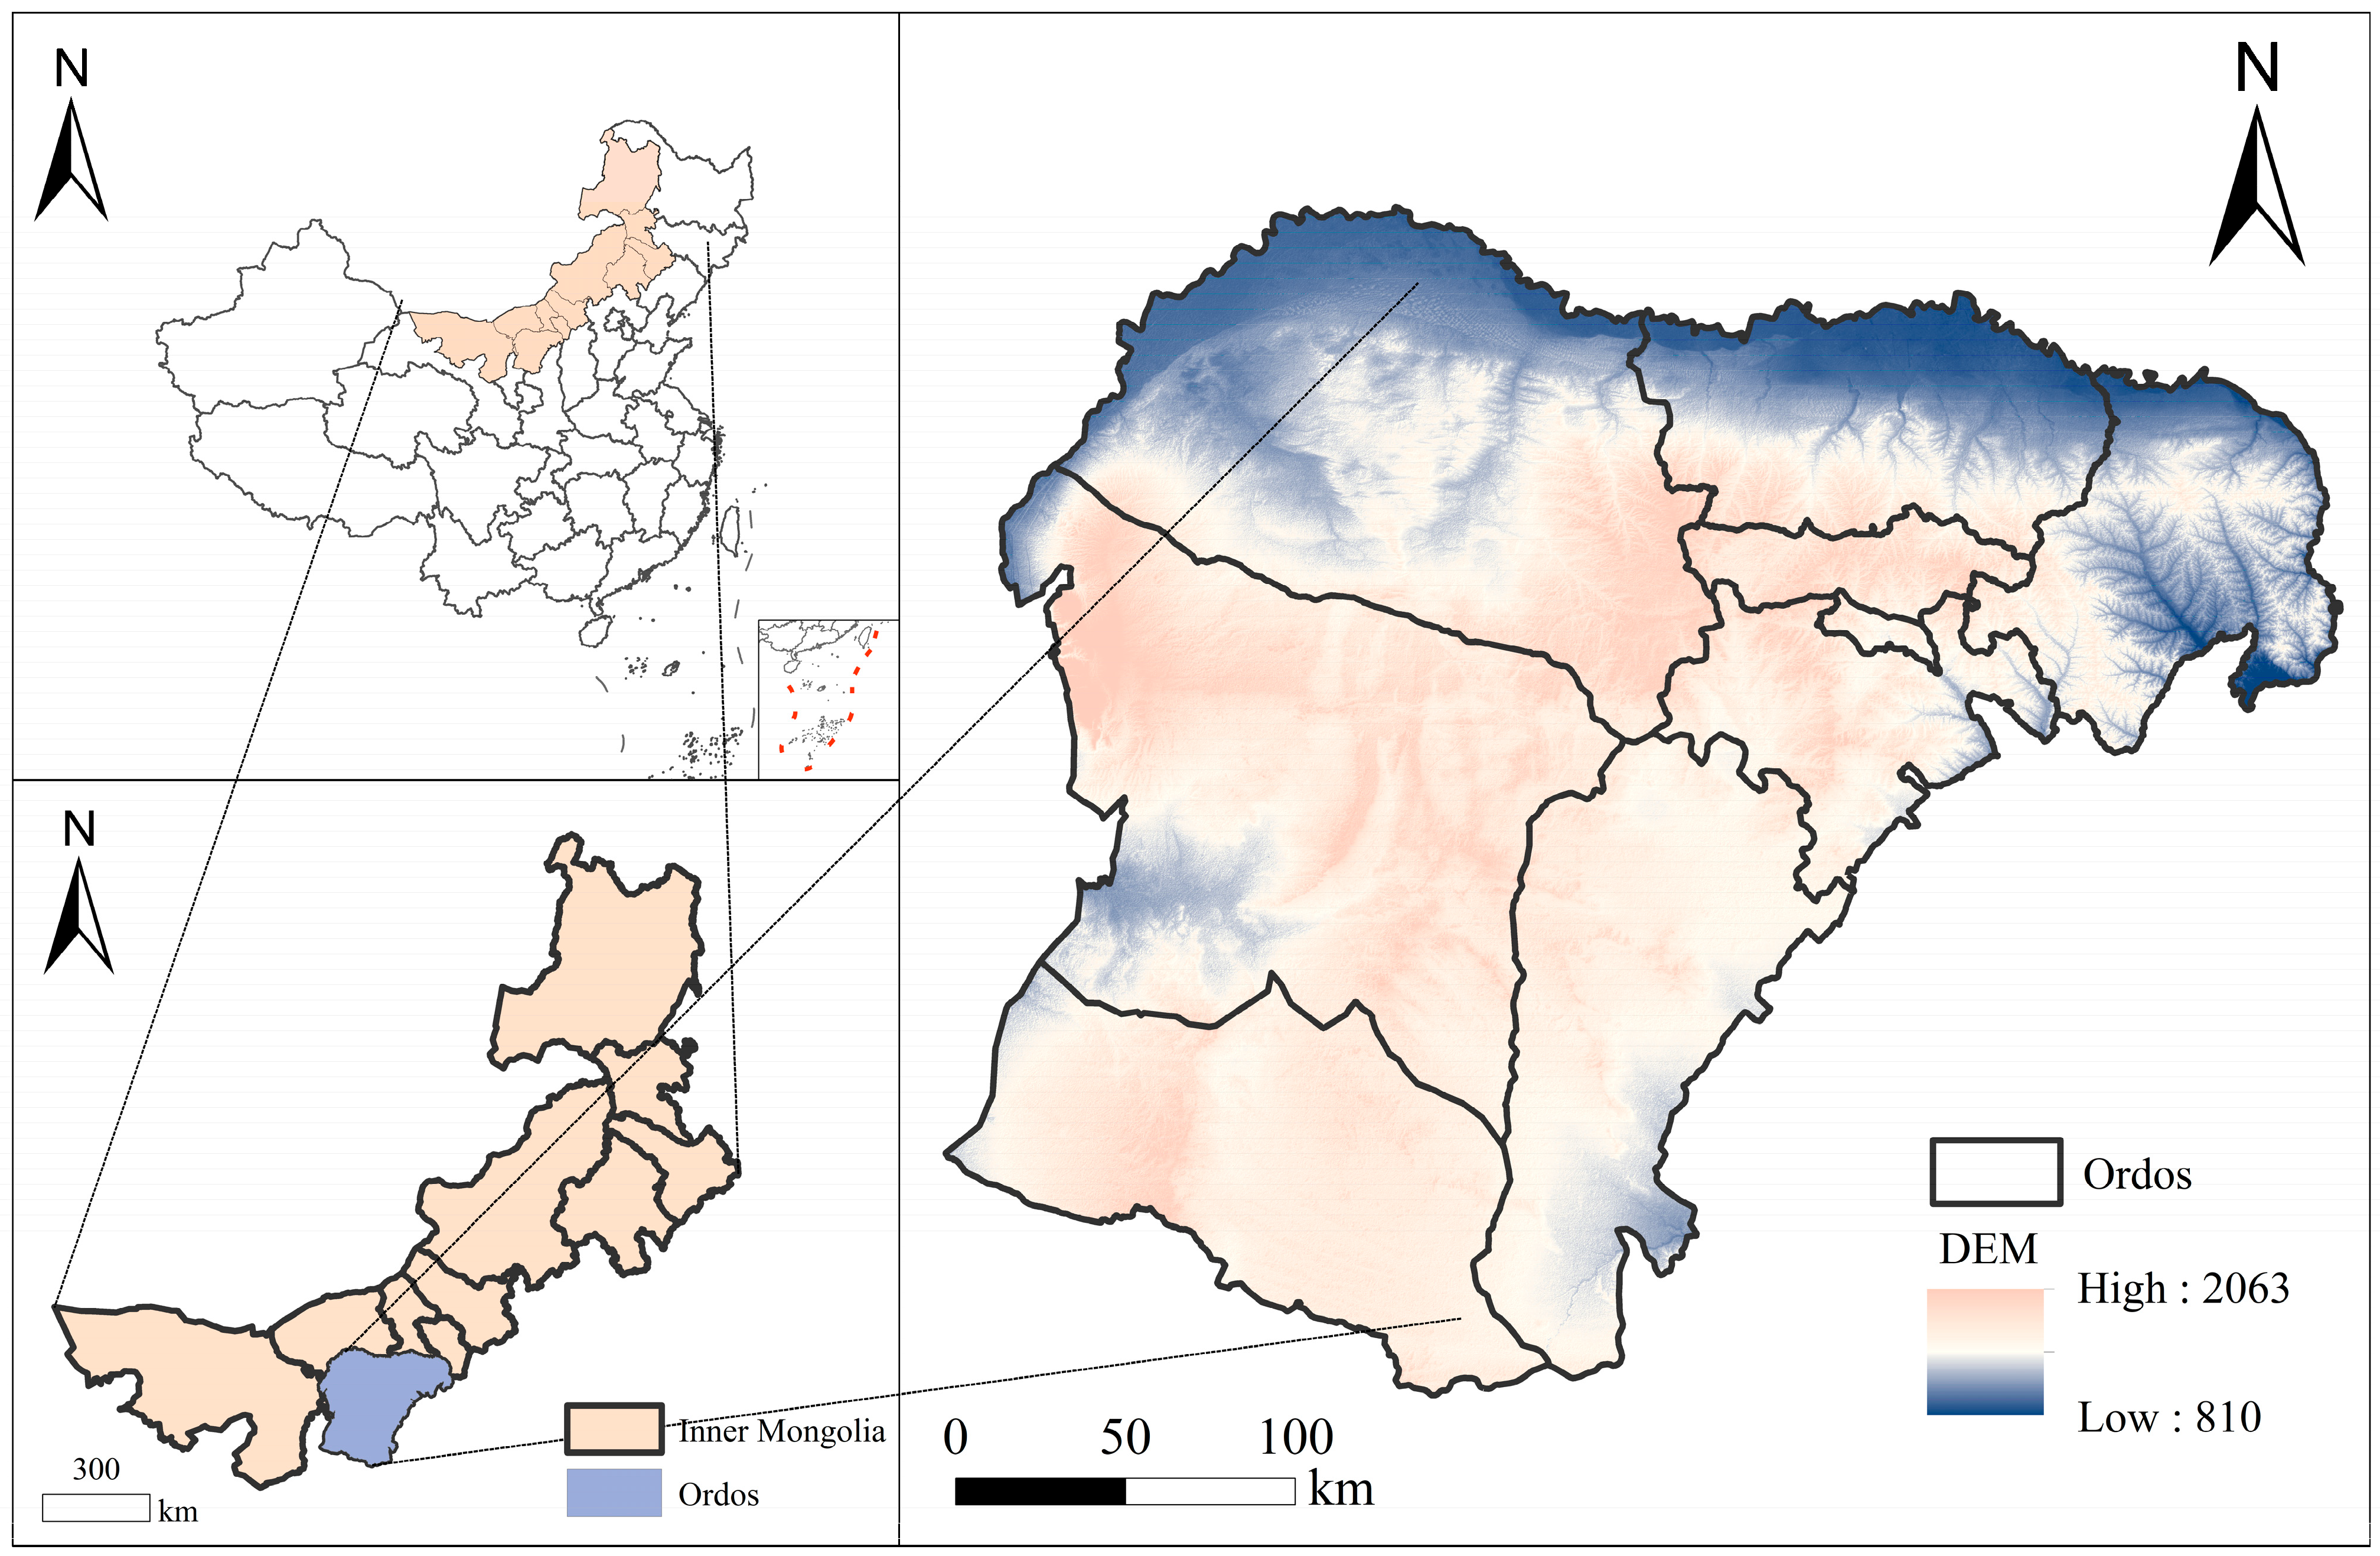
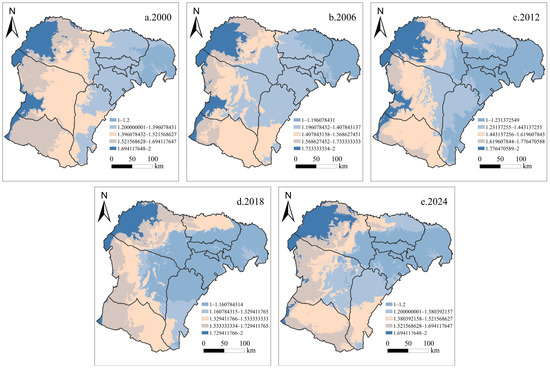
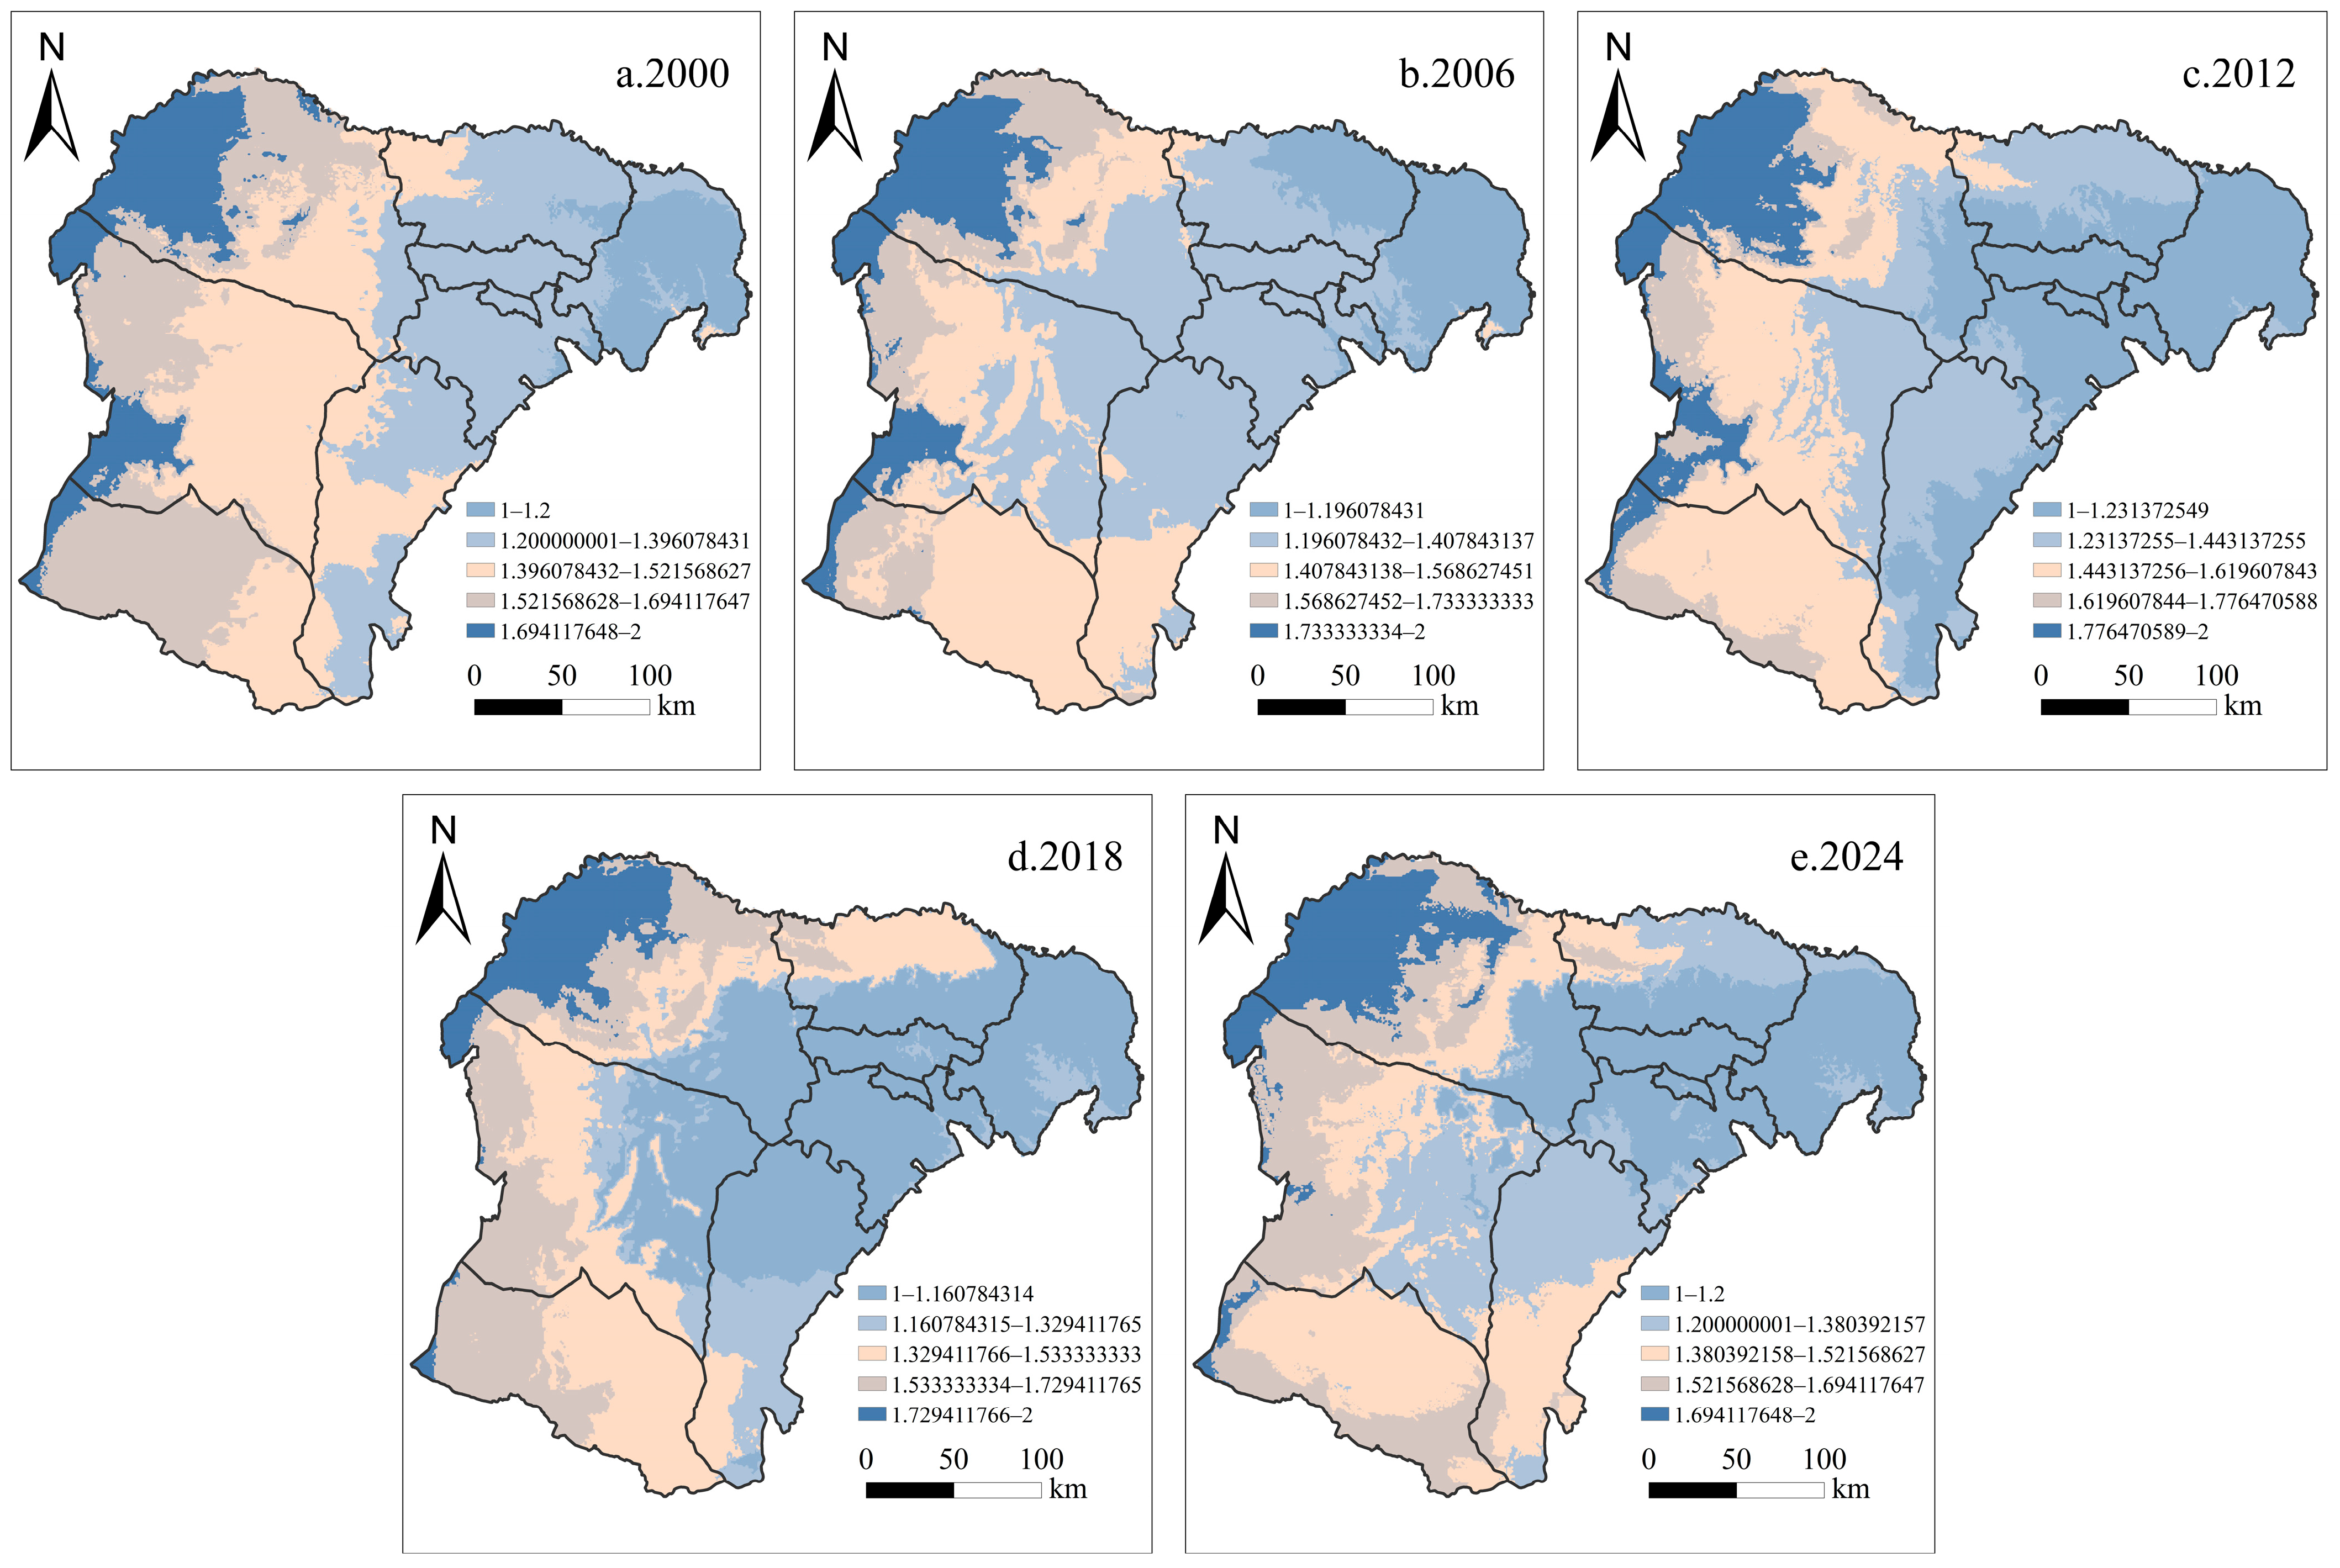
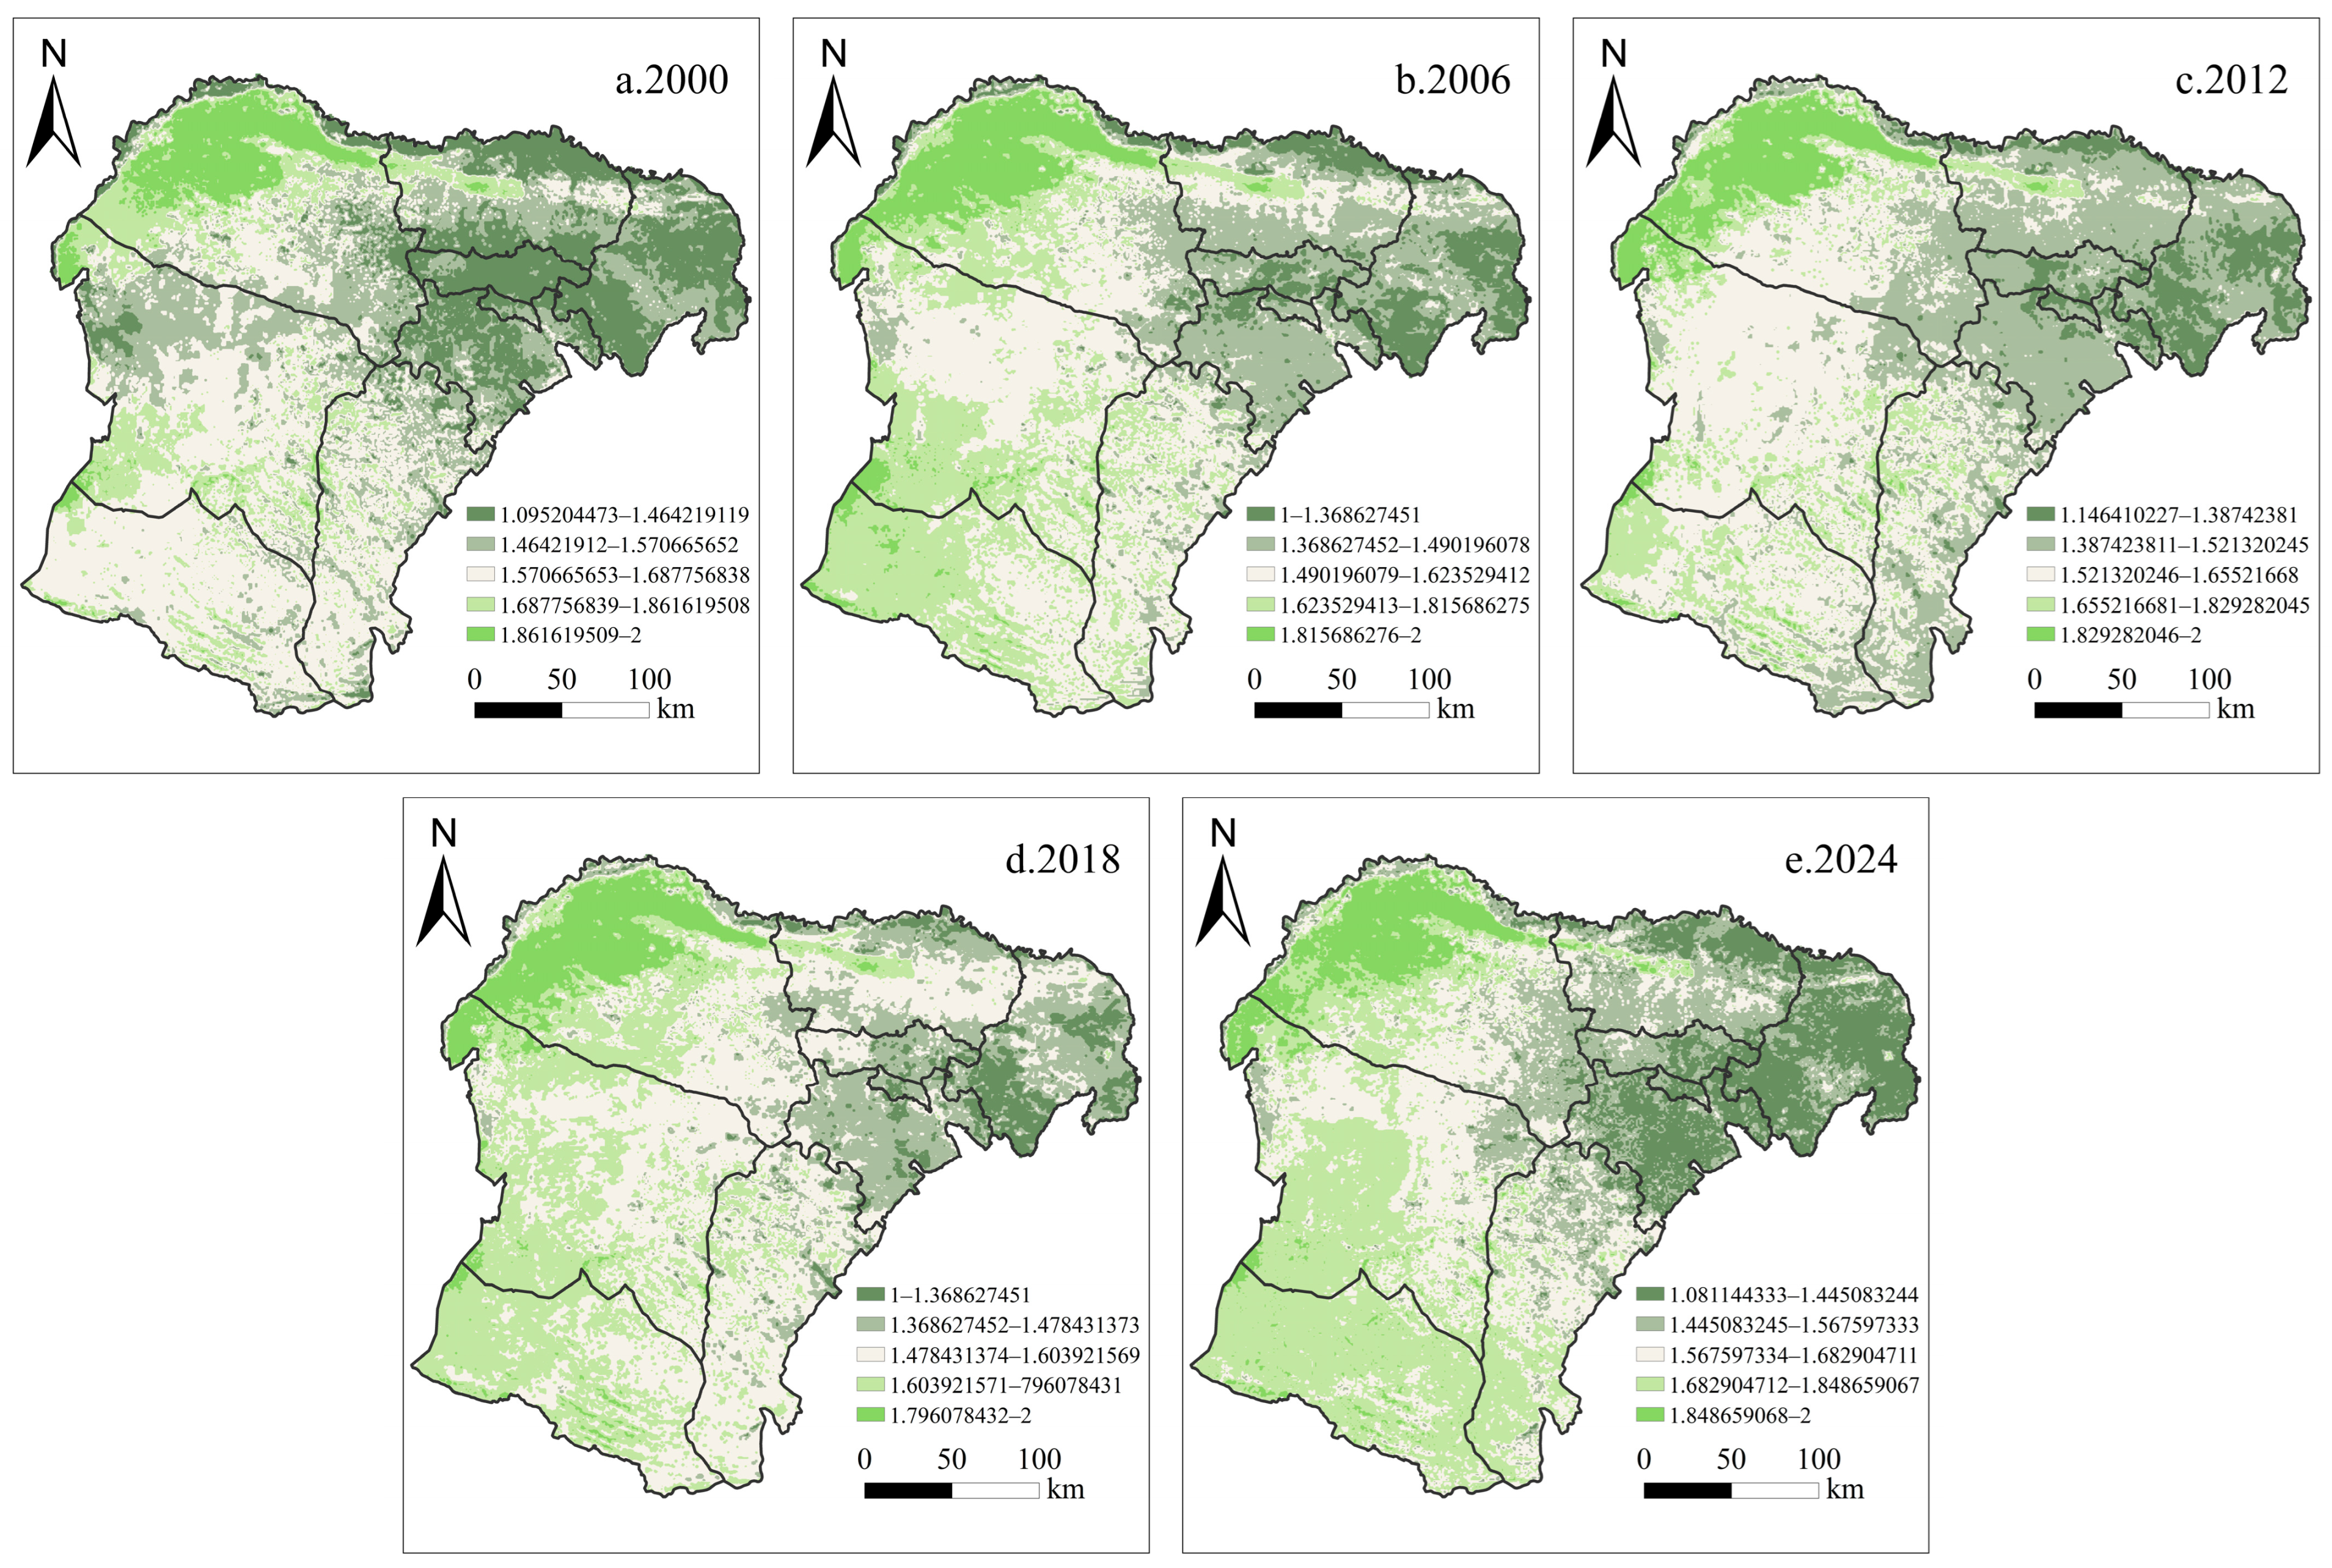
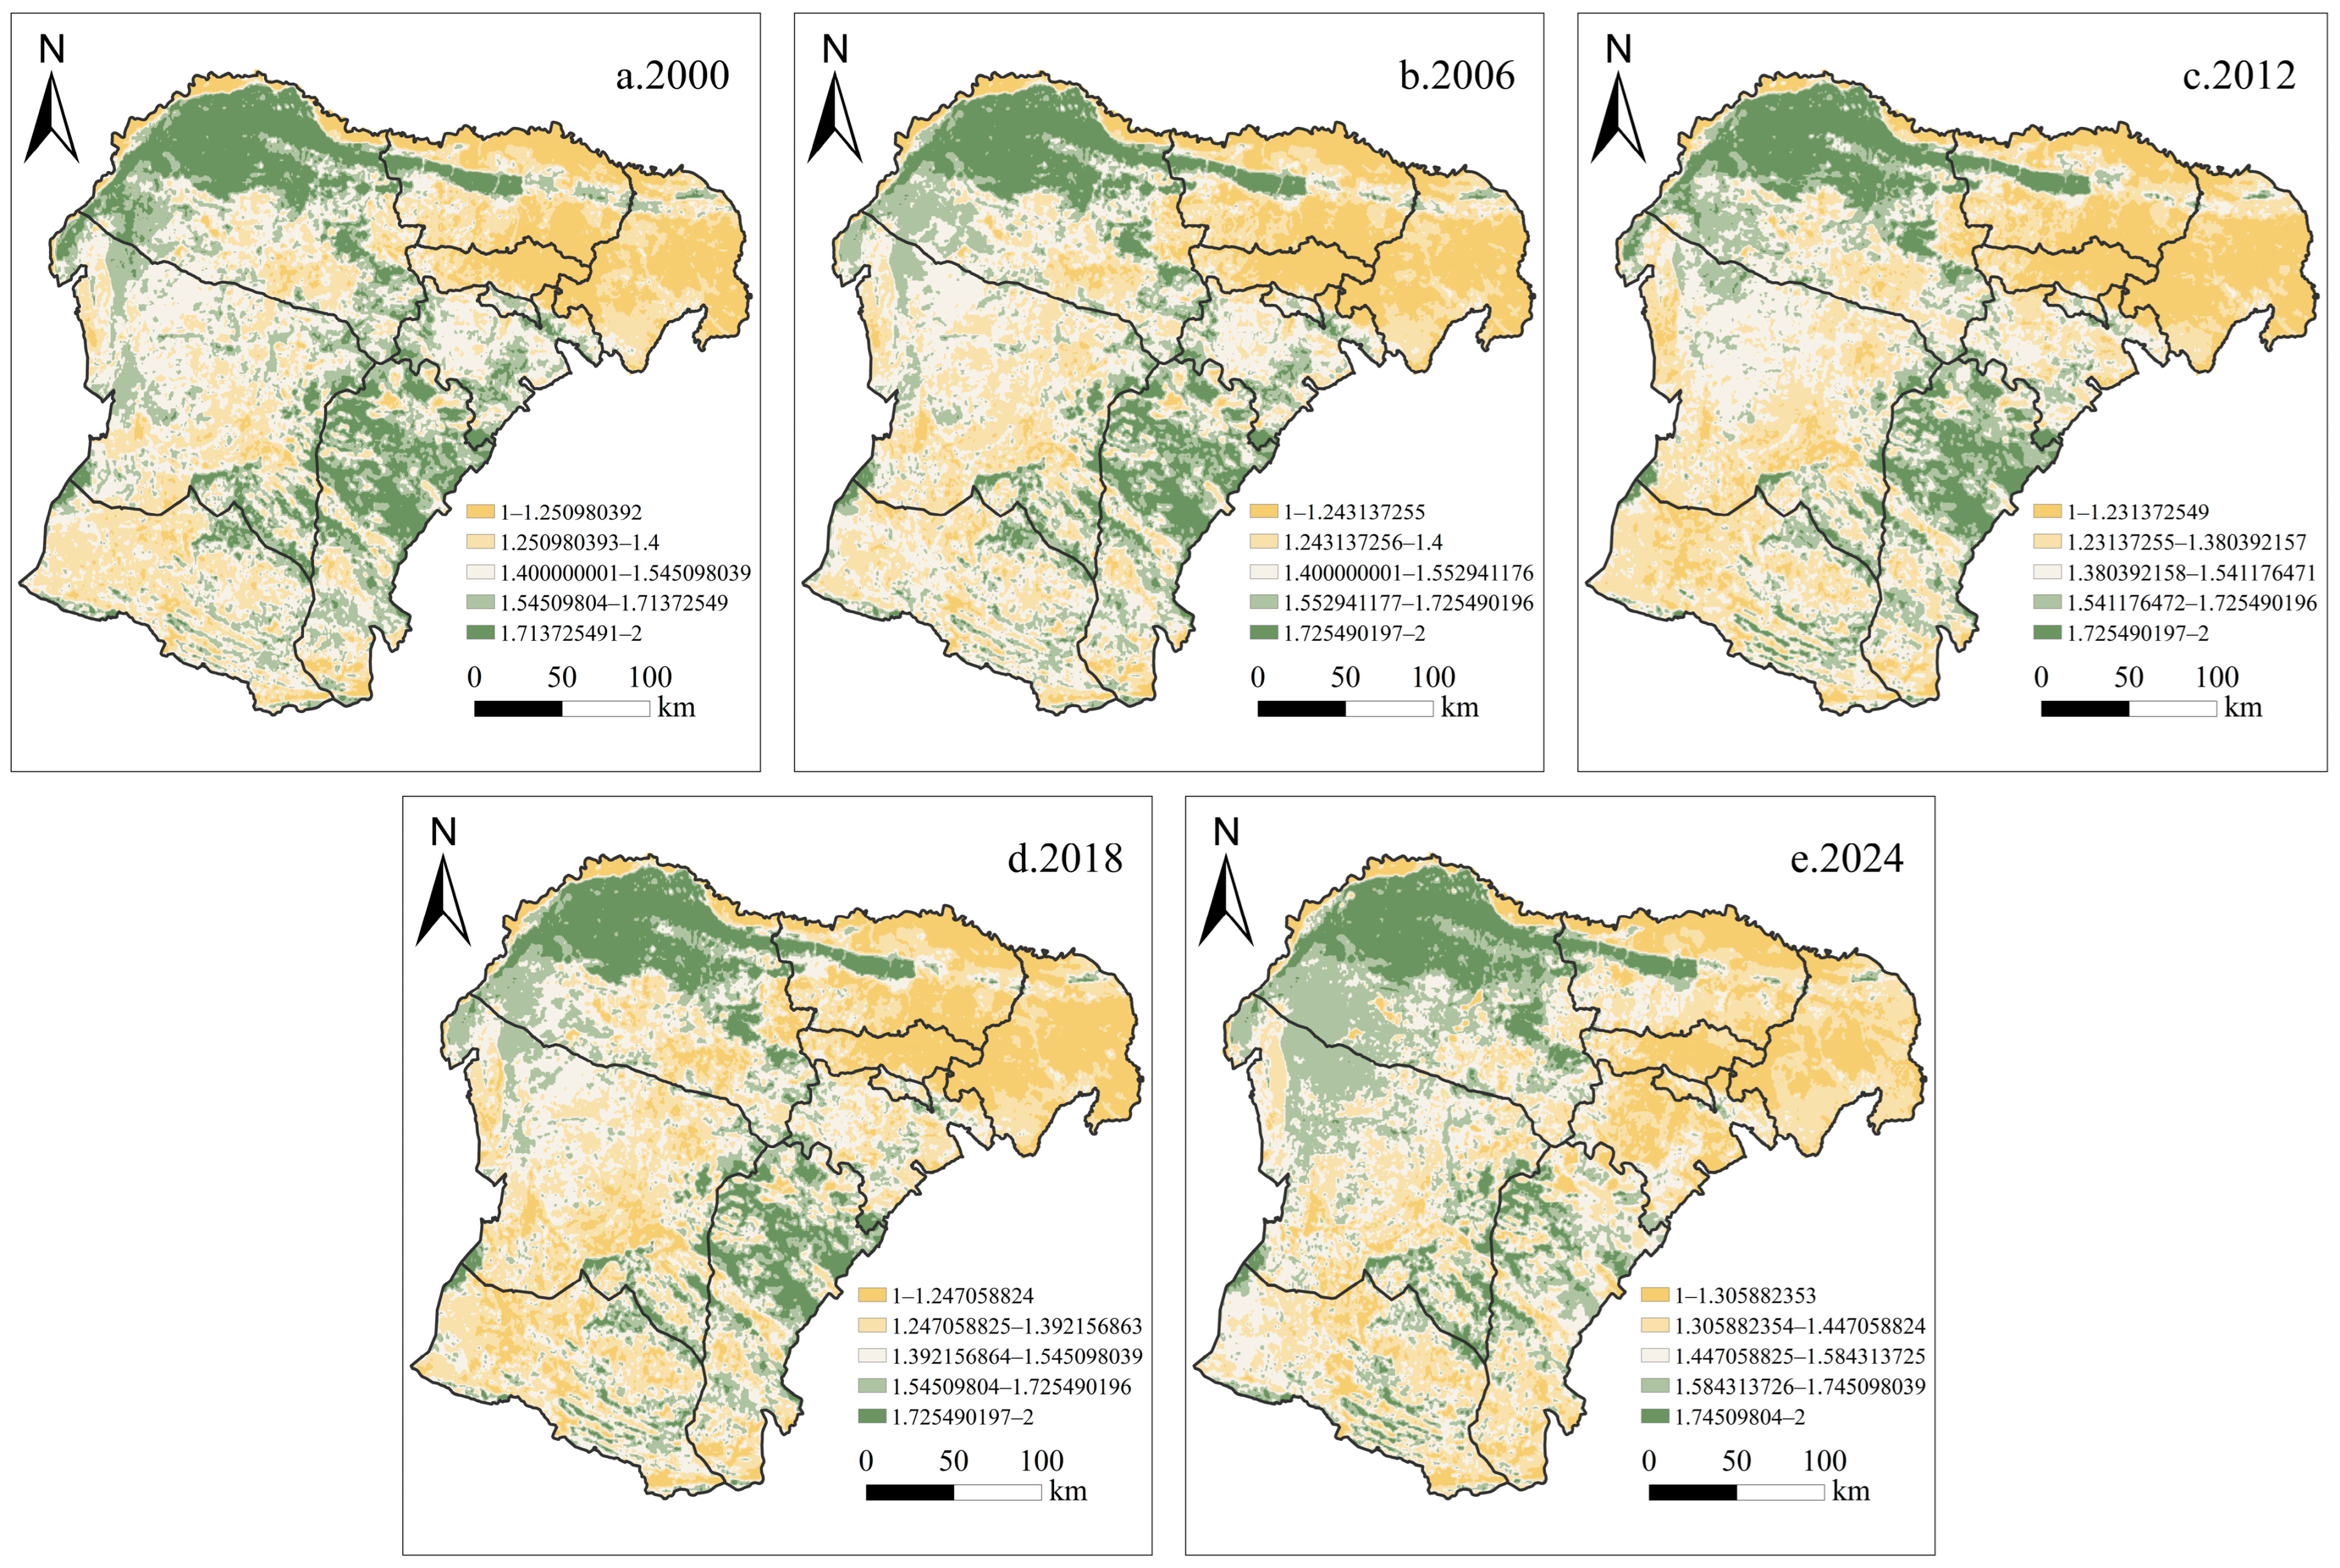
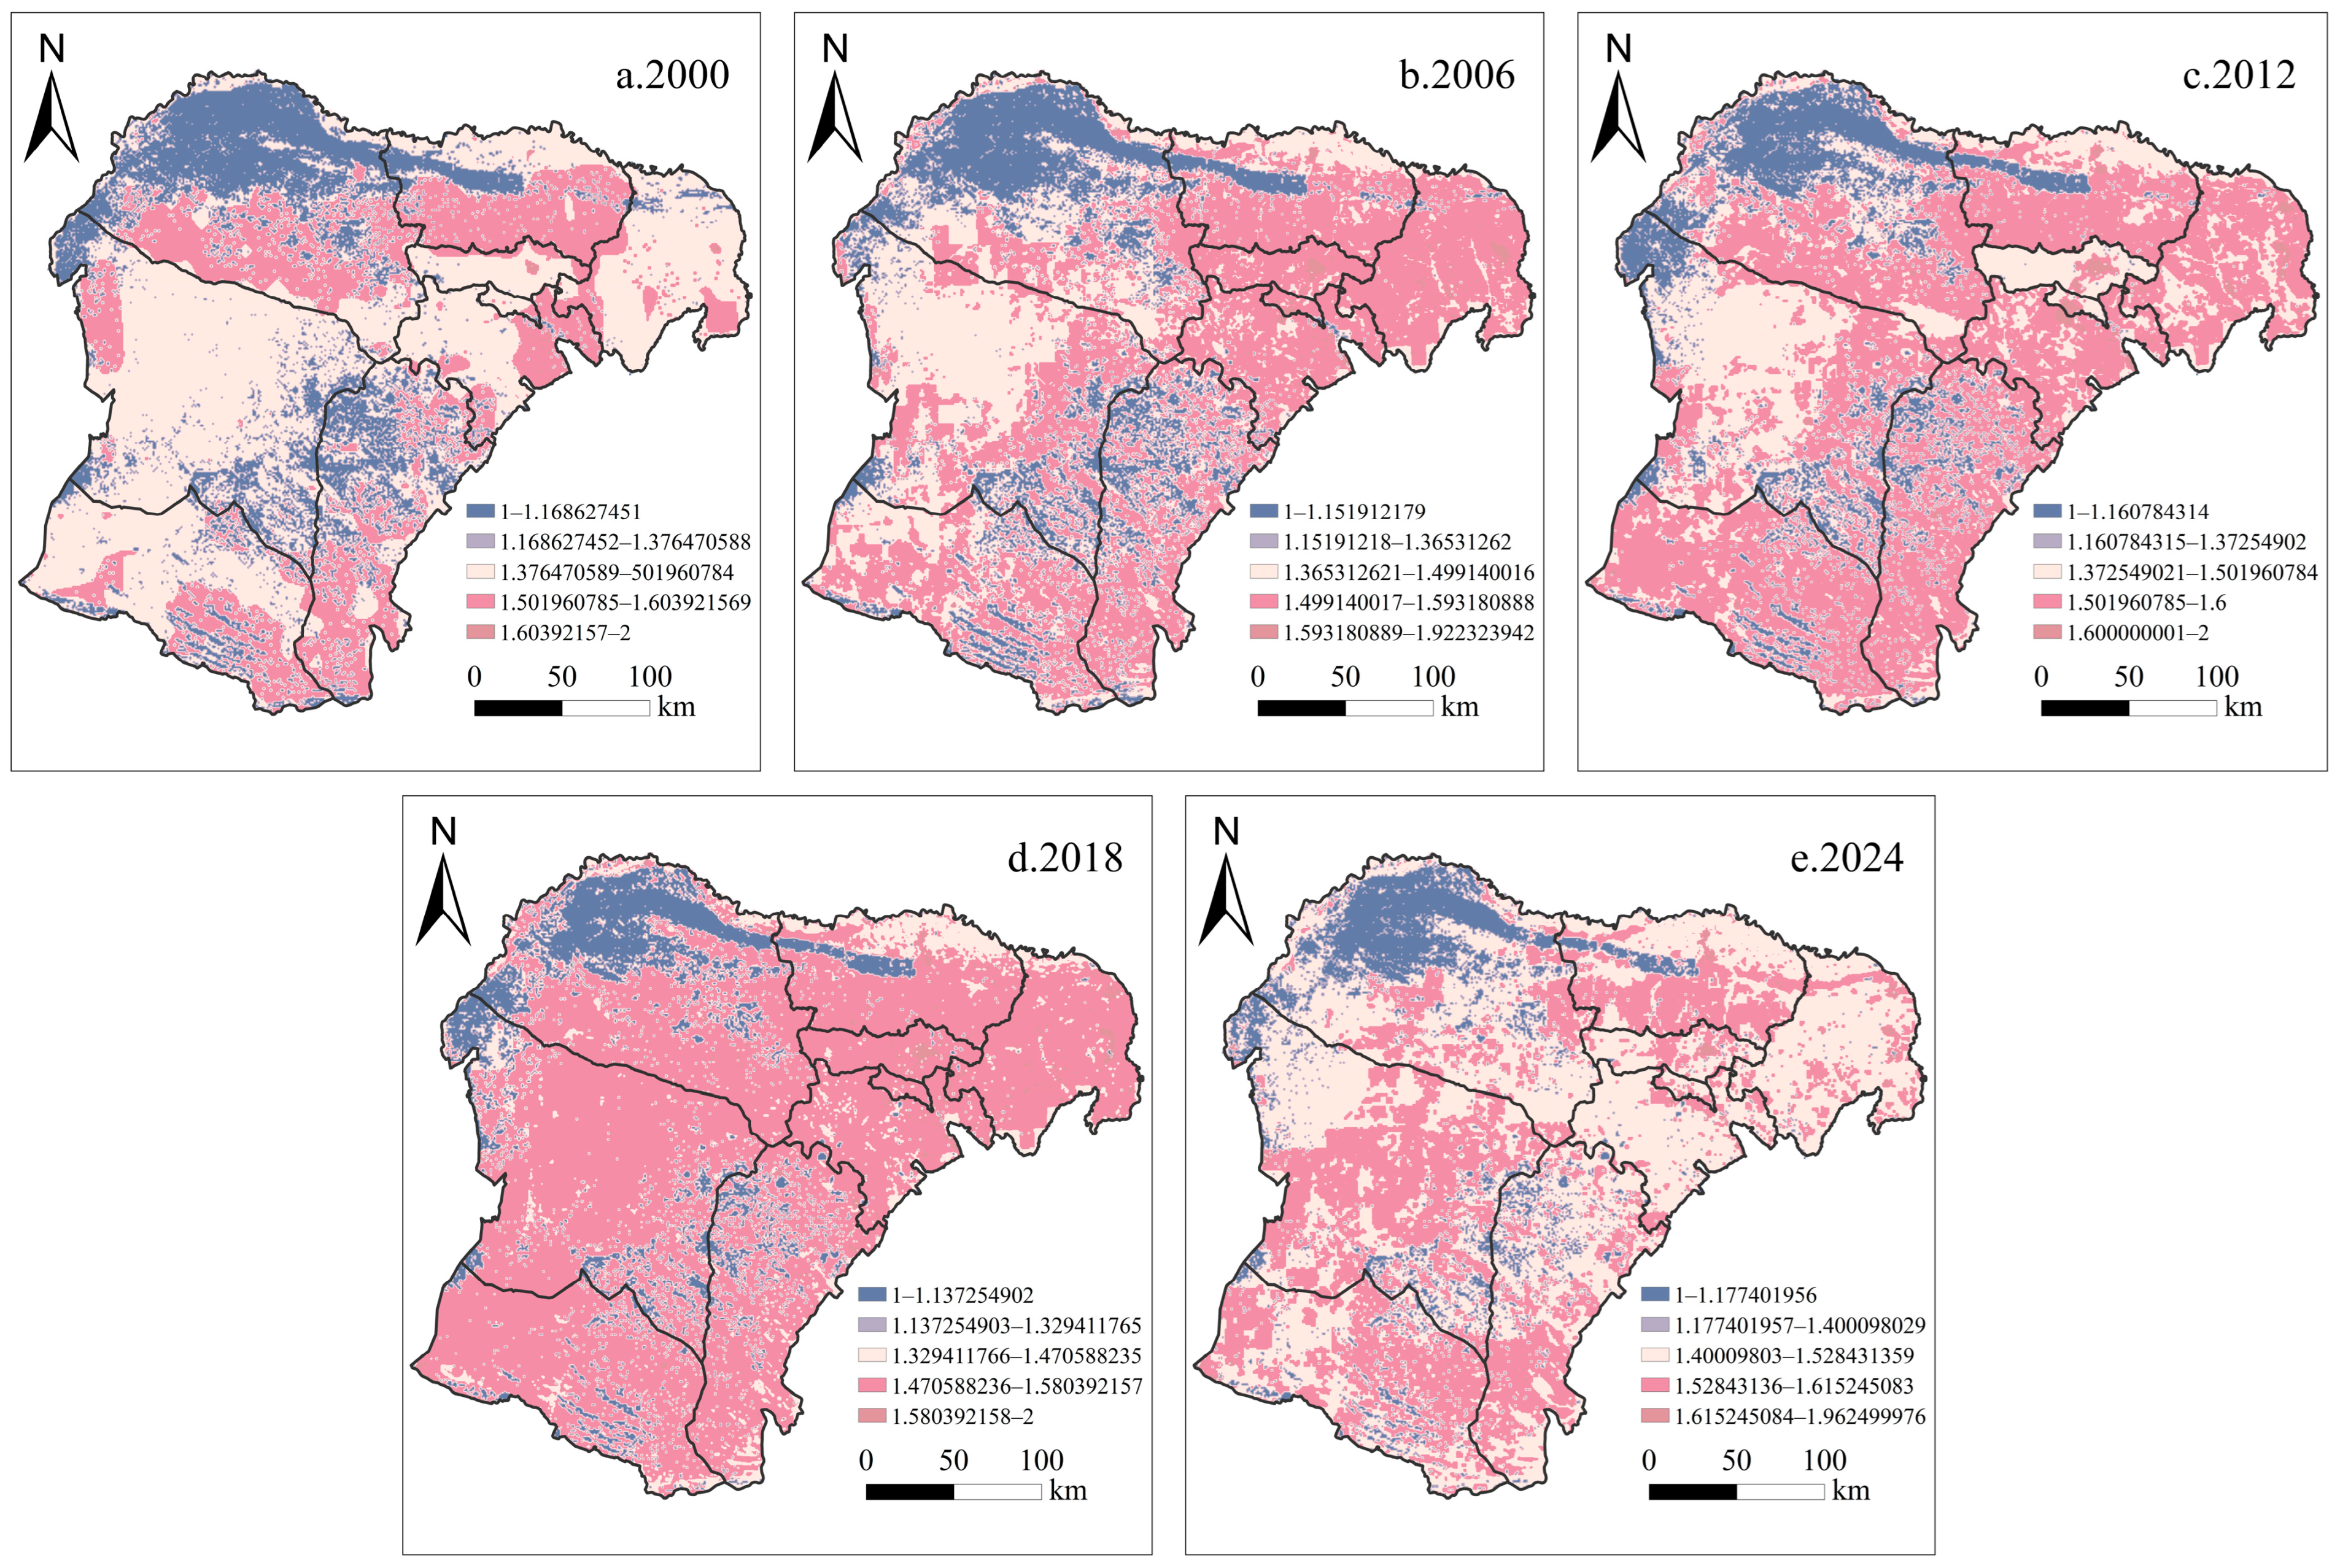
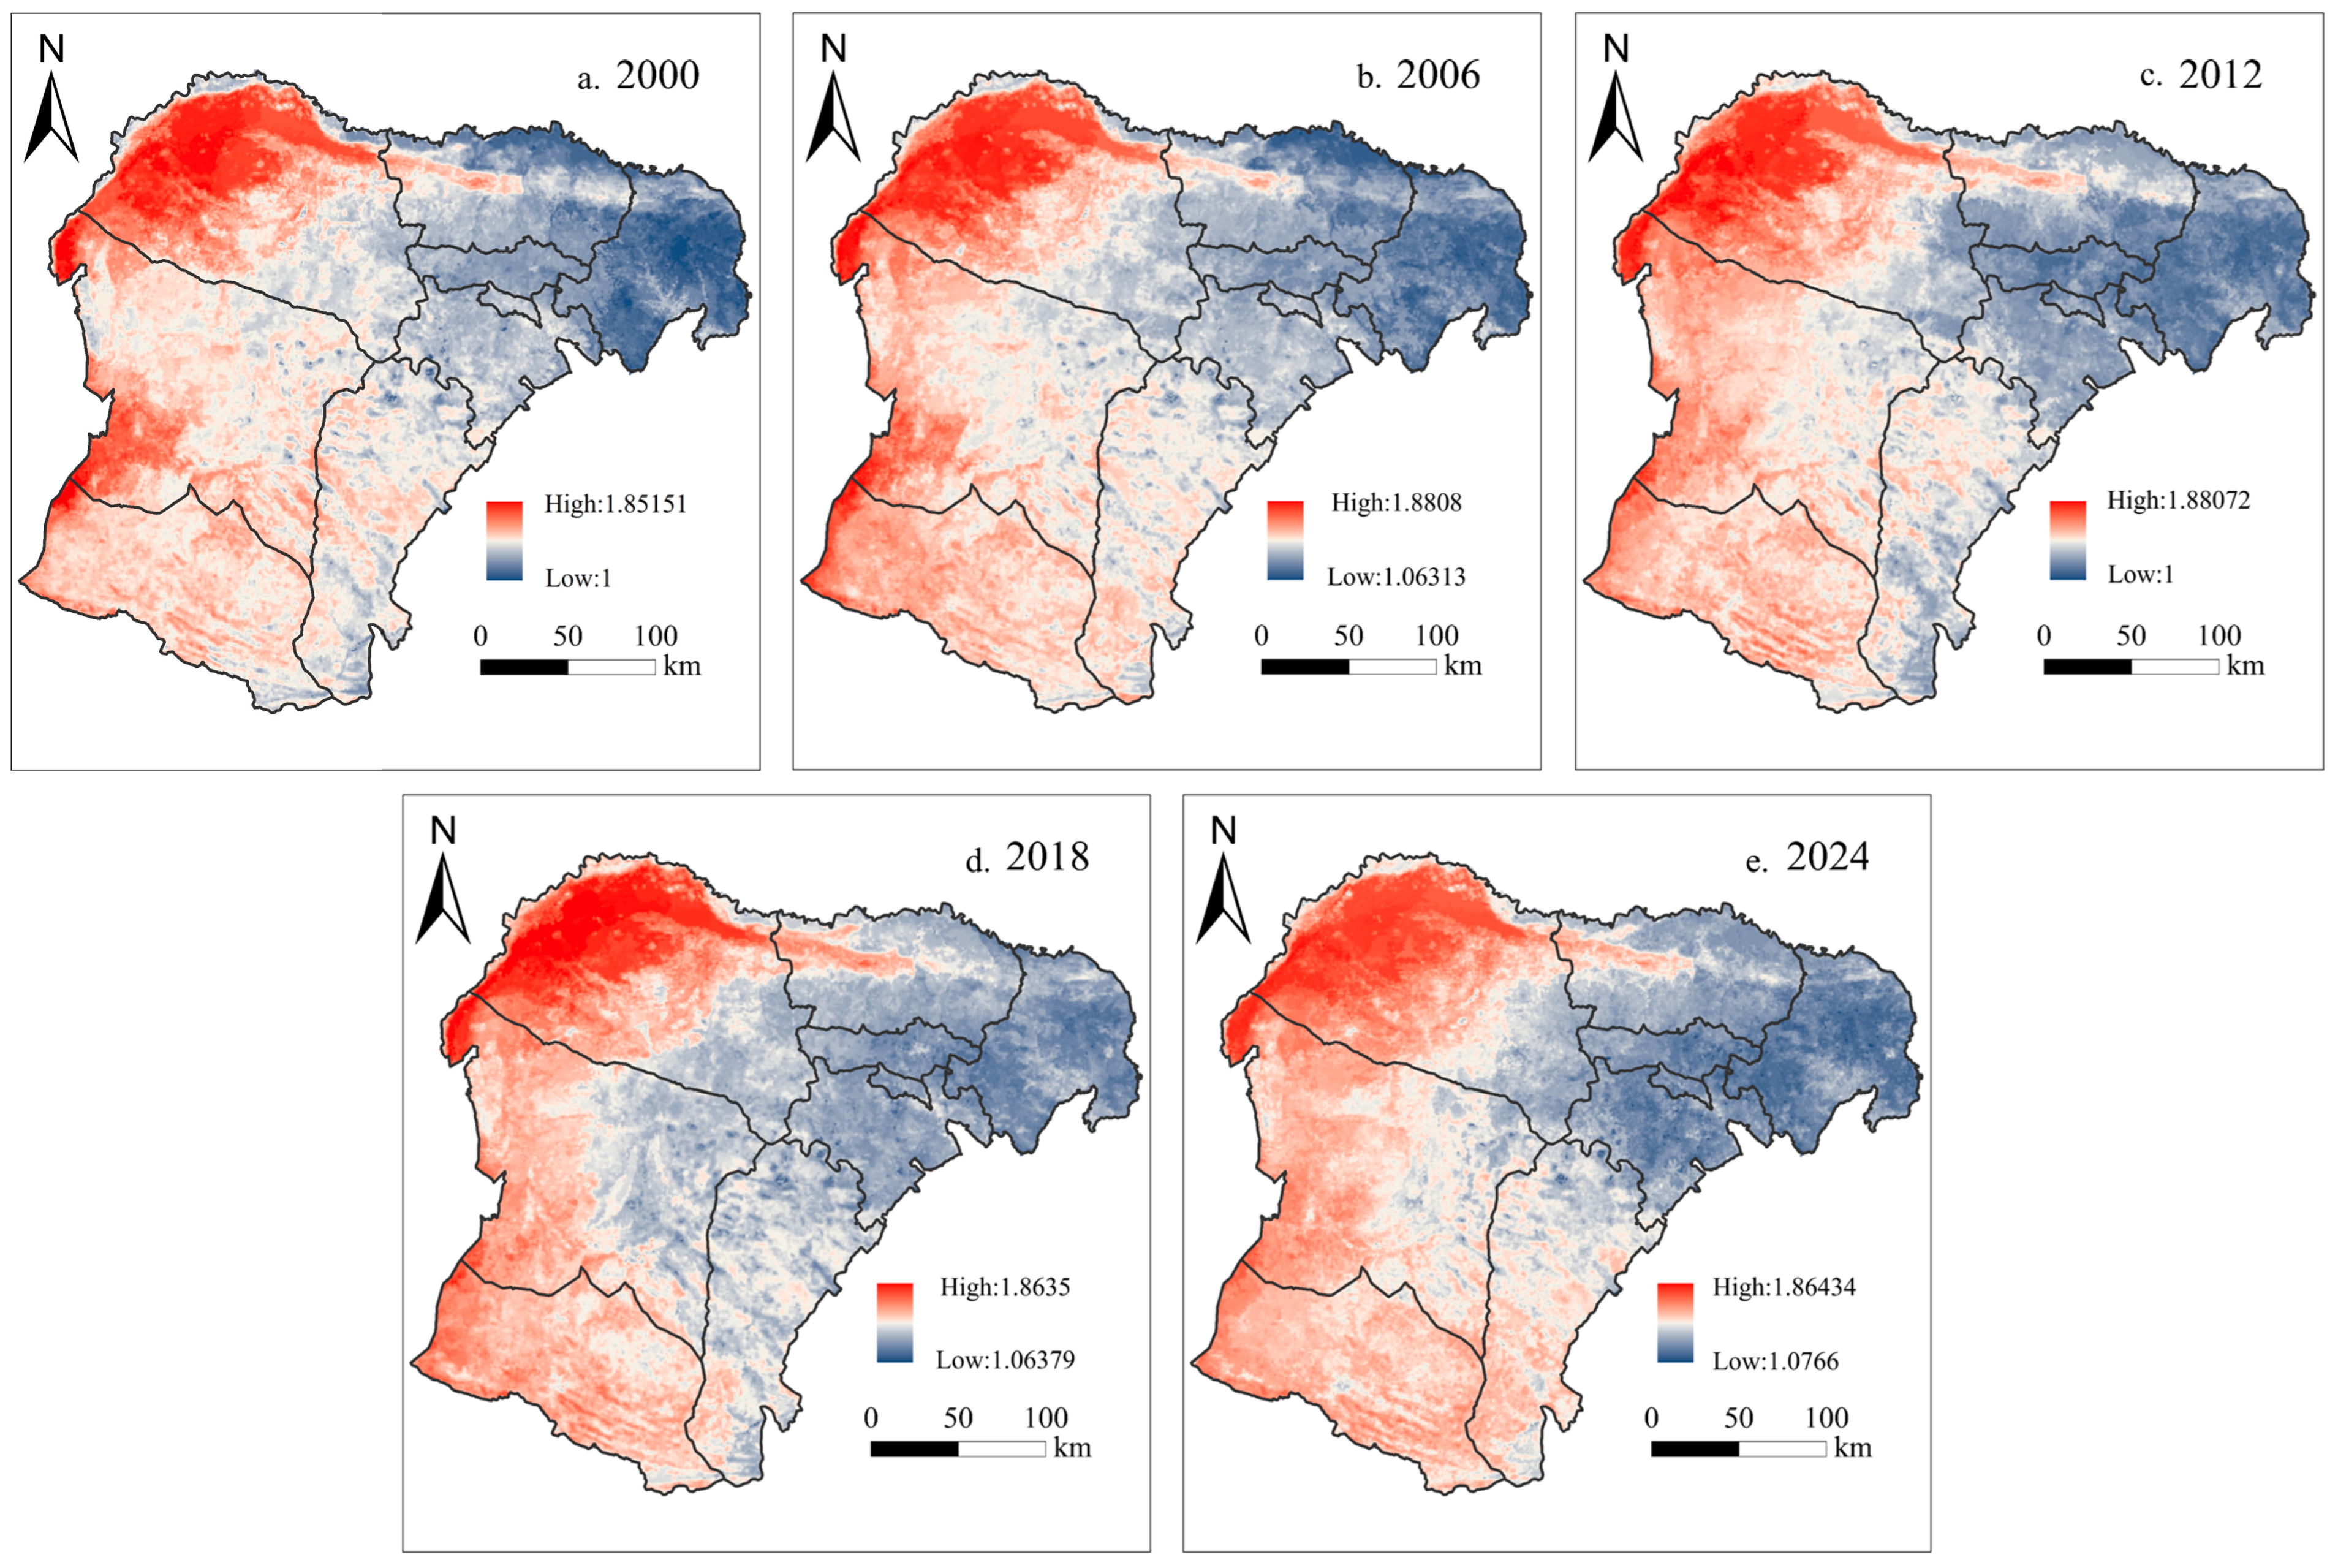
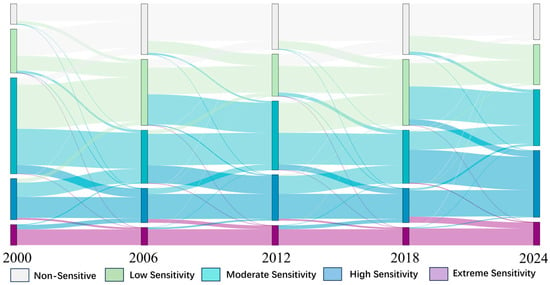
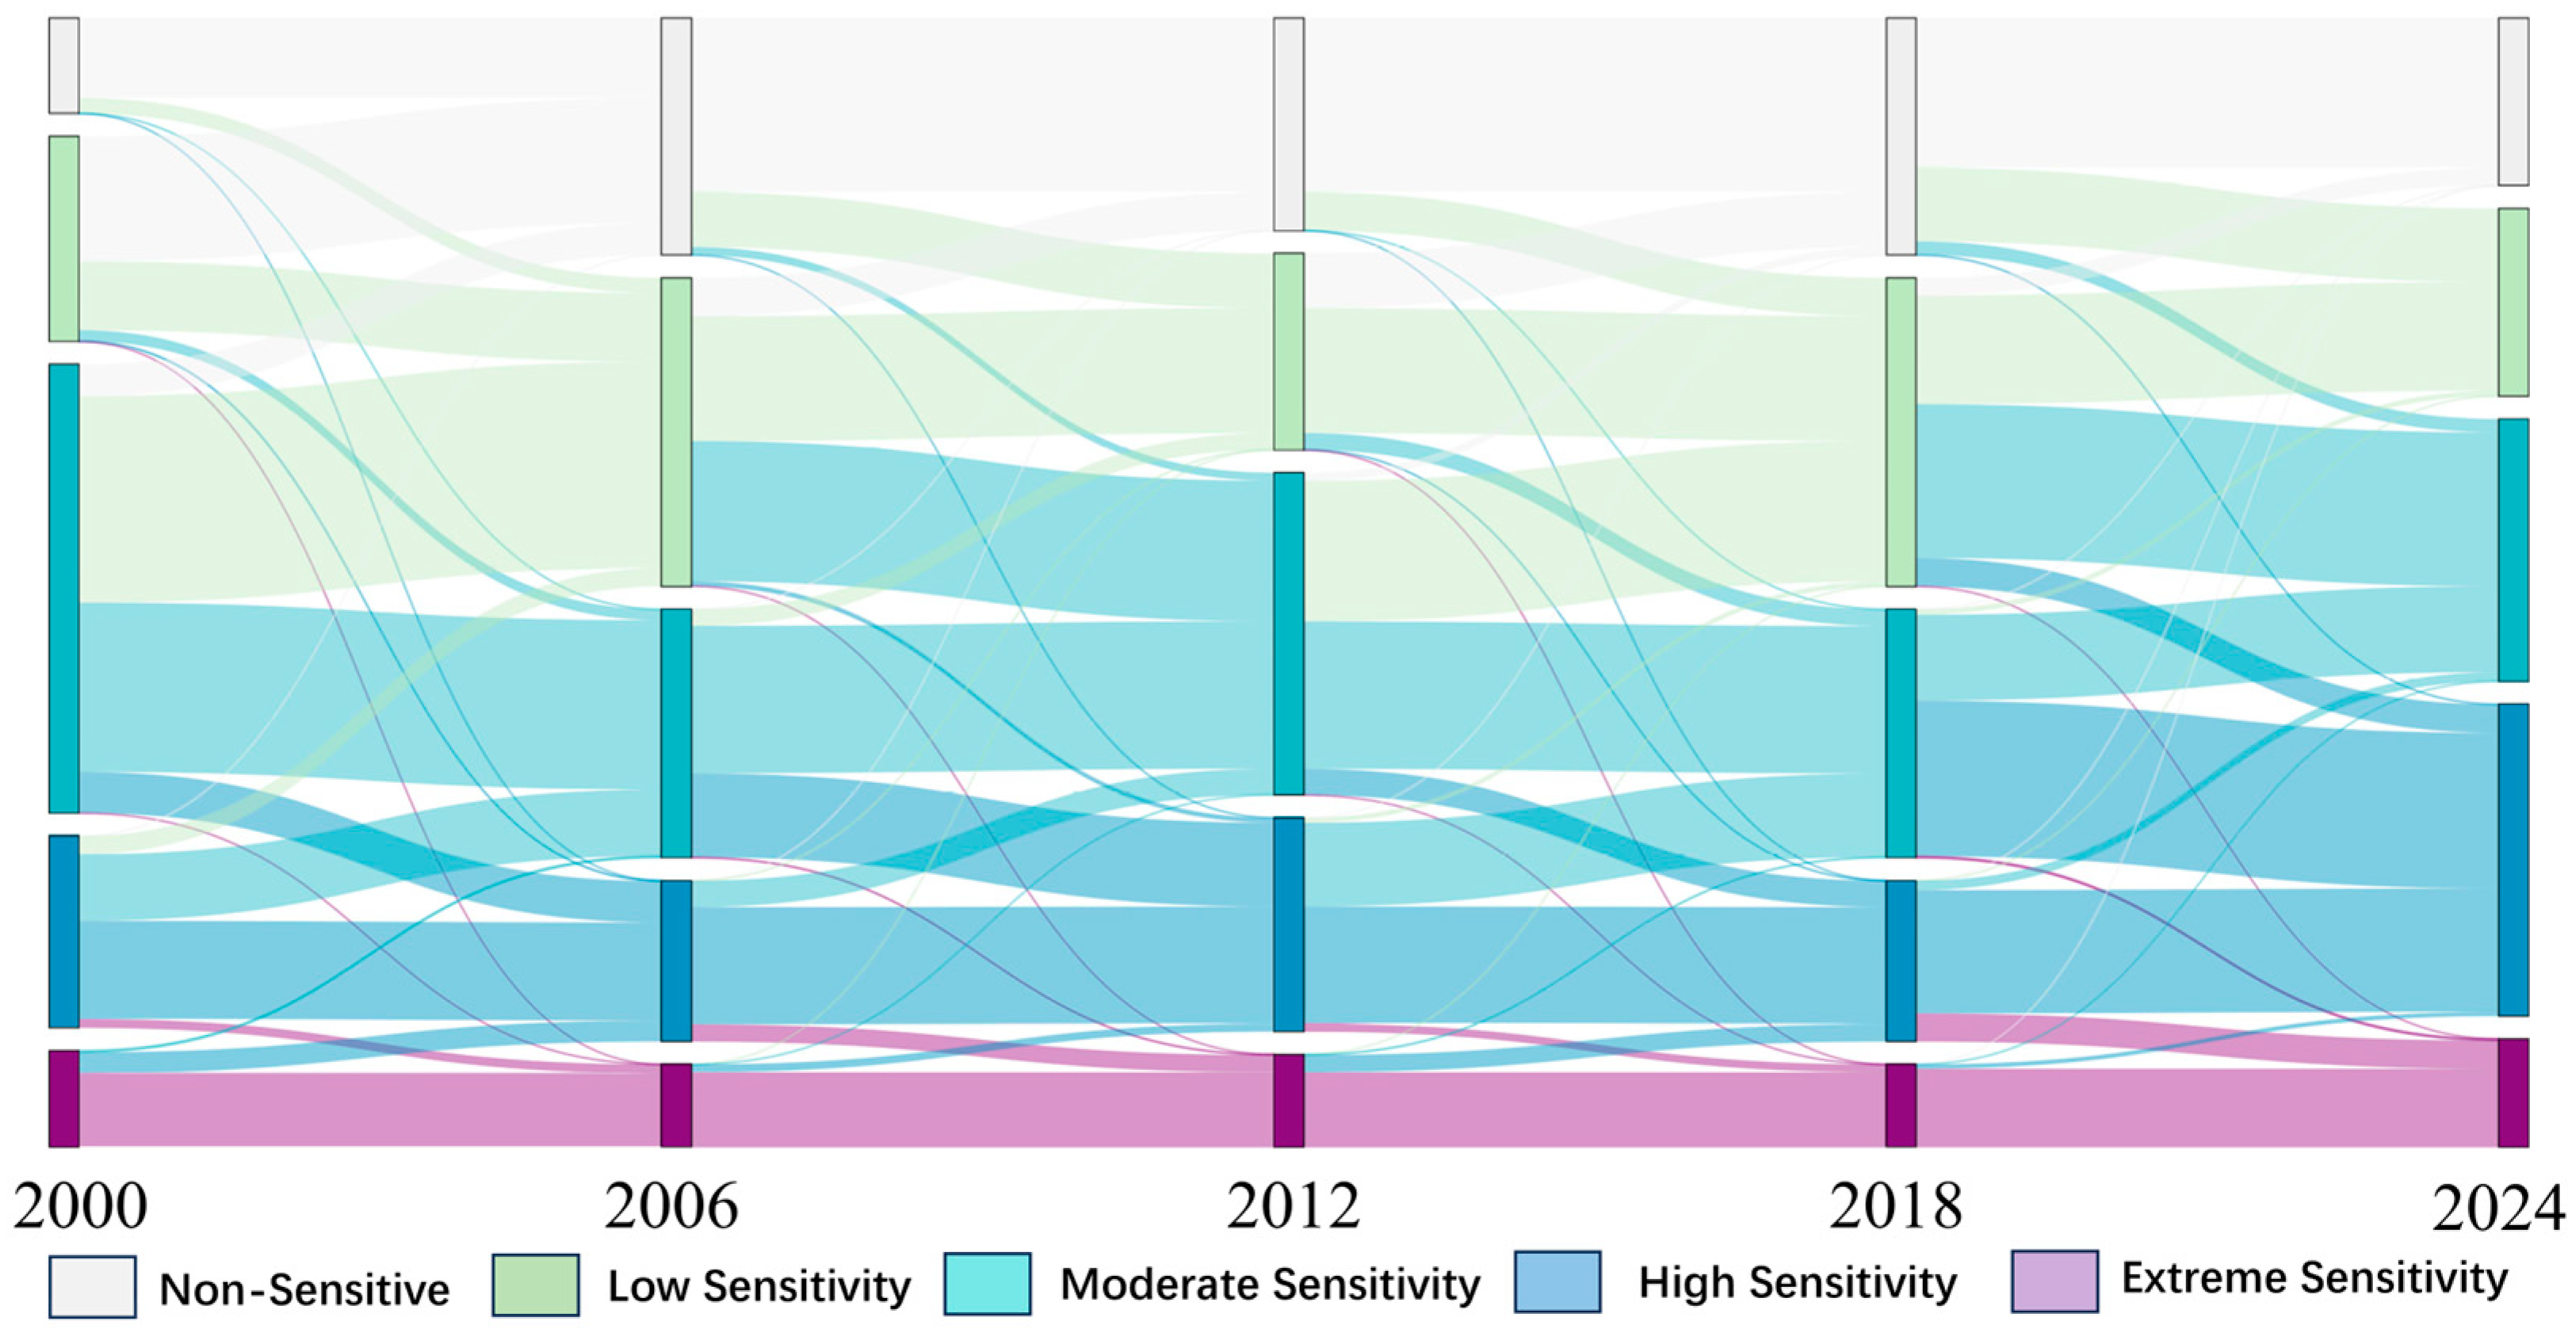
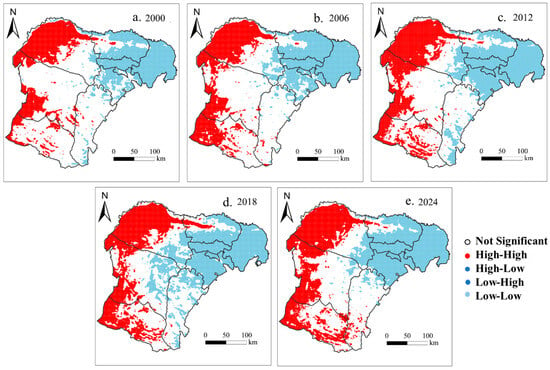
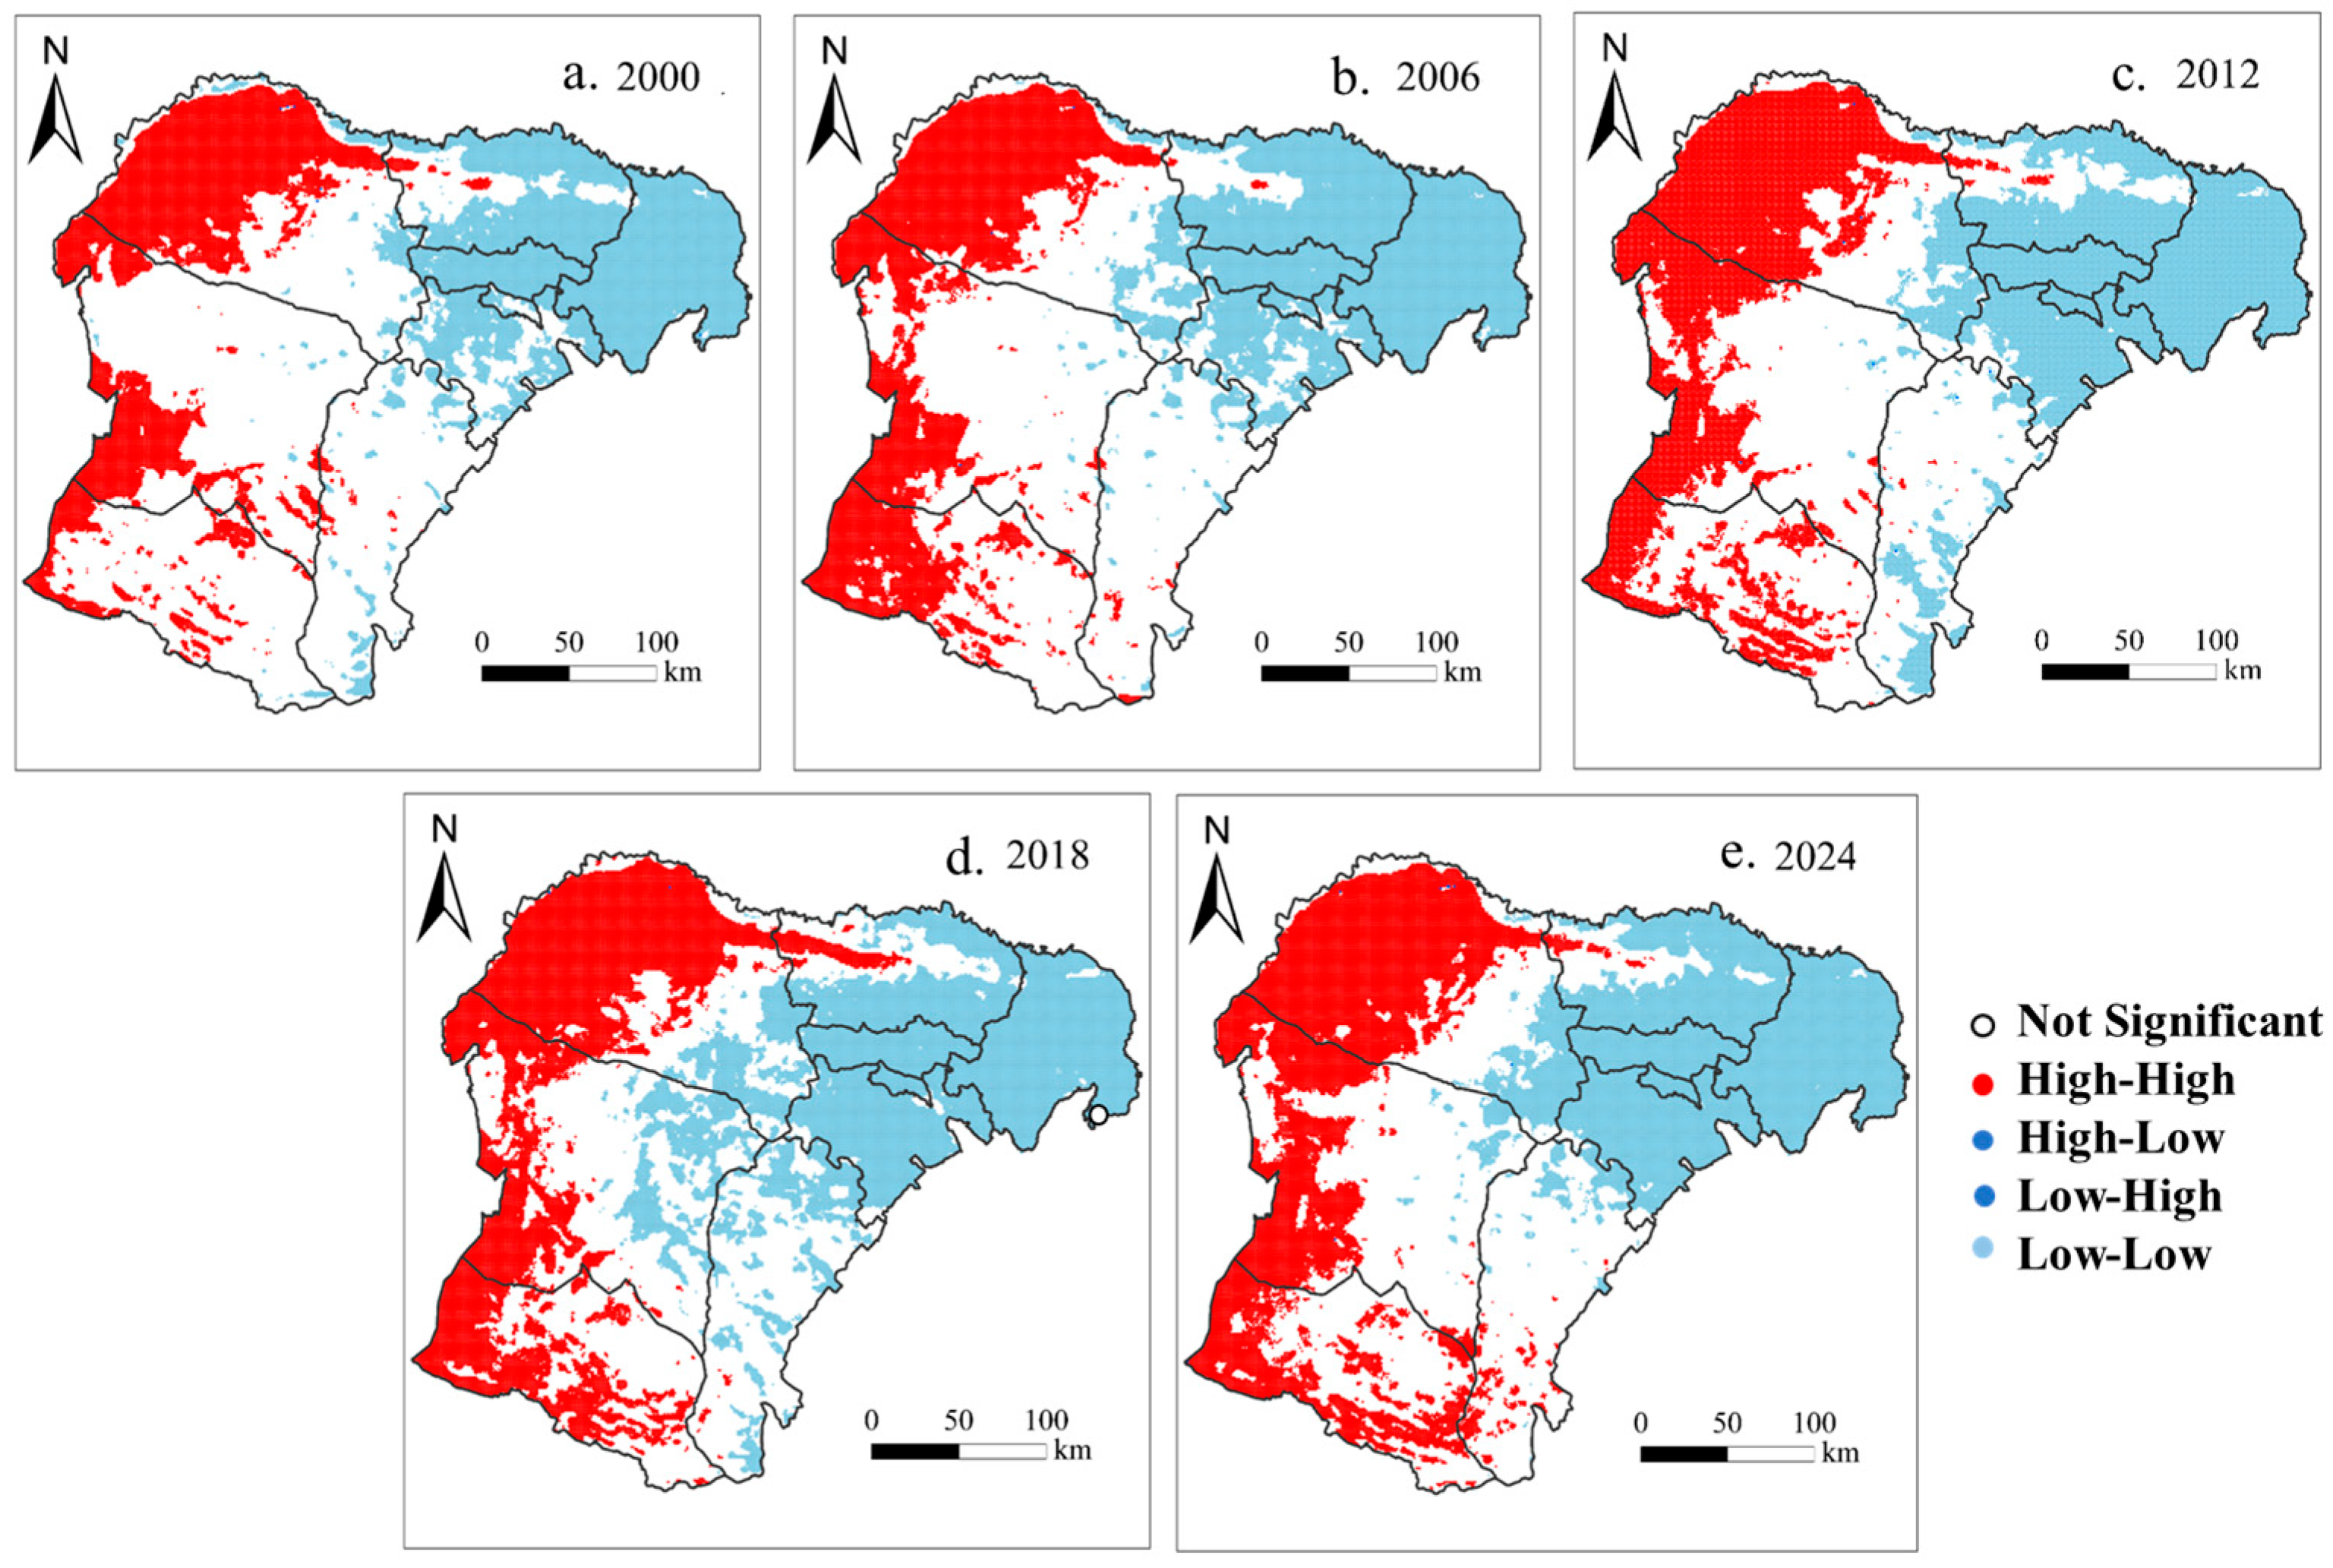
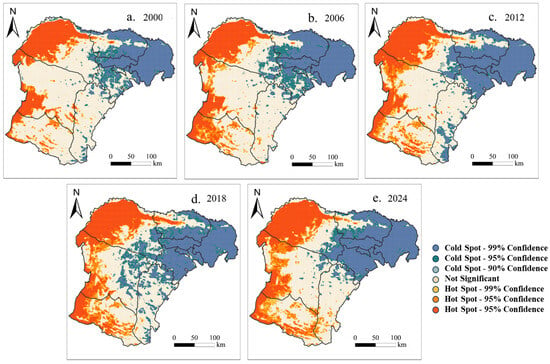
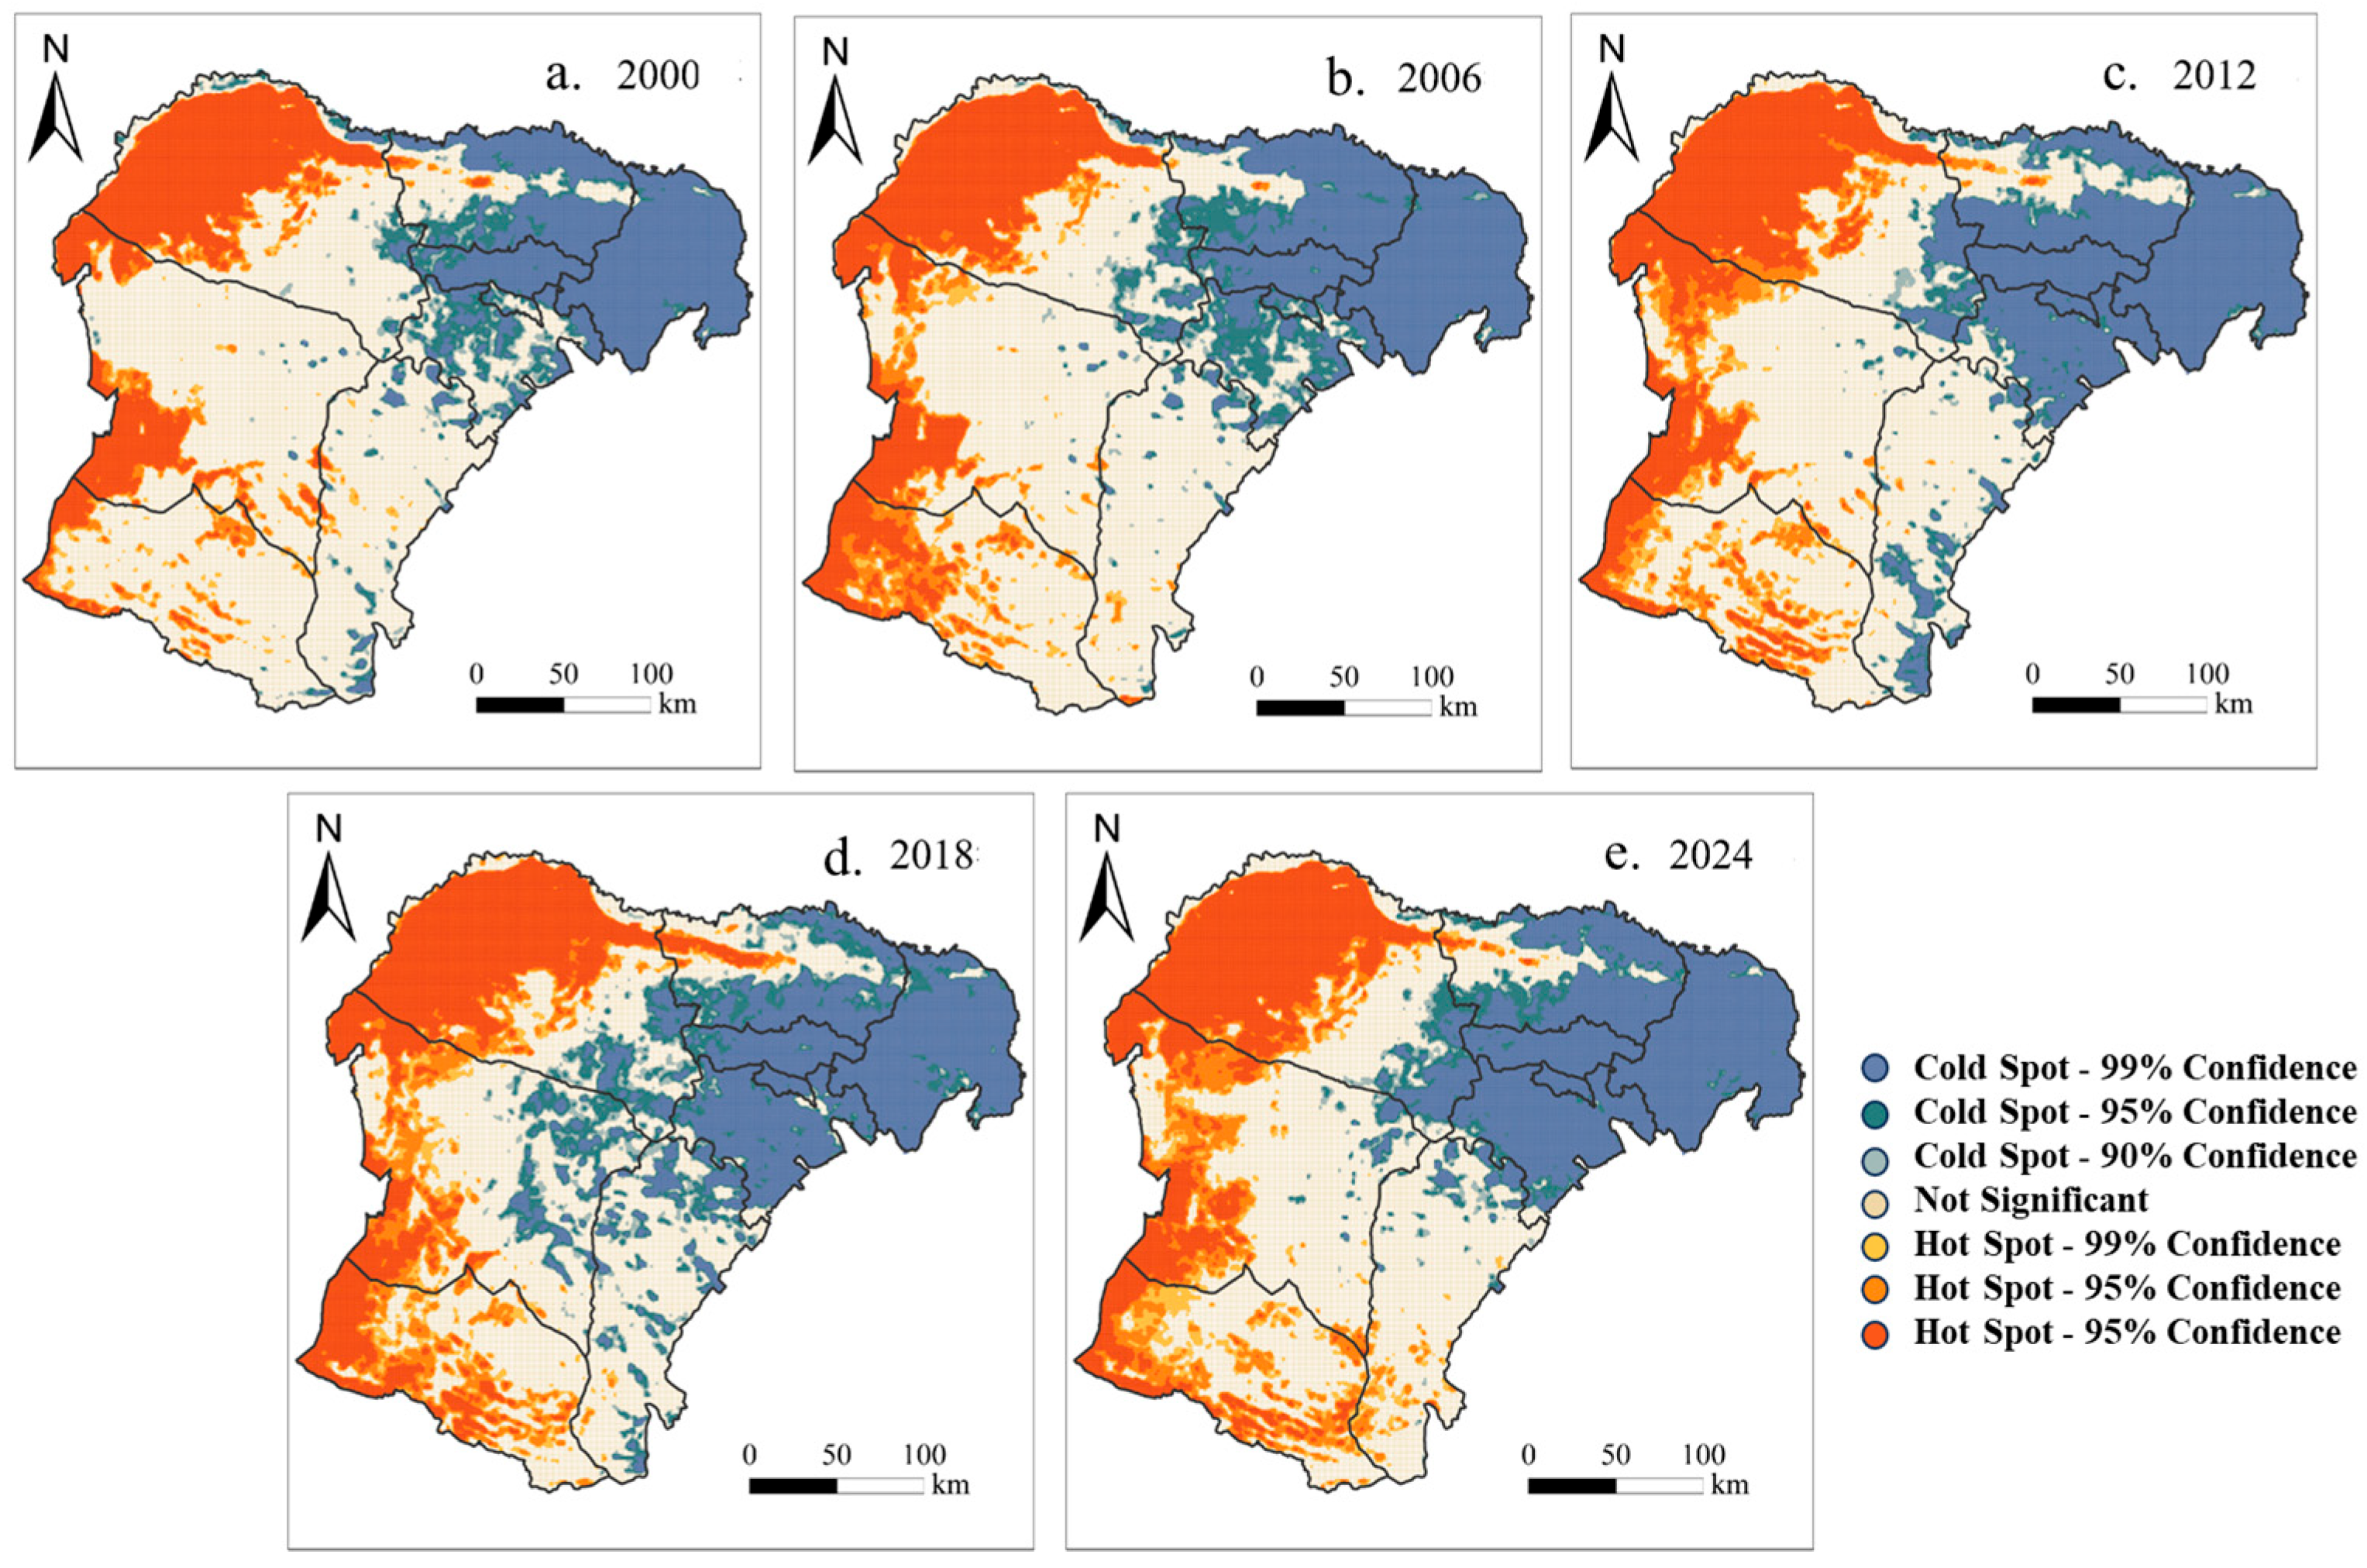
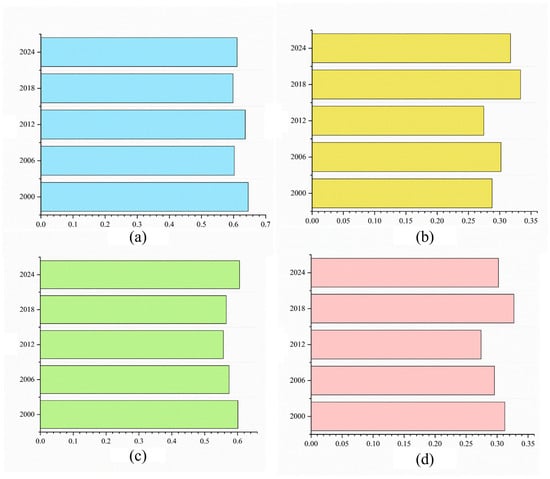
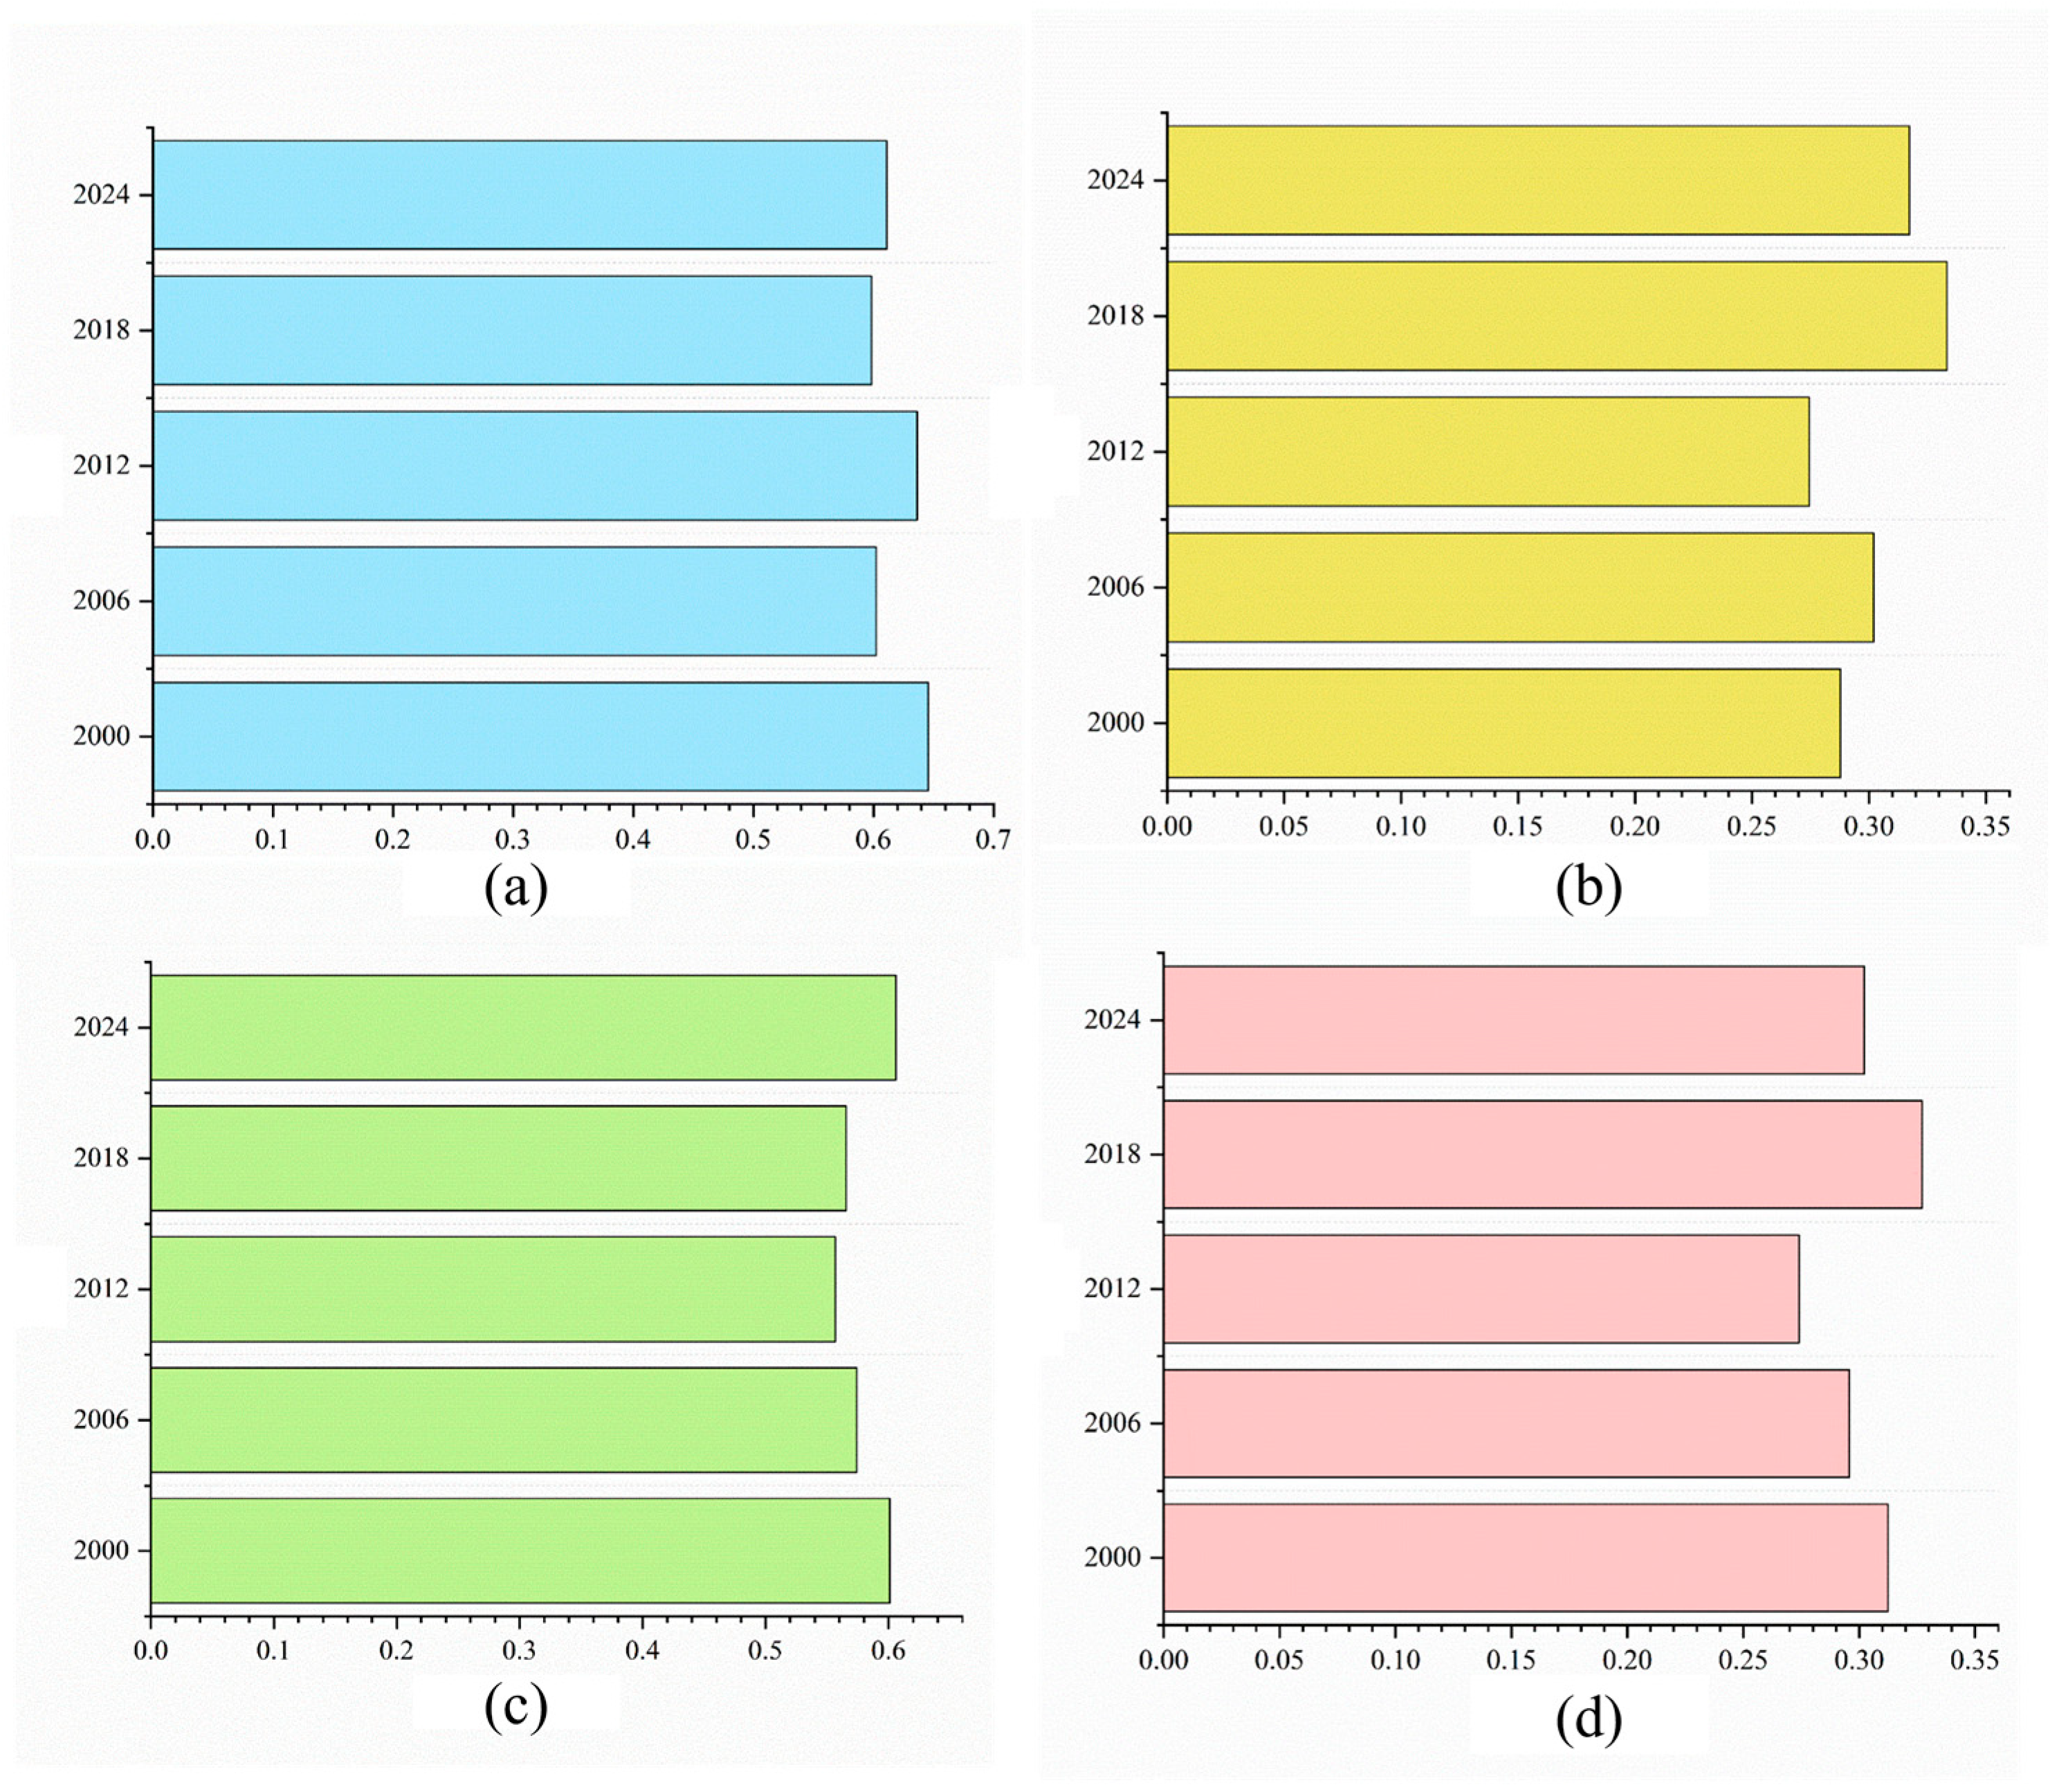
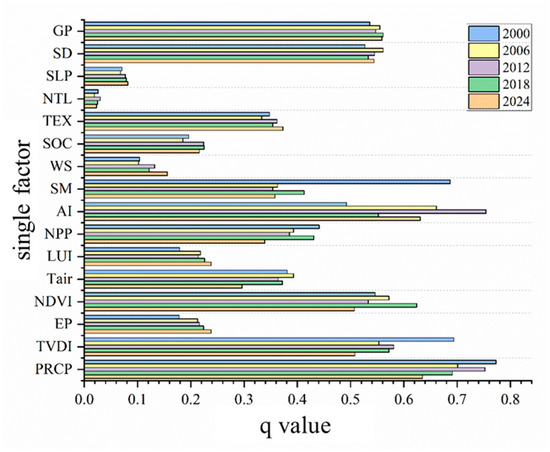
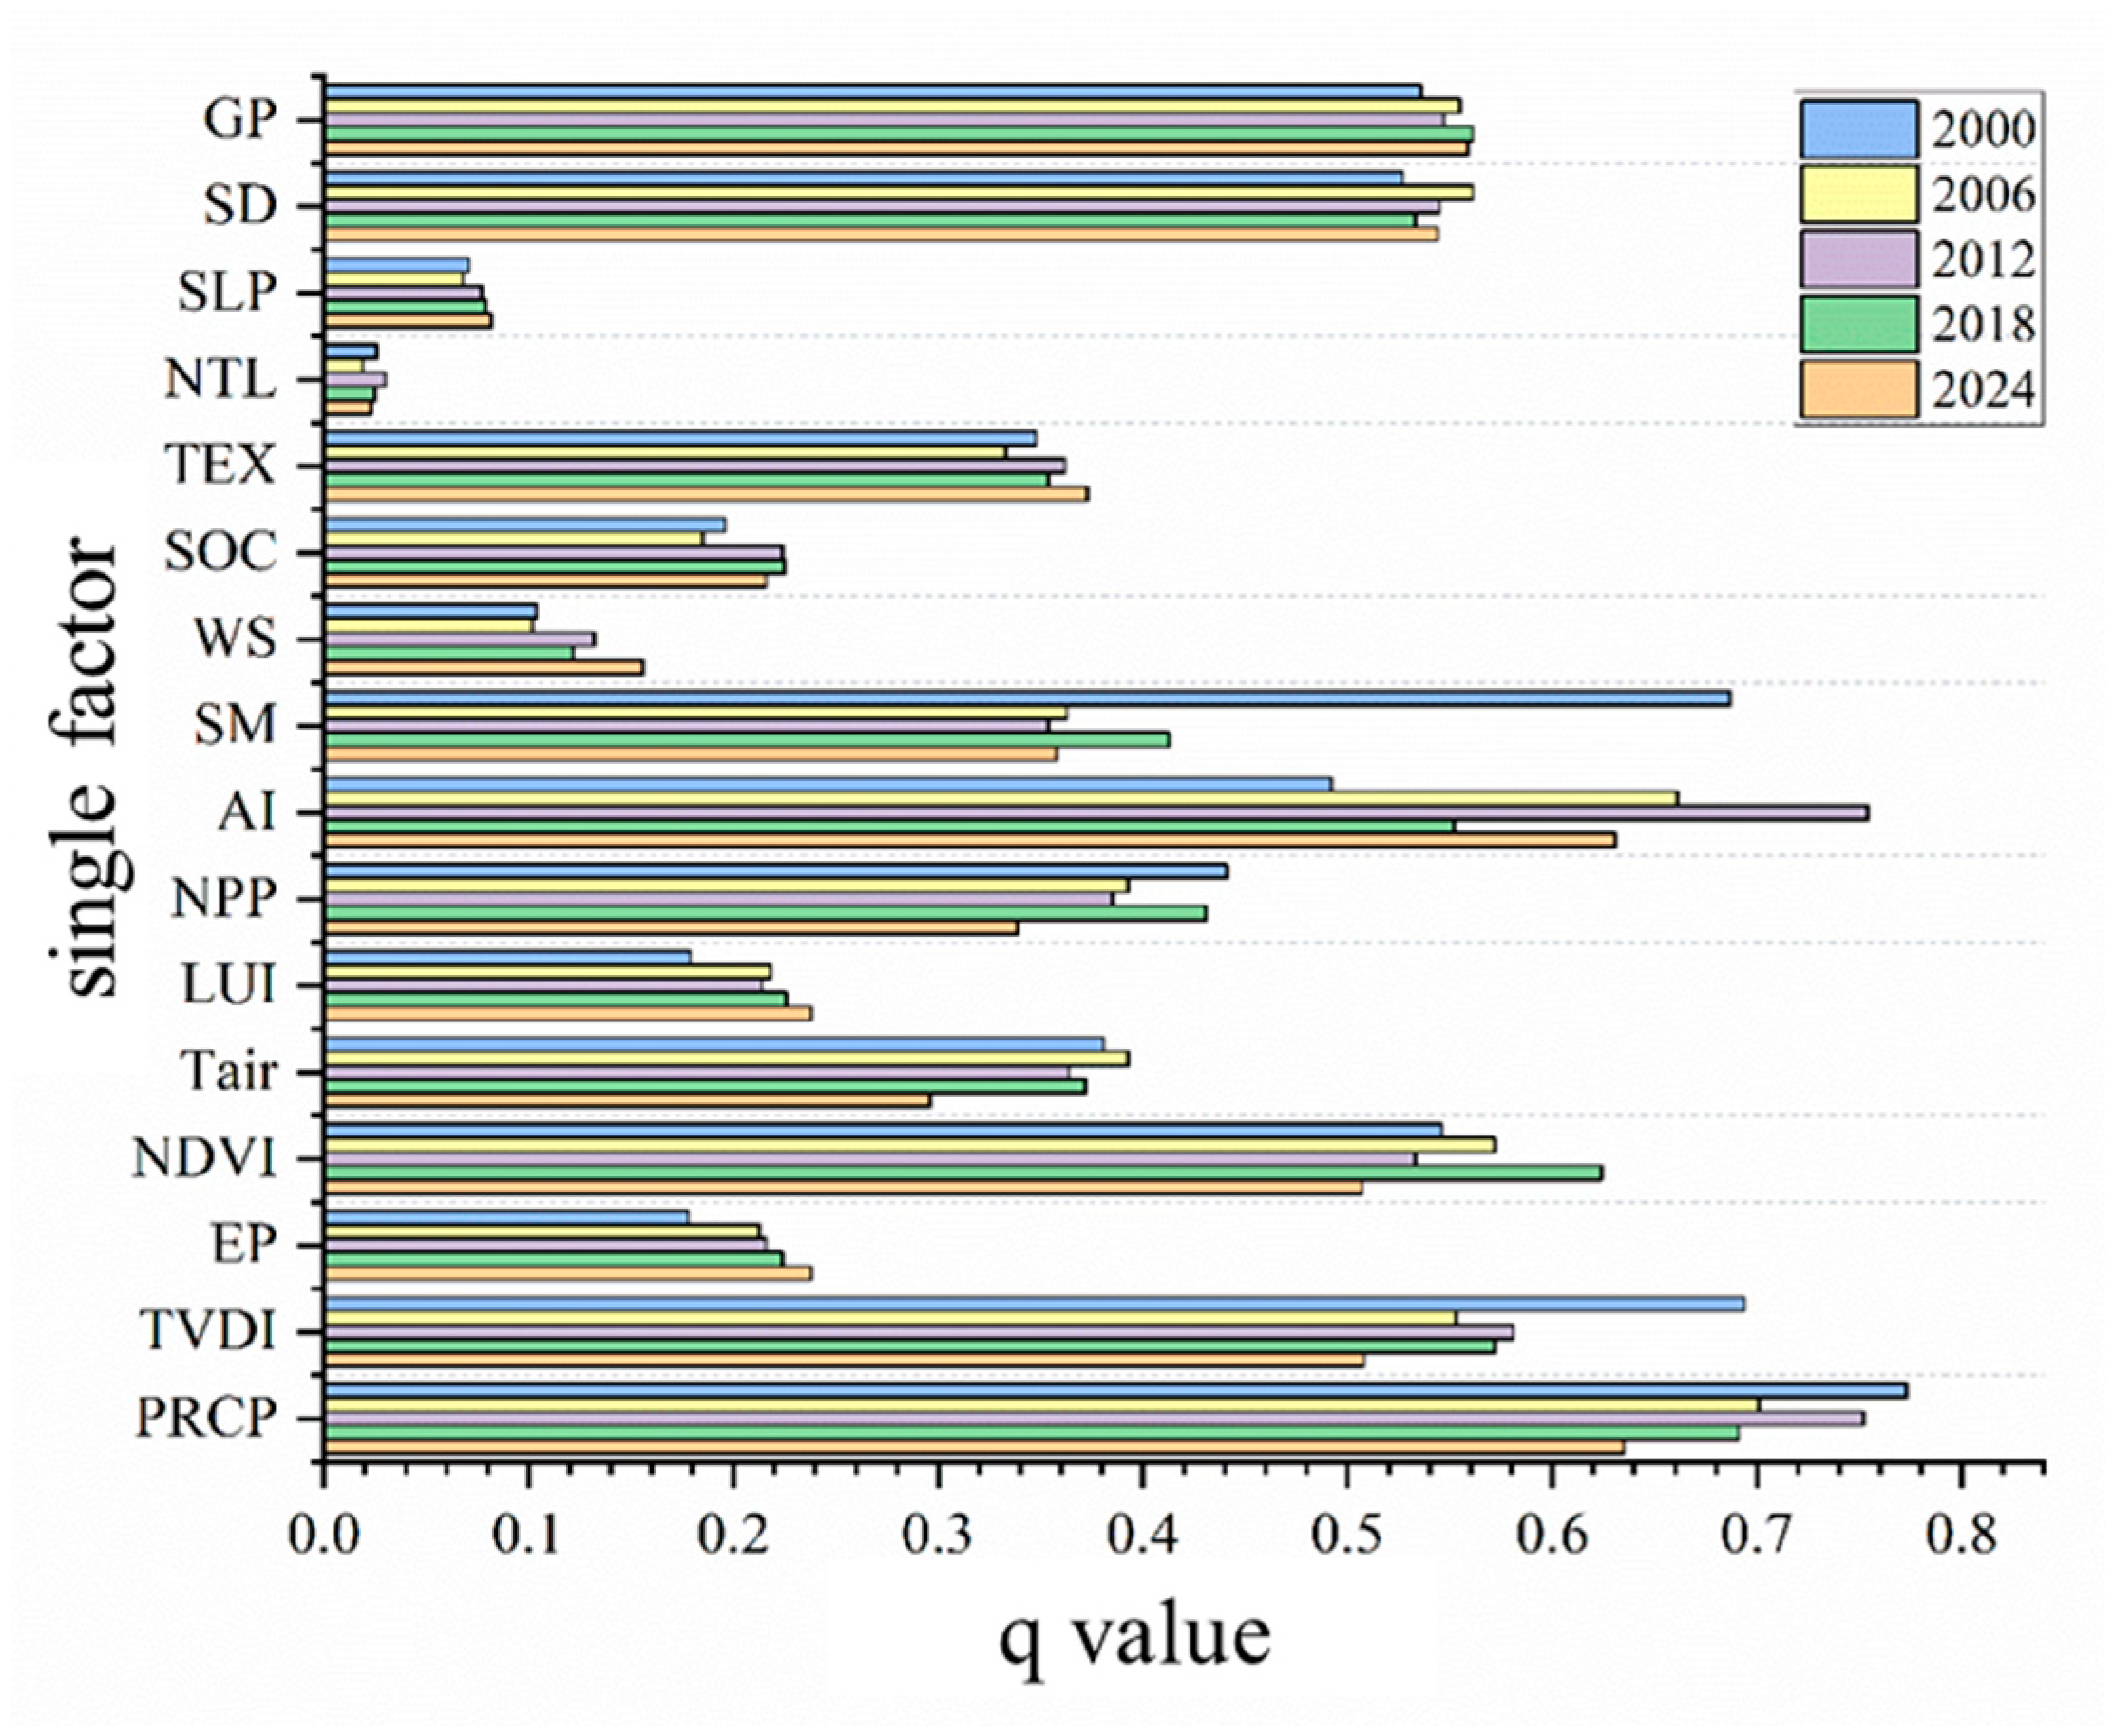
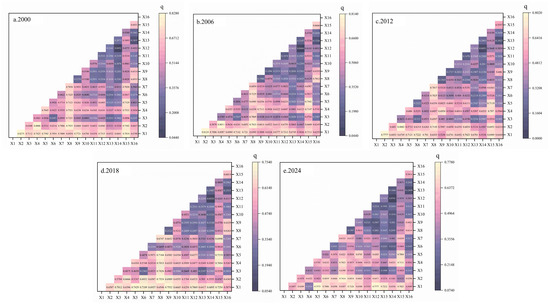
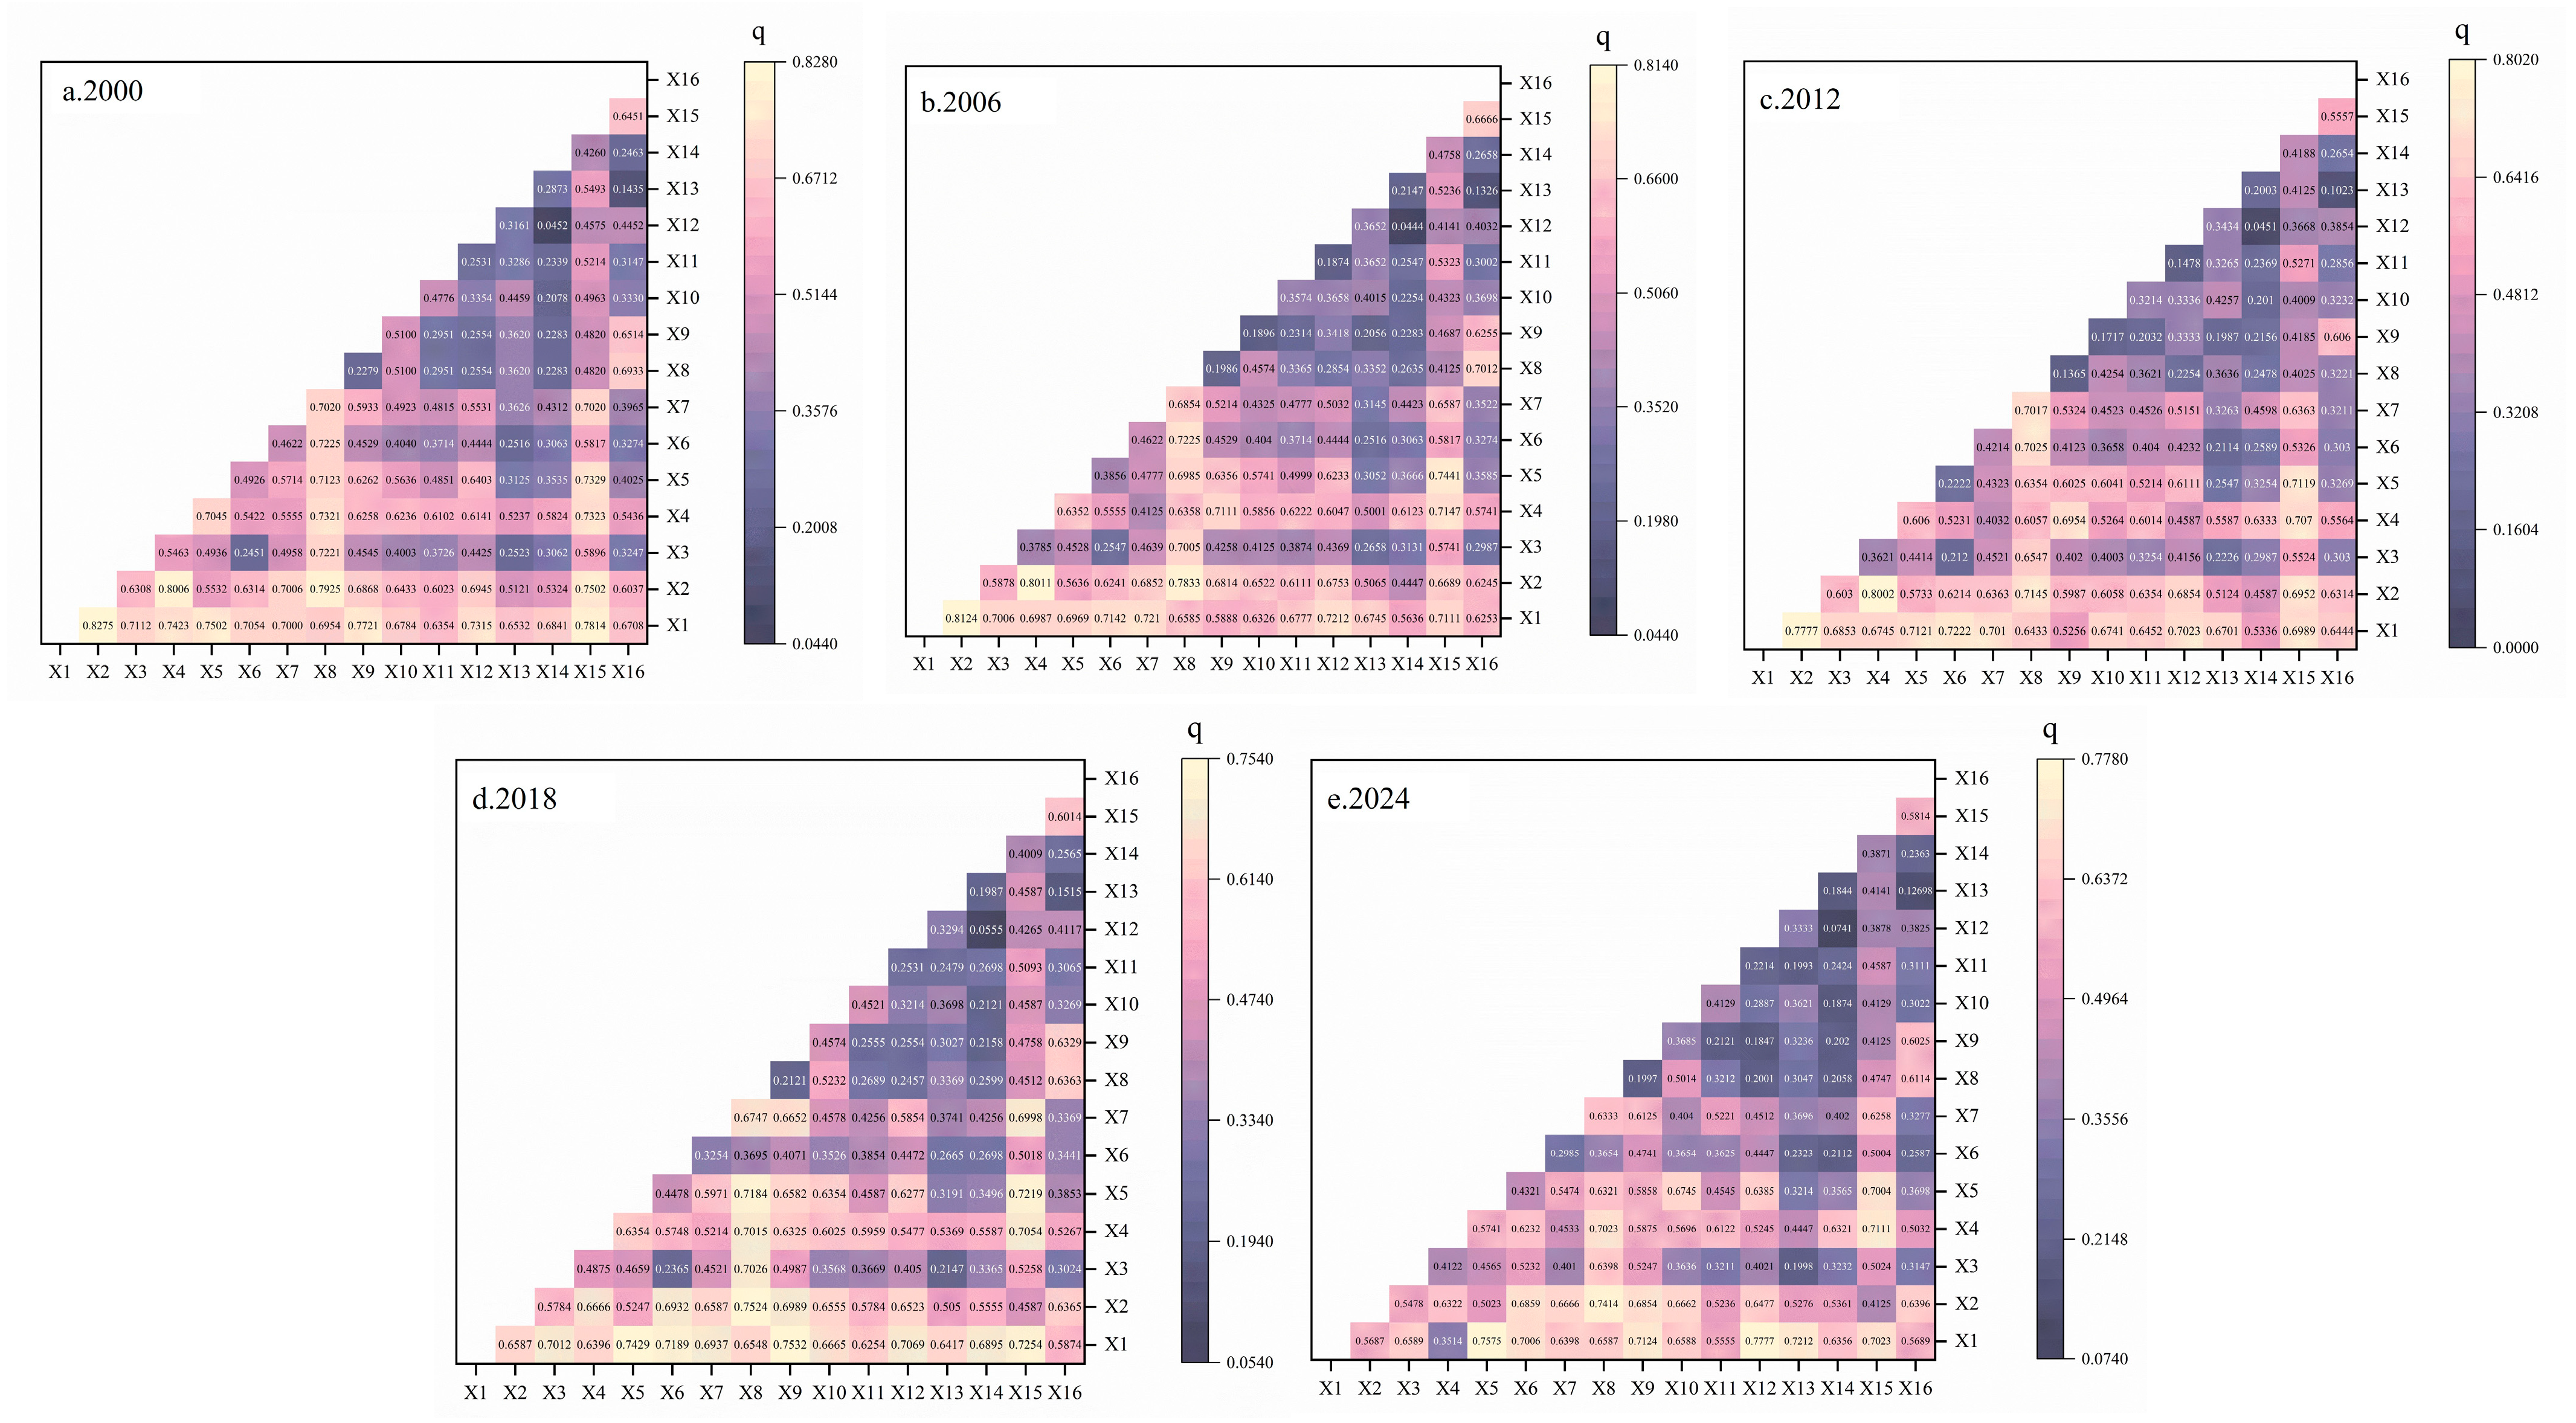
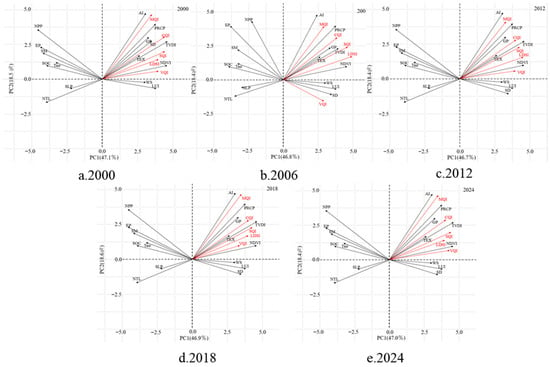
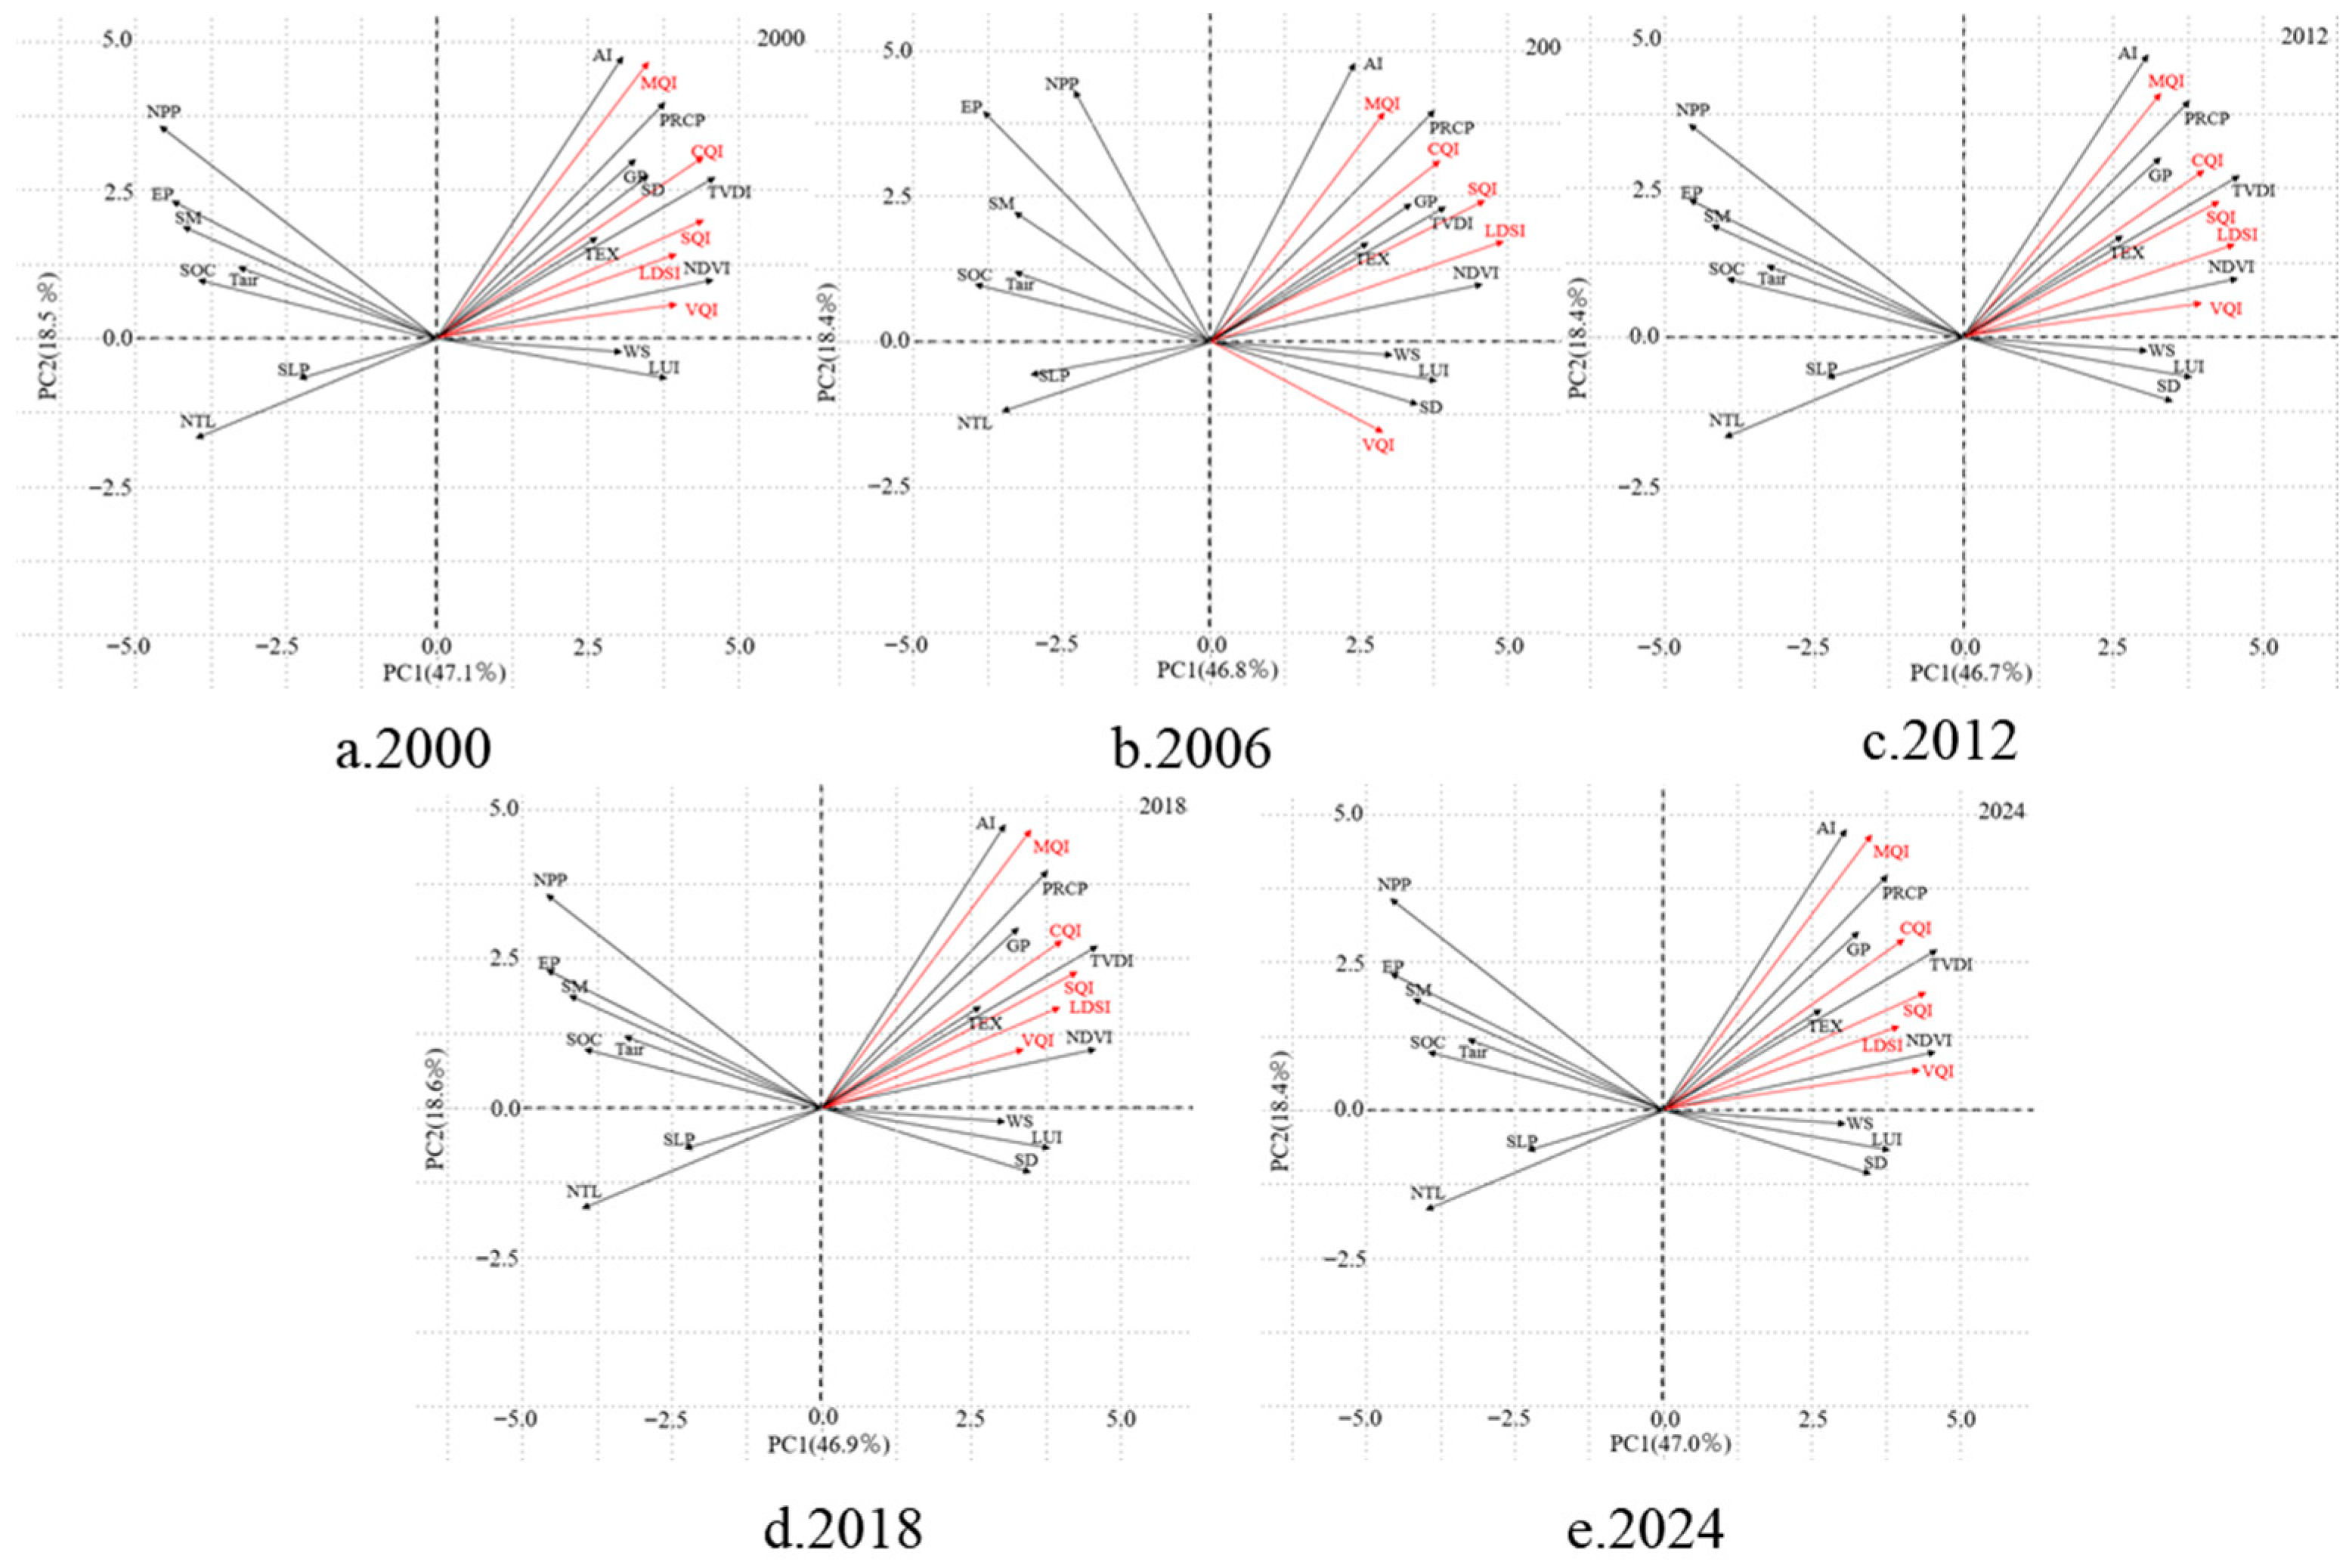

Disclaimer/Publisher’s Note: The statements, opinions and data contained in all publications are solely those of the individual author(s) and contributor(s) and not of MDPI and/or the editor(s). MDPI and/or the editor(s) disclaim responsibility for any injury to people or property resulting from any ideas, methods, instructions or products referred to in the content. |
© 2026 by the authors. Licensee MDPI, Basel, Switzerland. This article is an open access article distributed under the terms and conditions of the Creative Commons Attribution (CC BY) license.