


Abstract
This study examines how exchange-rate competitiveness and external economic activity are associated with health-purpose visits, total real receipts, and real receipts per visit in Türkiye using quarterly data for 2014Q2–2024Q4. Dynamic ARDL models are estimated for visitor volume and total receipts, while receipts per visit is examined using stationary dynamic specifications that incorporate changes in REER and OECD real GDP. Additional lag structures, a 2021Q3 pulse indicator, and autoregressive-error models provide sensitivity evidence. Visitor estimates show a generally negative association with REER across specifications, with the precision of inference assessed alongside the residual diagnostics. In the total-receipts baseline, OECD GDP is positively associated with receipts in the long run, while the REER coefficient is not statistically significant. For receipts per visit, positive associations with changes in REER arise in the stationary models, although statistical significance varies with lag choice and the treatment of the unusual 2021Q3 observation. By examining demand volumes together with inflation-adjusted revenue measures, the study offers a differentiated perspective on medical-tourism competitiveness and provides evidence relevant to the economic dimension of sustainable destination planning.
1. Introduction
Medical tourism constitutes a distinct segment of international trade in health services, combining healthcare utilization with cross-border travel. Advances in transportation infrastructure, digital communication, medical technology, and cross-border healthcare coordination have facilitated access to treatment outside patients’ countries of residence. International patients may seek treatment abroad because of lower costs, shorter waiting times, access to specialized procedures, or higher-quality healthcare services. For destination economies, medical tourism can generate foreign-exchange earnings, support employment, stimulate investment in healthcare infrastructure, and strengthen the international competitiveness of health services. These potential benefits make medical tourism increasingly relevant to sectoral policy and broader economic planning.
Türkiye has emerged as a significant medical-tourism destination, supported by its geographical accessibility, competitive treatment costs, modern healthcare facilities, and growing specialization in medical services. The sector has attracted policy attention as part of efforts to diversify tourism revenues and strengthen the contribution of healthcare services to the national economy. Nevertheless, evaluating its economic performance requires more than monitoring international patient arrivals. Growth in health-purpose visits does not necessarily translate into proportional increases in total real tourism receipts, particularly when average receipts per visit change over time. Differences in treatment composition, patient expenditure, and the structure of international demand may cause visitor volume and revenue performance to evolve differently. Distinguishing these dimensions is therefore important for understanding medical-tourism competitiveness.
Exchange-rate competitiveness represents a key macroeconomic consideration in international medical-tourism demand. An appreciation of the domestic currency can increase the relative cost of medical treatment and associated travel expenditures, potentially weakening the destination’s price attractiveness for international patients. However, exchange-rate movements may not be associated uniformly with visitor arrivals, aggregate receipts, and average receipts per visit. Changes in relative prices may coincide with shifts in patient composition, treatment choices, and expenditure patterns, producing different relationships across these performance indicators. The real effective exchange rate (REER), which captures changes in relative prices against a trade-weighted basket of currencies, is employed in this study as an indicator of international price competitiveness.
External economic conditions constitute another important determinant of international medical-tourism activity. Higher income in potential source markets may strengthen households’ ability to finance international travel and medical treatment, particularly for services not fully covered by health insurance. This study employs OECD real GDP as a broad proxy for external economic conditions and purchasing capacity. Although this aggregate measure does not represent the specific income circumstances of all patient-origin countries, it provides a consistent indicator of economic activity across a substantial group of internationally connected economies.
The economic performance of medical tourism is also relevant to the broader framework of sustainable destination development. Figueiredo et al. [1] identify economic, social, and environmental dimensions of sustainable health tourism, while Çapar and Arslanoğlu [2] examine relationships between sustainable development goals and medical tourism across countries. Within this broader perspective, assessing whether increases in international patient activity are accompanied by improvements in real tourism revenues provides useful evidence for the economic dimension of destination planning. Monitoring visitor volume, aggregate real receipts, and receipts per visit can therefore support a more comprehensive evaluation of sectoral performance and its implications for economic sustainability, without treating these indicators as direct measures of sustainability.
Previous studies have examined the macroeconomic determinants of medical tourism in Türkiye from several perspectives. Ağazade and Ergün [3] investigate the relationship between health-tourism revenues and the real exchange rate, while Sinet et al. [4] examine macroeconomic determinants of international health-tourism revenues across different regimes. Kalkay and Sarıipek [5] extend the analysis to tourism revenues and visitor numbers, incorporating exchange-rate and inflation measures. Beyond Türkiye-specific evidence, Gholipour and Esfandiar [6] investigate the relationship between medical tourism and healthcare-sector growth, while Ağazade [7] examines the relationship between travel-for-health revenues and economic growth using cross-country data. Related tourism research further distinguishes dimensions of international demand [8] and investigates average expenditure per tourist in Türkiye [9].
Although these studies provide valuable evidence on tourism demand, revenue generation, and economic growth, the literature reviewed here offers limited direct comparison of how exchange-rate competitiveness relates to three distinct dimensions of medical-tourism performance within a consistent quarterly framework for Türkiye: health-purpose visits, total real receipts, and real receipts per visit. This distinction matters because the same macroeconomic conditions may be associated with different magnitudes or directions of change across these indicators. Consequently, conclusions based exclusively on visitor arrivals or aggregate receipts may provide an incomplete understanding of destination competitiveness and economic performance.
To address this gap, the present study investigates the relationships between exchange-rate competitiveness, external economic conditions, and three complementary dimensions of medical tourism performance in Türkiye: health-purpose visits, total real receipts, and real receipts per visit. Drawing on quarterly data from 2014Q2 to 2024Q4, the study employs dynamic time-series models to examine how these dimensions respond to changes in macroeconomic conditions. By distinguishing between visitor volume, aggregate revenues, and average receipts per visit, the analysis provides a more nuanced understanding of medical tourism competitiveness and offers insights into its implications for economic sustainability.
The study contributes to the existing literature in three respects. First, it compares the relationships of exchange-rate competitiveness and external economic conditions with three complementary dimensions of medical-tourism performance within a common quarterly empirical setting for Türkiye. Second, by examining real receipts per visit as a separate dependent variable, it provides additional evidence on average revenue performance that may not be apparent from visitor arrivals or aggregate receipts alone. Third, the findings offer policy-relevant insights into medical-tourism competitiveness and the economic sustainability implications of distinguishing visitor growth from real revenue performance. Together, these contributions extend the empirical assessment of medical tourism beyond individual performance indicators while recognizing that the estimated relationships are associational rather than causal.
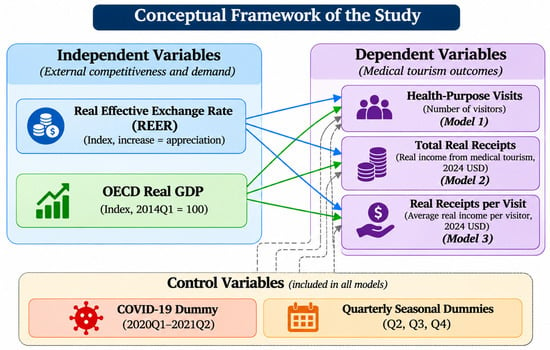
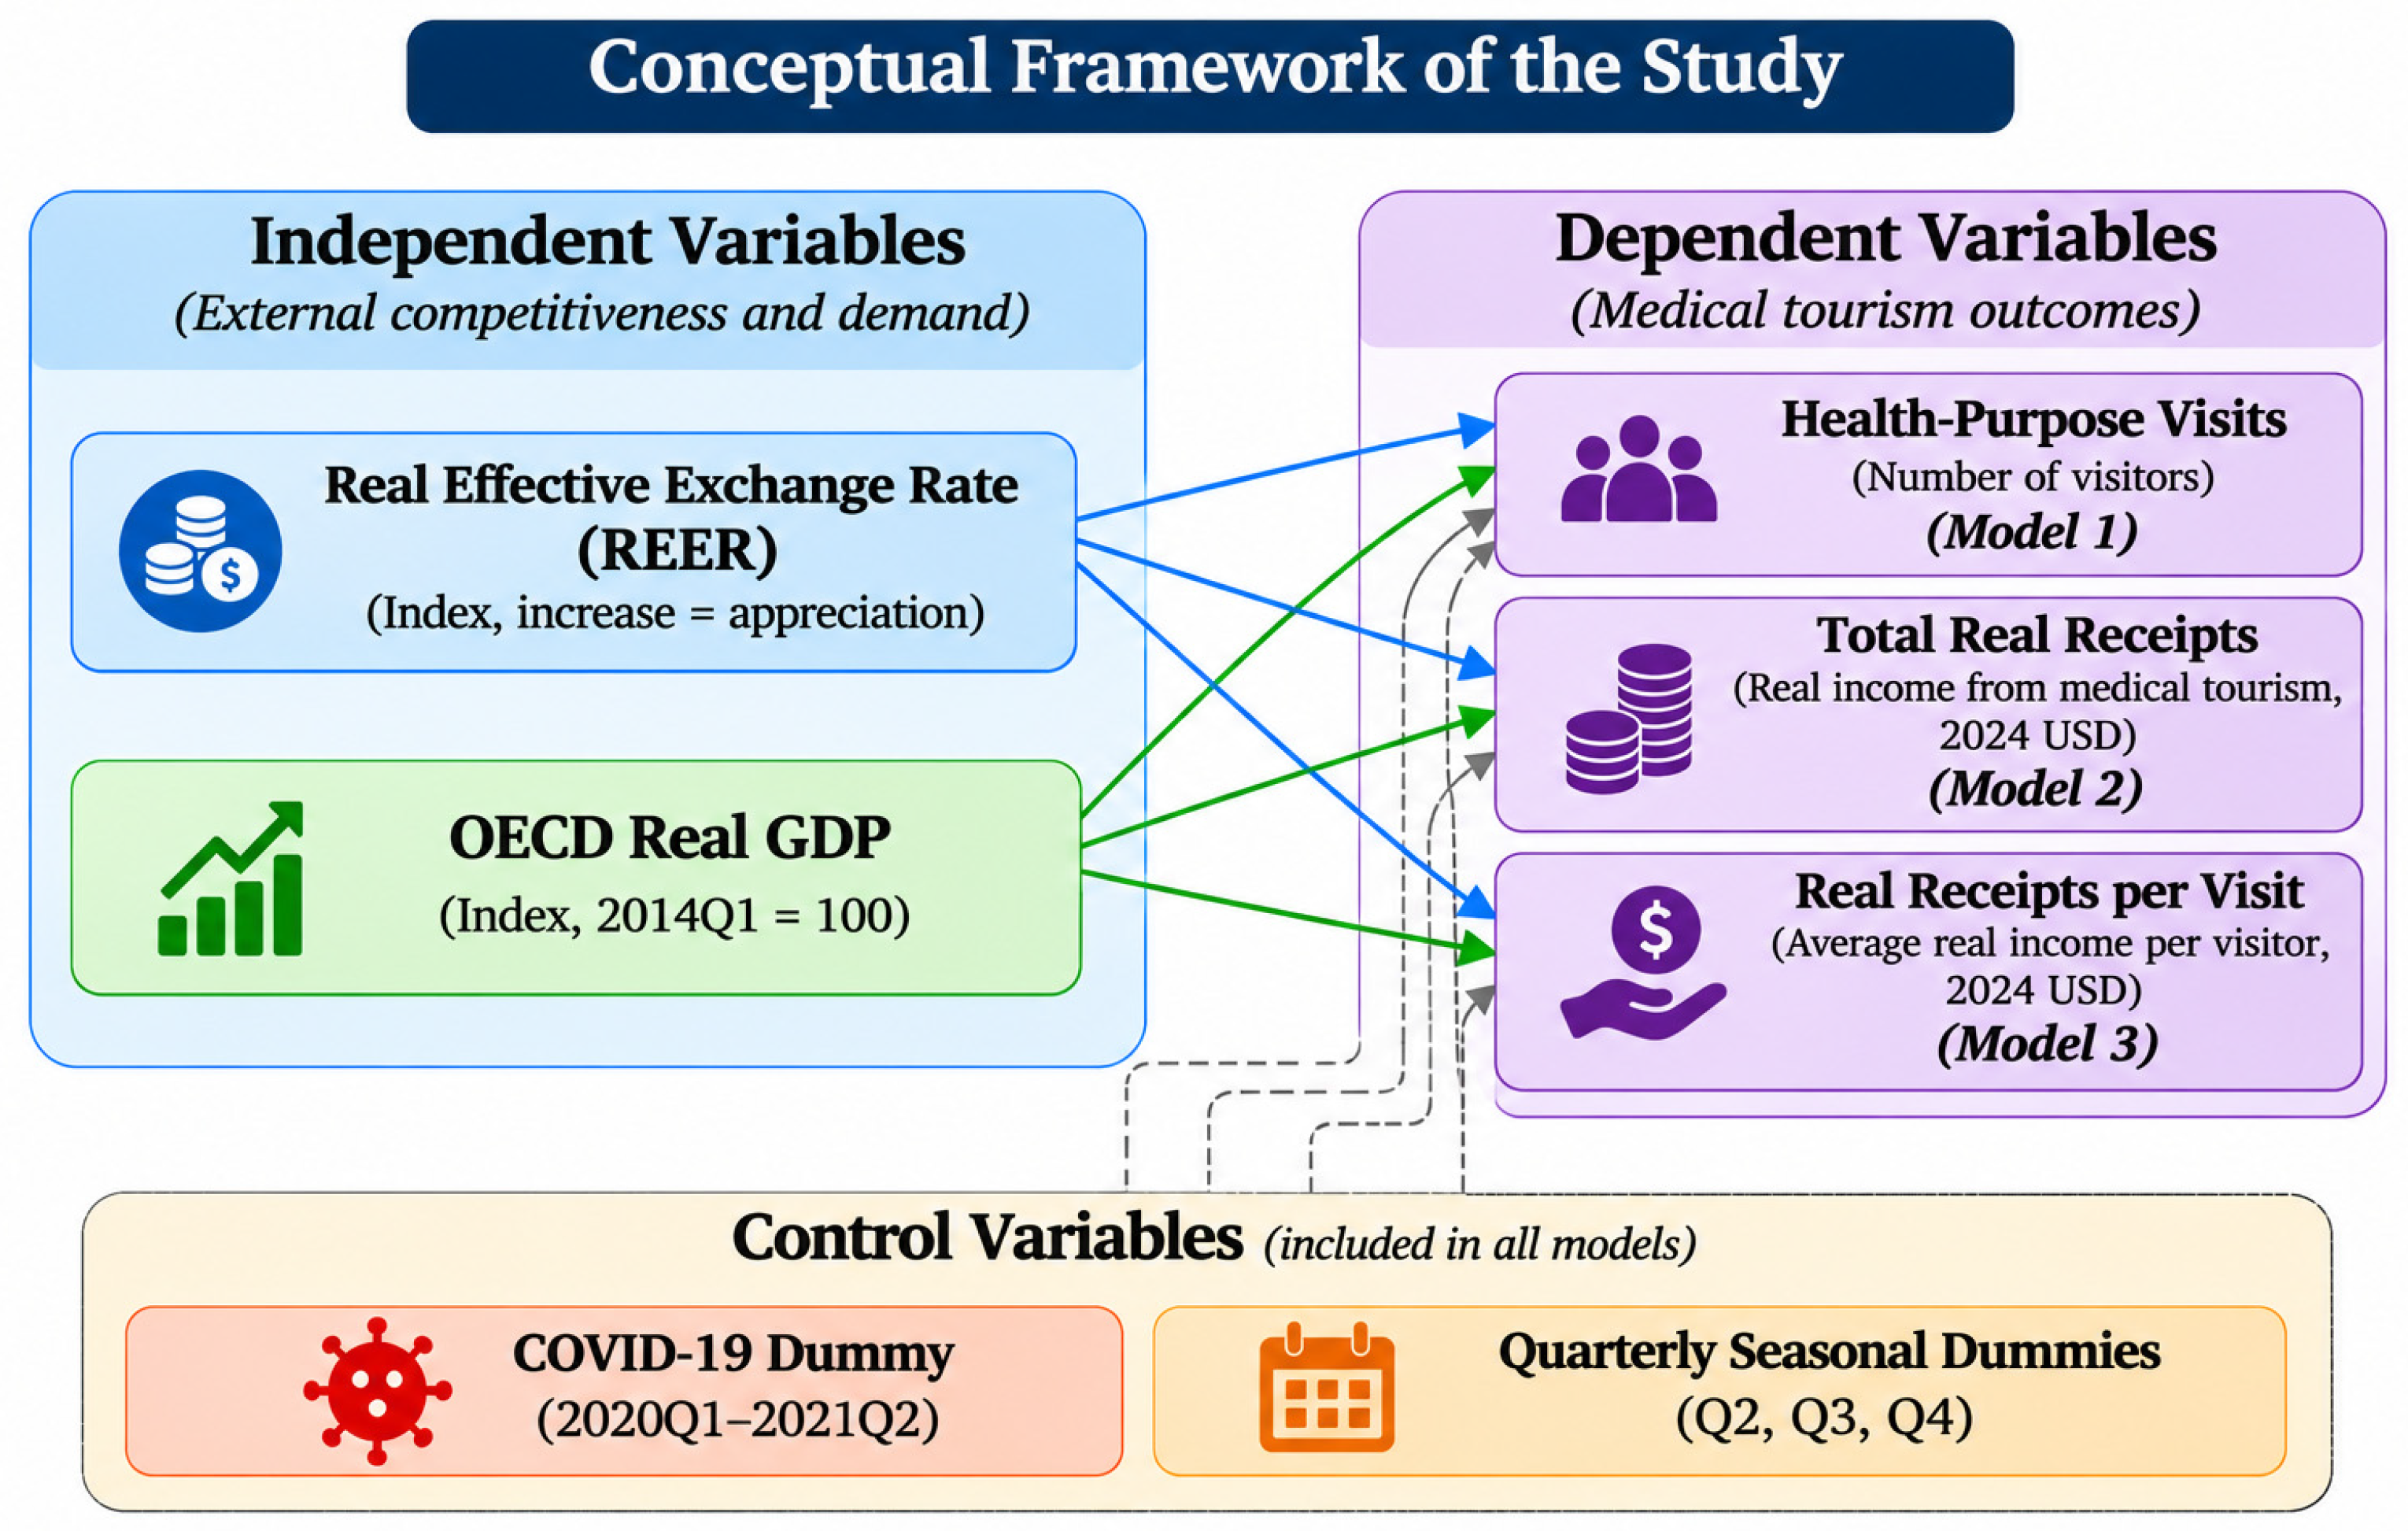
To illustrate the conceptual structure of the study, Figure 1 presents the relationships examined between the principal macroeconomic explanatory variables and the three dimensions of medical-tourism performance. The REER and OECD real GDP serve as independent variables, while health-purpose visits, total real receipts, and real receipts per visit represent separate dependent variables. COVID-19 and quarterly seasonal indicators are incorporated as common controls across the three models.
Figure 1.
Conceptual framework linking macroeconomic conditions to three dimensions of medical-tourism performance in Türkiye. Note: Solid arrows indicate the relationships examined between the explanatory variables (REER and OECD real GDP) and each dependent variable. Dashed arrows indicate the inclusion of COVID-19 and quarterly seasonal controls. The three outcomes are analyzed separately. The arrows do not represent estimated coefficient signs or causal effects. Source: Author’s own elaboration.
The remainder of the paper is organized as follows. Section 2 reviews theoretical and empirical literature. Section 3 describes the data and empirical methodology. Section 4 presents the baseline estimation results. Section 5 reports robustness checks and diagnostic evidence. Section 6 discusses the findings and their implications for destination competitiveness and economic sustainability. Section 7 concludes with the study’s limitations and directions for future research.
2. Literature Review and Theoretical Context
2.1. Medical Tourism and Economic Performance
Medical tourism represents a form of international trade in health services in which individuals travel outside their country of residence to obtain medical treatment. Its economic contribution extends beyond healthcare provision to foreign-exchange earnings, employment, infrastructure investment, accommodation, transportation, and related services. Beladi et al. [10] examine the relationship between medical tourism and economic growth across countries, highlighting differences associated with national economic and healthcare conditions. Chowdhary and Majumdar [11] similarly investigate the contribution of health-tourism revenues, infrastructure investment, and trade openness to economic growth in developing economies. The economic contribution of medical tourism also depends on institutional capacity and service organization. Özsarı and Şeker [12] describe an international-patient coordination model integrating treatment planning with assistance throughout the patient journey. Buzcu and Birdir [13], using evidence from 206 private-hospital managers in Türkiye, identify promotion, staffing, financial support, and accreditation as important considerations for sectoral development. Budak [14] provides a broader perspective on the historical development and management of health tourism. Together, these studies demonstrate that the economic performance of medical tourism depends on both international demand and the capacity of destination healthcare systems to provide and coordinate services. For empirical assessment, health-purpose visits, total real tourism receipts, and real receipts per visit capture complementary dimensions of economic activity. Visitor counts indicate the volume of international demand, aggregate receipts represent total tourism spending associated with health-purpose visits, and receipts per visit measure average revenue per recorded visit. These indicators provide different perspectives on sectoral performance, although none independently measures hospital profitability or domestic value added.
2.2. Economic Sustainability and the Measurement of Medical-Tourism Performance
The sustainability literature emphasizes that tourism development must be evaluated beyond growth in visitor arrivals or financial receipts. Figueiredo et al. [1] synthesize research addressing the economic, social, and environmental dimensions of sustainable health tourism, while Çapar and Arslanoğlu [2] examine relationships between sustainable development goals and medical tourism across 34 countries. In the broader tourism literature, Elgin and Elveren [15] consider tourism arrivals and revenues alongside multiple sustainable development indicators, emphasizing the multidimensional nature of tourism’s relationship with sustainable development. A related body of empirical research focuses more directly on economic outcomes. Gholipour and Esfandiar [6] examine the association between medical tourism and healthcare-sector growth across 49 economies, while Ağazade [7] investigates the relationship between travel-for-health revenues and economic growth using data from 72 countries. These studies establish the broader economic relevance of medical tourism, but their research objectives differ from examining the relationship between exchange-rate competitiveness and alternative measures of medical-tourism performance. Within this context, comparing visitor activity with inflation-adjusted revenue measures offers a useful perspective on the economic dimension of sustainable destination planning. An increase in visitor numbers does not necessarily imply a proportional improvement in real revenue performance. Monitoring both dimensions may therefore assist policymakers in evaluating sectoral development, economic exposure, and revenue trends. Such indicators provide information relevant to economic sustainability considerations, while a comprehensive assessment of sustainability would additionally require evidence on healthcare capacity, domestic economic benefits, social outcomes, and environmental impacts.
2.3. Exchange-Rate Competitiveness and Medical-Tourism Demand
Exchange rates influence international tourism demand through their relationship with destination price competitiveness. When an increase in the real effective exchange rate (REER) represents domestic-currency appreciation, destination services become relatively more expensive compared with those offered by trading partners. For medical tourism, this may affect the affordability of treatment, accommodation, transportation, and other travel-related expenditures. Appreciation may consequently weaken demand among price-sensitive international patients, whereas depreciation may strengthen relative price competitiveness. Nevertheless, medical-tourism demand may respond differently from conventional leisure tourism because treatment decisions depend on medical necessity, procedure availability, service quality, waiting times, and healthcare specialization. Tang and Lau [16] identify income, prices, exchange rates, safety, medical quality, personnel, and facilities as relevant factors influencing medical-tourism demand in Malaysia. Kadir and Nayan [17] similarly examine the roles of medical-tourism prices, travel costs, real income, exchange rates, and healthcare expenditure. Recent research also highlights differences in tourism responses to relative prices. Pailwar and Mitra [18] employ a threshold gravity framework to examine nonlinear relationships between exchange-rate-adjusted relative prices and medical-tourist inflows to India. In broader inbound tourism, Sharma et al. [19] investigate nonlinear long-run exchange-rate relationships with arrivals, while Sharma et al. [20] examine exchange-rate and global-income relationships using an ARDL approach. Esquivias et al. [21] show that income and relative-price sensitivities differ across Indonesia’s major source markets. These findings suggest that exchange-rate relationships may vary across destinations, source markets, and categories of demand. For medical tourism, such differences could also be reflected in the composition of visitors and their expenditures. Exchange-rate movements may be associated not only with changes in visitor numbers but also with changes in average receipts per visit. However, identifying the mechanisms underlying these relationships requires information beyond aggregate tourism statistics. Measurement considerations are therefore important. Horsfall and Lunt [22] discuss challenges associated with quantifying medical tourism and defining relevant indicators of activity. In the present study, real receipts per health-purpose visit are used as an average revenue measure rather than a direct indicator of clinical expenditure, treatment quality, or healthcare-provider profitability.
2.4. Empirical Evidence from Türkiye
Research on Türkiye provides direct evidence of the relevance of exchange rates and macroeconomic conditions to health-tourism activity. Ağazade and Ergün [3] identify a long-run relationship between health-tourism revenues and the real exchange rate using quarterly data for 2002Q1–2019Q4. Their subsequent research [23] extends the analysis across medical-tourism segments and examines the roles of tourist income, healthcare supply, marketing activity, and exchange-rate conditions. Biri [24] likewise investigates the relationship between Türkiye’s health-tourism revenues and macroeconomic factors using cointegration analysis. Other studies demonstrate that these relationships may vary with economic conditions and modeling approaches. Sinet et al. [4] examine international health-tourism revenues across different macroeconomic regimes, finding that relative prices and exchange-rate competitiveness are particularly relevant in the high-revenue regime. Gündoğan et al. [25] analyze the dynamic response of health tourism to exchange-rate shocks, providing additional evidence on the importance of currency movements. Kalkay and Sarıipek [5] provide a particularly relevant contribution by examining health-tourism revenues and visitor numbers alongside the REER and inflation using quarterly data for 2012Q1–2024Q1. Their inclusion of both arrivals and revenues recognizes that tourism activity can be evaluated through more than one performance indicator. However, their analysis does not separately model inflation-adjusted receipts per visit, leaving scope for further investigation of how average revenue performance relates to exchange-rate movements. Institutional and financial research provides additional context. Demir Uslu et al. [26] discuss the internationalization and branding of the Turkish healthcare system. Demirel and Şahin [27] examine relationships between health-tourism revenues, the BIST100 index, and the USD/TRY exchange rate using quarterly data and ARDL analysis. Karcıoğlu [28] reviews evidence concerning the contribution of health-tourism revenues to hospitals’ foreign-exchange financing, highlighting differences in benefits across healthcare institutions. Additional studies address sectoral growth and heterogeneity in medical-tourism demand. Uçak [29] investigates the relationship between health-sector growth and inbound health-tourism income using cointegration and Granger-causality methods. Geçer [30] discusses the affordability advantages and imported-input cost pressures associated with lira depreciation in aesthetic and cosmetic tourism. Özdemir et al. [31] examine differences in destination preferences across treatment categories, indicating that medical-tourism demand is not homogeneous. A particularly relevant comparison from the broader tourism sector is provided by Gündüz et al. [9], who report a positive relationship between REER appreciation and average expenditure per tourist in Türkiye. Although their analysis does not isolate medical tourism, it demonstrates the relevance of examining expenditure per visitor rather than focusing exclusively on arrivals or aggregate revenues. Taken together, Türkiye-specific research establishes the importance of exchange-rate conditions for medical-tourism revenues and, in some cases, visitor arrivals. The closest studies nevertheless differ in their choice of outcomes, price measures, and empirical specifications. The present study builds on this evidence by comparing visitor volume, total real receipts, and real receipts per visit within the same quarterly setting. The resulting comparisons are descriptive associations across related indicators rather than a formally identified decomposition of aggregate revenue effects.
2.5. External Income and Source-Market Demand
External income is another important determinant of international medical-tourism demand. Higher income in patients’ countries of residence may increase their ability to finance medical treatment, travel, and accommodation, particularly when services are not fully covered by insurance. Tang and Lau [16] and Kadir and Nayan [17] identify income conditions as relevant to medical-tourism demand in Malaysia. For Türkiye, Ağazade and Ergün [23] report a positive relationship between tourist income and medical-tourism revenues. Evidence from broader tourism markets supports the importance of income while highlighting differences across source countries. Sharma et al. [20] report positive relationships between global income and inbound tourist arrivals in India, while Esquivias et al. [21] document variation in source-market income elasticities in Indonesia. Murshed [32] incorporates income, relative costs, and exchange rates into an ARDL analysis of tourism demand in Bangladesh. These studies demonstrate the relevance of macroeconomic income conditions, although differences in income measures and tourism markets limit direct comparisons. At the patient level, Öztürk [33] identifies healthcare quality, technology, affordability, accessibility, and cultural and linguistic proximity among the considerations influencing Kyrgyz medical tourists’ choice of Türkiye. This evidence further suggests that demand depends on origin-market characteristics beyond aggregate income alone. A central measurement issue concerns the selection of an appropriate external-income variable. Source-country-specific income measures may more closely reflect actual visitors’ purchasing capacity, particularly when weighted by the composition of tourism flows. However, aggregate quarterly models often face limitations in the availability and consistency of origin-specific data. OECD real GDP is therefore employed in the present study as a broad indicator of external economic activity. Its coefficients are interpreted as associations with general external economic conditions rather than as universal income elasticities applicable to all medical tourists visiting Türkiye.
2.6. Broader Tourism Demand and Elasticity Evidence
The broader international tourism literature offers a useful foundation for interpreting price and income relationships. Garín-Muñoz and Pérez Amaral [34] model tourism flows to Spain using source-market income, exchange rates, and relative prices. Culiuc [8] finds that real exchange-rate responses operate through different tourism-demand margins, including arrivals and length of stay, with differences between OECD and non-OECD markets. Chi [35] examines the dynamic relationships between income, exchange rates, and US tourism trade, while Ongan et al. [36] investigate the sensitivity of US tourist arrivals from selected European countries to income and tourism-specific real exchange rates. These contributions illustrate that estimated tourism relationships depend on destination characteristics, source markets, price measures, and the selected outcome variable. An important distinction also exists between different measures of tourism demand intensity. Length of stay, expenditure per tourist, and real medical-tourism receipts per health-purpose visit are conceptually related but measure different dimensions of activity. Consequently, coefficients obtained from these outcomes should not be treated as directly interchangeable. Comparisons across studies require attention to variable definitions, price adjustments, the composition of tourism demand, and the distinction between contemporaneous and long-run relationships. For the present study, this literature provides an economic rationale for examining multiple performance indicators while maintaining a separate interpretation of each estimated equation.
2.7. Synthesis and Research Gap
The reviewed literature establishes three central findings. First, medical-tourism demand and revenues are associated with macroeconomic conditions, particularly relative prices and external income. Second, evidence from Türkiye demonstrates the relevance of exchange-rate competitiveness to health-tourism performance. Third, broader tourism research highlights the importance of distinguishing visitor arrivals from spending-related outcomes. Despite these contributions, the studies reviewed here offer limited evidence comparing the relationships of exchange-rate competitiveness and external economic conditions with health-purpose visits, total real receipts, and real receipts per visit within a common quarterly empirical framework for Türkiye. Existing research provides substantial evidence on aggregate revenues and some evidence on visitor numbers, but less direct attention has been given to average real receipts per health-purpose visit as a separate modeled outcome. The present study addresses this gap by estimating three separate dynamic equations using the same underlying macroeconomic indicators and deterministic controls, with transformations appropriate to each outcome. This approach permits a comparison of how the three related dimensions of medical-tourism performance are associated with exchange-rate competitiveness and external economic activity. Its contribution lies in the joint interpretation of complementary performance indicators, rather than in identifying causal channels or constructing a new measure of sustainability. By connecting these comparisons to the economic dimension of sustainable destination planning, the analysis provides a basis for more differentiated monitoring of medical-tourism competitiveness and revenue performance.
3. Data and Empirical Approach
The analysis uses quarterly data for 2014Q2–2024Q4. Health-purpose visitor counts and associated tourism receipts are drawn from the Turkish Statistical Institute (TurkStat) MEDAS category “Health and Medical Reasons (Less Than 1 Year)”. Visitor counts represent departing health-purpose visits, including foreign visitors and Turkish citizens resident abroad; receipts encompass tourism expenditure associated with this travel purpose. The dataset comprises 43 calendar quarters, with 2020Q2 recorded as missing. The baseline one-lag models use 40 observations. Table 1 summarizes the variables, sources, and transformations [37].
Table 1.
Data sources, definitions, and transformations.
Visitor and total-receipts equations are estimated using ARDL models, with lag selection guided by AIC and extended-lag alternatives examined for robustness. For receipts per visit, the stationary dynamic specification includes its lagged level and first differences of log REER and log OECD GDP, together with COVID and quarterly controls. The analysis also examines a 2021Q3 pulse indicator and autoregressive-error specifications. ARDL models are widely used to examine tourism-demand dynamics. Applications include Thailand [38], Malaysia [39], India [20], and Bangladesh [32]. Cheng [40] applies bounds testing to Chinese maternity tourism to Hong Kong. The present analysis follows the bounds-testing framework of Pesaran et al. [41], with inference conditional on integration orders and residual diagnostics.
Bounds tests for the visitor and total-receipts equations use Case III (unrestricted constant, no trend) with two level regressors (k = 2). F- and t-statistics are assessed against their respective bounds distributions [41]; small-sample F-critical values are considered in light of the 40-observation baseline sample [42]. For the visitor equation, bounds statistics are considered together with the reported residual serial-correlation diagnostics (Section 4 and Section 5).
Nominal health-purpose receipts, reported in thousand US dollars, are multiplied by 1000 and deflated with the US Bureau of Labor Statistics all-items CPI obtained from FRED (CPIAUCSL). Monthly seasonally adjusted CPI observations are averaged within each quarter. Real receipts in 2024 US dollars equal nominal receipts in US dollars multiplied by the 2024 annual mean CPI (313.6981667) and divided by the quarterly mean CPI. Real income per visitor equals real receipts divided by health-purpose visits, giving ln(RIPV) = ln(RI) − ln(VISITORS). This adjustment measures US-dollar purchasing power rather than Turkish hospital margins or domestic value added [43].
The CPI-based REER is obtained from the Central Bank of the Republic of Türkiye (series TP_RK_T1_Y; 2025 = 100). Monthly observations are averaged within each quarter and transformed into natural logarithms; an increase denotes real appreciation. External economic activity is represented by a constructed OECD real GDP index. The source series, OECDNAEXKP01GPSAQ, reports seasonally adjusted quarter-on-quarter percentage growth. Setting = 100, the index is constructed recursively as
where denotes the quarterly growth rate in percent. The index is then log-transformed, with first differences used in the stationary receipts-per-visit specification. It represents OECD-wide economic activity rather than income weighted by visitors’ countries of origin [44,45].
The COVID indicator equals one from 2020Q1 through 2021Q2 and zero otherwise. Quarterly indicators Q2, Q3, and Q4 capture seasonality, with Q1 as the reference quarter. The pulse indicator D2021Q3 equals one in 2021Q3 and zero otherwise and is included only in the sensitivity specifications.
3.1. Descriptive Statistics
Table 2 presents descriptive statistics for the five study variables in their original units over 2014Q2–2024Q4. The common descriptive sample contains 42 observations, excluding 2020Q2 because tourism data are unavailable. The table reports the mean, median, sample standard deviation, minimum, and maximum.
Table 2.
Descriptive statistics for the study variables, 2014Q2–2024Q4.
Table 2 summarizes the variables over the study period. Quarterly health-purpose visits averaged approximately 208,018, ranging from 81,082 to 428,072. Real health-purpose receipts averaged USD 561.43 million per quarter, while real receipts per visit averaged USD 2830.61. The mean exceeding the median for both visitors and total receipts indicates that higher observations raised their sample averages. Real receipts per visit reached a maximum of USD 5884.26 in 2021Q3, highlighting the exceptional observation examined in the sensitivity analysis. The REER ranged from 77.84 to 149.07, while the OECD real GDP index ranged from 100.56 to 124.49.
3.2. Unit-Root Results
Table 3 reports the ADF and Phillips–Perron unit-root rechecks. The tests classify log health-purpose visits, log total real receipts, log REER, and log OECD real GDP as I(1), and log receipts per visit as I(0). The ADF lag length is selected by BIC (0–4). The Phillips–Perron tau test uses a Bartlett kernel and a four-quarter Newey–West bandwidth. Both tests include a constant and no trend. MacKinnon p-values are shown in parentheses.
Table 3.
Unit-root test results.
3.3. Model Representation
Let Vt denote log health-purpose visits, Yt log total real receipts, Pt log real receipts per visit, Rt log REER, and Gt log OECD real GDP. The two I(1) outcomes are examined using autoregressive distributed-lag models, with bounds statistics interpreted in conjunction with model-specific residual diagnostics.
The stationary receipts-per-visit equation instead includes Pt and Pt−1 in levels and uses ΔRt and ΔGt as regressors, together with COVID and seasonal controls. A 2021Q3 pulse is introduced in sensitivity analysis, and AR(1)-error estimation provides an additional check. Coefficients on ΔRt and ΔGt describe associations with contemporaneous changes rather than long-run levels.
4. Empirical Results
4.1. Main Baseline Estimates
Table 4 presents the baseline estimates for health-purpose visits, total real receipts, and real receipts per visit. The receipts-per-visit equation is a stationary dynamic regression and is interpreted in terms of associations with changes in the explanatory variables rather than a long-run cointegrating relationship. For this outcome, the positive coefficient on Δln(REER) is estimated with a p-value above 0.05 in the parsimonious baseline. The visitor and total-receipts coefficient estimates are presented separately, with the visitor benchmark accompanied by explicit residual serial-correlation diagnostics.
Table 4.
Baseline dynamic-model estimates.
4.2. Bounds Tests and Model Fit
Table 5 summarizes the bounds-test results, model fit, and residual serial-correlation diagnostics for the baseline specifications. The Case III total-real-receipts baseline yields F-bounds = 9.6611 (k = 2, N = 40) and t-bounds = −5.2124. Breusch–Godfrey tests do not reject the absence of residual serial correlation at one or two lags (LM p = 0.3122 and 0.1540). The visitor ARDL(1,0,0) yields F-bounds = 11.230 and t-bounds = −4.879. Because its BG tests indicate residual serial correlation, these statistics are presented as indicative estimates rather than used alone to establish cointegration. For the I(0) receipts-per-visit equation, the stationary dynamic formulation is used instead of bounds-based cointegration inference. For Case III and k = 2, PSS [41], Table CII(iii), gives asymptotic t-bounds I(0)/I(1) of −2.57/−3.21 at 10%, −2.86/−3.53 at 5%, and −3.43/−4.10 at 1%. The receipts statistic −5.2124 lies below the 1% I(1) bound. These t critical values are asymptotic; the reported small-sample F comparison is separate.
Table 5.
Bounds-test results and model fit.
4.3. Long-Run Associations and Diagnostic Considerations
Visitor normalized long-run estimates are reported as indicative magnitudes and discussed alongside the diagnostics in Section 5.7.
Normalized long-run coefficients are interpreted for the total-real-receipts baseline conditional on its unit-root classifications and residual diagnostics. Visitor multipliers are shown as benchmark calculations, with their interpretation informed by the residual serial-correlation results. The receipts-per-visit specification focuses on associations with changes in macroeconomic variables rather than long-run level multipliers.
4.4. Interpretation
For health-purpose visits, the restricted ARDL(1,0,0) gives a negative current REER coefficient (−0.7188, p = 0.0041). The negative REER estimates persist across expanded OLS lag specifications; residual serial correlation is also observed (two-lag BG LM p = 0.0022 in the original benchmark). In the separate AR(2)-error maximum-likelihood sensitivity with two lags of visits (N = 38), REER equals −0.8678 (p < 0.001) without the pulse and −0.7118 (p = 0.0001) with it; the pulse coefficient is 0.2105 (p = 0.0684). These conditional estimates provide additional evidence on the direction of the REER association; bounds-based long-run inference is considered separately for the ARDL equation.
For total real receipts, the baseline long-run REER multiplier is not statistically significant (−0.5844, p = 0.3379), whereas the estimated OECD GDP multiplier is positive (4.5992, p = 0.0385). Neither the one- nor the two-lag BG LM tests reject the no-pulse baseline. The ARDL(1,1,1) pulse specification yields calculated long-run REER and GDP multipliers of −0.4120 and 4.9011, respectively, and the BG LM diagnostics indicate residual serial correlation (BG LM p = 0.0249 and 0.0428). When the lag order is instead held fixed at (1,1,0), the BG LM diagnostics likewise indicate residual serial correlation (p = 0.0184 and 0.0475). These pulse estimates are accordingly presented as sensitivity evidence alongside the diagnostically more favorable no-pulse baseline.
For real receipts per visit, the coefficient on Δln(REER) is positive in the stationary OLS model without a pulse (1.1362, p = 0.0635), with a pulse (0.7361, p = 0.1120), and with pulse and AR(1) errors (0.3218, p = 0.2873). The estimates remain positive, while their statistical precision varies across the parsimonious sensitivity specifications; each has a p-value above 0.05. The AR(1)-error model estimates a positive 2021Q3 pulse coefficient (0.8443, p = 0.0008), capturing the distinct pattern observed in that quarter without assigning it a causal explanation.
The three outcomes are linked by the accounting identity ln(real receipts) = ln(visits) + ln(real receipts per visit). Their separately estimated equations have different dynamics and regressor transformations. Consequently, contemporaneous coefficients, normalized long-run multipliers, and coefficients on changes in REER are not directly comparable measures of the same effect. The comparison is descriptive across separately estimated equations; a formal cross-equation equality test would be required to assess differences in coefficients. The results therefore support separate monitoring of volume and revenue indicators, without presuming that the relationships represent offsetting exchange-rate effects.
5. Robustness and Diagnostic Evidence
The robustness analysis examines the influence of 2021Q3 through a pulse indicator. The fixed-lag comparisons distinguish the effect of the pulse from changes in lag selection. The underlying visitor and revenue series are defined in Table 1.
The robustness analysis separates fixed-lag comparisons that change only the pulse indicator from comparisons that also change selected lag orders because conflating these changes would obscure their individual contributions. AR-error sensitivity models are reported separately from OLS ARDL bounds specifications. The 2021Q3 pulse improves in-sample fit in several specifications, while the related BG diagnostics are reported alongside those improvements. The additional real-receipts comparison excluding 2021Q3 and its affected lagged-outcome period, 2021Q4, yields significant BG statistics for the 38-observation sample. These comparisons illustrate the sensitivity of selected estimates to the treatment of an influential quarter and complement the baseline analysis.
5.1. Visitor Robustness Specification
Table 6 presents the robustness checks for the visitor model. These checks compare extended ARDL lag specifications and AR(2)-error estimates. The additional lag specifications retain negative REER estimates, while the BG diagnostics identify residual serial correlation in the baseline and several expanded ARDL equations. The AR(2)-error specifications provide complementary estimates with favorable residual correlograms. The 38- and 36-observation lag-search samples are distinguished when comparing the estimates.
Table 6.
Visitor-model robustness comparison.
5.2. Total-Receipts Robustness Specification
Table 7 compares the robustness specifications for total real receipts. In the total-receipts ARDL(1,1,1) with a pulse, the pulse coefficient is 0.8549 (p = 0.0003), and one- and two-lag BG LM tests indicate residual serial correlation (p = 0.0249 and 0.0428). With lag orders fixed at (1,1,0), the pulse coefficient is 0.8096 (p = 0.0005), with BG LM p-values below 0.05 (0.0184 and 0.0475). The no-pulse ARDL(1,1,0) baseline has BG LM p-values of 0.3122 and 0.1540. Excluding 2021Q3–2021Q4 preserves a negative calculated REER multiplier (approximately −0.456), but the resulting BG LM p-values of 0.0010 and 0.0011 indicate residual serial correlation in this sensitivity exercise. The exclusion estimates are used to evaluate sensitivity.
Table 7.
Total-real-receipts robustness comparison.
5.3. Receipts-per-Visit Robustness Specification
Table 8 compares the stationary specifications for real receipts per visit. The stationary receipts-per-visit specification includes its lagged log level and first differences of log REER and log OECD GDP. The Δln(REER) coefficient declines from 1.1362 (p = 0.0635) without the pulse to 0.7361 (p = 0.1120) with the pulse and 0.3218 (p = 0.2873) with the pulse and AR(1) errors. The corresponding AR(1)-error pulse coefficient is 0.8443 (p = 0.0008). The positive REER association varies in precision across these parsimonious specifications, each with p > 0.05. The OLS no-pulse and pulse comparisons use the same lag structure, controls, and 40 observations. Adjusted R2 increases from 0.0940 to 0.4907 when only the pulse is added. For the earlier levels equation, the independent replication holds ARDL(1,1,0) fixed and finds adjusted R2 rising from 0.196 to approximately 0.718, compared with 0.726 after also changing the lag order to (1,0,0). Thus, the exceptional observation accounts for most of the earlier improvement in fit. The levels-model comparison is retained as an influence check, while the stationary specifications provide the basis for statistical inference on the REER association.
Table 8.
Receipts-per-visit robustness comparison.
5.4. Model Equations for Sensitivity Analysis
To distinguish the stationary receipts-per-visit dynamics from level-based specifications, the three robustness-model forms are distinguished below. The visitor AR(2)-error model is a maximum-likelihood sensitivity specification; the total-receipts pulse form is ARDL(1,1,1); and the receipts-per-visit model uses first differences of both I(1) regressors with AR(1) errors. Bounds testing is reserved for the corresponding ARDL specifications rather than the AR-error sensitivity models.
For compact presentation, Vt = ln(VISITORSt), Yt = ln(REAL INCOMEt), Pt = ln(INCOME PER VISITORt), Rt = ln(REERt), and Gt = ln(OECD GDPt). Q1 is the omitted seasonal reference category, and εjt denotes the disturbance term in equation j.
Visitor AR(2)-error sensitivity with 2021Q3 pulse
Vt = αᵥ + φᵥ1Vt−1 + φᵥ2Vt−2 + βᵥRt + γᵥGt
+ δᵥCOVIDt + Σ(q=2,3,4) θᵥqQq,t + λᵥPULSEt + uᵥ,t
uᵥ,t = ρᵥ1uᵥ,t−1 + ρᵥ2uᵥ,t−2 + εᵥ,t
Total real receipts: ARDL(1,1,1) with 2021Q3 pulse
Real receipts per visit: stationary specification with AR(1) errors
Pt = αp + 0.019197 Pt−1 + 0.321772 ΔRt − 1.058406 ΔGt
+ 0.151033 COVIDt + 0.005713 Q2,t + 0.070503 Q3,t
− 0.020674 Q4,t + 0.844306 PULSEt + up,t
up,t = 0.607651 up,t−1 + εp,t
The intercept αp is approximately 7.7160 when receipts per visit are expressed in constant 2024 US dollars.
5.5. Residual Diagnostic Tests and Model Adequacy
Table 9 reports diagnostics for all three baseline equations; the stationary receipts-per-visit baseline is distinguished from the pulse and AR-error sensitivity fits. The visitor two-lag BG test reports F(2,30) = 6.6308 (p = 0.0041) and LM χ2(2) = 12.2618 (p = 0.0022). For total receipts, the corresponding statistics are F(2,29) = 1.4966 (p = 0.2407) and LM χ2(2) = 3.7422 (p = 0.1540). For stationary receipts per visit, they are F(2,30) = 0.0270 (p = 0.9734) and LM χ2(2) = 0.0719 (p = 0.9647). Each auxiliary regression uses 40 observations. The receipts-per-visit pulse model with AR(1) errors is assessed separately: Jarque–Bera p = 0.4841 and ARCH-LM(2) p = 0.5688, with 36 observations in the ARCH auxiliary regression. For the stationary no-pulse receipts-per-visit model, the Koenker–Breusch–Pagan LM p-value is 0.6770, while the Jarque–Bera statistic indicates non-normal residuals (JB = 34.2490, p < 0.0001). A complementary HC3 covariance estimate yields Δln(REER) p = 0.1764 and a 95% interval [−0.5378, 2.8101], illustrating the sensitivity of the conventional 10% finding to the uncertainty estimator.
Table 9.
Baseline residual diagnostics by specification.
5.6. Stability of the Pulse Specifications
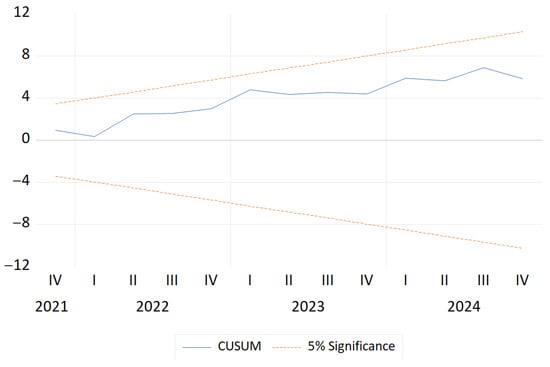
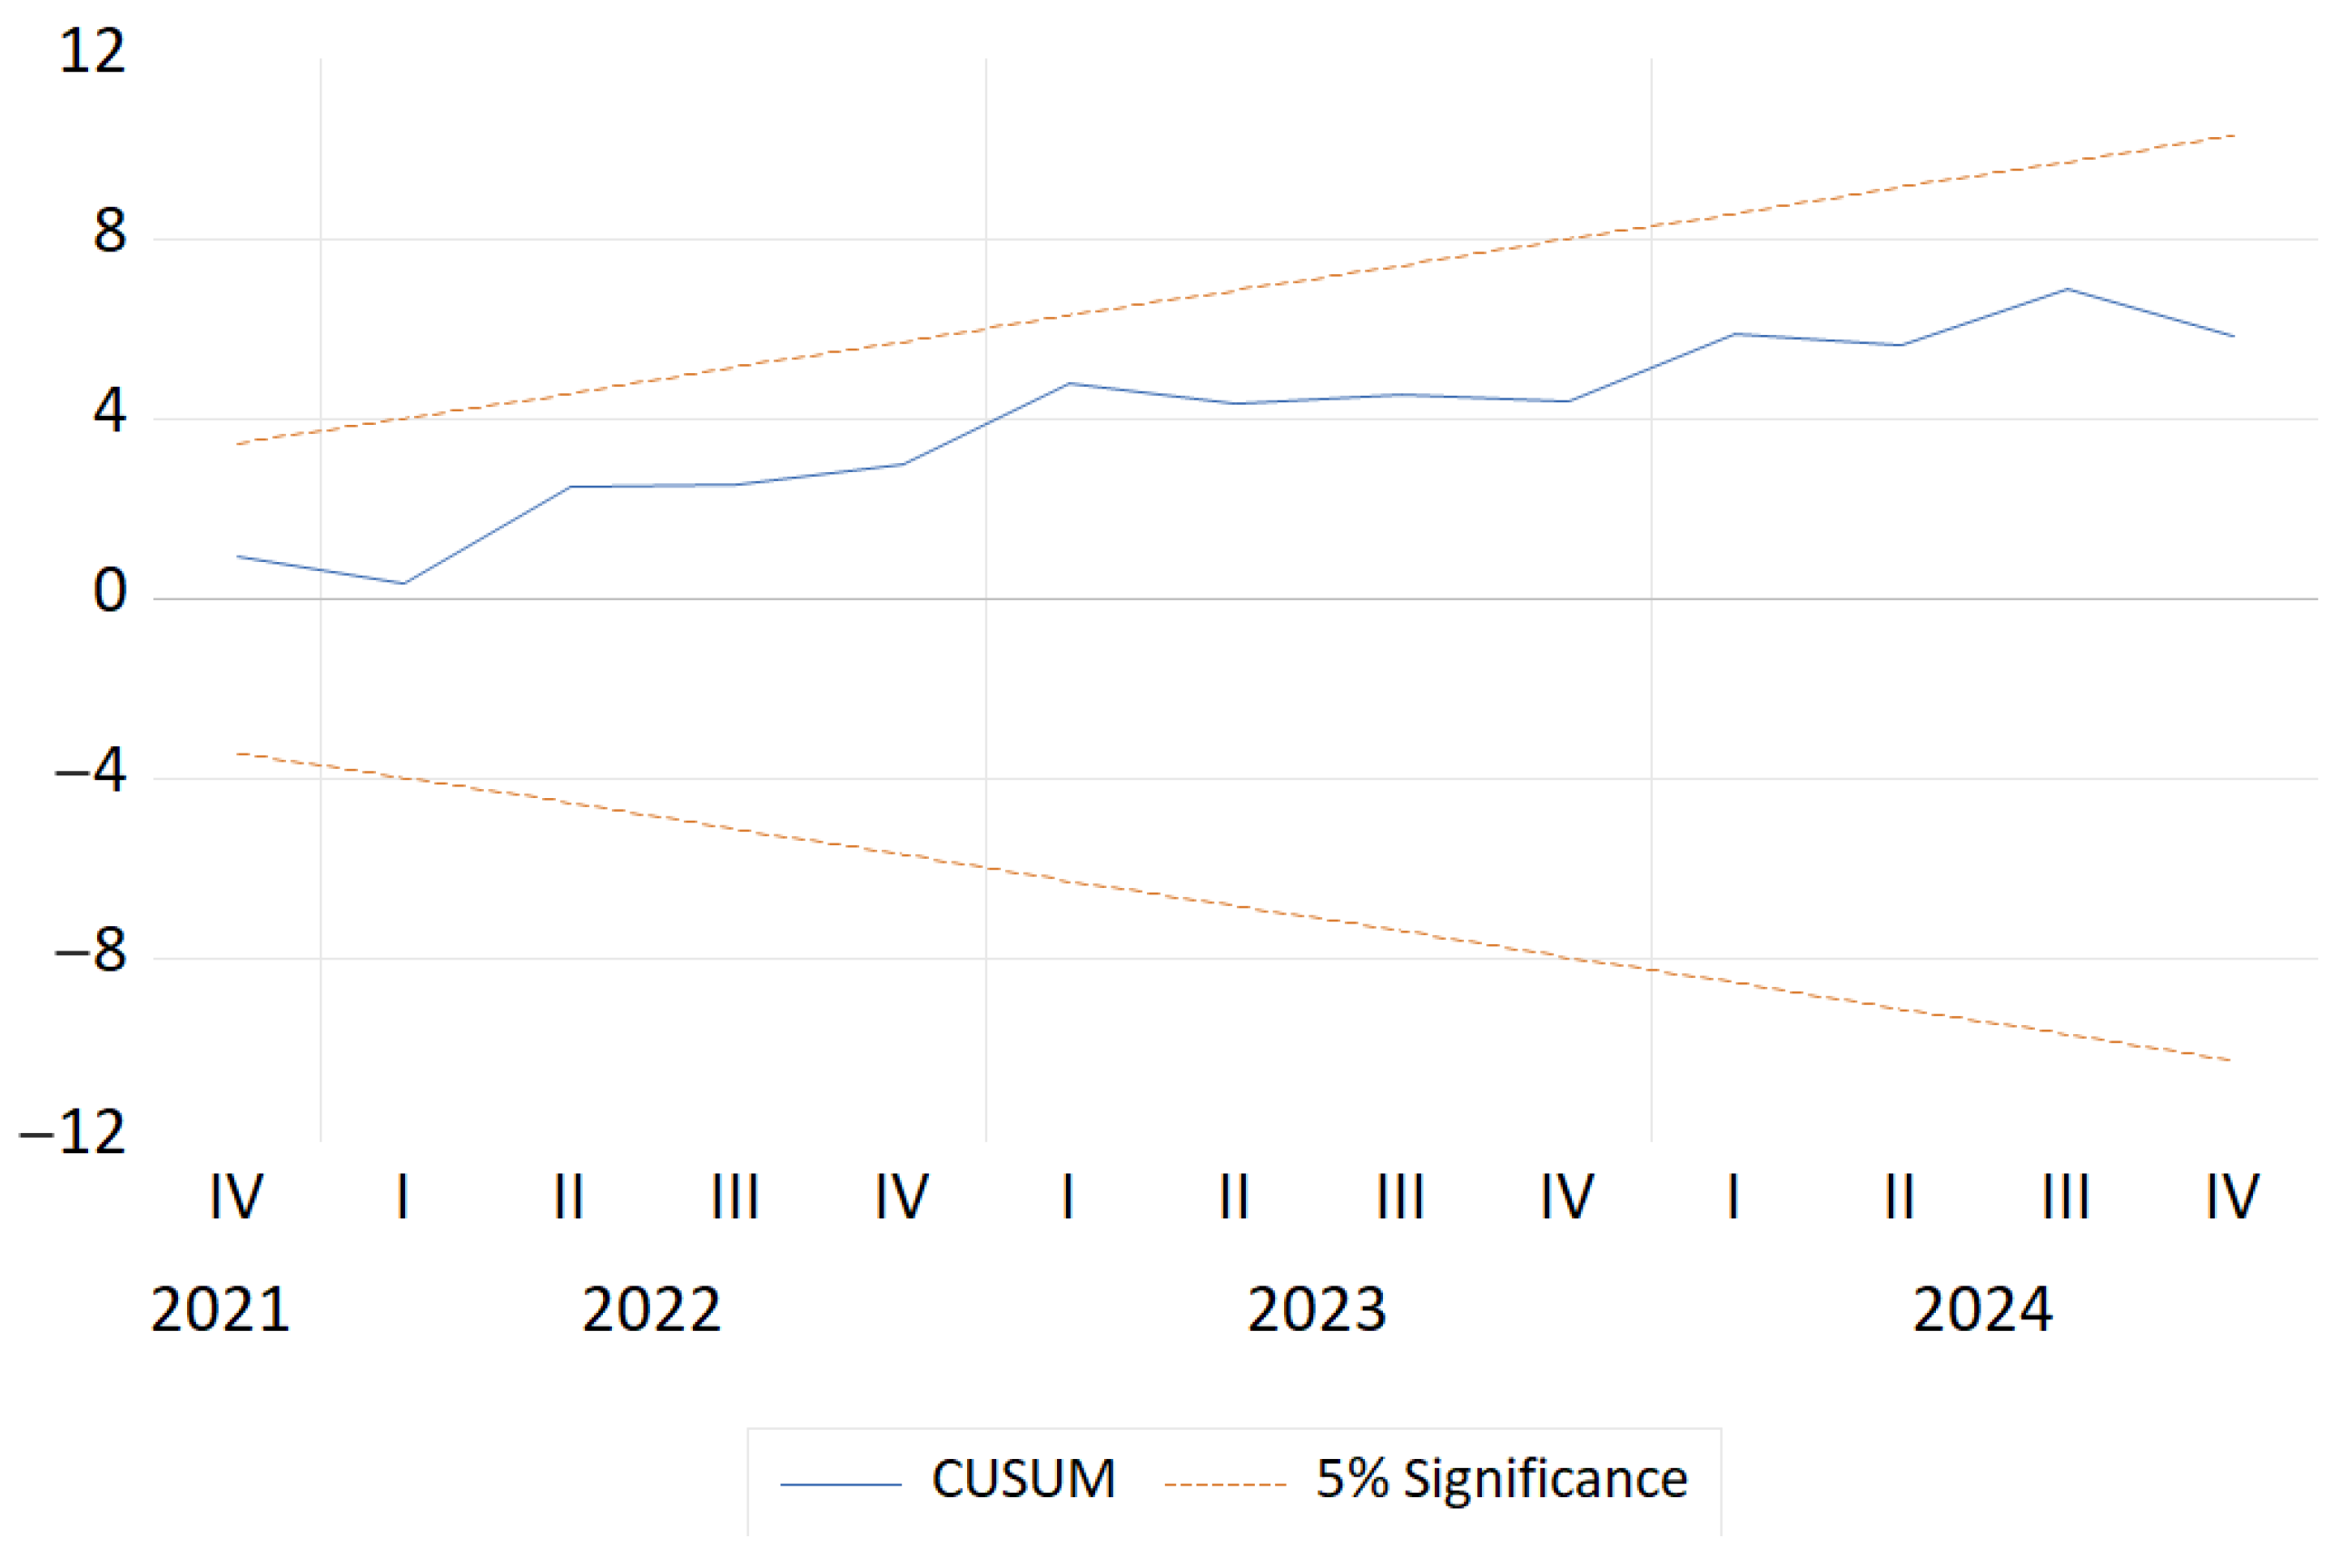
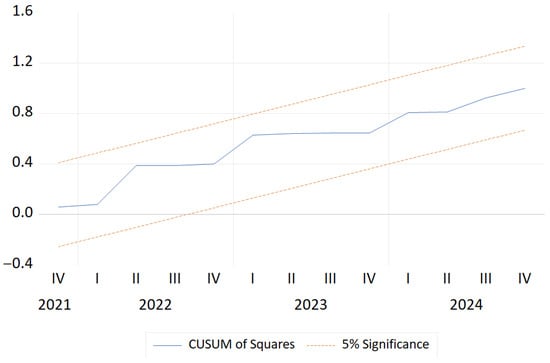
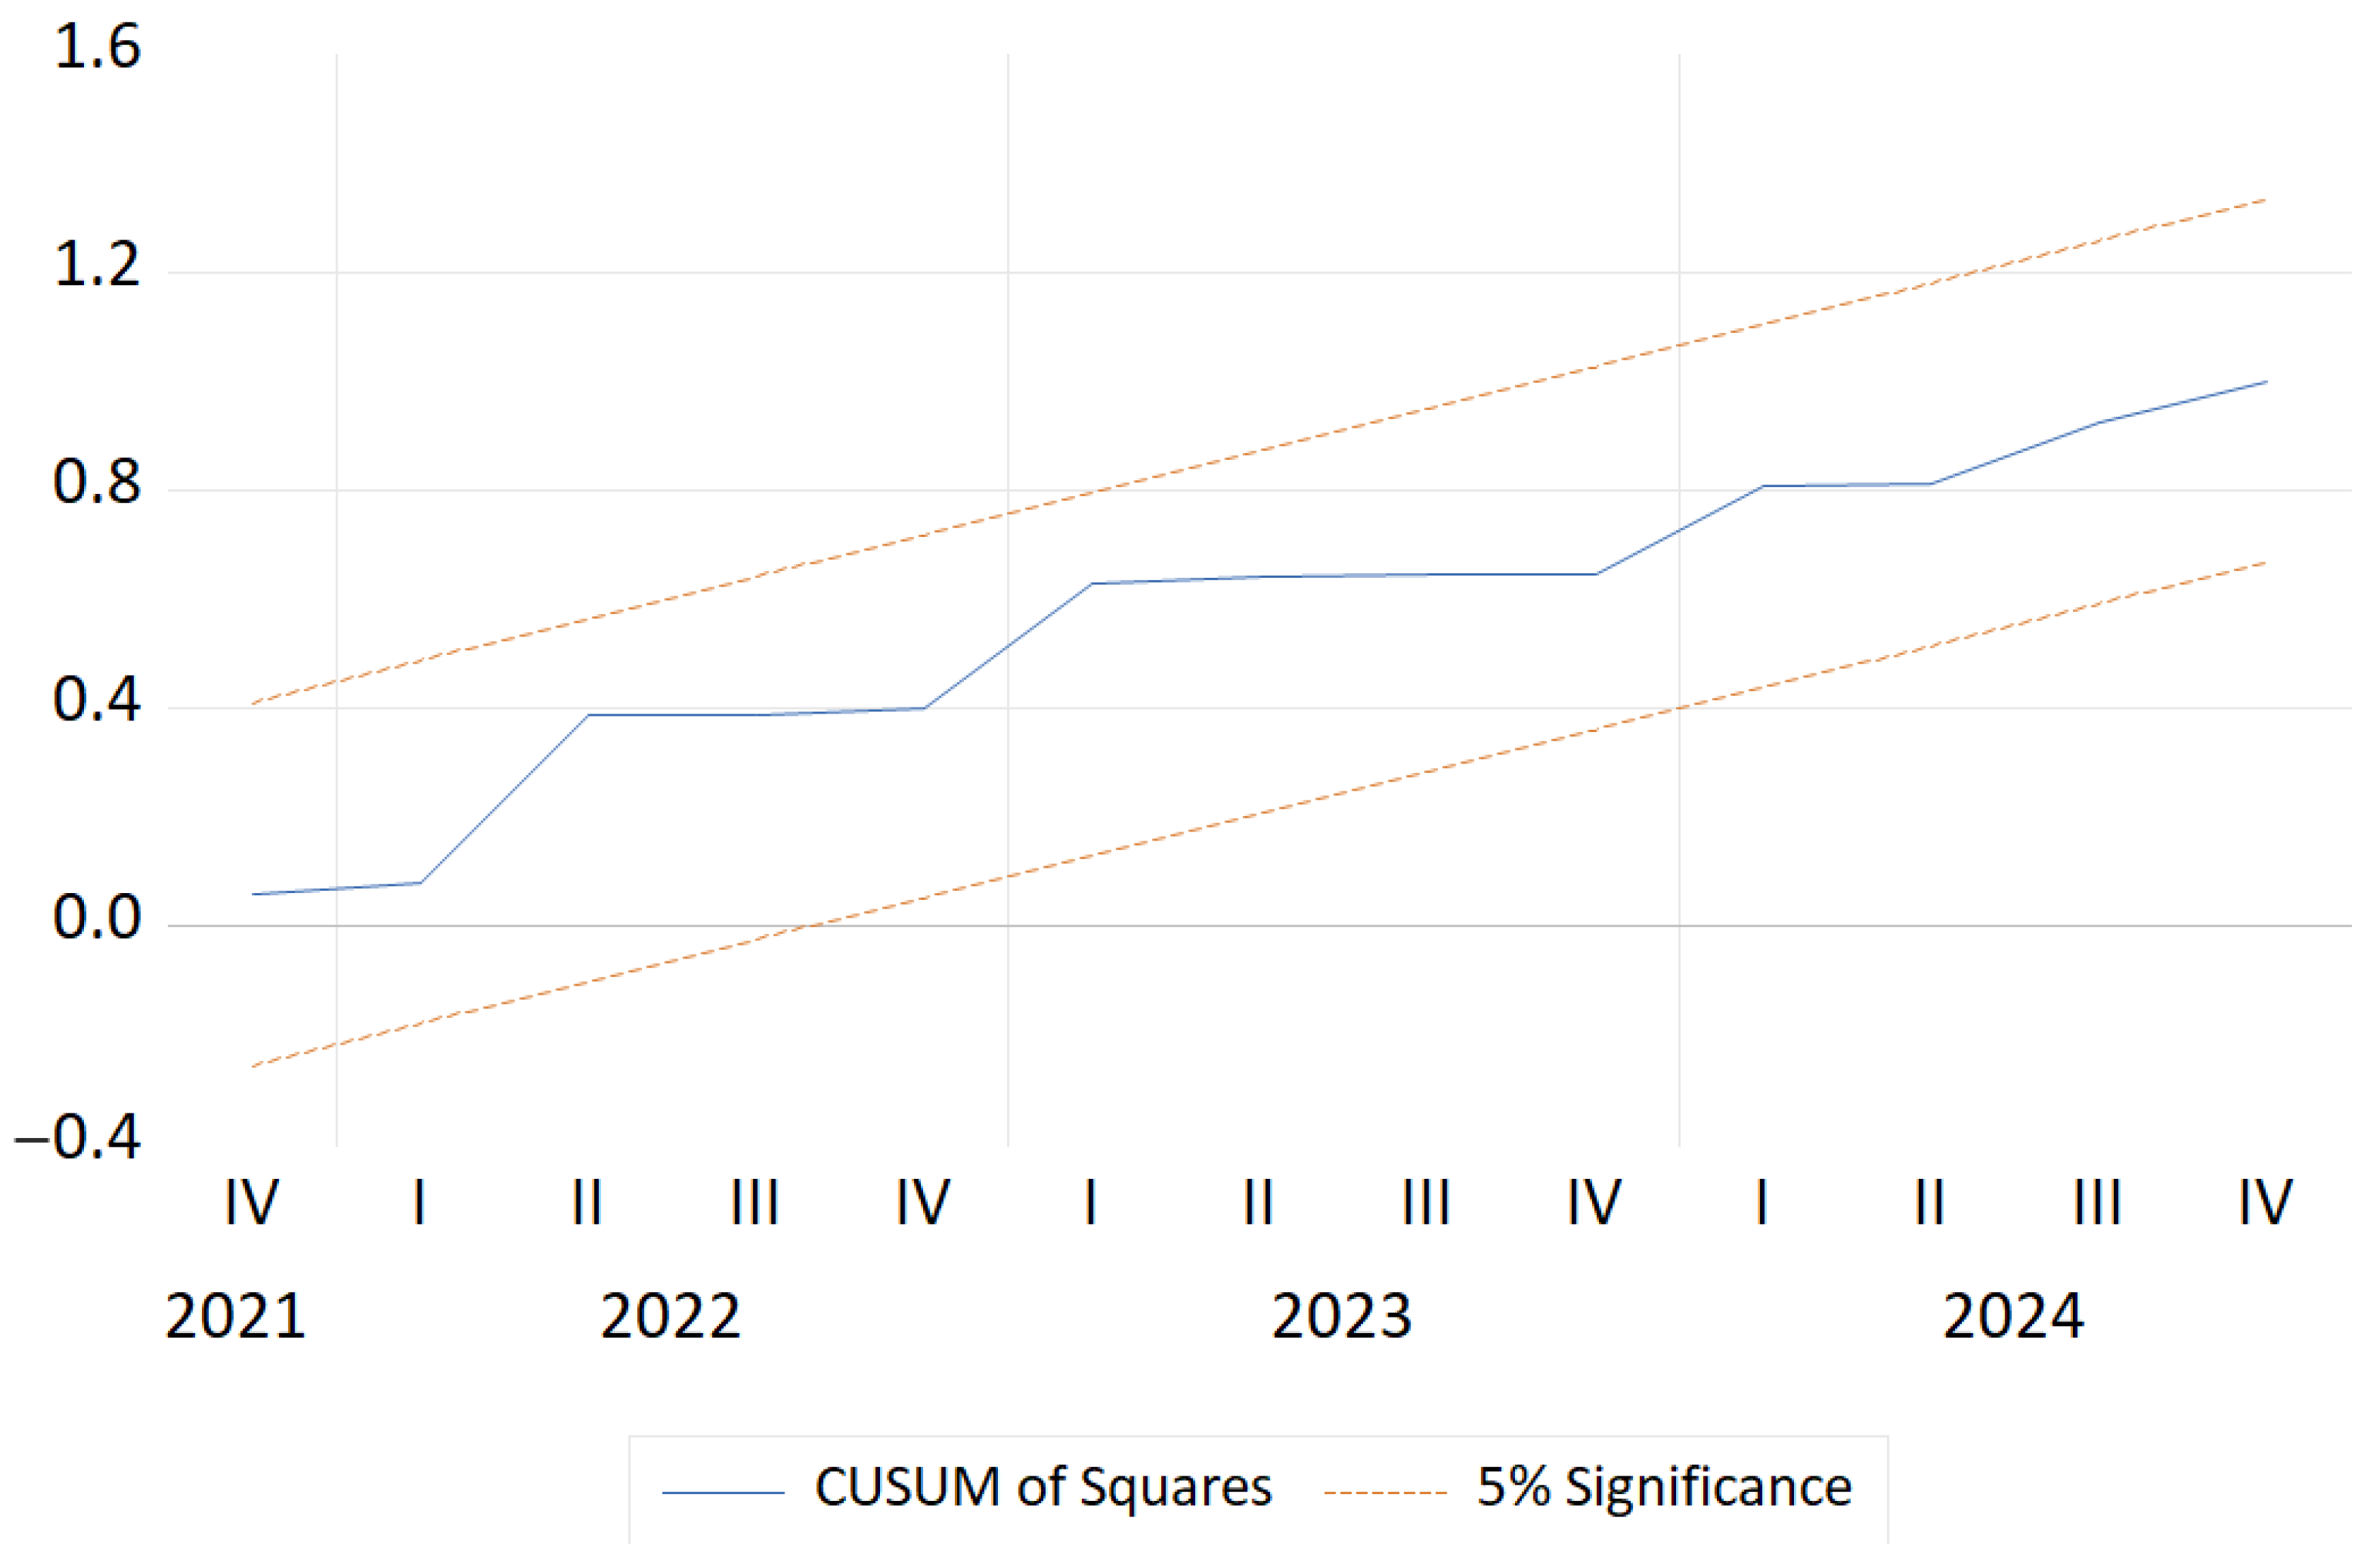
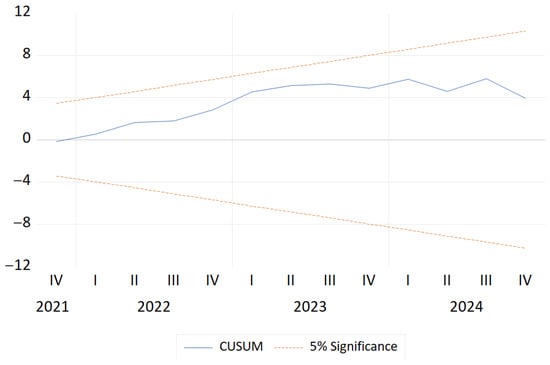
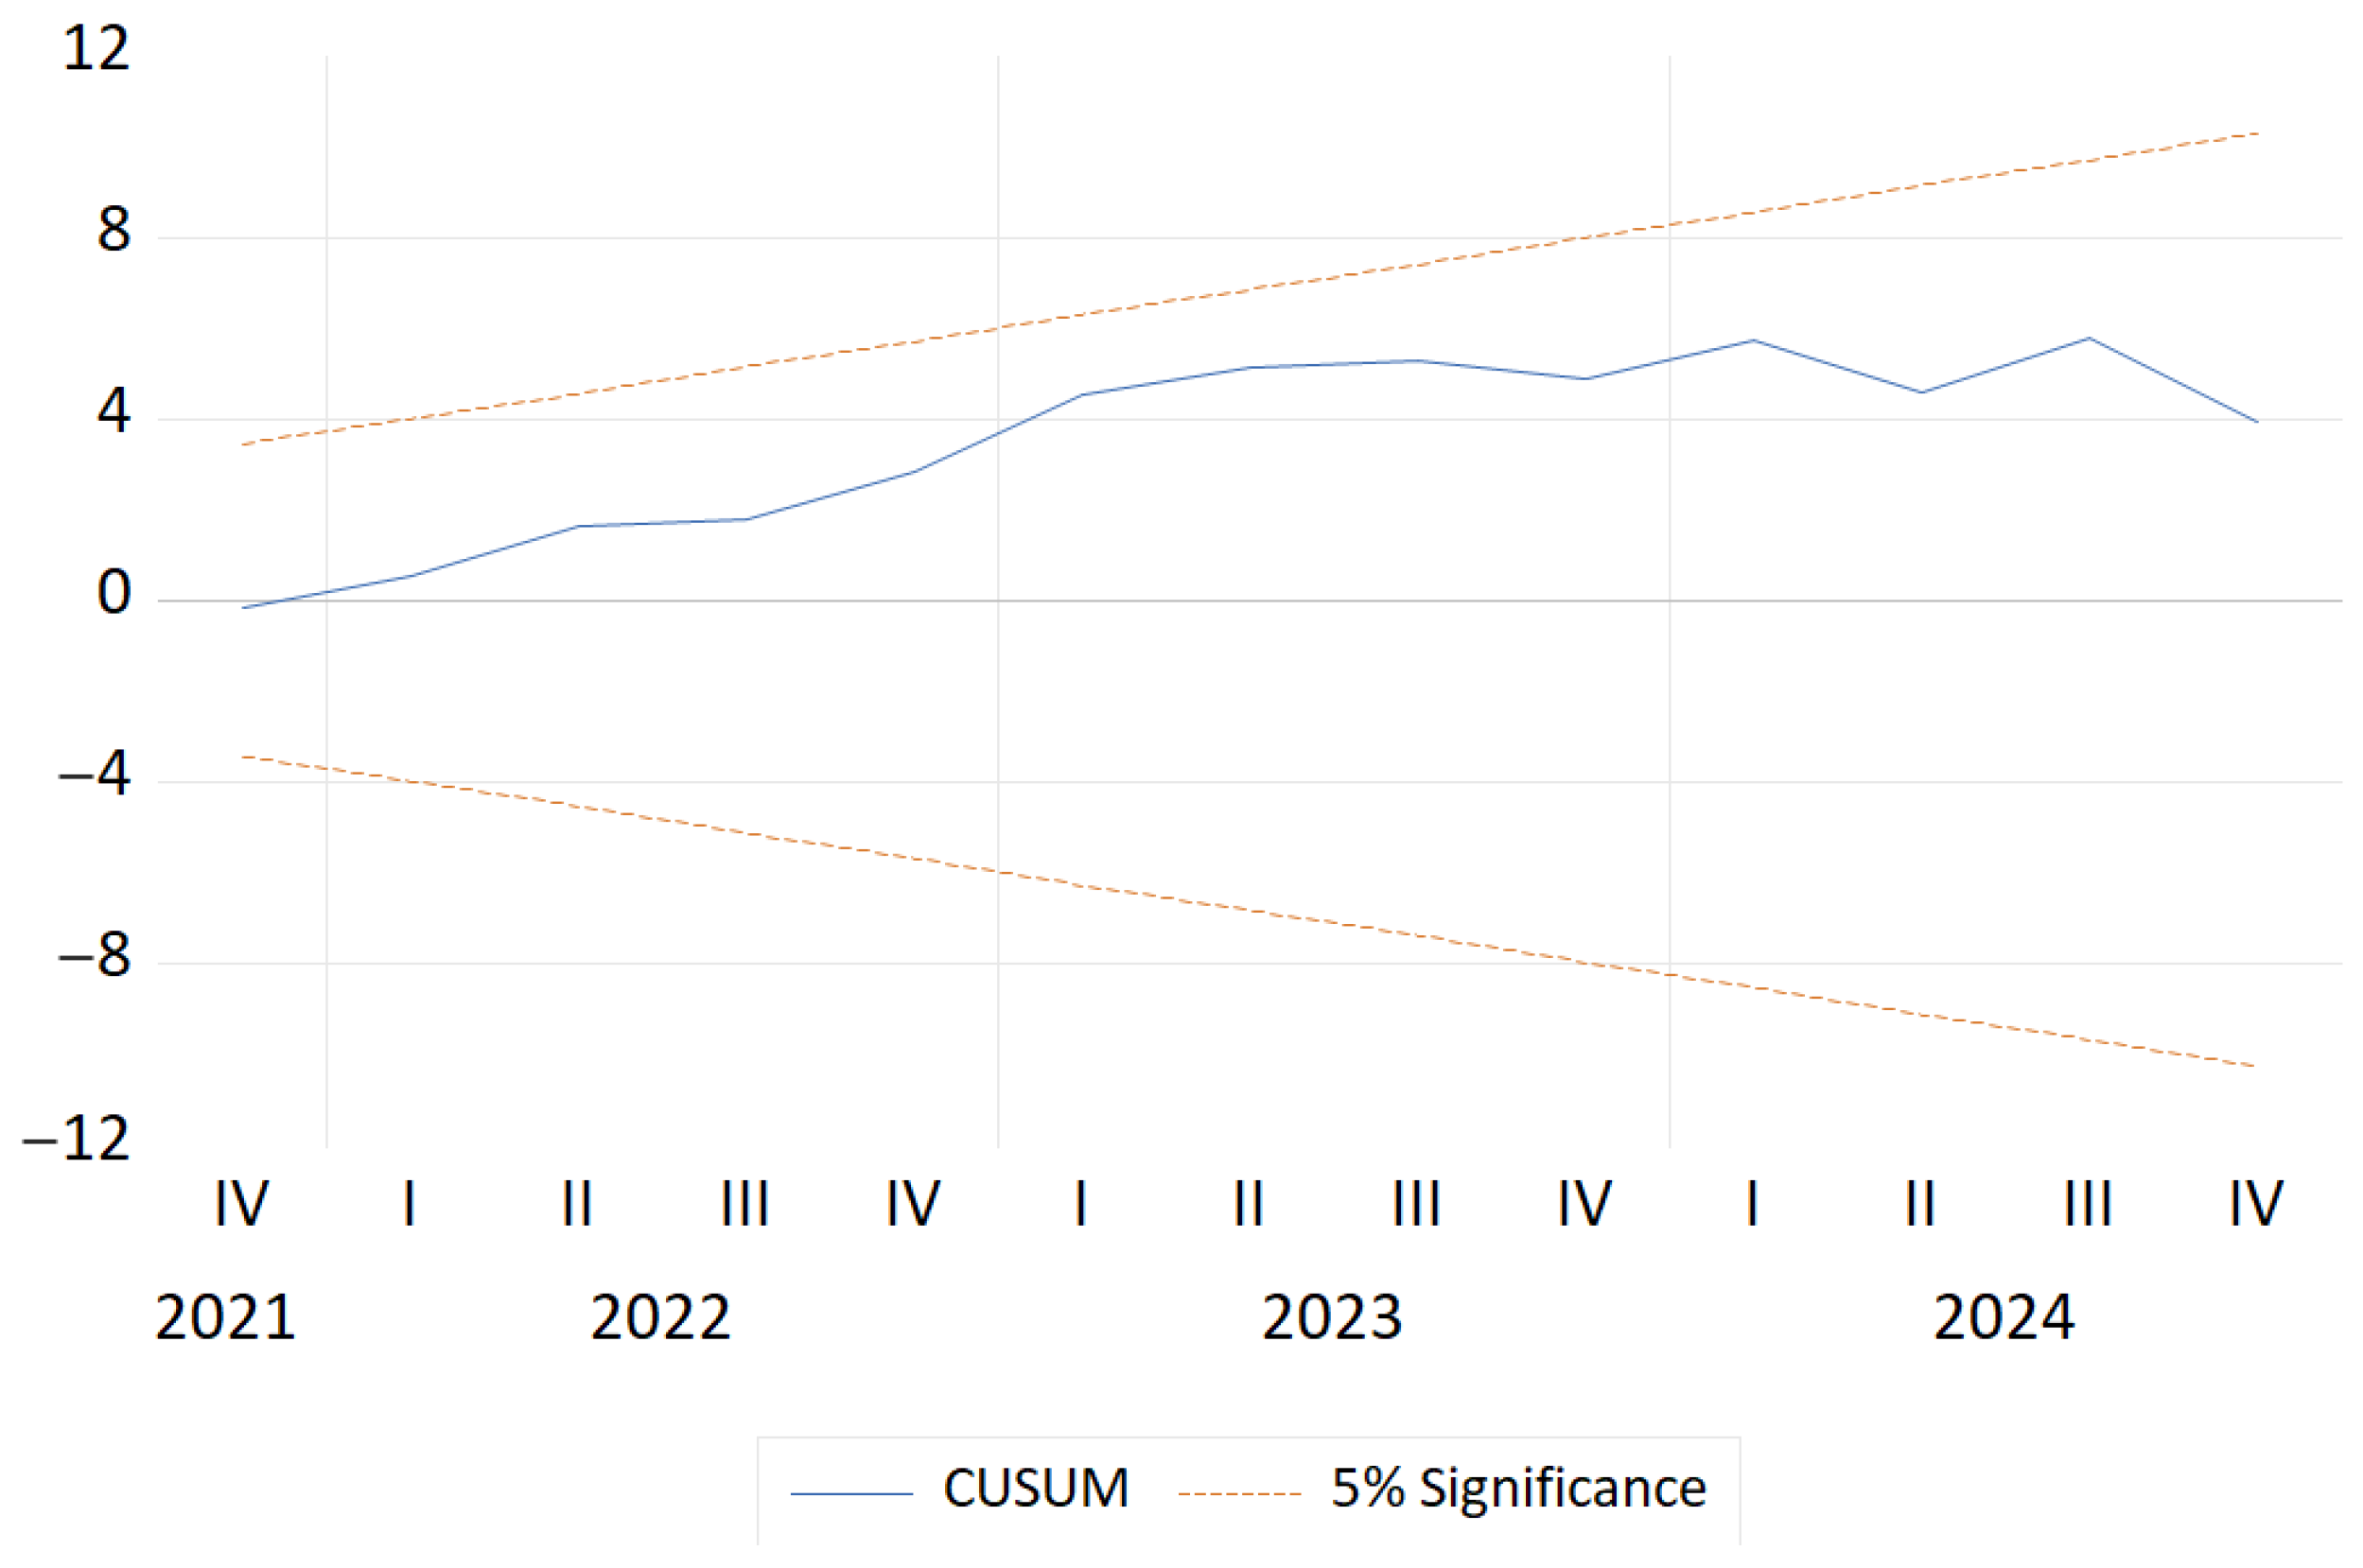
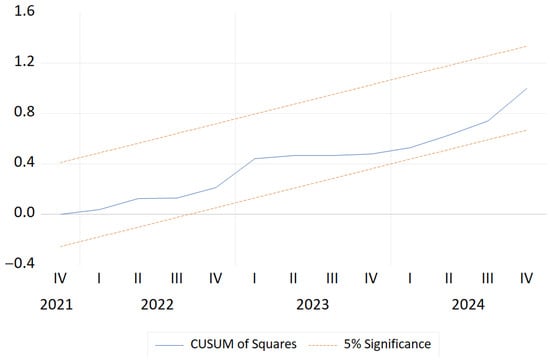
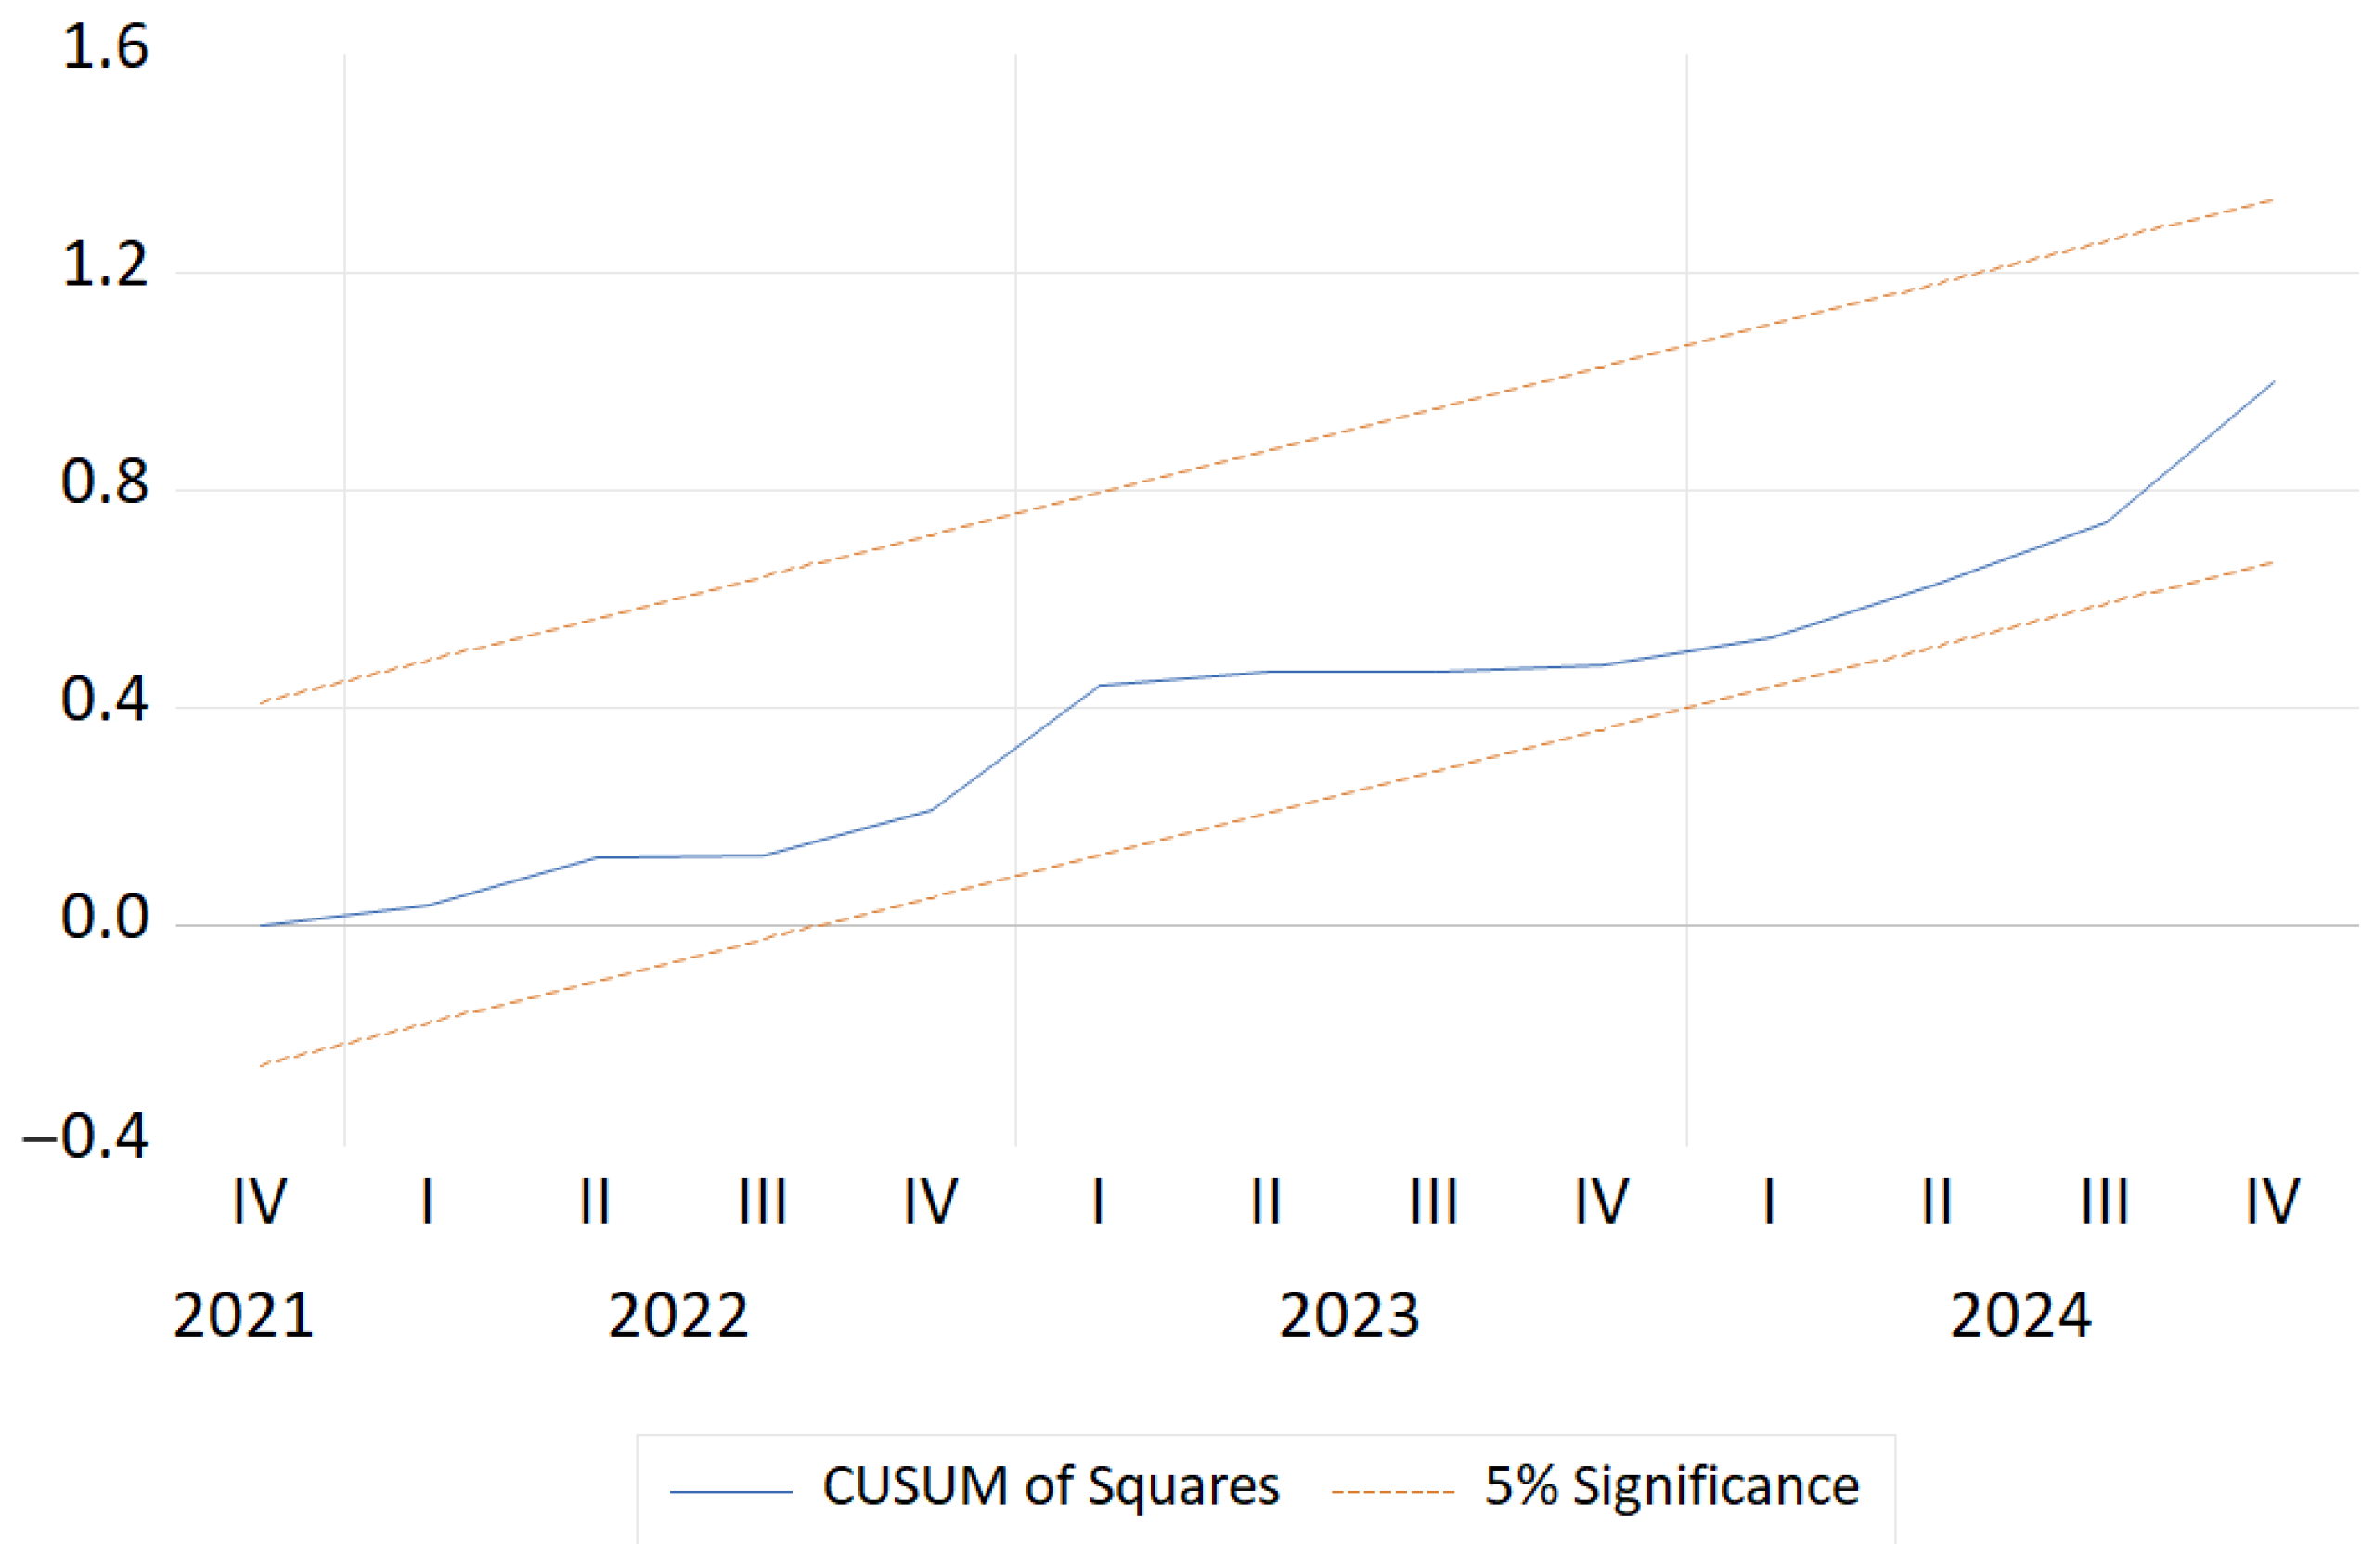
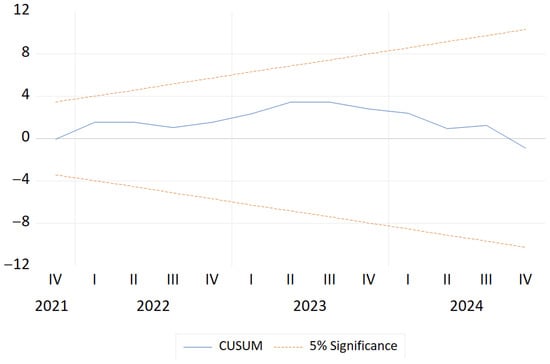
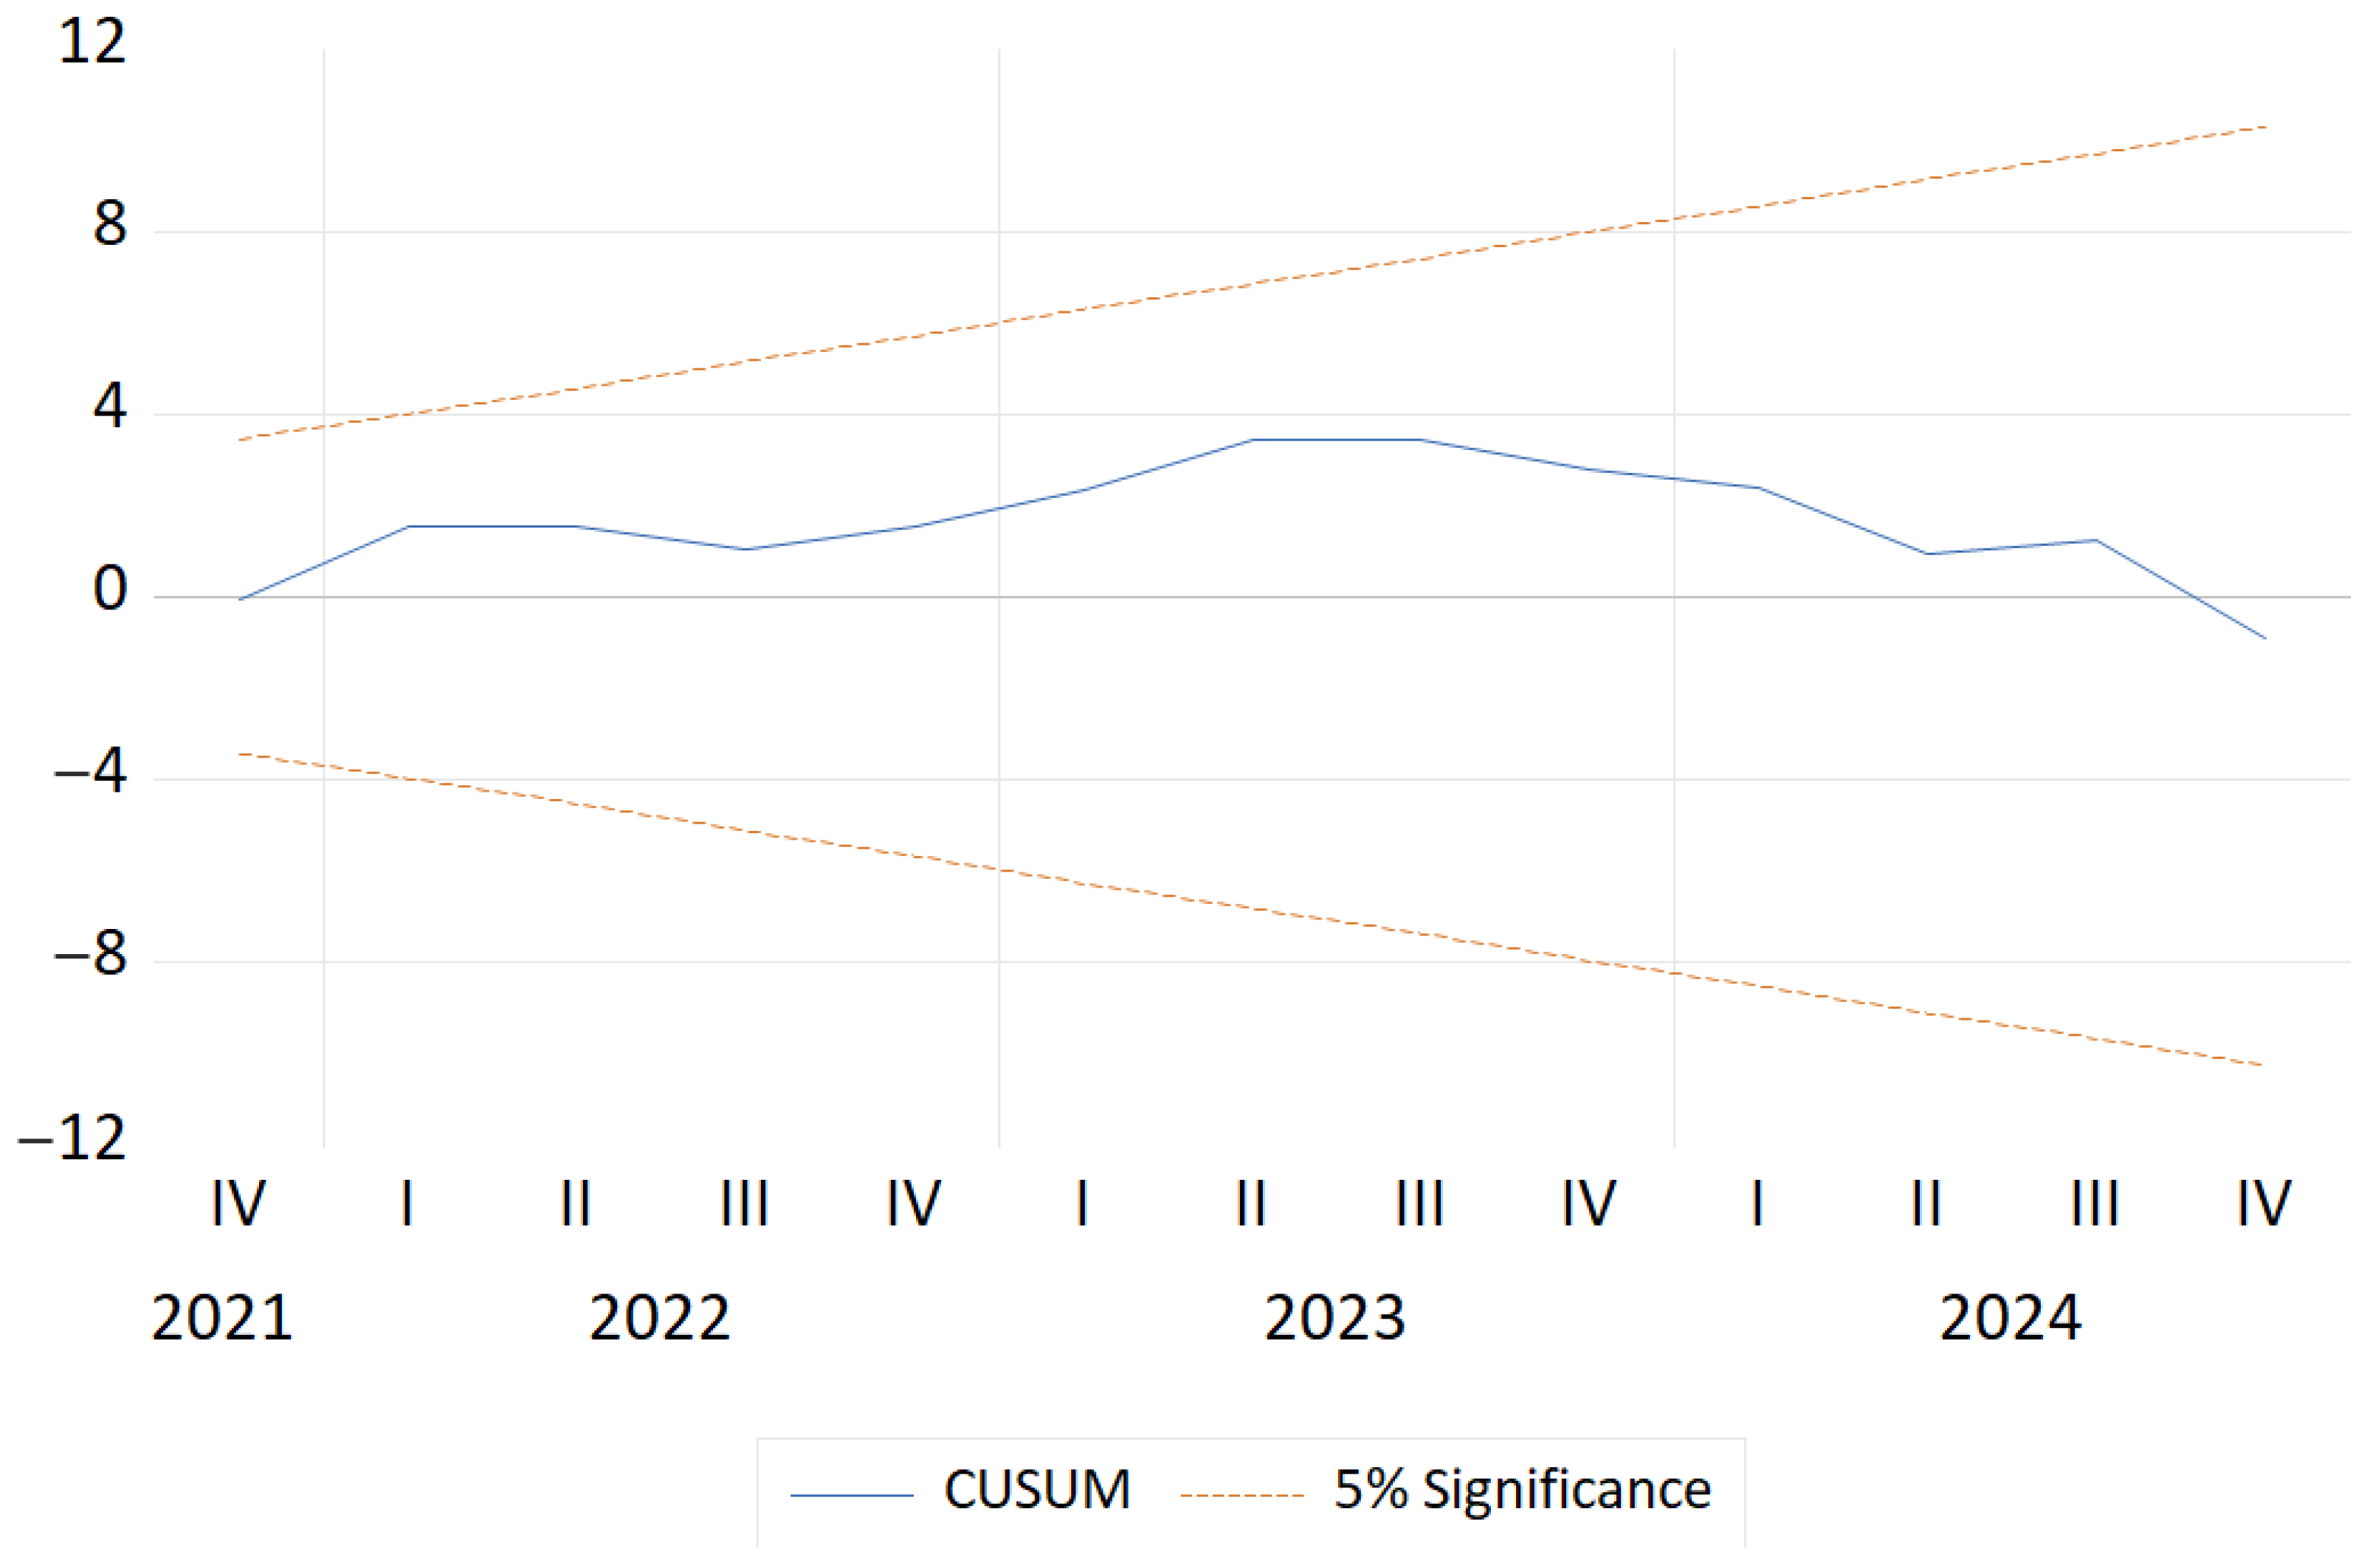
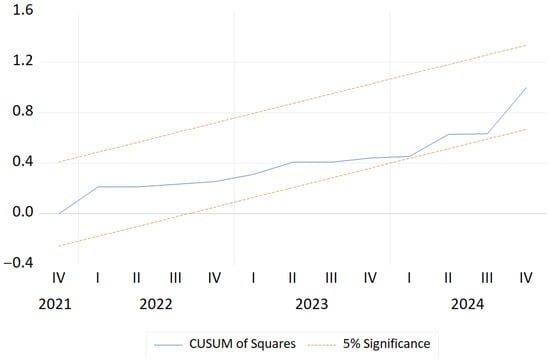
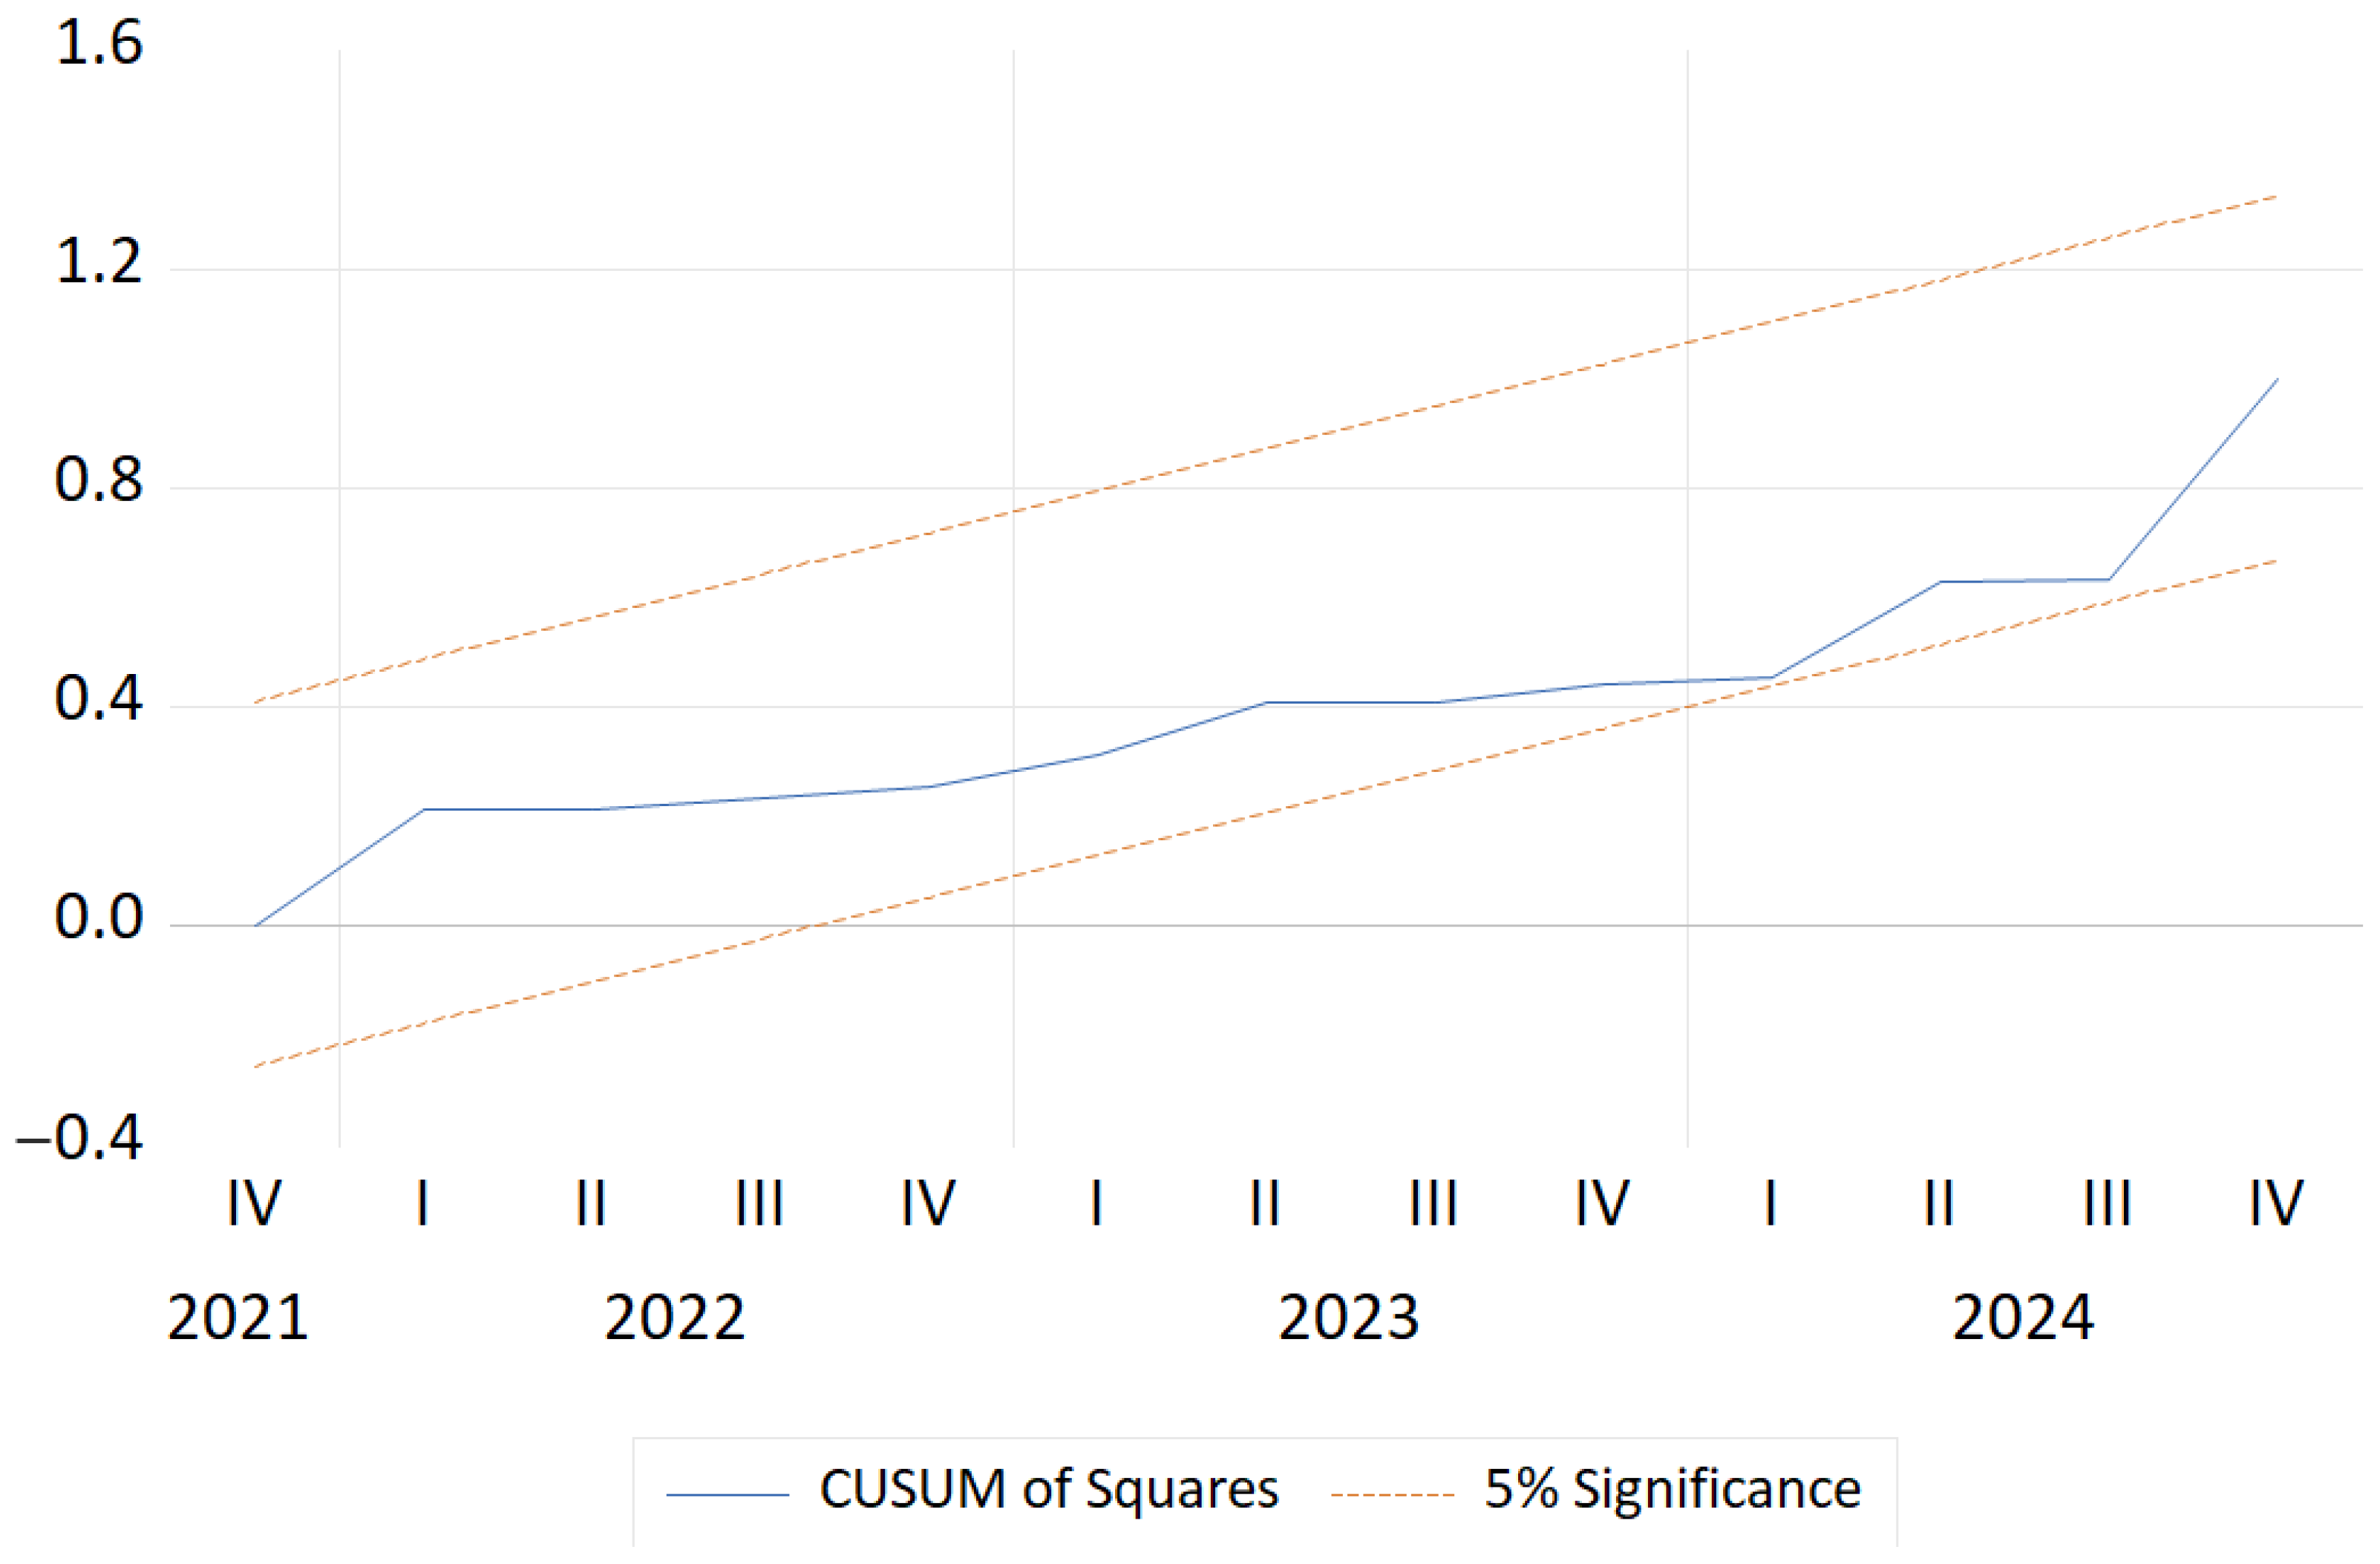
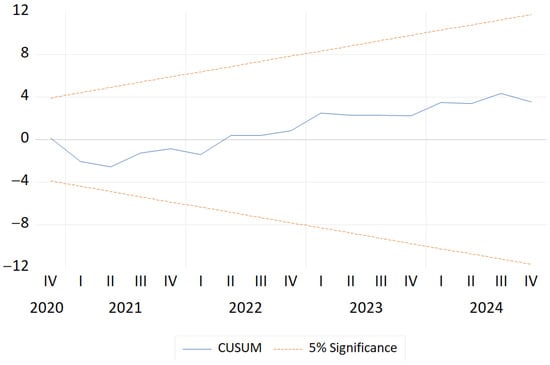
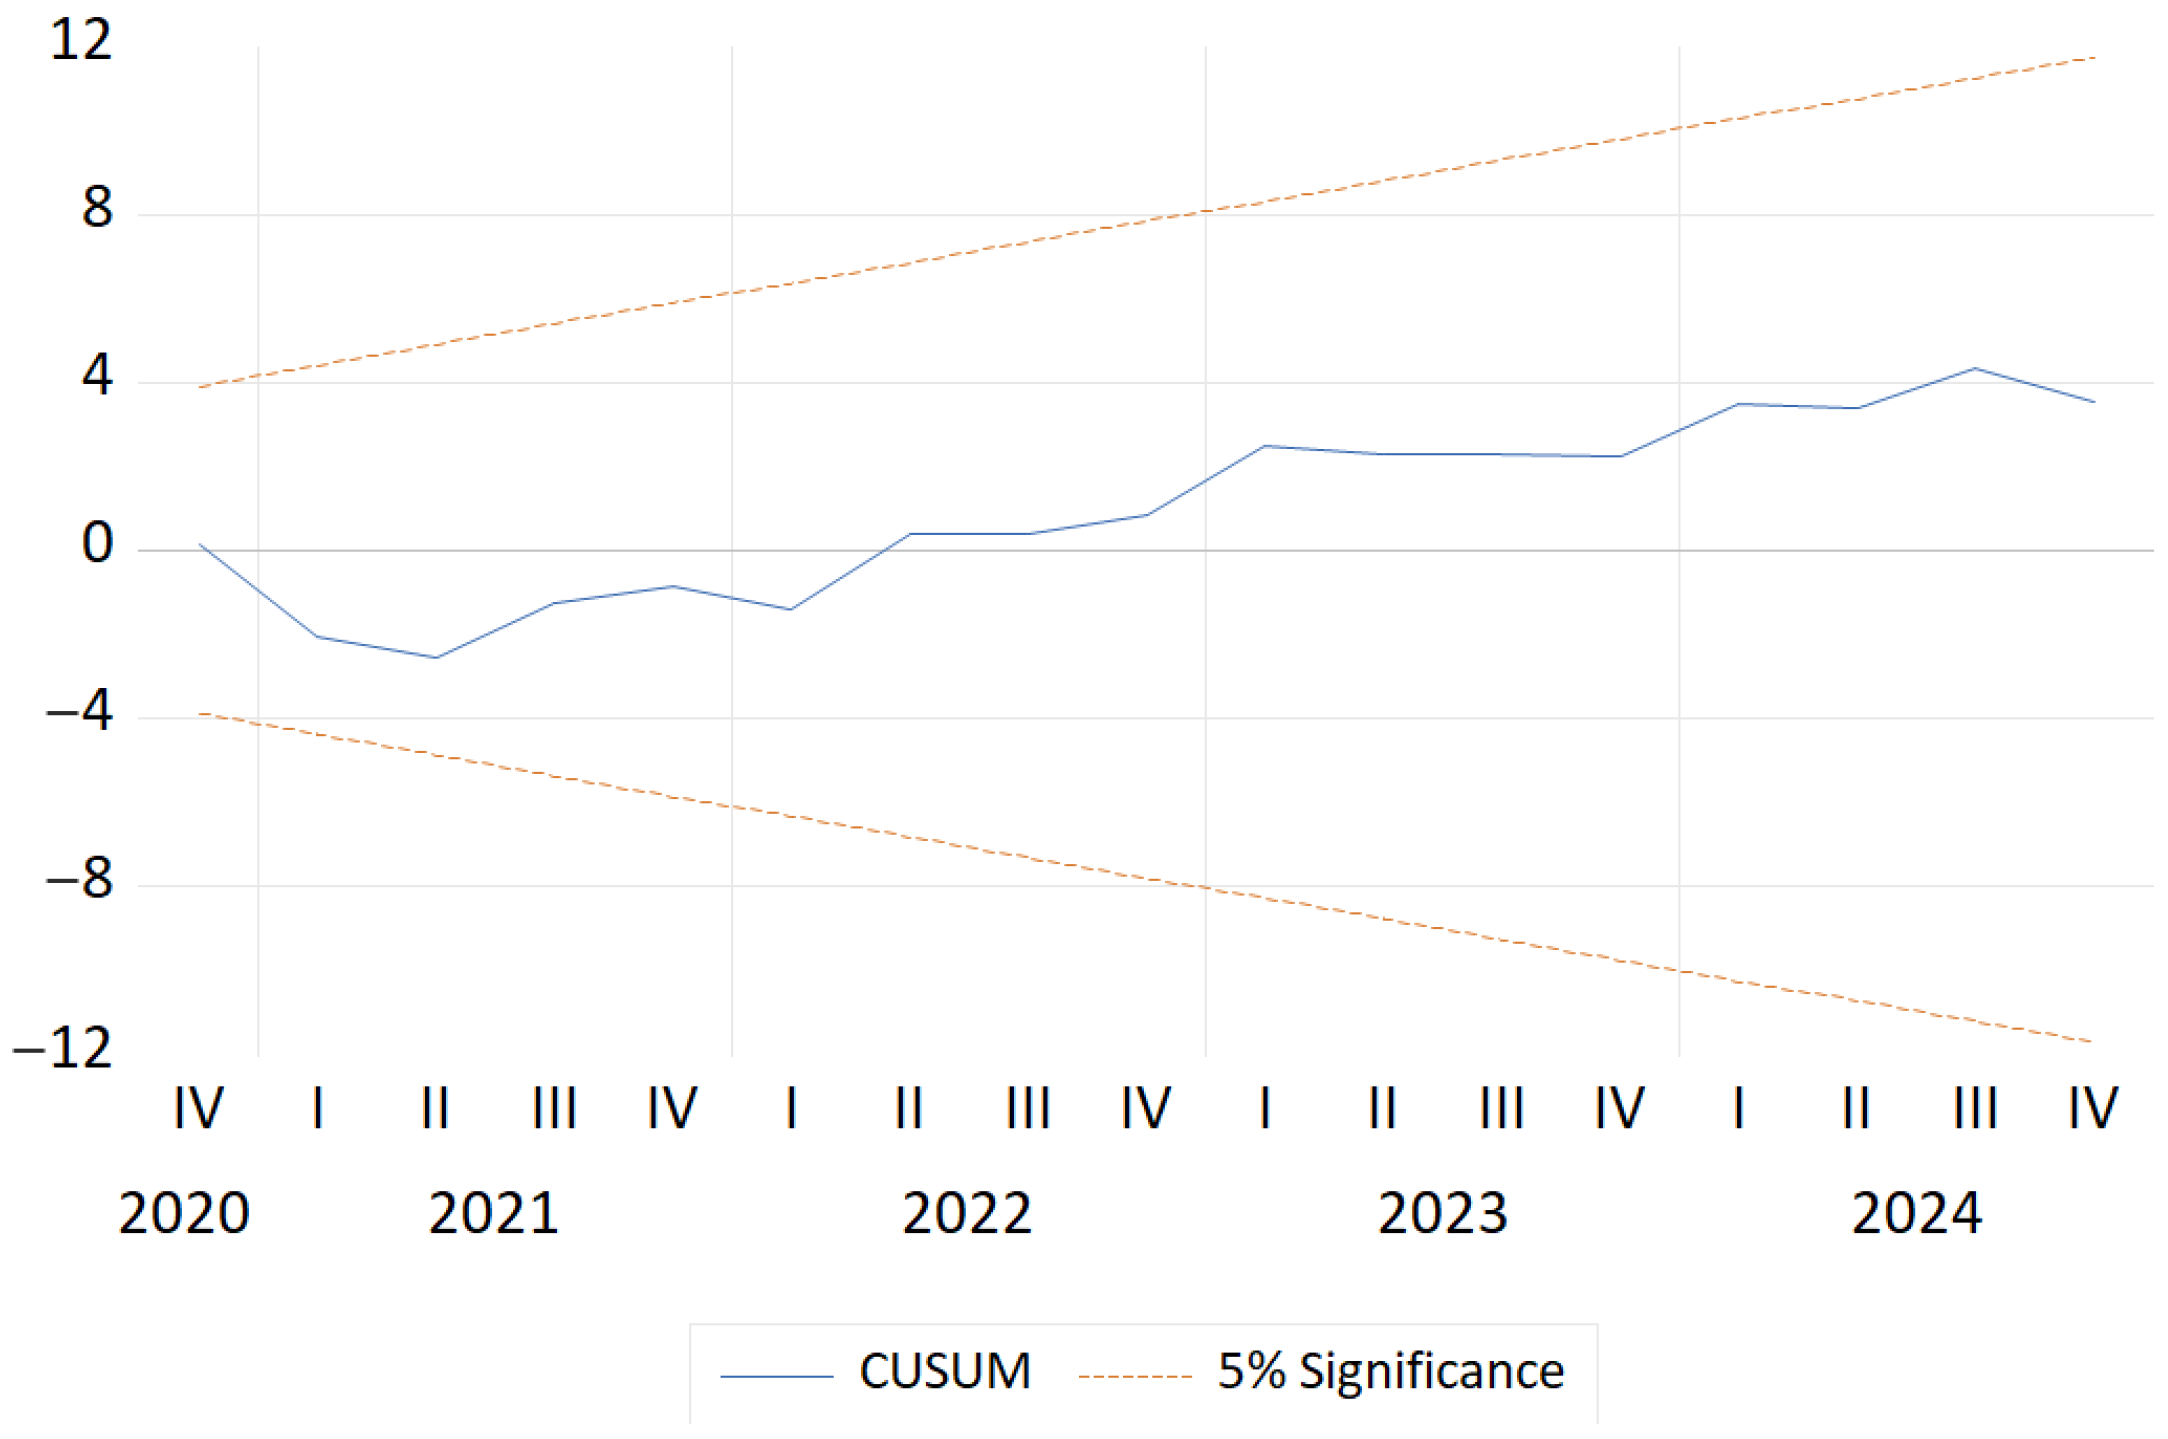
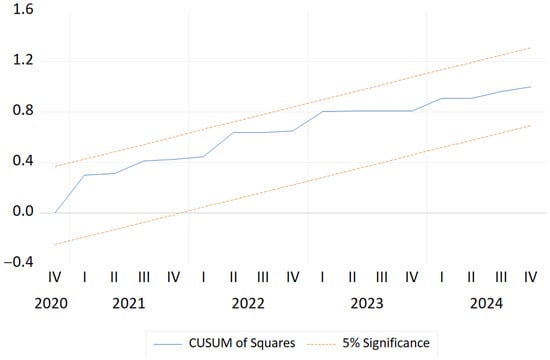
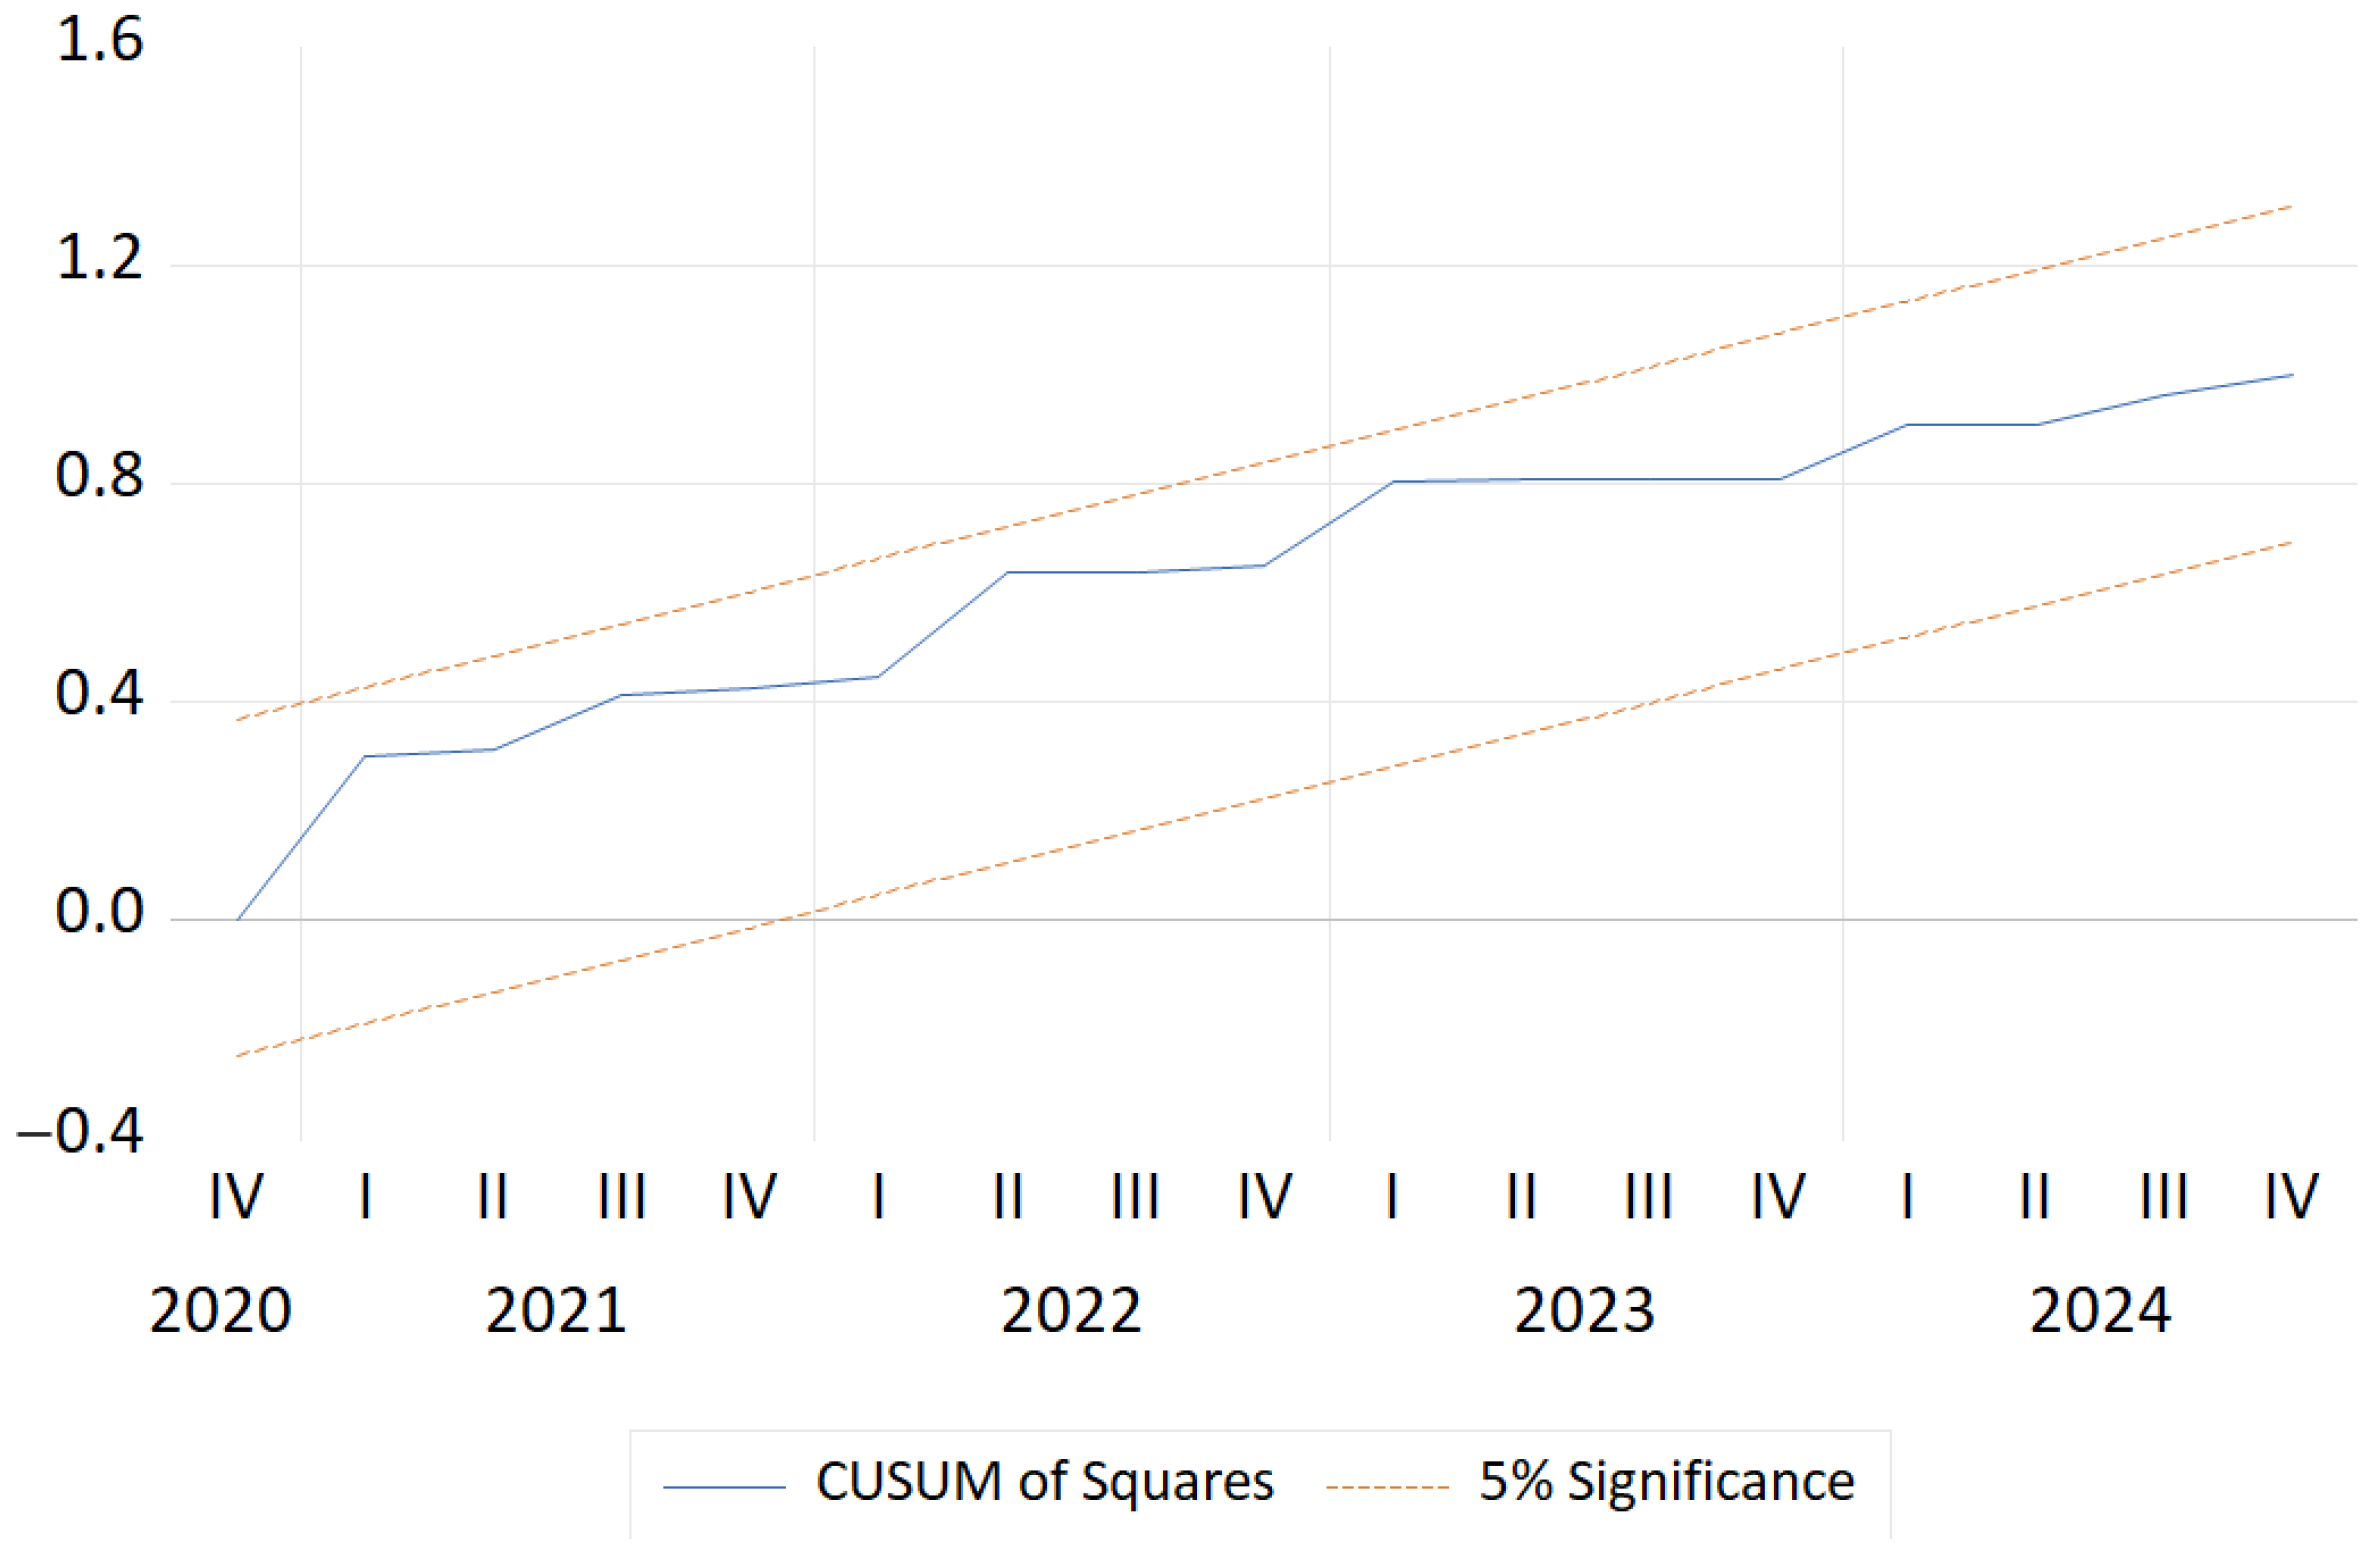
CUSUM and CUSUM-of-squares tests assess parameter stability using recursive residuals [46]. Figure 2, Figure 3, Figure 4, Figure 5, Figure 6 and Figure 7 refer to the pulse-level specifications and do not assess the stationary receipts-per-visit or AR(2)-error visitor alternatives. These stability checks are interpreted alongside residual diagnostics. The corresponding stability evidence pertains to the recursive estimation periods and specifications displayed in each figure.
Figure 2.
CUSUM for the visitor pulse specification.
Figure 3.
CUSUM of squares for the visitor pulse specification.
Figure 4.
CUSUM for the total-real-receipts pulse specification.
Figure 5.
CUSUM of squares for the total-real-receipts pulse specification.
Figure 6.
CUSUM for the receipts-per-visit pulse specification.
Figure 7.
CUSUM of squares for the receipts-per-visit pulse specification.
5.7. Baseline Visitor Diagnostics and Stability
The visitor ARDL(1,0,0) benchmark uses 40 observations, with calendar lags preserving the missing 2020Q2 outcome. BG diagnostics indicate residual serial correlation: the one-lag LM p-value is 0.0314, and the two-lag LM p-value is 0.0022 (Table 10). At two lags, the F-test also rejects (F(2,30), p = 0.0041). The visitor bounds statistics are therefore interpreted together with the model-specific residual diagnostics.
Table 10.
Diagnostic tests for the baseline visitor equation.
Figure 8 and Figure 9 present the CUSUM and CUSUM-of-squares plots for the visitor ARDL(1,0,0) baseline. They assess parameter stability in this specification rather than in the expanded-lag or AR(2)-error alternatives and are interpreted together with the BG diagnostics reported in Table 10. The graphical assessment pertains to the displayed recursive periods.
Figure 8.
CUSUM for the visitor baseline without D2021Q3 (5% boundaries).
Figure 9.
CUSUM of squares for the visitor baseline without D2021Q3 (5% boundaries).
5.8. Consolidated Robustness Summary
Table 11 consolidates the receipts-per-visit and visitor robustness estimates and distinguishes the parsimonious main specifications from the wider-lag exploratory specifications. The wider-lag receipts-per-visit models use two lags of the outcome and lags 0–2 of the differenced regressors. Table 8 presents the one-lag specifications estimated using 40 observations. The first six rows of Table 11 report the coefficient on Δln(REER) for real receipts per visit. The final row reports the coefficient on contemporaneous ln(REER) for health-purpose visits.
Table 11.
Consolidated robustness comparison for the REER coefficient.
As shown in Table 11, the parsimonious stationary specifications yield positive coefficients on Δln(REER), with all p-values above 0.05. In the exploratory specifications with wider lags, the coefficient is 1.7159 (p = 0.0088) without the pulse and 1.0581 (p = 0.0420) with the pulse. The RESET test rejects the no-pulse specification at the 5% level (p = 0.0037), and the two-lag Breusch–Godfrey LM test for the pulse specification gives p = 0.0593. After excluding 2021Q3 and the following two quarters, the coefficient remains positive at 0.9864 (p = 0.0750). The estimated association is positive across these specifications, with statistical significance at the 5% level varying by lag structure and treatment of the 2021Q3 observation.
For health-purpose visits, the one- and two-lag Breusch–Godfrey LM tests for the ARDL(1,2,2) specification (*N* = 38) yield p-values of 0.0908 and 0.0934, respectively. The contemporaneous REER coefficient is −0.4786 (conventional p = 0.2083). The BPG F-test rejects homoskedasticity at the 5% level (p = 0.0266), and the reported LM p-value is 0.0520. With HC3 standard errors, the contemporaneous REER coefficient has a p-value of 0.3310 and a 95% confidence interval of [−1.4717, 0.5145]. The conventional bounds statistics are *F* = 12.5520 and *t* = −5.7281. The evidence of heteroskedasticity warrants caution when interpreting these statistics against the standard bounds critical values.
Table 12 reports the estimated current-quarter responses of health-purpose visits, total real receipts, and real receipts per visit to a 1% increase in the REER, together with HC3-based 95% confidence intervals and p-values.
Table 12.
Current-quarter responses to a 1% REER increase, with HC3 uncertainty.
Responses are approximate percentage changes for the same 0.01 current log-REER movement, holding lagged paths and other covariates fixed. The visitor equation is ARDL(1,2,2); total receipts uses its baseline ARDL; receipts per visit uses its stationary baseline. These conditional comparisons share an impact horizon but are not causal effects or tests of cross-equation equality.
6. Discussion
The results demonstrate the value of distinguishing visitor volume, total inflation-adjusted receipts, and average receipts per visit. The negative REER point estimates for visitor demand persist across several dynamic specifications, including AR(2)-error sensitivity models, while the BG evidence for the restricted OLS ARDL model calls for a cautious reading of its bounds-based long-run estimates. The total-receipts baseline estimates a positive long-run OECD GDP association and a REER coefficient that is not statistically significant, with the magnitude and precision of some estimates varying when the 2021Q3 indicator is introduced. For receipts per visit, the stationary specifications yield positive REER-change coefficients whose statistical precision differs across the parsimonious and wider-lag approaches (Table 11). Taken together, the results emphasize the different dimensions of tourism performance while avoiding causal or mechanically offsetting interpretations of the estimated associations.
Because real receipts per visit is I(0) and the log REER and OECD GDP variables are I(1), the stationary dynamic specifications are prioritized for inference on receipts per visit. In stationary models, positive Δln(REER) coefficients have p-values of 0.0635 without the pulse, 0.1120 with the pulse, and 0.2873 with AR(1) errors. These estimates preserve a positive sign but indicate specification-dependent precision; the parsimonious estimates have p-values above 0.05, while wider-lag results are reported separately in Table 11. The large 2021Q3 pulse reflects an exceptional aggregated quarterly observation; a more detailed explanation would benefit from patient-level case-mix and reporting information. The identity relating total receipts, visits, and receipts per visit is used as an accounting framework, with behavioral channels left for future research.
The baseline real-receipts ARDL estimates a positive long-run OECD GDP multiplier (4.5992, p = 0.0385), with estimates showing some sensitivity to pulse inclusion and lag selection. Intervention and exclusion comparisons are presented alongside their BG diagnostics to distinguish in-sample fit from model adequacy. OECD-wide activity is used as a consistent broad proxy for external conditions, while the available quarterly sample favors parsimonious dynamic specifications. Accordingly, the coefficients are discussed as context-specific associations between macroeconomic conditions and revenue performance. These revenue indicators contribute to the economic dimension of a broader sustainability assessment, which may also incorporate provider-level outcomes and social or environmental measures.
From a policy perspective, the results support monitoring health-purpose visits, total real receipts, and real receipts per visit as complementary indicators of medical-tourism performance. The provider-side considerations identified by Buzcu and Birdir [13] and the service-positioning perspective discussed by Demir Uslu et al. [26] highlight the value of interpreting sectoral outcomes alongside healthcare capacity and institutional conditions. Karcıoğlu [28] further underscores the relevance of how tourism revenues are distributed across healthcare providers. The combined indicators offer policymakers a more informative picture of changes in activity, average expenditure, and aggregate revenue, helping to identify areas for strategic planning and continued sectoral development. The implications for economic sustainability arise from distinguishing visitor growth from real revenue performance and from monitoring the sector’s exposure to macroeconomic conditions. This interpretation is consistent with the multidimensional approach to sustainable health tourism advanced by Figueiredo et al. [1], Elgin and Elveren [15], and Çapar and Arslanoğlu [2], alongside evidence linking medical-tourism revenues to healthcare-sector and aggregate economic activity [6,7]. Future work using provider-level and patient-level evidence could extend these findings to domestic value added, access to care, and social and environmental outcomes. The study’s principal contribution is a differentiated empirical basis for assessing medical-tourism competitiveness and revenue performance as part of longer-term destination planning.
7. Conclusions
Quarterly evidence for 2014Q2–2024Q4 examines exchange-rate associations separately for health-purpose visits, total real receipts, and real receipts per visit in Türkiye. Visitor REER coefficients are consistently negative across the examined specifications, with long-run interpretation considered alongside the corresponding residual serial-correlation diagnostics. The total-receipts baseline yields a long-run REER coefficient that is not statistically significant and a positive OECD GDP coefficient that is sensitive to intervention specification. For receipts per visit, the positive coefficient on changes in log REER is not significant at 5% in the parsimonious stationary specifications; wider-lag exploratory models yield significance at the 5% level in some cases, whose significance changes when 2021Q3 and its affected lag observations are excluded, highlighting sensitivity to model specification (Table 11). The exceptional 2021Q3 observation influences receipts estimates and motivates further investigation with more disaggregated data.
These findings demonstrate the analytical value of monitoring visitor volume, total real receipts, and real receipts per visit simultaneously. Visitor arrivals provide information about the scale of international demand, while aggregate receipts capture total tourism revenue associated with health-purpose visits. Real receipts per visit offer a complementary indicator of average revenue performance. Assessing these measures together can help policymakers distinguish changes in tourism activity from changes in the economic value associated with each visit. Such distinctions are relevant to healthcare capacity planning, destination competitiveness, infrastructure investment, and the evaluation of medical-tourism development strategies.
From an economic sustainability perspective, the three-indicator framework provides a broader basis for evaluating medical-tourism performance than reliance on visitor arrivals or aggregate receipts alone. By distinguishing growth in international patient-related activity from changes in inflation-adjusted revenue performance, the analysis offers insights relevant to long-term sectoral planning and the monitoring of macroeconomic exposure. In particular, considering exchange-rate competitiveness and external economic conditions alongside complementary performance indicators can support more informed assessments of the sector’s economic development. As part of a multidimensional sustainability assessment, these economic indicators can be complemented in future research by evidence on healthcare capacity, domestic value added, benefit distribution, local access to care, and environmental outcomes.
The findings are based on quarterly tourism indicators and a consistent set of macroeconomic variables. Alternative lag structures, pulse specifications, and observation-exclusion exercises provide further evidence on the sensitivity of the estimated relationships. The visitor-model results are considered alongside the corresponding residual diagnostics. Future research could build on this framework with origin-market income, treatment mix, and provider-level information to examine the wider economic, social, and environmental dimensions of medical tourism.
Funding
This research was funded by the Princess Nourah bint Abdulrahman University Researchers Supporting Project number (PNURSP2026R961), Princess Nourah bint Abdulrahman University, Riyadh, Saudi Arabia.
Institutional Review Board Statement
Not applicable; the study uses aggregate secondary data.
Informed Consent Statement
Not applicable.
Data Availability Statement
The data supporting the findings of this study are available from the corresponding author upon reasonable request. The original data sources and variable definitions are described in Table 1.
Acknowledgments
The author extends appreciation to Princess Nourah bint Abdulrahman University Researchers Supporting Project number (PNURSP2026R961), Princess Nourah bint Abdulrahman University, Riyadh, Saudi Arabia.
Conflicts of Interest
The author declares no conflicts of interest.
References
- Figueiredo, N.; Abrantes, J.L.; Costa, S. Mapping the Sustainable Development in Health Tourism: A Systematic Literature Review. Sustainability 2024, 16, 1901. [Google Scholar] [CrossRef] [Scilit]
- Çapar, H.; Arslanoğlu, A. The Impact of Sustainable Development Goals as a Driving Force in the Development of Medical Tourism. Eval. Program Plan. 2025, 111, 102587. [Google Scholar] [CrossRef] [Scilit] [PubMed]
- Ağazade, S.; Ergün, A. Health tourism revenues and real exchange rate relationship in Türkiye. J. Qual. Assur. Hosp. Tour. 2024, 25, 1402–1419. [Google Scholar] [CrossRef] [Scilit]
- Sinet, U.; Akdeniz, C.; Gaberli, Ü. Health tourism potential of Turkey under the different regimes: Macroeconomic factors affecting the international competitiveness. Ege Acad. Rev. 2025, 25, 567–578. [Google Scholar] [CrossRef] [Scilit]
- Kalkay, D.; Sarıipek, S. Türkiye’de sağlık turizmi gelirleri ve döviz kuru arasındaki ilişkinin vektör otoregresif model ile analizi. Akad. Hassasiyetler 2025, 12, 182–200. [Google Scholar] [CrossRef] [Scilit]
- Gholipour, H.F.; Esfandiar, K. Does medial tourism promote growth in healthcare sector? Eur. J. Health Econ. 2025, 26, 233–241. [Google Scholar] [CrossRef] [Scilit] [PubMed]
- Ağazade, S. Travel for health as a type of niche tourism and economic growth: A cross-country panel data analysis. Int. J. Tour. Res. 2024, 26, e2681. [Google Scholar] [CrossRef] [Scilit]
- Culiuc, A. Determinants of International Tourism; IMF Working Paper No. 14/82; International Monetary Fund: Washington, DC, USA, 2014. [Google Scholar] [CrossRef] [Scilit]
- Gündüz, S.; Çeken, H.; Yazıcıoğlu, İ. Türkiye’de reel efektif döviz kurunun turist başına düşen ortalama harcama miktarı üzerindeki etkisi. İşletme Araştırmaları Derg. 2023, 15, 2402–2412. Available online: https://isarder.org/index.php/isarder/article/download/2020/2136/1966 (accessed on 4 November 2026).
- Beladi, H.; Chao, C.C.; Ee, M.S.; Hollas, D. Does medical tourism promote economic growth? A cross-country analysis. J. Travel Res. 2019, 58, 121–135. [Google Scholar] [CrossRef] [Scilit]
- Chowdhary, S.P.; Majumdar, K. Health tourism catalyst for growth in developing nations. J. Public Aff. 2025, 25, e70060. [Google Scholar] [CrossRef] [Scilit]
- Özsarı, H.; Seker, M. Health tourism and an example of private healthcare solution. Int. J. Health Manag. Tour. 2018, 3, 82–86. [Google Scholar] [CrossRef] [Scilit]
- Buzcu, Z.; Birdir, K. Türkiye’de medikal turizm incelemesi: Özel hastanelerde bir çalışma. Gaziantep Üniversitesi Sos. Bilim. Derg. 2019, 18, 311–327. [Google Scholar] [CrossRef] [Scilit]
- Budak, E.S. Health tourism and management: Past, present and future in Turkey and the world. Int. J. Health Manag. Sci. 2026, 2. [Google Scholar] [CrossRef] [Scilit]
- Elgin, C.; Elveren, A.Y. Unpacking the Economic Impact of Tourism: A Multidimensional Approach to Sustainable Development. J. Clean. Prod. 2024, 478, 143947. [Google Scholar] [CrossRef] [Scilit]
- Tang, C.F.; Lau, E. Modelling the demand for inbound medical tourism: The case of Malaysia. Int. J. Tour. Res. 2017, 19, 584–593. [Google Scholar] [CrossRef] [Scilit]
- Kadir, N.; Nayan, S. International demand for medical tourism in Malaysia: Evidence from panel data. Int. J. Bus. Soc. 2021, 22, 1240–1255. [Google Scholar] [CrossRef] [Scilit]
- Pailwar, V.K.; Mitra, S.K. International medical tourism: The nonlinear impact of exchange-rate-adjusted relative prices. J. Qual. Assur. Hosp. Tour. 2025. Advance online publication. [Google Scholar] [CrossRef] [Scilit]
- Sharma, M.; Mohapatra, G.; Giri, A.K. Examining the macro-determinants of tourist arrivals in India. SN Bus. Econ. 2022, 2, 113. [Google Scholar] [CrossRef] [Scilit] [PubMed]
- Sharma, M.; Mohapatra, G.; Giri, A.K. The determinants of inbound tourism demand in India: New evidence from ARDL co-integration approach. Bus. Perspect. Res. 2023. Advance online publication. [Google Scholar] [CrossRef] [Scilit]
- Esquivias, M.A.; Sugiharti, L.; Rohmawati, H.; Setyorani, B.; Anindito, A. Tourism demand in Indonesia: Implications in a post-pandemic period. Geoj. Tour. Geosites 2021, 37, 951–958. [Google Scholar] [CrossRef] [Scilit]
- Horsfall, D.; Lunt, N. Medical tourism by numbers. In Handbook on Medical Tourism and Patient Mobility; Lunt, N., Horsfall, D., Hanefeld, J., Eds.; Edward Elgar Publishing: Cheltenham, UK, 2015; pp. 25–36. [Google Scholar] [CrossRef] [Scilit]
- Ağazade, S.; Ergün, A. Medical tourism demand to Türkiye: Sub-sectoral panel data estimations. J. Qual. Assur. Hosp. Tour. 2025, 26, 987–1005. [Google Scholar] [CrossRef] [Scilit]
- Biri, G. Türkiye’nin sağlık turizmi gelirini etkileyen faktörlerin eşbütünleşme analizi. Anadolu Üniversitesi İktisadi İdari Bilim. Fakültesi Derg. 2021, 22, 73–82. [Google Scholar] [CrossRef] [Scilit]
- Gündoğan, H.; Coşkun, K.; Çelik, S. Analysing the impact of exchange rate shocks on health tourism with SVAR analysis. Erciyes Univ. J. Fac. Econ. Adm. Sci. 2025, 71, 33–40. [Google Scholar] [CrossRef] [Scilit]
- Demir Uslu, Y.; Yılmaz Alarçin, E.; Yılmaz, E.; Gedikli, E. Türk sağlık sisteminin markalaşmasına stratejik bir bakış. Bingöl Üniversitesi Sos. Bilim. Enstitüsü Derg. 2022, 23, 207–225. [Google Scholar] [CrossRef] [Scilit]
- Demirel, S.; Şahin, A. Türkiye’de sağlık turizminin finansal piyasalara etkisi. Uluslar. Ekon. Siyaset İnsan Toplum Bilim. Derg. 2023, 6, 308–336. [Google Scholar] [CrossRef] [Scilit]
- Karcıoğlu, U.B. The role of health tourism revenues in closing Turkish hospitals’ foreign-exchange gaps: A systematic literature review of the post-pandemic period 2022–2025. J. Tour. Intell. Smartness 2026, 9, 16–25. [Google Scholar] [CrossRef] [Scilit]
- Uçak, H. The relationship between the growth in the health sector and inbound health tourism: The case of Turkey. SpringerPlus 2016, 5, 1685. [Google Scholar] [CrossRef] [Scilit] [PubMed]
- Geçer, T. The effect of exchange rate increase on aesthetic cosmetic tourism within the framework of health tourism: Example of Türkiye. Uluslar. Sos. Bilim. Derg. 2022, 6, 183–195. [Google Scholar] [CrossRef] [Scilit]
- Özdemir, A.; Işın, F.B.; Eşiyok, B. Treatment type as a factor in medical tourism destination preferences: The case of Turkey. Int. J. Health Manag. Tour. 2017, 2, 58–72. Available online: https://dergipark.org.tr/en/pub/ijhmt/article/338208 (accessed on 4 November 2026).
- Murshed, M. International tourism demand in Bangladesh: An ARDL bounds test approach. J. Tour. Manag. Res. 2018, 5, 50–67. [Google Scholar] [CrossRef] [Scilit]
- Öztürk, M. Factors influencing Kyrgyz medical tourists’ choice of Turkey: Evidence from surveys and expert interviews. Ponte Acad. J. 2026, 82, 2–15. [Google Scholar] [CrossRef] [Scilit]
- Garín-Muñoz, T.; Pérez Amaral, T. An econometric model for international tourism flows to Spain. Appl. Econ. Lett. 2000, 7, 525–529. [Google Scholar] [CrossRef] [Scilit]
- Chi, J. Dynamic impacts of income and the exchange rate on US tourism, 1960–2011. Tour. Econ. 2015, 21, 1047–1060. [Google Scholar] [CrossRef] [Scilit]
- Ongan, S.; Işık, C.; Özdemir, D. The effects of real exchange rates and income on international tourism demand for the USA from some European Union countries. Economies 2017, 5, 51. [Google Scholar] [CrossRef] [Scilit]
- Turkish Statistical Institute. Tourism Statistics: Departing Visitors and Tourism Income by Purpose of Visit. MEDAS. Available online: https://biruni.tuik.gov.tr/medas/?kn=74&locale=en (accessed on 4 November 2026).
- Chaitip, P.; Chaiboonsri, C. Thailand’s international tourism demand: The ARDL approach to cointegration. Ann. Univ. Petroşani Econ. 2009, 9, 163–184. Available online: https://www.upet.ro/annals/economics/pdf/2009/20090316.pdf (accessed on 4 November 2026).
- Beh, W.-L.; Lee, J.-H. The study of the Malaysia’s tourism arrivals: An ARDL approach. Austrian J. Stat. 2020, 49, 48–56. Available online: https://www.ajs.or.at/index.php/ajs/article/view/1031 (accessed on 4 November 2026).
- Cheng, K.M. Medical tourism: Chinese maternity tourism to Hong Kong. Curr. Issues Tour. 2016, 19, 1479–1486. [Google Scholar] [CrossRef] [Scilit]
- Pesaran, M.H.; Shin, Y.; Smith, R.J. Bounds testing approaches to the analysis of level relationships. J. Appl. Econom. 2001, 16, 289–326. [Google Scholar] [CrossRef] [Scilit]
- Narayan, P.K. The saving and investment nexus for China: Evidence from cointegration tests. Appl. Econ. 2005, 37, 1979–1990. [Google Scholar] [CrossRef] [Scilit]
- US Bureau of Labor Statistics. Consumer Price Index for All Urban Consumers: All Items in US City Average [CPIAUCSL]. FRED, Federal Reserve Bank of St. Louis. Available online: https://fred.stlouisfed.org/series/CPIAUCSL (accessed on 4 November 2026).
- Central Bank of the Republic of Türkiye. CPI-Based Real Effective Exchange Rate (TP_RK_T1_Y, 2025=100). Electronic Data Delivery System. Available online: https://evds3.tcmb.gov.tr/ (accessed on 4 November 2026).
- Organisation for Economic Co-operation and Development. National Accounts: GDP by Expenditure: Constant Prices: Gross Domestic Product: Total [OECDNAEXKP01GPSAQ]. FRED, Federal Reserve Bank of St. Louis. Available online: https://fred.stlouisfed.org/series/OECDNAEXKP01GPSAQ (accessed on 22 September 2026).
- Brown, R.L.; Durbin, J.; Evans, J.M. Techniques for testing the constancy of regression relationships over time. J. R. Stat. Soc. Ser. B 1975, 37, 149–163. [Google Scholar] [CrossRef] [Scilit]

Disclaimer/Publisher’s Note: The statements, opinions and data contained in all publications are solely those of the individual author(s) and contributor(s) and not of MDPI and/or the editor(s). MDPI and/or the editor(s) disclaim responsibility for any injury to people or property resulting from any ideas, methods, instructions or products referred to in the content. |
© 2026 by the author. Licensee MDPI, Basel, Switzerland. This article is an open access article distributed under the terms and conditions of the Creative Commons Attribution (CC BY) license.