


Abstract
The accelerating pace of climate change and urbanization intensifies the urban heat island (UHI) effect, posing significant public health risks and challenging the goal of sustainable urban development. Urban waterfront parks (UWPs), as nature-based solutions, offer great potential for mitigating urban heat stress. However, a critical gap remains in understanding how visual landscape elements psychologically influence human thermal comfort, which limits theoretical innovation in sustainable urban design. Moving beyond merely reducing physical temperatures, this study introduces a psychosocial perspective to explore how visual perception can enhance cooling effects. This research investigates the moderating effects of visual landscape elements on thermal perception within UWPs during summer. The study area is Yihu Park in Dujiangyan, a city located in the hot-summer/cold-winter (HSCW) climate zone of China. Combining on-site meteorological measurements with subjective thermal sensation surveys across six activity zones, we assessed thermal comfort (TC) and thermal perception (TP). Regression models were used to analyze how visual features moderate the relationship between the Universal Thermal Climate Index (UTCI) and TP, leading to the establishment of thermal benchmarks. The results reveal substantial spatial variations in the thermal environment, indicating that water bodies are not the sole determinants of thermal comfort. The neutral UTCI of the park was 36.46 °C, with a neutral temperature range of 34.52–38.40 °C. After accounting for within-location dependence across 60 sampling locations, the UTCI × SVI interaction remained negative and statistically significant (β = −0.259, cluster-robust 95% CI: −0.502 to −0.016, p = 0.0371; ΔR2 = 0.0068), suggesting that higher sky visibility was associated with a weaker relationship between UTCI and subjective thermal perception. In contrast, the UTCI × GVI interaction remained positive but was no longer statistically significant at the 0.05 level (β = 0.122, cluster-robust 95% CI: −0.014 to 0.259, p = 0.0782; ΔR2 = 0.0056). The UTCI × HPVI interaction remained statistically non-significant. Multilevel mixed-effects models confirmed these significance patterns and the consistency of the interaction directions. These findings highlight the potential perceptual role of visual landscape characteristics while demonstrating that their moderating associations are modest. Integrating visual landscape design with physical microclimatic interventions may contribute to more comfortable and climate-resilient urban waterfront spaces.
1. Introduction
Global climate change and rapid urbanization have intensified heat stress in urban environments, presenting severe public health challenges. Urban heat waves are increasing in both frequency and intensity, with densely built-up areas exhibiting temperatures substantially higher than surrounding rural areas due to pronounced urban heat island (UHI) effects [1]. According to projections from the World Health Organization, heat-related mortality is expected to escalate dramatically in the coming decades without effective interventions [2], underscoring the urgent need for innovative and sustainable solutions to mitigate heat stress in urban settings.
In response to these challenges, many cities have implemented multi-layered cooling strategies, including increasing urban greenery, enhancing reflective surfaces, installing shading infrastructure, and promoting cooling centers [3,4]. However, these interventions predominantly focus on objective temperature reductions and frequently overlook subjective human thermal comfort experiences. This has resulted in a notable disconnect: engineered solutions that succeed in modestly reducing temperature metrics do not necessarily translate into improved thermal comfort as perceived by urban residents [5,6]. Field studies have long recognized that physical microclimatic parameters explain only part of the variance in subjective thermal sensation [5], and that the physical cooling delivered by vegetation and the perceptual benefits it provides do not necessarily coincide [6]. Whether—and under what conditions—engineered reductions in temperature metrics translate into perceived thermal comfort therefore remains insufficiently quantified in field settings. Such a mismatch highlights a critical limitation in current urban heat mitigation strategies, indicating that addressing heat stress requires a deeper integration of physical and psychological comfort factors.
Urban waterfront spaces are increasingly recognized for their potential to alleviate summer heat stress, offering a natural microclimatic moderation through the interplay of water bodies, vegetation, and open space [7]. Beyond their physical cooling capabilities—such as evaporative cooling and vegetative shading—these environments create visually appealing landscapes that significantly influence psychological perceptions of comfort [8]. Visual landscape elements like water vistas, green canopies, and spaciousness evoke subjective sensations of coolness, enhancing residents’ psychological resilience to heat stress [9]. Nevertheless, traditional urban climate research and planning have largely emphasized objective meteorological measures, neglecting the powerful role visual and psychological factors play in thermal perception [10]. Thus, a renewed emphasis on visual perception and environmental psychology is essential to unlock the full cooling potential of urban waterfront parks.
To address the identified research gaps, this study examines the relationships among visual landscape factors, objective thermal conditions, and subjective thermal perception in urban waterfront parks (UWPs) during summer. Previous studies have shown that landscape characteristics influence microclimatic conditions [11,12], while visual appraisal and psychological adaptation may also shape subjective thermal perception [13,14,15]. However, the spatial differences in thermal conditions across functional zones and the potential moderating effects of visual landscape factors on the relationship between objective thermal stress and subjective thermal perception remain insufficiently understood. Theoretically, this study advances the understanding of outdoor thermal comfort in urban waterfront parks by examining both the relationships between visual landscape factors and objective thermal conditions and the moderating effects of these factors on the relationship between UTCI and subjective thermal perception. By comparing these relationships across functionally distinct zones within the same park, the study provides further insight into spatial heterogeneity in thermal conditions and the potential role of visual landscape characteristics in shaping subjective thermal responses. Practically, the findings can inform context-sensitive landscape planning and design by helping to identify how vegetation visibility, sky exposure, and hard-paved surfaces are associated with local thermal conditions and perceived thermal comfort. This evidence may support zone-specific design strategies for improving outdoor thermal environments in waterfront parks, while recognizing that their applicability may vary across climatic and site conditions.
Based on the research gaps identified above and the supporting evidence from previous studies, three hypotheses are proposed:
Hypothesis 1 (H1): Microclimatic parameters and surface temperatures exhibit statistically significant spatial differences across distinct functional zones in the urban waterfront park.
Hypothesis 2 (H2): Visual landscape configurations (GVI, SVI, and HPVI) significantly affect local microclimatic parameters and contribute to spatial variations in objective thermal comfort (UTCI).
Hypothesis 3 (H3): Visual landscape factors moderate the relationship between objective thermal stress (UTCI) and subjective thermal perception (TP), with green visibility (GVI) expected to amplify and sky visibility (SVI) expected to attenuate this relationship, reflecting the potential roles of psychological expectations and spatial openness.
2. Literature Review
The urban heat island (UHI) phenomenon refers to the significant increase in temperature observed in urban areas compared to surrounding suburban regions, primarily due to the densification of buildings, the hardening of surfaces, and heightened human activity [16]. This effect not only elevates urban summer temperatures and intensifies the heat burden on residents, but it may also result in increased energy consumption, diminished air quality, and adverse health effects for the population [17,18]. However, in waterfront areas, the impacts of the UHI can manifest differently due to the moderating influence of water bodies and specific geographic conditions [19]. For instance, water bodies can exert a cooling effect on adjacent areas through their unique heat capacity and evaporation processes [20], thereby mitigating the heat island effect to some degree. Furthermore, landscape design elements—such as the selection of plant species [21], the size of the canopy [22], the type of understory [23], and the spatial layout [24] of the waterfront—significantly influence the thermal environment of these areas. Increased vegetation cover is frequently correlated with diminished solar radiation and lower air temperatures [11]. Trees and plants can effectively mitigate surface and air temperatures by providing shade and facilitating water evaporation. In contrast, hardened surfaces in parks, such as concrete and asphalt pavements, tend to absorb and retain heat due to their material properties, resulting in a significant rise in surface and air temperatures in these areas [12]. Consequently, a thorough investigation and comprehension of the UHI and its influencing mechanisms in landscape design, particularly in waterfront areas, is essential for the formulation of effective urban planning and mitigation strategies [25].
Human thermal comfort (HTC) is defined as “the psychological state of being satisfied with the thermal environment.” This definition underscores that HTC is a subjective experience [26], varying from individual to individual due to factors such as clothing and metabolic rate [27]. The impact of landscape elements on thermal comfort (TC), in relation to physical factors, emphasizes meteorological variables and human biological indicators that reflect the objective thermal conditions present in the urban environment [28]. Studies typically employ a variety of models and methods to assess HTC, including the Physiological Equivalent Temperature (PET), the Standard Effective Temperature (SET*), and the Universal Thermal Climate Index (UTCI) [29]. These models integrate several meteorological variables, such as air temperature, wind speed, solar radiation, and humidity, to quantify HTC within a specific environment [30,31]. Indeed, HTC in outdoor open spaces is influenced by a complex interplay of physical, physiological, behavioral, and psychological factors [32]. Research has demonstrated that the perception of TC is associated with the naturalness of the environment, aesthetic appreciation, and positive experiences [13]. Individuals’ perceptions of TC are influenced by their assessment of the spatial environment [33], suggesting that frequenting and utilizing green spaces during the hotter months may enhance individuals’ TC. Additionally, Maanvi and Rajasekar (2021) found that satisfaction with the aesthetic elements of the landscape impacts thermal perception (TP) [34]. Lau and Choi (2021) found that populations residing in aesthetically pleasing and pleasant environments exhibited higher tolerance and lower sensitivity to HTC [13]. Their study confirmed that microclimatic factors accounted for approximately 50% of the variance in the relationship between objective and subjective evaluations of TC, suggesting that the remaining variance is likely attributable to psychological adaptation. Factors influencing psychological adaptation include naturalness, expectations, both short- and long-term experiences [14], exposure duration, perceived control, and environmental stimuli [15].
Vision is a critical sensory component that connects individuals to their surroundings and significantly influences their perception of the external environment [35]. Access to green spaces in urban areas is a fundamental need, and aesthetically pleasing visual environments can aid in stress reduction [36]. Furthermore, both urban visual and thermal environments (TE) impact individuals’ comfort and psychological well-being [37]. Outdoor thermal comfort represents a crucial aspect of green space quality that significantly affects individuals’ choices and their utilization of these areas. Furthermore, the visual environment [38], along with visual perception [39] and visual psychology [40], has been recognized as a factor influencing perceptions of the thermal environment. Individuals experience varying levels of TC in response to different visual elements. Research indicates that the ornamental characteristics of trees may influence individuals’ thermal sensation votes (TSVs) by enhancing positive emotions [41]. Lam identified significant associations between TP and sun preference, demonstrating that outdoor TP is positively correlated with sun perception. Furthermore, he confirmed that outdoor heat discomfort can be alleviated by enhancing visual comfort [38]. Additionally, individuals’ ratings of comfort in the visual environment are also influenced by the thermal environment [42]. Lyu et al. conducted a laboratory-based investigation into the effects of landscape on thermal comfort and resilience among a semi-outdoor employed population. Their findings indicate that TP influences individuals’ visual preferences, and that visual comfort contributes to overall comfort [43].
In urban waterfront parks (UWPs), thermal perception is influenced by the combined effects of landscape characteristics and the surrounding thermal environment [44]. Water bodies are a defining feature of UWPs and may modify local thermal conditions through thermal inertia, evaporative cooling, and interactions with local airflow and humidity. Together with vegetation and spatial openness, these characteristics contribute to a distinctive microclimatic context that may affect both objective thermal conditions and subjective thermal perception. Different visual landscape components may be associated with thermal conditions through distinct physical mechanisms. For example, vegetation can reduce solar radiation and air temperature through shading and evapotranspiration [11,45], whereas greater sky exposure may increase exposure to solar radiation [46]. Hard-paved surfaces may also contribute to elevated surface temperatures because of their thermal properties [12]. Accordingly, variations in the Green View Index (GVI), Sky View Index (SVI), and Hard Pavement View Index (HPVI) may be associated with differences in microclimatic conditions and objective thermal stress across waterfront activity zones.
Beyond these physical relationships, visual landscape characteristics may also influence how individuals perceive and respond to a given level of objective thermal stress. Thermal perception is shaped not only by environmental conditions but also by visual appraisal and psychological adaptation, including naturalness, aesthetic appreciation, expectations, and previous experiences [5,6,13,14,15]. Consequently, individuals exposed to similar objective thermal conditions may report different thermal sensations depending on their surrounding visual environments and individual perceptions. The relationship between UTCI and subjective thermal perception (TP) may therefore vary with landscape composition. In particular, GVI, SVI, and HPVI may exhibit different moderating effects on the relationship between objective thermal stress and subjective thermal perception. However, these potential moderating effects should be distinguished from the direct physical effects of landscape characteristics on the thermal environment.
Despite growing research interest in the relationships between visual landscapes and outdoor thermal comfort, several aspects remain insufficiently understood. First, many existing studies examine individual landscape scenes or specific spatial types, providing limited evidence on spatial differences in microclimatic conditions and surface temperatures among functionally distinct zones within the same UWP. Second, although vegetation, sky exposure, and hard surfaces are associated with thermal environmental conditions, their respective relationships with microclimatic parameters and UTCI require further investigation in waterfront settings. Third, while previous studies have identified associations between visual landscape characteristics and thermal perception, limited attention has been given to whether and how these characteristics moderate the relationship between UTCI and subjective TP, or whether such moderating effects differ among landscape factors. Addressing these issues is important for understanding the respective physical and perceptual roles of visual landscape characteristics in outdoor thermal comfort.
Taken together, the reviewed literature provides the theoretical basis for the conceptual framework presented in Figure 1. The framework illustrates the relationships among functional zones, visual landscape factors, microclimatic conditions, UTCI, and subjective TP. It distinguishes spatial differences in thermal conditions from the relationships between visual landscape characteristics and objective thermal conditions, while also representing the potential moderating role of visual landscape factors in the UTCI–TP relationship. Although the present study focuses on waterfront parks, the landscape components examined, including vegetation, sky exposure, spatial openness, and hard surfaces, are also present in other urban parks. The findings may therefore offer insights for parks with comparable landscape and climatic conditions, although the magnitude of these relationships may vary according to site-specific characteristics.
Figure 1.
Conceptual framework of the relationships among visual landscape factors, the objective thermal environment, and subjective thermal perception.
3. Overview of the Study Area and Delineation of the Area of Activity
3.1. Overview of the Study Area
The area selected for this study is Dujiangyan City (31°1′ N, 103°39′3″ E), situated in Chengdu, Sichuan Province. Dujiangyan City is located in the northwestern part of Sichuan Province and experiences a humid subtropical monsoon climate, characterized by a pleasant atmosphere, abundant precipitation, and ample sunshine. According to China’s Thermal Design Code for Civil Buildings (GB50176-2016) [47], Dujiangyan City belongs to the HSCW region (Figure 2), which is marked by a hot and sultry climate. Table 1 presents the monthly averages, as well as the maximum and minimum temperatures and average wind speed for Dujiangyan City in 2020. The highest temperatures are recorded in July, while the lowest occur in January. Overall, summer temperatures remain moderate, with the hot season spanning from June to August. The average wind speed shows no significant variation throughout the year. For this study, July, the hottest month of summer in Dujiangyan City, was selected to conduct a field survey and investigate the thermal environmental comfort and TP of urban residents under extreme weather conditions.
Figure 2.
Zone map [48].
Table 1.
The 2020 air temperature and wind speed table of Dujiangyan City.
Dujiangyan Yihu Park (31°0′48″ N–31°1′16″ N, 103°39′4″ E–103°39′39″ E) features the Puyang River traversing its landscape, with Yihu Park positioned at the park’s center, creating a waterfront area characterized by diverse natural scenery. However, certain waterfront spaces within the park are underutilized regarding their thermal environmental potential, primarily due to suboptimal landscape design. This inadequacy adversely impacts both visitor engagement and the overall efficiency of space utilization. Consequently, selecting Yihu Park as a focal point for research is both representative and valuable for investigating enhancements to the TE in UWP.
3.2. Activity Area Division
The diverse blue and green space types within Yihu Park create a range of microclimatic environments. This paper classifies the park’s behavioral activities and spatial types into six categories: Waterfront Woodland (WW), Waterside Meadow (WM), Lawn Area (LA), Event Square (ES), Waterside Stalls (WS), and Waterside Greenway (WG), based on the variations in landscape factor combinations and the analysis of park users’ activity characteristics during the research phase. To mitigate randomness and reduce research error, sampling points for actual measurements were selected in each spatial type, guided by the richness of the spatial landscape (Figure 3). The spatial characteristics and number of sampling points for each activity area are presented in Table 2.
Figure 3.
Spatial typing and sampling points.
Table 2.
Spatial characteristics and number of sampling points.
4. Methodology
To investigate the moderating effects of visual landscape factors on TP, this study employed a combination of field measurement techniques and subjective assessments. An Unmanned Aerial Vehicle (UAV) equipped with a thermal imaging camera was utilized to collect subsurface data, allowing for detailed measurements of thermal environmental factors at 60 points across various spatial types within Yihu Park in Dujiangyan City. By integrating these measurements with field survey data, this study compared and analyzed the impacts of different visual landscape factors. To test the proposed hypotheses, field microclimatic measurements, visual landscape assessments, UTCI calculations, questionnaire surveys, and statistical analyses were conducted. The overall research framework and analytical procedures are illustrated in Figure 4.
Figure 4.
Research framework diagram.
4.1. Underlying Surface Temperature Acquisition
The TE field program incorporated aerial photography during the peak summer heat period, utilizing a drone equipped with a thermal imaging camera. Specifically, between 14:18 and 14:38 on 19 July 2020, a total of 248 thermal imaging photographs were captured from an altitude of 200 m using a DJI M210-RTK V2 UAV, which was outfitted with a ZENMUSE XT2 thermal imaging camera. These images were subsequently processed using PIX4Dmapper (version 4.3) to produce accurate orthophotographs depicting the surface temperature of the undercover area (e.g., Figure 5).
Figure 5.
Thermal imaging process for drone aerial photography.
4.2. Thermal Environment Data Acquisition
This TE data collection employs anemometers, thermometers, hygrometers, and thermal radiation meters, with a sampling height of 1.5 m above ground level, which approximates the average breathing height of the human body [49]. This setup facilitates the collection of air temperature, humidity, wind speed, and solar radiation data from 60 sampling points within the park. Given the hot summer weather, elevated temperatures can lead to significant discomfort, adversely affecting public activities [50]. Consequently, on-site measurements were conducted during early (8:00–10:00), middle (13:00–15:00), and late (16:00–18:00) time periods when residents are typically relaxing. These time frames also correspond to periods when the microclimate effects of the riverfront space are more pronounced. To reduce measurement errors caused by cloud instability and to ensure data collection accuracy, this study selected consecutive summer days characterized by high temperatures and clear, rain-free weather for the actual measurements [51,52]. During the data collection process, the limited experimental instrumentation prevented the simultaneous collection of data from all 60 points. Consequently, data from the 60 sampling points were collected sequentially over three different time periods across three consecutive days, from 20 July to 22 July 2020. Each collection session for the 60 sampling points was conducted within the designated time frame, resulting in a total of 180 sets of thermal data. This approach ensured comprehensive temporal coverage and minimized potential errors.
To improve measurement reliability and reduce uncertainties associated with short-term weather variability (e.g., transient cloud cover and intermittent wind gusts), all mobile instruments were calibrated prior to fieldwork in accordance with the manufacturers’ specifications (Table 3). Additionally, data collection was conducted under sustained clear-sky conditions, and sensors were stabilized for 5 min at each sampling point to obtain steady-state average values rather than instantaneous readings.
Table 3.
Main measuring instruments and parameters.
4.3. Extraction of Visual Landscape Factors
From 12 July to 14 July 2020, 60 sampling points were used to sample the cultural landscape around them using a high-definition panoramic camera. A deep neural network was constructed to semantically segment the cultural landscape using the Deeplabv3+ model, which was trained based on the Cityscapes dataset; to extract 21 indicators with semantic profiles among them; and to group them by number. Through panoramic map semantic recognition, the classification of the landscape is quantitatively represented based on the materials, characteristics, distribution, and other features of the waterfront park landscape. This is achieved in conjunction with grid processing of the panoramic camera imaging results. Subsequently, batch semantic recognition statistics are conducted on the collected riverfront space maps, and the occupancy of various landscape view factors within each map is calculated, as illustrated in Table 4. Finally, three semantic labels—GVI, SVI, and hardened pavement visual index (HPVI) [53]—are utilized as the landscape factors in this study, with the definitions of each landscape factor presented in Table 5. The DeepLabv3+ network was pre-trained on the Cityscapes dataset, whose semantic categories cover the main landscape elements represented in the panoramic images; the semantic labels were grouped into the three indices according to Table 4, and the plausibility of the segmentation outputs was checked by visual comparison with the original panoramic images. Quantitative accuracy metrics such as mIoU were not calculated because manually labeled ground-truth images were unavailable.
Table 4.
Semantic classification and sequence numbers.
Table 5.
Landscape elements and meanings.
4.4. Thermal Comfort Index
The Universal Thermal Climate Index (UTCI) is a globally applicable thermal climate index designed to assess and compare HTC across various environmental conditions. Developed through an international collaborative effort initiated by the International Society of Biometeorology (ISB) and subsequently advanced through COST Action 730, the Universal Thermal Climate Index (UTCI) integrates key meteorological variables with human thermophysiological responses to provide a comprehensive assessment of outdoor thermal stress across diverse climatic conditions [54]. The calculated UTCI values represent equivalent temperatures derived from a combination of air temperature, radiation, wind, and humidity data, which correspond to reference conditions of radiation, humidity, and wind speed. The associated assessment scale, developed based on simulated physiological responses, comprises 10 categories that range from extreme cold stress to extreme heat stress (Table 6).
Table 6.
Thermal stress classification for UTCI.
The application of BioKlima version 2.6 software for calculating the UTCI necessitates the input of four meteorological parameters (Ta, RH, V, and Tmrt), along with two personal factors: metabolic rate and clothing insulation. Notably, clothing insulation is not a mandatory input for the UTCI, as a clothing model incorporated within UTCI-Fiala has been designed to predict clothing insulation based on air temperature [55]. Consequently, the UTCI is represented as a sixth-degree polynomial regression function of the four meteorological parameters (Equation (1)).
The meteorological parameters Ta and RH were obtained directly from field measurements, whereas Tmrt was estimated by considering the effects of air temperature and measured solar radiation using the following simplified radiative expression (Equation (2)).
Ta = Air temperature (°C);
α = Shortwave absorptivity of the human body (standard reference value taken as 0.70 for standard clothing and skin);
ε = Longwave emissivity (assumed to be 0.95);
σ = Stefan–Boltzmann constant (5.67 × 10⁻⁸ Wm−2K−4);
S = Solar radiation intensity (Wm−2).
Accordingly, αS represents the net absorbed shortwave solar radiation by the human body.
In addition, UTCI calculation requires wind speed referenced to a height of 10 m. Because of limitations in the field measurement setup, the measured wind speeds were converted to corresponding 10-m values using the wind-profile equation (Equation (3)) [56].
Vm = Wind speed at the measurement height;
m = Wind speed measurement height (m);
Z0 = The roughness length, which for urban street environments takes the value of 0.01 m.
4.5. Human Thermal Perceived Comfort Questionnaire Scale
Concurrent with the collection of thermal environment data at each monitoring site across different time periods, thermal perception questionnaires were administered to randomly encountered residents and visitors in the vicinity of the monitoring sites. The 180 meteorological observations were obtained from 60 sampling locations across three observation periods, representing repeated measurements at the same locations rather than 180 independent spatial samples. Questionnaire responses were matched to the corresponding thermal conditions according to the survey location and observation period. Each respondent completed the questionnaire only once. The study was conducted between 8:00 and 18:00 across six activity areas at 60 sampling points. Researchers randomly distributed the TEC scale to residents and visitors in these areas. TC was assessed using the ASHRAE 7-point heat sensation scale, which ranges from 1 (very cool) to 7 (very hot). Additionally, participants were surveyed on whether they believed this location was more suitable for cooling compared to other areas in the park, using a scale from 1 (strongly disagree) to 7 (strongly agree). A set of control questions was also included to calibrate the validity of the questionnaire. The full questionnaire, including the thermal environment experience items and participants’ basic demographic information, is provided in Appendix A. Analysis of the collected responses allowed for an evaluation of the human thermal perception of the riverfront space, with a total of 321 scales distributed and 300 scales successfully recovered. For the analyses, the original 1–7 votes were re-coded onto the conventional thermal sensation scale from −3 (very cool) through 0 (neutral) to +3 (very hot). To minimize potential observer bias, all field researchers received standardized pre-investigation training and followed a neutral, non-leading script during survey administration. Furthermore, participants were required to remain in the designated activity zone for at least 10–15 min to reach thermal adaptation before completing the questionnaire. However, multiple respondents could share the environmental observation corresponding to the same location–period combination; therefore, the questionnaire sample represents independent respondents but not 300 independent measurements of the physical thermal environment.
4.6. Thermal Comfort Benchmarks
4.6.1. Tn (Neutral Temperature)
Tn refers to the temperature level that individuals perceive as acceptable during the summer, specifically the temperature associated with the ‘temperature acceptable’ option in the Thermal Sensation Vote (TSV) scale [57]. Most existing studies have employed linear regression to determine Tn. In these studies, the regression function is derived by linearly fitting the mean TSV to a temperature index, namely the UTCI. The value of X that corresponds to the regression function Y = 0 (where Y represents the mean TSV) is identified as Tn. This study also utilized linear regression to ascertain Tn.
4.6.2. NTR (Neutral Temperature Range)
NTR is an extension of Tn, and the derived X range is based on the regression equation of neutral temperature, with the predicted Y values calculated as [−0.5, 0.5].
By examining Tn and NTR, this study discusses the TEC under various comfort benchmarks, aiming to adapt different standards for outdoor comfort in waterfront environments. This approach serves to inform the visual landscape design of waterfront spaces.
4.7. Dataset Matching and Spatiotemporal Synchronization
To ensure analytical validity across multi-source datasets, the temporal attributes and spatial matching protocols were designed as follows:
Spatial Matching: All spatial datasets were anchored to the 60 georeferenced sampling sites across the six spatial typologies. Visual landscape metrics (GVI, SVI, HPVI) captured static 3D geometric configurations; given that vegetation canopy density, sky view, and hardscape morphology remain quasi-static over midsummer weeks, these indices served as time-invariant spatial moderators for each point.
Synchronous Microclimate and Survey Coupling: The core analytical variables—on-site micrometeorological parameters (Ta, RH, V, and S) and subjective thermal perception questionnaires (MTSV)—were collected in strict spatiotemporal synchronization across three daily observation periods between 20 and 22 July 2020. Questionnaire responses were matched to the environmental conditions measured at the corresponding sampling location and observation period. Each respondent completed the questionnaire only once; however, multiple respondents could share the same location–period environmental observation. This hierarchical structure was considered when interpreting the statistical relationships between objective thermal conditions and subjective thermal perception.
Synoptic Weather Consistency for Thermal Imagery: The UAV thermal flight (19 July, 14:18–14:38) was conducted under the same stable subtropical anticyclonic weather system (hot, cloudless, low wind) as the subsequent on-site monitoring days (20–22 July). The aerial thermal imagery was utilized exclusively to assess macro-scale land surface temperature clustering and spatial cold/hot spots, rather than point-by-point instantaneous pairing with dynamic survey votes. This hierarchical decoupling between macro-spatial morphology and synchronous micro-perceptual surveys minimizes temporal mismatch bias.
4.8. Statistical Dependence and Robustness Analysis
In the questionnaire survey, 300 valid responses were collected across 60 georeferenced sampling locations. Each respondent completed the questionnaire only once. Respondents surveyed at the same location shared location-specific visual landscape characteristics, and those surveyed within the same location–observation-period combination could share the same measured microclimatic record. Consequently, questionnaire responses may be correlated within sampling locations despite being provided by distinct individuals. This shared spatial context induces a nested data structure that can bias standard ordinary least squares (OLS) standard errors downward and inflate Type I error rates. To account for this spatial dependence structure, two formal modeling frameworks were applied to evaluate the moderating effects of visual landscape factors:
(1) Cluster-Robust Standard Errors (CRSE): Linear interaction models were estimated using Huber–White cluster-robust sandwich variance estimators clustered at the sampling-location level (60 clusters). The cluster-robust covariance estimator was used to obtain cluster-robust standard errors. For statistical inference, 95% confidence intervals and p-values were calculated using a t-distribution with K − 1 = 59 degrees of freedom, where K = 60 represents the number of sampling-location clusters.
(2) Multilevel Linear Mixed-Effects Models (LMM): A two-level hierarchical model with individuals (i) nested within sampling locations (j) was specified:
where u0j ∼ N (0, τ00) represents the location-specific random intercept capturing between-location spatial heterogeneity, and eij ∼ N (0, σ2) represents individual-level residual variance.
The 95% confidence intervals were reported for all model specifications. Incremental ΔR2 was calculated for the OLS models only by comparing each interaction model with its corresponding main-effects model. Accordingly, adjusted R2 and incremental ΔR2 are reported only for the OLS specifications.
5. Result
5.1. Characterization of the Thermal Environment in Different Areas of a Waterfront Park
Figure 6 illustrates the variation in five thermal environment factors—solar radiation, relative humidity, air temperature, wind speed, and subsurface temperature—across six typical activity areas in the riverfront park during three time periods: Forenoon, Midday, and Afternoon. The figure indicates that thermal stress is most pronounced during midday hours, with solar radiation, air temperature, and subsurface temperature exhibiting a pattern of increase followed by decrease, while relative humidity displays a decrease followed by an increase. Notably, each thermal environment factor in the WW significantly differs from those in other regions, recording the lowest median values for solar radiation (44.00 W/m2), air temperature (28.60 °C), and subsurface temperature (29.70 °C), alongside the highest median relative humidity (60.70%) in this area. The proximity of the area to a water body, along with the high vegetation cover, may provide some relief from thermal stress. Notably, significant differences were observed in relative humidity, air temperature, and subsurface temperature between the WM and the lawn. Specifically, the median relative humidity (53.10%) and air temperature (30.85 °C) were higher in the WM than in the lawn, while the underlying surface temperature (36.75 °C) was also significantly elevated compared to the lawn. This indicates that the presence of the water body positively influences the thermal environment of the area, despite the use of the same underlying surface temperature. Conversely, the solar radiation (841.00 W/m2) and underlying surface temperature (47.80 °C) in the event plaza were consistently the highest throughout the measurement period, suggesting that this area experienced the most intense heat. In contrast, the WS exhibited lower wind speeds and solar radiation, likely due to the presence of more artificial tents and shelters.
Figure 6.
Thermal environmental factor box–line diagram.
5.2. Analysis of Variance in Thermal Environmental Comfort in Different Areas of a Waterfront Park
The UTCI values for the various activity areas were calculated using Equation (1), followed by box-and-line plot statistics. ANOVA was conducted to compare the differences in UTCI values across the different activity areas throughout the day (e.g., Figure 7). The figure illustrates that the UTCI values for the WW were lower than those of the other zones, most of which experienced moderate to strong heat stress. Additionally, significant differences in UTCI values were observed between the WW and LA (p < 0.001), WM (p < 0.001), ES (p < 0.001), and WS (p < 0.01). Furthermore, the LA and ES exhibited more pronounced fluctuations in UTCI values during midday hours, indicating that these areas have a diminished capacity to mitigate the TE when thermal stress is heightened. The UTCI values recorded at each sampling site within the waterfront ground stall and waterfront walkway exhibited a considerable range of decreases during the afternoon hours, suggesting that the enhancement of thermal comfort was more pronounced in this area compared to others. In contrast, the waterfront meadow experienced peak UTCI values at midday, with over 85% of the readings indicating very high to extreme heat stress levels (ranging from 38 °C to over 46 °C). Additionally, a significant difference (p < 0.01) was observed between the UTCI values of the event WS and the waterfront stand throughout the day, with the WS demonstrating slightly better cooling performance than the event plaza, likely due to its proximity to the water body.
Figure 7.
Characterization of UTCI changes and thermal comfort grading.
5.3. Characteristics of Temperature Distribution in Different Activity Zones of UWP
Global spatial autocorrelation analysis was conducted using thermal imaging data collected by low-level UAVs. Moran’s I index for the underlying surface temperature was significantly positive (p < 0.01) at the 99% confidence level, indicating that these variables are spatially clustered (see Figure 8a). Subsequently, the spatial pattern was visualized through local spatial autocorrelation analysis, where hotspots represent clusters with high underlying surface temperature values, while cold spots indicate clusters with low underlying surface temperature values (see Figure 8b). Overall, there is a distinct differentiation between hot and cold spots, with substantial clusters of cold spots observed on both sides of the waterfront, suggesting a cooling effect of the water body on the TE. It is noteworthy that the LA, ES, and WG areas adjacent to the waterbody did not exhibit significant clusters of cold spots, in contrast to the WW, WM, and WS areas. Furthermore, the Event ES displayed the highest concentration of hotspots, a phenomenon attributed to the extensive hard paving and limited shelter availability in this region. In comparison, the hotspots in the LA and WG were primarily located along the pedestrian walkway, aligning with the anticipated spatial distribution of hot and cold spots.
Figure 8.
Spatial autocorrelation and cluster analysis of underlying surface temperature: (a) Moran’s I-space autocorrelation. (b) Results of hotspot analysis. (c) Clustering and outlier results.
To explore and analyze the differences in the distribution of hot and cold spots within each region, clustering and outlier analysis were employed to characterize the temperature distribution of each area (e.g., Figure 8c). The figure illustrates that High–Low Outliers in the WW, WM, and WS are predominantly located around the walkway and nearby structures. Additionally, the WS exhibits a significant number of Low–High Outliers near the roadside awning. Conversely, the LA, ES, and WG areas demonstrate a substantial presence of Low–High Outliers, further highlighting the cooling effect of the water body on the surrounding environment. Overall, the spatial distribution of hot and cold spots reflects the combined influence of water, vegetation, and surface materials. Cold spots were more evident where proximity to water was accompanied by greater vegetation cover, whereas waterfront areas with greater hard-paved exposure did not consistently exhibit cold-spot clusters. In particular, the concentration of hot spots in the ES corresponded to its extensive hard paving and limited shading.
5.4. Analysis of the Impact of Visual Landscape Factors and the Thermal Environment
5.4.1. Correlation Analysis Between Visual Landscape Factors and Microclimate Factors
The Pearson correlation analysis of visual landscape factors and microclimatic factors (Figure 9) revealed a significant negative correlation between GVI and solar radiation (r = −0.47, p < 0.01). GVI was also significantly negatively correlated with air temperature (r = −0.40, p < 0.05) and underlying surface temperature (r = −0.75, p < 0.001), with the strongest association observed for underlying surface temperature. These findings indicate that higher GVI was associated with lower solar radiation, air temperature, and underlying surface temperature. Meanwhile, SVI was significantly and positively correlated with solar radiation (r = 0.64, p < 0.01), air temperature (r = 0.55, p < 0.01), wind speed (r = 0.45, p < 0.01), and underlying surface temperature (r = 0.68, p < 0.01), suggesting that the lack of shade in open areas leads to an increase in radiant heat, which in turn elevates air temperature. In addition, hardened pavement visibility was significantly and positively correlated with air temperature (r = 0.38, p < 0.01) and subsurface temperature (r = 0.62, p < 0.01), suggesting that hardened paved areas have reduced thermal comfort due to elevated temperatures. Relative humidity was not significantly correlated (p > 0.05) with any of these three landscape factors. Overall, the findings emphasize the importance of different landscape factors in regulating microclimate.
Figure 9.
Correlation between landscape factors and microclimate factors.
5.4.2. Analysis of Differences in Visual Landscape Factors and Thermal Comfort (UTCI) in Different Activity Areas
By analyzing the effects of visual landscape factors on UTCI values across different activity areas during the forenoon (Figure 10a), midday (Figure 10b), and afternoon (Figure 10c), the results indicate that in the WW area, high GVI significantly reduces UTCI values, particularly in the forenoon and afternoon, thereby enhancing TC. Conversely, the Lawn Area (LA) exhibited moderate TC, with elevated UTCI values during midday despite maintaining moderate green visibility; the WM region exhibited high GVI and low UTCI values in the forenoon and afternoon, with a notable increase during the midday hours; however, overall comfort remained moderate. In contrast, the ES region experienced low GVI and high SVI and HPVI, resulting in consistently high UTCI values, particularly during the midday hours, which indicated a significant increase in heat stress. Although the WS region had moderate GVI, the UTCI values were considerably higher due to elevated SVI and HPVI, with peak values observed during midday, reflecting strong heat stress. Conversely, the WG region maintained moderate GVI and SVI, low HPVI, and low UTCI values across all time periods, indicating good TC.
Figure 10.
Visual landscape factors and thermal comfort (UTCI) variance analysis: (a) Forenoon. (b) Midday. (c) Afternoon. (d) All-day UTCI variation (maximum–minimum difference).
The combined all-day data (Figure 10d) revealed significant differences in the maximum and minimum UTCI values across the various activity zones. In the WW zone, the difference was 16.71 °C, indicating that high GVI and low HPVI substantially mitigated the TE. The LA zone exhibited a difference of 16.41 °C, suggesting moderate TC, while the WM zone showed a difference of 13.22 °C, demonstrating that areas with higher GVI provide a more effective cooling effect. Overall, when all regions are considered, the difference between the maximum and minimum UTCI values is the largest, reaching 19.93 °C. This further emphasizes the critical role of diverse visual landscape factors in regulating the TE.
5.4.3. Regression Analysis of Visual Landscape Factors and Thermal Comfort Values
Regression analysis of the relationship between GVI, SVI, and HPVI and UTCI yielded the following results.
(1) The relationship between green ratings and UTCI
By analyzing the relationship between GVI and UTCI values (Figure 11), the results indicate a significant overall negative correlation between GVI and UTCI values. During the forenoon, the influence of GVI on UTCI values was most pronounced (p = 0.000, R2 = 0.29), suggesting that areas with high GVI contribute significantly to cooling effects during this time. The midday period also exhibited a significant negative correlation (p = 0.000, R2 = 0.32), demonstrating that vegetation cover effectively reduces heat stress even at midday, when solar radiation is at its peak. In contrast, the negative correlation observed between GVI and UTCI values during the afternoon hours (afternoon) was relatively weak (p = 0.219, R2 = 0.03). Overall, the findings suggest that increasing GVI significantly mitigates heat stress, particularly during the forenoon and midday hours. To assess the robustness of the pooled relationships to repeated measurements at the same sampling locations, additional models were estimated using observation-period fixed effects and cluster-robust standard errors at the sampling-location level. The results remained consistent with the original analyses. GVI was negatively associated with UTCI (β = −7.634, 95% CI: −9.705 to −5.562, p < 0.001), whereas SVI (β = 18.228, 95% CI: 13.220 to 23.236, p < 0.001) and HPVI (β = 10.275, 95% CI: 5.972 to 14.578, p < 0.001) were positively associated with UTCI. These results indicate that the principal visual–thermal relationships were robust to within-location dependence across the three observation periods.
Figure 11.
Regression analysis of GVI vs. UTCI. Shaded areas denote the 95% confidence band of the linear fit; the statistics refer to the n = 60 sampling points per period (n = 180 for the all-day panel).
(2) Relationship between SVI and UTCI
By analyzing the relationship between SVI and UTCI values (Figure 12), the results revealed a significant positive correlation between these two variables. During the forenoon, SVI had a significant effect on UTCI values (p = 0.000, R2 = 0.30), indicating that areas with high SVI experienced a notable increase in heat stress. In the midday period, the correlation was even stronger (p = 0.000, R2 = 0.38), with regions exhibiting high SVI facing significantly higher heat stress when solar radiation is at its peak. In the afternoon, the effect of SVI on UTCI values remained significant but was weaker (p = 0.005, R2 = 0.13), likely due to the influence of other cooling factors becoming more pronounced. Overall, the results suggest that high SVI significantly contributes to increased heat stress, particularly during midday.
Figure 12.
Regression analysis of SVI and UTCI. Shaded areas denote the 95% confidence band of the linear fit; the statistics refer to the n = 60 sampling points per period (n = 180 for the all-day panel).
(3) Relationship between HPVI and UTCI
By analyzing the relationship between HPVI and UTCI values (Figure 13), the results indicate a significant positive correlation between HPVI and UTCI values. During the forenoon, the effect of HPVI on UTCI values was notable (p = 0.000, R2 = 0.27), suggesting that areas with high HPVI significantly increased heat stress during this time. Similarly, midday also exhibited a significant positive correlation (p = 0.000, R2 = 0.26), with regions characterized by high HPVI experiencing markedly higher heat stress, particularly when solar radiation is at its peak. In contrast, the correlation between HPVI and UTCI values in the afternoon was weaker and statistically insignificant (p = 0.457, R2 = 0.01), likely due to the influence of other cooling factors that became more prominent later in the day. Overall, high HPVI was found to significantly elevate heat stress, especially during the forenoon and midday hours.
Figure 13.
Regression analysis of HPVI vs. UTCI. Shaded areas denote the 95% confidence band of the linear fit; the statistics refer to the n = 60 sampling points per period (n = 180 for the all-day panel).
A cross-period comparison revealed that the relationships of GVI, SVI, and HPVI with UTCI were generally stronger during the forenoon and midday but weakened in the afternoon, with the SVI–UTCI relationship being strongest at midday (R2 = 0.38). This temporal variation indicates that the thermal effects associated with visual landscape characteristics vary over the course of the day.
5.5. Thermal Environment Comfort and Human Thermal Perceived Comfort Analysis
5.5.1. Questionnaire Analysis
By investigating and analyzing the heat perception of individuals in various activity zones, we plotted the percentage distribution of heat perception categories within each zone (Figure 14). The analysis revealed that in the WW area, the categories of “slightly cool,” “cool,” and “very cool” accounted for significant percentages of 52%, 22%, and 3%, respectively. In addition, 17% of respondents reported a neutral thermal sensation. This suggests that the WW area offers good TC and a favorable cooling experience for visitors. In the LA, neutral thermal perception accounted for 38%, followed by “slightly cool” at 25% and “cool” at 20%. Compared to the other areas, the percentages for “cool” and “slightly cool” were relatively high, indicating a comparatively balanced thermal perception pattern. ES presents a more varied distribution of TP, with 45% classified as “slightly warm,” 20% as “neutral,” and 18% as “hot,” indicating that this area exhibited a relatively warmer thermal perception pattern. In the WS area, the proportions of “slightly cool,” “neutral,” and “slightly warm” TP are 32%, 24%, and 30%, respectively. The WG area shows percentages of “slightly cool,” “neutral,” and “slightly warm” perceptions at 34%, 29%, and 31%, respectively. Overall, WW and WM were characterized by relatively cooler thermal perceptions, whereas ES exhibited a greater proportion of warm sensations. LA, WS, and WG showed comparatively mixed thermal perception patterns.
Figure 14.
Questionnaire statistics.
5.5.2. UTCI and TP Voting
By analyzing the relationship between the UTCI and the Mean Thermal Sensation Vote (MTSV), we created a Sankey diagram to illustrate the two (e.g., Figure 15). The figure clearly indicates that the results of various TC votes correspond to different UTCI heat stress categories. The analysis reveals that most votes within the ‘very cool’ and ‘cool’ perceptual states align with UTCI values primarily situated in the ‘moderate heat stress’ category, suggesting that individuals in these regions experience a higher level of perceived TC. Additionally, it is noteworthy that even at elevated UTCI values (i.e., within the ‘strong heat stress’ and ‘very strong heat stress’ categories), a substantial proportion of votes still reflected ‘slightly cool’ or ‘neutral’ TP. This finding indicates a divergence between subjective thermal perception and calculated UTCI-based thermal stress. Under conditions of high heat stress, individuals’ TP did not always correspond closely with UTCI values. Such discrepancies may reflect both individual perceptual responses and uncertainties in UTCI estimation, particularly those associated with the simplified estimation of Tmrt and the use of fixed radiative parameters. Therefore, the observed divergence between UTCI and TP should be interpreted cautiously and should not be attributed solely to the mitigating effects of design or environmental factors.
Figure 15.
UTCI vs. MTSV Sankey diagrams.
5.5.3. Determination of TC Benchmarks
The TC benchmark Tn and NTR were calculated by fitting a linear regression to the MTSV and UTCI values and calculating the value of UTCI for MTSV = 0 and MTSV = [−0.5, 0.5] respectively.
Figure 16 clearly demonstrates a positive correlation between UTCI and TP: as UTCI increases, so does the perceived temperature, indicating that higher UTCI values correspond to hotter perceived temperatures. The very low p-value (<2 × 10⁻¹⁶) and moderate R2 value of 0.5889 further confirm the significance and explanatory power of this linear model. When MTSV is 0, UTCI is 36.456 (indicating strong heat stress); when MTSV ranges from −0.5 to 0.5, UTCI is 34.52 (strong heat stress), and UTCI reaches 38.40 (very strong heat stress).
Figure 16.
Linear fit of UTCI to MTSV.
5.6. Moderating Effects of Visual Landscape Factors on Thermal Perception
The moderating effects of visual landscape factors on the relationship between UTCI and subjective thermal perception (TP) were evaluated using three model specifications: conventional OLS, cluster-robust standard errors (CRSE) at the sampling-location level, and multilevel linear mixed-effects models (LMM) (Table 7). Across the specifications, the interaction estimates retained consistent directions and similar magnitudes, whereas their statistical significance differed after accounting for within-location dependence.
Table 7.
Moderating effects of visual landscape factors.
The UTCI × GVI interaction remained positive (β = 0.1224), suggesting a potentially steeper relationship between UTCI and TP at higher levels of greenery visibility (Figure 17a). Although significant in the conventional OLS model (p = 0.0439), the interaction was no longer statistically significant after clustering by the 60 sampling locations. Its standard error increased from 0.0607 to 0.0682, yielding a cluster-robust 95% CI of −0.014 to 0.259 (p = 0.0782). The LMM produced a similar result (β = 0.1218, 95% CI: −0.010 to 0.254, p = 0.0706). Thus, the positive interaction direction was consistent, but its statistical significance was not robust to dependence adjustment.
Figure 17.
Interaction diagram: (a) moderating effect of the green visual index (GVI); (b) moderating effect of the sky visual index (SVI).
In contrast, the UTCI × SVI interaction remained negative and statistically significant under both dependence-adjusted approaches. The CRSE model yielded β = −0.2594 (95% CI: −0.502 to −0.016, p = 0.0371), while the LMM yielded β = −0.2587 (95% CI: −0.495 to −0.022, p = 0.0322). These results suggest that higher sky visibility was associated with a less steep positive UTCI–TP relationship (Figure 17b), with the negative interaction direction and nominal statistical significance maintained across specifications.
The UTCI × HPVI interaction remained negative but statistically non-significant under both CRSE (β = −0.1479, 95% CI: −0.356 to 0.061, p = 0.161) and LMM (β = −0.1465, 95% CI: −0.349 to 0.056, p = 0.155). Moreover, the incremental explanatory contributions of the three interactions were small (ΔR2 = 0.0056, 0.0068, and 0.0032 for GVI, SVI, and HPVI, respectively). Overall, only the SVI interaction retained nominal statistical significance after accounting for location-level dependence, although the estimated interaction directions were consistent across models.
6. Discussion
6.1. Regional Differences in TE
The results of this study reveal significant differences in TE factors and TC across various areas of the UWP during the summer. These differences reflect the effectiveness of the natural environmental features in mitigating thermal stress [58]. The varying impacts of TE factors associated with different landscape types in distinct spaces contribute to these findings. Specifically, WW, WM, and WG demonstrated more pronounced improvements in TC. This enhancement can be attributed to the connectivity between green spaces and water bodies, which facilitates air circulation and subsequently increases humidity and cooling. Furthermore, the aggregation of cold spots on both sides of the waterfront area underscores the crucial role that water bodies play in lowering ambient temperatures [59]. The “cold island effect” of the water body was diminished in the vicinity of the hard subsurface due to elevated thermal radiation, resulting in significant hotspots concentrated in the active plaza. This observation indicates that the water body is not the sole factor affecting the TE of the waterfront space; other environmental factors also contribute to this dynamic [60]. Furthermore, this study highlights that during the afternoon hours, despite a reduction in thermal stress compared to midday, TC did not improve over time due to insufficient ventilation and inadequate heat dissipation mechanisms in certain areas. This finding underscores the importance of considering the potential impact of the TE on spatial vitality when planning UWP designs [61]. Consequently, the design should leverage the resource endowment of the “cold spots” to create public activity spaces that are conducive to residents’ living and relaxation, thereby enhancing the vitality and sustainability of the area. These findings support H1, confirming significant spatial differences in microclimatic conditions and surface temperatures across functional zones. The contrasting thermal conditions and the distribution of hot and cold spots highlight the spatial heterogeneity of the waterfront park.
6.2. Effects of Visual Landscape Factors on the TE
This study further investigates the specific effects of visual landscape factors on TC in UWP and compares the results across different activity areas. Existing studies indicate that water body area, flow regime, vegetation characteristics (e.g., canopy width and density), and HPVI significantly influence TC [62]. Notably, green visibility has a pronounced effect on the TE, as it reduces both solar radiation and air temperature. These findings align with those of other studies, such as Zölch et al. (2016), which highlight that urban greening significantly mitigates thermal stress in the surrounding areas [45]. While high SVI may enhance visual access, it can simultaneously reduce TC due to increased exposure to solar radiation, a finding consistent with the research conducted by Rossi et al. (2020) [46]. Furthermore, the use of hardened paving materials contributes to elevated air temperatures, thereby diminishing TC [63]. The linear fitting results from this study indicate that greenery and SVI significantly contribute to TC, corroborating previous findings regarding the role of blue-green spaces in enhancing the TE [64]. This underscores the necessity of considering the interplay of various visual landscape factors when planning and designing UWP to optimize the TE. These findings provide support for H2 by demonstrating significant relationships between visual landscape factors and the thermal environment, although the specific effects vary across landscape indices and thermal parameters.
These findings translate into several specific design recommendations for UWPs in the HSCW zone. (1) In hard-paved activity spaces such as the ES, tree canopies or shade structures should be introduced to reduce excessive solar and sky exposure, while extensive exposed paving should be interrupted by vegetation where feasible to mitigate surface heat accumulation. This recommendation is supported by the relatively high thermal stress and pronounced hot-spot patterns observed in hard-paved activity areas. (2) Riparian woodland corridors such as the WW, which combine high vegetation visibility with proximity to water and exhibited relatively favorable thermal conditions, should be conserved and, where appropriate, extended along the shoreline to enhance the combined thermal benefits of vegetation and waterfront environments. (3) Along waterfront walkways (WG) and stall zones (WS), summer shading should be strengthened while maintaining visual and spatial connections to the water. Although the GVI interaction estimate was positive, it was not statistically significant after accounting for within-location dependence. Therefore, these results do not provide robust evidence that greater greenery visibility amplifies the UTCI–TP relationship. Vegetation design should instead prioritize effective physical shading and cooling, ensuring that favorable visual landscape characteristics are accompanied by measurable improvements in the thermal environment.
6.3. Thermal Comfort Benchmarks for UWP
This study elucidates the specificity of TC benchmarking in UWP by providing a comprehensive analysis of the relationship between the UTCI and crowd TP across various areas of these parks. The correlation between UTCI and MTSV indicates that, while higher UTCI values are generally linked to increased perceptions of heat stress, some individuals report experiencing ‘slightly cooler’ or ‘neutral’ thermal sensations even at elevated UTCI levels. Furthermore, although Dujiangyan is located in the HSCW region, the neutral UTCI values recorded in summer significantly differ from findings in other studies conducted within the same climate zone. Dong’s study of Chengdu People’s Park reported a Tn of 24.75 °C (indicating no heat stress) and an NTR of 13.27 °C (also indicating no heat stress) to 27.25 °C (characterized as moderate heat stress) [48]. This presents a significant discrepancy when compared to the Tn of 36.456 °C (indicating strong heat stress), NTR of 34.52 °C (also indicating strong heat stress), and UTCI of 38.40 °C (classified as very strong heat stress) observed in this study. Such differences may be attributed to the higher wind speeds in the waterfront area and the extensive shading provided by numerous trees. This observation aligns with Jianong’s findings, which suggest that respondents’ thermal sensation (MTSV) is influenced by their need for sunlight and wind conditions. Furthermore, psychological attitudes toward these environmental factors, or individuals’ sensitivity to them, appear to have a greater impact than the effect of UTCI [65]. It has been observed that the relationship between the TC and the MTSV in hot outdoor environments remains unclear, particularly when the operating temperature exceeds 34 °C [66]. The findings indicate that while the UTCI, as a quantitative measure of heat stress, effectively captures the overall characteristics of the regional TE, the actual heat perception among the population is influenced by a combination of factors, resulting in a degree of complexity and diversity [67]. This suggests that urban residents in the HSCW region exhibit a significant psychological adaptive capacity to changes in the TE of waterfront spaces. This observation aligns with Huang’s study (2023) [68], which indicates that individuals living in hot climates can tolerate higher temperatures during heat waves.
Compared with a previous study conducted in the same HSCW climate zone, the neutral UTCI obtained in the present study (36.46 °C) is markedly higher than the neutral temperature of 24.75 °C reported for Chengdu People’s Park [48]. A similar difference is evident in the neutral temperature range (NTR): the present study identified an NTR of 34.52–38.40 °C, whereas Wei et al. [48] reported a range of 13.27–27.25 °C. This discrepancy may be related to several context-specific factors, including the cooling and ventilation benefits associated with the waterfront environment, the extensive shading provided by vegetation, and visitors’ psychological adaptation to local summer thermal conditions [65,68]. These physical and psychological factors may contribute to more favorable subjective thermal evaluations despite relatively high levels of objective thermal stress. The relatively high neutral UTCI therefore indicates that visitors accept a physically warm but visually cool and airy environment, rather than a generalized tolerance of heat.
The findings offer a significant reference for future urban planning and environmental design, particularly regarding the enhancement of urban TC and the optimization of landscape layout, which carry important practical implications. Our results establish an empirical foundation for the design of urban green spaces and public areas, highlighting the necessity of integrating various visual landscape factors when planning UWP. Future research should further investigate the effects of different types of blue-green spaces on TC and the variations in thermal perception across different seasonal conditions to improve the quality of TE in urban settings.
6.4. Interpretation and Implications of Visual Landscape–Thermal Perception Interactions
The dependence-adjusted analyses provide a more nuanced understanding of the moderating roles of visual landscape factors in the relationship between objective thermal stress (UTCI) and subjective thermal perception (TP). Although GVI and SVI exhibited opposing interaction directions in the original OLS models, their statistical robustness differed after accounting for the clustering of questionnaire responses within sampling locations. Specifically, the UTCI × GVI interaction remained positive but was no longer statistically significant at the 0.05 level under either cluster-robust inference (β = 0.1224, 95% CI: −0.014 to 0.259, p = 0.0782) or the multilevel mixed-effects model (β = 0.1218, 95% CI: −0.010 to 0.254, p = 0.0706). In contrast, the negative UTCI × SVI interaction retained its nominal statistical significance under both approaches (cluster-robust: β = −0.2594, 95% CI: −0.502 to −0.016, p = 0.0371; multilevel: β = −0.2587, 95% CI: −0.495 to −0.022, p = 0.0322). These findings highlight the importance of distinguishing the direction of estimated interactions from the robustness of their statistical significance.
The observed interaction patterns may reflect the combined influence of physical environmental conditions and potential perceptual processes. GVI and SVI are associated with landscape characteristics such as vegetation cover, shading, solar exposure, spatial openness, and airflow, which may influence local thermal conditions. Meanwhile, previous outdoor thermal comfort studies have suggested that subjective thermal perception may also be shaped by contextual expectations, prior thermal experiences, and adaptive responses [69,70,71]. These considerations provide a plausible theoretical basis for interpreting the observed associations, although the present observational design does not allow physical and psychological mechanisms to be independently identified.
The positive UTCI × GVI interaction suggests that the association between UTCI and subjective TP tended to become steeper as greenery visibility increased. One possible explanation is that individuals in visually greener environments may develop different expectations regarding thermal comfort, potentially influencing their responses to experienced heat stress. However, because the GVI interaction was not statistically significant after accounting for within-location dependence, this interpretation remains tentative and should not be regarded as evidence of an established moderating mechanism. By comparison, the negative UTCI × SVI interaction suggests that the relationship between UTCI and TP became less steep at higher levels of sky visibility. The consistency of this negative association and its nominal statistical significance across the dependence-adjusted models provides comparatively stronger support for an SVI-related moderating association. Nevertheless, this finding does not establish that greater sky visibility directly reduces perceived heat stress through psychological processes, because physical factors such as solar exposure, airflow, and spatial openness were not experimentally separated.
Overall, H3 received partial support. The predicted positive interaction involving GVI and negative interaction involving SVI were both observed, but only the SVI interaction retained nominal statistical significance after accounting for location-level dependence. The UTCI × HPVI interaction remained statistically non-significant under both the cluster-robust and multilevel specifications. Furthermore, the incremental explanatory contributions of the interaction terms were small (ΔR2 = 0.0056 for GVI, 0.0068 for SVI, and 0.0032 for HPVI), indicating that the identified moderation patterns explain only limited additional variation in subjective thermal perception. Therefore, the findings should be interpreted as modest visual–thermal associations rather than evidence of strong causal or exclusively psychological moderating mechanisms. These results suggest that climate-responsive waterfront landscape planning should consider the interplay between visual landscape composition, objective thermal conditions, and subjective thermal experiences, while recognizing the need for further research to clarify the underlying mechanisms.
6.5. Research Limitations and Future Research Directions
This study presents intriguing findings regarding the effects of visual landscape factors on TC in UWP; however, several limitations warrant consideration. (1) This study primarily relied on field measurements for data collection, which may have resulted in a limited sample size. Future research could consider integrating remote sensing data and big data analytics to capture a broader spectrum of environmental information, thereby enhancing the representativeness of the research conclusions and the robustness of the data. (2) Seasonal variations significantly influence the TP of individuals, and it is essential for future research to encompass data collection across all four seasons to achieve a more comprehensive understanding of how visual landscape factors affect TC. (3) Additionally, the study did not fully account for the diversity of crowd characteristics when analyzing TP. Subsequent research should focus on groups of varying ages, health conditions, and cultural backgrounds to enhance the understanding and improvement of the urban TE. (4) This study concentrated on a single UWP; however, the transferability and generalizability of these intriguing findings remain uncertain. This uncertainty represents a fundamental criticism of the case study approach [48]. To address this limitation, future research should incorporate multiple datasets from various parks to facilitate comparative analyses and draw more compelling conclusions. In addition, uncertainty in Tmrt estimation associated with the use of fixed radiative parameters may propagate into the calculated UTCI values and should be considered when interpreting discrepancies between UTCI and subjective thermal perception.
Furthermore, while the visual landscape indices, UAV thermal remote sensing data, and on-site microclimate measurements were collected within a concentrated 10-day heatwave period under relatively stable synoptic conditions, slight day-to-day meteorological variations may still have introduced temporal uncertainty. Although subjective thermal perceptions and microclimatic variables were simultaneously matched at the sampling points, future studies could employ synchronized multi-sensor monitoring, potentially combined with UAV-based observations, to improve temporal synchronization and spatial coverage across the entire park.
7. Conclusions
This study employed a combination of meteorological field measurements and subjective questionnaires to investigate the effects of various visual landscape factors in UWP on TC and crowd TP. The primary findings of this study are as follows:
(1) The ‘cold spots’ in the waterfront area are concentrated along the water bodies and green belts. Significant differences were observed in thermal environmental factors and TC across different areas of the UWP during the summer. Specifically, the WW, WM, and WG demonstrated more pronounced effects on enhancing TC. Furthermore, notable variations in thermal environmental factors and TC were identified across different areas and time periods.
(2) It was observed that various visual landscape factors, such as GVI, SVI, and HPVI, exhibited differing correlations with thermal environmental factors, and their impacts on TC varied across different time periods. Specifically, GVI was negatively correlated with several thermal environment factors, whereas SVI and HPVI demonstrated positive correlations. Additionally, the linear fitting results of this study indicated that both GVI and SVI had higher explanatory power regarding TC.
(3) Yihu Park in Dujiangyan City is located in the HSCW area, with a neutral summer temperature Tn = 36.456 °C (UTCI) and NTR = [34.52–38.40 °C] (UTCI), revealing the specificity of the TC benchmarks for waterfront parks.
(4) People’s actual TP in the UWP was overall superior to the UTCI values, suggesting that subjective thermal perception did not always correspond directly to UTCI-based thermal stress and may also be influenced by environmental and perceptual factors.
(5) After accounting for within-location dependence across 60 sampling locations, the UTCI × SVI interaction remained negative and statistically significant under both CRSE (β = −0.2594, 95% CI: −0.502 to −0.016, p = 0.0371) and LMM (p = 0.0322). In contrast, the UTCI × GVI interaction remained positive but was not statistically significant (β = 0.1224, 95% CI: −0.014 to 0.259, p = 0.0782 under CRSE; p = 0.0706 under LMM). The UTCI × HPVI interaction remained non-significant under both approaches. Despite consistent interaction directions across models, only SVI retained nominal statistical significance. Given the small incremental explanatory contributions (ΔR2 < 1% for each interaction), visual landscape characteristics should be considered supplementary modifiers of thermal perception rather than substitutes for physical microclimate cooling strategies.
Taken together, this study advances the understanding of outdoor thermal comfort by integrating visual landscape characteristics into the relationship between objective thermal stress and subjective thermal perception. The dependence-adjusted analyses provide consistent evidence for a negative moderating association involving sky visibility, while suggesting a potential, albeit statistically uncertain, positive interaction involving greenery visibility. These findings extend the discussion of urban heat mitigation beyond physical temperature reduction by highlighting the potential perceptual dimension of landscape design. From a planning perspective, they underscore the value of integrating visual landscape composition, shading, spatial openness, and microclimatic optimization to create more comfortable and climate-resilient urban waterfront spaces.
Author Contributions
Conceptualization, Y.S., K.D., G.Z., and J.W.; Methodology, Y.S., K.D., and J.W.; formal analysis, Y.S., K.D., G.Z., and J.W.; investigation, Y.S., K.D., and G.Z.; Resources, Y.S., K.D., and J.W.; Data curation, Y.S., K.D., and J.W.; writing—original draft, Y.S., K.D., G.Z., and J.W.; writing—review and editing, Y.S., K.D., G.Z., and J.W.; visualization, K.D., G.Z., and J.W.; supervision, Y.S., and J.W.; Project administration, Y.S., and J.W.; Funding acquisition, Y.S.; All authors have read and agreed to the published version of the manuscript.
Funding
We would like to acknowledge support from the National Natural Science Foundation of China (Grant No. 42301280), the Youth Project of Sichuan Natural Science Foundation (Grant No.2025ZNSFSC1147), the Research Center for Strengthening the Awareness of the Chinese Nation Community, Sichuan Minzu University, Key Project (Grant No.2026MYZLZD01), 2026 Chengdu Philosophy and Social Sciences Planning Project, General Project (Grant No.2026CS109).
Institutional Review Board Statement
We refer to the “Notice on Issuing the Measures for Ethical Review of Life Sciences and Medical Research Involving Humans” (No. 4 [2023]) jointly released by the National Health Commission, the Ministry of Education, the Ministry of Science and Technology, and the National Administration of Traditional Chinese Medicine. Article 32 of Chapter III stipulates that ethical review may be exempted for research involving human information or biospecimens under certain conditions, including when the study “causes no harm to human subjects, involves no sensitive personal information or commercial interests,” with the aim of reducing unnecessary burden on researchers. Our manuscript complies with Item 2 of Article 32, which applies to “research using anonymized information data,” and is therefore eligible for exemption from ethical approval.
Informed Consent Statement
Informed consent was obtained from all participants involved in the study.
Data Availability Statement
The survey data for this study were collected through on-site fieldwork and questionnaires, and can be obtained by communicating with the authors if genuinely needed.
Acknowledgments
We would like to thank the anonymous reviewers for constructive comments that significantly improved this article.
Conflicts of Interest
The authors declare no conflict of interest.
Appendix A
Human thermal perception comfort questionnaire scale.
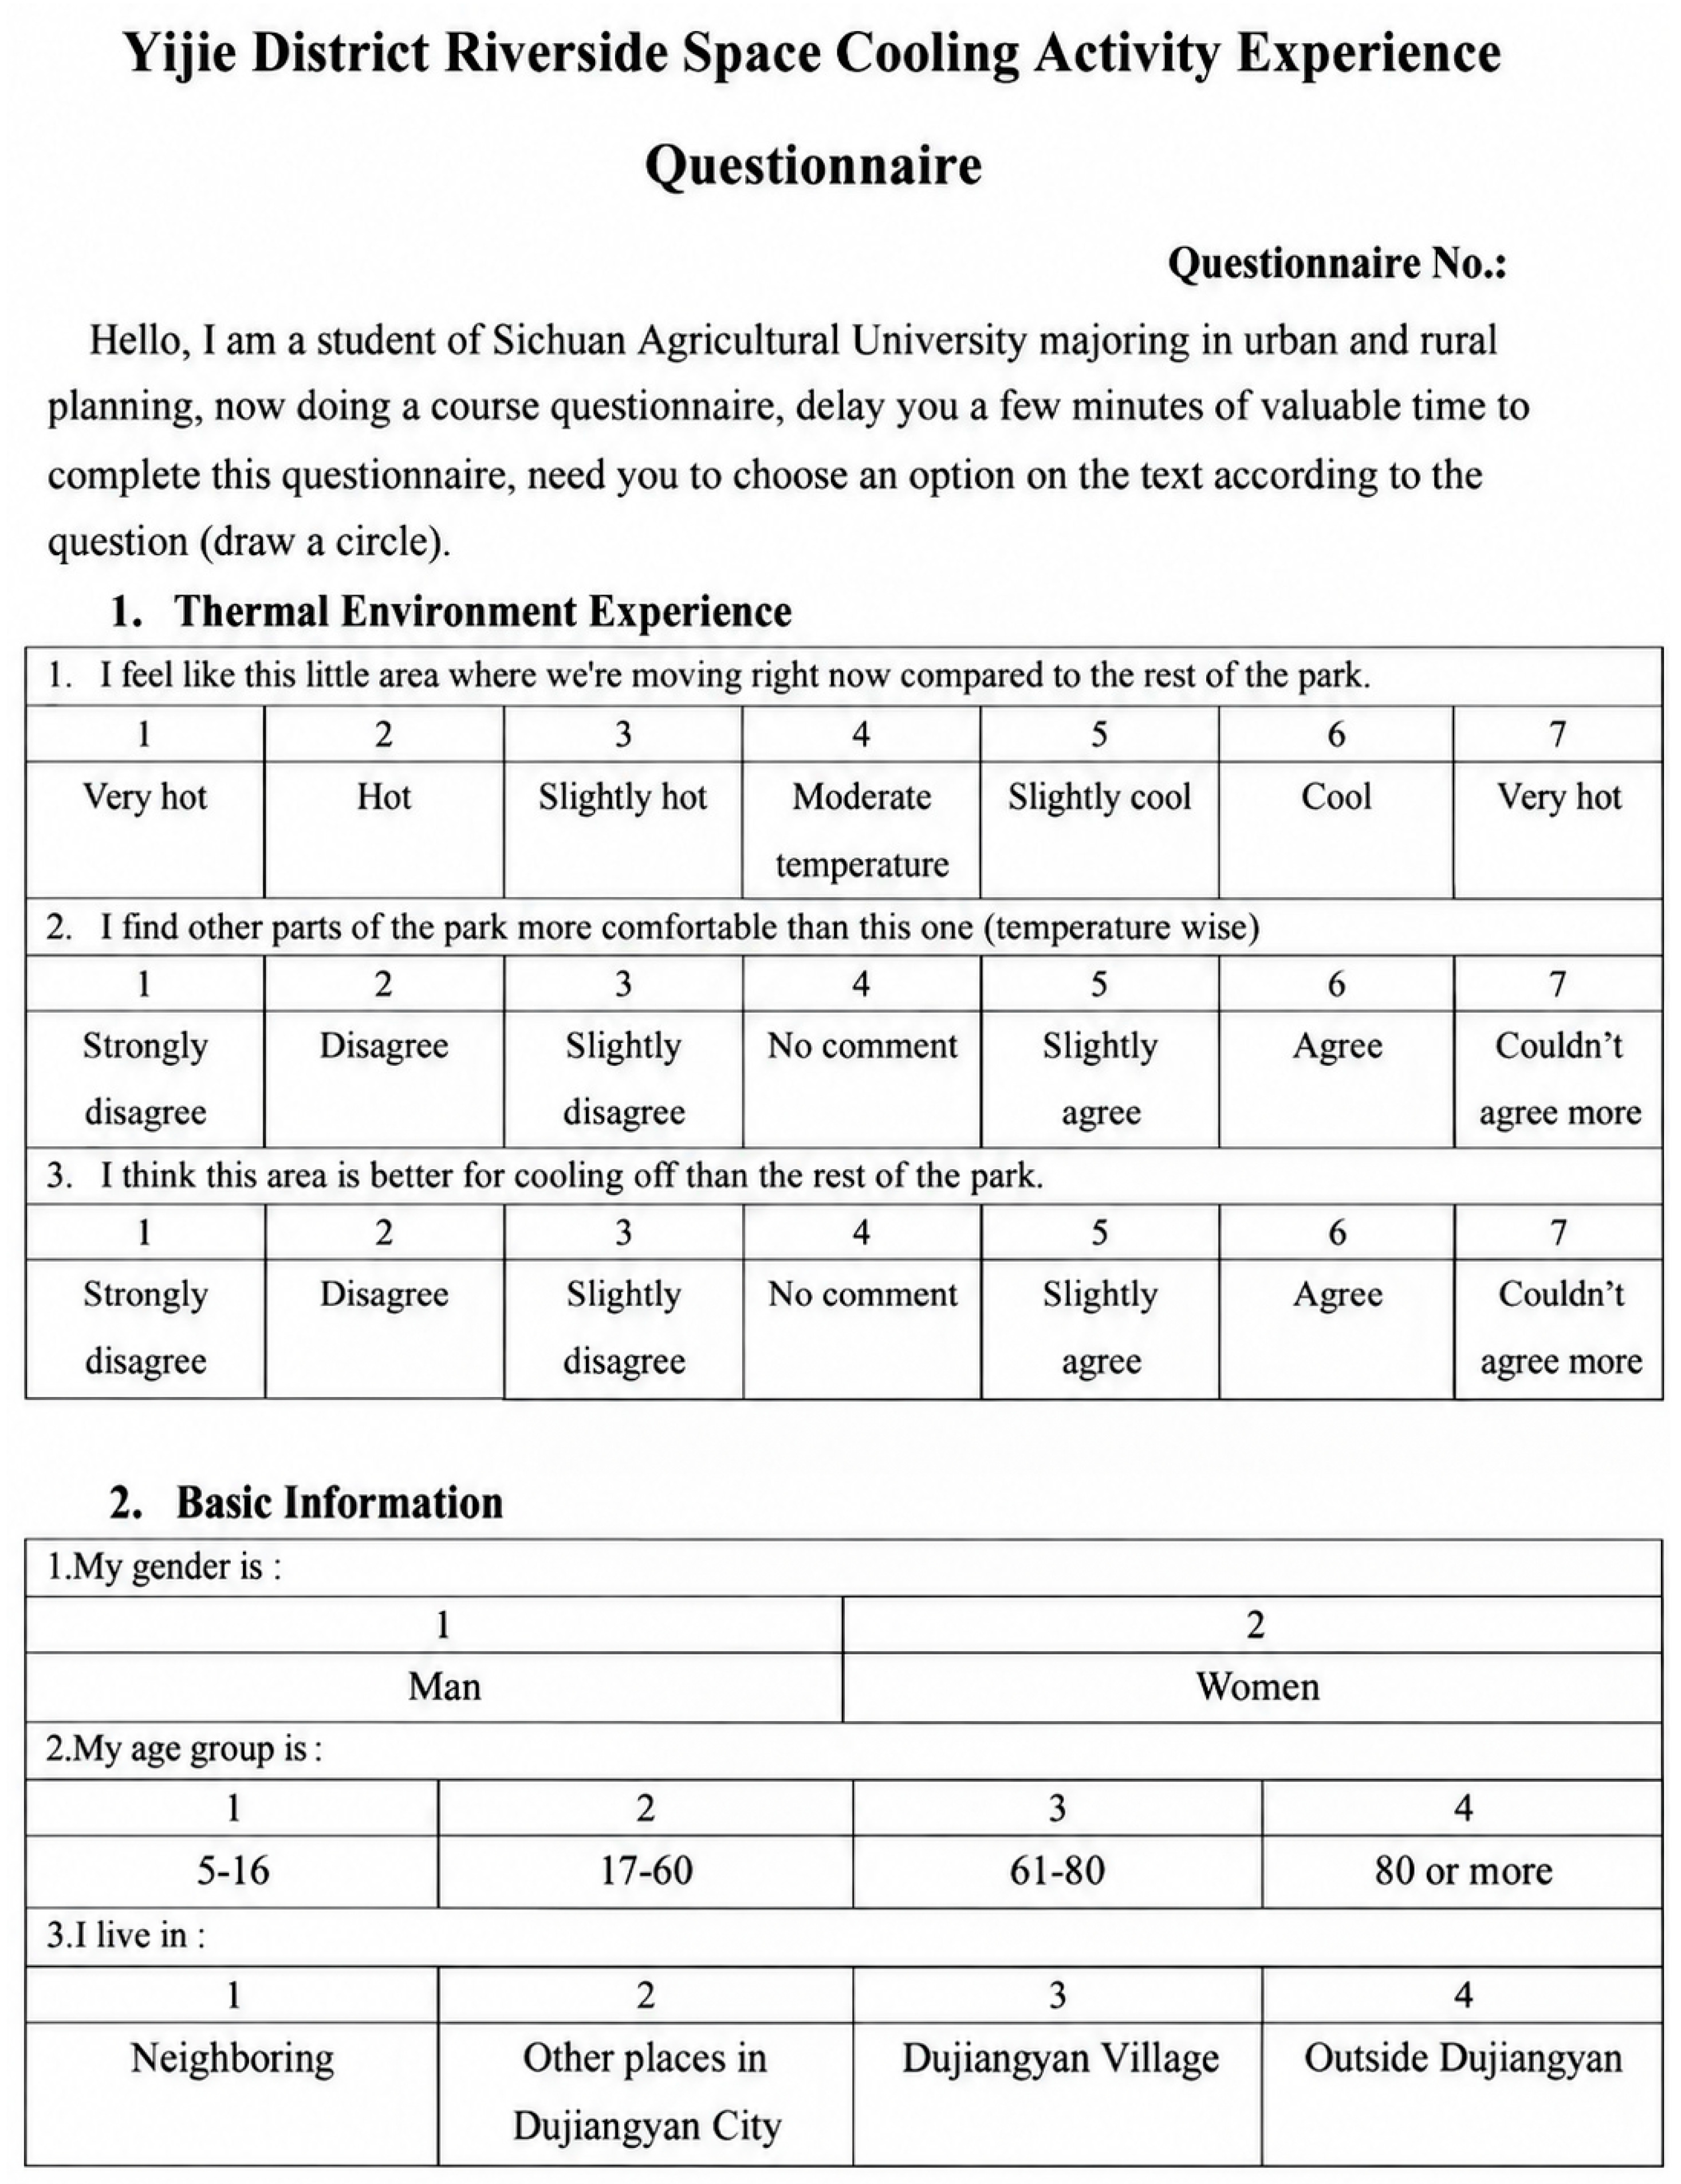
Appendix B
| Abbreviations | |||
| UHI | Urban Heat Island | UTCI | Universal Thermal Climate Index |
| TE | Thermal Environment | WW | Waterfront Woodland |
| TC | Thermal Comfort | LA | Lawn Area |
| UWP | Urban Waterfront Parks | WM | Waterside Meadow |
| GVI | Green View Index | ES | Event Square |
| SVI | Sky View Index | WS | Waterside Stalls |
| HPVI | Hardened Pavement Visual Index | WG | Waterside Greenway |
| HTC | Human thermal comfort | MTSV | Mean Thermal Sensation Vote |
| Ta | Air temperature | TP | Thermal Perception |
| Tn | Neutral temperature | S | Solar radiation intensity |
| ε | Longwave emissivity | Vm | Wind speed at the measurement height |
| σ | Stefan Boltzmann constant | m | Wind speed measurement height |
| α | Shortwave absorptivity | Z0 | The roughness length, which for urban street environments takes the value of 0.01 m |
References
- Usman, M.; Nichol, J.E.; Abdallah, A.M.; Bilal, M. Characterising the Urban Heat Island in a low-rise indigenous city using remote sensing. Urban Clim. 2025, 61, 102433. [Google Scholar] [CrossRef] [Scilit]
- Wang, S.; Zhan, W.; Zhou, B.; Tong, S.; Chakraborty, T.; Wang, Z.; Huang, K.; Du, H.; Middel, A.; Li, J. Dual impact of global urban overheating on mortality. Nat. Clim. Change 2025, 15, 497–504. [Google Scholar] [CrossRef] [Scilit]
- Cai, M.; Li, M.; Liu, H. Optimizing cooling efficiency of urban greenspaces across local climate zones in Wuhan, China. Urban For. Urban Green. 2025, 105, 128691. [Google Scholar] [CrossRef] [Scilit]
- Guan, S.; Hu, H. Exploring the potential relationship between cooling green space and built-up area: Analysis of community green space characteristics based on GWPCA. Build. Environ. 2025, 267, 112190. [Google Scholar] [CrossRef] [Scilit]
- Nikolopoulou, M.; Steemers, K. Thermal comfort and psychological adaptation as a guide for designing urban spaces. Energy Build. 2003, 35, 95–101. [Google Scholar] [CrossRef] [Scilit]
- Motzkin, T.; Svoray, T.; Erell, E. The complex effect of vegetation on thermal stress-real or imaginary? Measuring the psychological effect of vegetation. Urban Clim. 2025, 63, 102598. [Google Scholar] [CrossRef] [Scilit]
- Wang, Y.; Liu, X.; Xie, R.; Wang, J.; Dong, Q.; Yao, W.; Lin, D. Thermal comfort and urban microclimate response: A new thermal environment assessment model for waterfront spaces in historic ancient towns. Energy Build. 2025, 331, 115393. [Google Scholar] [CrossRef] [Scilit]
- Mei, Y.; Lu, J.; Han, D.; Xu, L.; Han, Y. Research on the spatial form effects of thermal comfort on urban waterfront trails in summer–a case study of West Lake in Hangzhou, China. J. Asian Archit. Build. Eng. 2024, 23, 773–788. [Google Scholar] [CrossRef] [Scilit]
- Chen, C.; Feng, X.; Yao, J.; Xiong, X. Perceived leisure service benefits of peri-urban community green Spaces: Impact of visual environment during day and night. Landsc. Urban Plan. 2025, 259, 105338. [Google Scholar] [CrossRef] [Scilit]
- Chen, X.; Wang, H.; Yang, J. Effect of green blue spaces on the urban thermal environment: A field study in Hong Kong. Urban Clim. 2024, 55, 101912. [Google Scholar] [CrossRef] [Scilit]
- Lin, Z.; Xu, H.; Yao, X.; Yang, C.; Yang, L. Exploring the relationship between thermal environmental factors and land surface temperature of a “furnace city” based on local climate zones. Build. Environ. 2023, 243, 110732. [Google Scholar] [CrossRef] [Scilit]
- Shamsaei, M.; Carter, A.; Vaillancourt, M. A review on the heat transfer in asphalt pavements and urban heat island mitigation methods. Constr. Build. Mater. 2022, 359, 129350. [Google Scholar] [CrossRef] [Scilit]
- Lau, K.K.-L.; Choi, C.Y. The influence of perceived aesthetic and acoustic quality on outdoor thermal comfort in urban environment. Build. Environ. 2021, 206, 108333. [Google Scholar] [CrossRef] [Scilit]
- Urban, J.; Pikl, M.; Zemek, F.; Novotný, J. Using Google Street View photographs to assess long-term outdoor thermal perception and thermal comfort in the urban environment during heatwaves. Front. Environ. Sci. 2022, 10, 878341. [Google Scholar] [CrossRef] [Scilit]
- Pistore, L.; Pasut, W. Roots and mechanisms of thermal comfort expectations: From individuals’ own background to adaptation and change. In Proceedings of the International Conference on Building Energy and Environment; Springer: Singapore, 2022; pp. 2325–2336. [Google Scholar]
- Kim, S.W.; Brown, R.D. Urban heat island (UHI) intensity and magnitude estimations: A systematic literature review. Sci. Total Environ. 2021, 779, 146389. [Google Scholar] [CrossRef] [Scilit] [PubMed]
- Henao, J.J.; Rendón, A.M.; Salazar, J.F. Trade-off between urban heat island mitigation and air quality in urban valleys. Urban Clim. 2020, 31, 100542. [Google Scholar] [CrossRef] [Scilit]
- Hsu, A.; Sheriff, G.; Chakraborty, T.; Manya, D. Disproportionate exposure to urban heat island intensity across major US cities. Nat. Commun. 2021, 12, 2721. [Google Scholar] [CrossRef] [Scilit] [PubMed]
- Hu, L.; Li, Q. Greenspace, bluespace, and their interactive influence on urban thermal environments. Environ. Res. Lett. 2020, 15, 034041. [Google Scholar] [CrossRef] [Scilit]
- Lin, Y.; Wang, Z.; Jim, C.Y.; Li, J.; Deng, J.; Liu, J. Water as an urban heat sink: Blue infrastructure alleviates urban heat island effect in mega-city agglomeration. J. Clean. Prod. 2020, 262, 121411. [Google Scholar] [CrossRef] [Scilit]
- Li, Z.; Zheng, H. Cooling and humidification effects of coniferous and broad-leaved plant communities in urban park. Build. Environ. 2023, 245, 110892. [Google Scholar] [CrossRef] [Scilit]
- Jiang, Y.; Jiang, S.; Shi, T. Comparative study on the cooling effects of green space patterns in waterfront build-up blocks: An experience from Shanghai. Int. J. Environ. Res. Public Health 2020, 17, 8684. [Google Scholar] [CrossRef] [Scilit] [PubMed]
- Song, X.; Liu, J.; Zhao, Y. Effect of design factors on the thermal environment in the waterfront area. Procedia Eng. 2017, 205, 2677–2682. [Google Scholar] [CrossRef] [Scilit]
- Xu, H.; Zheng, G.; Lin, X.; Jin, Y. Study on the Microclimatic Effects of Plant-Enclosure Conditions and Water–Green Space Ratio on Urban Waterfront Spaces in Summer. Sustainability 2024, 16, 2957. [Google Scholar] [CrossRef] [Scilit]
- Badach, J.; Raszeja, E. Developing a framework for the implementation of landscape and greenspace indicators in sustainable urban planning. Waterfr. Landsc. Manag. Case Stud. Gdańsk Poznań Bristol Sustain. 2019, 11, 2291. [Google Scholar] [CrossRef] [Scilit]
- Wang, J.; Wang, Z.; de Dear, R.; Luo, M.; Ghahramani, A.; Lin, B. The uncertainty of subjective thermal comfort measurement. Energy Build. 2018, 181, 38–49. [Google Scholar] [CrossRef] [Scilit]
- Wang, Z.; de Dear, R.; Luo, M.; Lin, B.; He, Y.; Ghahramani, A.; Zhu, Y. Individual difference in thermal comfort: A literature review. Build. Environ. 2018, 138, 181–193. [Google Scholar] [CrossRef] [Scilit]
- Klemm, W.; Heusinkveld, B.G.; Lenzholzer, S.; Jacobs, M.H.; Van Hove, B. Psychological and physical impact of urban green spaces on outdoor thermal comfort during summertime in The Netherlands. Build. Environ. 2015, 83, 120–128. [Google Scholar] [CrossRef] [Scilit]
- Niu, J.; Xiong, J.; Qin, H.; Hu, J.; Deng, J.; Han, G.; Yan, J. Influence of thermal comfort of green spaces on physical activity: Empirical study in an urban park in Chongqing, China. Build. Environ. 2022, 219, 109168. [Google Scholar] [CrossRef] [Scilit]
- Aram, F.; Solgi, E.; Baghaee, S.; García, E.H.; Mosavi, A.; Band, S.S. How parks provide thermal comfort perception in the metropolitan cores; a case study in Madrid Mediterranean climatic zone. Clim. Risk Manag. 2020, 30, 100245. [Google Scholar] [CrossRef] [Scilit]
- Peng, Z.; Bardhan, R.; Ellard, C.; Steemers, K. Urban climate walk: A stop-and-go assessment of the dynamic thermal sensation and perception in two waterfront districts in Rome, Italy. Build. Environ. 2022, 221, 109267. [Google Scholar] [CrossRef] [Scilit]
- Chen, L.; Ng, E. Outdoor thermal comfort and outdoor activities: A review of research in the past decade. Cities 2012, 29, 118–125. [Google Scholar] [CrossRef] [Scilit]
- Zabetian, E.; Kheyroddin, R. Comparative evaluation of relationship between psychological adaptations in order to reach thermal comfort and sense of place in urban spaces. Urban Clim. 2019, 29, 100483. [Google Scholar] [CrossRef] [Scilit]
- Manavvi, S.; Rajasekar, E. Evaluating outdoor thermal comfort in “Haats”—The open air markets in a humid subtropical region. Build. Environ. 2021, 190, 107527. [Google Scholar] [CrossRef] [Scilit]
- Haupt, C.; Huber, A.B. How axons see their way–axonal guidance in the visual system. Front Biosci. 2008, 13, 3136–3149. [Google Scholar] [CrossRef] [Scilit] [PubMed]
- Reyes-Riveros, R.; Altamirano, A.; De La Barrera, F.; Rozas-Vásquez, D.; Vieli, L.; Meli, P. Linking public urban green spaces and human well-being: A systematic review. Urban For. Urban Green. 2021, 61, 127105. [Google Scholar] [CrossRef] [Scilit]
- Javadi, R.; Nasrollahi, N. Urban green space and health: The role of thermal comfort on the health benefits from the urban green space; a review study. Build. Environ. 2021, 202, 108039. [Google Scholar] [CrossRef] [Scilit]
- Lam, C.K.C.; Yang, H.; Yang, X.; Liu, J.; Ou, C.; Cui, S.; Kong, X.; Hang, J. Cross-modal effects of thermal and visual conditions on outdoor thermal and visual comfort perception. Build. Environ. 2020, 186, 107297. [Google Scholar] [CrossRef] [Scilit]
- Rakotoarivelo, T.; Malet-Damour, B. Exploring the Interplay between Thermal and Visual Perception: A Critical Review of Studies from 1926 to 2022. Buildings 2023, 13, 879. [Google Scholar] [CrossRef] [Scilit]
- Klemm, W.; Heusinkveld, B.G.; Lenzholzer, S.; van Hove, B. Street greenery and its physical and psychological impact on thermal comfort. Landsc. Urban Plan. 2015, 138, 87–98. [Google Scholar] [CrossRef] [Scilit]
- Zhang, T.; Hong, B.; Su, X.; Li, Y.; Song, L. Effects of tree seasonal characteristics on thermal-visual perception and thermal comfort. Build. Environ. 2022, 212, 108793. [Google Scholar] [CrossRef] [Scilit]
- Auer, M.R. Environmental aesthetics in the age of climate change. Sustainability 2019, 11, 5001. [Google Scholar] [CrossRef] [Scilit]
- Lyu, K.; de Dear, R.; Brambilla, A.; Globa, A. Restorative benefits of semi-outdoor environments at the workplace: Does the thermal realm matter? Build. Environ. 2022, 222, 109355. [Google Scholar] [CrossRef] [Scilit]
- Zhang, T.; Su, M.; Hong, B.; Wang, C.; Li, K. Interaction of emotional regulation and outdoor thermal perception: A pilot study in a cold region of China. Build. Environ. 2021, 198, 107870. [Google Scholar] [CrossRef] [Scilit]
- Zölch, T.; Maderspacher, J.; Wamsler, C.; Pauleit, S. Using green infrastructure for urban climate-proofing: An evaluation of heat mitigation measures at the micro-scale. Urban For. Urban Green. 2016, 20, 305–316. [Google Scholar] [CrossRef] [Scilit]
- Rossi, F.; Cardinali, M.; Gambelli, A.M.; Filipponi, M.; Castellani, B.; Nicolini, A. Outdoor thermal comfort improvements due to innovative solar awning solutions: An experimental campaign. Energy Build. 2020, 225, 110341. [Google Scholar] [CrossRef] [Scilit]
- GB 50176-2016; Code for Thermal Design of Civil Building. China Architecture & Building Press: Beijing, China, 2016.
- Wei, D.; Yang, L.; Bao, Z.; Lu, Y.; Yang, H. Variations in outdoor thermal comfort in an urban park in the hot-summer and cold-winter region of China. Sustain. Cities Soc. 2022, 77, 103535. [Google Scholar] [CrossRef] [Scilit]
- Petralli, M.; Massetti, L.; Pearlmutter, D.; Brandani, G.; Messeri, A.; Orlandini, S. UTCI field measurements in an urban park in Florence (Italy). Misc. Geogr. 2020, 24, 111–117. [Google Scholar] [CrossRef] [Scilit]
- Zhao, X.; Xu, G.; Wu, Y.; Dong, L. Effects of Summer Microclimate on Residents’ Activities in Outdoor Public Space: A Study in Nanning. Build. Sci. 2018, 34, 18–24. [Google Scholar]
- Morris, C.; Simmonds, I.; Plummer, N. Quantification of the influences of wind and cloud on the nocturnal urban heat island of a large city. J. Appl. Meteorol. 2001, 40, 169–182. [Google Scholar] [CrossRef] [Scilit]
- Tumanov, S.; Stan-Sion, A.; Lupu, A.; Soci, C.; Oprea, C. Influences of the city of Bucharest on weather and climate parameters. Atmos. Environ. 1999, 33, 4173–4183. [Google Scholar] [CrossRef] [Scilit]
- Zhou, H.; Pu, H.; Cui, L.; Zhou, F.; Sun, J. Urban thermal environment effects based on visual indices: A case study in Xuzhou City, China. Chin. J. Appl. Ecol. 2022, 33, 2213–2220. [Google Scholar] [CrossRef] [Scilit] [PubMed]
- Park, S.; Tuller, S.E.; Jo, M. Application of Universal Thermal Climate Index (UTCI) for microclimatic analysis in urban thermal environments. Landsc. Urban Plan. 2014, 125, 146–155. [Google Scholar] [CrossRef] [Scilit]
- Havenith, G.; Fiala, D.; Błazejczyk, K.; Richards, M.; Bröde, P.; Holmér, I.; Rintamaki, H.; Benshabat, Y.; Jendritzky, G. The UTCI-clothing model. Int. J. Biometeorol. 2012, 56, 461–470. [Google Scholar] [CrossRef] [Scilit] [PubMed]
- Bröde, P.; Fiala, D.; Błażejczyk, K.; Holmér, I.; Jendritzky, G.; Kampmann, B.; Tinz, B.; Havenith, G. Deriving the operational procedure for the Universal Thermal Climate Index (UTCI). Int. J. Biometeorol. 2012, 56, 481–494. [Google Scholar] [CrossRef] [Scilit] [PubMed]
- Huang, B.; Hong, B.; Tian, Y.; Yuan, T.; Su, M. Outdoor thermal benchmarks and thermal safety for children: A study in China’s cold region. Sci. Total Environ. 2021, 787, 147603. [Google Scholar] [CrossRef] [Scilit]
- Xu, M.; Hong, B.; Mi, J.; Yan, S. Outdoor thermal comfort in an urban park during winter in cold regions of China. Sustain. Cities Soc. 2018, 43, 208–220. [Google Scholar] [CrossRef] [Scilit]
- Jiang, Y.-F.; Huang, J. Quantitative Analysis of Mitigation Effect of Urban Blue-Green Spaces on Urban Heat lsland. Resour. Environ. Yangtze Basin 2022, 31, 2060–2072. [Google Scholar]
- Bian, Q.; Zhao, X.; Liu, X. Progress and Prospects of Waterscape Climate Regulation Researches. Landsc. Archit. 2020, 27, 88–94. [Google Scholar]
- Yuan, J.; Dong, X.; Qu, T. Health Oriented Waterfront Space Research Progress and Prospects. Planners 2021, 37, 51–60. [Google Scholar]
- Zhang, Y.; Huang, Y. Review on the Influencing Factors of Microclimate Effect in Urban Waterfront Park. Urban. Archit. 2021, 18, 172–174. [Google Scholar]
- Lu, X.; Li, Q.; Tang, P.; Li, Q.; Zhao, L. Effect of heat mitigation strategies on the thermal environment of hardened pavement and pedestrian thermal comfort in a hot and humid area: A case study of Guangzhou, China. J. Clean. Prod. 2023, 427, 139089. [Google Scholar] [CrossRef] [Scilit]
- Chen, T.; Tan, N. Analysis of Urban Thermal Environment Improved by Blue-Green Space on the Landsat Data: A Case Study on Tianjin. J. South Archit. 2022, 19–27. [Google Scholar]
- Li, J.; Niu, J.; Mak, C.M.; Huang, T.; Xie, Y. Assessment of outdoor thermal comfort in Hong Kong based on the individual desirability and acceptability of sun and wind conditions. Build. Environ. 2018, 145, 50–61. [Google Scholar] [CrossRef] [Scilit]
- Fang, Z.; Feng, X.; Liu, J.; Lin, Z.; Mak, C.M.; Niu, J.; Tse, K.-T.; Xu, X. Investigation into the differences among several outdoor thermal comfort indices against field survey in subtropics. Sustain. Cities Soc. 2019, 44, 676–690. [Google Scholar] [CrossRef] [Scilit]
- Xu, T.; Yao, R.; Du, C.; Li, B. Outdoor thermal perception and heatwave adaptation effects in summer–A case study of a humid subtropical city in China. Urban Clim. 2023, 52, 101724. [Google Scholar] [CrossRef] [Scilit]
- Huang, X.; Yao, R.; Xu, T.; Zhang, S. The impact of heatwaves on human perceived thermal comfort and thermal resilience potential in urban public open spaces. Build. Environ. 2023, 242, 110586. [Google Scholar] [CrossRef] [Scilit]
- Chen, X.; Gao, L.; Xue, P.; Du, J.; Liu, J. Investigation of outdoor thermal sensation and comfort evaluation methods in severe cold area. Sci. Total Environ. 2020, 749, 141520. [Google Scholar] [CrossRef] [Scilit] [PubMed]
- Yung, E.H.K.; Wang, S.; Chau, C.-K. Thermal perceptions of the elderly, use patterns and satisfaction with open space. Landsc. Urban Plan. 2019, 185, 44–60. [Google Scholar] [CrossRef] [Scilit]
- Lin, T.-P. Thermal perception, adaptation and attendance in a public square in hot and humid regions. Build. Environ. 2009, 44, 2017–2026. [Google Scholar] [CrossRef] [Scilit]
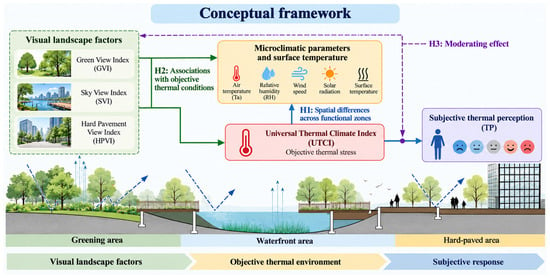
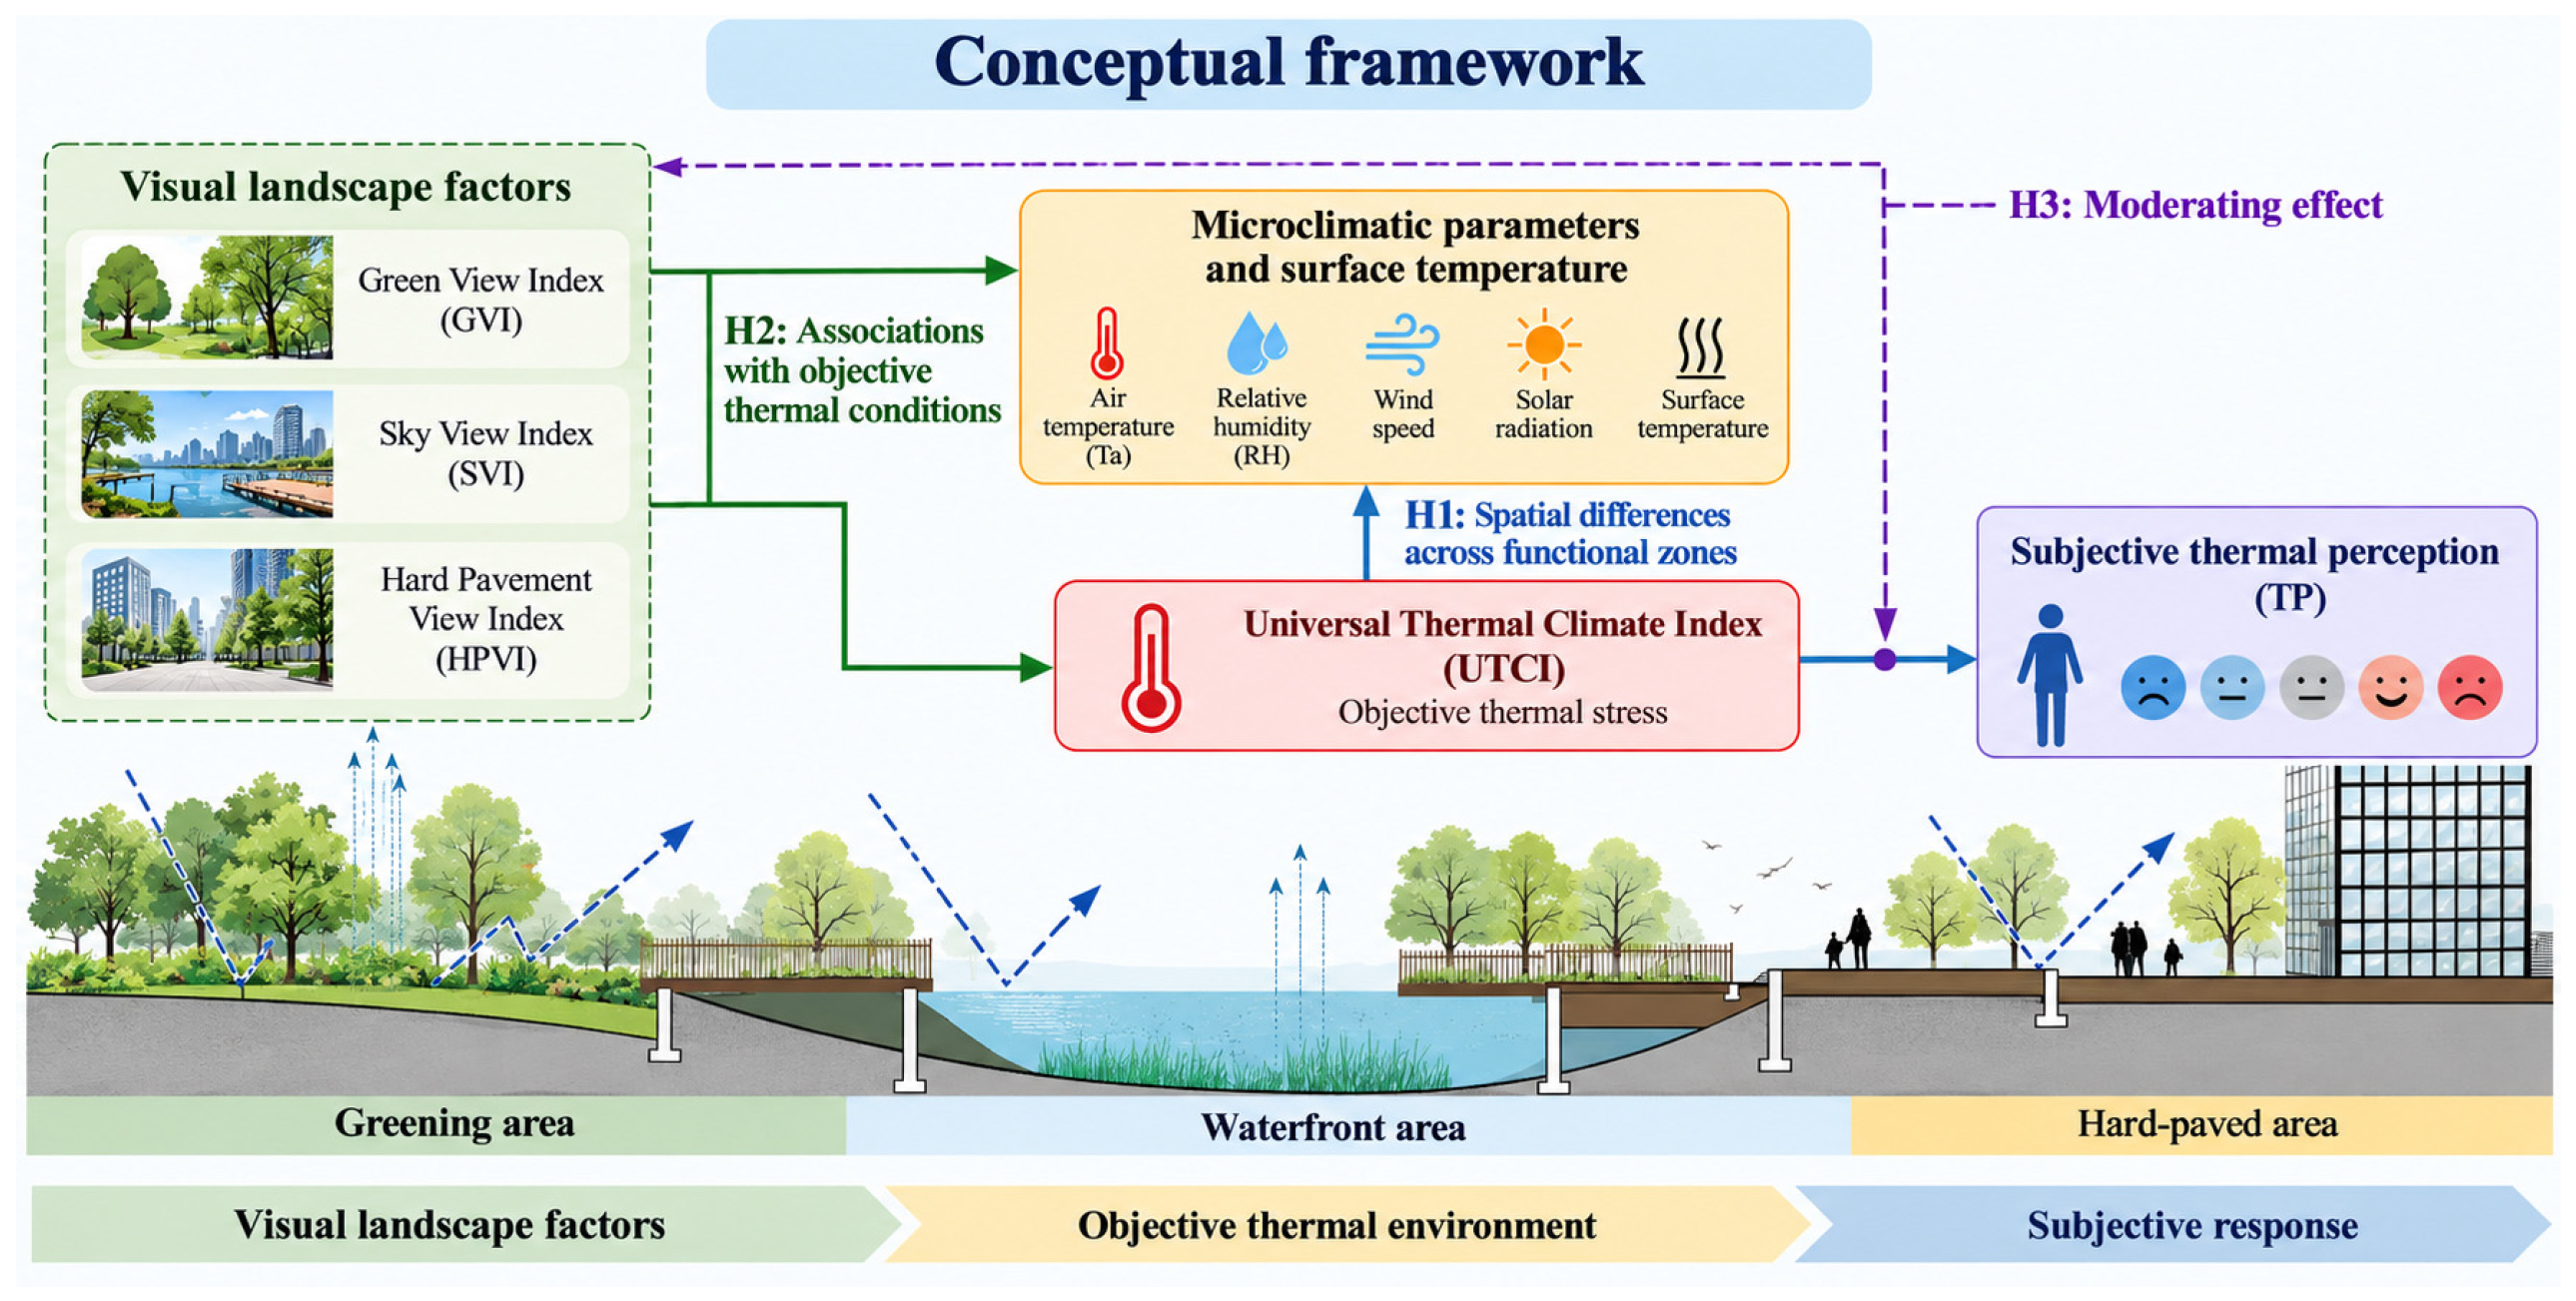
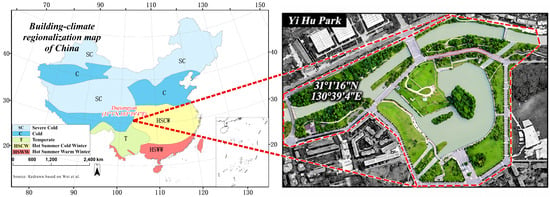
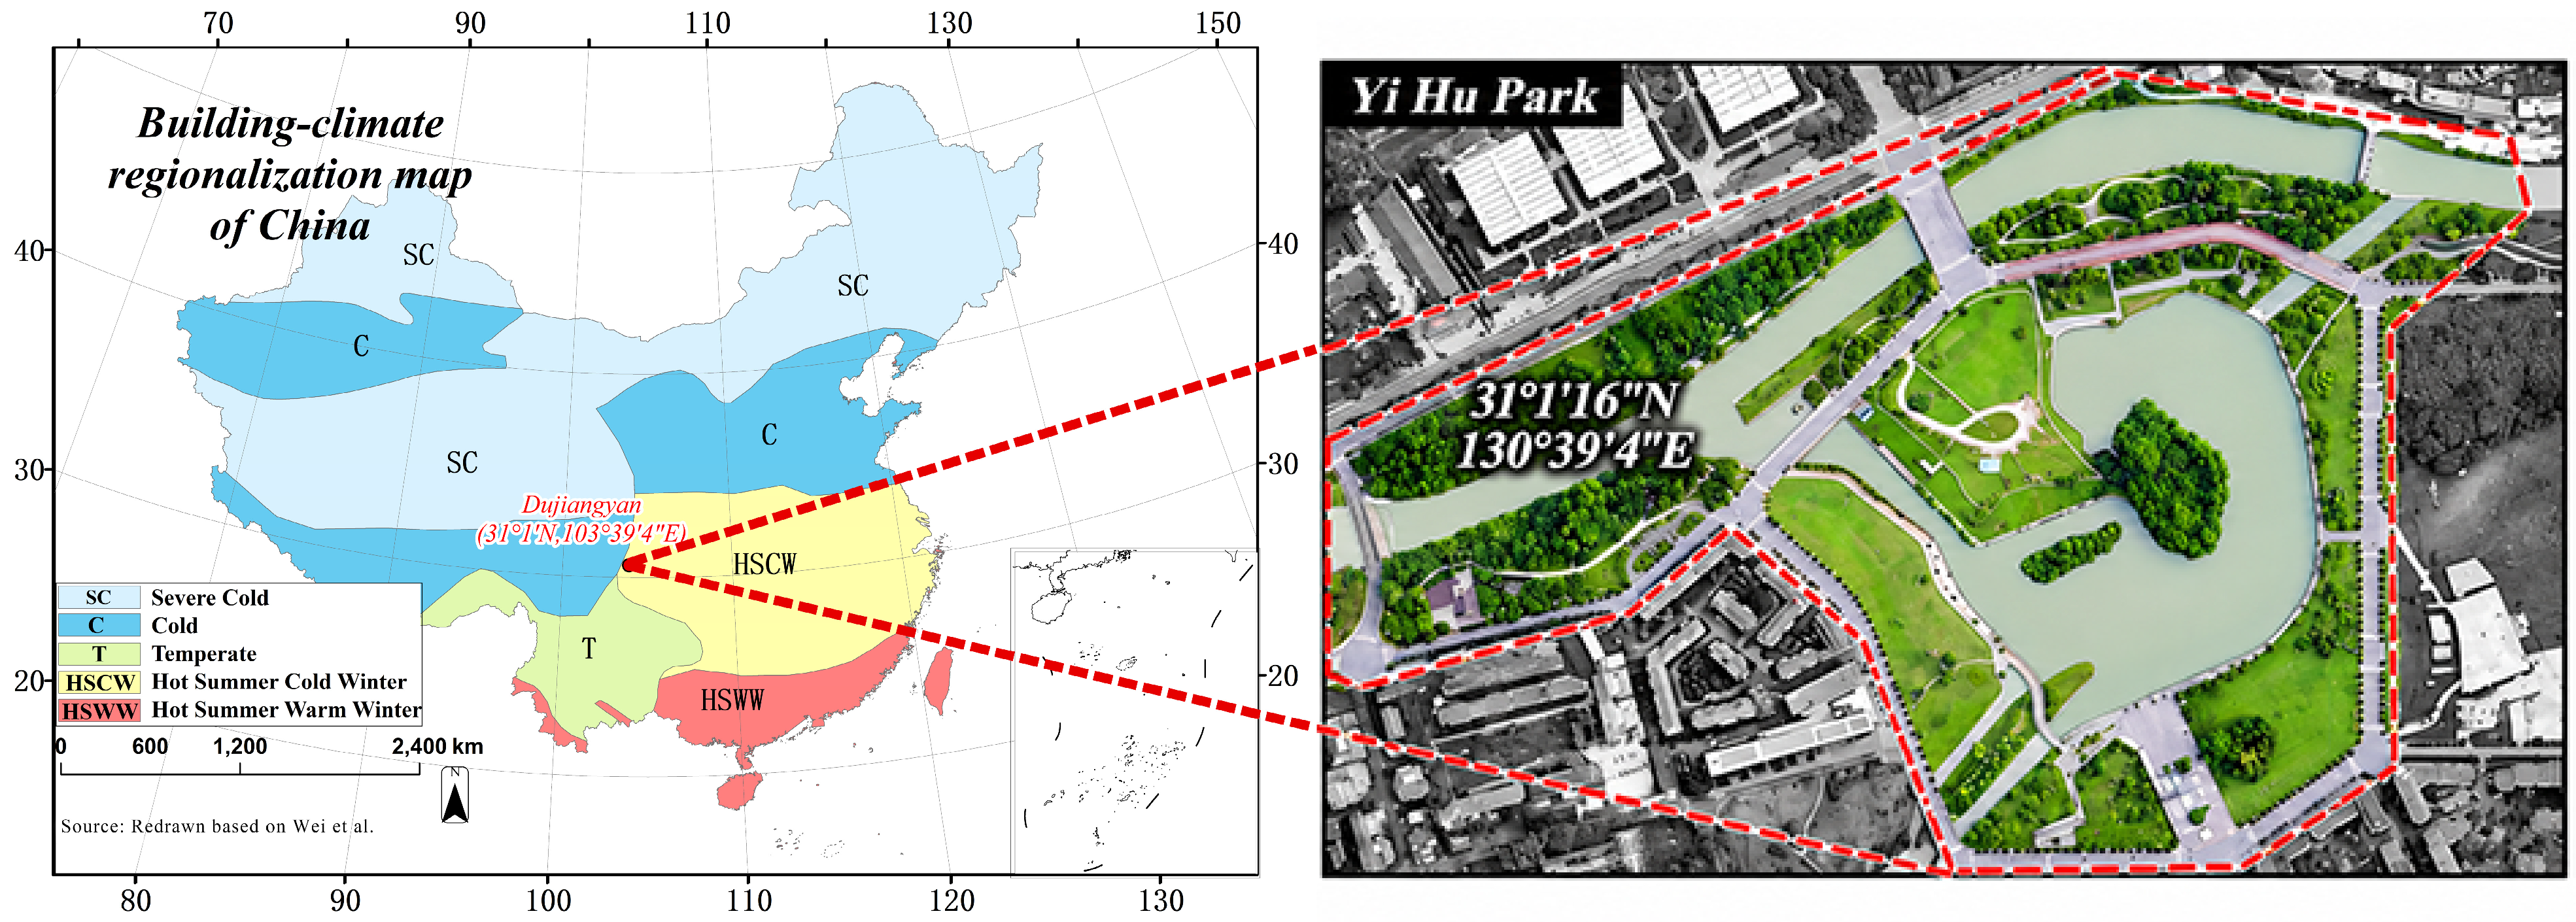
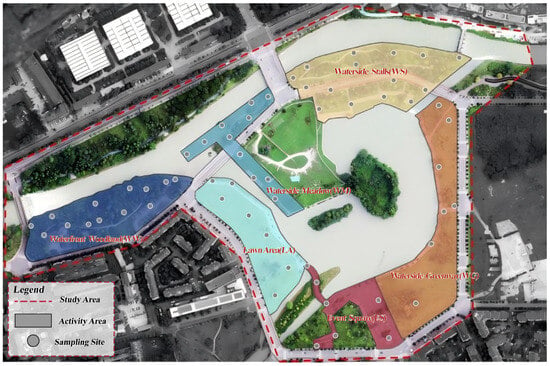
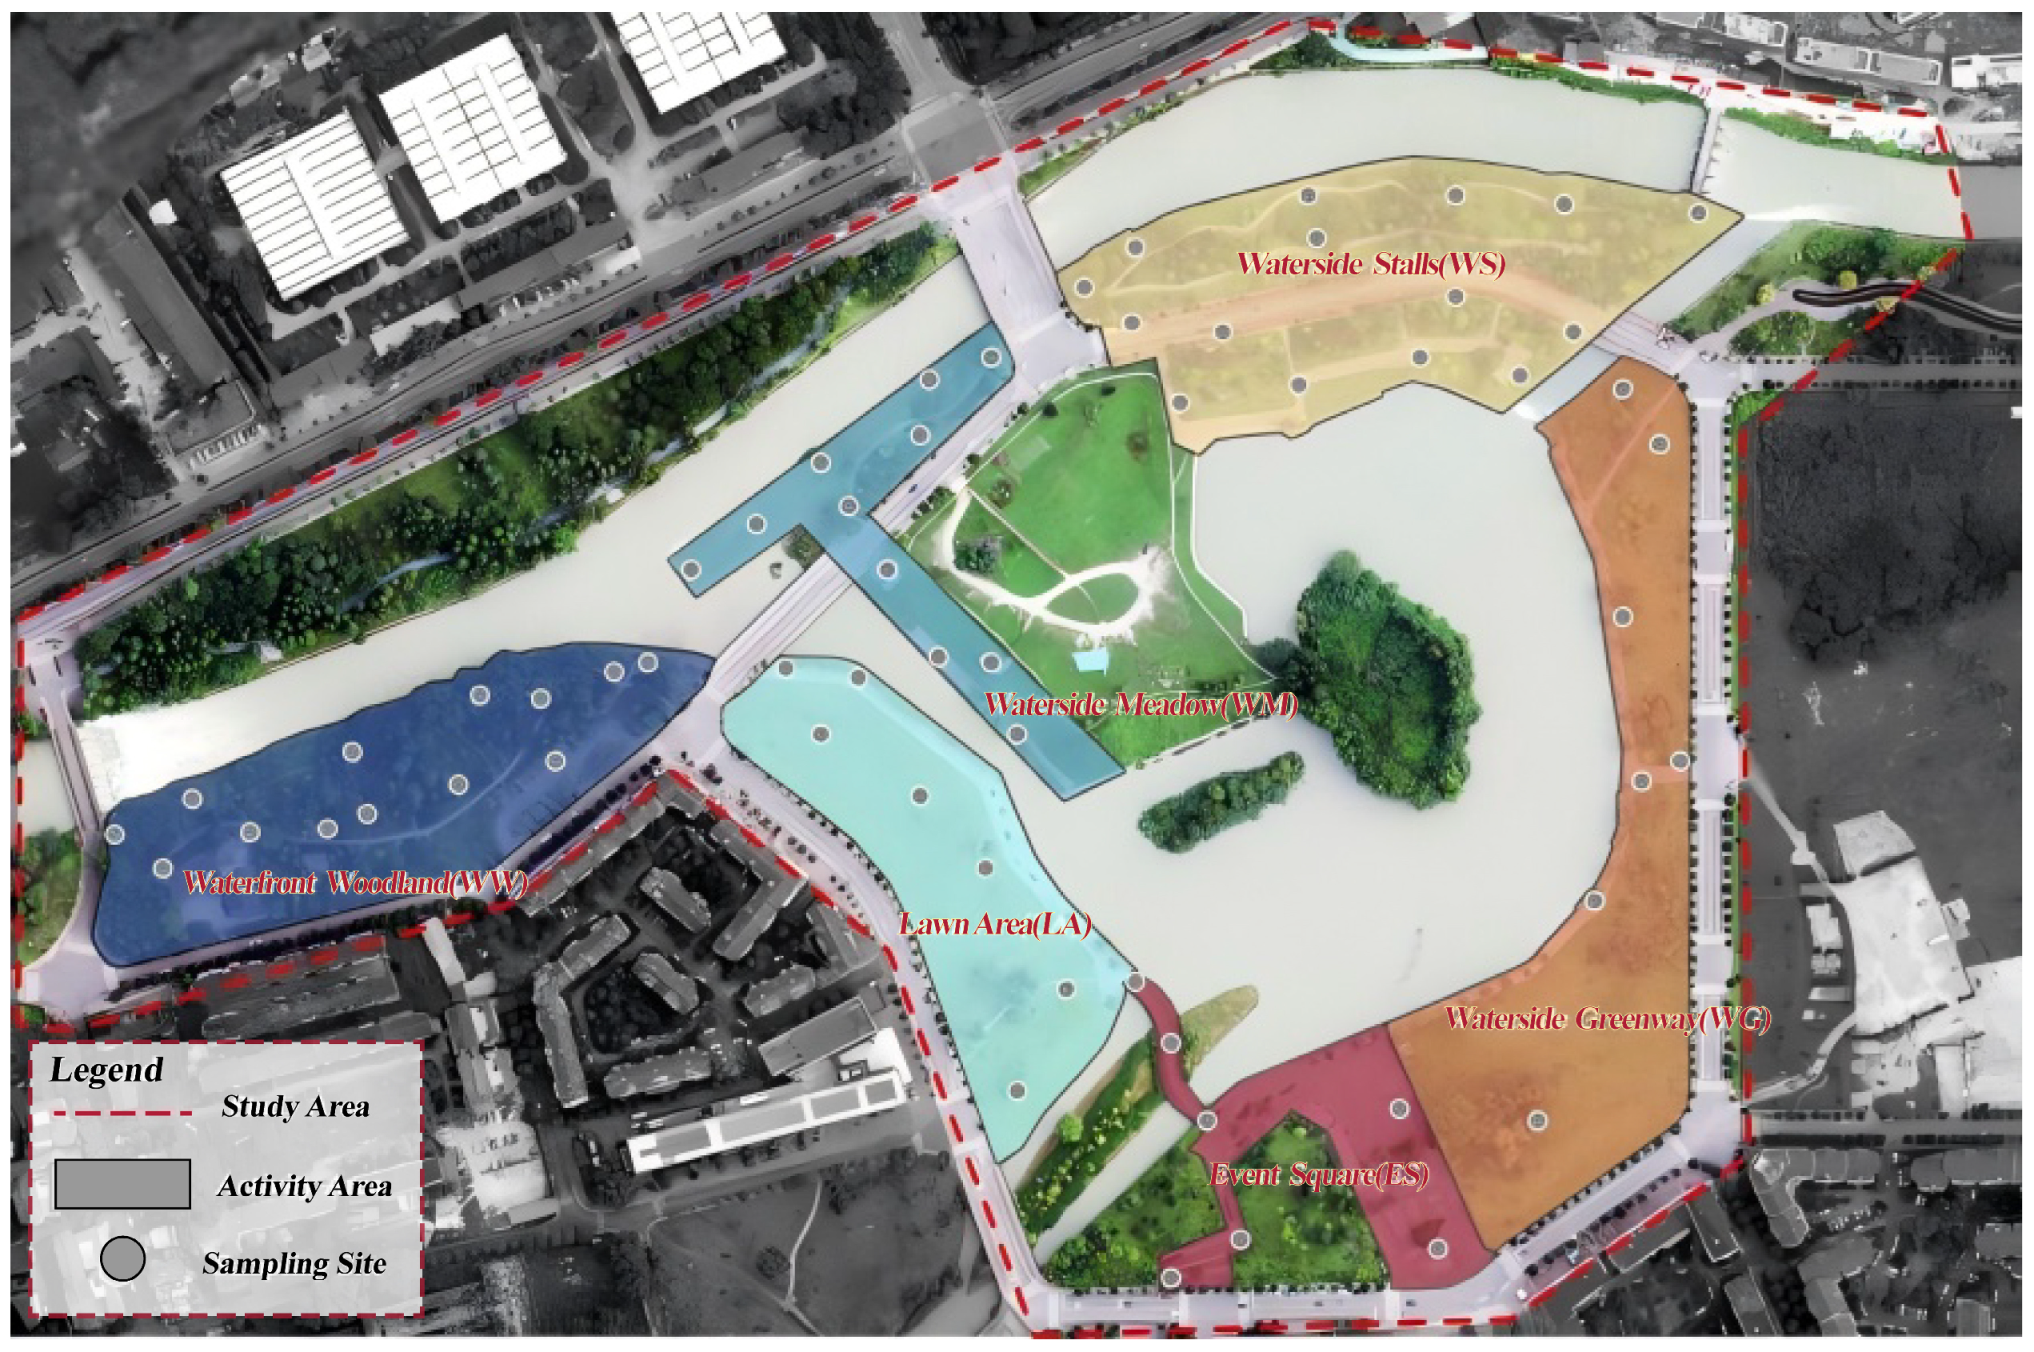
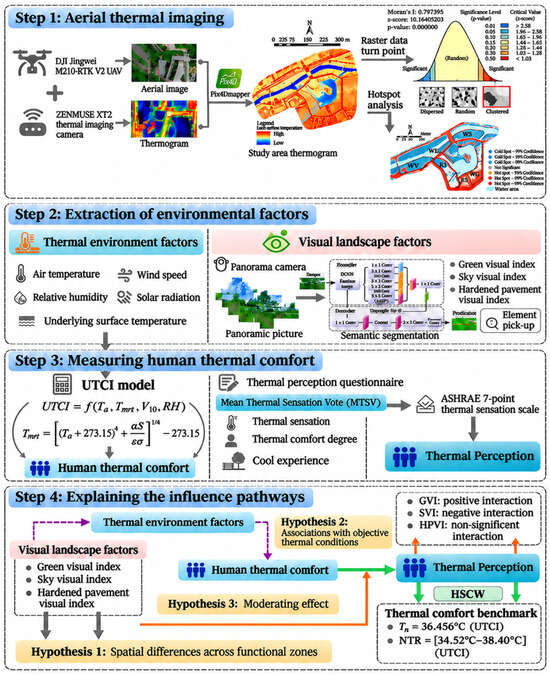
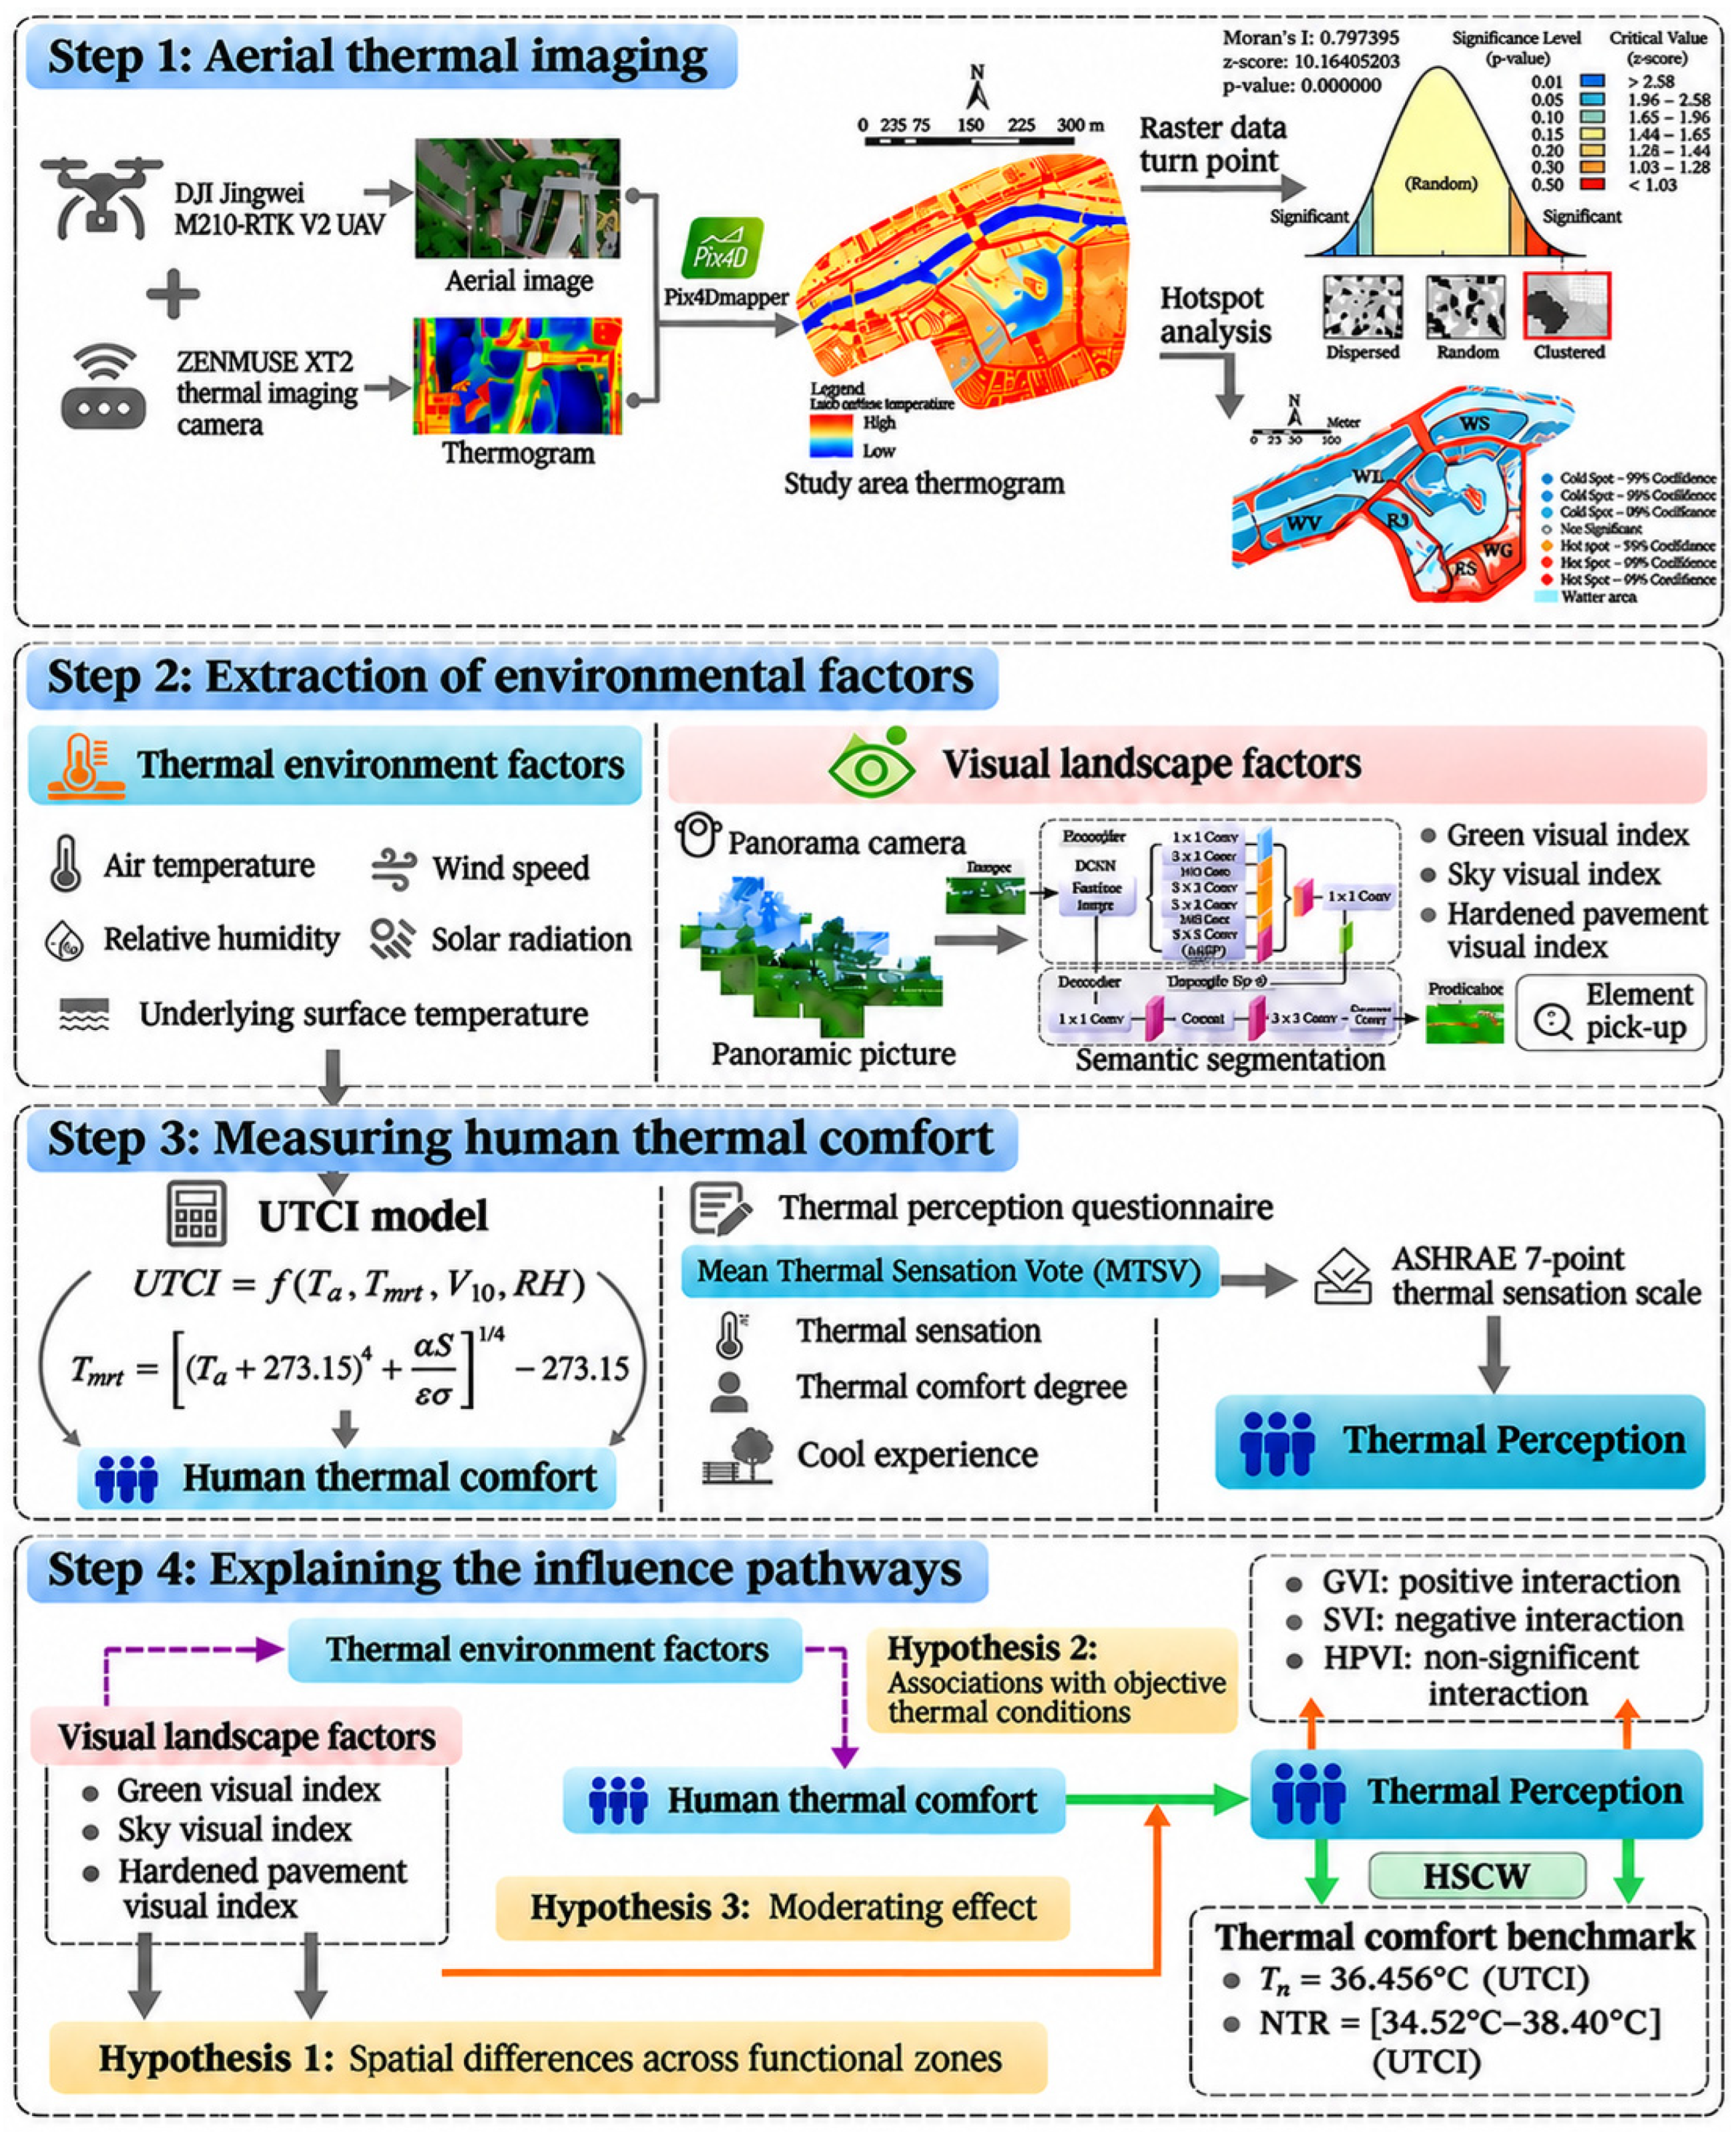
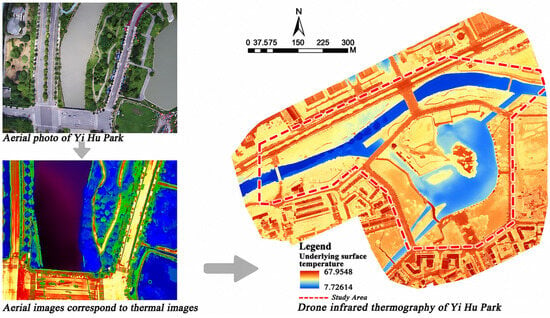
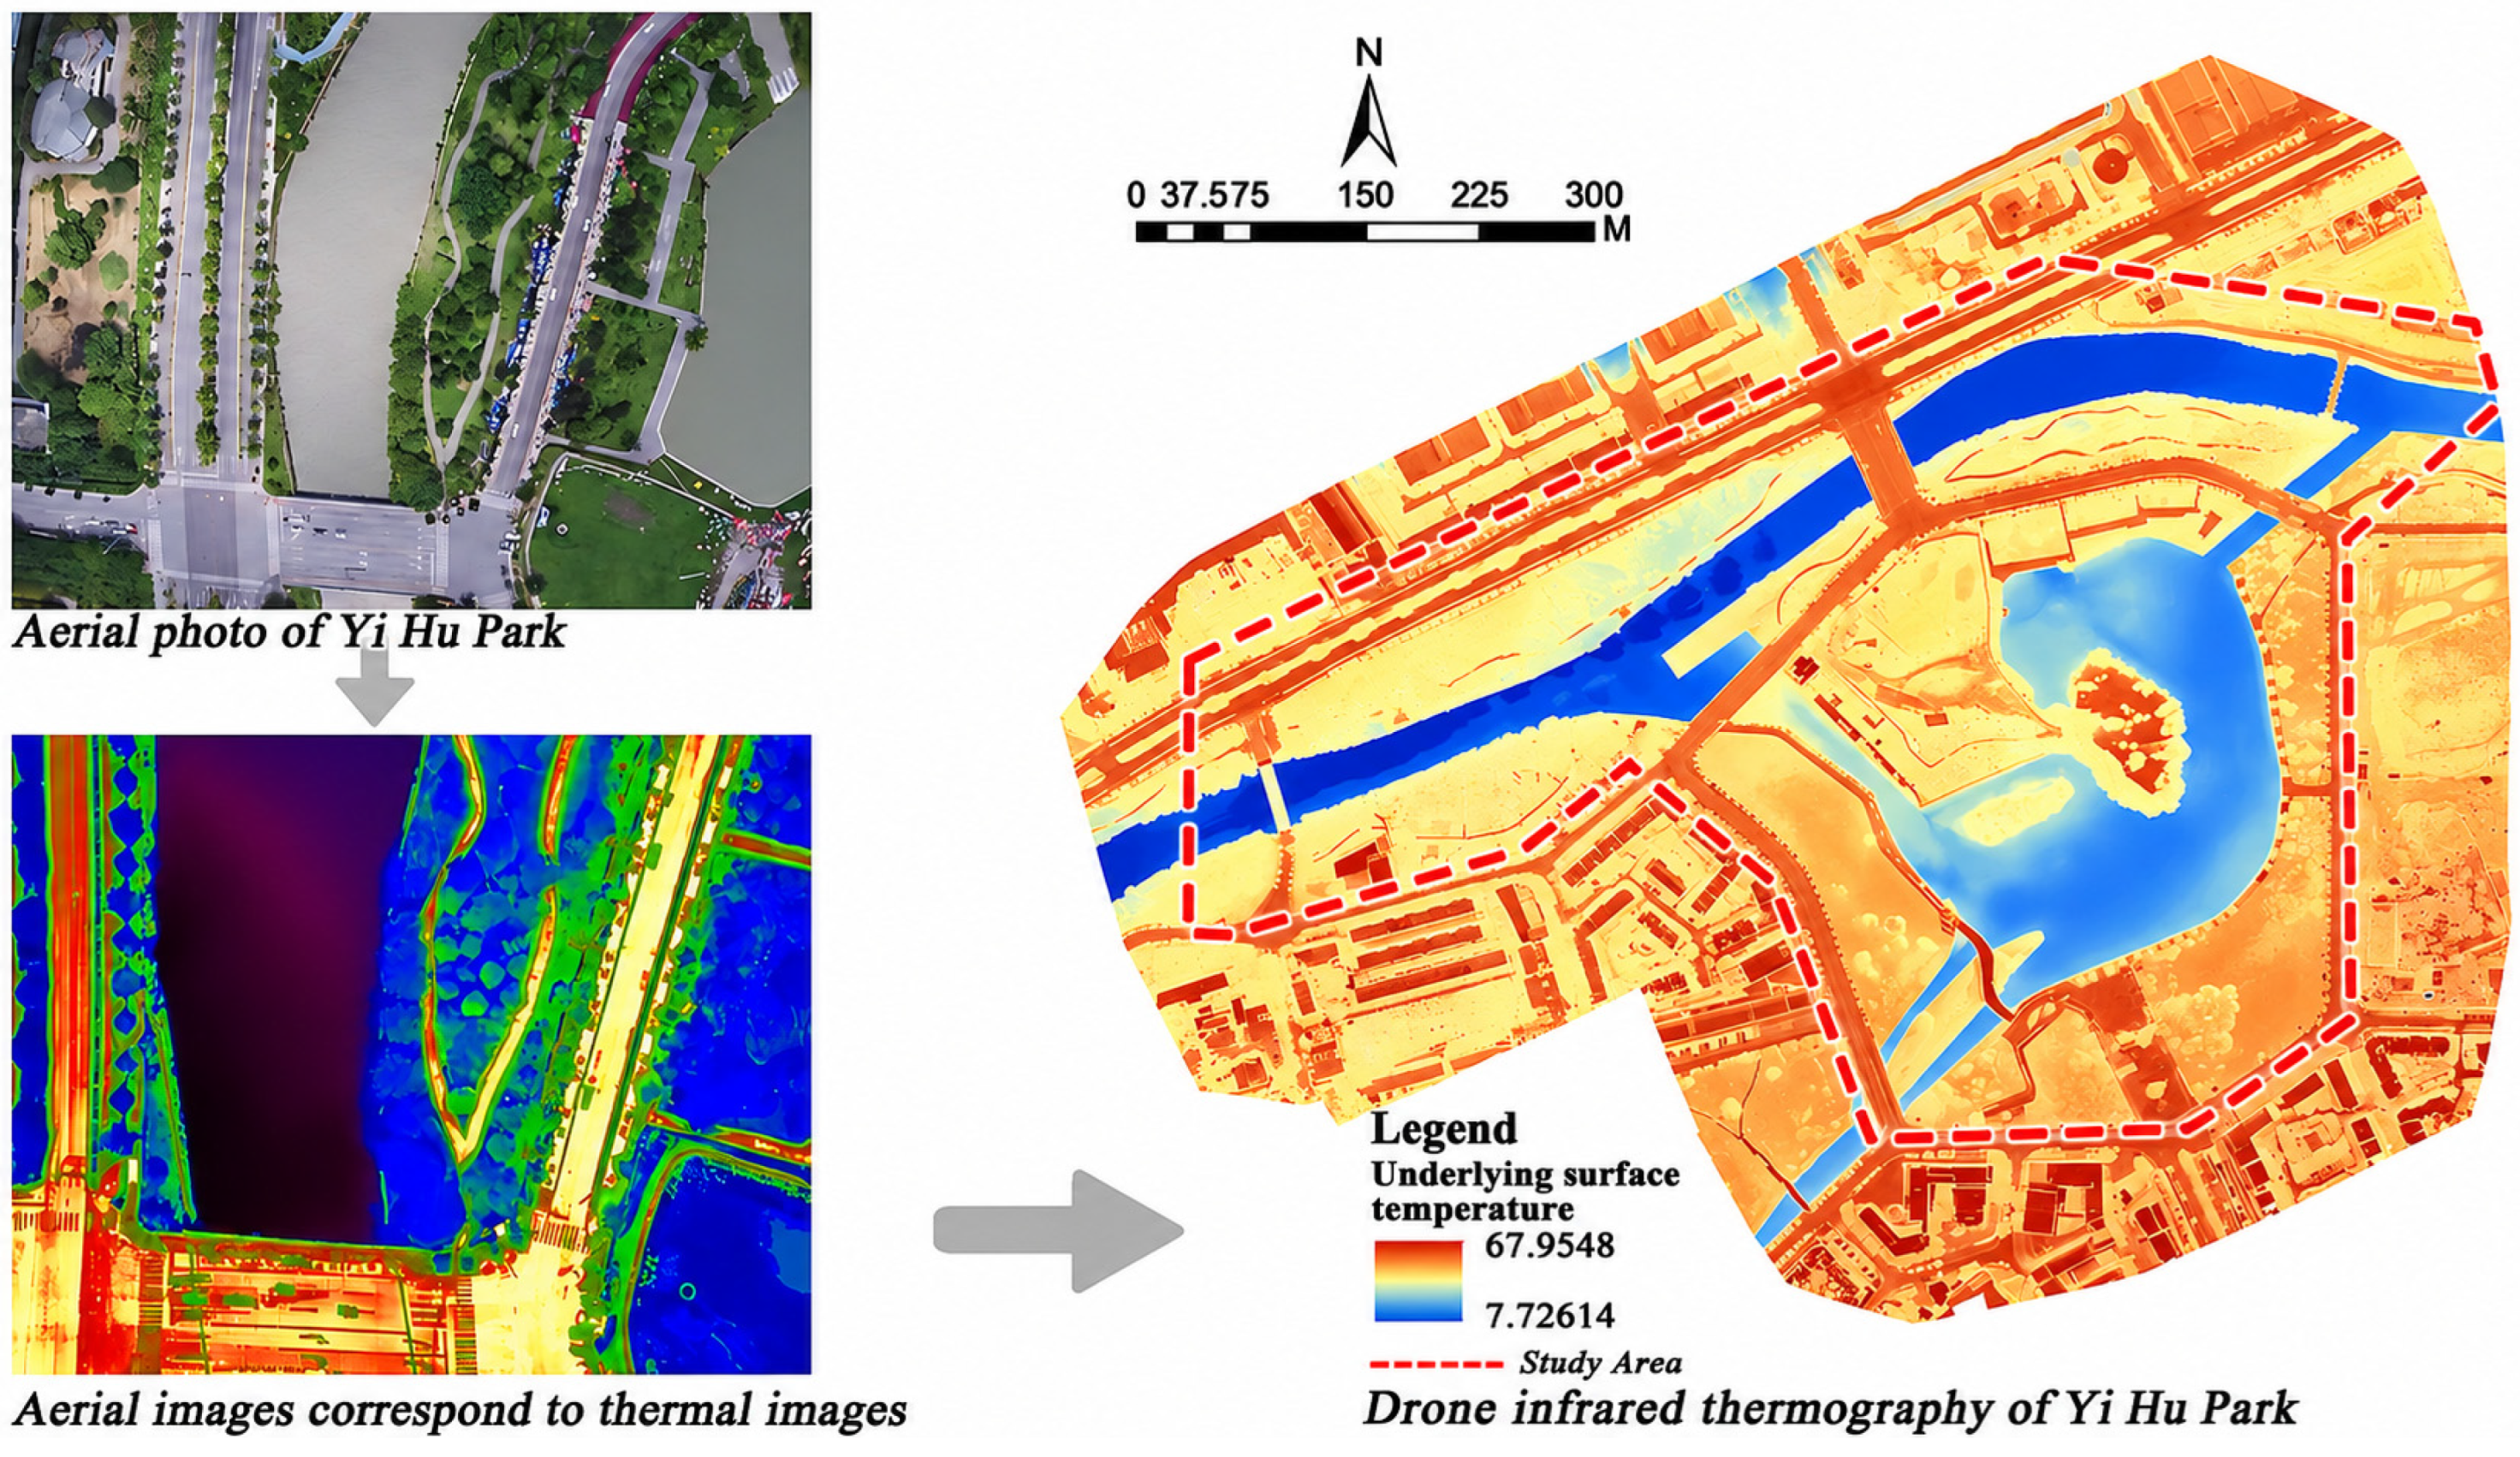
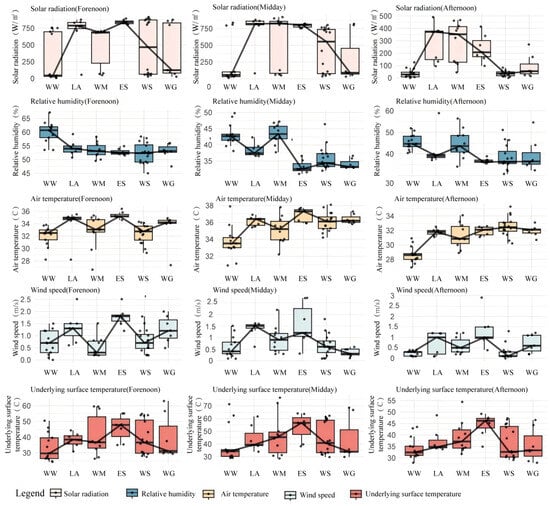
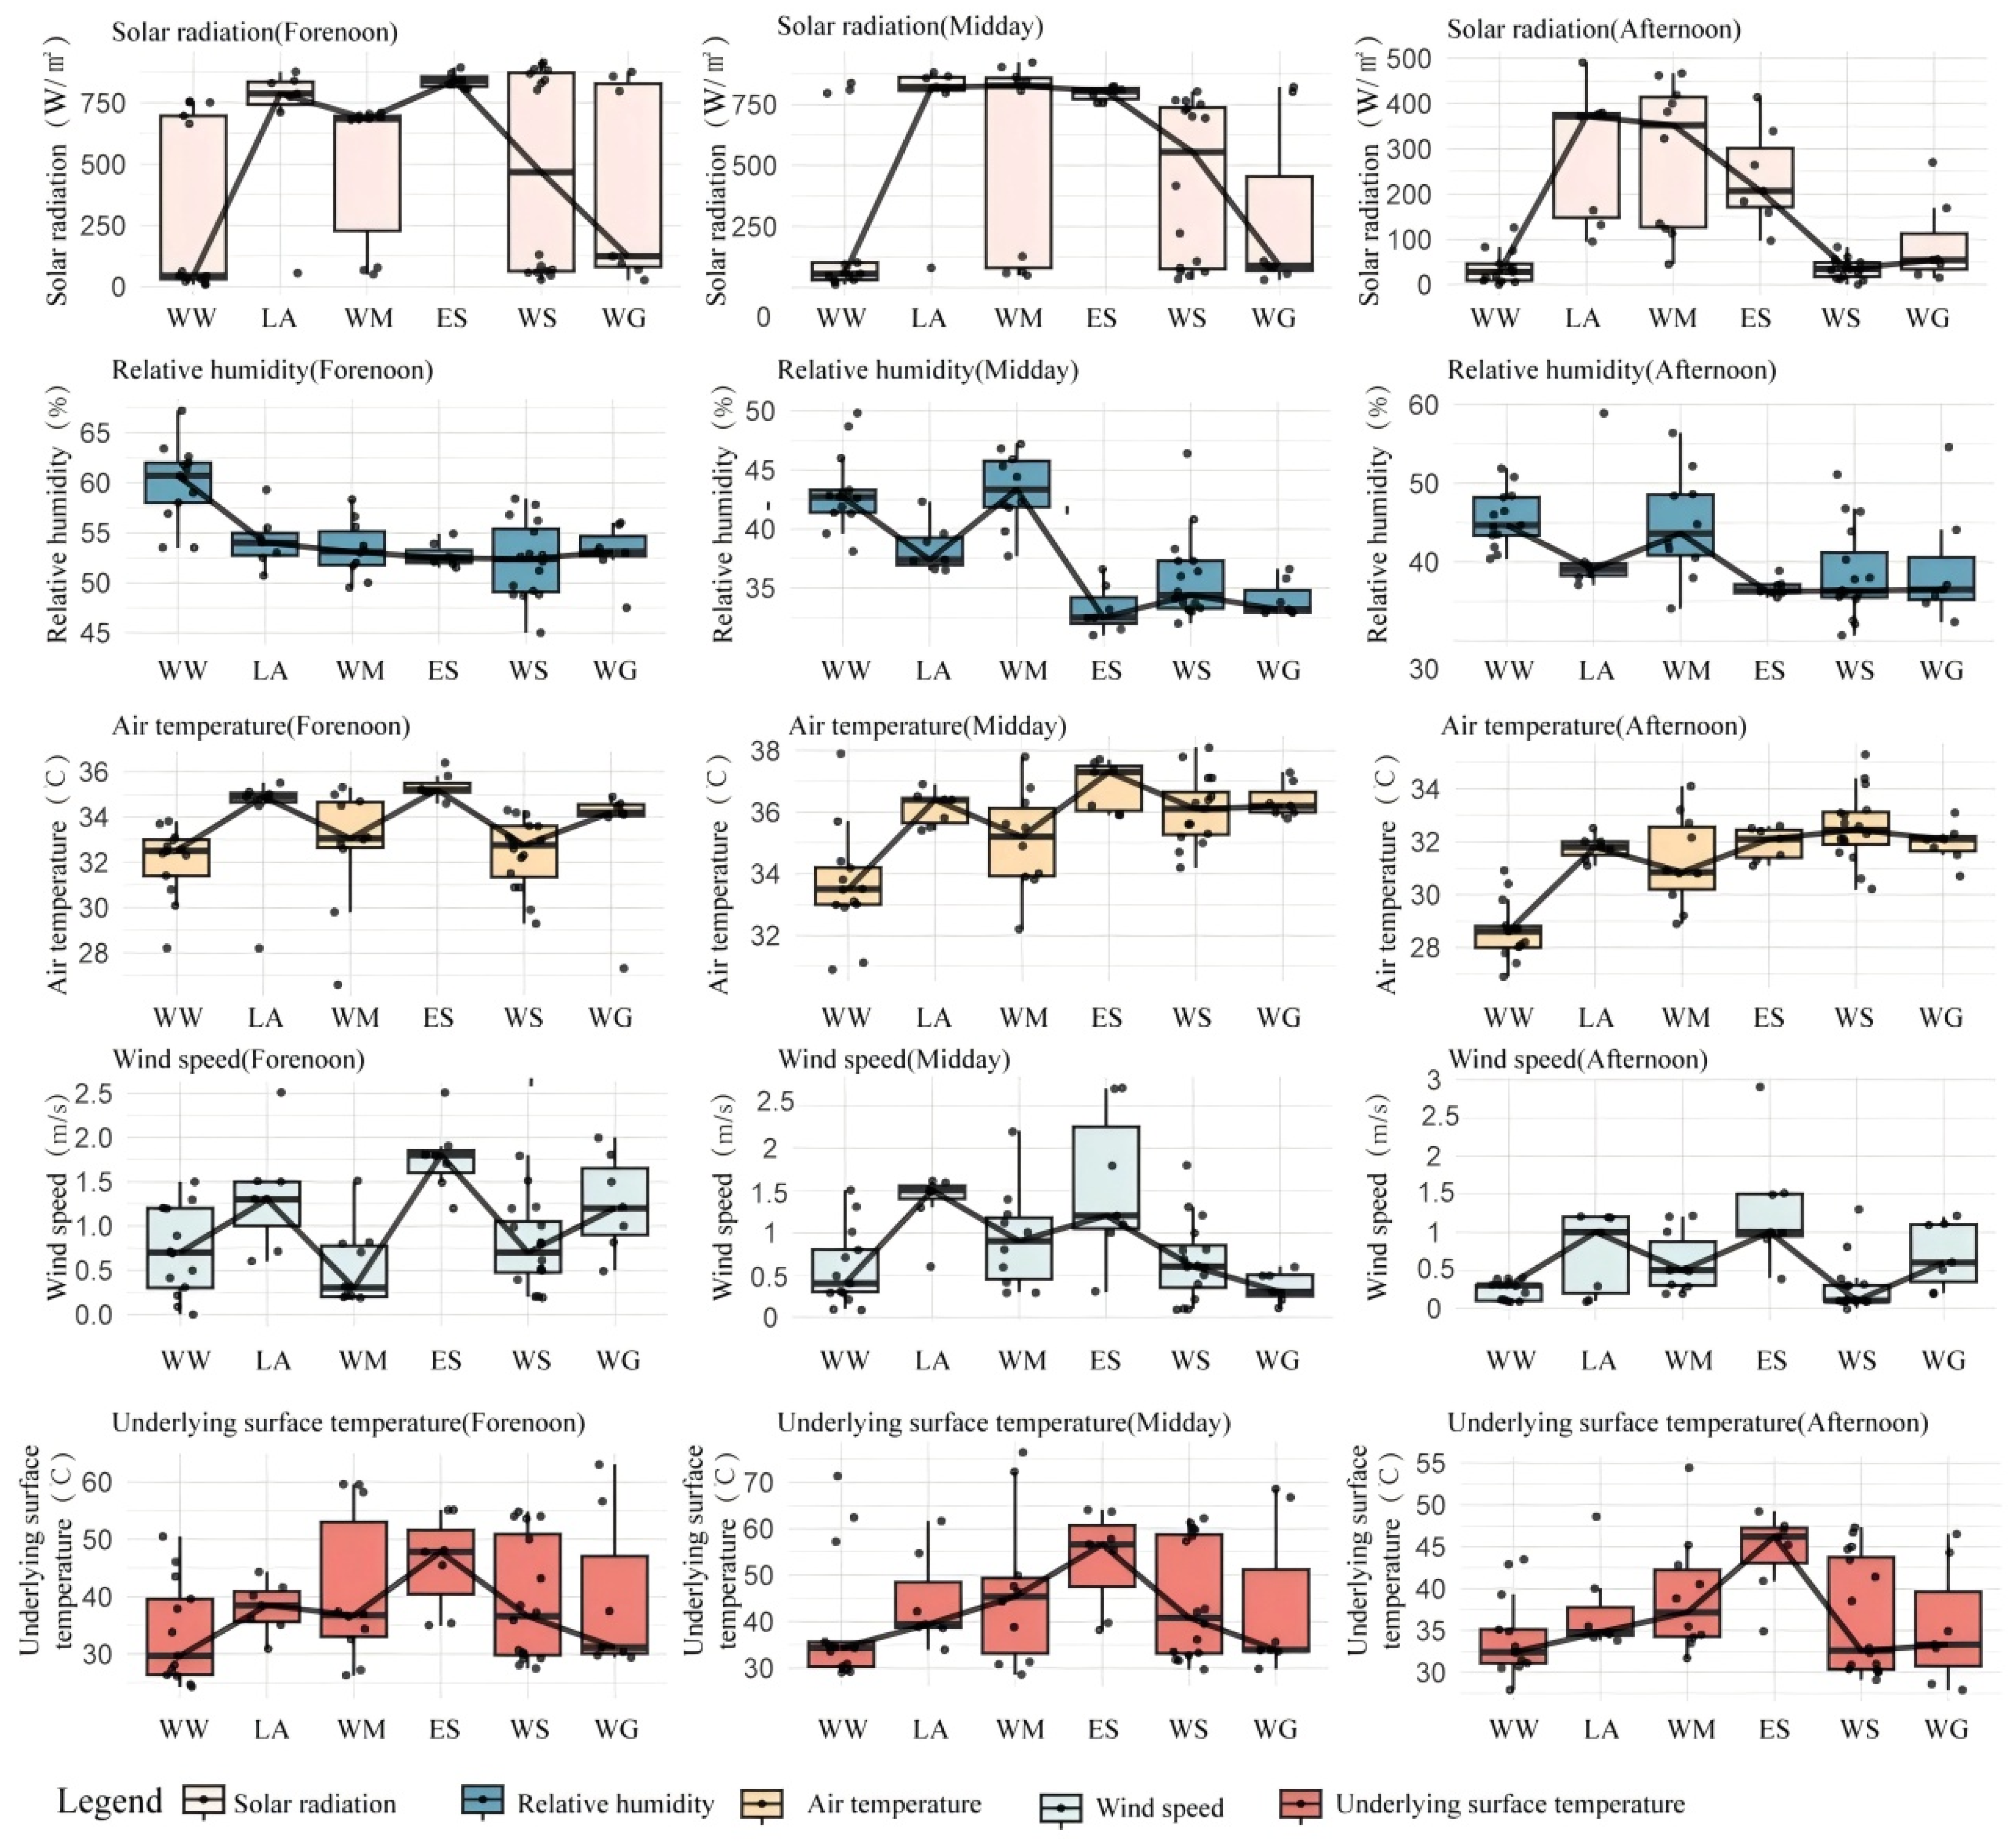
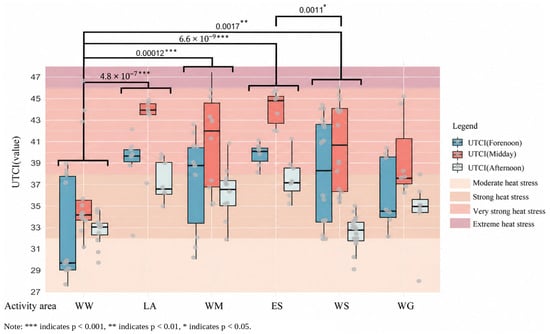
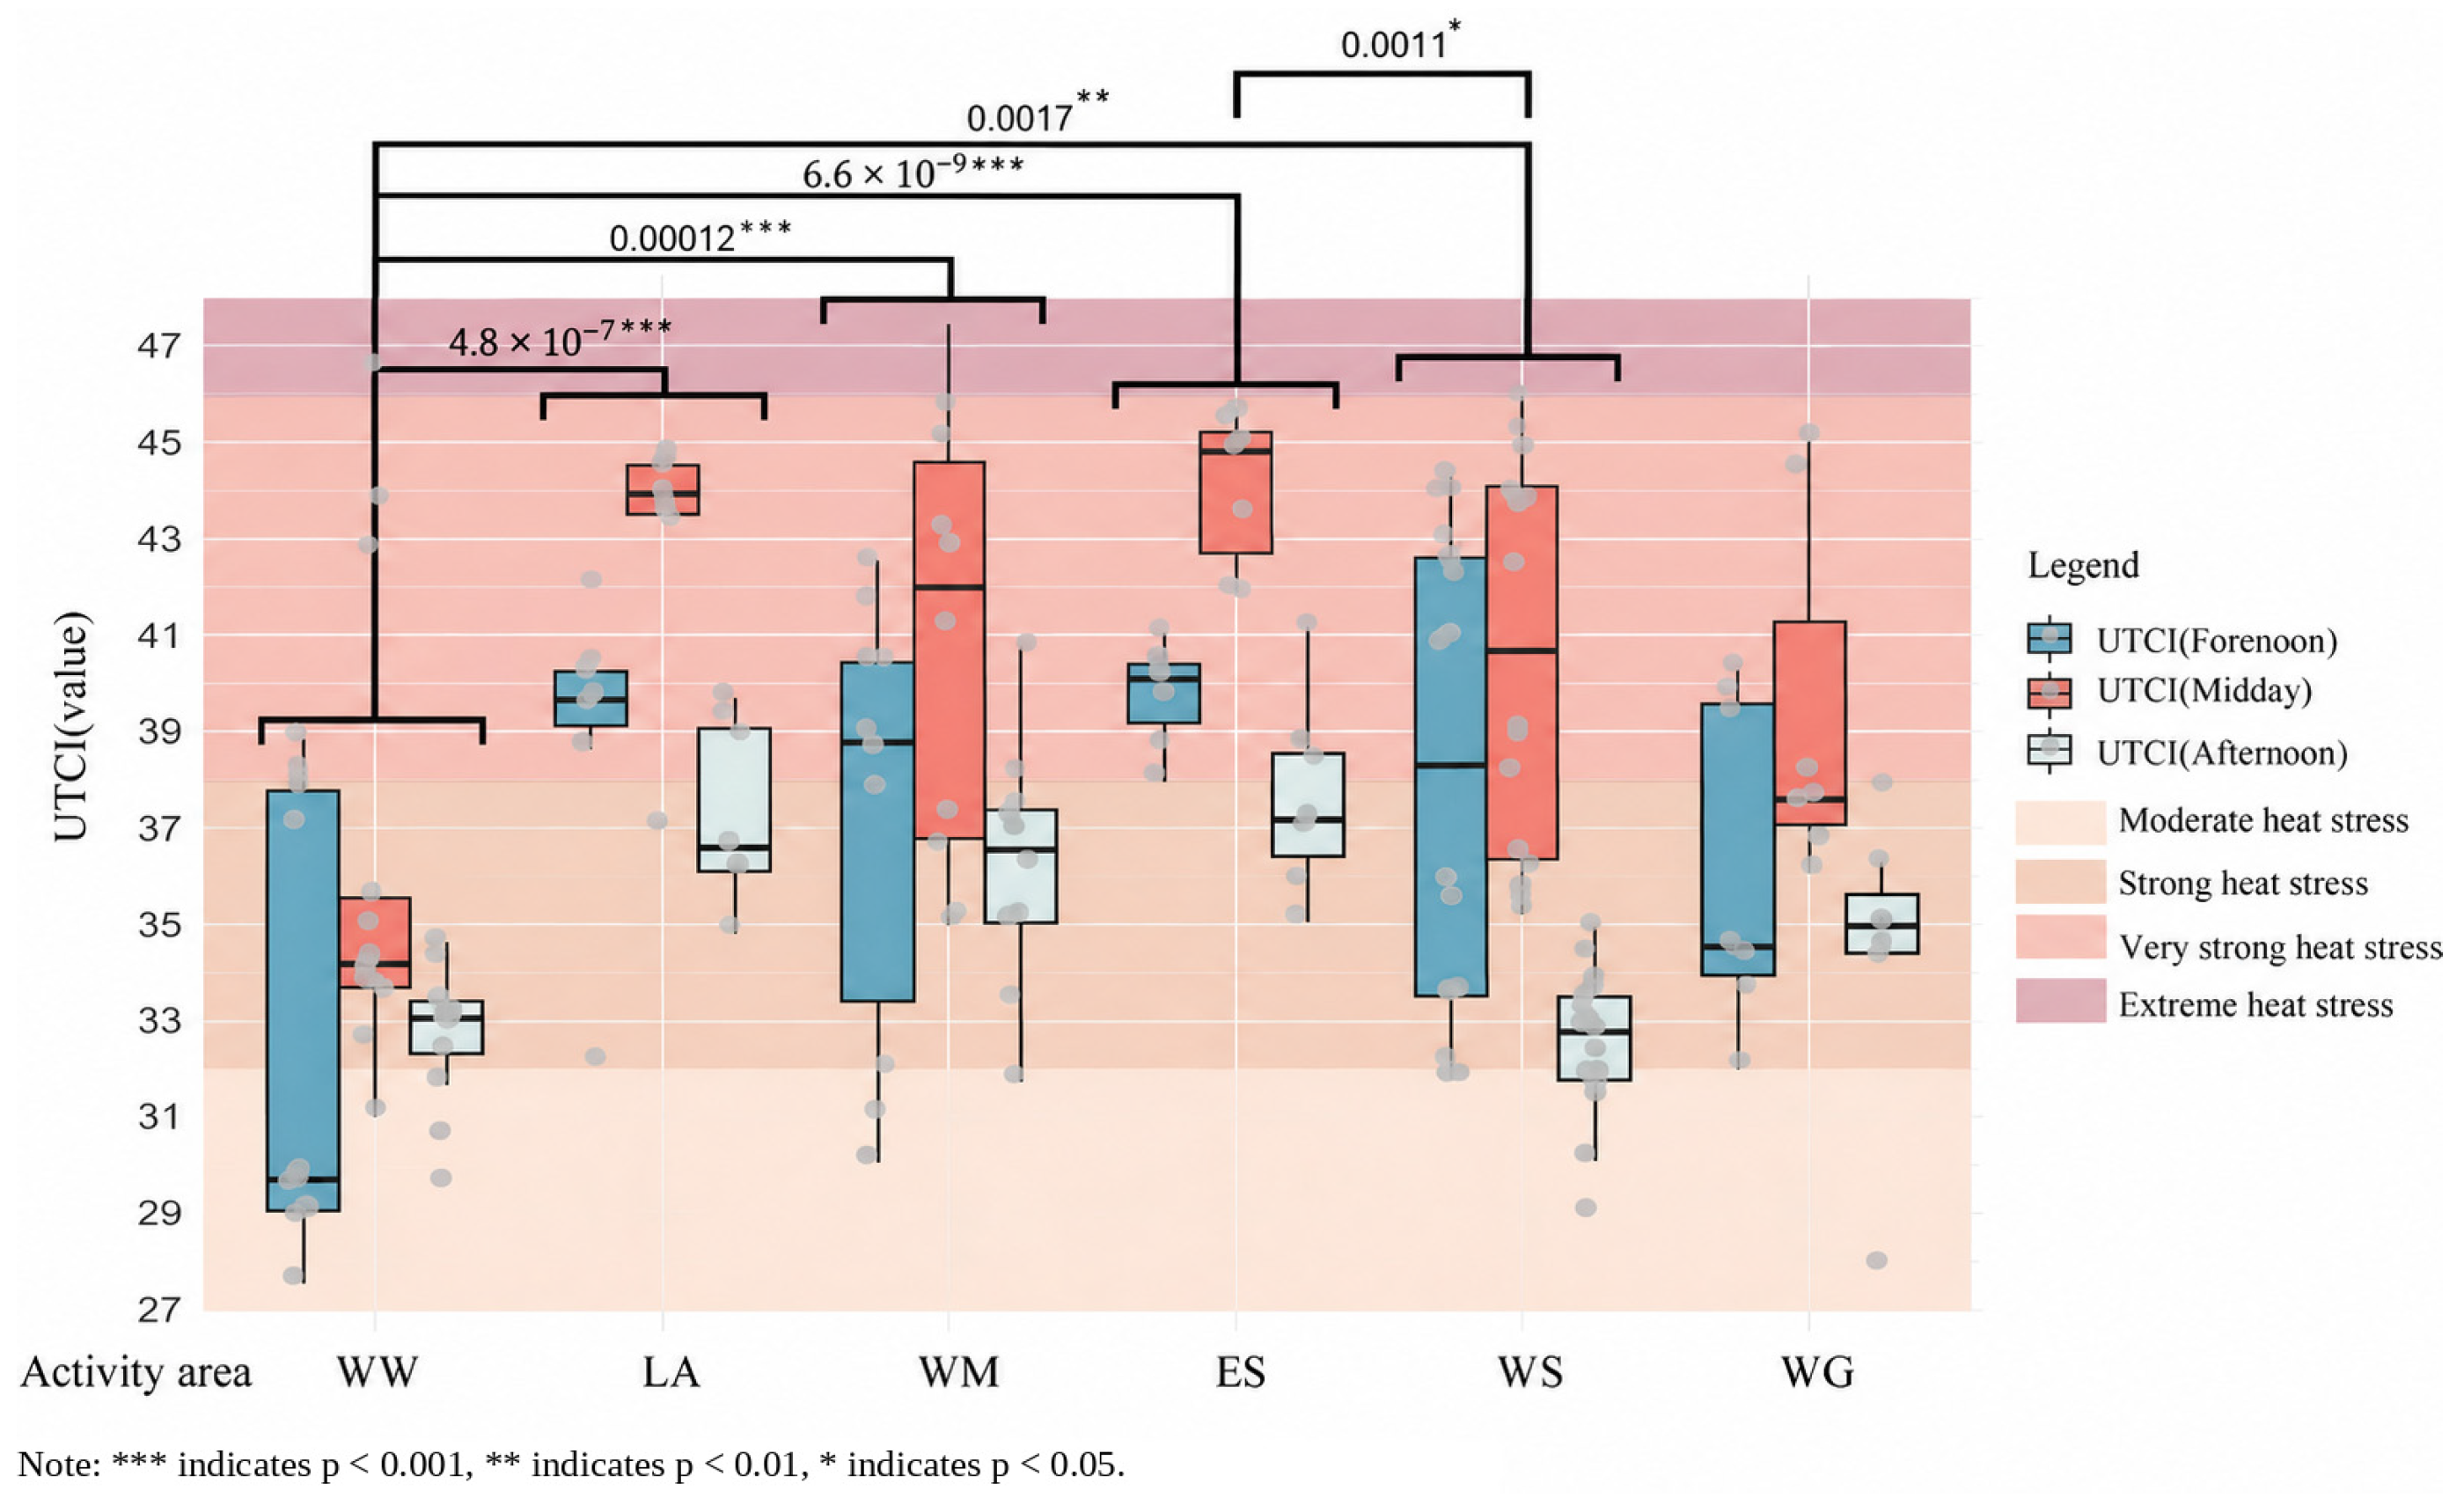
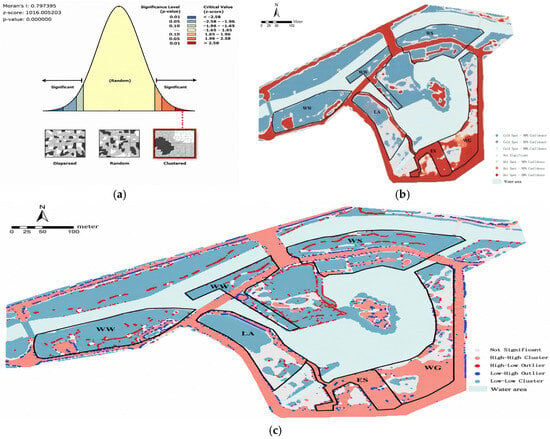
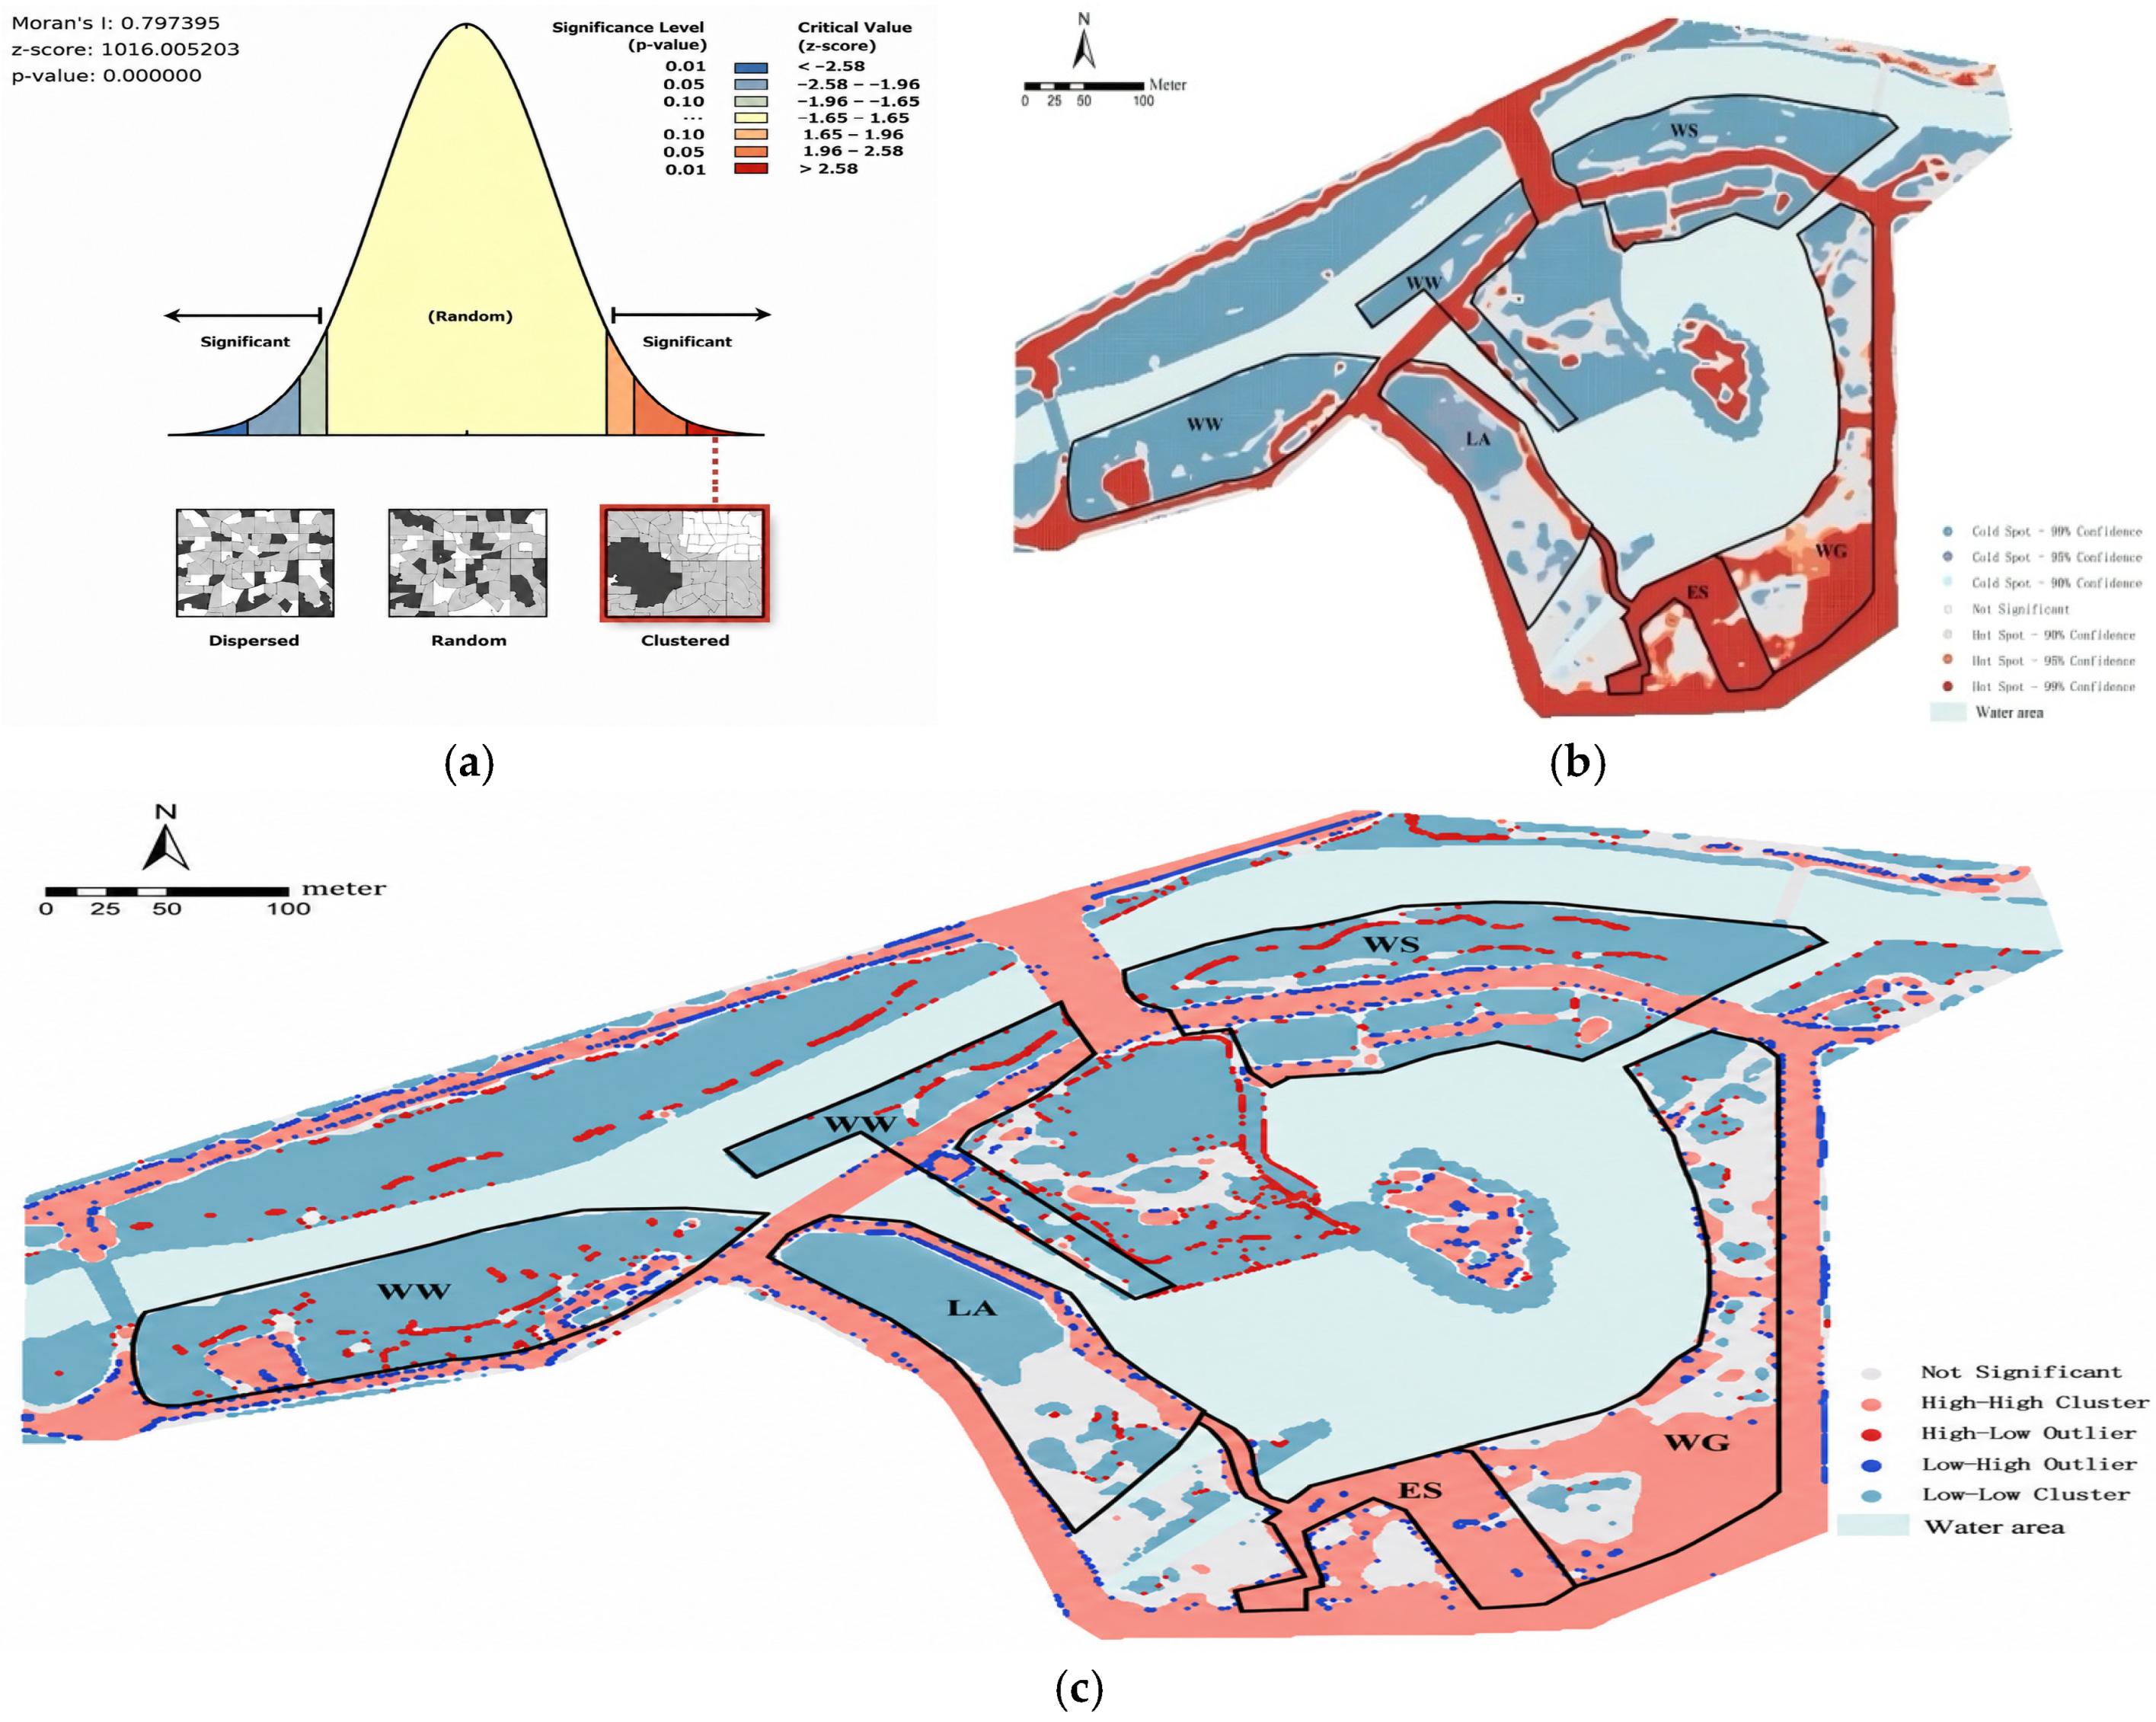
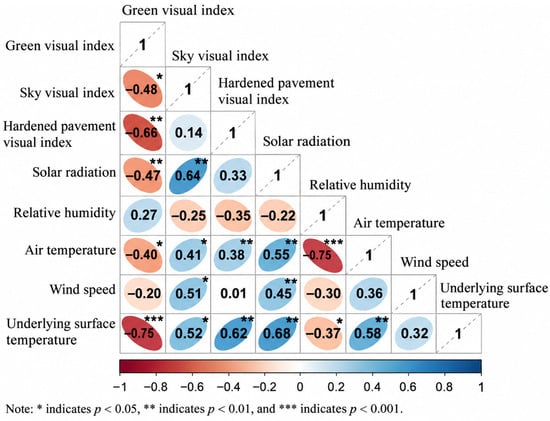
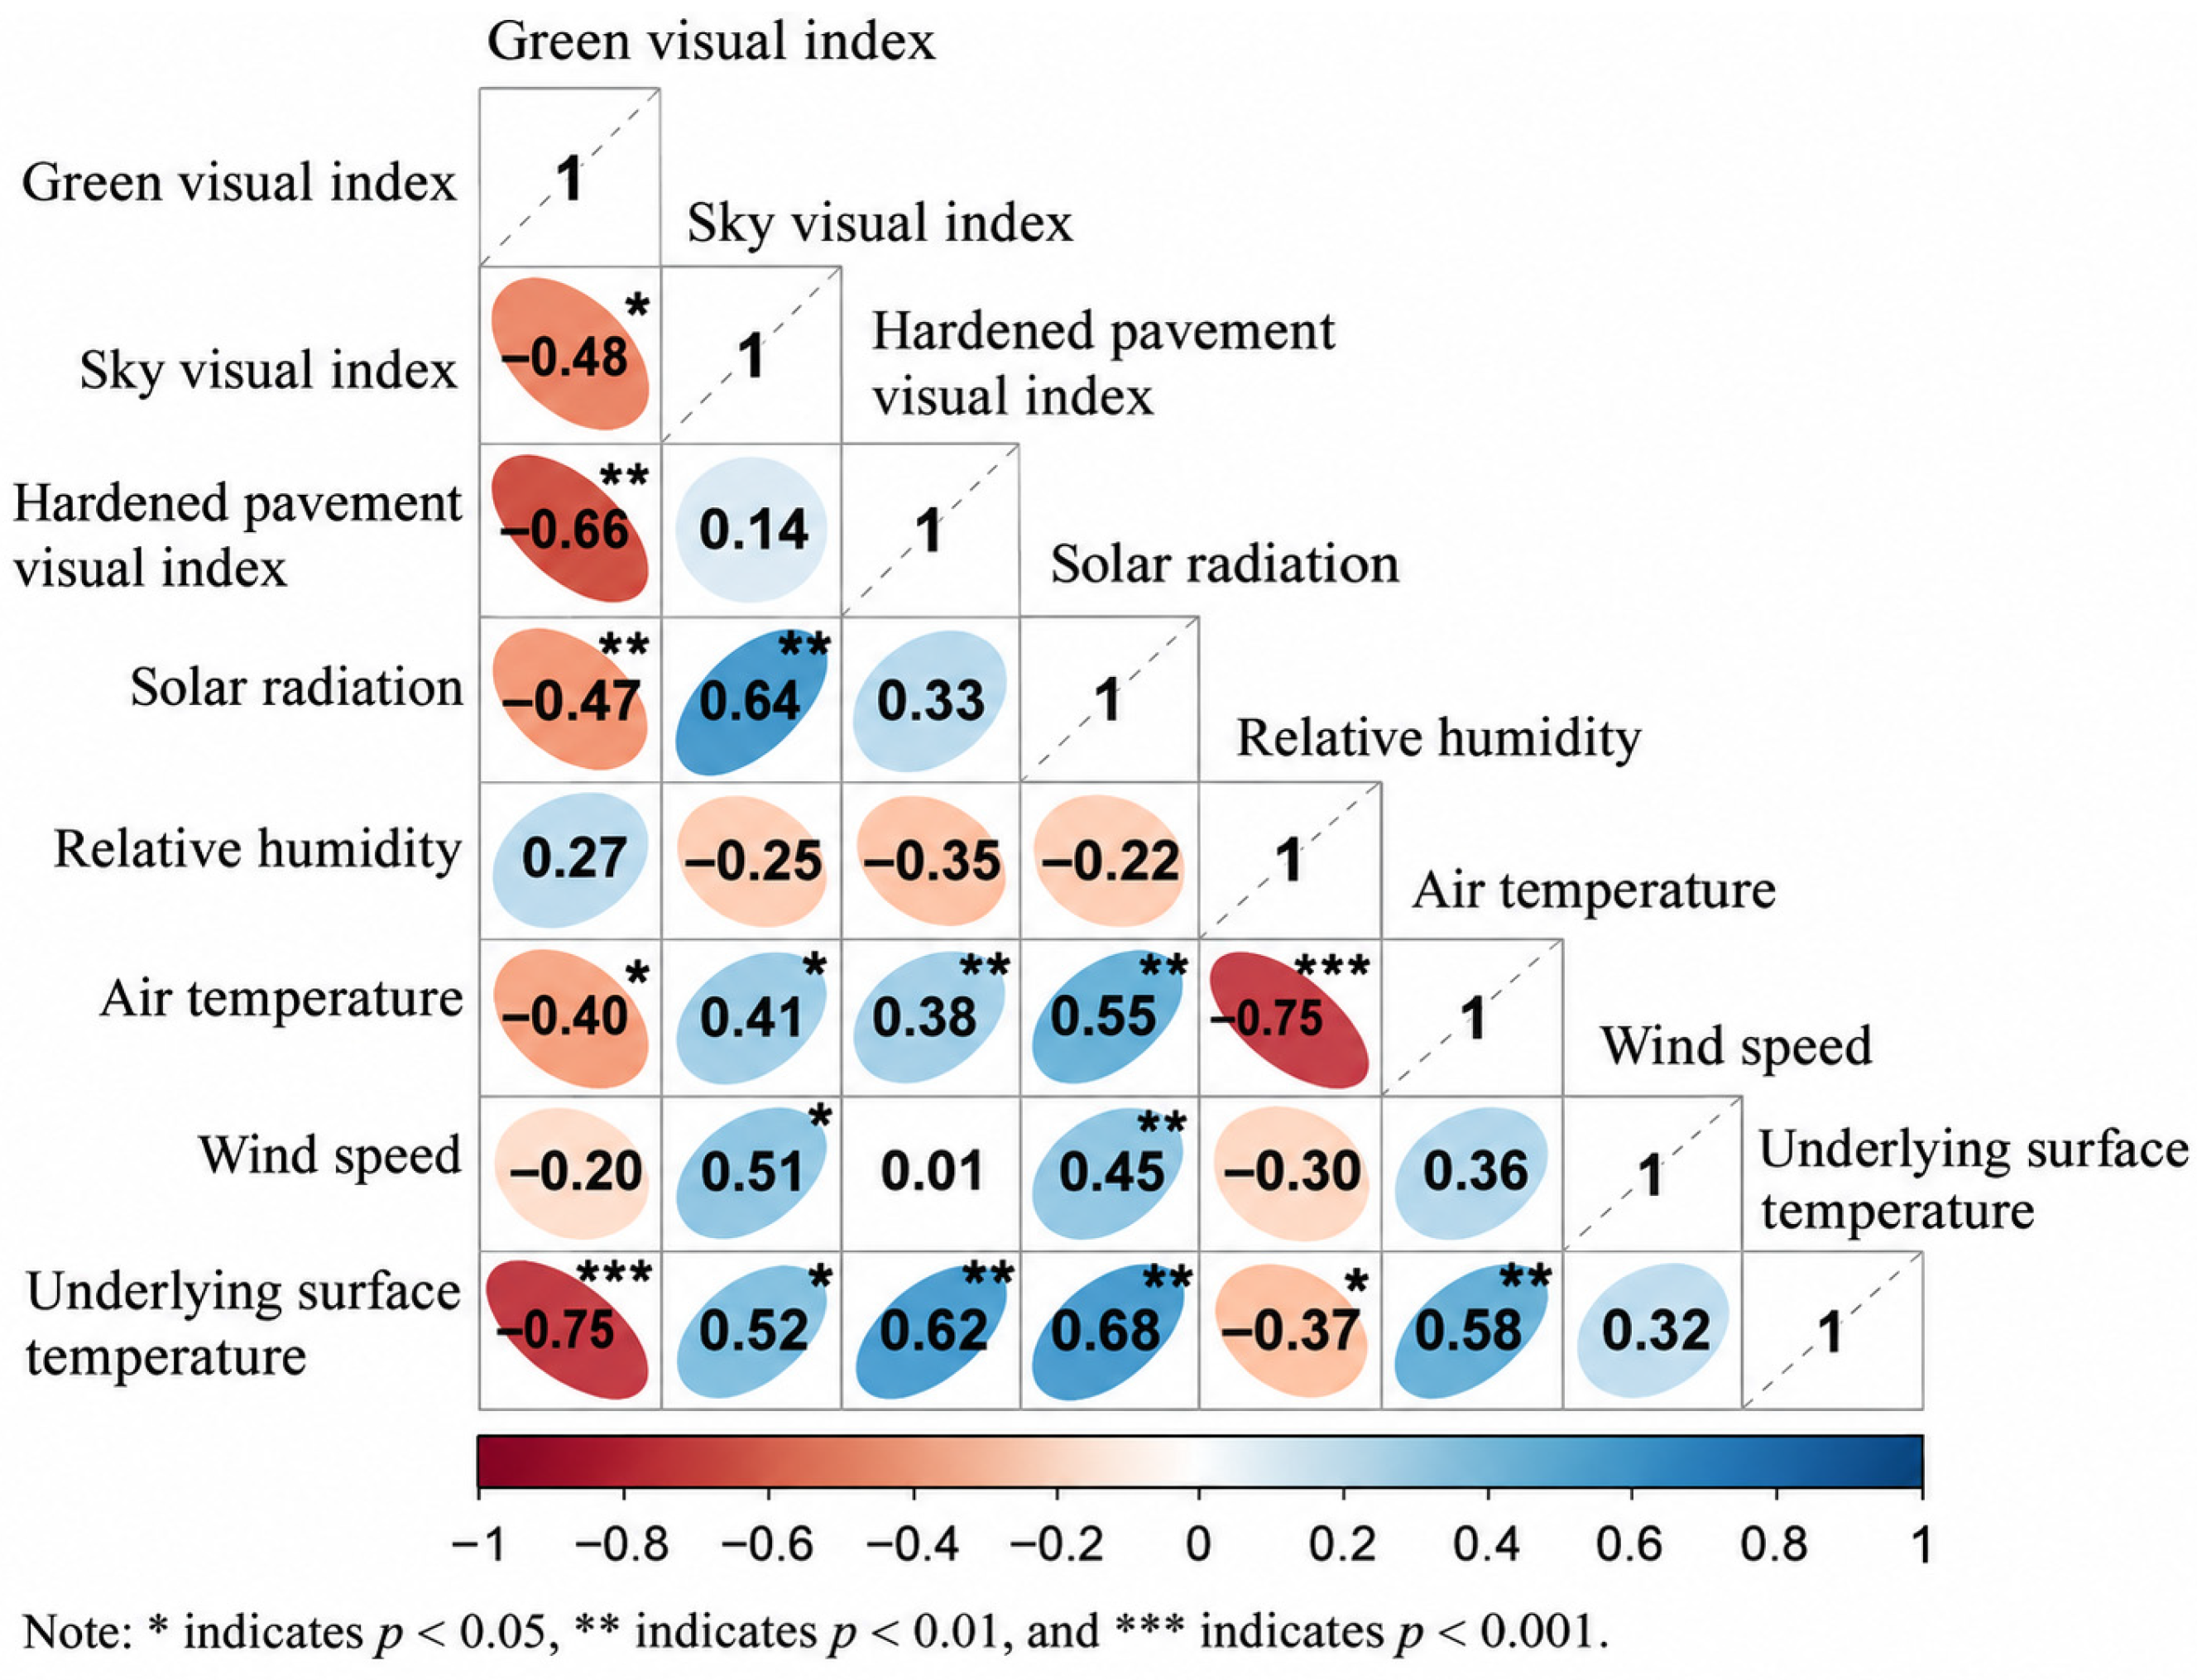
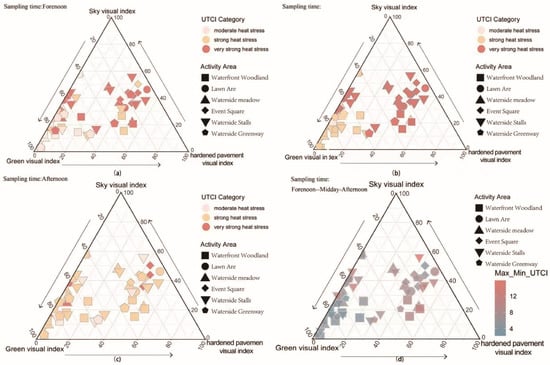
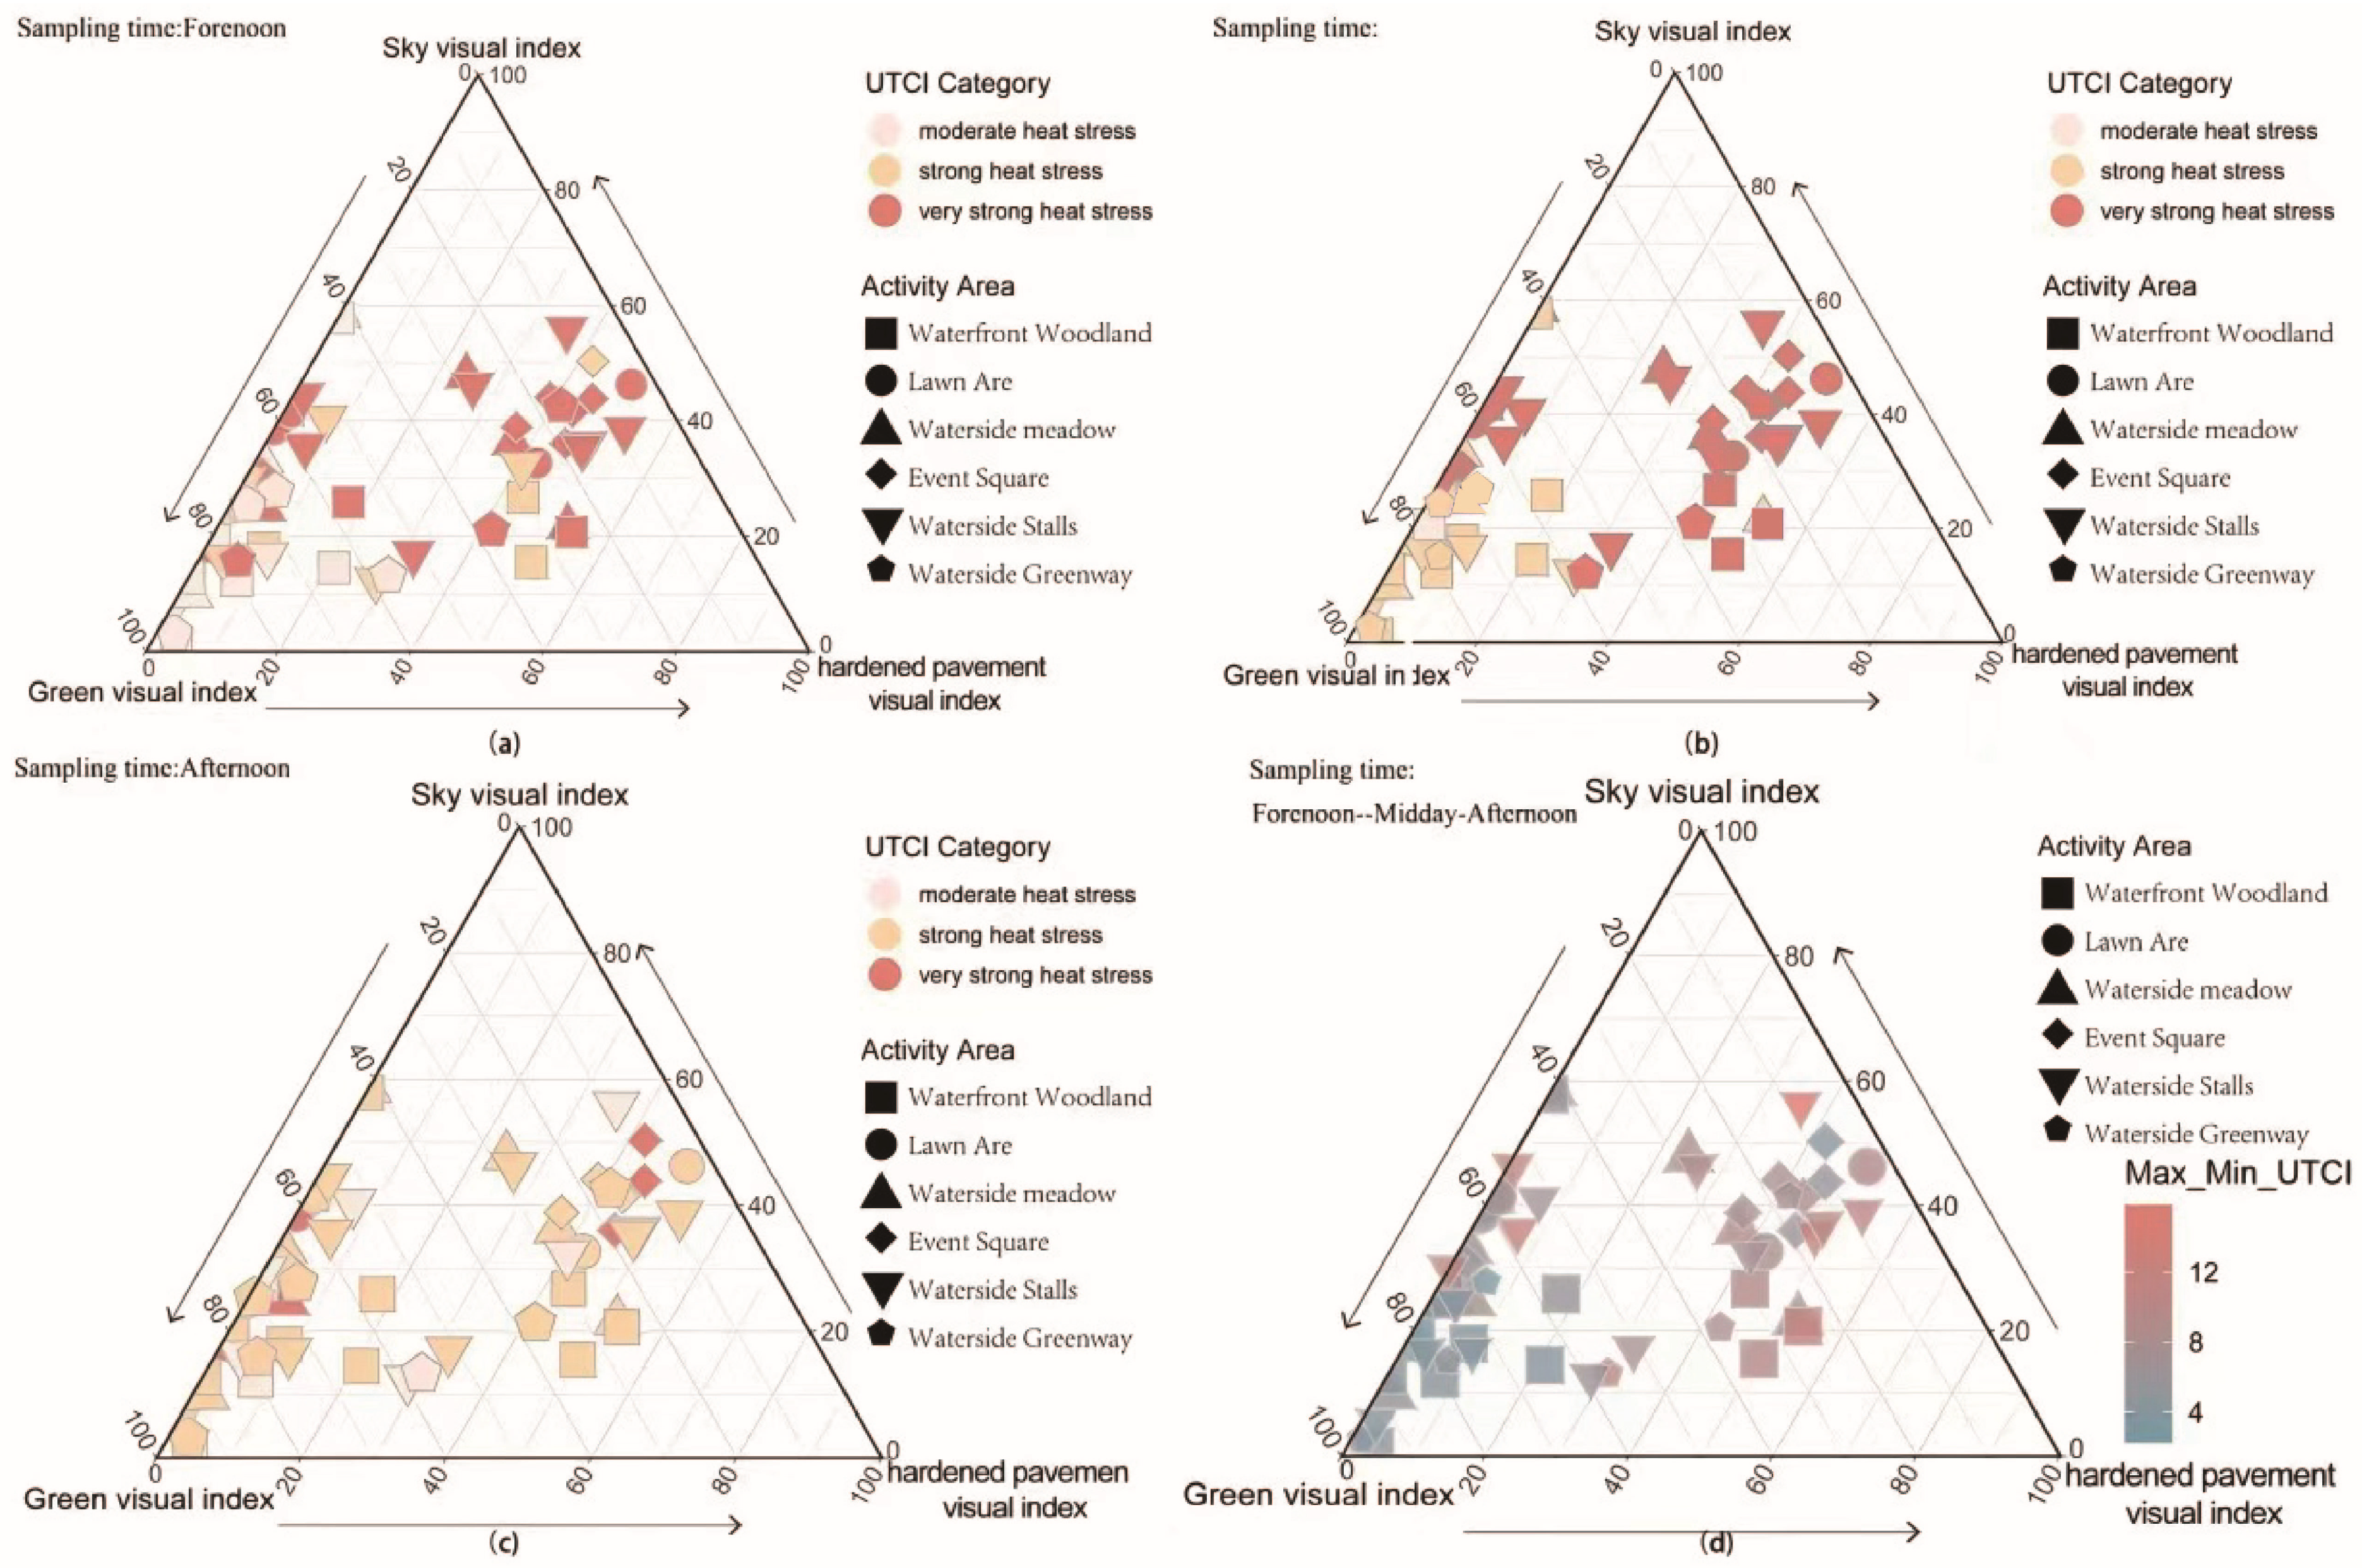
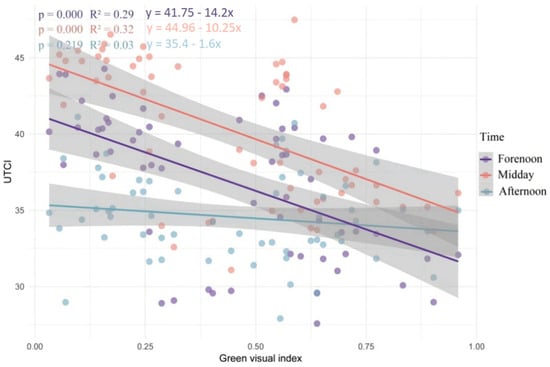
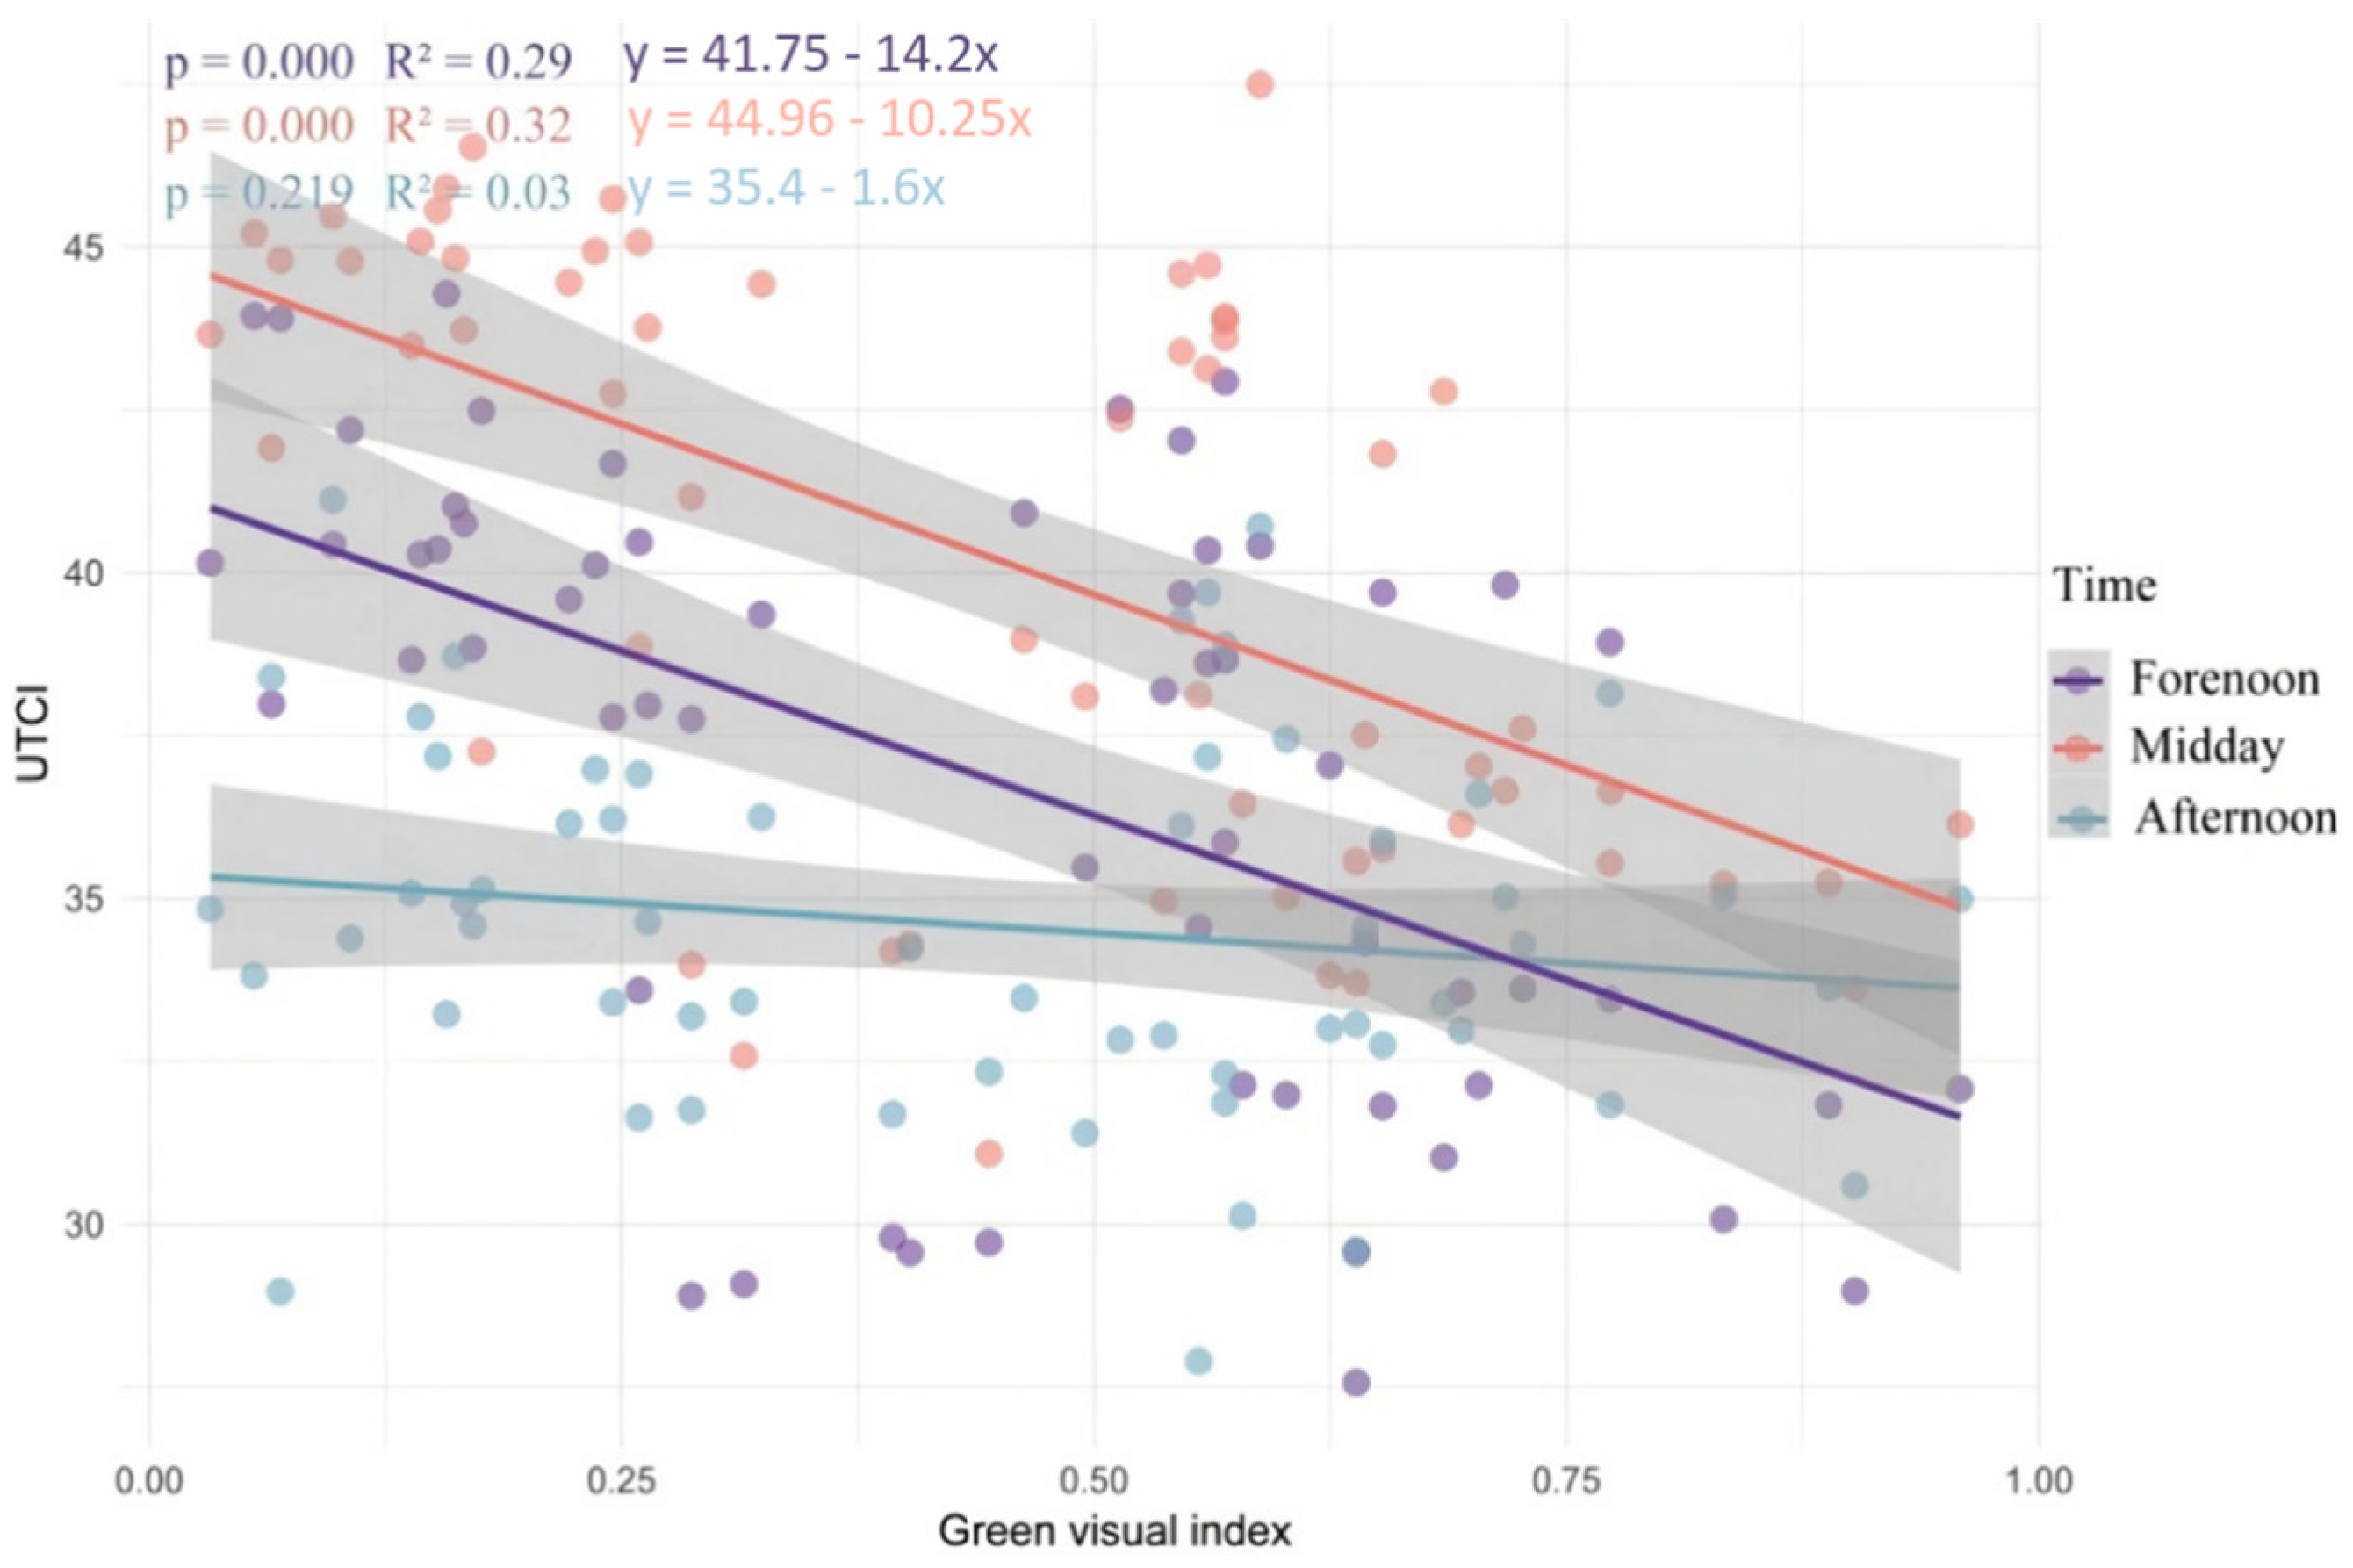
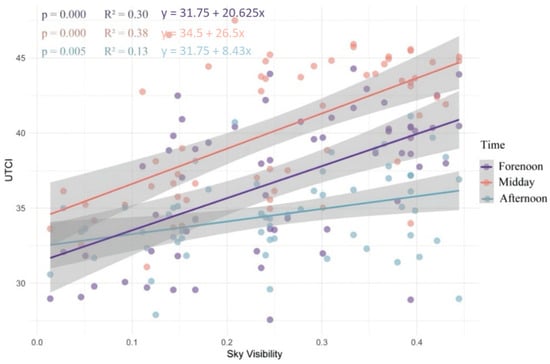
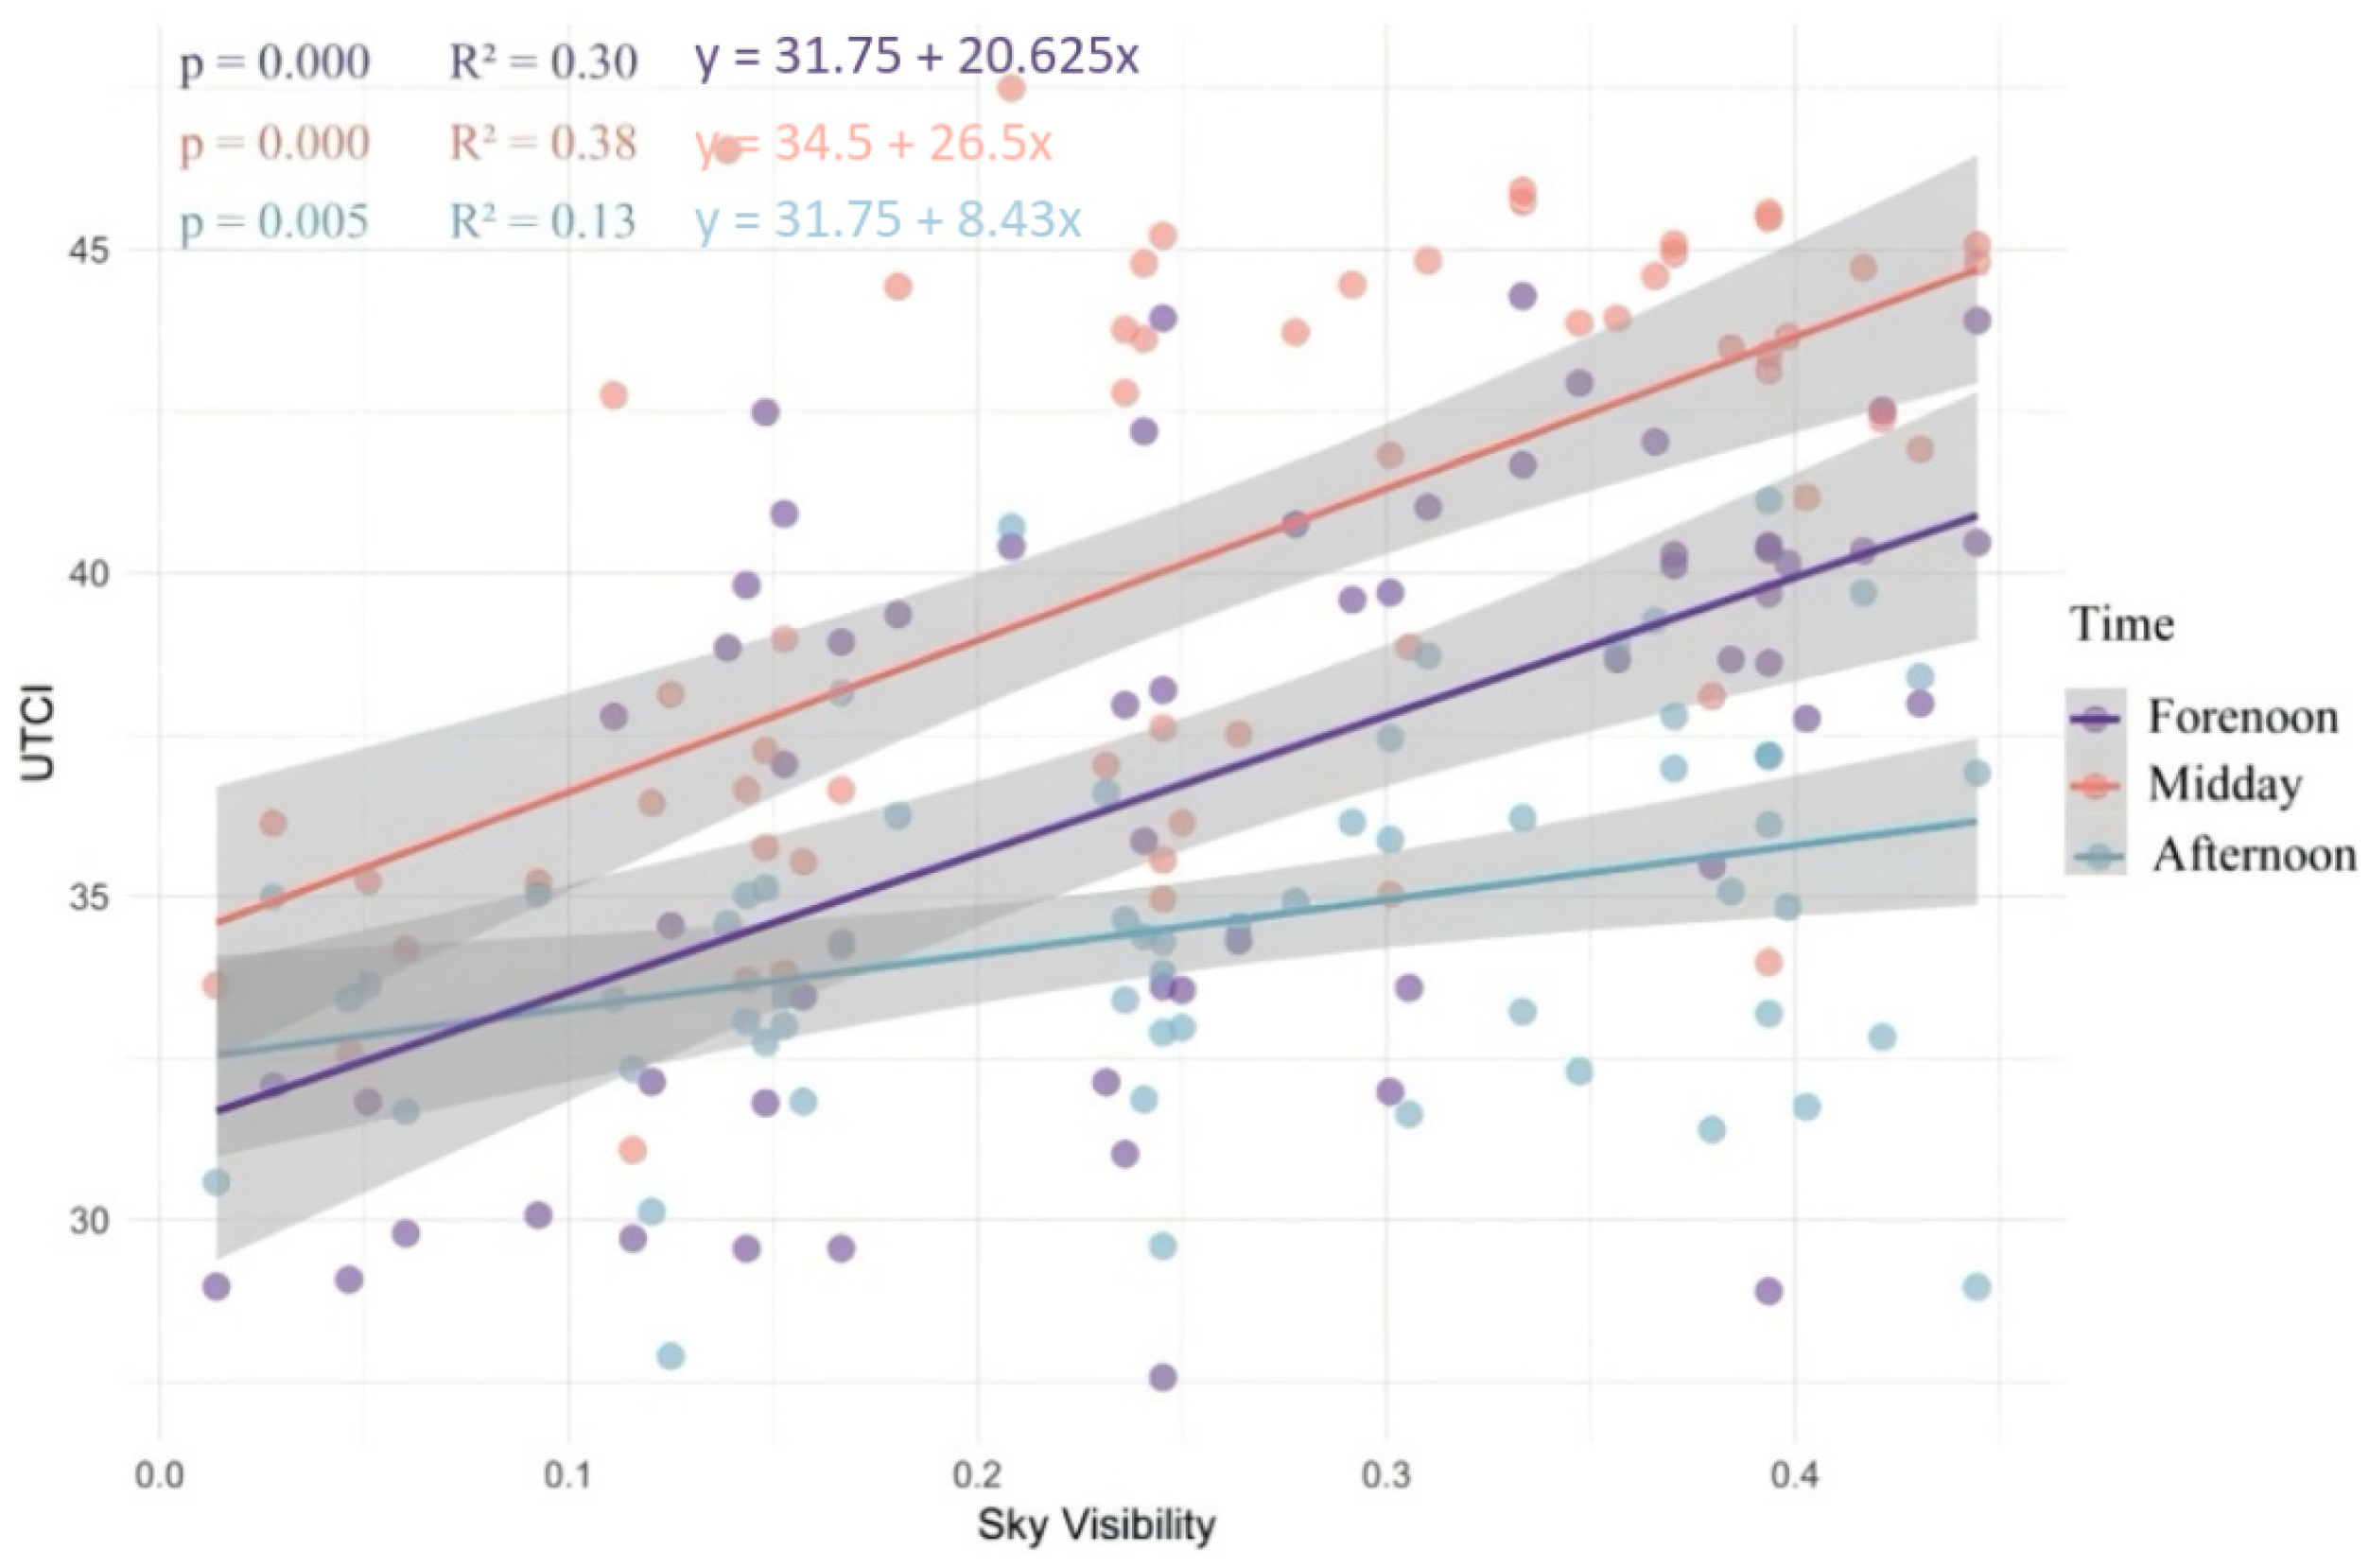
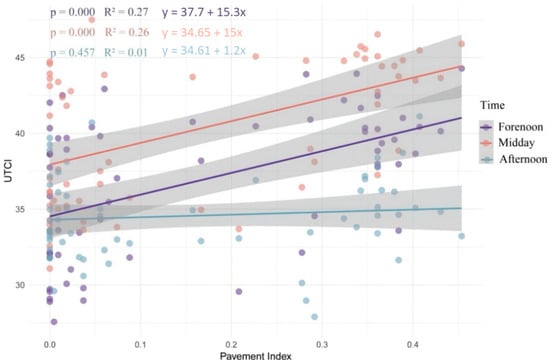
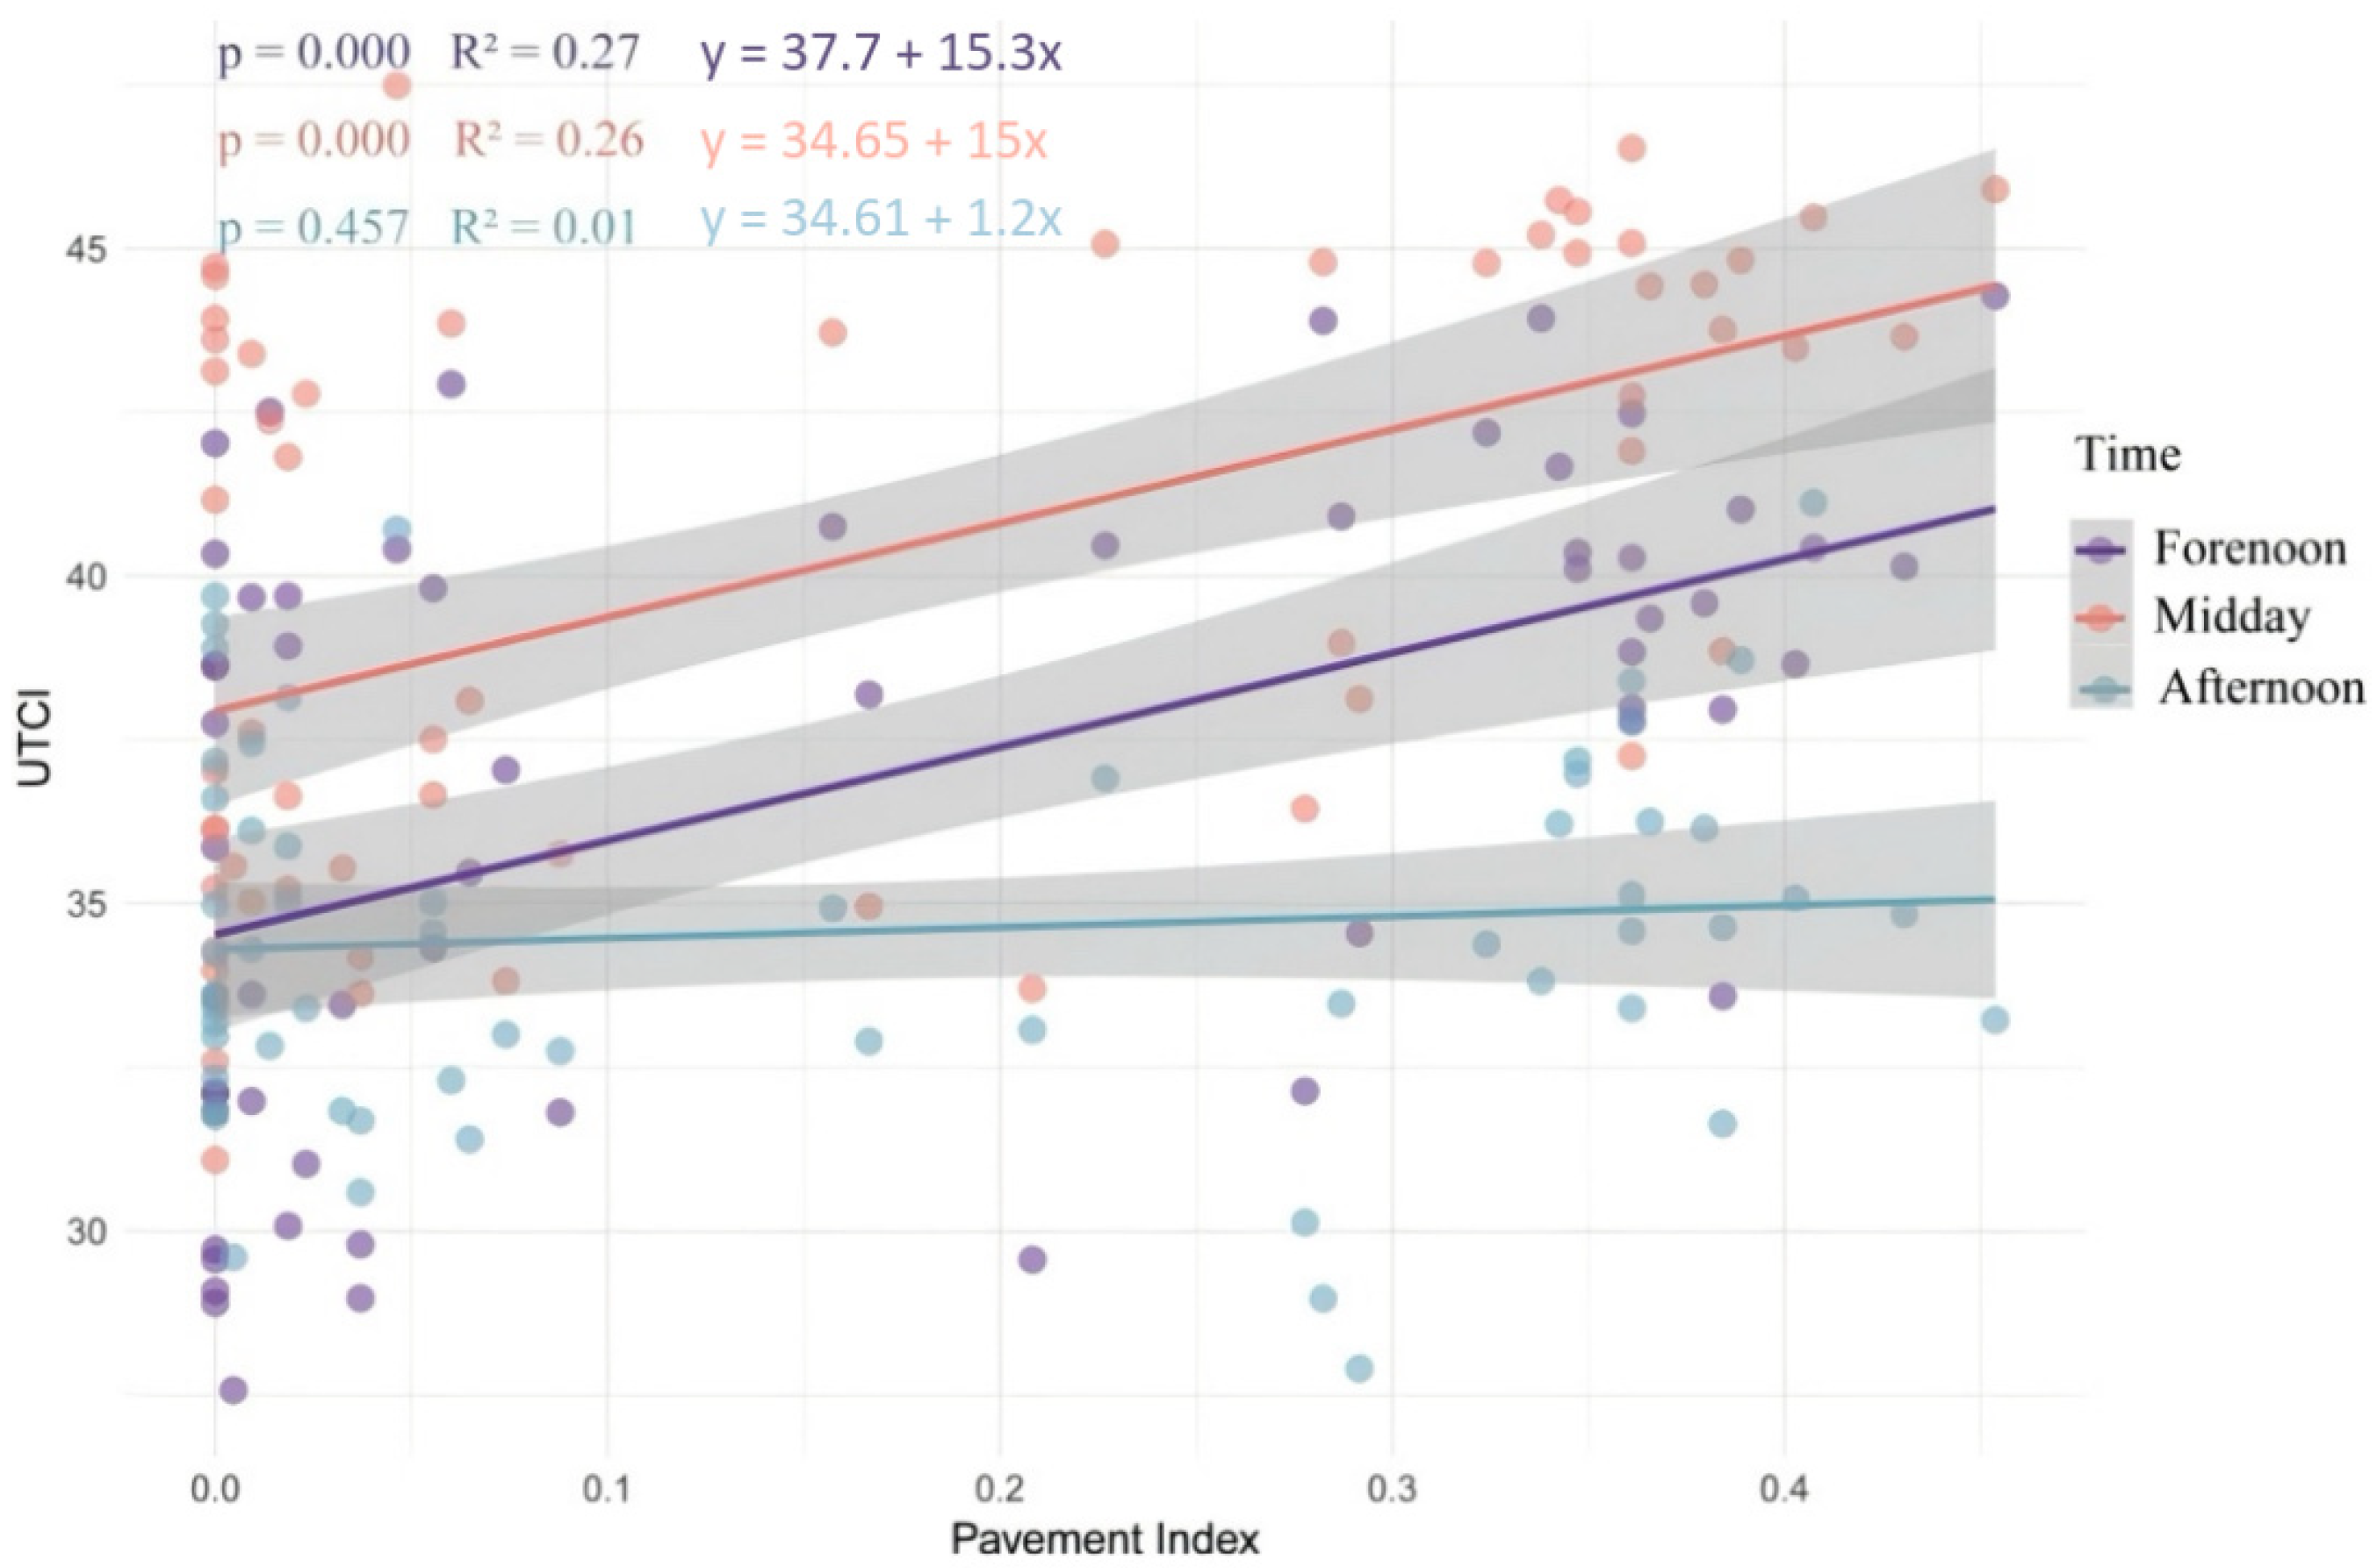
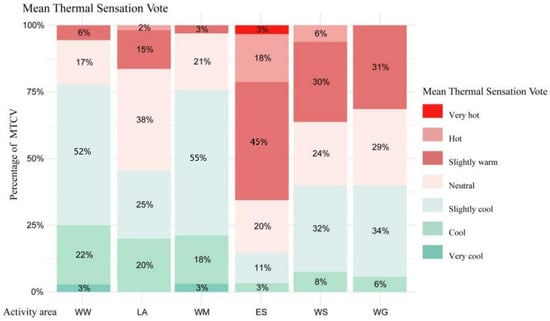
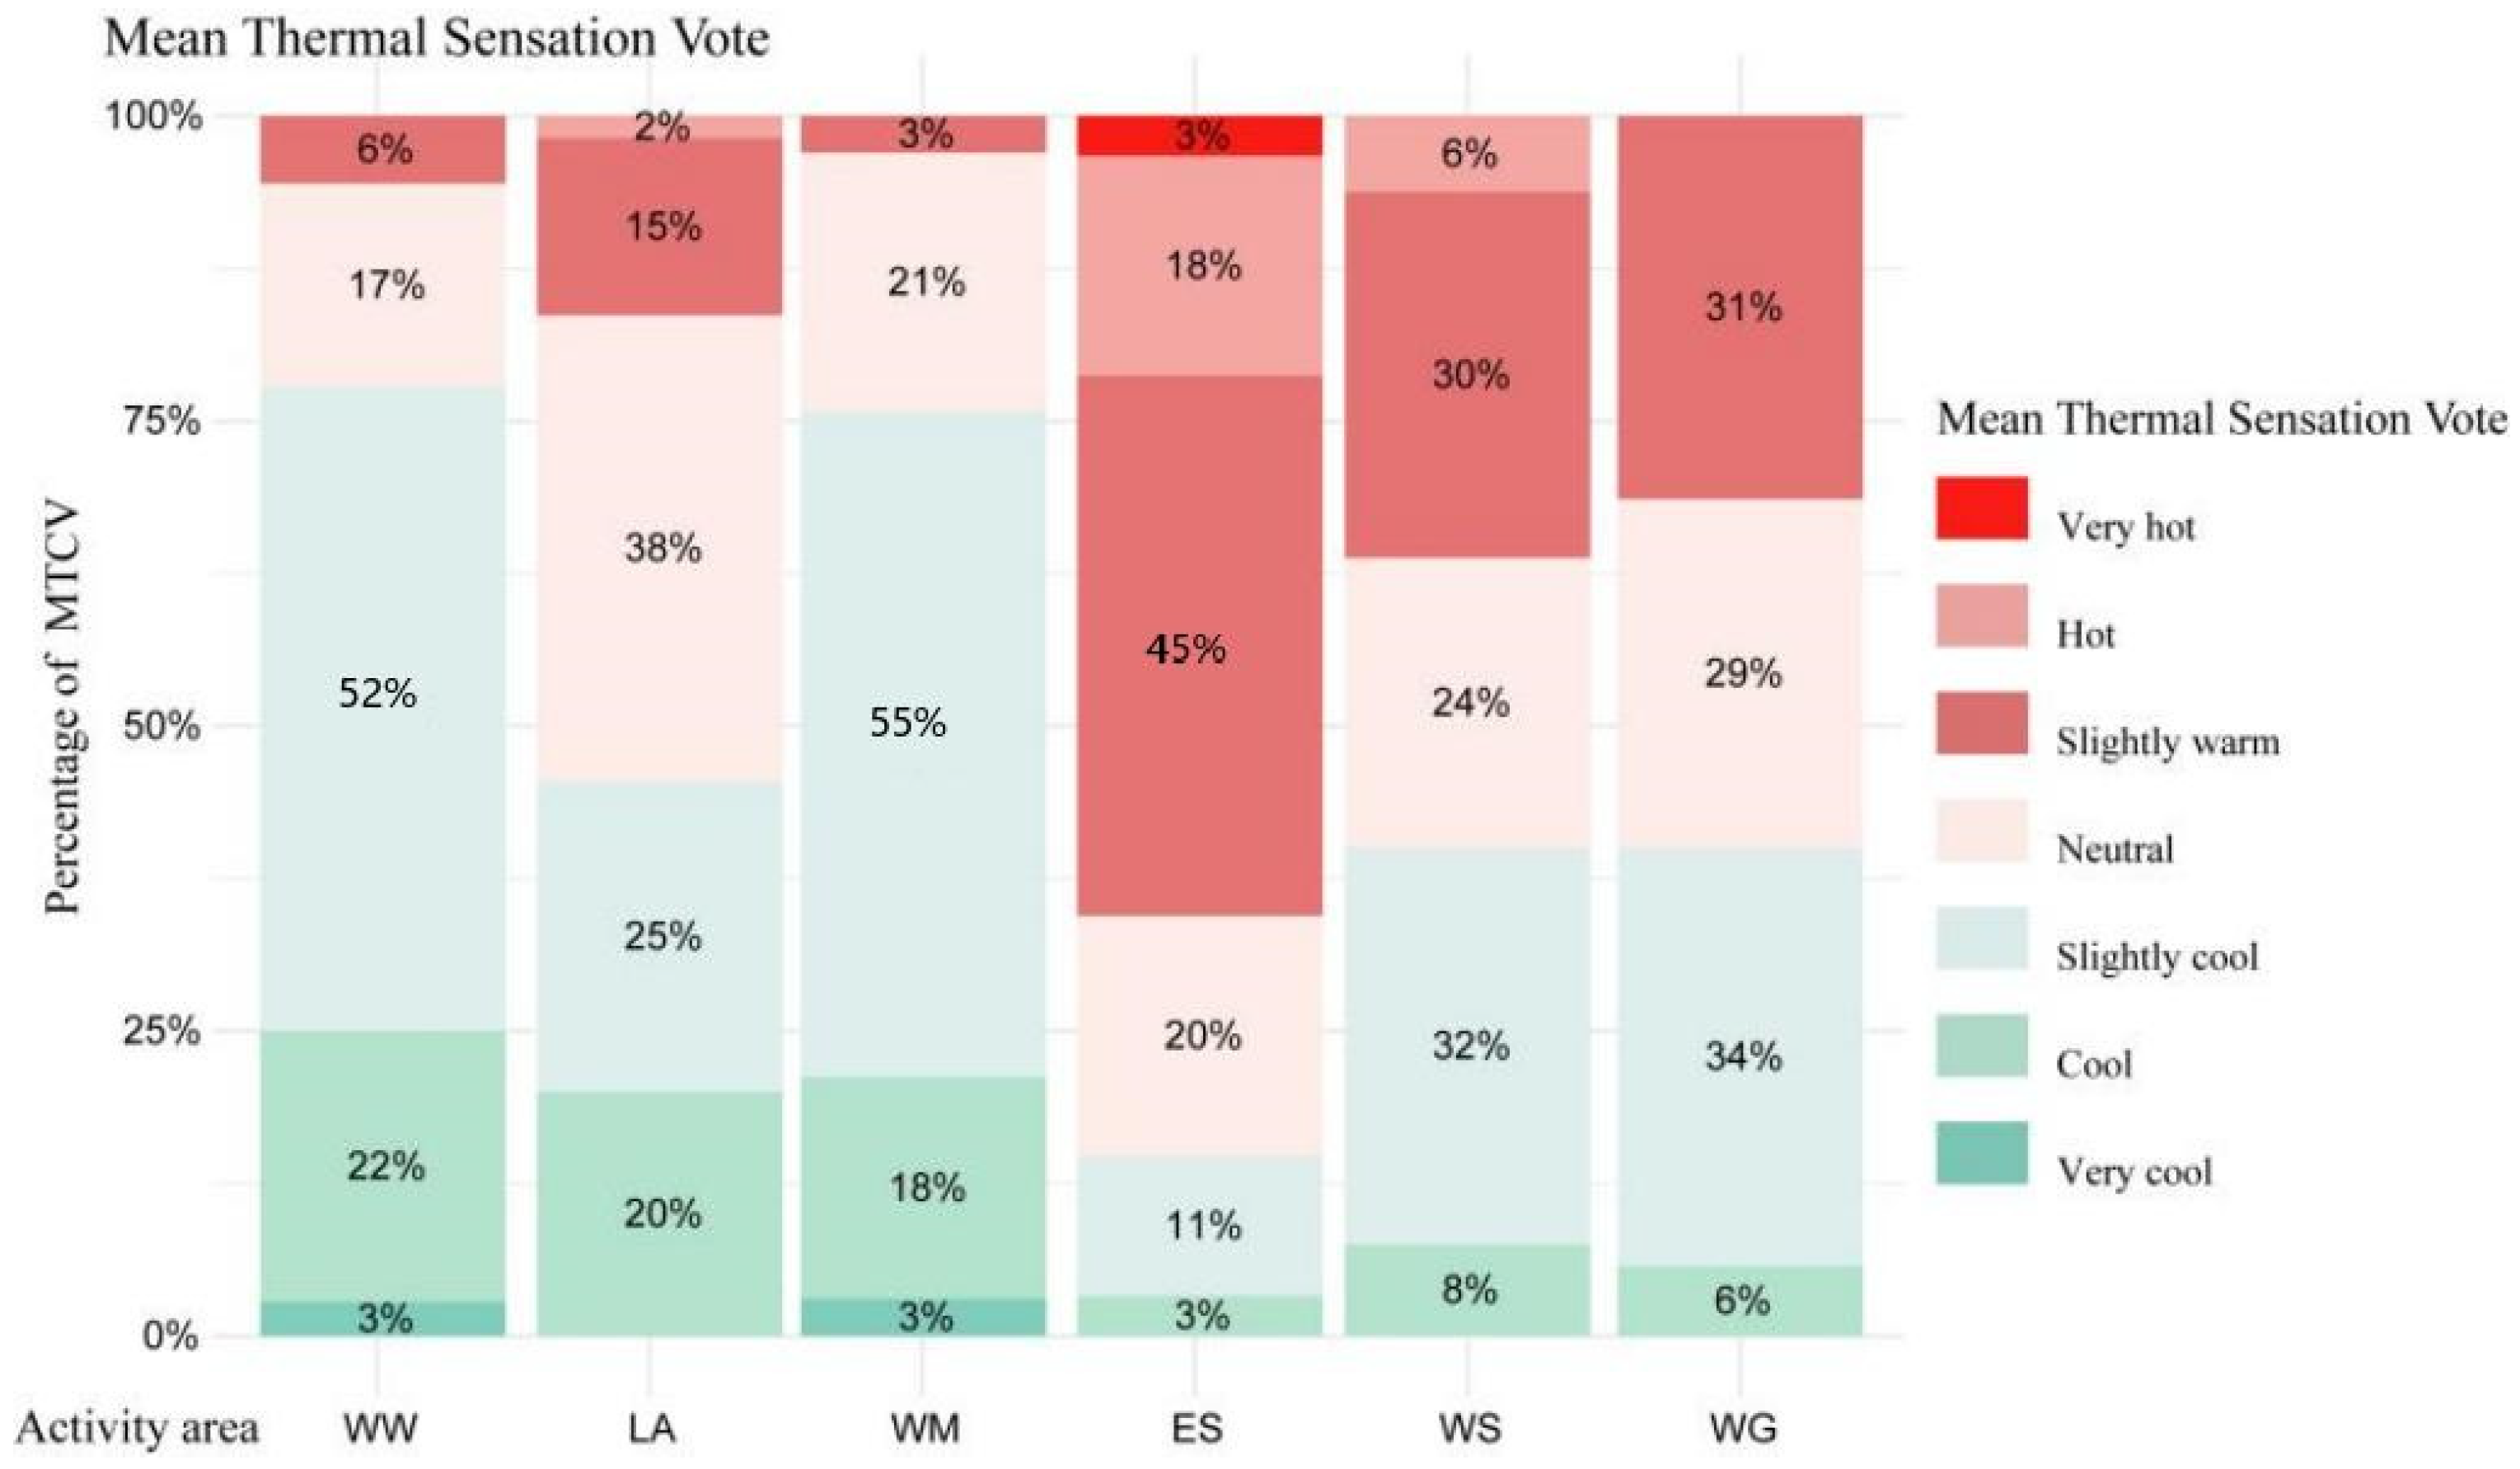
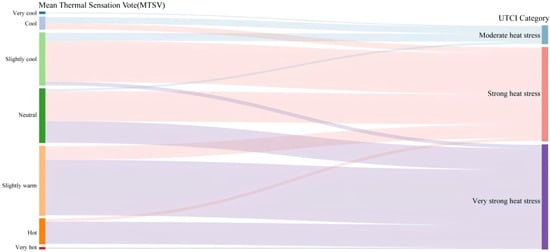
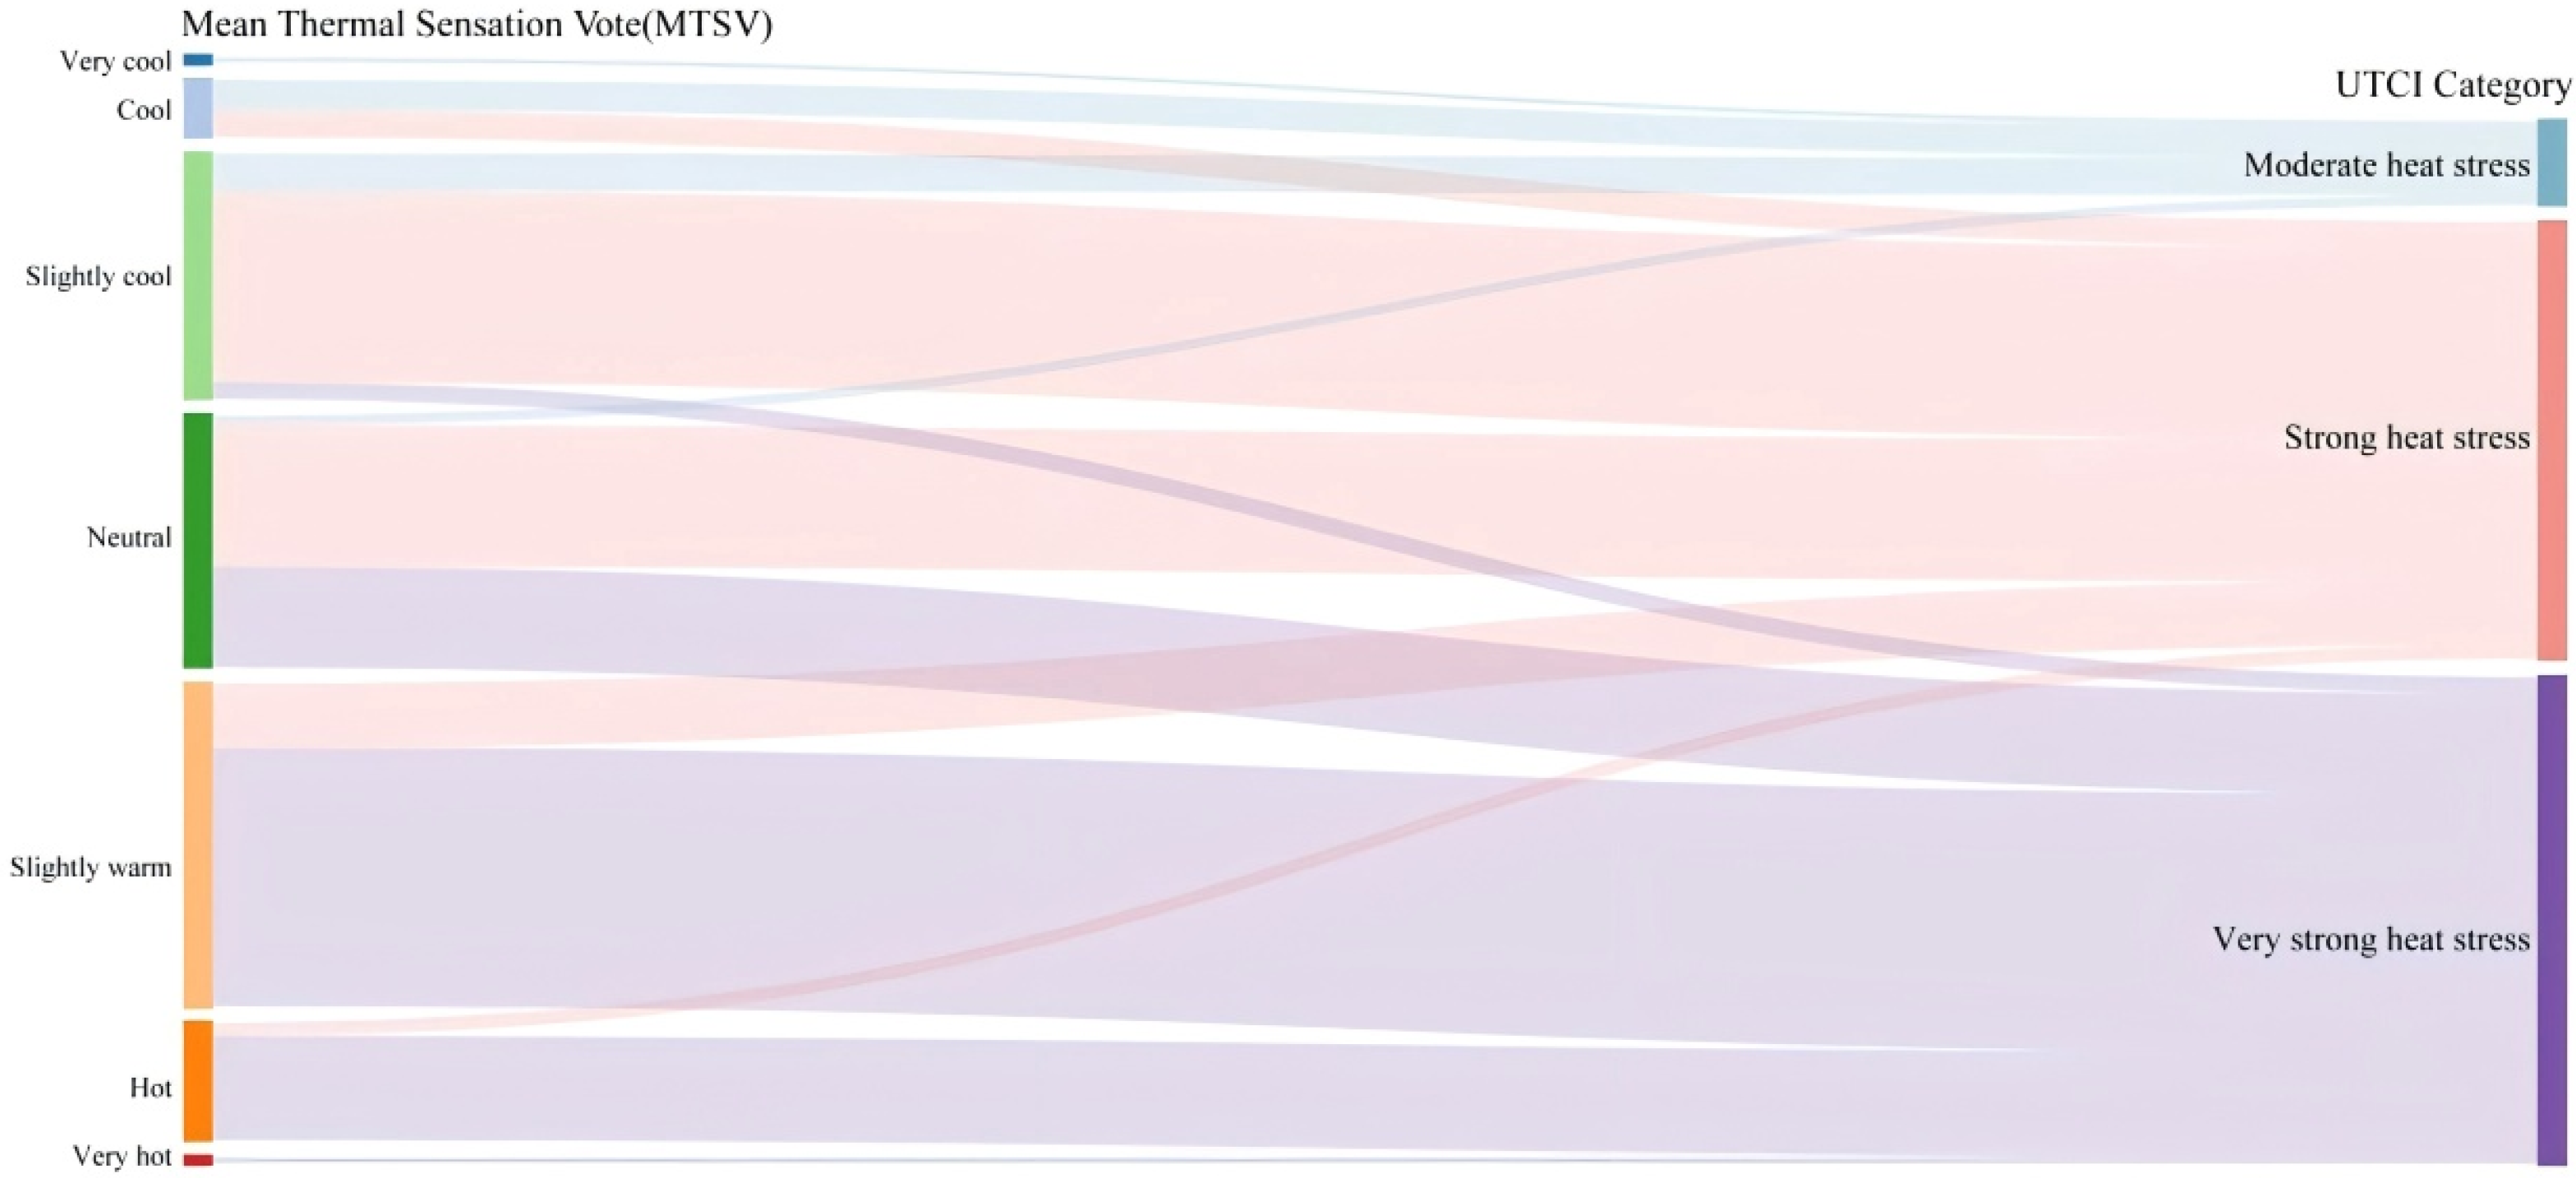
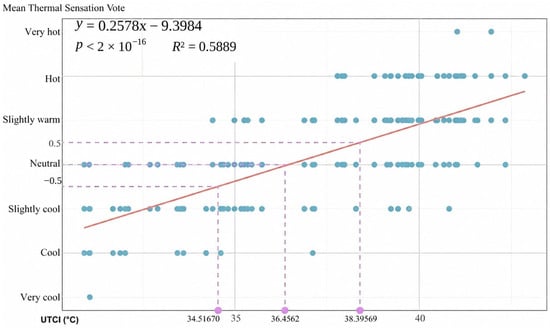
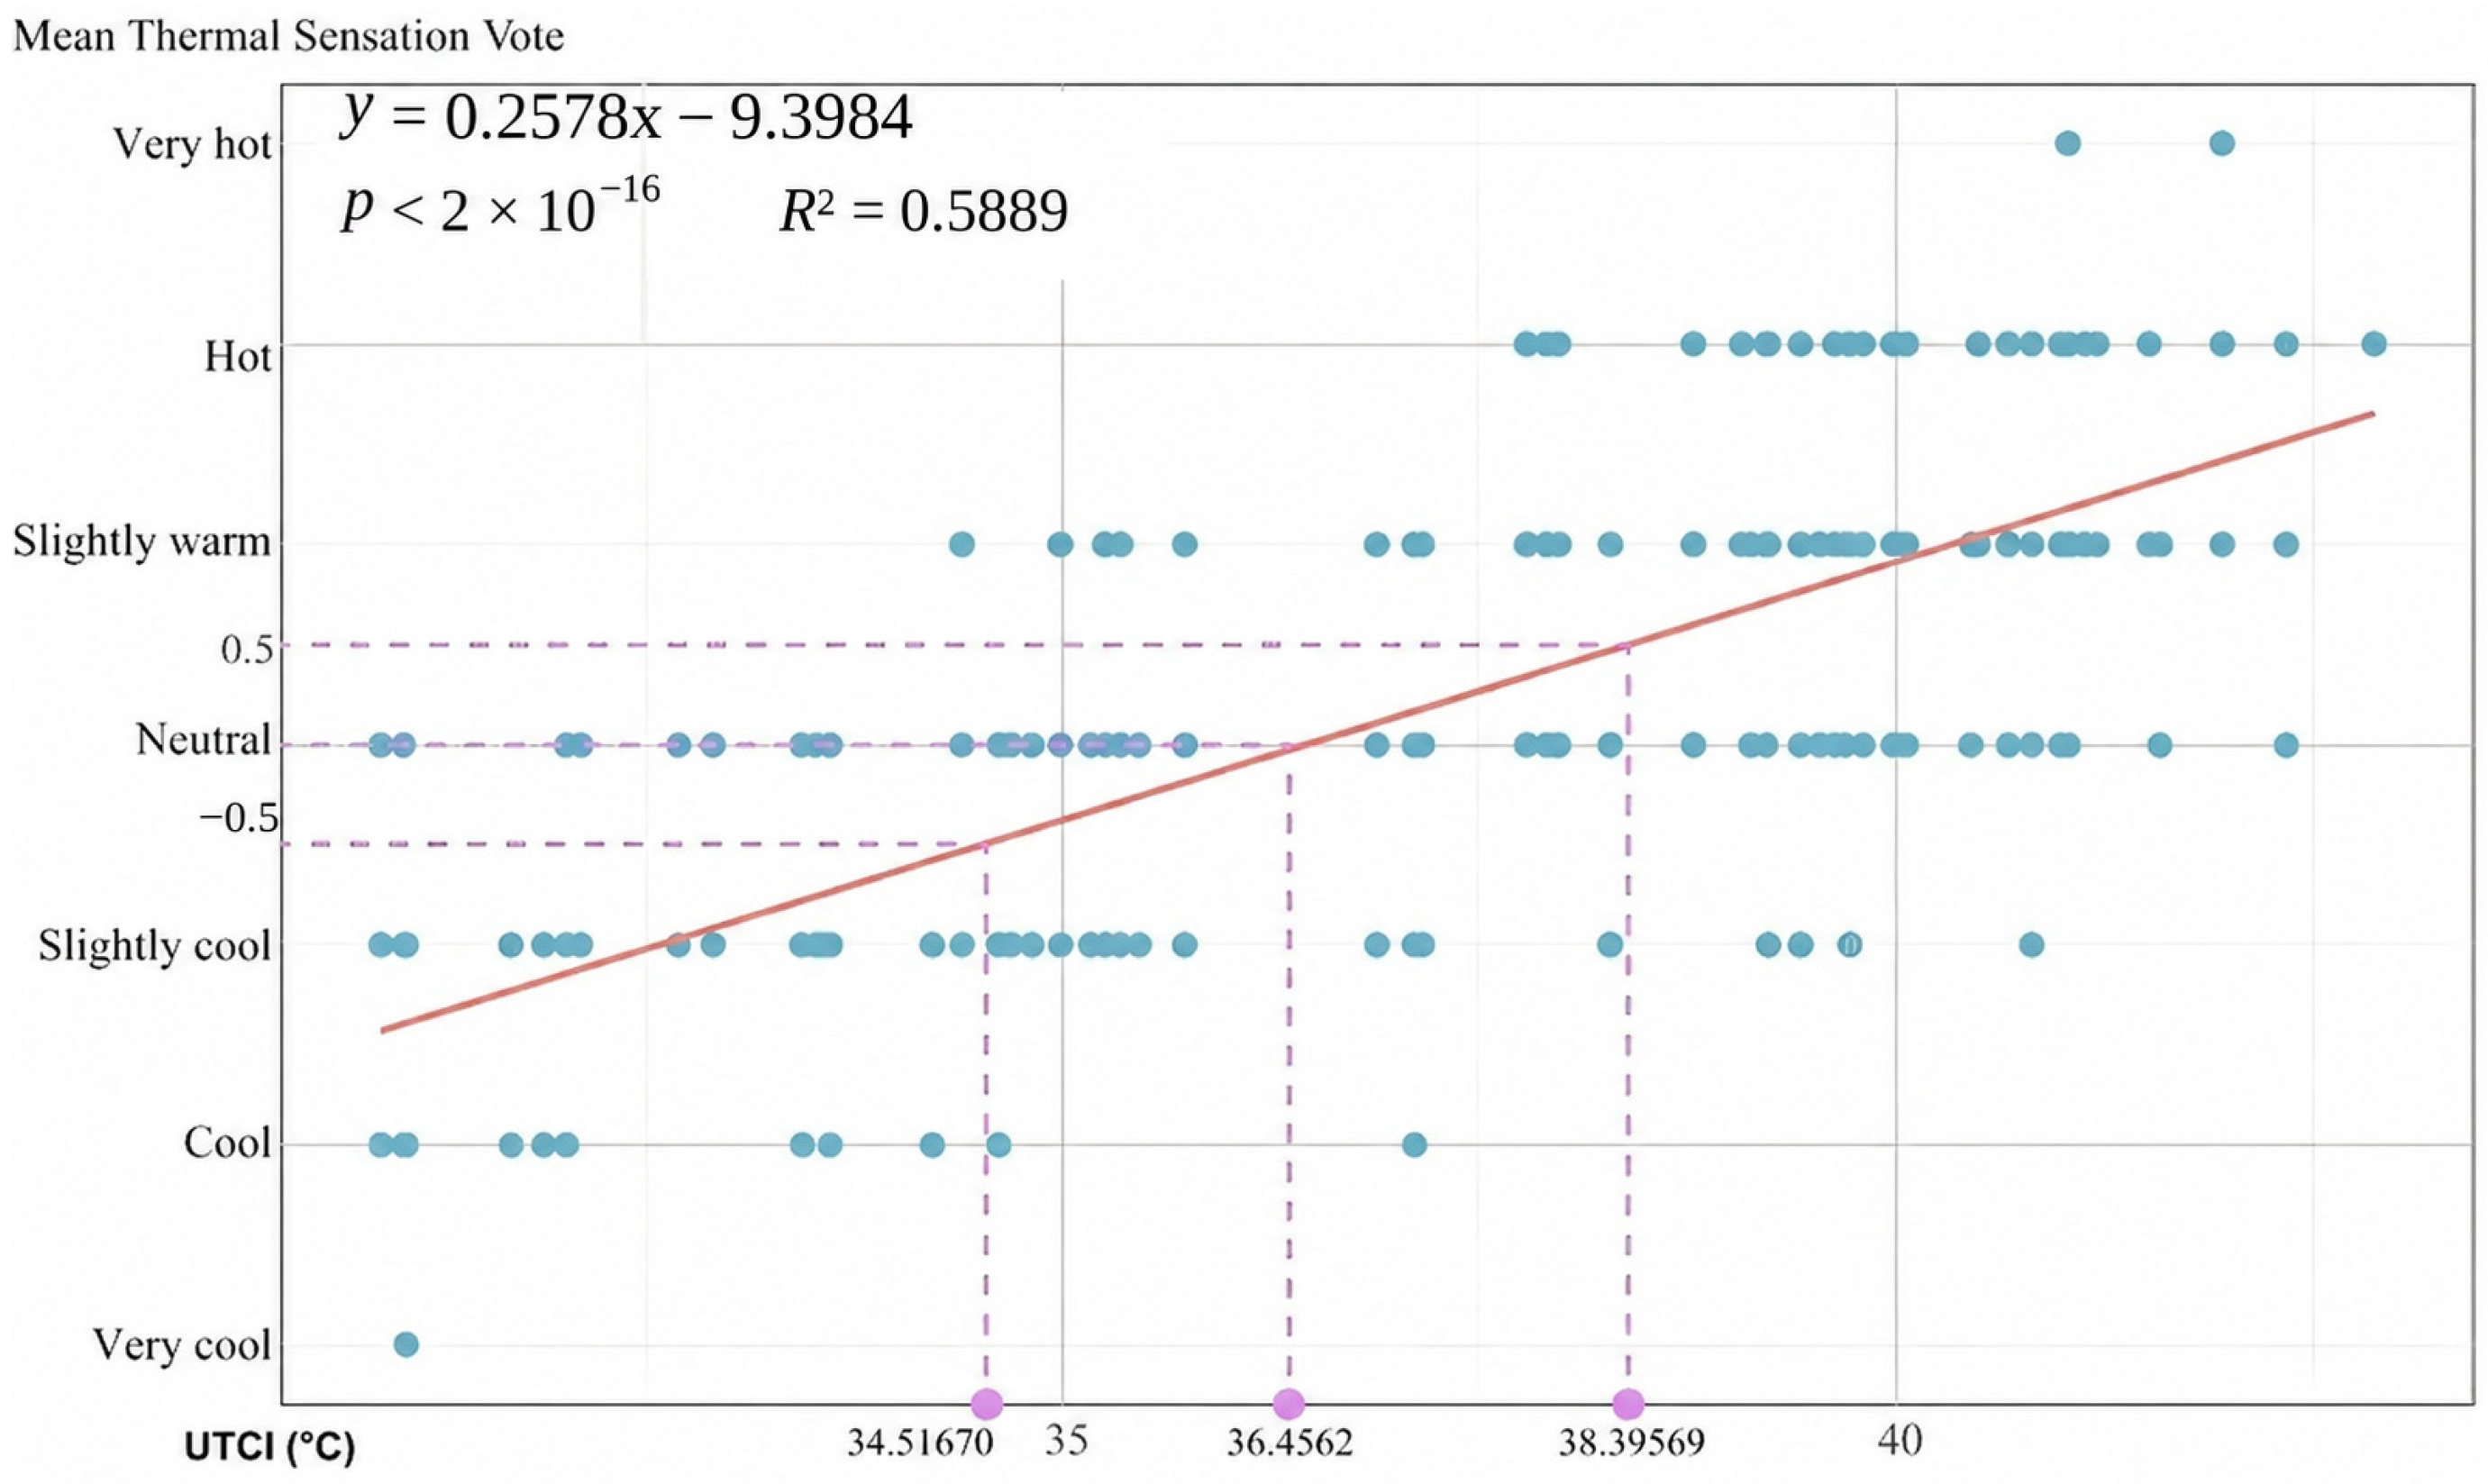
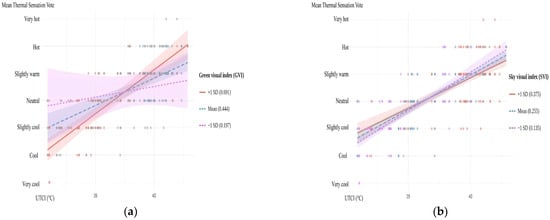
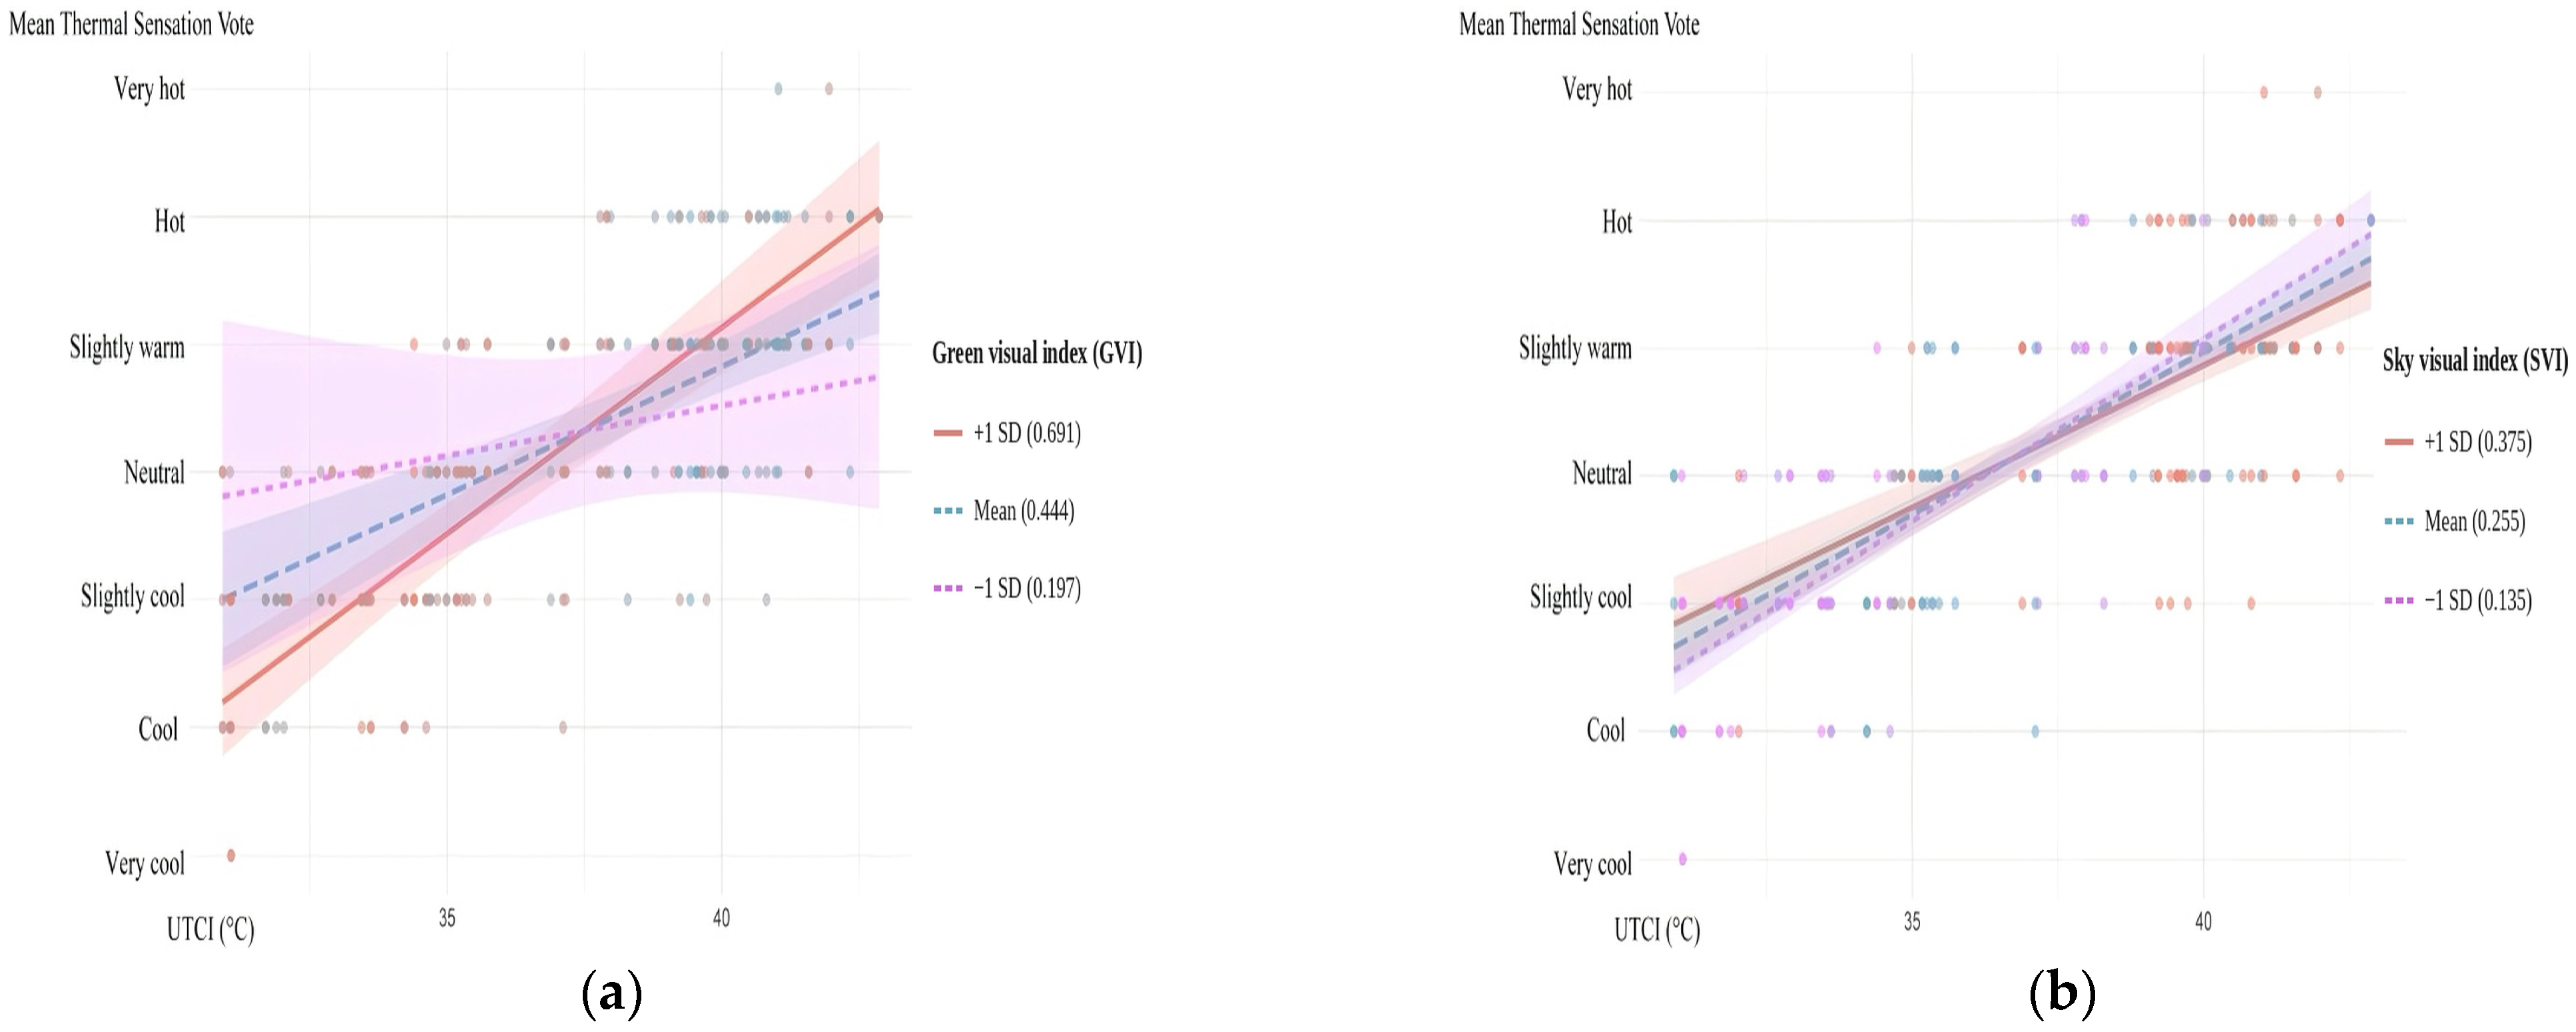

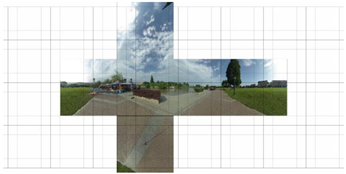

Disclaimer/Publisher’s Note: The statements, opinions and data contained in all publications are solely those of the individual author(s) and contributor(s) and not of MDPI and/or the editor(s). MDPI and/or the editor(s) disclaim responsibility for any injury to people or property resulting from any ideas, methods, instructions or products referred to in the content. |
© 2026 by the authors. Licensee MDPI, Basel, Switzerland. This article is an open access article distributed under the terms and conditions of the Creative Commons Attribution (CC BY) license.