


Abstract
Building-integrated photovoltaics (BIPV) can combine the renovation of the building envelope with on-site electricity generation, contributing to the sustainable renovation of buildings (reduction in carbon emissions and increased energy efficiency). Yet their uptake in existing buildings remains limited. This exploratory study examines how 16 property owners, architects and engineers in Northern Portugal, recruited through a purposive convenience sample, perceive fourteen barriers to BIPV adoption, grouped into economic, knowledge, technological and supply-chain categories, and how those perceptions relate to two single-item outcomes: the view that the benefits of BIPV outweigh its additional costs (perception) and the view that BIPV should play an important role in the energy renovation of the existing stock (perspective). Linguistic Likert answers were represented as triangular fuzzy numbers (TFNs), converted into crisp scores with the CFCS technique, and analysed descriptively and with fuzzy-set qualitative comparative analysis (fsQCA), accompanied by sensitivity analyses of calibration and thresholds. Sixteen persona-conditioned synthetic respondents, built from the participants’ profiles and generated five times under two prompts, were processed in the same way. Barriers were perceived as at least moderately important, and the lack of information and technical guidance ranked first. Respondents were more favourable towards the future role of BIPV (CFCS = 0.719) than towards its current benefit–cost balance (0.544). In the fsQCA, technological barriers were present in all configurations, leading to the absence of a positive perspective, but detailed configurations were sensitive to calibration choices and are interpreted cautiously. The synthetic samples reproduced the average outcome scores but compressed variance, rated technological barriers lower, depended strongly on the context given in the prompt for incentive-related items and showed no individual-level correspondence with the humans on whose profiles they were based. LLM personas may therefore complement, but not replace, human respondents.
1. Introduction
Decarbonising the European building stock requires a substantial reduction in the energy demand of existing buildings and a wider use of renewable energy at the point of consumption. Directive (EU) 2024/1275 on the energy performance of buildings sets the objective of a zero-emission building stock by 2050 and obliges Member States to draw up national renovation plans, including an assessment of market barriers and of the capacities available in the construction, energy-efficiency and renewable-energy sectors [1]. The recital of the same directive notes that buildings account for roughly 40% of the Union’s energy consumption and 36% of its energy-related greenhouse gas emissions, while Directive (EU) 2023/1791 reinforces the framework through the ‘energy efficiency first’ principle [2]. Portugal’s draft National Building Renovation Plan follows this logic. The European Commission’s feedback on the draft acknowledges its targets for the residential stock and for renewable integration but asks for clearer objectives, impacts and funding periods and for stronger measures on the worst-performing buildings and on energy poverty [3,4]. The renovation challenge is made harder by the age of the stock. European residential buildings were largely built before modern energy requirements existed, so that renovation is considered a central route to meeting efficiency targets [5,6].
Building-integrated photovoltaics (BIPV) are of particular interest in this context. A BIPV element generates electricity and, at the same time, fulfils a function of the building envelope, such as roofing, cladding, shading or glazing, so that its removal would require replacing it with an equivalent construction component [7]. This dual function distinguishes BIPV from building-applied photovoltaics (BAPV), in which standard modules are added on top of an existing envelope [8,9]. In a renovation project that already foresees replacing a roof or a façade layer, BIPV can offset part of the cost of the displaced materials, exploit surfaces beyond the roof and contribute to the architectural renewal of the building [10,11,12,13,14].
Despite these attributes, BIPV remains a niche market. The literature associates this with a set of barriers that includes high initial costs, design complexity, performance and safety risks, certification procedures, limited product availability, insufficient information, a shortage of qualified professionals and weak coordination between the construction and photovoltaic sectors [8,9,15,16,17,18,19]. These barriers do not act in isolation. A lack of technical guidance, for instance, increases uncertainty, delays decisions and favours better-known BAPV solutions, which in turn weakens demand for integrated products and for specialised training. Moreover, BIPV sits at the intersection of two industries with different vocabularies, risk profiles and decision criteria [15], so that owners, architects and engineers may not experience the same obstacles with the same intensity.
Three gaps motivate the present study. First, research on BIPV has traditionally concentrated on technological, architectural, energy-performance and economic questions [20], whereas the adoption of BIPV in the renovation of existing buildings has received comparatively less attention [12,14,21]. Renovation changes the meaning of several barriers: the relevant cost is the increment over conventional envelope materials rather than the price of a photovoltaic system, and the technical difficulty lies in fitting a multifunctional component to an existing structure. Findings from general BIPV-adoption studies cannot be transferred automatically to this setting. Second, empirical work on stakeholder perceptions typically treats barriers one at a time, even though the literature itself stresses their interdependence, and it normally handles Likert answers as if the verbal categories had sharp, equidistant boundaries. Third, the recruitment of specialised respondents is difficult and slow, which has led some authors to explore large language models (LLMs) as generators of synthetic survey responses [22]. Evidence on their reliability is mixed [23,24,25], and little is known about whether synthetic answers preserve not only average scores but also the configurational structure of the relations between barriers and attitudes.
The main objective of this study is therefore to analyse how homeowners, architects and engineers in Northern Portugal perceive the barriers to BIPV adoption in the renovation of residential buildings and under which combinations of barrier categories BIPV is judged favourably. Northern Portugal serves as an example of a region with an ageing residential stock, a favourable solar resource and a renovation policy shaped by the national plan. The study addresses three research questions. RQ1: How severe are the economic, knowledge, technological and supply-chain barriers perceived to be, and do they differ across categories and stakeholder roles? RQ2: How do these barriers combine in explaining two different outcomes, namely the perceived benefit–cost balance of BIPV and the expected role of BIPV in the energy renovation of the existing stock? RQ3: To what extent do persona-conditioned synthetic respondents reproduce the human results at the descriptive and configurational levels? The human survey is the main empirical source; the synthetic samples are a complementary methodological experiment. The study is exploratory: it relies on a small purposive sample and on perceptions, not on observed adoption decisions, and its propositions are examined descriptively and configurationally, not tested for population-level inference.
To answer these questions, linguistic Likert responses are converted into triangular fuzzy numbers (TFNs), aggregated, and transformed into crisp scores through the Converting Fuzzy data into Crisp Scores (CFCS) technique, which handles the vagueness of verbal categories in a transparent way. The category-level scores of each respondent are then used as conditions in a fuzzy-set qualitative comparative analysis (fsQCA), which identifies necessary and sufficient combinations of barriers for each outcome. The same procedure is applied to synthetic samples of 16 LLM-generated personas that mirror the roles, experience and knowledge of the human respondents, generated five times under each of two prompts that differ in the contextual information provided, and the samples are compared with paired analyses, effect sizes and non-parametric tests. Because calibration choices matter greatly when cases are few, the configurational results are accompanied by a sensitivity analysis of calibration anchors, thresholds and scoring.
The study makes four contributions. It provides exploratory evidence on stakeholder perceptions of BIPV barriers in the specific context of building renovation in Southern Europe; it shows how TFN/CFCS and fsQCA can be combined to treat linguistic vagueness and barrier interdependence in a methodologically consistent way and documents how far the configurational results depend on calibration choices when cases are few; it separates the perceived current benefit–cost balance from the expected strategic role of BIPV and explores whether they follow different configurations; and it offers a structured assessment of the extent to which persona-conditioned LLM responses reproduce descriptive and configurational patterns of human respondents, indicating which findings are robust to the substitution, to the context given in the prompt and to repeated generation, and which are not.
Four features of the evidence should be kept in mind throughout. First, the human sample is small (16), is non-probabilistic and was recruited over ten days, so the results describe patterns in this sample and are not estimates for stakeholder populations. Second, both outcomes are single items that measure opinions, not adoption behaviour, and the knowledge profiles are self-reported and unverified (Section 6). Third, with few cases and discrete answers, fsQCA solutions are sensitive to calibration; configurations are therefore interpreted only to the extent that they are stable across specifications (Section 4.5.4). Fourth, the synthetic samples are conditioned on the participants’ self-reported profiles and are analysed as a methodological comparison, not as a substitute for human respondents.
This study contributes to sustainability research in three ways. First, it provides measurable and repeatable indicators of perceived barriers (four category scores and two outcome scores) that can be monitored across regions and over time, for example to assess whether information programmes or support schemes reduce the barriers perceived by the actors who decide on renovations. Second, it identifies which barriers are associated with support for BIPV in building renovation, a technology aligned with SDG 7, SDG 11 and SDG 13, and therefore where policies and industry measures may be most useful. Third, it evaluates whether LLM-generated personas can serve as a low-cost tool for pre-testing sustainability surveys and policies and shows their limits.
The rest of the paper is organised as follows. Section 2 reviews the literature on BIPV in renovation, on barriers and stakeholders, and on fuzzy, configurational and synthetic-sample methods and formulates eleven exploratory propositions. Section 3 describes the survey, the samples, the fuzzy treatment, the fsQCA procedure and the sensitivity analysis. Section 4 reports the results for the human sample, the synthetic samples and their comparison. Section 5 discusses the evidence pattern for each proposition in the light of previous research, and Section 6 presents the conclusions, implications, limitations and lines for future research.
2. Literature Review
2.1. BIPV in the Energy Renovation of Buildings
International definitions agree on the requirement of dual functionality: a BIPV module forms part of the building envelope and generates electricity, and its removal requires its replacement by an equivalent component [7]. Standards such as EN 50583 [26,27] and IEC 63092 [28,29] formalise this logic, and the distinction has practical consequences. A module fixed on a roof or façade without replacing any envelope layer is BAPV, regardless of how well it looks [8,9]. Because BIPV replaces materials, the relevant economic comparison is between functionally equivalent envelope solutions rather than between the price of BIPV and BAPV modules [14,30]. Integration also carries simultaneous electrical and constructional requirements, such as safety, mechanical strength, watertightness, thermal behaviour, durability and maintenance, which calls for coordination among owners, architects, engineers, manufacturers and installers from the earliest design stages [16,31].
The renovation context offers specific opportunities and constraints. Existing roofs and façades can be replaced or overclad, and renovation projects can use large surfaces for generation. Martín-Chivelet et al. [11] demonstrated a retrofit with a ventilated BIPV façade and argued for its replicability, and Aguacil et al. [12] proposed a method for selecting active BIPV surfaces in renovation projects based on self-consumption and self-sufficiency. Life-cycle assessment and costing of residential BIPV renovation scenarios indicate that well-designed interventions can improve environmental performance while addressing economic objectives [13]. At the same time, structural capacity, orientation, shading, existing electrical systems, occupancy during works and heritage restrictions limit the design space [32,33]. A recent review of BIPV in building renovation concludes that its suitability depends on the building, the planned intervention, the product, the scale and the market context [14]. Adoption in renovation is thus a multidimensional decision rather than a question of photovoltaic performance alone, and it takes place within a European framework that integrates renovation, energy efficiency and renewable generation [1].
2.2. Barriers to BIPV Adoption
Previous reviews and empirical studies organise adoption barriers into several families [8,9,15,34]. Based on 43 stakeholder interviews, Curtius [15] classified determinants as product-specific, stakeholder-specific and institutional, with high initial costs and complexity, low awareness and political uncertainty as prominent examples. For the purposes of this study, the barriers are grouped into four categories.
Economic barriers include high upfront costs, long payback periods, insufficient incentives and uncertainty about future support schemes. Higher capital costs relative to conventional cladding or BAPV and the tendency of simple payback calculations to ignore the value of displaced materials are frequent themes [30,35]. Developer and consumer studies in Malaysia and Switzerland show that capital premiums and uncertain returns weigh heavily on decisions and that business models which lower upfront outlays increase acceptance [36,37].
Knowledge barriers comprise the lack of information, technical guidance and application examples and the shortage of qualified professionals and specialised training. Heinstein et al. [8] documented persistent misconceptions about BIPV, and Attoye et al. [38] argued that educational and communication gaps limit early-stage design adoption. Recent reviews and innovation-system analyses continue to list awareness, expertise, official guidance and training among the main obstacles [17,19,21].
Technological barriers refer to uncertainty about performance and to the complexity of design, installation and maintenance. Yang [31] analysed technical risks along the project cycle and showed that design, installation, operation and coordination problems are tied to skills and decision processes. Thermal behaviour, partial shading, wiring in façade joints, fire safety and cleaning are among the issues documented in the technical literature [9,39].
Supply-chain and market barriers include a market oriented towards conventional photovoltaic solutions, limited cooperation between the construction and energy sectors, and restricted availability of BIPV products. The BIPV value chain is fragmented and bridges two historically separate industries [15,40], and regulatory frameworks that treat photovoltaic modules and envelope components separately add certification burdens [16]. An interpretive structural model for Singapore verified by local experts stressed, in addition to economic issues, the lack of professionals and of cost-effective products and design tools [41], and a technological innovation system analysis for several countries found that BIPV acceptance among owners remains low to moderate, with a preference for BAPV and the need for information, qualified personnel, cross-sector collaboration and specific regulation [17,19].
The literature also reports drivers: mandatory policies and decarbonisation targets, aesthetic customisation of products, and new business models such as energy communities and community solar [37,42,43,44]. Two features of this literature matter for the present design. First, the barriers are interdependent: unclear regulation raises costs and delays, weak demand limits the supply of products and training, and the scarcity of demonstration projects reduces confidence [17,41]. Second, no single category is expected to dominate, because the evidence reviewed above documents all of them as active. Considering that the respondents of this study are active in a region where BIPV is far from mainstream, the following exploratory propositions are formulated:
P1 (RQ1): We expect respondents to perceive each of the fourteen barriers as at least moderately important (Medium or above), with a substantial share of respondents rating most barriers High or Very high.
P2 (RQ1): We expect knowledge-related barriers to be among the most highly rated categories, although differences between categories may be small relative to the dispersion across respondents.
The expectation in P2 follows from the repeated identification of knowledge deficits as foundational, since a technology cannot be specified, compared or priced if the stakeholders do not know it [21,31,38].
2.3. Stakeholders, Knowledge and Perception/Perspective on BIPV
The value chain of BIPV includes manufacturers, installers, contractors, developers, authorities and utilities, but three actors take the central decisions in residential renovation. Studies of renewable-energy adoption in the built environment emphasise that outcomes emerge from networks of such actors with different roles and knowledge [45]. Evidence on how these groups perceive BIPV is limited but suggestive. An analysis of variance among stakeholders in Singapore found that groups perceive the drivers of BIPV similarly but differ significantly on several barriers [46]. Developer perspectives in Malaysia concentrate on capital premiums and resale uncertainty [36], and studies on architects point to unfamiliarity with products and to reluctance to assume responsibility for the electrical interface [15,38]. This leads to the following exploratory proposition, which, given the size of the role groups (four owners, eight architects and four engineers), is examined descriptively.
P3 (RQ1): We explore whether the perceived importance of barriers, and the evaluation of BIPV, vary by stakeholder role.
Two important issues emerge to assess stakeholders’ attitude towards BIPV. On the one hand, it is highly relevant to know if stakeholders perceive that the benefits of BIPV outweigh the additional investment and installation costs under present conditions. On the other, it is very informative asking stakeholders about their perspective on BIPV playing an important role in the energy renovation of the existing stock, which is a strategic and forward-looking judgement. The two need not move together. Technological innovation system analyses describe BIPV as a technology whose market formation, knowledge diffusion and institutional support are still developing [17,19], so that confidence in its long-term role may coexist with doubts about present economics, especially when costs are compared with those of familiar alternatives and when incentives are uncertain [36,37].
P4 (RQ2): We expect respondents to assess the current benefit–cost balance of BIPV less favourably than the future role of BIPV in the energy renovation of existing buildings.
2.4. Linguistic Vagueness and Configurational Thinking
Likert statements are anchored on verbal labels such as ‘low’ or ‘high’ whose boundaries are not sharp, and treating them as equidistant integers hides the vagueness of the judgement. Fuzzy set theory and the notion of a linguistic variable provide a formal way to represent such terms [47]. Triangular fuzzy numbers (TFNs) are widely used for this purpose because they are computationally simple and capture gradual transitions between adjacent categories [48,49,50]. A TFN is a triplet (l, m, u) of a lower bound, modal value and upper bound. Aggregation across respondents can be done component-wise, the aggregate can be mapped back to a linguistic term through a distance measure [51], and it can be converted into a crisp score with the CFCS technique [52]. This keeps the vagueness of the original judgement explicit until the last step and yields a score suitable for further analysis.
The second methodological concern is the interdependence of barriers. Conventional regression estimates the net effect of each variable and assumes that effects are symmetric, additive and homogeneous across cases. Configurational approaches start from different assumptions: outcomes result from combinations of conditions (conjunctural causation), several different combinations may lead to the same outcome (equifinality), and the conditions explaining the presence of an outcome may differ from those explaining its absence (causal asymmetry) [53,54,55]. Fuzzy-set QCA (fsQCA) implements this logic by calibrating variables into membership scores between 0 and 1 and examining necessity and sufficiency relations [53,56,57]. It has been applied widely in business, innovation and management research [58,59] and complements regression-based approaches [60,61]. It is also suited to small and intermediate samples, provided that calibration and thresholds are reported transparently [62,63]. Given the arguments of Section 2.2 on interdependence, the following exploratory propositions are formulated. Because fsQCA identifies set relations rather than net effects, they are framed as configurational and not as causal statements. With 16 cases, they are interpreted only to the extent that the results are stable across calibration and threshold choices (Section 3.6).
P5 (RQ2): We explore whether lower perceived barriers are associated with a more favourable perception that BIPV benefits outweigh additional costs, that is, whether barrier conditions form a part of the configurations leading to its absence and their absence a part of those leading to its presence.
P6 (RQ2): We explore whether lower perceived barriers are associated with stronger support for the role of BIPV in the renovation of the existing stock.
P7 (RQ2): We explore whether the configurations associated with favourable BIPV outcomes are conjunctural, that is, whether no single barrier category is necessary or sufficient and several alternative combinations lead to the same outcome.
P8 (RQ2): We explore whether the configurations associated with a favourable perspective differ from those associated with a favourable benefit–cost perception.
2.5. LLM-Based Synthetic Profiles as a Complementary Source
Silicon sampling, that is, the generation of survey responses from LLMs conditioned on the demographic or professional characteristics of simulated respondents, was proposed as a low-cost complement to human surveys [22]. Accuracy appears to improve when prompts contain situational information [64], and LLMs have been used to assess building energy retrofit challenges [65] and to prioritise factors in solar panel recycling [66] with zero-shot prompting, that is, without worked examples [67]. A hybrid human–AI Delphi panel has also been reported to combine the consistency of AI agents with the contextual knowledge of human experts [68].
Methodological evidence calls for caution. Synthetic responses may resemble human averages while showing lower variance, different regression coefficients and sensitivity to prompt wording and query timing [23]. They may display reduced diversity of thought and order effects [24] and do not consistently reproduce human response biases [25], and adding more persona attributes does not guarantee greater alignment and may redistribute errors across subgroups [69]. Persona-based studies should therefore justify the attributes used, document prompts and discuss representativeness [70]. A persona does not give the model professional experience, responsibility or participation in real decisions. In this study, the human and synthetic samples are consequently analysed in parallel and not pooled: they originate from different data-generating processes, pooling would hide precisely the differences of interest, and the human sample is the reference against which the synthetic one is assessed. The following exploratory propositions address the validity of the synthetic sample at three levels and consider how far the results depend on the context given in the prompt and on run-to-run variability.
P9 (RQ3): We examine whether LLM-generated stakeholder responses reproduce the general structure of human perceptions of BIPV barriers and outcomes.
P10 (RQ3): We examine whether, despite broad similarity, LLM-generated responses deviate systematically from human responses for, in particular, barrier categories, items and outcomes.
P11 (RQ3): We examine whether the configurational relations identified in the human sample are reasonably robust when the synthetic samples are used.
The overarching expectation, which the study explores without testing it for generalisation, is that LLM personas can reproduce the broad structure of human perceptions but that differences in the weighting and configuration of barriers limit their use as direct substitutes. The propositions are summarised in Table 1 and follow a progression from human perceptions (P1–P4), through barrier–outcome configurations (P5–P8), to the validity of synthetic respondents (P9–P11).
Table 1.
Exploratory propositions and analytical strategy.
3. Materials and Methods
3.1. Research Design
The study follows the sequence shown in Figure 1. Data were collected from three stakeholder groups involved in residential renovation in Northern Portugal (owners, architects and engineers) through semi-structured interviews that combined open questions, answered in conversation, with an online questionnaire. Only the on-line questionnaire items described in Section 3.2 are analysed here: knowledge self-assessments, agreement with fourteen barrier statements and agreement with two outcome statements. The remaining interview content is not analysed in this paper. For each human respondent, synthetic personas were then generated with an LLM from the respondent’s role, experience, decision involvement and knowledge profile and asked to answer the same barrier and outcome items; each persona was generated five times under each of two prompts that differ in the contextual information provided (Section 3.4). All samples were processed identically: linguistic answers were turned into TFNs and CFCS scores, analysed descriptively by barrier, category and role, and subjected to fsQCA with a sensitivity analysis of calibration and thresholds. The human–LLM comparison was performed last, on run-averaged personas and with paired analyses.
Figure 1.
Research design (prepared with the assistance of Claude Sonnet 5.5 (Anthropic) from the authors’ study design).
3.2. Stakeholder Perspectives, Barriers and Survey Instrument
Three stakeholder perspectives were considered. Property owners represent demand and investment decisions and assess costs, benefits, risks, return on investment, energy self-sufficiency and the impact on the property. Architects represent design and integration and assess compatibility with the existing building, integration in the façade or roof, architectural identity and the interplay between components. Engineers, together with energy specialists, form the technical group responsible for assessing performance, safety, energy production, reliability and system compatibility.
Fourteen barrier statements were derived from the literature reviewed in Section 2.2 and grouped into four categories (Table 2). The questionnaire comprised sections on role; experience in years and frequency of participation in decisions on energy renovation (two items); knowledge of and familiarity with BIPV (eight items); the 14 barrier statements; and the two outcome statements. Knowledge, barrier and outcome items were presented as statements, and respondents reported their degree of agreement on a five-point linguistic scale: None, Low, Medium, High and Very high. For the human sample the questionnaire was completed before the conversation with the interviewer and was administered in Portuguese. The two outcome statements are single items. The category scores aggregate three or four barrier statements and are treated as composite indices built on theoretical grounds, whose internal consistency is assessed in Section 3.7 and Section 4.3.
Table 2.
Barrier statements and outcome items included in the survey.
Knowledge is treated here as a multidimensional construct. The literature suggests at least four layers: recognising the concept and its distinction from BAPV; understanding its functions, advantages and limits; being able to compare alternatives, interpret costs and recommend a solution; and holding applied knowledge from design, installation or maintenance [15,17,31]. These layers are not equivalent, and individual deficits should be distinguished from shortcomings of the knowledge infrastructure, namely the absence of official guidance, comparable tools, interdisciplinary training and monitored case studies, which reflect the maturity of the innovation system [17,19]. The survey operationalises them with eight self-reported items (general knowledge, differences between BIPV and BAPV, advantages, limitations, real-world examples, costs, preparedness to assess or recommend BIPV, and information available on the market).
3.3. Human Sample
The target population comprised individuals with personal or professional experience of residential renovation, architecture, engineering or energy in Northern Portugal. Previous experience with BIPV was not an inclusion criterion, because the level of knowledge and familiarity with the technology was one of the research focuses. Recruitment was non-probabilistic and purposive: potential participants were identified through their professional role or experience and invited by direct contact through email and LinkedIn between 10 September and 20 September 2026. The ten-day recruitment window reflects the time available for fieldwork and is a limitation of the study (Section 6). Thirty stakeholders (ten owners, ten architects and ten engineers) were contacted. Within the ten-day fieldwork window, interviews could be scheduled with 16 of them (four owners, eight architects and four engineers), which corresponds to a participation of 53.3% (40% owners, 80% architects, and 40% engineers). The remaining 14 could not be accommodated in the available time frame. Participation was voluntary and conditional on accepting the information provided at the start of the questionnaire. Responses were anonymised, and no personal data are reported. The final sample comprised 16 valid responses: four property owners, eight architects and four engineers (Table 3). The role groups are therefore small, and all four owners reported no experience in energy renovation, so role and experience are partly confounded. The results are read as exploratory patterns in this sample and not as estimates for these stakeholder groups.
Table 3.
Composition of the human sample and involvement in energy renovation.
3.4. Synthetic (Silicon) Sample
After collecting the human responses, the synthetic samples were generated with GPT-6 (OpenAI), a widely used general-purpose model [71], through the ChatGPT web interface on 23 October 2026, under a zero-shot design, so that the model received instructions only and no worked examples [67]. One persona was created for each human respondent, which gave the same distribution of roles (four owners, eight architects and four engineers). The prompt supplied the role, experience, frequency of involvement in renovation decisions and the eight knowledge levels reported by the corresponding human respondent. Two prompts were used. Prompt A also provided a general description of the state of BIPV development in Northern Portugal and of its conditioning factors, namely solar resource, the building stock and ownership structure, the socioeconomic context, the status of the main renovation support programmes and the limited familiarity with BIPV. Prompt B kept the definition of BIPV, the persona profile, the instructions and the statements but replaced that description by a one-sentence indication of the region, so that the comparison of A and B shows how far the answers depend on contextual information. In both prompts, each persona was asked to state its agreement with the same 14 barrier statements and the two outcome statements, using the same five-level scale, and to return the answers in a fixed JSON format with one key per statement, so that they could be processed automatically. The prompts were written in English. Each answer was checked against the five-level scale and the sixteen statement keys, and no answer had to be regenerated. Each persona was generated five times under each prompt (16 × 5 × 2 = 160 generations), each time in a new conversation without memory, custom instructions or web search. Sampling parameters such as temperature cannot be set by the user in this interface so were left at the platform defaults and are therefore not reported. All prompts and raw outputs are provided in the Supplementary Materials. Because the repeated generations of a persona differ slightly, the unit of analysis is the run-averaged persona, obtained by averaging the CFCS scores of its five runs. Sample A is the main synthetic sample, and sample B is used to assess the dependence on contextual information. An earlier single-run generation with a previous model version (GPT 5.1 Luna) produced a similar ordering of the barriers (Spearman ρ = 0.92 with sample A) and is described in the Supplementary Materials. Because personas were conditioned on the human profiles, the human and synthetic samples are matched by profile but not by responses, and the synthetic outputs are interpreted as simulated content and not as an additional sample of the population [70]. The samples are analysed in parallel and not merged, for the reasons given in Section 2.5.
3.5. Fuzzy Representation, Aggregation and CFCS Scores
Each linguistic label was represented by a TFN (l, m, u) on the interval [0, 1] using overlapping adjacent triangular terms (Table 4), which reflects the gradual, non-abrupt transition between adjacent categories [47,50]. When K respondents assess the same item, the group opinion was obtained as the component-wise arithmetic mean of their TFNs:
lagg = (1/K) ∑ lk, magg = (1/K) ∑ mk, uagg = (1/K) ∑ uk
Table 4.
Triangular fuzzy linguistic scale of the reference terms.
The aggregated TFN was mapped back onto the linguistic scale by nearest-neighbour reclassification, using the normalised vertex distance to each reference term, Sj [51], and was assigned the label of the term with minimum distance:
d
(Ã, Sj) = √{[(lagg − lj)2 + (magg − mj)2 + (uagg − uj)2]/3}
For analysis, TFNs were converted into crisp scores with the CFCS technique [52]. With lmin and umax, the extreme values of the fuzzy partition, and Δ = umax − lmin, the technique normalises the TFN, computes its left and right scores and combines them into a final crisp value:
xl = (l − lmin)/Δ, xm = (m − lmin)/Δ, xu = (u − lmin)/Δ
ls = xm/(1 + xm − xl), rs = xu/(1 + xu − xm)
xcrisp = [ls(1 − ls) + rs2]/(1 − ls + rs), CFCS = lmin + xcrisp Δ
The procedure was applied at three levels. At the global and role levels, the TFNs of all respondents (or of those in a role) were aggregated item by item, labelled and defuzzified, which gives the CFCS of each barrier for the group. At the category level, for each respondent the TFNs of the barriers of a category (eco: B1–B4; know: B5–B7; tech: B8–B11; supch: B12–B14) were averaged and defuzzified, giving one score per respondent and category (for personas, one score per run, which was then averaged over the five runs of the persona). For the outcomes, the CFCS of the single selected label was used. The four category scores per respondent are the conditions of the fsQCA, and the perception and perspective scores are the two alternative outcomes considered.
For single items, the five reference CFCS values (0.033, 0.267, 0.500, 0.733 and 0.967) are equally spaced, so that the CFCS is a linear recoding of the ordinal codes 1–5. The added value of the TFN/CFCS treatment lies in carrying the linguistic labels transparently through the aggregation and not in a different ordering of respondents. For the category scores, which average three or four items, the CFCS is close to, but not exactly, linear in the mean of the codes, so that respondents with the same mean code can obtain slightly different scores. The descriptive and configurational analyses were therefore repeated with conventional ordinal scoring (mean of the 1–5 codes rescaled to 0–1) as a robustness check (Section 4.5.4). CFCS values and calibration anchors were rounded to three decimals, and calibrated memberships to two decimals, as stored by fsQCA.
3.6. fsQCA Procedure
The configurational analysis used four conditions (eco, know, tech, and supch) and two alternative outcomes (perc and pers), each analysed for its presence and for its absence (~), through the models fsperc = f(fseco, fsknow, fstech, fssupch), ~fsperc = f(…), fspers = f(…) and ~fspers = f(…). The analysis follows the three usual steps [53,56], calibration, necessity analysis and sufficiency analysis, carried out with fsQCA 4.1 [72]. The sensitivity analysis, described below, was carried out with the R package QCA [73] (R version 4.3.3, with the R package QCA 3.25.7). Variables were calibrated with the direct method, using thresholds for full membership, crossover and full non-membership anchored on the empirical distribution of each variable in each sample, based on the 90th, 50th and 10th percentiles (Table 5). Calibrating each sample on its own distribution keeps the cases informative but means that the sets are sample specific, which must be borne in mind when comparing solutions. When the percentile anchors of a variable were not strictly increasing, which happens with discrete scores and little dispersion (economic and technological barriers and perception in sample A), scale-based anchors were used for that variable (Table 5): 0.500, 0.733 and 0.967 for the barrier conditions and 0.500, 0.617 and 0.733 for the outcome, which places the crossover midway between Medium and High. A membership of exactly 0.5 cannot be assigned to a truth-table row, so 0.001 was added to those memberships (0.501), in conditions and outcomes. Because this choice treats neutral answers as marginally positive, the opposite adjustment (0.499) is part of the sensitivity analysis.
Table 5.
Calibration thresholds.
A condition was considered necessary when its consistency exceeded 0.90, with coverage above 0.60 to limit trivial relations [53,56,74,75]. Conditions with consistency between 0.80 and 0.90 are described as quasi-necessary, and conditions that are highly consistent with both an outcome and its negation are regarded as non-discriminating. For sufficiency, truth-table analysis required a minimum frequency of 1 case, a threshold commonly used for small samples [63], and a raw consistency cut-off set at a natural gap in the distribution of the truth-table rows, so as to retain around 80% of the cases [62] and never below 0.75 (the values used are given in Section 4.5). Because the study is exploratory, no directional expectations were imposed: every condition could contribute to the outcome when present or when absent, so that the intermediate solution coincides with the complex solution, and we refer to it as the intermediate solution. When the prime-implicant chart showed tied prime implicants, all were retained. A condition is core in a configuration if it appears in a term of the parsimonious solution that is a subset of that configuration (a subpath), and peripheral otherwise [54]. The consistency of the parsimonious solution can be lower than that of the intermediate one, so both are reported. No minimum coverage was imposed, since low coverage is common in social-science applications [76]. With four conditions and 16 cases, many logically possible combinations are empirically empty, which is a typical feature of small-N applications [62].
Since small-N fsQCA is sensitive to calibration choices, the baseline analysis was complemented with a sensitivity analysis of 36 specifications for each sample and outcome: three calibration schemes (own-sample percentile anchors with scale-based anchors where these are degenerate; scale-based anchors of 0.500, 0.733 and 0.967 for conditions, 0.500, 0.617 and 0.733 for outcomes, and 0.500, 0.617 and 0.733 for all variables), two directions of the adjustment of memberships of 0.5 (+0.001 and −0.001), two frequency thresholds (1 and 2) and three consistency cut-offs (0.75, 0.80 and 0.85). For each specification the complex solution was obtained (identical to the intermediate one), including all prime implicants of tied solutions, and the parsimonious solution was used to identify core conditions. The analysis was also repeated with conventional ordinal scoring and with calibration data at different numerical precision. A configuration or condition is described as stable when it appears in a high share of the specifications that yield a solution and as fragile when it depends on a particular specification; only stable patterns are interpreted as findings.
3.7. Reliability and Validity of the Category Scores
Each category score is the mean of three or four barrier statements. Because these are single-statement indicators grouped on theoretical grounds, the category scores are treated as composite indices and not as reflective latent scales. Their internal consistency was examined with Cronbach’s alpha [77] with bootstrap 95% confidence intervals [78] from 2000 resamples, the mean inter-item Spearman correlation, item-rest correlations and the value of alpha if an item is deleted. Discriminant evidence was sought by comparing the mean correlation between items of the same category with that between items of different categories and by the correlations among the four category scores. With 16 cases these statistics are imprecise, and they are used to flag weak items and not to establish validity. In the synthetic samples they are computed on the run-averaged item scores, and items with a single answer for all personas, which mechanically lower alpha, are identified.
3.8. Human–LLM Comparison
The samples were compared at five levels. First, because each persona was generated from the profile of one human respondent, the primary comparison for the four categories and the two outcomes is paired: within-pair differences (persona minus human) are summarised with their mean and a bootstrap 95% confidence interval (10,000 resamples) [78], a paired Wilcoxon signed-rank test [79] with Holm correction across the six variables [80], and the Spearman correlation between matched pairs. Because the pairing is by profile and not by response, the exact agreement of each persona’s modal answers with its matched human was compared with its agreement with unmatched humans as a benchmark of how much of the individual responses the profile conditioning recovers. Cohen’s d with the pooled standard deviation [81], Welch’s t-test [82] and the Mann–Whitney test [83] are reported as sensitivity analyses for independent samples (n = 16 each). Second, at the item level, a paired Wilcoxon signed-rank test compared the global CFCS of the 14 barriers in the two samples, so that each barrier forms a pair, and Spearman’s rank correlation assessed whether the ordering of barriers was preserved. Third, run-to-run variability within personas was summarised by the share of identical items across the five runs, the agreement between pairs of runs and the intraclass correlation of the scores, and the dependence on the context of the prompt by the paired differences between prompts A and B. Fourth, the relation of the self-reported profiles (knowledge index, experience and participation) with the scores was examined with Spearman correlations in the human and synthetic samples, and the human–LLM differences were examined in the lower and upper halves of the knowledge index and among respondents with experience. Fifth, the necessary conditions and sufficient configurations of the samples were compared. Given the small samples and the number of tests, p-values are read jointly with effect sizes, and confidence intervals and are exploratory. Standard deviations in comparative tables are sample standard deviations (n − 1).
4. Results
4.1. Profile and Knowledge of BIPV in the Human Sample
Participation in energy-renovation decisions varied considerably (Table 3): 37.5% of respondents took part occasionally, 25.0% frequently, 18.8% rarely, 12.5% never and 6.3% very frequently. Seven respondents (43.8%) reported no experience in energy-renovation projects; among the nine who did, 44.4% had 10–20 years of experience, 22.2% less than five years, 22.2% more than 20 years and 11.1% 5–10 years.
Self-reported knowledge of BIPV was limited (Table 6). Half of the respondents rated their general knowledge as Low and 12.5% as None, and nobody chose Very high. The gaps were larger for the practical dimensions than for the concept: 81.3% reported None or Low knowledge of BIPV costs, 81.3% of the information available on the market, 75.0% of the limitations of BIPV and of their own capacity to assess or recommend a solution, and 68.8% of real-world examples. Knowledge of the distinction between BIPV and BAPV was somewhat higher, although half of the respondents still reported None or Low.
Table 6.
Self-reported knowledge of BIPV in the human sample (% of respondents, n = 16).
4.2. Perception/Perspective Outcomes and Heterogeneity of Profiles
The benefit–cost statement (perception) obtained a mean CFCS of 0.544 and the label Medium: ten respondents (62.5%) selected Medium, three (18.8%) High, one (6.3%) Very high and two (12.5%) Low. Although 87.5% chose Medium or higher, only 25.0% chose High or Very high, which indicates a moderately positive but not strongly affirmative view of the present benefit–cost balance. The statement on the future role of BIPV in renovation (perspective) obtained a mean CFCS of 0.719 and the label High: 68.8% selected High or Very high, 31.3% Medium, and nobody Low or None. The same respondents therefore perceive substantial obstacles under current conditions and still consider BIPV an important component of future renovation. Both outcomes are single items, and the concentration of answers on Medium for perception means that this item discriminates little between respondents (Section 6).
The individual profiles show that this pattern does not come from a homogeneous group. Several respondents with little BIPV knowledge assign a high or very high future role to the technology, and the current benefit–cost judgement is more dispersed (from Low to Very high) than the future-perspective judgement. Profile and outcome are not simply related in this sample: the mean knowledge index is unrelated to perception (Spearman ρ = −0.07) and perspective (ρ = 0.19), whereas respondents with more experience in energy renovation were less favourable on perception (ρ = −0.52; Section 4.6). This heterogeneity is relevant for the configurational analysis, because similar outcomes may coexist with different combinations of perceived barriers.
4.3. Assessment of Barriers
No respondent from the human sample selected None for any barrier, and only one selected Low (for B3); 223 of the 224 answers (14 barriers × 16 respondents) were therefore Medium or higher. Table 7 shows that the highest concentration of High and Very high answers corresponds to the lack of information, guidance and examples (87.5%; 95% exact confidence interval 61.7–98.4%) [84], followed by the high initial investment (75.0%) and the market orientation towards conventional photovoltaics (75.0%). The lowest shares correspond to increased project complexity (43.8%; 19.8–70.1%) and to insufficient incentives, payback period and installation complexity (50.0% each); thirteen of the fourteen barriers were rated High or Very high by at least half of the respondents. With 16 respondents, these intervals are wide. The aggregated results (Table 8 and Figure 2) are consistent with these distributions: all 14 barriers received the global label High. This label should not be over-read, because the global CFCS values (0.626–0.782) lie between the reference scores of Medium (0.500) and High (0.733), and for the lowest-rated barriers the label depends on lying just above the midpoint between the two (0.617); for B9, 56.3% of the answers were Medium. We therefore read the result as a pattern of moderate-to-high perceived importance and not as uniformly High ratings. The highest CFCS scores were those of the lack of information, guidance and examples (B5, 0.782), the high initial investment (B1, 0.739), the market orientation towards conventional photovoltaics (B12, 0.687), the shortage of qualified professionals (B6, 0.683) and the lack of cooperation between sectors (B13, 0.673). The lowest were those of increased project complexity (B9, 0.626), insufficient public incentives (B3, 0.639) and increased installation complexity (B10, 0.641).
Table 7.
Distribution of answers on barriers and outcomes in the human sample (% of respondents, n = 16).
Table 8.
Global CFCS, linguistic label and rank of each barrier in the human and in the synthetic samples A and B.
Figure 2.
Global CFCS of each barrier in the human and the synthetic samples A (full context) and B (minimal context); prepared with the assistance of Claude Sonnet 5.5 (Anthropic). Dotted lines mark the reference scores of Medium (0.500), High (0.733) and Very high (0.967).
In the synthetic samples the global labels were more differentiated than in the human sample. In sample A, five barriers were labelled High, six Medium and three Very high. The strongest were insufficient public incentives (B3) and uncertainty about future incentives and policies (B4), both with a CFCS of 0.960, followed by the lack of information, guidance and examples (B5, 0.876), the market orientation towards conventional photovoltaics (B12, 0.772), the high initial investment (B1, 0.733) and limited product availability (B14, 0.725), whereas the lowest were uncertainty about technical performance (B8, 0.485), uncertainty about future maintenance (B11, 0.491) and the payback period (B2, 0.500) (Table 8). In sample B, where the contextual information on support programmes was removed, B3 and B4 fell to 0.500 and 0.570, and only B5 remained Very high (0.857), with seven barriers labelled Medium and six High. The contextual information of prompt A therefore raised the two incentive-related items by 0.46 and 0.39 CFCS points.
Across the 14 barriers, the global CFCS of sample A was on average 0.006 higher than the human one (paired Wilcoxon p = 0.761), and that of sample B 0.056 lower (p = 0.042). Spearman’s rank correlation between the human and synthetic global CFCS was weak and not significant for sample A (ρ = 0.328; p = 0.252) and moderate for sample B (ρ = 0.630; p = 0.016), while A and B correlated at 0.522 (p = 0.056). Sample B was thus closer to the human ordering and level of the barriers (mean absolute difference of 0.080 against 0.123). The absence of a global shift in sample A does not imply that the ordering is reproduced: B3 moved from thirteenth to first place (+0.321), B4 moved from sixth to first place (+0.289) and B5, B12 and B14 increased by 0.081–0.094, whereas the payback period (B2, −0.154), uncertainty about technical performance (B8, −0.173), uncertainty about future maintenance (B11, −0.153), increased installation complexity (B10, −0.100) and the shortage of qualified professionals (B6, −0.130) decreased (Figure 2 and Table 8). Some differences are common to both prompts: lower scores for B2, B8 and B11 and a higher score for B5; B2, B11 and B5 also changed in the same direction in the earlier single-run generation. The synthetic samples therefore do not reproduce the human ordering of barriers, and their emphasis depends on the contextual information supplied.
4.4. Category and Role-Level Profiles
Table 9 summarises the reliability of the four composite indices for each barrier category. In the human sample, Cronbach’s alpha was 0.76 for economic, 0.87 for knowledge, 0.77 for technological and 0.80 for supply-chain barriers, with mean inter-item correlations between 0.38 and 0.67; the intervals are wide (for example 0.25–0.92 for technological barriers), as expected with 16 cases. The mean Spearman correlation between items of the same category (0.48) was higher than between items of different categories (0.16), and the category scores were weakly to moderately correlated (ρ ≤ 0.40, except knowledge and supply chain, 0.63), which supports treating the four categories as distinguishable but related. The weakest items were B4 in the economic category (item-rest correlation 0.36) and B8 in the technological category (0.32); deleting B4, B8 or B14 would raise alpha only slightly (to 0.79, 0.81 and 0.82), and B5 stands apart within the knowledge category (alpha 0.97 without it). We retained all items to preserve the theoretical content of each category. In the synthetic samples the internal consistency was weaker: only the knowledge category reached acceptable values (alpha 0.78 in A and 0.94 in B), whereas economic (0.40 and 0.36), technological (0.25 and −0.11) and, in A, supply-chain scores (0.30) were low, partly because several items had a single answer for all personas (B1 and B2 in A; B2, B3 and B11 in B), and the within-category correlation (0.28 and 0.36) was much closer to the between-category one (−0.012 and 0.10) than in the human sample. The synthetic category scores are therefore not equivalent measures of the human constructs, and comparisons by category should be read with this in mind.
Table 9.
Internal consistency of the category scores: Cronbach’s alpha (95% bootstrap confidence interval) and mean inter-item Spearman correlation (ρ̄).
At this category level, in the human sample knowledge barriers obtained the highest mean CFCS (0.717), followed by economic (0.679), supply-chain (0.669) and technological barriers (0.645) (Table 10). The differences between categories are small relative to the dispersion across respondents (standard deviations between 0.113 and 0.154), and all four category means lie between the reference scores of Medium (0.500) and High (0.733).
Table 10.
Human and synthetic scores by barrier category and outcome, with paired differences (synthetic − human).
Sample A obtained 0.776 for economic, 0.682 for knowledge, 0.519 for technological and 0.735 for supply-chain barriers, and sample B 0.562, 0.720, 0.529 and 0.699, respectively (Table 10). Benefit–cost perception reached 0.535 (A) and 0.526 (B) and the future perspective 0.722 and 0.730, close to the human values. The synthetic scores are far less dispersed than the human ones, especially for the barrier categories (Table 10). Table 10 also shows the category-level comparison between the human sample and the synthetic samples A and B. Because each persona was generated from the profile of one respondent, the comparison is paired. In sample A, the personas rated economic barriers 0.098 higher (95% bootstrap CI 0.031 to 0.161; Cohen’s d = 1.00), supply-chain barriers 0.066 higher (0.021 to 0.109; d = 0.78), and technological barriers 0.126 lower (−0.187 to −0.076; d = −1.41); after Holm correction across the six variables, only the technological difference remained detectable (p = 0.003). In sample B, technological barriers were again 0.116 lower (d = −1.31; Holm p = 0.006), but economic barriers were 0.117 lower (d = −1.15; Holm p = 0.014), and the supply-chain difference was small (0.030; d = 0.34). The sign of the economic difference therefore reverses with the context given in the prompt. Knowledge barriers and both outcomes did not differ from the human values in either prompt (|d| ≤ 0.29; Holm p = 1.00). Only the lower technological scores are therefore common to the two prompts. Correlations between each persona and its matched respondent were weak and mostly not significant (perception ρ = −0.37 and −0.40, perspective ρ = 0.02 and 0.26 for A and B; the only correlations with p < 0.05 were supply chain in A, 0.70, and economic in B, 0.63, without correction for twelve tests), which means that the personas do not track the individual respondents on whose profiles they are based. Another systematic difference concerns dispersion: the standard deviation of the synthetic samples is between 0.04 and 0.78 times that of the human sample (A) and between 0.29 and 0.69 (B), and the economic scores in A are practically constant (SD = 0.006).
Role-level results are shown in Table 11 together with those of synthetic sample A. In the human sample, owners gave the lowest scores in all four barrier categories (0.558 to 0.653), whereas engineers gave the highest knowledge (0.792), technological (0.704) and supply-chain (0.751) scores and the lowest future-perspective score (0.617). Architects gave the highest future-perspective score (0.762), and engineers the lowest benefit–cost score (0.500, against 0.558 for owners and architects). With only four owners and four engineers, these differences are descriptive.
Table 11.
Mean CFCS by stakeholder role: human (H) and synthetic sample A (A).
In sample A, role differences were small for the barrier categories (economic 0.771–0.779; technological 0.506–0.544), whereas the outcomes followed the profile: the future perspective increased from owners (0.547) to architects (0.751) and engineers (0.838), and the benefit–cost perception was 0.500 for owners, 0.529 for architects and 0.582 for engineers.
The role profiles show that sample A is not a scaled copy of the human one. Synthetic owners gave higher economic and supply-chain scores than human owners (+0.135 and +0.097) and a much lower future perspective (0.547 against 0.733), and the ordering of roles on the future perspective changes: architects > owners > engineers among the humans (0.762, 0.733, and 0.617) and engineers > architects > owners among the personas (0.838, 0.751, and 0.547). Given that the role-specific n is four for owners and engineers, these comparisons are descriptive. They are consistent with the finding in Section 4.6 that the outcomes of the personas increase with the knowledge and experience profile, whereas those of the humans do not.
Repeated generations of the same persona were highly consistent (Table 12): on average 13.3 of the 16 items were identical across the five runs, and the agreement between pairs of runs was 92% in both prompts, the variation typically being one level up or down in a single odd run. The intraclass correlation of the scores was 0.84–0.88 for the two outcomes, 0.65–0.74 for knowledge, technological and supply-chain barriers under prompt A and 0.65–0.86 under prompt B, and practically zero for economic barriers under A (−0.02), which are almost constant. Between-persona variance therefore dominates run-to-run variance, and averaging the runs is justified. However, the personas were much less diverse than the respondents: the 16 personas produced only 10 (A) and 11 (B) distinct modal answer patterns, against 16 among the humans, and the mean disagreement between pairs of personas (22% and 28% of items) was well below that between pairs of respondents (63%). Moreover, the exact agreement between a persona and its matched respondent (41.8% in A and 48.8% in B) was not higher than its agreement with unmatched respondents (42.4% and 45.7%): conditioning on the profile does not recover individual responses.
Table 12.
Run-to-run stability, diversity and individual-level correspondence of the synthetic samples.
4.5. fsQCA Results
Table 13 reports the analysis of necessary conditions. For the perception outcome, no single condition reached a consistency of 0.80 in the human sample. The highest consistency for positive perception corresponded to the absence of knowledge barriers (~fsknow: consistency 0.718, coverage 0.709), but the same condition also had the highest consistency for negative perception (0.771, coverage 0.613), so it does not discriminate between the outcome and its negation. For the perspective outcome, technological barriers showed the clearest pattern: their presence was quasi-necessary for the absence of a positive perspective (fstech: 0.834, coverage 0.862) and their absence quasi-necessary for a positive perspective (~fstech: 0.851, coverage 0.821). No condition reached the formal necessity threshold of 0.90, and the two quasi-necessary relations are sensitive to calibration: across the specifications of the sensitivity analysis, the consistency of ~fstech for a positive perspective ranged from 0.59 to 0.86 (Section 4.5.4).
Table 13.
Analysis of necessary conditions: consistency (coverage) for the absence and presence of high perception and perspective; human sample and synthetic sample A.
In sample A, the absence of technological barriers has a consistency between 0.955 and 0.995 for all four outcomes, but this is trivial because technological barriers are ab-sent in every persona (coverage 0.186 for a positive perception). Likewise, the presence of economic barriers reaches 0.870 for a positive perspective only because economic barriers are present in all personas. The informative relations involve supply-chain barriers: their presence exceeds the necessity threshold for a positive perspective (consistency 0.918, coverage 0.907) and their absence for a negative perspective (0.921, coverage 0.930), which indicates that supply-chain barriers are the one condition that separates a positive from a negative perspective in sample A. For a positive perception, the consistency of the presence of supply-chain barriers and of the absence of knowledge barriers (0.983 in both cases) rests on only two personas.
4.5.1. Sufficiency Analysis Results in the Human Sample
Table 14 reports the sufficient configurations. Six were found for each outcome: two for the absence and four for the presence of a high perception, and three for the absence and three for the presence of a high perspective. Solution consistency (complex and intermediate solutions are the same) was above the 0.75 threshold in all cases (lowest: 0.775 for the presence of high perception), whereas solution coverage was uneven (0.411 for the absence of high perception and 0.799 for its presence). The parsimonious solutions, used to identify core conditions, had lower consistency for the presence of high perception (0.678, with the term ~fstech alone at 0.713) and for the absence of high perception (0.802), so core status in the perception configurations rests on terms that are less consistent than the configurations themselves. Several configurations describe very few cases: five of the twelve configurations are defined by a single case and three by two cases.
Table 14.
Sufficient configurations (intermediate solution) leading to the absence and presence of high perception and perspective; human sample: core and peripheral conditions.
For the absence of a high perception, both configurations combine the core absence of knowledge barriers with the core presence of technological barriers; configuration 1 adds the peripheral absence of economic and supply-chain barriers and configuration 2 their peripheral presence, which means that technological concerns are associated with a negative benefit–cost perception under either condition of the other barriers. Each rests on a single case. For its presence, the most extensive pathway (configuration 3, raw coverage 0.485, unique coverage 0.258, five cases, but the lowest consistency, 0.794) has the core absence of knowledge and technological barriers. The other three show that a positive perception can also arise when barriers are present: configuration 4 combines the core presence of knowledge barriers and the core absence of supply-chain barriers with the peripheral presence of technological barriers; configuration 5 combines the core absence of economic barriers with the core presence of knowledge barriers and the peripheral presence of supply-chain barriers (consistency 0.922); and configuration 6, which describes a single case, combines the core presence of economic and supply-chain barriers and the core absence of knowledge barriers with the peripheral presence of technological barriers. The absence of knowledge barriers thus appears in both negative and positive perception pathways, as a core condition in the former and as a peripheral or core condition in the latter.
For the absence of a high perspective, technological barriers are a core condition in all three configurations: together with the peripheral presence of knowledge barriers (configuration 1, the pathway with the highest raw coverage, 0.572, and eight cases), with the peripheral absence of economic and supply-chain barriers (configuration 2) or with the peripheral presence of economic and supply-chain barriers (configuration 3). The presence of a high perspective is associated with three alternative pathways. Configuration 4 has the highest consistency of the table (0.958) and the highest unique coverage (0.206): it combines the core presence of economic barriers and the core absence of supply-chain barriers with the peripheral absence of knowledge and technological barriers. Configuration 5 combines the core absence of technological barriers with the core presence of knowledge and supply-chain barriers and the peripheral absence of economic barriers, and configuration 6 the core presence of economic barriers and the core absence of supply-chain barriers with the peripheral presence of knowledge and technological barriers and a negligible unique coverage (0.007). These configurations are conditional on the calibration choices examined in Section 4.5.4.
4.5.2. Sufficiency Analysis Results in the Synthetic Sample A
In sample A, economic and technological barriers are practically constant (all 16 personas are above the crossover for economic barriers and below it for technological barriers; Table 5), so the truth table has only four observed rows, defined by knowledge and supply-chain barriers. Table 15 reports the results. No configuration reaches the consistency cut-off of 0.80 for a positive perception (the highest row consistency is 0.546), so this outcome has no sufficient configuration; only two personas have a membership above 0.5. For the absence of a positive perception there are two configurations, both with a consistency of 1.000 and a solution coverage of 0.624: the core presence of knowledge barriers (configuration 1) or the core absence of supply-chain barriers (configuration 2), with economic barriers present and technological barriers absent as peripheral conditions. For a positive perspective there is a single configuration (consistency 0.897, solution coverage 0.787, eleven cases) whose core condition is the presence of supply-chain barriers, and for its absence two configurations that again combine the core presence of knowledge barriers or the core absence of supply-chain barriers (solution consistency 0.891, coverage 0.837). The parsimonious solutions confirm that only knowledge and supply-chain barriers carry information (fsknow + ~fssupch for the two negative outcomes, with consistency of 0.991 and 0.769, and fssupch for a positive perspective, 0.907). The peripheral status of economic and technological barriers, which appear in every configuration, is a consequence of the lack of variation in these conditions and not a substantive finding.
Table 15.
Sufficient configurations (intermediate solution) leading to the absence and presence of high perception and perspective, synthetic sample A: core and peripheral conditions.
Sample B, in which economic and technological scores vary somewhat more, gave different solutions, which are reported in the Supplementary Materials: positive perception yields no solution in any of the 36 specifications, and the most frequent configuration for a positive perspective is ~fseco·~fstech·fssupch (in six specifications).
4.5.3. Comparison of the Configurational Human and LLM Analyses
The configurational results of the two samples show limited correspondence. They share two features: no condition among those that vary reaches the formal necessity threshold for perception, and equifinality is evident for the negative outcomes (two or three alternative configurations in both samples). The differences are larger. First, the clearest necessity relations refer to technological barriers in the human sample (~fstech: 0.851 for a positive perspective; fstech: 0.834 for its absence) and to supply-chain barriers in sample A (fssupch: 0.918 for a positive perspective; ~fssupch: 0.921 for a negative one), and the high consistency of ~fstech in A is trivial. Second, knowledge barriers play opposite roles in the pathways to a negative perception: their absence is a core condition in both human configurations, whereas their presence is the core of the first configuration in sample A. Third, in the human sample technological barriers are the core of every pathway to the absence of a positive perspective, whereas in sample A they are absent in every persona, and the pathways differ in knowledge and supply-chain barriers. Fourth, human positive outcomes accommodate both the presence and absence of economic barriers, whereas economic barriers are present in all configurations of sample A because they are present in every persona. Finally, sample A has no sufficient configuration for a positive perception, which has several in the human sample. The configurational relations identified in the human sample are therefore not reproduced by the synthetic sample, and the comparison is further limited by the constants in sample A.
4.5.4. Sensitivity Analysis
Table 16 summarises the sensitivity analysis described in Section 3.6 (36 specifications per sample and outcome). In the human sample, the configurations depend strongly on the calibration choices. Reversing the adjustment of memberships of 0.5 (−0.001 instead of +0.001) under otherwise identical baseline settings changes the solutions of all four outcomes: only two of the twelve baseline configurations reappear unchanged (one for positive perception and one for the absence of a positive perspective), and the −0.001 solutions include, for example, seven configurations for positive perception. This is because ten of the sixteen respondents are at the crossover for perception and seven for perspective (Section 4.2), so that neutral answers cannot be assigned unambiguously to either side. Calibration also determines whether a solution exists at all: positive perception and the absence of a positive perspective yield a solution in only 12 of the 36 specifications each, against 31 for the absence of perception and 32 for a positive perspective. Repeating the baseline with the calibration data at four decimals or at full precision, with the anchors at three decimals, also changed the solutions of all four outcomes, whereas data and anchors with the same precision did not. With conventional ordinal scoring in place of CFCS, the sets of configurations were identical in 108 of the 144 human specifications (75%), and the necessity results changed little (maximum difference in consistency 0.052). Barrier rankings were identical in the synthetic samples and differed by a single swap in the human sample (Spearman ρ = 0.983), the category scores correlated at 0.999 or more with their ordinal counterparts, and none of the twelve decisions on human–synthetic differences (p < 0.05 or not) changed.
Table 16.
Sensitivity analysis of the sufficiency results: availability and stability of configurations across 36 specifications per sample and outcome.
What remains stable is limited. The most persistent pattern is the presence of technological barriers in the configurations leading to the absence of a positive perspective: fstech appears in every configuration in 9 of the 12 specifications that yield a solution (75%) and is a core condition in all three baseline configurations. For a positive perspective, fseco and ~fstech appear in every configuration in 22 of the 32 specifications with a solution (69%), and the most frequent configuration (fseco·~fsknow·~fstech·~fssupch, baseline configuration 4) appears in 17 of the 36 specifications. For perception and its absence, no condition appears in every configuration in at least half of the specifications, although the baseline configuration ~fsknow·~fstech·~fssupch for positive perception appears in all 12 specifications that yield a solution. We therefore classify the technological pattern for the absence of a positive perspective and the economic and technological pattern for a positive perspective as partly stable and the remaining human configurations as fragile.
In sample A, the solutions are stable only in a trivial sense: fseco and ~fstech appear in every configuration in all (or, for ~fstech with a positive perspective, 92%) of the specifications because they are constants. Sample B, in which these conditions vary slightly, gives fragile solutions (for example, ~fstech appears in every configuration in 67% of the specifications for the absence of perception and for a positive perspective), and its positive perception has no solution in any specification. The synthetic configurations are thus not stable enough to serve as a basis of comparison for the human ones.
4.6. Self-Reported Profiles and Results
Because the personas were generated from the self-reported profiles of the respondents, we examined how far these profiles relate to the scores in each sample (Table 17). In the human sample, the mean knowledge index (the average of the eight knowledge items coded 1–5) was not associated with knowledge barriers (ρ = 0.03), perception (ρ = −0.07) or perspective (ρ = 0.19) and was positively associated with economic barriers (ρ = 0.56; p = 0.024). Experience in energy renovation was associated with higher technological barriers (ρ = 0.66; p = 0.006) and with a less favourable perception (ρ = −0.52; p = 0.040) and perspective (ρ = −0.43; p = 0.098). The share of Medium answers decreased with experience (ρ = −0.57) and with knowledge (ρ = −0.48; p = 0.059), and owners answered Medium in 56% of their answers, against 44% for architects and 14% for engineers, which suggests that Medium partly reflects uncertainty in the less knowledgeable and less experienced respondents. Owners rated technological barriers lower than the other respondents (0.558 against 0.674; Mann–Whitney p = 0.065), which is consistent with the possibility that low technical knowledge depresses the rating of technical barriers, although the evidence is weak.
Table 17.
Spearman correlations of the self-reported profile (knowledge index and experience in energy renovation) with barrier and outcome scores; human and synthetic samples.
In the synthetic samples the relation with the profiles is different (Table 17). The outcomes of the personas increased strongly with the knowledge index (perspective ρ = 0.87 and 0.86; perception 0.68 and 0.58) and with experience (perspective 0.74 and 0.59; perception 0.65 and 0.47), whereas in the human sample these relations are absent or negative, and the knowledge barriers of the personas decreased with the knowledge index (ρ = −0.60 and −0.62, against 0.03 in humans). The profile also modulates the human–LLM gap: the overstatement of economic barriers in sample A was larger where the knowledge index was lower (ρ between the gap and the index = −0.54; p = 0.031; gap 0.155 in the lower half of the index and 0.041 in the upper half). In the lower half of the index all human respondents answered Medium on perception, and the personas also averaged 0.500, whereas among respondents with experience (n = 9) the personas were more positive than the humans on the future perspective (+0.14 in A and +0.12 in B) and rated technological barriers lower (−0.17 and −0.15).
A five-condition robustness model that added the calibrated knowledge profile (anchors at the 10th, 50th and 90th percentiles of the index: 1.06, 2.06 and 3.50) reproduced 9 of the 12 baseline human configurations once the added condition was dropped, and a model that added experience (any/none) reproduced 7 of 12; the added condition appeared present in some configurations and absent in others, without a consistent role. The profile of the cases in the configurations is also uneven: the most extensive configuration for a positive perception (~fsknow·~fstech·~fssupch) comprises 5 cases, of which 3 are owners, and 4 have no experience, with a mean knowledge index of 1.72, whereas the other configurations comprise one to three cases. With 32 possible configurations and 16 cases these models are exploratory, and we use the profiles as descriptors and not as conditions. These results qualify, but do not remove, the interpretation that respondents with limited knowledge may rate some barriers and outcomes less discriminatingly, and they show that the persona conditioning on profiles produces a profile gradient that is not present in the human responses.
5. Discussion
Table 18 summarises the evidence pattern for each of the eleven exploratory propositions. Given the sample size (n = 16) and the sample-specific calibration, these patterns describe consistency with the propositions in this sample and are not tests of population-level hypotheses. Of the eleven propositions, five are consistent with the evidence (P1, P4, P7, P8 and P10), three are partly consistent (P2, P6 and P9), one can only be described (P3), and two are not consistent (P5 and P11). For P7 and P8, consistency refers to the baseline human configurations, whose detailed content proved fragile in the sensitivity analysis (Section 4.5.4). The discussion follows the three blocks of propositions.
Table 18.
Summary of the evidence pattern for each exploratory proposition.
5.1. Stakeholder Perceptions of Barriers (P1–P4)
The evidence is consistent with P1: respondents perceived the barriers as at least moderately important. Of the 224 barrier ratings only one was below Medium, and the share of High or Very high answers reached at least 50% for 13 of the 14 barriers. This agrees with reviews and empirical studies that portray BIPV adoption as constrained by several simultaneous obstacles and not by a single decisive one [8,9,15,17,19]. The global label High should not be over-read, because the aggregated scores (CFCS 0.626–0.782) lie between the reference values of Medium and High, and the lowest-rated barrier (B9) was labelled High only because it lies just above the midpoint between the two (56.3% of its answers were Medium); we therefore read the result as a pattern of moderate-to-high importance, with confidence intervals that are wide in a sample of 16. The distributions show that this is not caused by a few extreme respondents: no one selected None for any barrier. The result also suggests that the barriers described for general BIPV markets and for other regions are recognisable by stakeholders working in the renovation of residential buildings in Northern Portugal, with the caveat that the respondents form a purposive sample and that many reported limited BIPV knowledge.
The ranking of items qualifies this general picture. The lack of information, guidance and application examples was the most severe barrier, and it was accompanied by a self-reported knowledge profile in which three quarters or more of respondents reported None or Low knowledge of costs, market information and their own capacity to recommend BIPV. This agrees with studies that identify knowledge deficits, educational gaps and the absence of guidance as central obstacles [17,19,21,38]. Because B5 refers to external provision of information, guidance and examples, it also fits the distinction between individual literacy and knowledge infrastructure drawn in Section 2.3, and it suggests that respondents interpret the problem to some extent as a shortage of shared resources, not only of personal training. The evidence for P2 is therefore partly consistent: knowledge barriers obtained the highest category score (0.717), but the gaps between categories are small compared with the dispersion across respondents (standard deviations 0.113–0.154), and no formal test of differences among categories was performed.
Within the economic category, the high initial investment was rated much higher than the payback period and the sufficiency of incentives. This is in line with studies in which capital premiums are the main financial deterrent [35,36], and it may indicate that cost is perceived above all as an upfront issue. These judgements, however, were formed with limited information: over 80% of respondents reported None or Low knowledge of BIPV costs. In renovation, the relevant comparison is the incremental cost with respect to the conventional envelope components that BIPV displaces [14,30], and it is plausible that respondents without cost information default to the perception of BIPV as an expensive add-on. This reading cannot be verified with the present data, but it points to cost-framing tools for renovation as a practical need.
The role-level results (P3) are consistent in direction with the observation of Lu et al. [46] that stakeholder groups can differ significantly on barriers. Engineers gave the highest scores for knowledge, technological and supply-chain barriers, which may reflect their responsibility for performance, safety and technical liability [31], whereas owners, who are less exposed to implementation details, gave the lowest scores on all four categories. Architects were the most favourable group regarding the future role of BIPV and engineers the least. Nevertheless, with four owners and four engineers, these differences should be seen as indications of heterogeneity and not as established effects. Role is also confounded with experience, since all four owners reported none, and owners answered Medium more often than the other groups (56% of their answers against 44% for architects and 14% for engineers). Their lower technological scores (0.558 against 0.674 for the other respondents) may therefore reflect limited technical knowledge, which makes it harder to rate technical barriers, as much as a different view of those barriers (Section 4.6).
The evidence is clearly consistent with P4. The human respondents were considerably more positive about the future role of BIPV in renovation than about the present balance between benefits and additional costs (CFCS 0.719 against 0.544, High against Medium): eight respondents rated the future role higher and none lower (paired Wilcoxon p = 0.010). This result is compatible with a technology whose market formation and institutional support are still developing [17,19], where strategic expectations can run ahead of economic assessment, and where uncertainty about incentives and costs weighs on short-term decisions [36,37]. Two cautions apply. Both outcomes are single items, and 62.5% of respondents chose Medium for the benefit–cost balance, which may reflect real ambivalence or limited information about costs, since over 80% reported None or Low knowledge of BIPV costs. The distinction nevertheless carries a methodological message: studies that measure only attitudes towards the potential of BIPV may overestimate the readiness of the market, and studies that measure only the benefit–cost balance may underestimate the support for the technology among professionals.
5.2. Configurations of Barriers and the Two Outcomes (P5–P8)
The configurational results do not support a simple monotonic relation between barriers and outcomes (P5). For perception, no condition was necessary, and the pathways to a positive outcome included combinations in which barriers were present, such as the core presence of economic and supply-chain barriers with the core absence of knowledge barriers (configuration 6, one case) or the core presence of knowledge barriers with the core absence of supply-chain barriers (configuration 4, two cases). The absence of knowledge barriers appeared in pathways to both negative and positive perception, as a core condition in the two negative ones and in configuration 6 and as a peripheral condition in configuration 3, which is characteristic of causal asymmetry, where the same condition can contribute to an outcome or to its negation, depending on the other conditions [53,55]. The concentration of Medium answers among respondents with little knowledge or experience makes perception a weak discriminating outcome. The presence of technological barriers was, however, a core element in both pathways to a negative perception. Because these pathways are fragile in the sensitivity analysis (only one of the four positive-perception configurations reappears when the adjustment of memberships of 0.5 is reversed), P5 is not consistent with the evidence.
For perspective, the evidence is partly consistent with P6 in the case of technological barriers: their absence was quasi-necessary for a positive perspective (0.851), their presence was quasi-necessary for its absence (0.834), and they were a core condition in all pathways to a negative perspective. This pattern is only partly stable: technological barriers appear in every configuration for the absence of a positive perspective in 75% of the specifications that yield a solution, whereas the consistency of ~fstech for a positive perspective ranges from 0.59 to 0.86 across calibrations (Section 4.5.4). This is coherent with the idea that the claim that BIPV should play an important role in renovation relies on its technical feasibility in existing buildings, where structural capacity, existing systems and installation constraints are salient [12,31,32]. Technical uncertainty is also the barrier most amenable to remedies that the literature recommends, such as standardisation, certified details and monitored case studies [16]. Two of the positive pathways for perspective show that economic barriers can be present while support is maintained, provided that supply-chain barriers are perceived as absent (configurations 4 and 6, where both are core conditions), which suggests that when the market is perceived as able to deliver products and coordination, high costs do not prevent a favourable strategic view. This reading is consistent with studies that locate supply-chain coordination at the root of BIPV market development [15,41], but it remains an interpretation of two pathways that describe two cases and one case, respectively.
The evidence is consistent with P7: no single barrier category was necessary at the formal threshold, each outcome was reached through several alternative combinations, and some pathways overlap, as shown by differences between raw and unique coverage. The configurations also illustrate the limited diversity of a small sample, since eight of the twelve describe one or two cases. The evidence is likewise consistent with P8, since the necessity structure and pathways of perception and perspective differ. Taken together with P4, this indicates that the perceived economic acceptance of BIPV and the belief in its strategic role are different constructs with different configurational drivers and should not be used interchangeably. These results describe set relations among 16 cases, with sample-specific calibration and limited diversity, and they are not estimates of population effects [62,63]; only the patterns that proved stable in Section 4.5.4, namely the presence of technological barriers in the pathways to the absence of a positive perspective and the economic and technological pattern for a positive perspective, should be treated as findings.
5.3. Synthetic Respondents (P9–P11)
The synthetic samples reproduced several broad features of the human results, which makes the evidence partly consistent with P9. They rated barriers as important overall, reproduced the average outcome scores (perception 0.535 and 0.526 against 0.544; perspective 0.722 and 0.730 against 0.719), reported a more positive future perspective than benefit–cost perception, and placed the lack of information and guidance among the most severe barriers. That the personas did not produce arbitrary answers is consistent with the finding that conditioning on situational information helps to approximate human responses [22,64] and with reports of similar averages in other domains [23]. The reproduction of the gap between perception and perspective is of particular interest, since it shows that the model can distinguish between the two outcome statements. The correspondence stops at the aggregate level, however: the ordering of the barriers was only weakly correlated with the human one (ρ = 0.33 for prompt A and 0.63 for B), and the personas were no closer to the respondents on whose profiles they were based than to other respondents (exact agreement 41.8% and 48.8% with the matched respondent, against 42.4% and 45.7% with the others).
The differences are systematic in several respects, which is consistent with P10. The dispersion of the synthetic answers was markedly lower, particularly for barrier categories (standard deviations 0.04–0.78 times the human ones in sample A), which agrees with reports of reduced variation and diversity of thought in synthetic responses [23,24]. Technological barriers were rated lower than by humans under both prompts (−0.126 and −0.116), and so were the payback period, increased technical complexity and future maintenance, whereas the lack of information and guidance was rated higher. The incentive-related items depended on the context supplied in the prompt: insufficient incentives and uncertainty about future incentives reached 0.960 when the prompt described the status of support programmes and 0.500 and 0.570 when it did not. Thus, the information given in the prompt seems to be a parsimonious explanation for the high incentive scores.
The role-level patterns were not preserved either: synthetic owners gave a much lower perspective than human owners (0.547 against 0.733), the order of roles was reversed, and the outcomes of the personas increased strongly with the knowledge and experience of the profile (ρ up to 0.87), whereas those of the humans did not. This is consistent with the observation that persona attributes can redistribute errors among subgroups without improving alignment [69] and that models do not consistently reproduce human response patterns [25]. Repeated generations were highly consistent (92% agreement between runs), so the differences are not noise, but they come from one model version, two prompts and 16 personas and should not be generalised as a characteristic bias of LLMs; they are better read as the signature of this generation process [70].
At the configurational level, the evidence is not consistent with P11. The configurations of the human sample were not reproduced: in sample A, economic and technological barriers are practically constant (the economic scores range from 0.758 to 0.779), so the truth table has four rows, only knowledge and supply-chain barriers carry information, no configuration is sufficient for a positive perception, the clearest necessity relations involve supply-chain and not technological barriers, and knowledge barriers play the opposite role in the pathways to a negative perception. The synthetic solutions were also unstable in the sensitivity analysis, and the apparent stability of economic and technological barriers is a consequence of their lack of variation. Reduced variance probably contributes to this, because calibration anchored on the empirical distribution turns small score differences into set-membership differences when the spread is narrow. Descriptive similarity therefore does not guarantee configurational equivalence, which is a relevant caution for research that treats synthetic respondents as drop-in replacements. A hybrid design in which synthetic and human experts are combined, as proposed by Rammo et al. [68], may be valuable, but our results suggest that the contributions of each source should be reported separately before they are combined.
6. Conclusions
This exploratory study analysed the barriers to the adoption of BIPV in the renovation of residential buildings in Northern Portugal from the perspective of 16 owners, architects and engineers, combining triangular fuzzy numbers and CFCS scores, which handle the vagueness of linguistic Likert answers, with a configurational fsQCA and a sensitivity analysis of its calibration. A parallel analysis of persona-conditioned LLM responses, generated repeatedly under two prompts, served as an exploratory test of synthetic respondents.
The human results show that BIPV adoption is perceived as constrained by many barriers at once: 223 of the 224 ratings were at least Medium, with the lack of information, guidance and examples and the high initial investment at the top and with a self-reported knowledge profile dominated by None and Low levels. Respondents were more positive about the future role of BIPV in renovation than about the present balance between benefits and costs, and the configurational analysis showed that the two outcomes follow different logics. Technological barriers marked the divide for the strategic perspective, being present in all pathways to its absence, whereas no single category governed the benefit–cost perception, which was reached through several combinations. The detailed configurations, however, were sensitive to calibration: only two of the twelve baseline configurations reappeared when the adjustment of memberships of 0.5 was reversed, and only the technological pattern for the absence of a positive perspective and the economic and technological pattern for a positive perspective were partly stable. The synthetic samples reproduced the average outcome scores and the gap between the two outcomes but compressed variance, rated technological barriers lower, depended on the contextual information in the prompt for the incentive items, did not track the individual respondents on whose profiles they were based and produced a configurational structure that could not be compared with the human one. LLM personas may therefore serve as a complement for exploration, but they cannot be assumed to be statistically interchangeable with human stakeholders.
Implications for policy: The prominence of the information barrier supports the creation of a public knowledge infrastructure for BIPV in renovation, including official technical guidance, libraries of documented renovation cases with monitored performance, and training for architects, engineers and installers, as foreseen in the capacity assessments of national renovation plans [1]. The uncertainty about future incentives and policies suggests that predictable support frameworks matter as much as their level. Because the relevant cost in renovation is incremental, public programmes and tools should present life-cycle and avoided-material costs and not only the price of photovoltaic modules. The relevance of supply-chain barriers and the technical divide in perspective call for standards, certification routes and coordination mechanisms between the construction and energy sectors [16,17].
Implications for practice: Manufacturers and installers could reduce technical uncertainty by providing standardised details, performance data and reference projects adapted to existing buildings. Design teams could involve architects, engineers and suppliers at early stages, since the barriers are perceived differently by each profession. Advisers working with owners could use renovation-specific cost comparisons to counter the perception of BIPV as an add-on.
Implications for research: The results support the use of configurational methods in the study of technology adoption, because the same condition contributes to different outcomes, depending on its combination with others, and the use of fuzzy representations of linguistic scales when the vagueness of judgements is relevant. They also show that studies using synthetic respondents should test configurational structure, dispersion and subgroup patterns, not only mean scores, and that configurational results from small samples should be accompanied by a sensitivity analysis of calibration choices.
Limitations: The sample is small, purposive and not statistically representative of stakeholders in Northern Portugal; it was recruited over ten days, and although the invitations were balanced across the three groups, the interviews that could be held within the available time were not, so that the achieved sample over-represents architects and reflects the availability of the invitees; the groups of owners and engineers have four members each, so inferential p-values are exploratory (Holm correction was applied only across the six scores of each paired comparison). Knowledge was self-reported, and both outcomes are single items that measure opinions and not adoption behaviour, cannot be assessed for reliability, and are concentrated on Medium, an answer that may mean neutrality or lack of information. The category scores are composite indices of three or four items whose internal consistency is acceptable in the human sample but imprecise and weak in the synthetic samples. The fsQCA is based on 16 cases per sample with sample-specific calibration; its detailed solutions depend on the treatment of memberships of exactly 0.5, on the precision of the data and on the scoring, and several configurations describe one or two cases. Other value-chain actors (installers, manufacturers, developers, contractors and public authorities) are not represented. The synthetic analysis is based on one model version accessed through an interface that does not allow for setting sampling parameters, two prompts and 16 personas matched to the human profiles but not to their responses; in sample A, economic and technological barriers are practically constant, which prevents a configurational comparison.
Future research: Larger and more diverse samples, including other regions and actors of the value chain, would allow for testing the stability of the configurations and the inclusion of knowledge and experience as conditions in the fsQCA. Multi-item outcome measures and sensitivity analyses of calibration thresholds would strengthen the configurational results. Regarding synthetic respondents, future work could compare several models, control sampling parameters through programmatic access, evaluate personas grounded in documents such as national regulations or technical reports, and examine hybrid human–AI panels in which the contribution of each source is reported separately.
Supplementary Materials
The following supporting information can be downloaded at: https://www.mdpi.com/article/10.3390/su182211660/s1, prompts A and B (S1_Prompt_A.txt and S1_Prompt_B.txt); raw outputs of the 160 synthetic generations (S2_synthetic_answers_prompt_A.csv and S2_synthetic_answers_prompt_B.csv); item-level data of the human sample, coarsened to prevent re-identification (S3_human_item_level_answers.csv); calibrated data and fsQCA truth tables (S4_calibration_and_truth_tables.xlxs); and the full sensitivity analysis (S5_sensitivity_analysis.xlxs).
Author Contributions
Conceptualization, N.R.-C. and J.P.-C.; methodology, N.R.-C. and J.P.-C.; formal analysis, C.I.R.-M.-P.; investigation, C.I.R.-M.-P.; data curation, N.R.-C. and C.I.R.-M.-P.; writing—original draft preparation, N.R.-C. and C.I.R.-M.-P.; writing—review and editing, N.R.-C., C.I.R.-M.-P. and J.P.-C.; project administration, J.P.-C. All authors have read and agreed to the published version of the manuscript.
Funding
This research received no external funding.
Institutional Review Board Statement
Ethical review and approval were waived for this study due to the EU General Data Protection Regulation (GDPR) (Regulation [EU] 2016/679). The 16 participants were adult professionals contacted voluntarily; they received information on the purpose, the voluntary nature of participation, and the processing of their data before answering, and participated on the basis of informed consent; no special categories of data were collected; only the data needed for the research were kept; responses were pseudonymised at collection and the deposited dataset is anonymised; and data are stored securely.
Informed Consent Statement
Informed consent was obtained from all subjects involved in the study.
Data Availability Statement
The anonymised questionnaire data of the human sample (coarsened to prevent re-identification), the prompts, and the raw synthetic outputs are available as Supplementary Materials. Further data can be provided upon request.
Acknowledgments
During the preparation of this manuscript/study, the authors used GPT-6 Luna for the purposes of generating a synthetic sample of BIPV stakeholders. Claude Sonnet 5.5 was used to generate figures, revise the English writing and to convert the in-text citations to numbered brackets. The authors have reviewed and edited the output and take full responsibility for the content of this publication.
Conflicts of Interest
The authors declare no conflicts of interest.
Abbreviations
The following abbreviations are used in this manuscript:
| BAPV | Building-applied photovoltaics |
| BIPV | Building-integrated photovoltaics |
| CFCS | Converting fuzzy data into crisp scores |
| EU | European Union |
| fsQCA | Fuzzy-set qualitative comparative analysis |
| LLM | Large language model |
| PRI | Proportional reduction in inconsistency |
| PV | Photovoltaic |
| QCA | Qualitative comparative analysis |
| RQ | Research question |
| SD | Standard deviation |
| TFN | Triangular fuzzy number |
References
- European Parliament and Council. Directive (EU) 2024/1275 of 24 April 2024 on the Energy Performance of Buildings. Off. J. Eur. Union 2024, L 2024/1275. Available online: https://eur-lex.europa.eu/eli/dir/2024/1275/oj/eng (accessed on 23 September 2026).
- European Parliament and Council. Directive (EU) 2023/1791 of 13 September 2023 on Energy Efficiency and Amending Regulation (EU) 2023/955 (Recast). Off. J. Eur. Union 2023, L 231, 1–111. Available online: https://eur-lex.europa.eu/eli/dir/2023/1791/oj/eng (accessed on 23 September 2026).
- European Commission. Feedback on the Draft National Building Renovation Plan of Portugal; Directorate-General for Energy: Brussels, Belgium, 2026; Available online: https://webgate.ec.europa.eu/circabc-ewpp/d/d/workspace/SpacesStore/088e7ab2-5742-4428-a7c7-d244da3d266f/download (accessed on 23 September 2026).
- Maduta, C.; Tami, J.; Tsemekidi-Tzeiranaki, S.; Castellazzi, L.; D’Agostino, D.; Lupi, V.; Clementi, E.; Paci, D.; Bednarski, N.; Ringel, M.; et al. Assessment of the First Draft National Building Renovation Plans. Part 1; JRC147375; Publications Office of the European Union: Luxembourg, 2026; Available online: https://publications.jrc.ec.europa.eu/repository/bitstream/JRC147375/JRC147375_01.pdf (accessed on 23 September 2026).
- Pohoryles, D.A.; Maduta, C.; Bournas, D.A.; Kouris, L.A. Energy performance of existing residential buildings in Europe: A novel approach combining energy with seismic retrofitting. Energy Build. 2020, 223, 110024. [Google Scholar] [CrossRef] [Scilit]
- Laaroussi, Y.; Bahrar, M.; Zavrl, E.; El Mankibi, M.; Stritih, U. New qualitative approach based on data analysis of European building stock and retrofit market. Sustain. Cities Soc. 2020, 63, 102452. [Google Scholar] [CrossRef] [Scilit]
- Berger, K.; Cueli, A.B.; Boddaert, S.; Del Buono, M.; Delisle, V.; Fedorova, A.; Frontini, F.; Hendrick, P.; Inoue, S.; Ishii, H.; et al. International Definitions of “BIPV”; IEA PVPS Task 15, Report T15-04:2018; IEA PVPS: Paris, France, 2018; Available online: https://iea-pvps.org/wp-content/uploads/2020/02/IEA-PVPS_Task_15_Report_C0_International_definitions_of_BIPV_hrw_180823.pdf (accessed on 23 September 2026).
- Heinstein, P.; Ballif, C.; Perret-Aebi, L.E. Building integrated photovoltaics (BIPV): Review, potentials, barriers and myths. Green 2013, 3, 125–156. [Google Scholar] [CrossRef]
- Agathokleous, R.A.; Kalogirou, S.A. Status, barriers and perspectives of building integrated photovoltaic systems. Energy 2020, 191, 116471. [Google Scholar] [CrossRef] [Scilit]
- Scognamiglio, A. Building-integrated photovoltaics (BIPV) for cost-effective energy-efficient retrofitting. In Cost-Effective Energy Efficient Building Retrofitting; Pacheco-Torgal, F., Granqvist, C.G., Jelle, B.P., Vanoli, G.P., Bianco, N., Kurnitski, J., Eds.; Woodhead Publishing: Cambridge, UK, 2017; pp. 169–197. [Google Scholar] [CrossRef] [Scilit]
- Martín-Chivelet, N.; Gutiérrez, J.C.; Alonso-Abella, M.; Chenlo, F.; Cuenca, J. Building retrofit with photovoltaics: Construction and performance of a BIPV ventilated façade. Energies 2018, 11, 1719. [Google Scholar] [CrossRef] [Scilit]
- Aguacil, S.; Lufkin, S.; Rey, E. Active surfaces selection method for building-integrated photovoltaics (BIPV) in renovation projects based on self-consumption and self-sufficiency. Energy Build. 2019, 193, 15–28. [Google Scholar] [CrossRef] [Scilit]
- Aguacil, S.; Duque, S.; Lufkin, S.; Rey, E. Designing with building-integrated photovoltaics (BIPV): A pathway to decarbonize residential buildings. J. Build. Eng. 2024, 96, 110486. [Google Scholar] [CrossRef] [Scilit]
- Martín-Chivelet, N.; Del Hierro López, I.; Marcos-Castro, A.; Sanz-Saiz, C.; Polo, J.; Olivieri, L. Towards innovative building renovation through building-integrated photovoltaics (BIPV): A comprehensive review. Buildings 2026, 16, 2139. [Google Scholar] [CrossRef] [Scilit]
- Curtius, H.C. The adoption of building-integrated photovoltaics: Barriers and facilitators. Renew. Energy 2018, 126, 783–790. [Google Scholar] [CrossRef] [Scilit]
- Parolini, F.; Bonomo, P.; Frontini, F.; Bellenda, G.; Caccivio, M.; Federova, A.; Boddaert, S.; Chivelet, N.M.; Wilson, H.R. Advancing BIPV Standardization: Addressing Regulatory Gaps and Performance Challenges; IEA PVPS Task 15, Report T15-24:2024; IEA PVPS: Paris, France, 2024; Available online: https://iea-pvps.org/key-topics/advancing-bipv-standardization-addressing-regulatory-gaps-and-performance-challenges/ (accessed on 8 November 2026).
- Martín-Chivelet, N.; van Noord, M.; Tilli, F.; Yang, R.J.; Weerasinghe, N.; Daun, E.; Baggini, A. BIPV market development: International technological innovation system analysis. Buildings 2025, 15, 3011. [Google Scholar] [CrossRef] [Scilit]
- Poulin, F.; Orator-Saghy, S.; Rajal, B.; Gölz, S.; Raats, P. Analysis of Barriers for Innovative Forms of Solar PV Deployment and Associated Recommendations; European Commission, Directorate-General for Energy: Brussels, Belgium, 2025; Available online: https://build-up.ec.europa.eu/en/bup/download/private?filepath=2025-08/FeyZKx0GrG_26_08_2025_105013.pdf (accessed on 8 November 2026).
- van Noord, M.; Martín-Chivelet, N.; Weerasinghe, N.; Halme, J.; Tilli, F.; Baggini, A.; Tabakovic, M.; Bernsen, O.; Yang, R.; Daun, E. Analysis of Technological Innovation Systems for BIPV in Different IEA Countries; IEA PVPS Task 15; IEA PVPS: Paris, France, 2025. [Google Scholar] [CrossRef] [Scilit]
- Biyik, E.; Araz, M.; Hepbasli, A.; Shahrestani, M.; Yao, R.; Shao, L.; Essah, E.; Oliveira, A.C.; del Caño, T.; Rico, E.; et al. A key review of building integrated photovoltaic (BIPV) systems. Eng. Sci. Technol. Int. J. 2017, 20, 833–858. [Google Scholar] [CrossRef] [Scilit]
- Faes, A.; Virtuani, A.; Quest, H.; Maturi, L.; Scognamiglio, A.; Frontini, F.; Schlueter, A.; Martin-Chivelet, N.; Reinders, A. Building-integrated photovoltaics. Nat. Rev. Clean Technol. 2025, 1, 333–350. [Google Scholar] [CrossRef] [Scilit]
- Argyle, L.P.; Busby, E.C.; Fulda, N.; Gubler, J.R.; Rytting, C.; Wingate, D. Out of one, many: Using language models to simulate human samples. Polit. Anal. 2023, 31, 337–351. [Google Scholar] [CrossRef] [Scilit]
- Bisbee, J.; Clinton, J.D.; Dorff, C.; Kenkel, B.; Larson, J.M. Synthetic replacements for human survey data? The perils of large language models. Polit. Anal. 2024, 32, 401–416. [Google Scholar] [CrossRef] [Scilit]
- Park, P.S.; Schoenegger, P.; Zhu, C. Diminished diversity-of-thought in a standard large language model. Behav. Res. Methods 2024, 56, 5754–5770. [Google Scholar] [CrossRef] [Scilit] [PubMed]
- Tjuatja, L.; Chen, V.; Wu, T.; Talwalkwar, A.; Neubig, G. Do LLMs exhibit human-like response biases? A case study in survey design. Trans. Assoc. Comput. Linguist. 2024, 12, 1011–1026. [Google Scholar] [CrossRef] [Scilit]
- EN 50583-1:2016; Photovoltaics in Buildings—Part 1: BIPV Modules. European Committee for Electrotechnical Standardization (CENELEC): Brussels, Belgium, 2016. Available online: https://standards.iteh.ai/catalog/standards/clc/a749f8c8-938e-48a4-9a7d-0891a4c57f8f/en-50583-1-2016?srsltid=AYCX9vJfKvzVwIgK9o6dK2xLzcg4wo2uYA8An7-riKKcAPx8EWHwxDNM (accessed on 8 November 2026).
- EN 50583-2:2016; Photovoltaics in Buildings—Part 2: BIPV Systems. European Committee for Electrotechnical Standardization (CENELEC): Brussels, Belgium, 2016. Available online: https://standards.iteh.ai/catalog/standards/clc/5742107f-80d2-4e7a-ac72-91199a23e494/en-50583-2-2016 (accessed on 8 November 2026).
- IEC 63092-1:2020; Photovoltaics in Buildings—Part 1: Requirements for Building-Integrated Photovoltaic Modules. International Electrotechnical Commission (IEC): Geneva, Switzerland, 2020. Available online: https://standards.iteh.ai/catalog/standards/iec/b8c18792-f4b5-48a9-89da-b42f7615d2ee/iec-63092-1-2020 (accessed on 8 November 2026).
- IEC 63092-2:2020; Photovoltaics in Buildings—Part 2: Requirements for Building-Integrated Photovoltaic Systems. International Electrotechnical Commission (IEC): Geneva, Switzerland, 2020. Available online: https://standards.iteh.ai/catalog/standards/iec/ddd5d528-97e2-473c-b3e4-b8de0a697071/iec-63092-2-2020 (accessed on 8 November 2026).
- Corti, P.; Follo, A.; Bonomo, P. Workflow to support cost-benefits comparison and sensitivity analysis of BIPV case studies: Three examples of BIPV facades in the south of Switzerland. Energy Build. 2024, 322, 114732. [Google Scholar] [CrossRef] [Scilit]
- Yang, R.J. Overcoming technical barriers and risks in the application of building integrated photovoltaics (BIPV): Hardware and software strategies. Autom. Constr. 2015, 51, 92–102. [Google Scholar] [CrossRef] [Scilit]
- Rosa, F. Building-integrated photovoltaics (BIPV) in historical buildings: Opportunities and constraints. Energies 2020, 13, 3628. [Google Scholar] [CrossRef] [Scilit]
- Bottino-Leone, D.; Stawinoga, A.E.; Adami, J.; Troi, A.; Herrera-Avellanosa, D. Social acceptance of integrated photovoltaic systems in Italian heritage and landscape contexts. Buildings 2024, 14, 3948. [Google Scholar] [CrossRef] [Scilit]
- Azadian, F.; Radzi, M.A.M. A general approach toward building integrated photovoltaic systems and its implementation barriers: A review. Renew. Sustain. Energy Rev. 2013, 22, 527–538. [Google Scholar] [CrossRef] [Scilit]
- Yang, R.J.; Zou, P.X.W. Building integrated photovoltaics (BIPV): Costs, benefits, risks, barriers and improvement strategy. Int. J. Constr. Manag. 2016, 16, 39–53. [Google Scholar] [CrossRef] [Scilit]
- Goh, K.C.; Goh, H.H.; Yap, A.B.K.; Masrom, M.A.N.; Mohamed, S. Barriers and drivers of Malaysian BIPV application: Perspective of developers. Procedia Eng. 2017, 180, 1585–1595. [Google Scholar] [CrossRef] [Scilit]
- Stauch, A.; Vuichard, P. Community solar as an innovative business model for building-integrated photovoltaics: An experimental analysis with Swiss electricity consumers. Energy Build. 2019, 204, 109526. [Google Scholar] [CrossRef] [Scilit]
- Attoye, D.E.; Adekunle, T.O.; Tabet Aoul, K.A.; Hassan, A.; Attoye, S.O. A conceptual framework for a building integrated photovoltaics (BIPV) educative-communication approach. Sustainability 2018, 10, 3781. [Google Scholar] [CrossRef] [Scilit]
- Yang, H.; Lu, L. Optical, thermal, and electrical properties of building-integrated photovoltaics (BIPV): A critical review. Energy Eng. 2026, 123, 1. [Google Scholar] [CrossRef] [Scilit]
- van der Poel, E.; van Sark, W.; Aartsma, Y.; Teunissen, E.; van Straten, I.; de Vries, A. Steps towards an optimal building-integrated photovoltaics (BIPV) value chain in the Netherlands. In Sustainability in Energy and Buildings; Littlewood, J., Howlett, R., Capozzoli, A., Jain, L., Eds.; Smart Innovation, Systems and Technologies; Springer: Singapore, 2020; Volume 163. [Google Scholar] [CrossRef] [Scilit]
- Chen, T.; Sun, H.; Tai, K.F.; Heng, C.K. Analysis of the barriers to implementing building integrated photovoltaics in Singapore using an interpretive structural modelling approach. J. Clean. Prod. 2022, 365, 132652. [Google Scholar] [CrossRef] [Scilit]
- Attoye, D.E.; Tabet Aoul, K.A.; Hassan, A. Mandatory policy, innovations and the renewable energy debate: A case study on building integrated photovoltaics. Buildings 2022, 12, 931. [Google Scholar] [CrossRef] [Scilit]
- Zhou, Q.; Yao, Y. Unveiling the key drivers for the adoption of colored BIPV in residential buildings: Insights from the Chinese context. J. Build. Eng. 2025, 116, 114613. [Google Scholar] [CrossRef] [Scilit]
- Casalicchio, V.; Gonnella, G.; Maturi, L.; Barchi, G. Economic competitiveness of BIPV in energy sharing configurations across selected European countries. Energy Rep. 2025, 14, 2031–2046. [Google Scholar] [CrossRef] [Scilit]
- Weerasinghe, R.P.N.P.; Yang, R.J.; Too, E.; Le, T. Renewable energy adoption in the built environment: A sociotechnical network approach. Intell. Build. Int. 2021, 13, 33–50. [Google Scholar] [CrossRef] [Scilit]
- Lu, Y.; Chang, R.; Shabunko, V.; Yee, A.T.L. The implementation of building-integrated photovoltaics in Singapore: Drivers versus barriers. Energy 2019, 168, 400–408. [Google Scholar] [CrossRef] [Scilit]
- Zadeh, L.A. The concept of a linguistic variable and its application to approximate reasoning. Inf. Sci. 1975, 8, 199–249. [Google Scholar] [CrossRef] [Scilit]
- Li, R.J. Fuzzy method in group decision making. Comput. Math. Appl. 1999, 38, 91–101. [Google Scholar] [CrossRef] [Scilit]
- Lazim, A.; Wahab, N. A fuzzy decision making approach in evaluating ferry service quality. Manag. Res. Pract. 2010, 2, 94–107. Available online: https://mrp.ase.ro/no21/f6.pdf.
- Bouzon, M.; Govindan, K.; Rodriguez, C.M.T.; Campos, L.M.S. Identification and analysis of reverse logistics barriers using fuzzy Delphi method and AHP. Resour. Conserv. Recycl. 2016, 108, 182–197. [Google Scholar] [CrossRef] [Scilit]
- Chen, C.T. Extensions of the TOPSIS for group decision-making under fuzzy environment. Fuzzy Sets Syst. 2000, 114, 1–9. [Google Scholar] [CrossRef] [Scilit]
- Opricovic, S.; Tzeng, G.-H. Defuzzification within a multicriteria decision model. Int. J. Uncertain. Fuzziness Knowl.-Based Syst. 2003, 11, 635–652. [Google Scholar] [CrossRef] [Scilit]
- Ragin, C.C. Redesigning Social Inquiry: Fuzzy Sets and Beyond; University of Chicago Press: Chicago, IL, USA, 2008. [Google Scholar]
- Fiss, P.C. Building better causal theories: A fuzzy set approach to typologies in organization research. Acad. Manag. J. 2011, 54, 393–420. [Google Scholar] [CrossRef] [Scilit]
- Misangyi, V.F.; Greckhamer, T.; Furnari, S.; Fiss, P.C.; Crilly, D.; Aguilera, R. Embracing causal complexity: The emergence of a neo-configurational perspective. J. Manag. 2017, 43, 255–282. [Google Scholar] [CrossRef] [Scilit]
- Schneider, C.Q.; Wagemann, C. Set-Theoretic Methods for the Social Sciences: A Guide to Qualitative Comparative Analysis; Cambridge University Press: Cambridge, UK, 2012. [Google Scholar]
- Pappas, I.O.; Woodside, A.G. Fuzzy-set qualitative comparative analysis (fsQCA): Guidelines for research practice in information systems and marketing. Int. J. Inf. Manag. 2021, 58, 102310. [Google Scholar] [CrossRef] [Scilit]
- Kraus, S.; Ribeiro-Soriano, D.; Schüssler, M. Fuzzy-set qualitative comparative analysis (fsQCA) in entrepreneurship and innovation research—The rise of a method. Int. Entrep. Manag. J. 2018, 14, 15–33. [Google Scholar] [CrossRef] [Scilit]
- Kumar, S.; Sahoo, S.; Lim, W.M.; Kraus, S.; Bamel, U. Fuzzy-set qualitative comparative analysis (fsQCA) in business and management research: A contemporary overview. Technol. Forecast. Soc. Change 2022, 178, 121599. [Google Scholar] [CrossRef] [Scilit]
- Fiss, P.C.; Sharapov, D.; Cronqvist, L. Opposites attract? Opportunities and challenges for integrating large-N QCA and econometric analysis. Polit. Res. Q. 2013, 66, 191–198. Available online: https://www.jstor.org/stable/23563602 (accessed on 8 November 2026).
- Gligor, D.; Bozkurt, S. FsQCA versus regression: The context of customer engagement. J. Retail. Consum. Serv. 2020, 52, 101929. [Google Scholar] [CrossRef] [Scilit]
- Greckhamer, T.; Misangyi, V.F.; Fiss, P.C. The two QCAs: From a small-N to a large-N set theoretic approach. In Configurational Theory and Methods in Organizational Research; Fiss, P.C., Cambré, B., Marx, A., Eds.; Research in the Sociology of Organizations; Emerald: Bingley, UK, 2013; Volume 38, pp. 49–75. [Google Scholar] [CrossRef] [Scilit]
- Cangialosi, N. Fuzzy-set qualitative comparative analysis (fsQCA) in organizational psychology: Theoretical overview, research guidelines, and a step-by-step tutorial using R software. Span. J. Psychol. 2023, 26, e21. [Google Scholar] [CrossRef] [Scilit] [PubMed]
- Ma, C. Evaluating silicon sampling: LLM accuracy in simulating public opinion on facial recognition technology. In Human Interaction and Emerging Technologies (IHIET 2025); Ahram, T.Z., Motschnig, R., Eds.; AHFE Open Access; AHFE International: New York, NY, USA, 2025; Volume 197. [Google Scholar] [CrossRef] [Scilit]
- Chen, L.; Darko, A.; Zhang, F.; Chan, A.P.; Yang, Q. Can large language models replace human experts? Effectiveness and limitations in building energy retrofit challenges assessment. Build. Environ. 2025, 276, 112891. [Google Scholar] [CrossRef] [Scilit]
- Eti, S.; Dinçer, H.; Yüksel, S.; Pamucar, D.; Çırak, A.N.; Özdemir, S.; Simic, V. Enhancing solar panel recycling efficiency through zero-shot learning and hybrid fuzzy decision-making techniques. Renew. Energy 2025, 256, 124411. [Google Scholar] [CrossRef] [Scilit]
- Zhou, C.; He, J.; Ma, X.; Berg-Kirkpatrick, T.; Neubig, G. Prompt consistency for zero-shot task generalization. In Findings of the Association for Computational Linguistics: EMNLP 2022; Association for Computational Linguistics: Stroudsburg, PA, USA, 2022; pp. 2613–2626. [Google Scholar] [CrossRef] [Scilit]
- Rammo, J.P.; Bouhadjer, Y.; Rouvelle, C.R.; Bernhard, O.; Wegmann, M.; Reuter, C.; Zaeh, M.F. Manufacturing change management—An AI- and data-enhanced Delphi study and algorithm to support change process tailoring and the identification of suitable methods and digital tools. Prod. Eng. 2026, 20, 43. [Google Scholar] [CrossRef] [Scilit]
- Taday Morocho, E.E.; Cima, L.; Fagni, T.; Avvenuti, M.; Cresci, S. Assessing the reliability of persona-conditioned LLMs as synthetic survey respondents. In Proceedings of the ACM Web Conference 2026, Dubai, UAE, 13–17 April 2026. [Google Scholar] [CrossRef] [Scilit]
- Batzner, J.; Stocker, V.; Tang, B.; Natarajan, A.; Chen, Q.; Schmid, S.; Kasneci, G. Whose personae? Synthetic persona experiments in LLM research and pathways to transparency. Proc. AAAI ACM Conf. AI Ethics Soc. 2025, 8, 343–354. [Google Scholar] [CrossRef] [Scilit]
- Naveen, P.; Akilan, T.; Manikandan, P.; Pushpavanam, B.; Swedheetha, C.; Saravanan, M. Comparative review of large language models. In Proceedings of the 5th International Conference on Soft Computing for Security Applications (ICSCSA), Salem, India, 4–6 August 2025; pp. 2120–2124. [Google Scholar] [CrossRef] [Scilit]
- Ragin, C.C.; Davey, S. fs/QCA, Version 4.1 [Computer Programme]. 2023. Available online: https://sites.socsci.uci.edu/~cragin/fsQCA/software.shtml (accessed on 30 October 2026).
- Duşa, A. QCA with R: A Comprehensive Resource; Springer: Cham, Switzerland, 2019. [Google Scholar]
- Mattke, J.; Maier, C.; Weitzel, T.; Thatcher, J.B. Qualitative comparative analysis in the information systems discipline: A literature review and methodological recommendations. Internet Res. 2021, 31, 1493–1517. [Google Scholar] [CrossRef] [Scilit]
- Skaaning, S.-E. Assessing the robustness of crisp-set and fuzzy-set QCA results. Sociol. Methods Res. 2011, 40, 391–408. [Google Scholar] [CrossRef] [Scilit]
- Roig-Tierno, N.; Gonzalez-Cruz, T.F.; Llopis-Martinez, J. An overview of qualitative comparative analysis: A bibliometric analysis. J. Innov. Knowl. 2017, 2, 15–23. [Google Scholar] [CrossRef] [Scilit]
- Cronbach, L.J. Coefficient alpha and the internal structure of tests. Psychometrika 1951, 16, 297–334. [Google Scholar] [CrossRef] [Scilit]
- Efron, B.; Tibshirani, R.J. An Introduction to the Bootstrap; Chapman & Hall: New York, NY, USA, 1993. [Google Scholar]
- Wilcoxon, F. Individual comparisons by ranking methods. Biom. Bull. 1945, 1, 80–83. [Google Scholar] [CrossRef] [Scilit]
- Holm, S. A simple sequentially rejective multiple test procedure. Scand. J. Stat. 1979, 6, 65–70. Available online: https://www.academia.edu/77036515/A_Simple_Sequentially_Rejective_Multiple_Test_Procedure (accessed on 8 November 2026).
- Cohen, J. Statistical Power Analysis for the Behavioral Sciences, 2nd ed.; Lawrence Erlbaum Associates: Hillsdale, NJ, USA, 1988. [Google Scholar]
- Welch, B.L. The generalization of “Student’s” problem when several different population variances are involved. Biometrika 1947, 34, 28–35. [Google Scholar] [CrossRef] [Scilit] [PubMed]
- Mann, H.B.; Whitney, D.R. On a test of whether one of two random variables is stochastically larger than the other. Ann. Math. Stat. 1947, 18, 50–60. [Google Scholar] [CrossRef] [Scilit]
- Clopper, C.J.; Pearson, E.S. The use of confidence or fiducial limits illustrated in the case of the binomial. Biometrika 1934, 26, 404–413. [Google Scholar] [CrossRef]
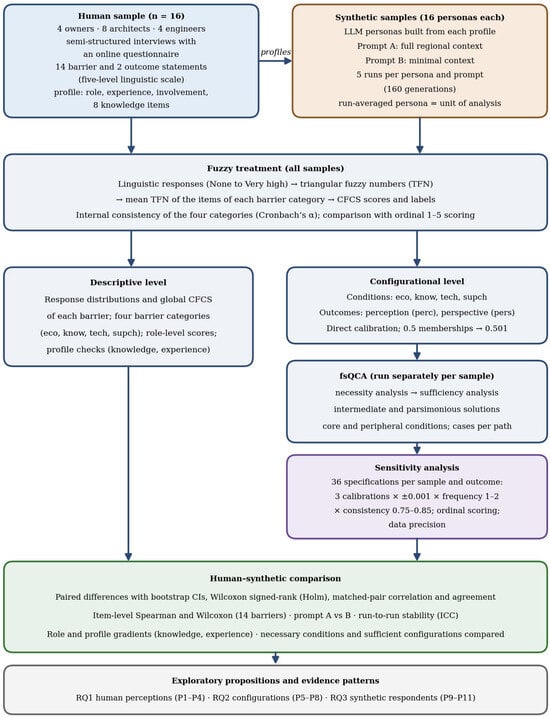
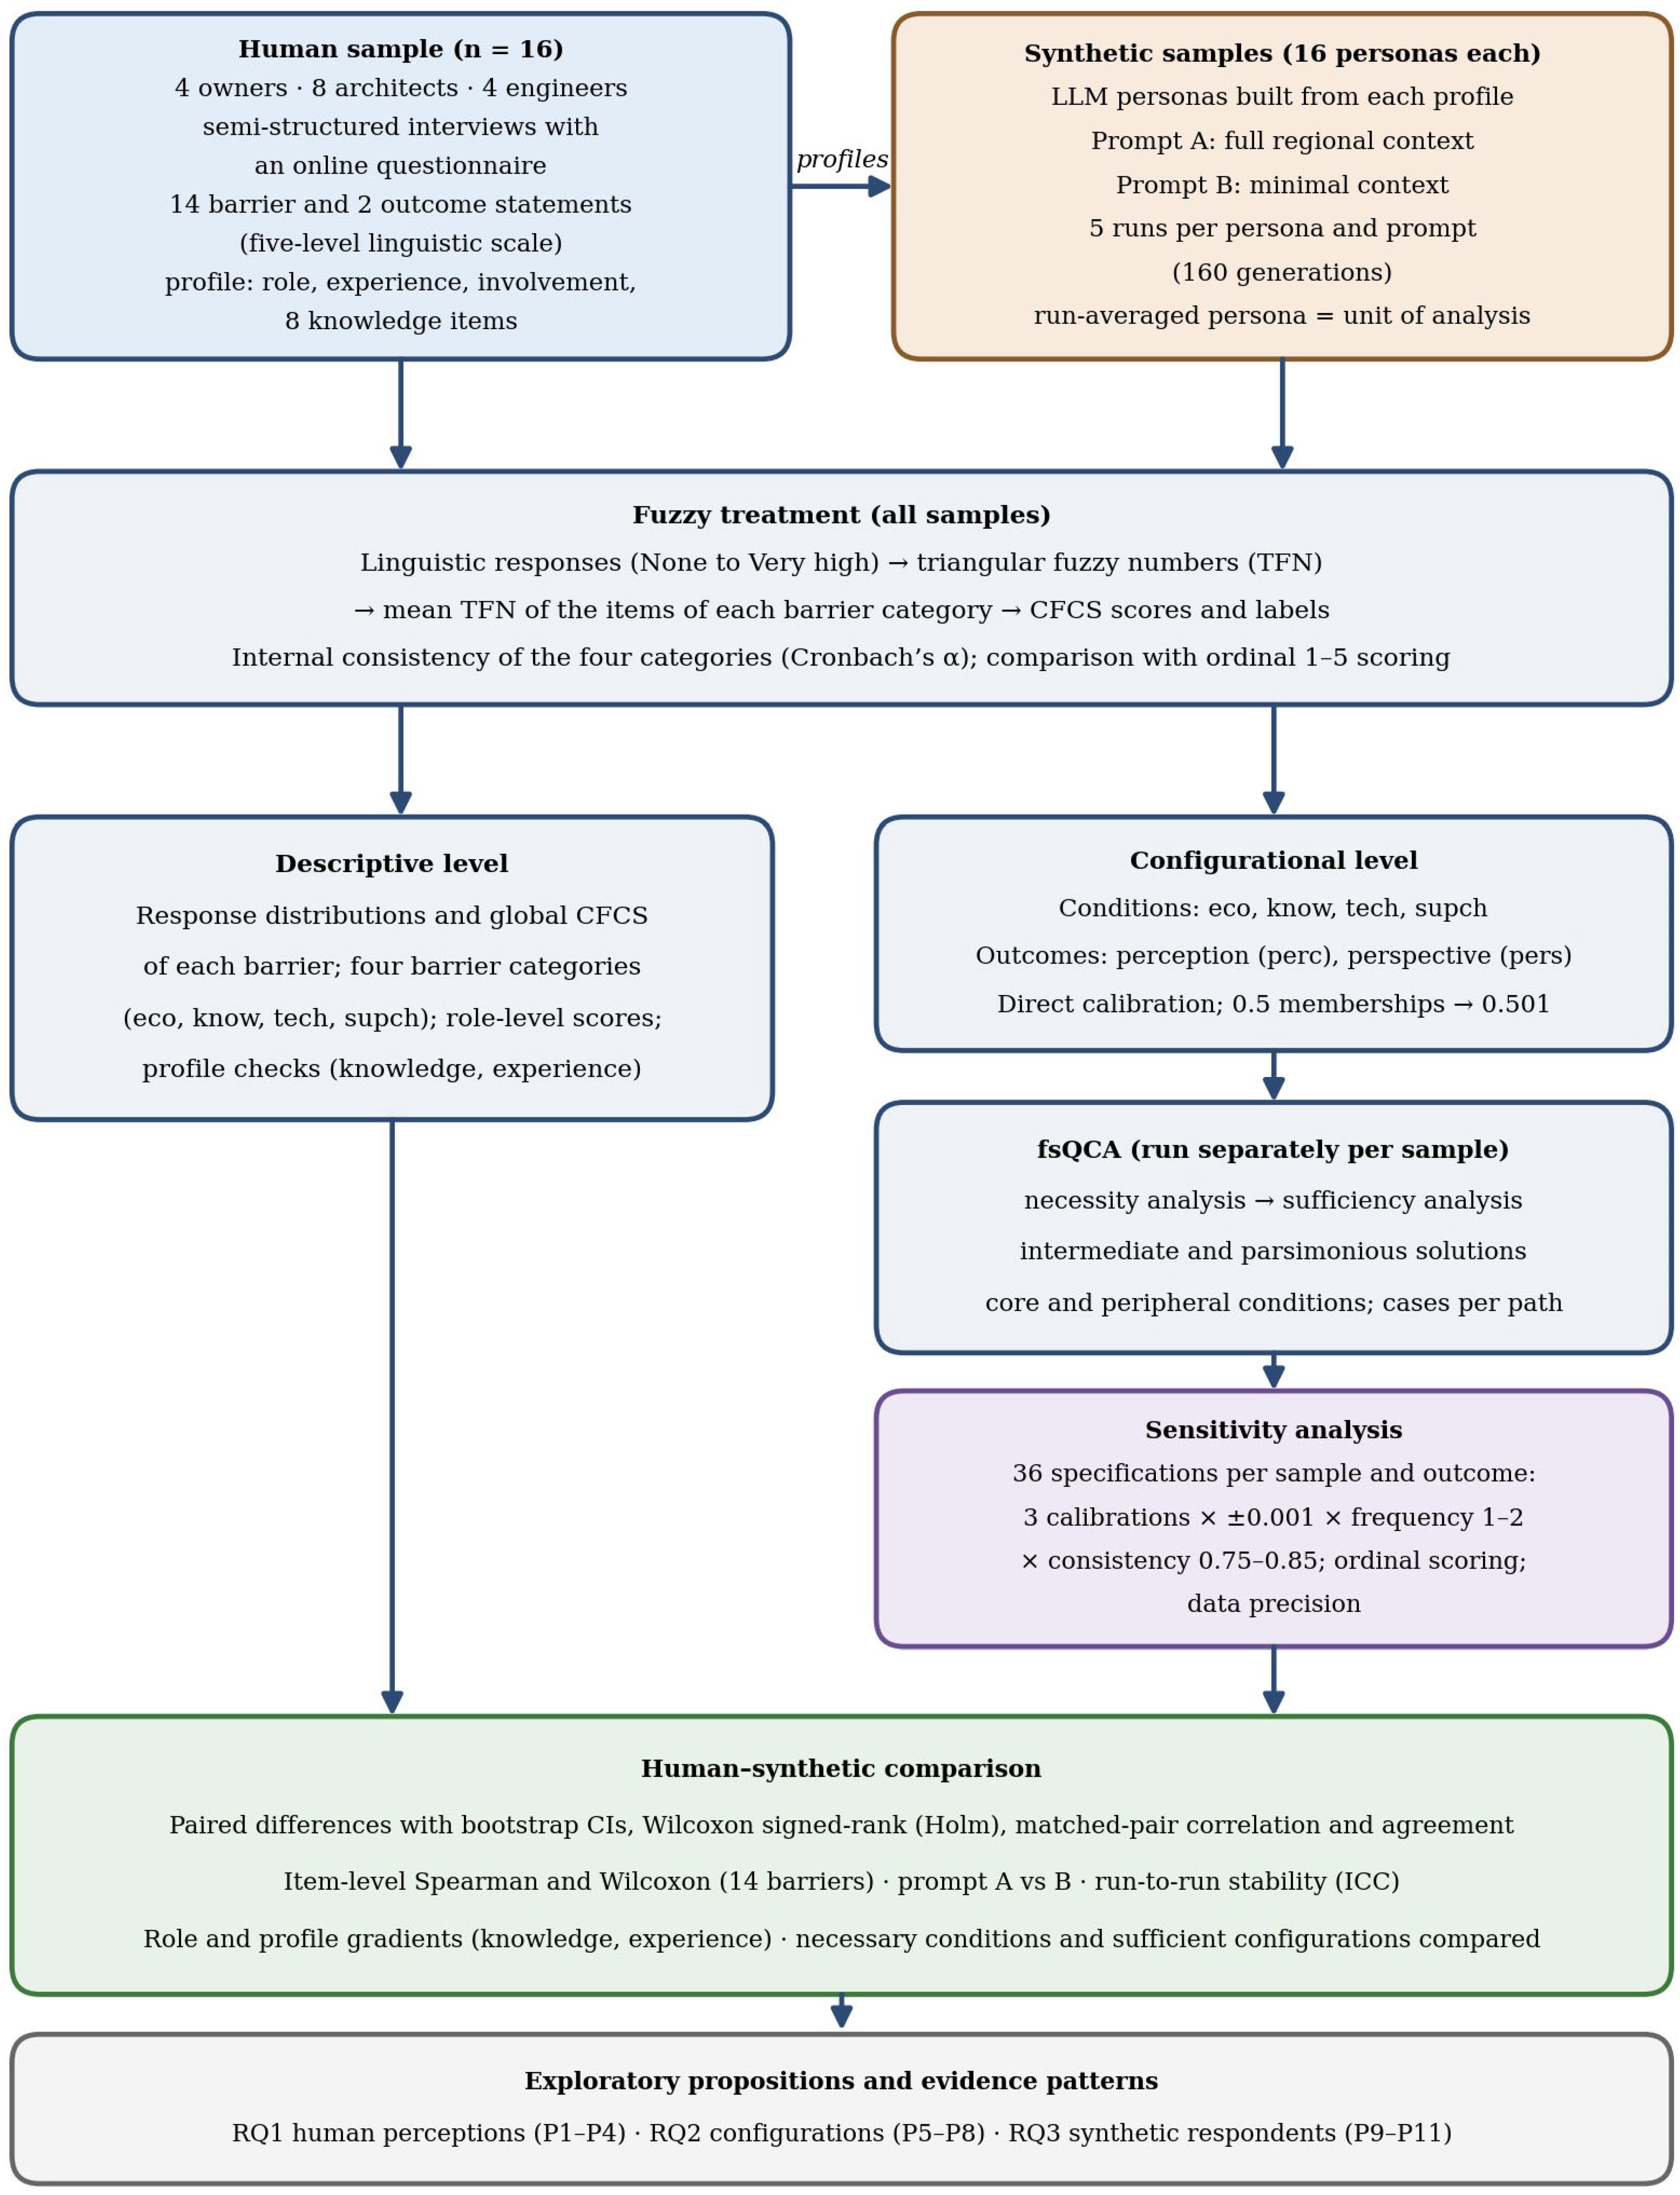
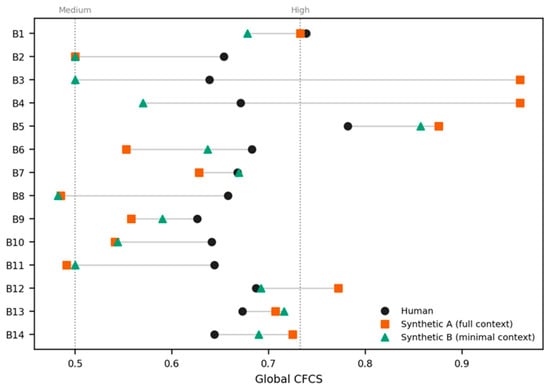
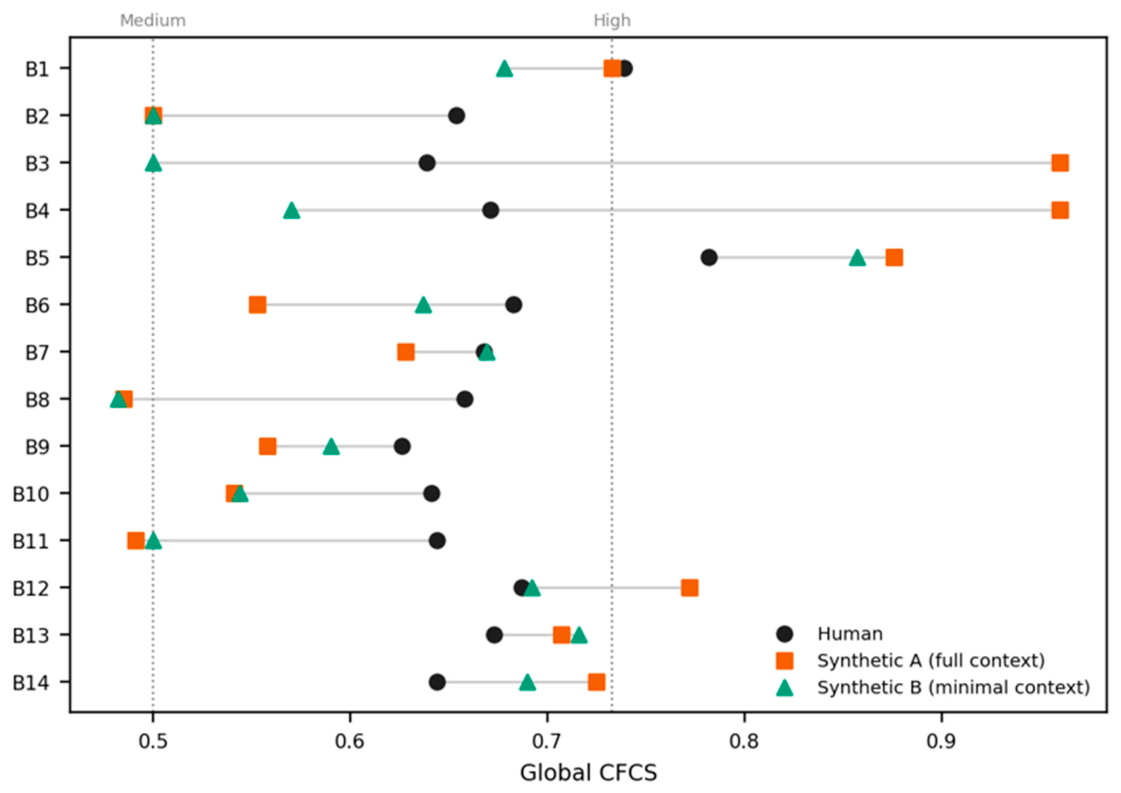

Disclaimer/Publisher’s Note: The statements, opinions and data contained in all publications are solely those of the individual author(s) and contributor(s) and not of MDPI and/or the editor(s). MDPI and/or the editor(s) disclaim responsibility for any injury to people or property resulting from any ideas, methods, instructions or products referred to in the content. |
© 2026 by the authors. Licensee MDPI, Basel, Switzerland. This article is an open access article distributed under the terms and conditions of the Creative Commons Attribution (CC BY) license.