


Abstract
The Hehuang Valley, located at the northeastern margin of the Qinghai–Tibet Plateau and adjacent to the Loess Plateau, is an ecologically sensitive agro-pastoral transition zone in the upper Yellow River Basin. This study investigated the spatiotemporal evolution of water erosion from 2000 to 2024 and quantified the contributions of major driving factors. Soil erosion was estimated using the RUSLE model and GIS, and a factor decomposition method was applied to assess the phased contributions of rainfall erosivity, vegetation cover and management, and soil and water conservation measures. The mean soil erosion modulus declined from 1484.45 to 1020.14 t/(km2·a), with erosion increasingly concentrated in minimal and mild classes. The contribution of rainfall erosivity decreased from 80.44% to 26.90%, whereas vegetation cover and management increased from 10.23% to 28.55% and soil and water conservation measures from 9.33% to 44.55%. After 2015–2020, vegetation and conservation measures jointly exceeded 70% by the end of the study period. Spatially, engineering measures dominated in the Chuanshui area, ecological restoration in the Qianshan area, and climatic factors in the Naoshan area. Overall, water erosion dynamics exhibited a potential shift from climate-dominated variability toward increasing anthropogenic influence, highlighting the importance of spatially differentiated soil erosion control and land management approaches.
1. Introduction
In the context of global climate change, extreme rainfall events have become increasingly frequent and soil water erosion has become a core issue in global land degradation. Approximately 55% of the global land area affected by erosion is subject to water erosion [1], one of the most severe gradual-onset disasters. Global arable land is lost annually due to water erosion, approximately 23 billion tonnes of soil, and the thinning of the soil layer directly reduces land productivity, exacerbates sedimentation in rivers and lakes and non-point source pollution, threatens food security and the ecological balance of river basins, and even jeopardizes social development [2,3]. China faces particularly serious water erosion problems [4]. The Third Remote Sensing Data Survey reported 2,674,200 km2 of erosion-affected land nationally, including 1,105,800 km2 affected by water erosion. The latter represented approximately 11.56% of China’s land area and 41.35% of its total eroded area [5]. Consequently, assessing soil water erosion and its driving mechanisms across different spatial and temporal scales has become a cutting-edge issue in sustainable land management.
The Hehuang Valley lies at the geographical interface of the Qinghai–Tibet Plateau and the Loess Plateau. It is an important center of population concentration, agricultural production, and urban development in Qinghai Province. Although the valley accounts for only approximately 5% of the province’s total area, it contains about 60% of its arable land and 72.77% of its population [6]. Urban growth, agricultural land-use changes, and ecological restoration have altered both the distribution of land uses and the conditions for soil conservation over recent decades [7].
The region is characterized by loose loess deposits and intense, short-duration rainfall during the flood season. These conditions promote sheet and gully erosion on cultivated slopes and increase the susceptibility of the region to flash floods and landslides. Over recent decades, changes in rainfall patterns and human activities have influenced soil erosion processes in the Hehuang Valley. Intense rainfall events and anthropogenic disturbances can exacerbate soil loss. Meanwhile, vegetation cover and land-use patterns have been modified through the conversion of cropland into forests and grasslands, alongside the implementation of comprehensive ecological restoration and soil and water conservation initiatives. Their combined effects have changed vegetation cover and land-use patterns. Consequently, both the locations of erosion and the relative importance of its controlling factors may have shifted over time.
Existing research has primarily focused on erosion mechanisms, driving factors, quantitative monitoring, erosion hazards, and prevention, control and restoration measures. With regard to erosion mechanisms, researchers have analyzed rainfall-induced erosion processes, slope runoff and scouring mechanisms, and loss mechanisms under combined freeze–thaw, wind and hydrological conditions [8,9]; in terms of quantitative monitoring, researchers have primarily utilized the RUSLE model to quantitatively estimate soil erosion rates and their spatiotemporal distribution in the Hehuang Valley [10,11,12]. With regard to erosion hazards and control measures, the focus has been on identifying large-scale sediment yield, gully formation and the susceptibility to geological hazards caused by soil erosion, as well as exploring soil and water conservation techniques and assessing their ecological, economic and social benefits [13,14]. Research on erosion controls also identifies rainfall erosivity, terrain, and land use as major influences, with interactions between climatic conditions and human activities [15,16].
However, existing research still suffers from several limitations. Most studies have concentrated on static erosion intensity assessments, without systematically quantifying dynamic contributions over multiple periods. In particular, the stage-dependent dominant mechanisms and the associated shifts in driving forces under climate change remain poorly understood. Furthermore, the temporal evolution of the relative contributions from the two primary drivers—namely, natural climate variability and ecological engineering interventions—has not been systematically clarified, and the intrinsic mechanisms governing these “driving transitions” lack sufficient exploration. Furthermore, research on spatial stratification is weak; no distinction has been made between the differences in erosion drivers across the three landform units—the Chuanshui area, the Qianshan area and the Naoshan area—and there is insufficient support for refined soil and water management.
To address these research gaps, this study applies the RUSLE model and multi-source geospatial datasets to investigate soil water erosion in the Hehuang Valley during 2000–2024. The study focuses on characterizing the temporal changes and spatial patterns of soil water erosion, quantifying the relative contributions of rainfall erosivity, vegetation cover and management, and conservation-related factors across different periods, and comparing their contribution patterns among the three geomorphological units to identify potential shifts in the relative importance of climatic and anthropogenic influences. The findings are expected to provide a scientific basis for spatially differentiated soil and water conservation strategies in the upper Yellow River Basin.
2. Materials and Methods
2.1. Overview of the Study Area
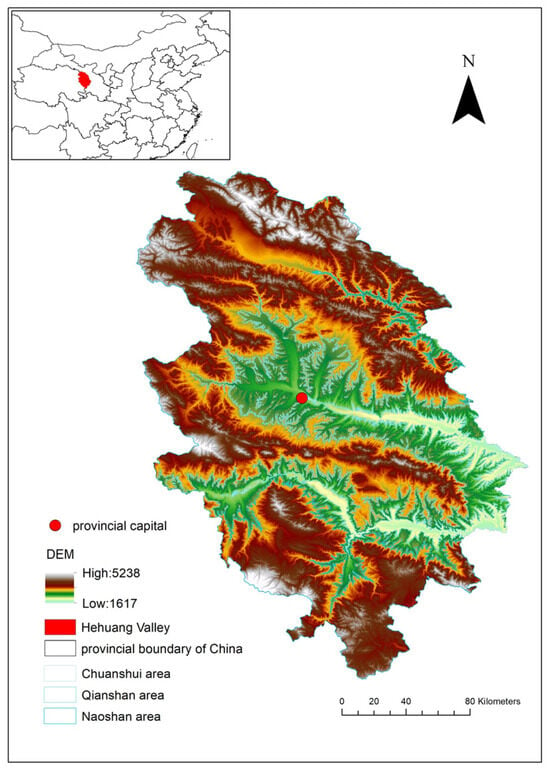
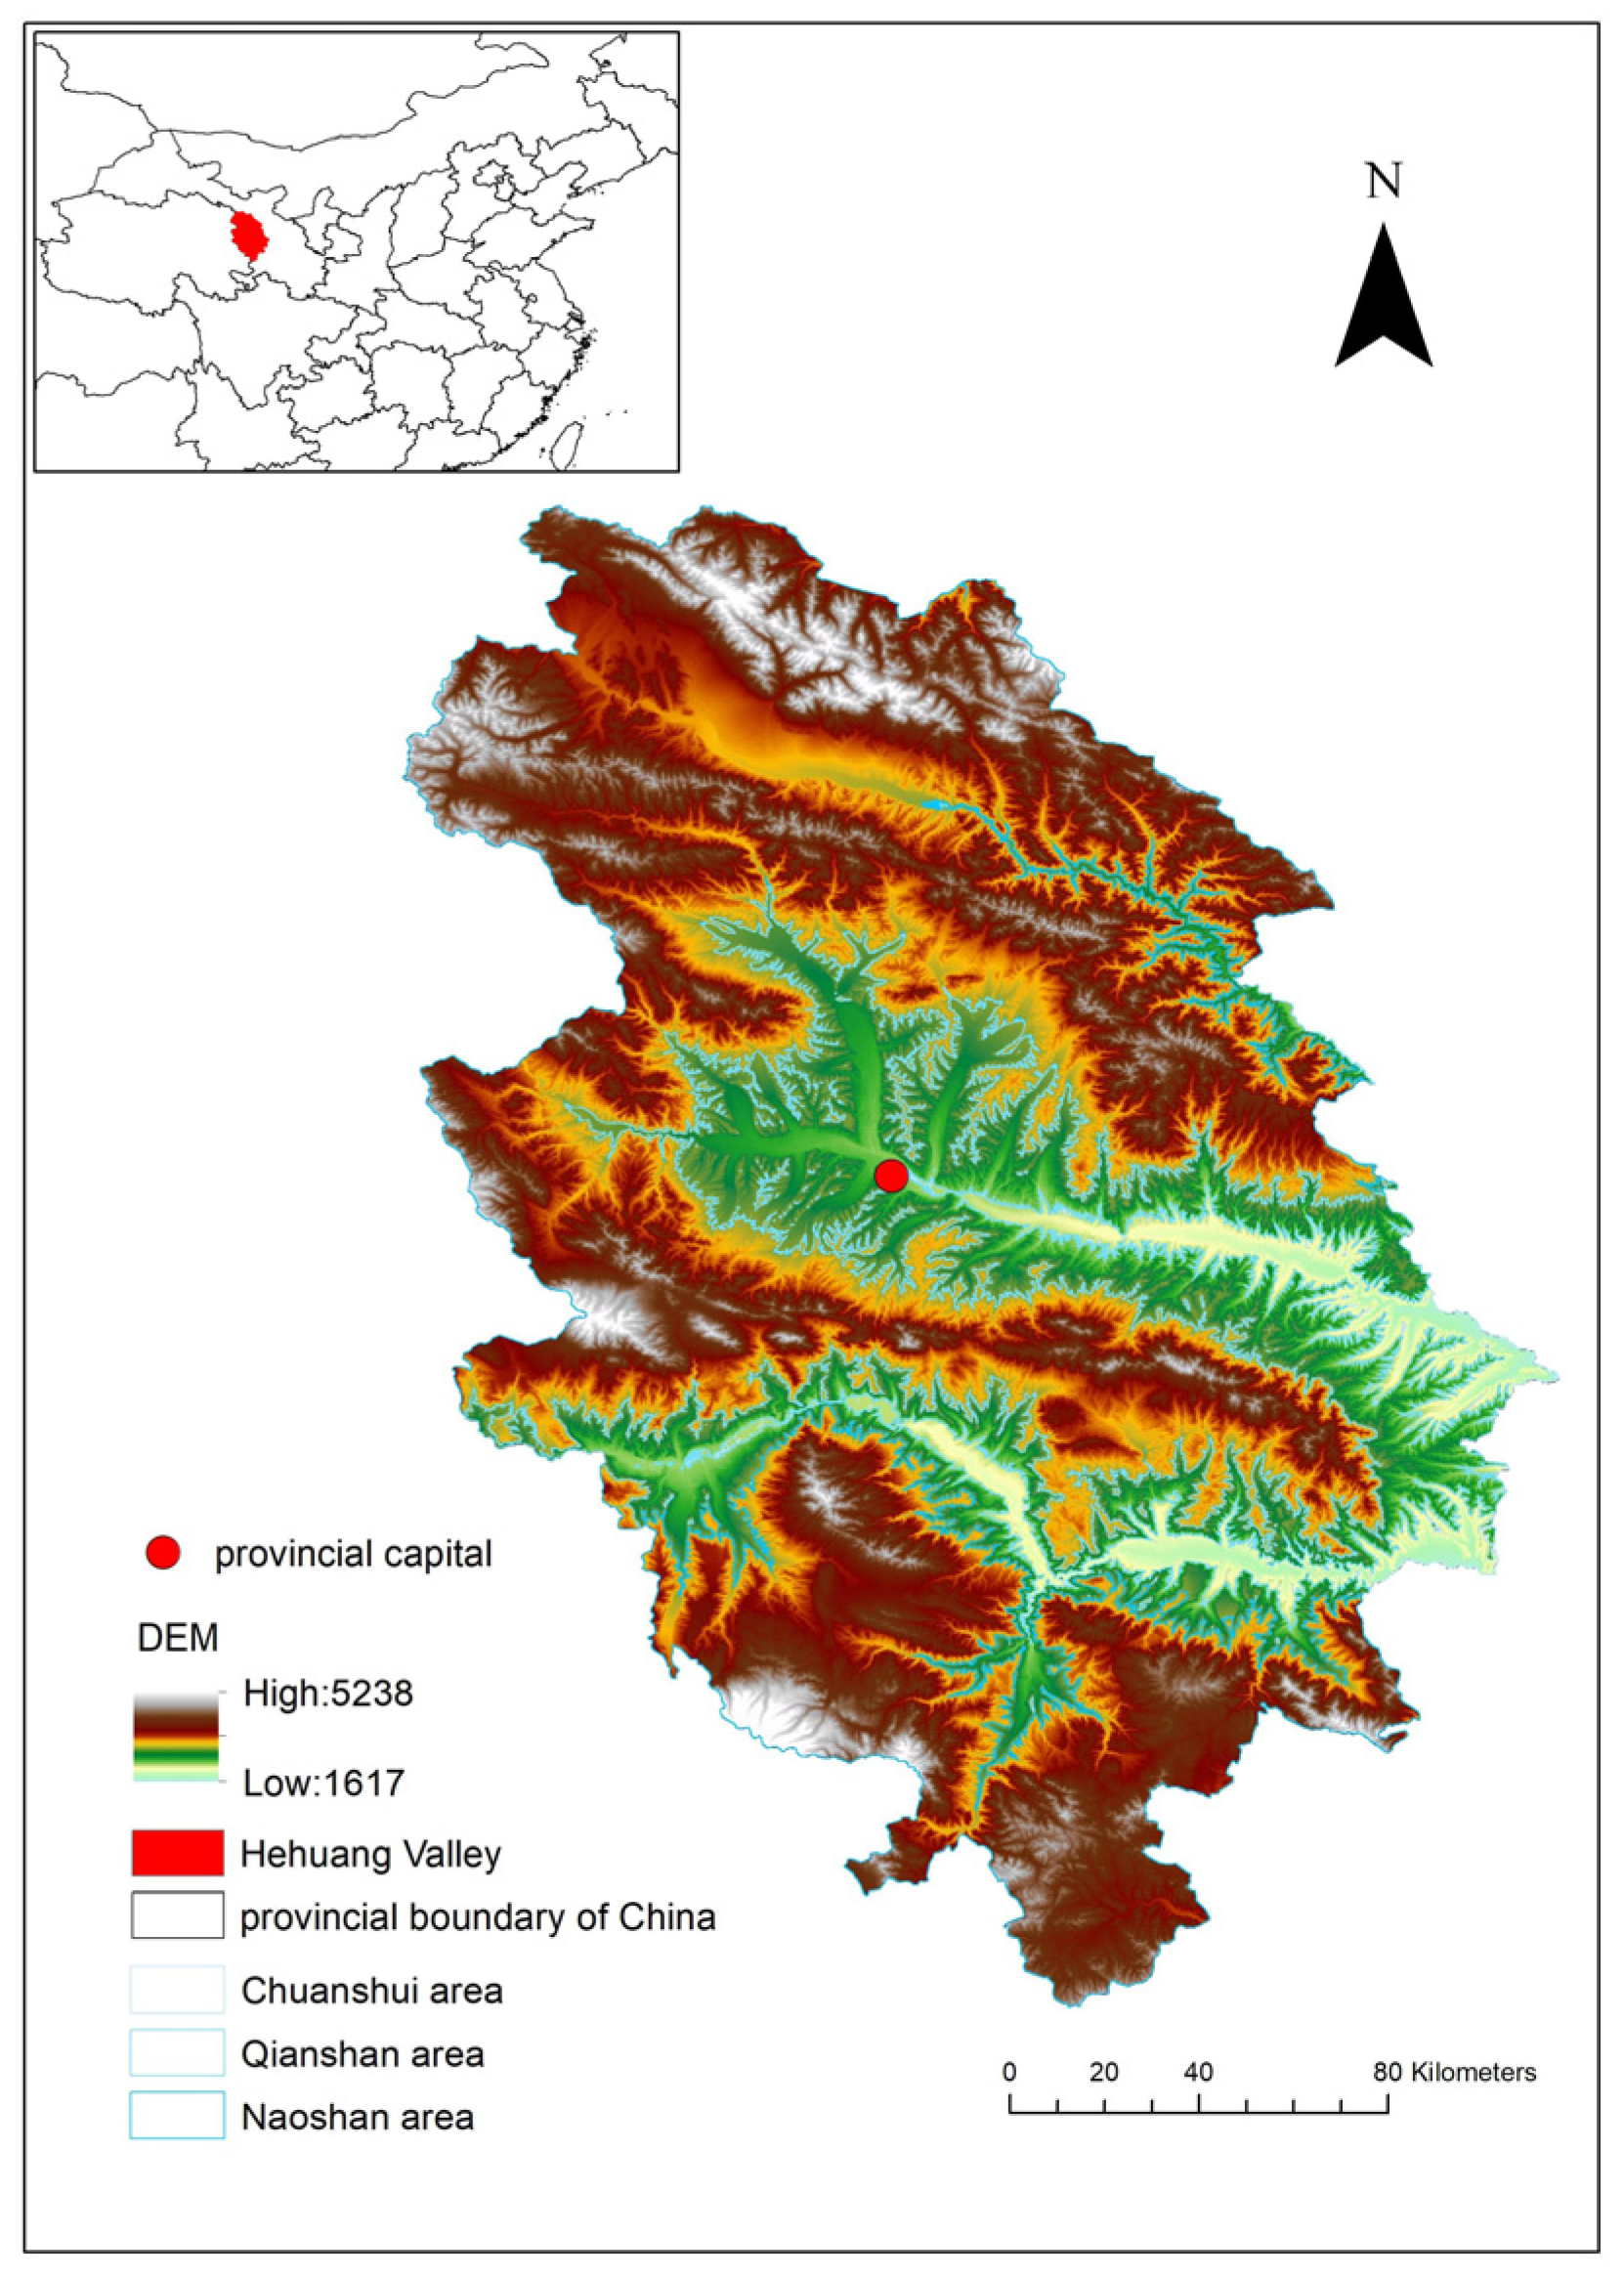
The study area extends approximately from 35°50′ to 37°25′ N and from 101°30′ to 103°00′ E, across the transition between the Qinghai–Tibet and Loess Plateaus. The region is characterized primarily by river valley basins and terraced plateaus (Figure 1). Due to the significant elevation differences in the Hehuang Valley, there are marked variations in temperature, precipitation, vegetation, and soil depending on topography and altitude. Locally, the landforms are conventionally divided into three regions: the Naoshan area, the Qianshan area, and the Chuanshui area. The Naoshan area lies at altitudes above 2700 m, accounting for about two-thirds of the catchment area. The Qianshan area ranges between 2200 and 2700 m in altitude, is covered with loess, has sparse vegetation, and suffers from severe soil erosion. The Chuanshui area covers the main river valley at altitudes between 1800 and 2200 m, generally consisting of multi-level terraces. The Hehuang Valley’s terrain is relatively gentle, but the mountains on either side are steep, forming a typical “valley–mountain” landform combination with significant variations in slope, which provides the driving conditions for soil erosion by water. Under the region’s arid to semi-arid climate, uneven rainfall, frequent torrential storms, and high evaporation favor episodic runoff and rill development.
Figure 1.
Geographical location of the Hehuang Valley (marked in red in the inset map) and its elevation characteristics.
In terms of human activities, agricultural land reclamation, overgrazing and sloping land cultivation have led to significant changes in land-use patterns. The decline in vegetation cover has resulted in increased surface runoff generation and weakened slope protection capacity, thereby exacerbating the erosive effects of surface runoff.
2.2. Data Sources
To assess soil water erosion in the Hehuang Valley over the period of 2000–2024, five categories of spatial data were assembled, covering precipitation, soil characteristics, topography, vegetation conditions, and land use. Further details regarding the datasets and their characteristics are presented in Table 1. All spatial datasets were processed using ArcGIS Desktop 10.8. Each dataset was referenced to WGS 1984 and clipped to the boundary of the Hehuang Valley. The raster datasets used in the RUSLE calculations were prepared at a common nominal spatial resolution of 30 m. Precipitation, NDVI, and land-use data were used to derive the R, C, and P factors, respectively. Land-use raster data corresponding to 2000, 2005, 2010, 2015, 2020, and 2024 were used separately to calculate the P factor for each analysis year. The K and LS factors were derived from soil properties and DEM data, respectively. The corresponding RUSLE factor layers were subsequently integrated to estimate soil water erosion for each selected year.
Table 1.
Data source information.
2.3. RUSLE Model
The RUSLE model is an empirical approach to estimating soil water erosion and has been widely applied to simulate erosion on hillslopes and conduct sensitivity analyses in regions characterized by steep slopes and substantial topographic variability [17,18,19,20]. The Hehuang Valley is characterized by highly undulating terrain and steep slopes, with intense storm runoff; water erosion predominates among the various types of erosion. Consequently, the use of the RUSLE model can reasonably reflect the spatial distribution pattern of soil water erosion in the region. ArcGIS 10.8 software was used for spatial data processing, calculation of the RUSLE factors (R, K, LS, C, and P), and raster-based estimation of soil water erosion. The calculation formula for the RUSLE model is A = R·K·L·S·C·P. Here, A represents the soil loss modulus, with units of [t/(km2·a)]; R represents the rainfall erosion force factor, with units of [(MJ·mm)/(km2·h·a)]; K expresses soil erodibility; L and S describe slope length and gradient; C represents vegetation cover and management; and P represents soil and water conservation practices. L, S, C, and P are dimensionless.
2.3.1. Rainfall Erosivity Factor
The R factor describes the capacity of rainfall to detach and transport soil. Annual rainfall erosivity was calculated from precipitation records according to the following empirical relationship [21]: Rd = 0.053Pd1.655. Rd denotes rainfall erosivity for a given year, and Pd is the corresponding annual precipitation in millimeters.
2.3.2. Soil Erodibility Factor
The K factor uses soil texture and organic carbon data to represent differences in soil susceptibility to water erosion. It was calculated for the soil in the study area using the following formula [22]:
where mc, mslit, ms and Corg denote the clay, silt, sand, and organic carbon contents, respectively, each expressed as a percentage.
2.3.3. Slope Length and Gradient Factor
Slope length and slope steepness influence surface runoff and sediment transport, and their effects are represented by the L and S factors, respectively. Both factors were calculated from DEM data using the equations provided below [23]:
where θ represents the slope angle (°); λ represents the slope length (m); and m is an exponent that varies with slope length.
2.3.4. Vegetation Cover Management Factor and Soil and Water Conservation Measures Factor
The Vegetation Cover Management Factor (C) was estimated using NDVI-derived vegetation coverage following the method of Cai; annual NDVI data corresponding to the selected study years were used to characterize temporal variations in vegetation coverage [24]. Higher vegetation coverage generally corresponds to lower C values. The calculation formula is as follows:
where c represents vegetation cover; NDVI represents the specific vegetation index of the pixel in question; and NDVImax and NDVImin denote the highest and lowest values of the vegetation index, respectively.
Soil and water conservation measures are key factors in the prevention and control of soil erosion, and their value ranges vary depending on land-use type. Accordingly, p values were assigned to individual land-use types based on the adopted classification scheme. Similar land-use-dependent parameterization methods have been widely applied in previous regional assessments of soil erosion [25,26]. The assigned p values were based on the land-use classification and relevant regional studies [27,28,29]. In the original parameterization, p values were assigned according to land-use type as follows: 0.3 for cropland and impervious surfaces, 0.5 for forestland, 0.9 for shrubland, 1.0 for grassland and bare land, and 0 for water bodies, ice-covered areas, and wetlands. For each study year, the corresponding land-use map was used to generate the P-factor raster.
2.4. Calculation of Relative Contributions to Dynamic Changes in Soil Water Erosion
To quantify the relative importance of different RUSLE factors in soil water erosion dynamics, a single-factor substitution approach based on the control-variable principle was employed. Previous studies have used scenario-based comparisons to distinguish the effects of climatic and land-use-related factors on soil erosion by varying selected RUSLE inputs while holding other factors constant [26,30]. This approach provides a transparent framework for evaluating the modeled response of soil erosion to individual factors under consistent baseline conditions.
Given that soil properties and terrain characteristics generally change slowly over the study period, K and LS were assumed to remain constant over time. In contrast, R, C, and P were treated as temporally variable to capture the effects of changes in rainfall erosivity, vegetation conditions, and land-use-related conservation practices on soil water erosion. Therefore, the analysis focused on the relative effects associated with changes in R, C, and P. The study period (2000–2024) was divided into five consecutive intervals: 2000–2005, 2005–2010, 2010–2015, 2015–2020, and 2020–2024. For each interval, the factor values from the initial year were used as the baseline, and those from the final year were used to construct alternative scenarios.
For example, the impact of rainfall erosion refers to the process of keeping vegetation cover management levels and soil and water conservation measures constant (maintaining the baseline period levels) while altering the level of rainfall erosion to determine the change in soil water erosion resulting from the impact of rainfall erosion [31]. Taking the calculation of the contribution factors for water erosion dynamics during 2000–2005 as an example, the formulas are
where ΔA denotes the change in soil water erosion between the two years; A2 represents the total soil water erosion in 2005; A1 represents the total soil water erosion in 2000; AR represents the total soil water erosion under the influence of rainfall erosion; ΔAR represents the change in soil water erosion under the influence of rainfall erosion; AC represents the total soil water erosion under the influence of vegetation cover management; ΔAC represents the change in soil water erosion under the influence of vegetation cover management; AP represents the total soil water erosion under the influence of soil and water conservation measures; and ΔAP represents the change in soil water erosion under the influence of soil and water conservation measures. The impact of rainfall erosion is calculated by dividing the magnitude of the rainfall erosion effect (ΔAR) by the actual change in soil water erosion (ΔA); the impact of vegetation cover management is calculated by dividing the magnitude of the vegetation cover management effect (ΔAC) by the actual change in soil water erosion (ΔA); and the impact of soil and water conservation measures is calculated by dividing the magnitude of the soil and water conservation measures effect (ΔAP) by the actual change in soil water erosion (ΔA).
ΔA = A2 − A1
ΔAR = AR − A1
ΔAC = AC − A1
ΔAP = AP − A1
To facilitate comparisons of the relative importance of the three factors, the absolute magnitude of each factor-specific effect was normalized by the sum of the absolute magnitudes of all three effects. The normalized relative contribution of each factor was calculated as follows:
where RCi represents the normalized relative contribution of factor i (%), and ΔAi denotes the corresponding change in modeled soil erosion, with i representing R, C, or P.
RCi = |ΔAi|/(|ΔAR| + |ΔAC| + |ΔAP|) × 100%
Consequently, the normalized relative contributions of R, C, and P sum to 100% by definition. These percentages represent the relative magnitudes of the modeled factor-specific effects under the adopted substitution scenarios, rather than their individual percentages of the net change in soil erosion. It should be noted that RUSLE is a multiplicative model, and simultaneous changes in R, C, and P may generate interaction effects that cannot be fully captured by independent single-factor substitutions. Moreover, normalization based on absolute values does not preserve the positive or negative directions of the individual effects or explicitly allocate their interactions. Therefore, the calculated relative contributions should be interpreted as indicators of the relative importance of selected RUSLE factors within the specified analytical framework, rather than as an exact additive decomposition of the total erosion change or an independent causal attribution. The same procedure was applied to the remaining study intervals and the three topographic sub-regions to examine the spatiotemporal variations in the relative importance of the influencing factors.
3. Analysis of Results
3.1. Characteristics of Soil Erosion Changes in the Hehuang Valley
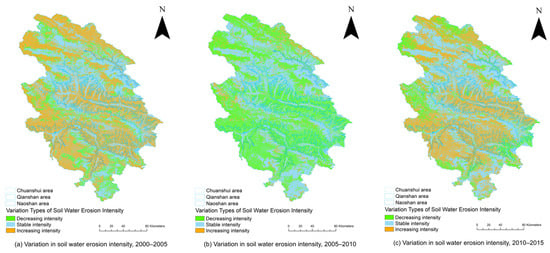
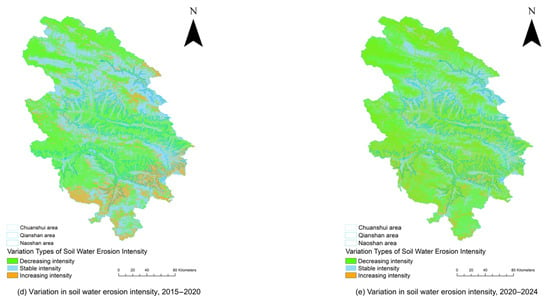
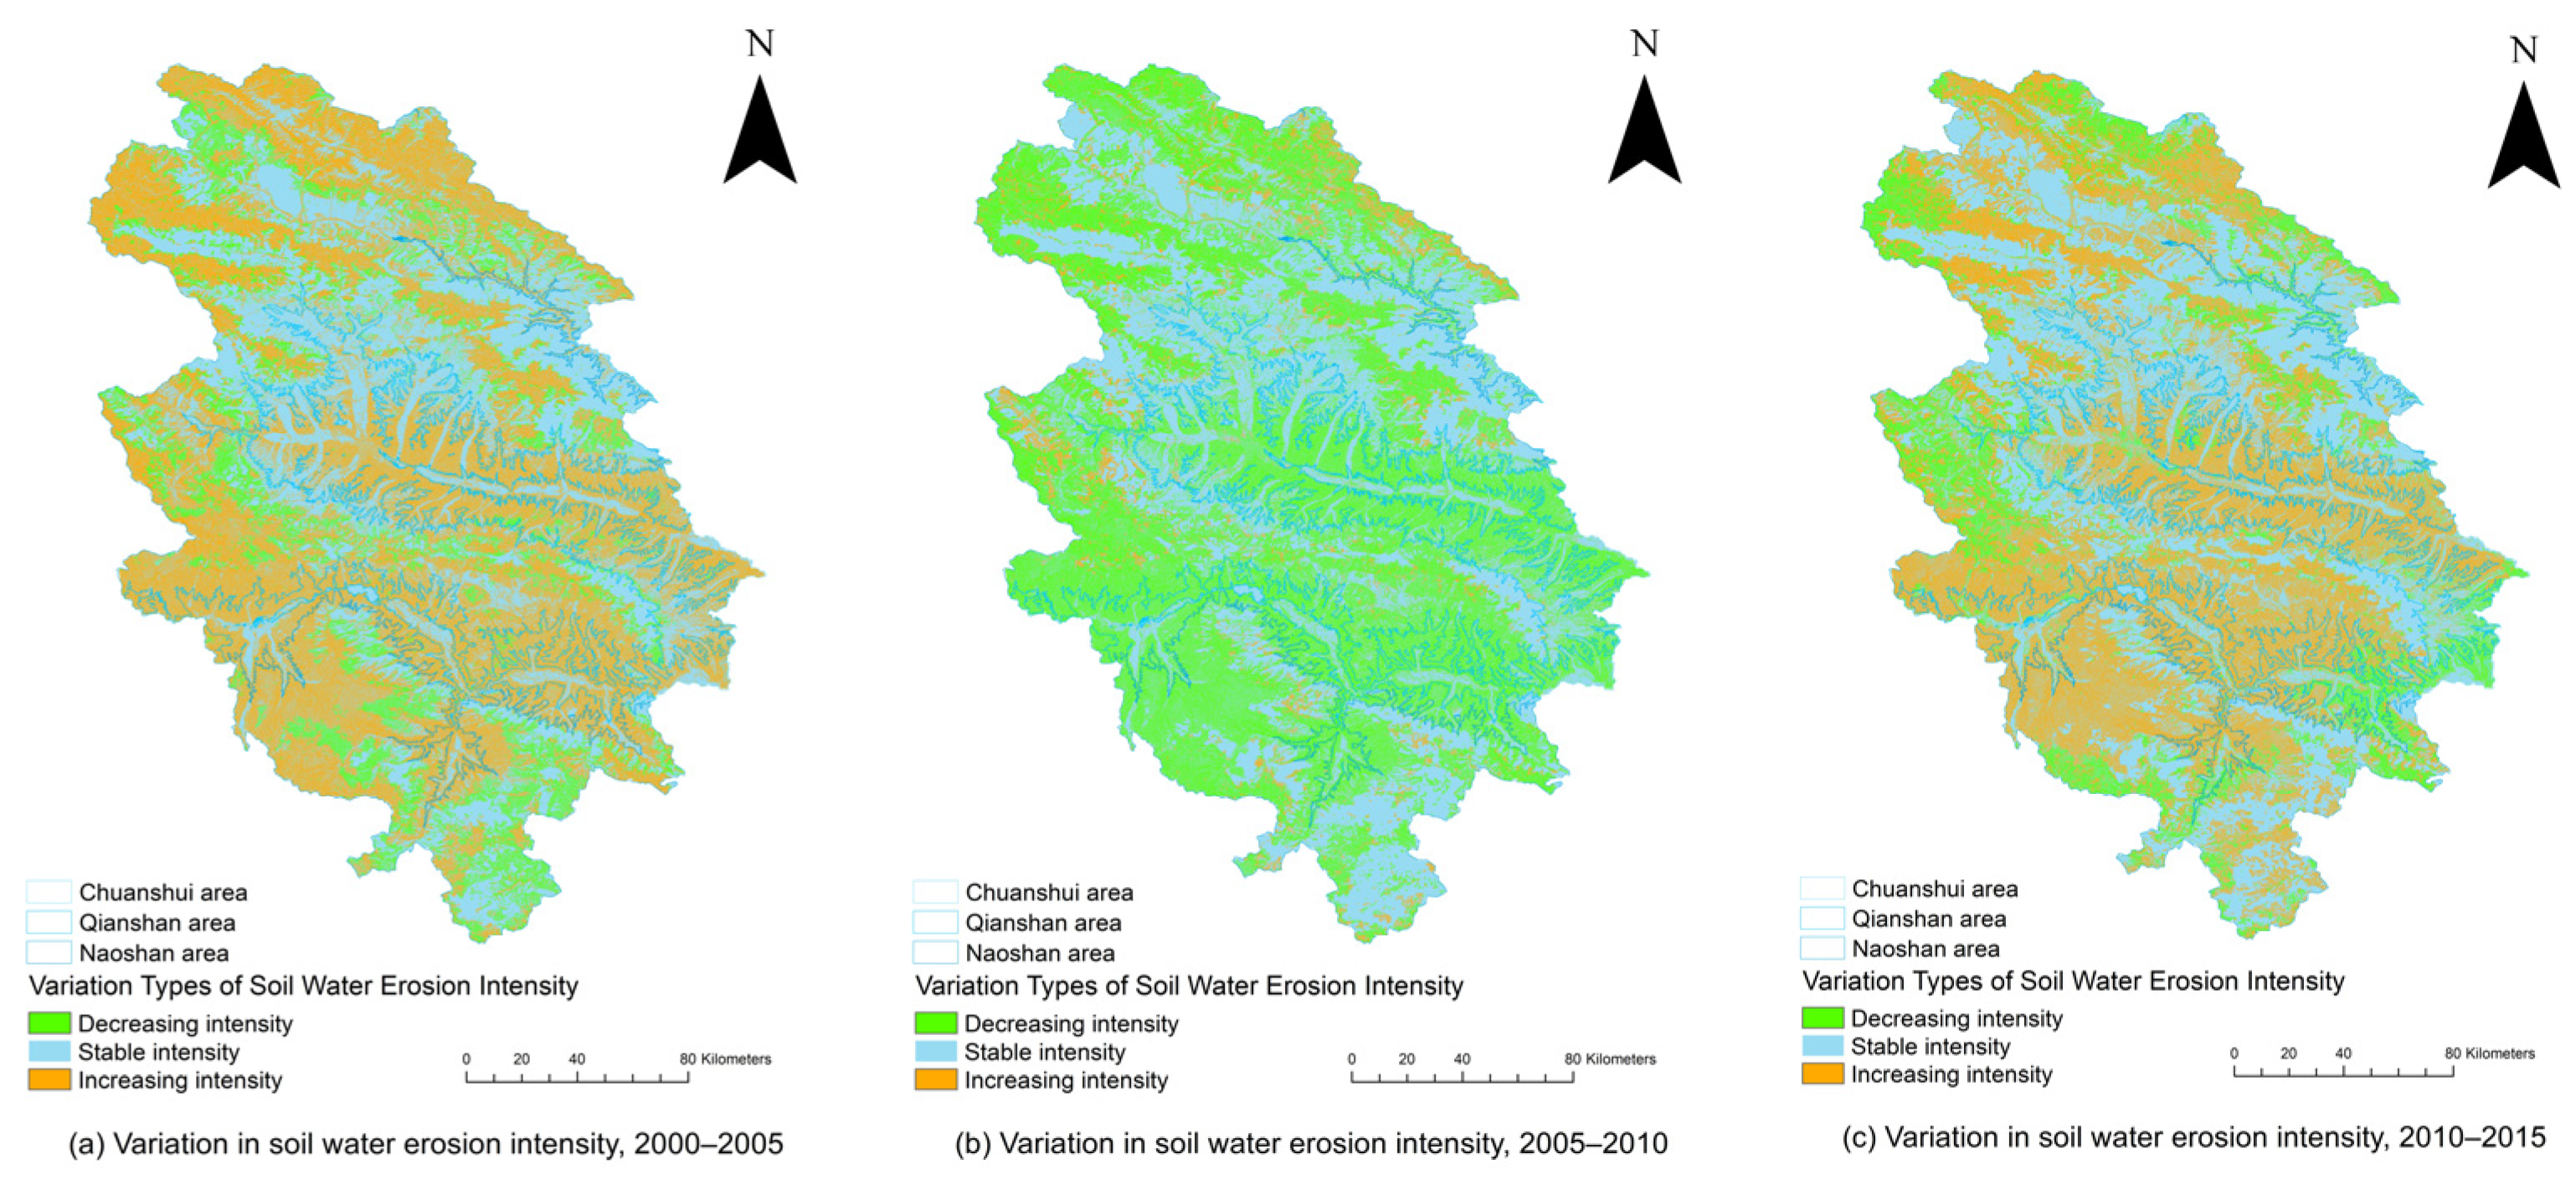
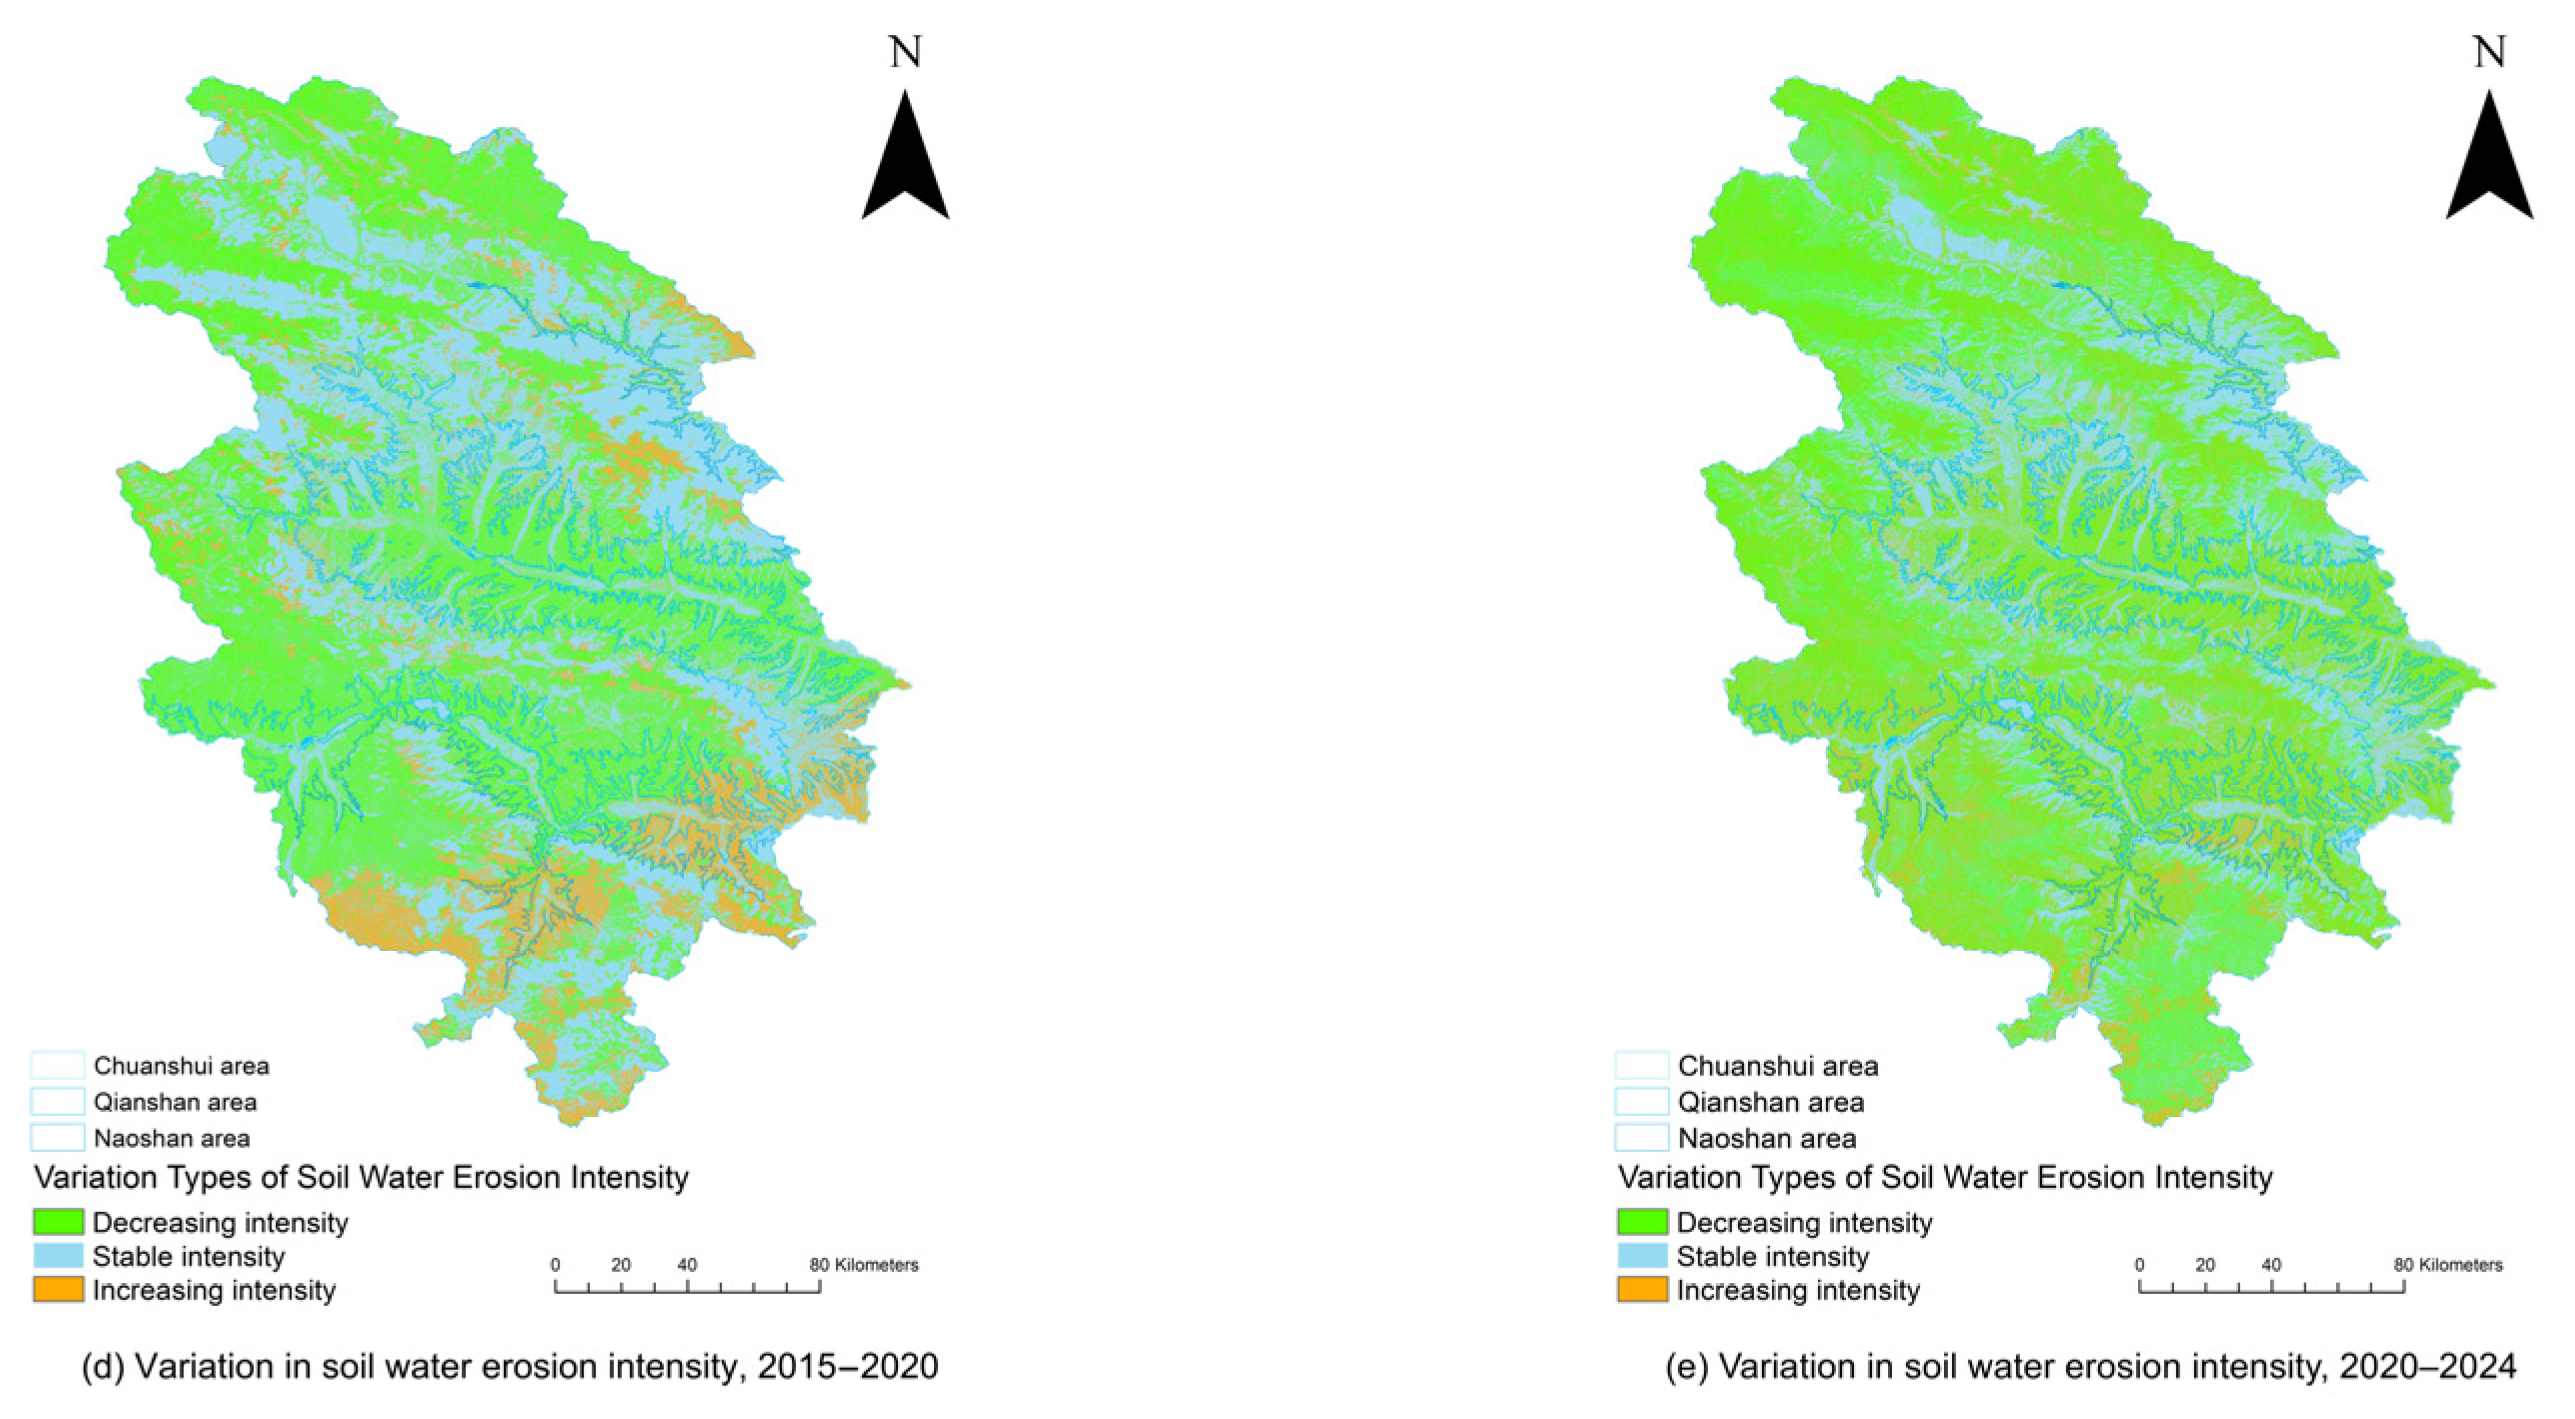
The soil erosion modulus for the years 2000, 2005, 2010, 2015, 2020 and 2024 were 1484.45 t/(km2·a), 1710.93 t/(km2·a), 1486.31 t/(km2·a), 1417.40 t/(km2·a), 1598.60 t/(km2·a) and 1020.14 t/(km2·a), respectively. To visually illustrate the spatiotemporal dynamics in soil erosion intensity in the Hehuang Valley, based on the soil erosion intensity data, the changes were classified into three categories: when the difference was greater than 0, it was classified as an increase in intensity; when the difference was equal to 0, it was classified as essentially unchanged; and when the difference was less than 0, it was classified as a decrease in intensity (Figure 2).
Figure 2.
Spatial distribution of changes in soil water erosion intensity across the Chuanshui, Qianshan, and Naoshan sub-regions of the Hehuang Valley over five study intervals: (a) 2000–2005; (b) 2005–2010; (c) 2010–2015; (d) 2015–2020; (e) 2020–2024.
Changes in soil water erosion intensity levels in the Hehuang Valley from 2000 to 2024 are shown in Figure 2. It can be seen that between 2000 and 2005, the proportion of areas experiencing increased water erosion intensity was relatively large, mainly concentrated on the southern and eastern slopes of the valley; between 2005 and 2010, the area of regions with reduced water erosion intensity expanded significantly, with the spatial distribution extending from the periphery towards the interior, whereas the area of regions with increased intensity shrank markedly; from 2010 to 2015, soil water erosion intensity generally intensified, with areas of increased intensity mainly located along the banks of the Yellow River in the southern part of the study area and along its western periphery; from 2015 to 2020, the soil water erosion situation showed widespread improvement, with areas of reduced intensity mainly located in the south-western part of the study area; and from 2020 to 2024, changes in soil water erosion again showed widespread improvement. Overall, changes in the intensity of soil water erosion in the Hehuang Valley from 2000 to 2024 were predominantly characterized by a reduction and stabilization; areas where erosion improved significantly outnumbered those where it worsened, and the regional soil and water loss situation showed an overall positive trend. Areas where erosion has diminished are mainly distributed in mountainous and hilly regions where vegetation restoration has been significant, and in areas where the “conversion of farmland to forest” program has been implemented, whereas areas where erosion has intensified are mainly scattered across regions with steeper slopes, well-developed gullies and those strongly affected by extreme rainfall.
In accordance with the “Standards for the Classification and Grading of Soil Erosion” SL190-2007 (approved by the Ministry of Water Resources of the People’s Republic of China, 2007), the soil water erosion in the Hehuang Valley for the period 2000–2024, as calculated in this paper, is classified into six categories: minimal erosion is less than 500 t/(km2·a), mild erosion is 500–2500 t/(km2·a), moderate erosion ranges from 2500 to 5000 t/(km2·a), marked erosion from 5000 to 8000 t/(km2·a), severe erosion from 8000 to 15,000 t/(km2·a), and very severe erosion is greater than 15,000 t/(km2·a). As shown in Table 2, water erosion in the Hehuang Valley between 2000 and 2024 was predominantly characterized by minimal and mild erosion.
Table 2.
Area (km2) and proportion (%) of different erosion intensities in the Hehuang Valley, 2000–2024.
As shown in Table 3, the rate of change in the area of minimal erosion between 2000 and 2024 exhibited a trend where negative changes were smaller than positive changes, whereas the rates of change for mild, moderate, marked, severe and very severe erosion all showed a trend where negative changes were more frequent than positive changes. This indicates that, between 2000 and 2024, the area of minimal erosion in the Hehuang Valley generally showed an increasing trend, whereas the areas of mild, moderate, marked, severe and very severe erosion generally showed decreasing trends over the 24-year period. Furthermore, the areas of erosion at levels of mild and above all decreased, shifting towards lower-grade erosion, with marked changes in the intensity of soil erosion.
Table 3.
Changes in the area proportions of different soil erosion intensity classes in the Hehuang Valley during 2000–2024 (percentage points).
3.2. Analysis of Contributing Factors to Dynamic Changes in Soil Erosion
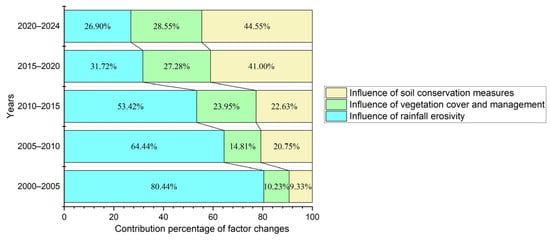
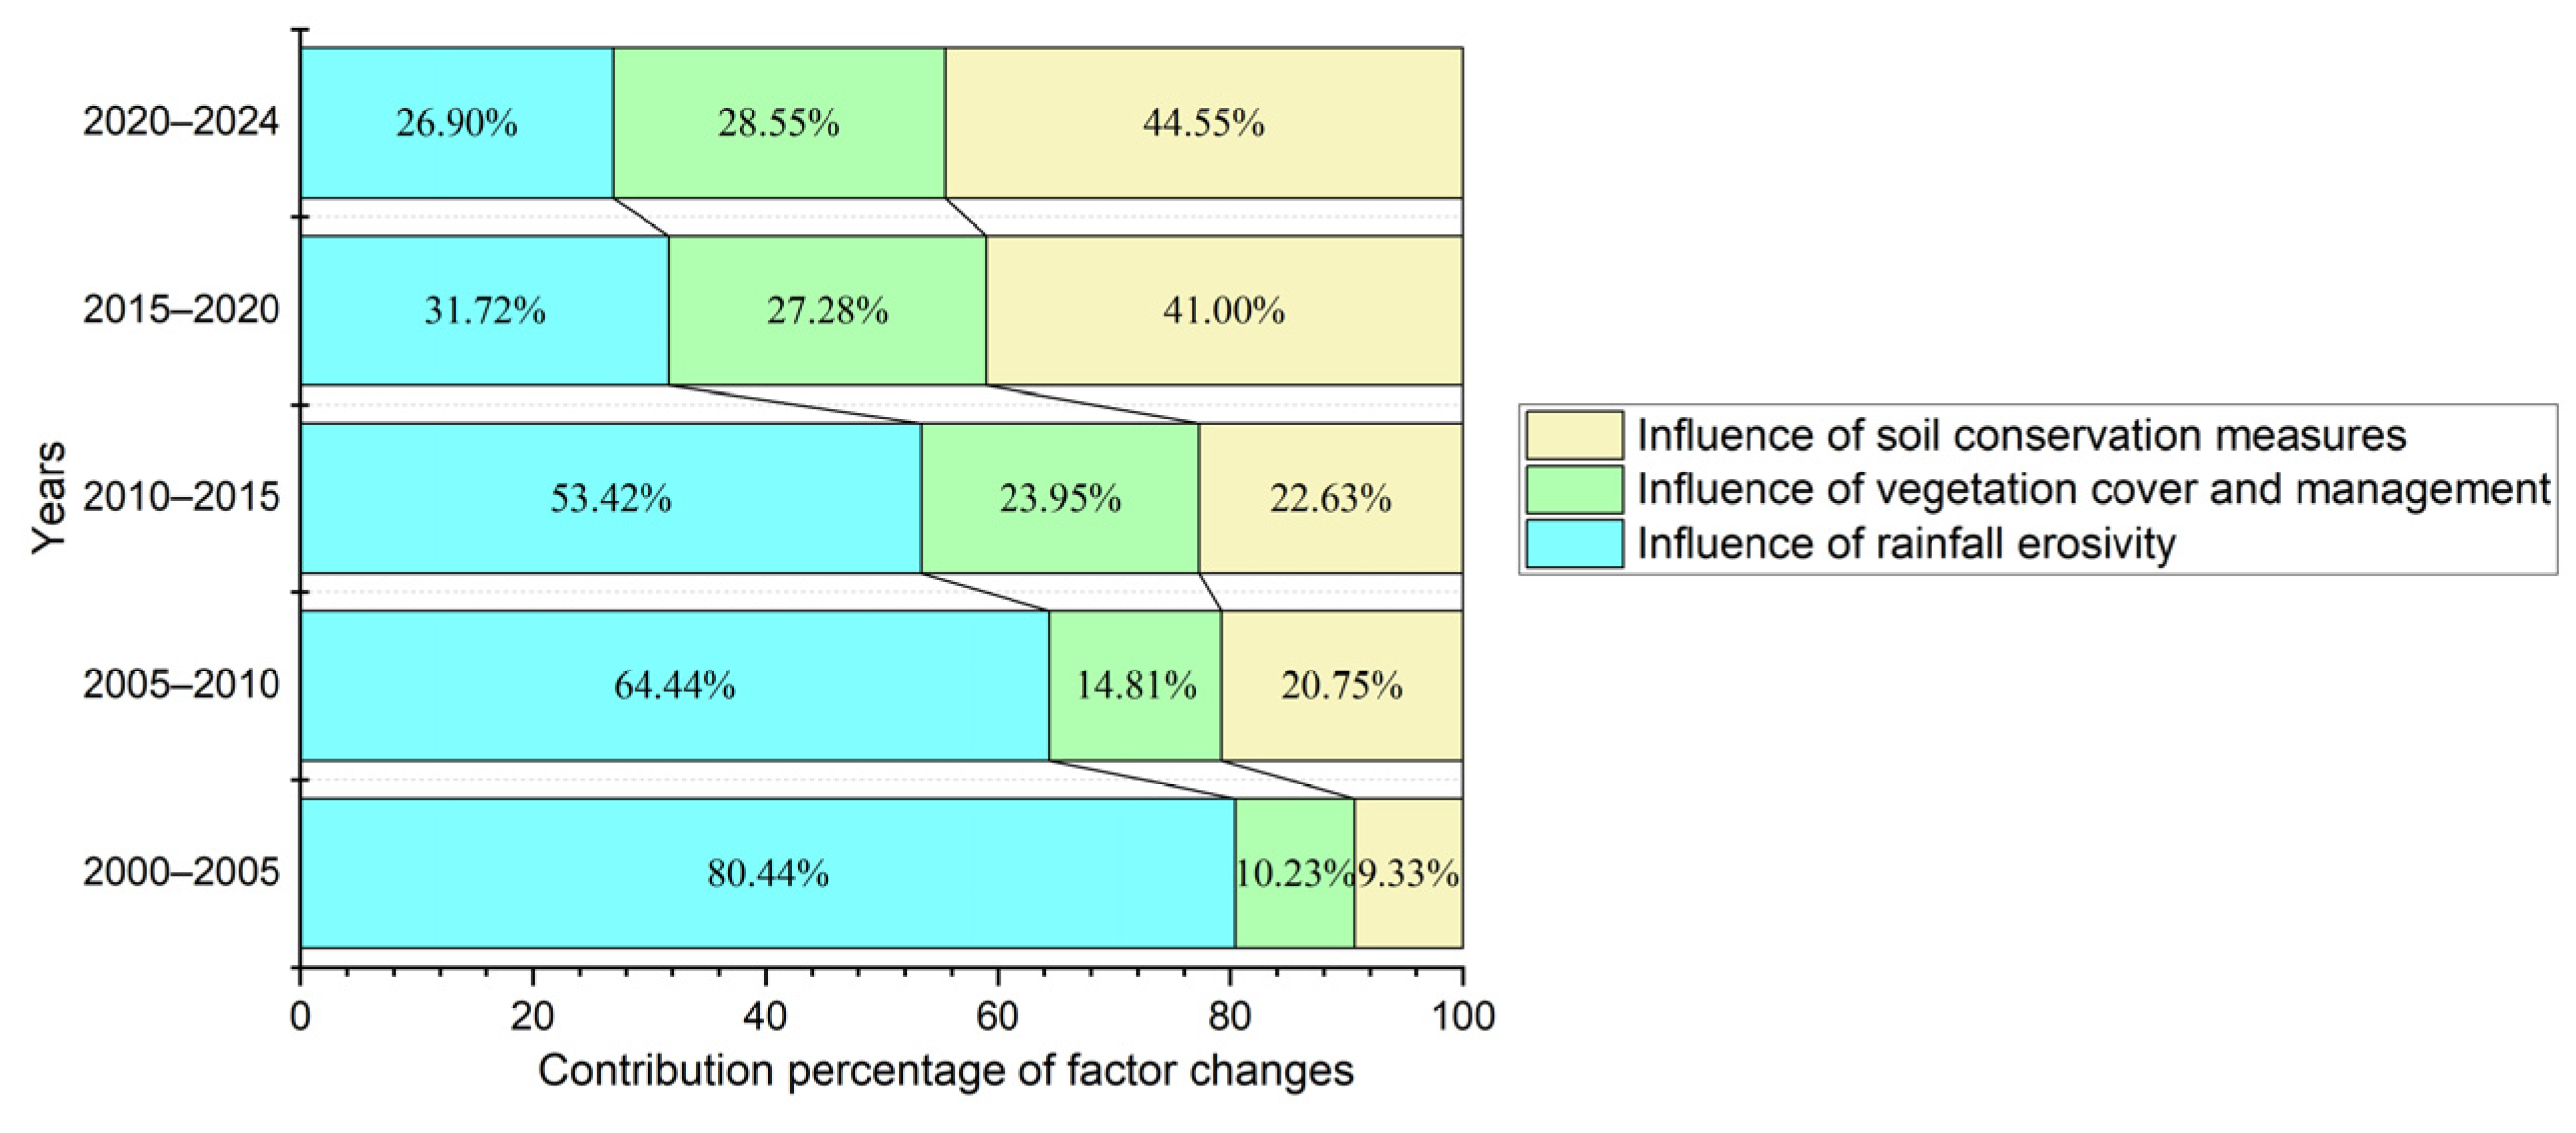
Figure 3 illustrates the normalized relative contributions of the rainfall erosivity factor (R), the Vegetation Cover Management Factor (C), and the soil conservation measures factor (P), which all exhibited distinct temporal variations during 2000–2024. The relative contribution of R generally decreased, whereas those associated with C and P increased.
Figure 3.
Changes in contribution factors to soil water erosion dynamics in the Hehuang Valley, 2000–2024.
During 2000–2005, R accounted for 80.44% of the total normalized contribution, substantially exceeding C (10.23%) and P (9.33%). In 2005–2010, the share of R declined to 64.44%, while those of C and P increased to 14.81% and 20.75%, respectively. This pattern persisted during 2010–2015, when R decreased to 53.42%, accompanied by further increases in C (23.95%) and P (22.63%). A notable change occurred in 2015–2020, as the contribution of R dropped to 31.72%, while P rose sharply to 41.00%, surpassing R for the first time. Meanwhile, C increased to 27.28%. By 2020–2024, R had reached its lowest contribution of 26.90%, whereas C and P accounted for 28.55% and 44.55%, respectively. Their combined contribution reached 73.10%, indicating a substantial change in the relative importance of the three factors. Overall, the contribution structure shifted from a strong predominance of R in the early period toward increasing contributions from C and P.
3.3. Analysis of Factors Contributing to the Dynamic Changes in Soil Water Erosion Across Different Sub-Regions
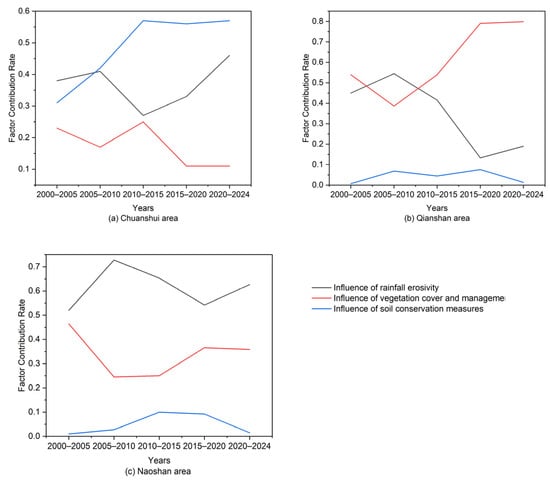
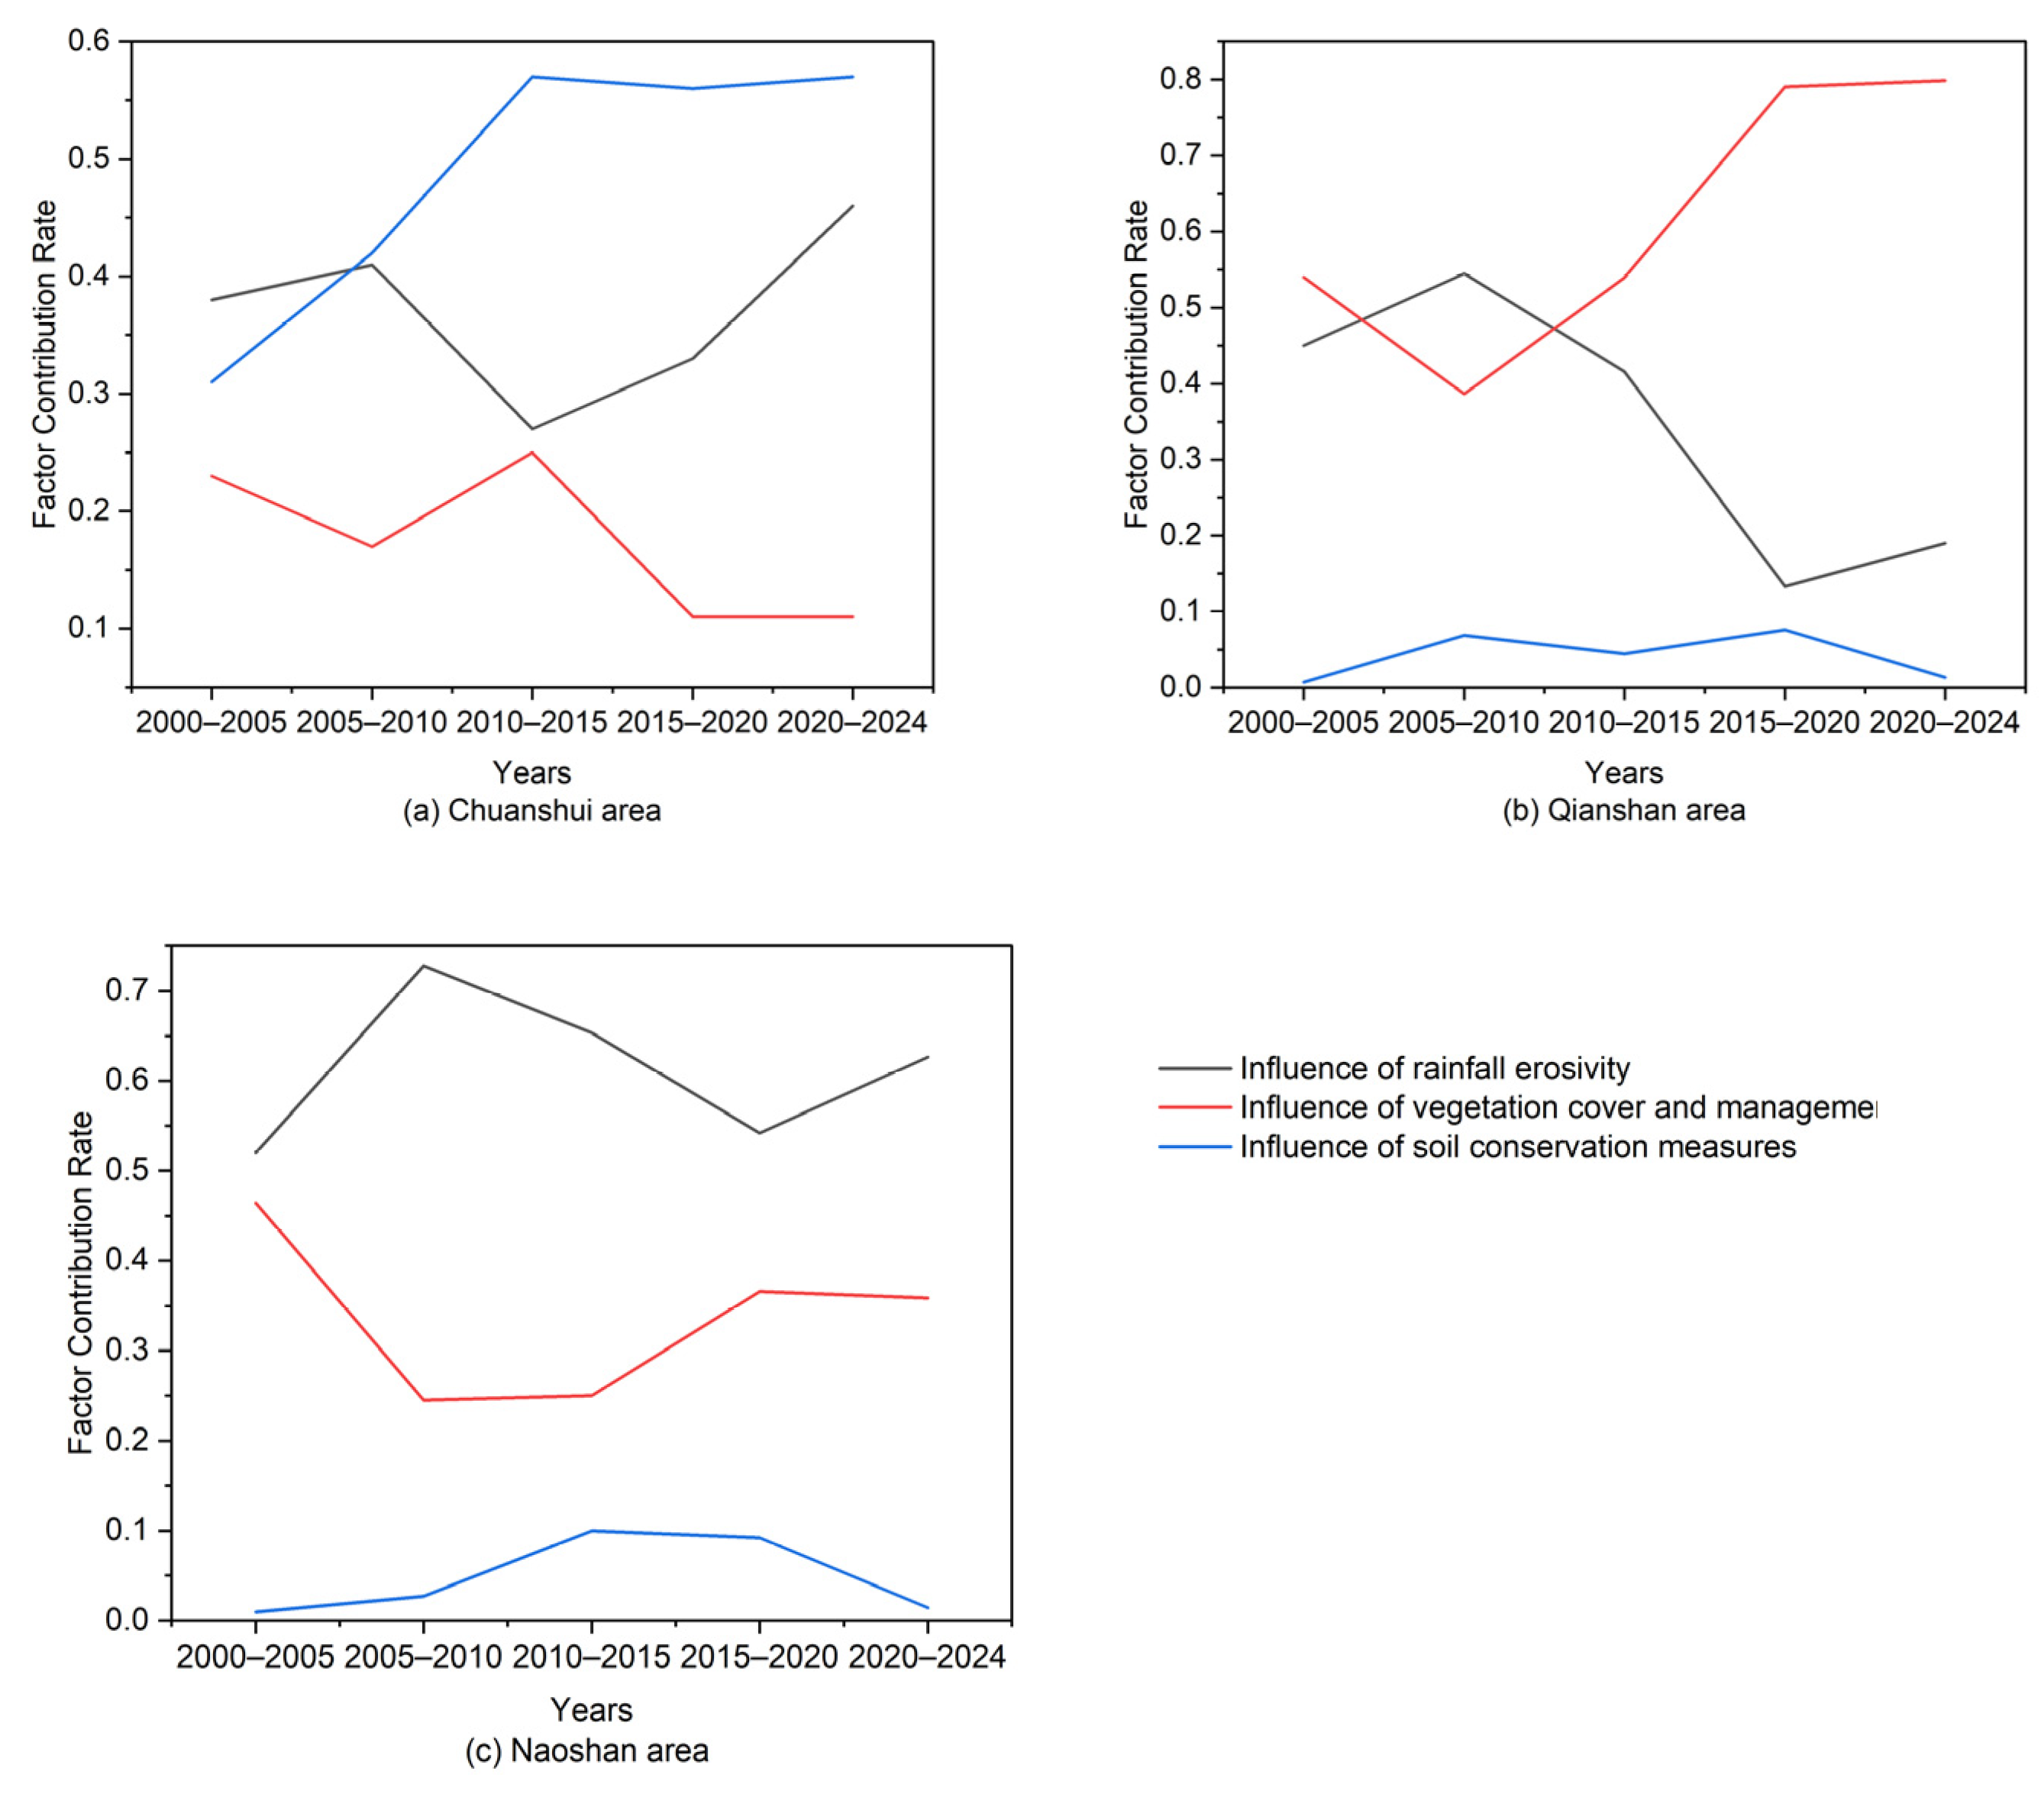
As presented in Figure 4, the relative contributions of R, C, and P to soil water erosion dynamics displayed considerable spatial heterogeneity across the three geomorphological sub-regions of the Hehuang Valley. Compared with the overall regional pattern, each sub-region exhibited a distinct contribution structure and dominant factor. Throughout the study period, the mean contributions of R, C, and P in the Chuanshui area were 31.26%, 19.38%, and 49.36%, respectively. The corresponding values in the Qianshan area were 38.63%, 57.32%, and 4.04%, while those in the Naoshan area were 61.65%, 33.69%, and 4.65%. Specifically, P contributed the largest proportion in the Chuanshui area, C played the leading role in the Qianshan area, and R accounted for the highest proportion in the Naoshan area. The spatial distribution of the normalized relative contributions further reflects the contrasting characteristics of the three geomorphological units. In the Chuanshui area, P accounted for nearly half of the total contribution (49.36%), exceeding the shares of R and C. By comparison, the contribution structure in the Qianshan area was dominated by C, which represented 57.32% of the total. In the Naoshan area, R maintained the highest relative contribution, reaching 61.65%. Such differences suggest that the relative importance of individual factors varies with geomorphological conditions, reflecting spatial variations in the modeled responses of soil erosion to changes in R, C, and P.
Figure 4.
Contribution rates of factors affecting dynamic changes in soil water erosion across different sub-regions of the Hehuang Valley: (a) Chuanshui area; (b) Qianshan area; (c) Naoshan area.
In the Chuanshui area, P was the primary contributor to temporal changes in soil water erosion, with a mean contribution of 49.36% over the entire study period, noticeably exceeding those of R and C. Its contribution also exhibited an overall upward tendency across successive intervals. During 2000–2005, P accounted for 31.05% of the total normalized contribution. This proportion increased in subsequent periods and reached its maximum of 62.27% during 2015–2020. Although a slight decrease occurred in 2020–2024, P continued to account for a substantial share of 59.12%, indicating that its relative importance remained high during the later stages of the study period. In the Qianshan area, C emerged as the predominant factor influencing changes in soil water erosion, contributing an average of 57.32% throughout the study period. This value was considerably greater than the corresponding contributions of R and P. The relative importance of C increased progressively across the five intervals, beginning at 34.04% in 2000–2005. By 2010–2015, its contribution had increased to 54.18%, followed by a pronounced rise to 79.11% during 2015–2020. This increasing tendency continued into 2020–2024, when C reached 80.24%, its highest level during the study period. The continuous increase in the contribution of C indicates that changes in vegetation cover and management became increasingly important in explaining the modeled erosion dynamics of the Qianshan area. In contrast to the Chuanshui and Qianshan areas, the contribution structure of the Naoshan area was consistently dominated by R. Its mean contribution reached 61.65% over the entire study period, substantially exceeding the corresponding values of C and P. Moreover, the relative contribution of R remained above 50% in all five intervals, demonstrating its persistent predominance in the modeled temporal variations in soil water erosion.
4. Discussion
4.1. Analysis of the Transition of Driving Factors of the Spatiotemporal Evolution of Water Erosion Intensity in the Hehuang Valley
From 2000 to 2024, soil water erosion in the Hehuang Valley exhibited an overall fluctuating downward trend, with the mean soil erosion modulus decreasing by 31.28%, from 1484.45 to 1020.14 t/(km2·a), corresponding to an average annual reduction of approximately 19.35 t/(km2·a). The erosion intensity was predominantly classified as slight, followed by moderate erosion, with the area of slight erosion gradually expanding, while areas affected by moderate and more severe erosion generally decreased. Spatially, reductions in soil erosion were mainly observed in the Huangshui Valley and mountainous areas with improved vegetation cover, whereas increases were primarily concentrated in the loess hilly and gully regions to the north and south, as well as in localized areas susceptible to intense rainfall. Overall, these changes indicate a general improvement in regional soil erosion conditions. The spatial distribution patterns of soil water erosion obtained in this study were generally consistent with those reported in the 30 m annual soil water erosion dataset for mainland China developed by Yan during the overlapping study period, providing qualitative support for the plausibility of the simulated spatial patterns [32].
Temporal variations in the relative contributions of RUSLE factors revealed a distinct shift in the dominant factors influencing soil water erosion dynamics (Figure 3). During 2000–2015, R remained the predominant contributor to changes in soil water erosion, although its relative importance progressively declined. Across the five study periods, the normalized contribution of R decreased substantially from 80.44% to 26.90%, while C exhibited an overall increasing trend, rising from 10.23% to 28.55%. Similarly, the contribution of P increased from 9.33% to 44.55%. Beginning in 2015–2020, the combined contribution of C and P surpassed that of R, eventually reaching 73.10% during 2020–2024. This shift in the contribution structure highlights the increasing relative importance of C and P in explaining modeled soil erosion dynamics, suggesting that anthropogenic influences may have become more prominent in shaping regional erosion patterns.
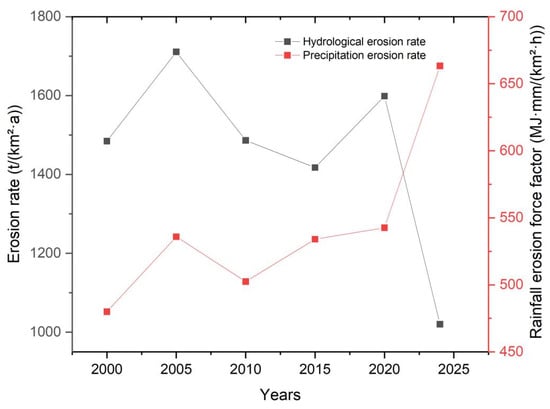
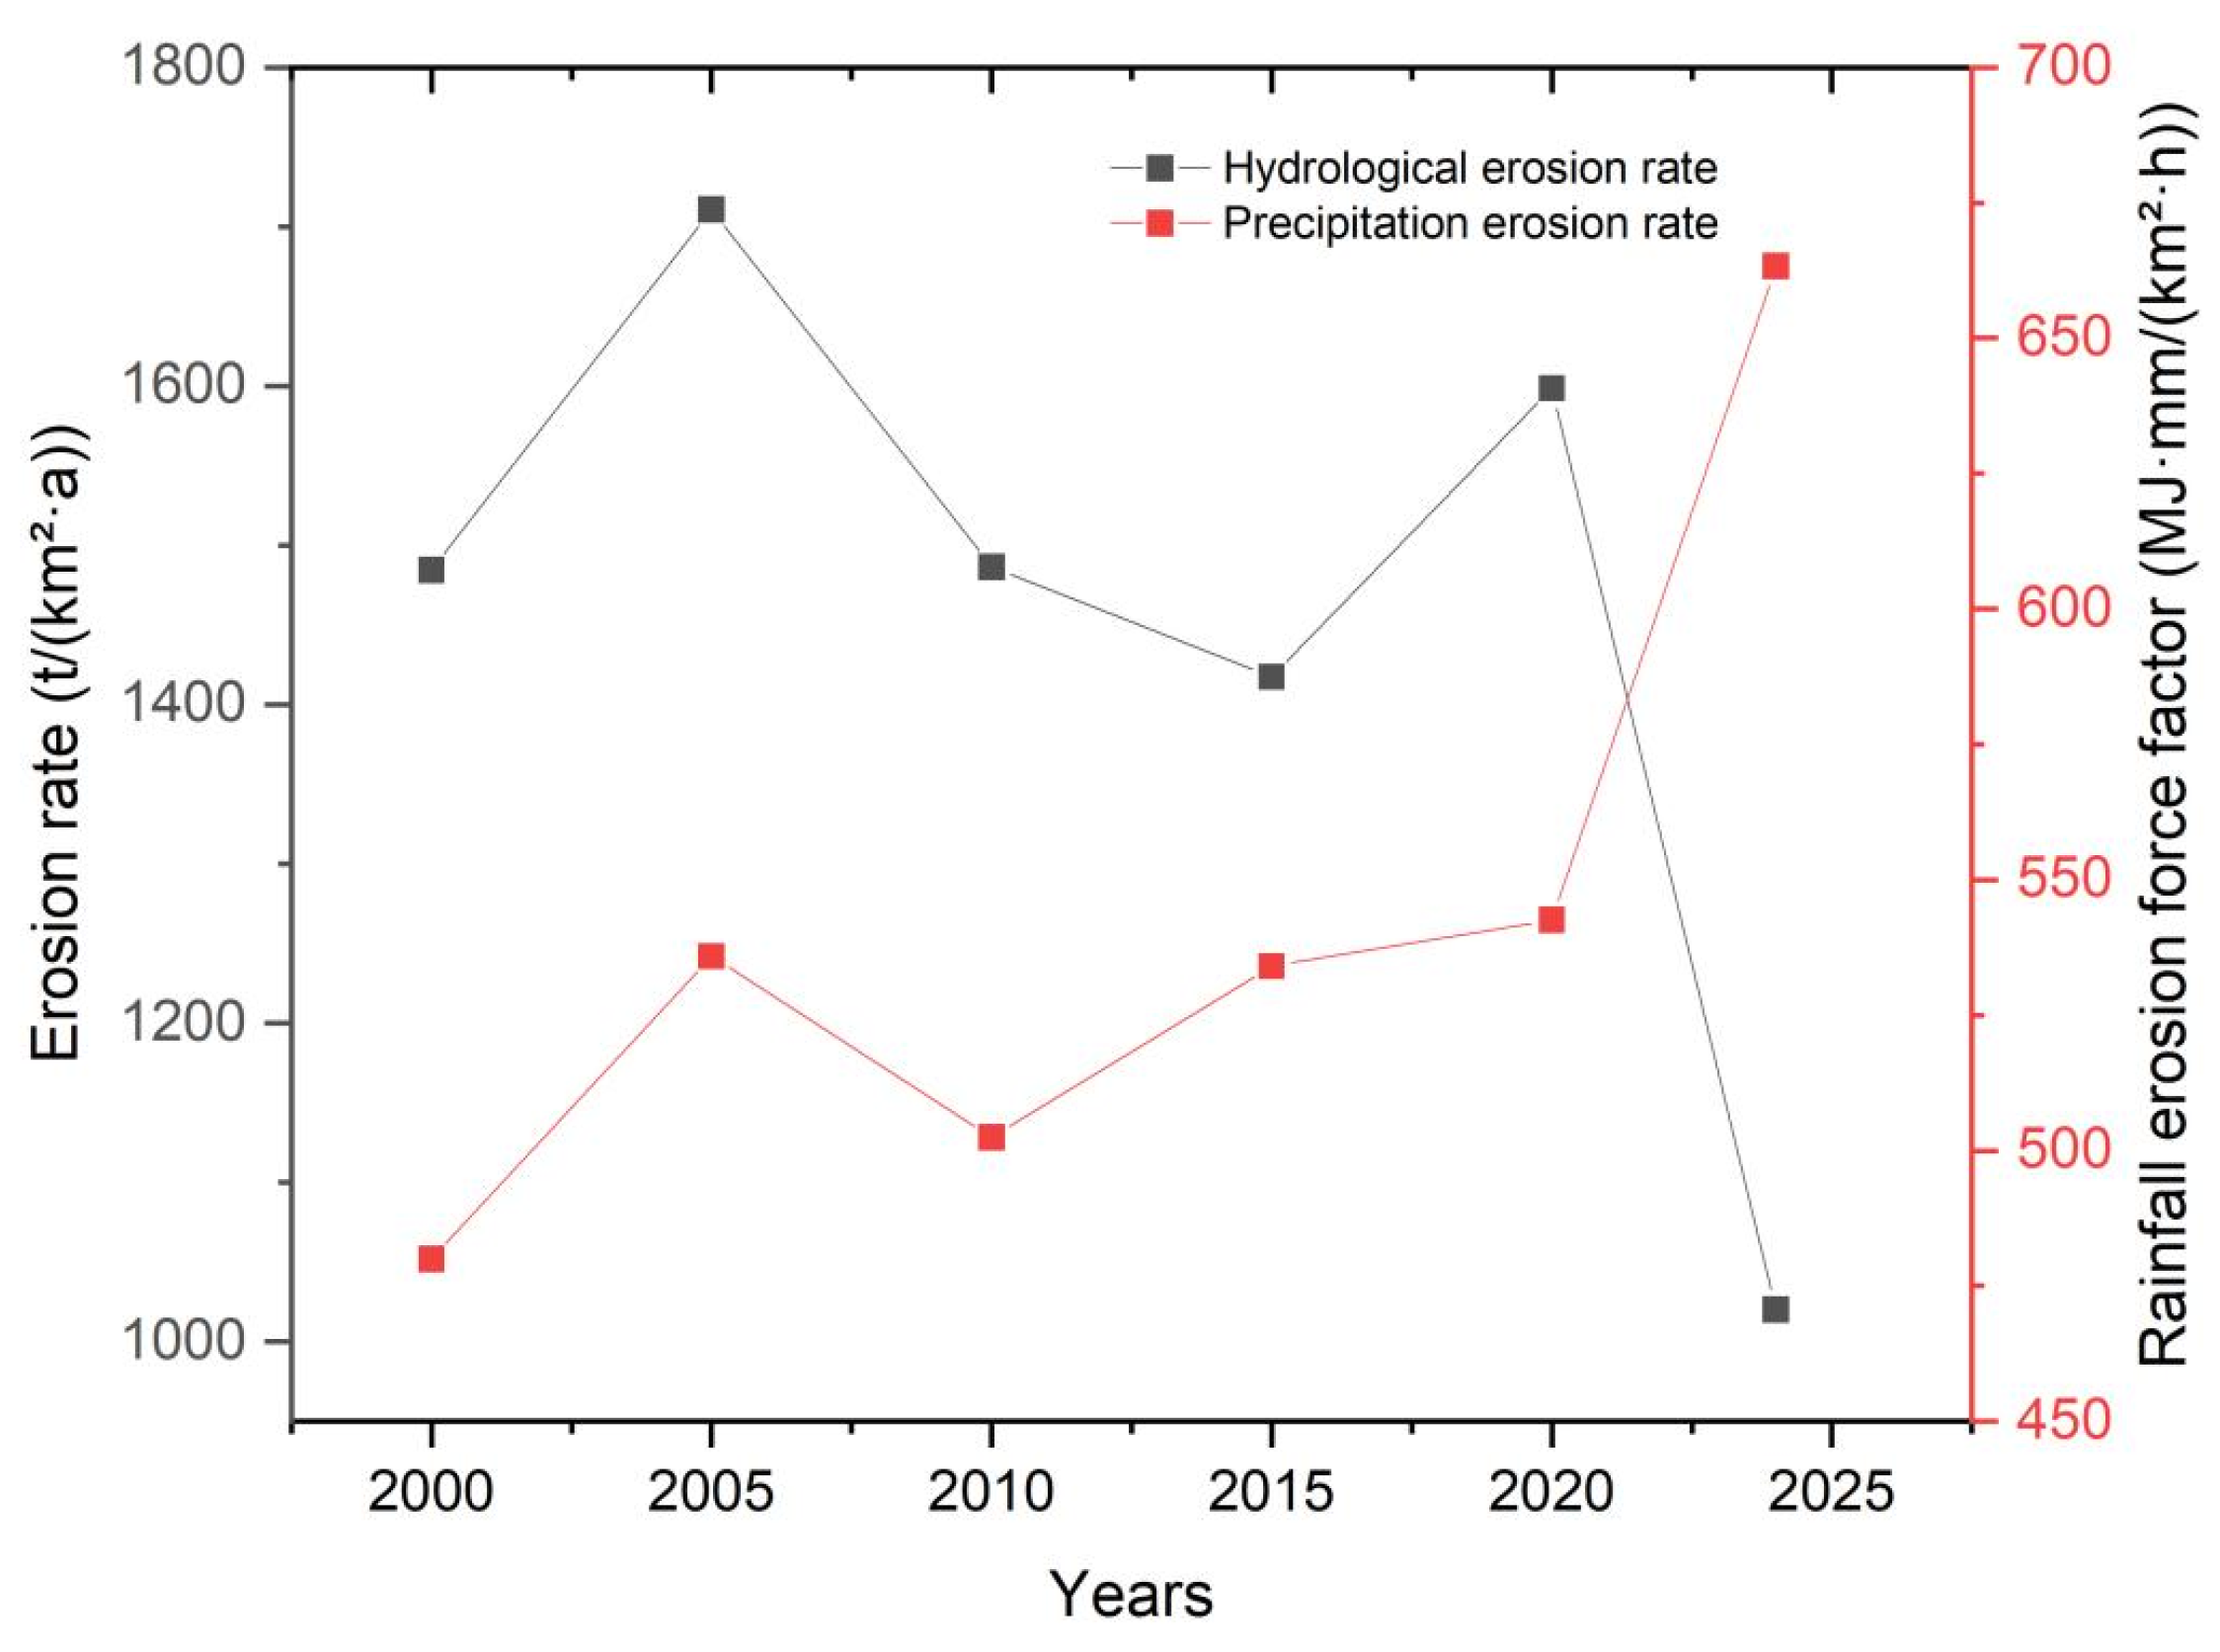
The relationship between R and soil erosion also provides further insight into this changing contribution structure (Figure 5). Over the period 2000–2024, R showed an overall fluctuating increase, whereas the regional mean soil erosion modulus declined from 1484.45 to 1020.14 t/(km2·a). Particularly during 2020–2024, the continued increase in R was accompanied by a reduction in the soil erosion modulus, revealing a divergence between rainfall erosivity and modeled soil loss. This contrasting pattern suggests that variations in R alone were insufficient to account for the observed changes in soil erosion. Within the RUSLE framework, temporal changes in C and P may have altered the modeled response of soil erosion to R, thereby partially offsetting the potential erosion pressure associated with increasing rainfall erosivity.
Figure 5.
Changes in soil water erosion volume and rainfall erosion potential in the Hehuang Valley, 2000–2024.
These changes may be associated with long-term ecological restoration and soil and water conservation efforts in the study area. Since the initiation of China’s Grain for Green Program in 1999, Qinghai Province has progressively implemented vegetation restoration and ecological conservation initiatives. The implementation of a new round of the program in 2014 further promoted regional ecological restoration. Previous studies on the Loess Plateau have demonstrated that vegetation restoration can exhibit cumulative effects over time, with improvements in vegetation cover and associated soil conservation functions becoming more pronounced as vegetation develops [33]. Therefore, the sustained effects of earlier restoration projects, together with subsequent ecological conservation initiatives, may partly explain the increasing relative contribution of the C factor after 2015. Meanwhile, engineering measures, including terracing and check dams, can reduce soil erosion by regulating surface runoff and retaining sediment, and their importance in erosion control on the Loess Plateau has been documented in previous studies [34,35]. Ecological restoration and engineering measures may exhibit complementary effects through their different response times and erosion control mechanisms, providing a plausible explanation for the changes observed in regional soil erosion dynamics. However, because the P factor in this study was assigned according to land-use categories rather than the actual spatial distribution and implementation intensity of conservation practices, its increasing relative contribution cannot be directly attributed to the independent effects of engineering measures.
The role of vegetation cover in mitigating soil erosion may be attributed to its effects on surface runoff dynamics and sediment transport processes. Feng investigated the effects of grass density on runoff hydraulic characteristics and sediment yield during gully headcut erosion through simulated rainfall and scouring experiments [36]. Their results demonstrated that grass vegetation altered runoff hydraulic conditions and enhanced flow energy dissipation. Compared with bare land, runoff energy consumption increased by 4.10–31.81% under grass-covered conditions, while the sediment-reduction efficiency increased with grass density, reaching a maximum of 66.79% under the experimental conditions. These findings suggest that vegetation can reduce soil detachment and sediment transport by modifying near-surface runoff processes. In the present study, the relatively high normalized contribution of the C factor in the Qianshan area indicates that vegetation cover changes were closely associated with variations in modeled soil erosion. The experimental findings of Feng et al. provide a plausible process-based explanation for this relationship.
Runoff energy also connects erosion to terrain. In China’s loess gully region, Shi found that slope gradient and upslope inflow discharge affected both energy consumption and sediment yield, with a significant relationship between these two responses (p < 0.01) [37]. These findings highlight the importance of runoff energy dynamics in controlling soil detachment and sediment transport. In the Hehuang Valley, similar hydrodynamic erosion processes may occur on loess-covered slopes and along concentrated runoff pathways in parts of the Qianshan and Chuanshui areas. Meanwhile, the relatively high normalized contribution of the R factor in the Naoshan area indicates that rainfall erosivity remained an important contributor to modeled soil erosion changes. Differences in topography, vegetation cover, soil properties, and land-use conditions among the sub-regions may lead to spatially variable erosion responses, contributing to the observed differences in dominant RUSLE factors.
Overall, soil water erosion dynamics in the Hehuang Valley exhibited a declining relative contribution of rainfall erosivity and an increasing importance of vegetation-cover- and land-use-related factors, suggesting a potential shift toward greater anthropogenic influence. However, the NDVI-derived C factor may reflect both climatic variability and human activities, while the land-use-based P factor only approximates conservation-related management conditions, potentially leading to overlapping effects. Moreover, RUSLE primarily estimates sheet and rill erosion without explicitly accounting for gully erosion or the time-dependent effects of seasonal freeze–thaw processes on soil erodibility. Therefore, the estimated erosion modulus represents model-based hillslope water erosion rather than total soil loss from all erosion processes. These limitations, together with uncertainties in model parameterization and the lack of systematic uncertainty quantification, constrain the interpretation of temporal changes and the independent contributions of different factors. Future studies integrating field observations, detailed conservation-practice data, and freeze–thaw processes could improve the reliability of erosion estimates and the attribution of driving factors.
4.2. Differences in Transition from a Topographic Zoning Perspective
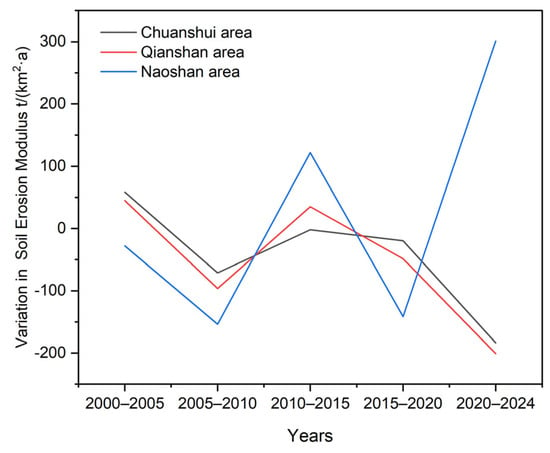
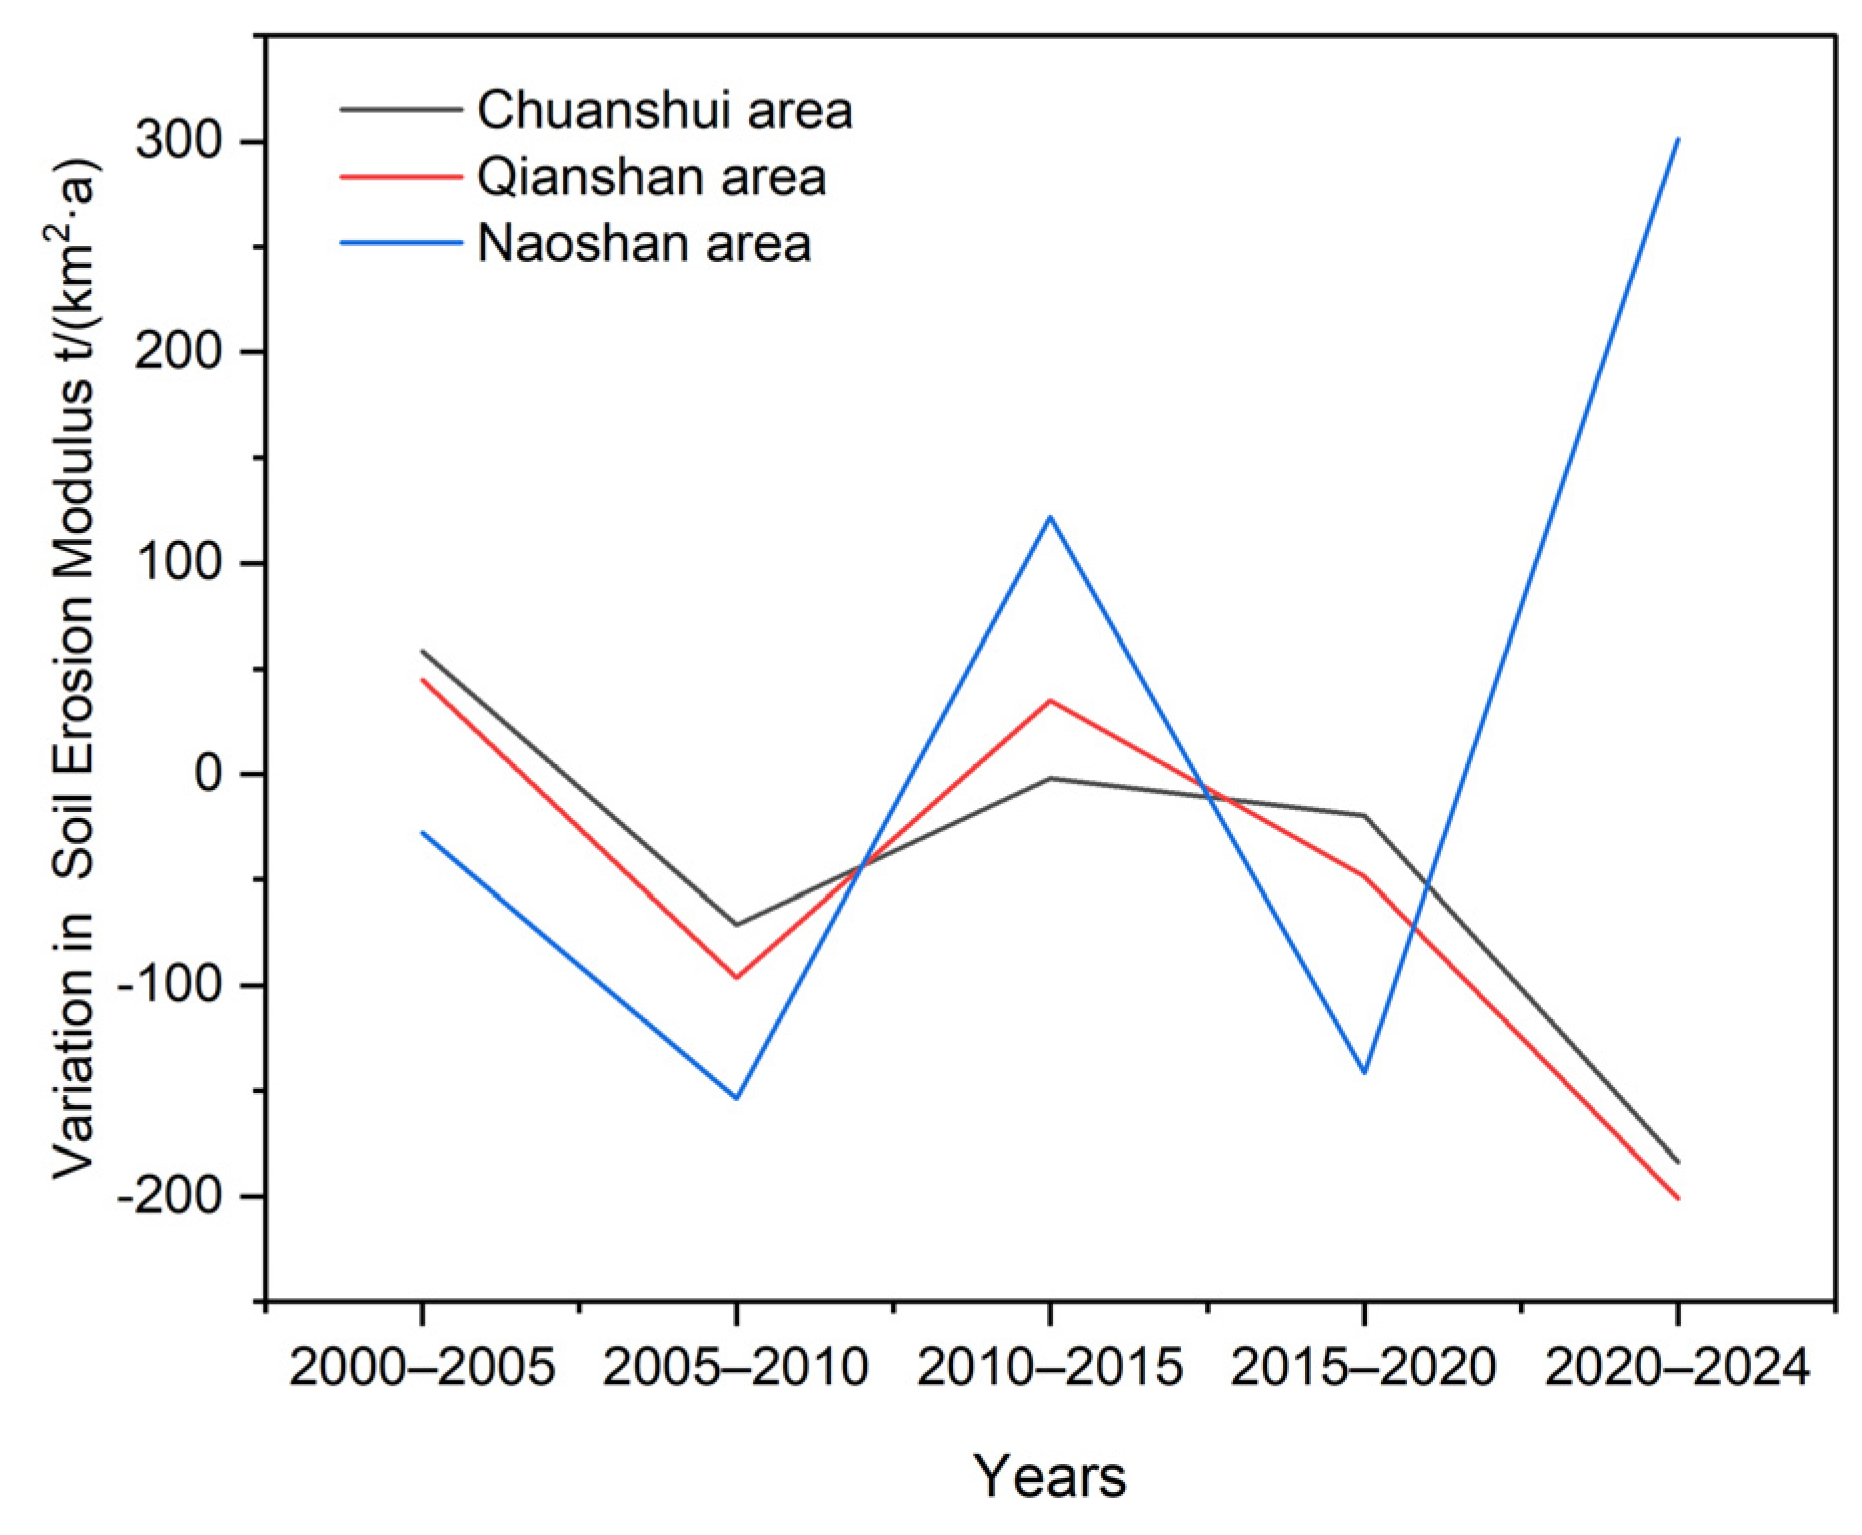
The shift in dominant factors exhibited pronounced spatial variation across the study area, potentially reflecting differences in natural geographical conditions, land-use patterns, and human activity intensity. Furthermore, the trends in soil erosion rates across the three topographic zones show good consistency with the evolution of the dominant driving factors; however, there are marked differences in the magnitude of erosion rate changes and response characteristics between different regions. Soil erosion rates in the Chuanshui area have generally shown a sustained downward trend (Figure 6). This zone features relatively gentle topography and concentrated arable land; it serves as a core area for agricultural production and population settlement, and is also a key region for the implementation of soil and water conservation projects, such as the conversion of sloping farmland into terraces, gully remediation and integrated small watershed management. Long-term, sustained engineering interventions have effectively reduced the velocity of slope runoff and enhanced the soil’s water retention and erosion control capacity, making engineering measures the dominant factor in controlling changes in water erosion within the region. Soil erosion rates in the Qianshan area have also shown an overall and sustained downward trend, with this trend becoming even more pronounced since 2015. The region is characterized by extensive sloping farmland and represents a priority area for implementing the Grain for Green Program (Conversion of Cropland to Forests and Grasslands) and other ecological restoration initiatives.
Figure 6.
Stage-wise variations in soil erosion modulus across different sub-regions of the Hehuang Valley from 2000 to 2024.
In recent years, as vegetation cover has continued to increase, the interception of rainfall by the vegetation canopy and the soil-stabilizing effect of root systems have significantly strengthened, effectively mitigating splash erosion and slope runoff erosion. Consequently, vegetation cover management has gradually become the dominant driving factor in water erosion changes in this region. Soil erosion rates in the Naoshan area exhibit significant interannual fluctuations and showed phased increases and decreases during the study period, consistent with the long-term dominant contribution of rainfall erosion. Given the region’s high altitude, steep slopes, deep gullies and undulating topography, coupled with relatively limited human activity and restricted scope for engineering interventions, the rate of natural vegetation recovery remains relatively slow. Consequently, the regional soil erosion process continues to be primarily governed by rainfall erosion forces and complex topographical conditions, meaning that rainfall erosion has consistently accounted for a high proportion of the total erosion.
Taken together, the three topographic sub-regions of the Hehuang Valley exhibit distinct spatial differences in the normalized relative contributions of RUSLE factors to changes in soil water erosion. Specifically, the support practice factor (P) shows the highest relative contribution in the Chuanshui area, the cover management factor (C) exhibits the greatest relative contribution in the Qianshan area, while the rainfall erosivity factor (R) plays a relatively greater role in the Naoshan area. These differences suggest spatial variations in the relative importance of rainfall erosivity, vegetation cover conditions, and land-use-related factors, providing useful insights into spatially differentiated soil and water conservation strategies. Accordingly, soil and water conservation planning should consider the environmental characteristics and relative importance of influencing factors across different sub-regions. In the Chuanshui area, attention could be given to improving land management and optimizing existing soil and water conservation practices; in the Qianshan area, maintaining vegetation cover and consolidating ecological restoration efforts may be particularly relevant; and in the Naoshan area, strengthening ecological protection and monitoring rainfall-induced erosion risks may be beneficial. Nevertheless, these recommendations are based on model-derived relative contributions and should be further evaluated in conjunction with local environmental conditions and field observations before implementation.
5. Conclusions
- (1)
- Modeled water erosion in the Hehuang Valley declined overall between 2000 and 2024. Minimal erosion constituted the largest proportion of the study area, followed by mild erosion. In terms of spatial distribution, erosion reductions were primarily observed in the Huangshui Valley and mountainous regions with well-restored vegetation, whereas erosion increases were mainly identified in the northern and southern loess hill–gully landscapes, as well as in scattered areas particularly susceptible to intense rainfall events.
- (2)
- Soil water erosion dynamics in the Hehuang Valley exhibited a potential transition toward increasing dominance of anthropogenic influences. From 2000 to 2024, the relative contribution of the R factor decreased from 80.44% to 26.90%, while that of the C factor fluctuated upward from 10.23% to 28.55%, and the P factor increased from 9.33% to 44.55%. After 2015–2020, the combined relative contributions of the C and P factors exceeded that of the R factor, reaching 73.10% in the final period, indicating the growing importance of vegetation-cover- and land-use-related factors and suggesting an increasing influence of human activities. During 2020–2024, rainfall erosivity increased while the soil erosion modulus decreased, suggesting that ecological restoration and land-use adjustments potentially associated with human activities may have partially mitigated the erosion pressure associated with increasing rainfall erosivity.
- (3)
- The driving mechanisms of soil erosion in different landform units of the Hehuang Valley exhibit significant spatial variation. In the Chuanshui area, soil and water conservation measures make the greatest contribution, resulting in a driving pattern dominated by engineering measures; in the Qianshan area, vegetation cover management makes the greatest contribution, resulting in a driving pattern dominated by ecological restoration; and in the Naoshan area, rainfall erosion remains the dominant factor, manifesting as a naturally climate-driven erosion process. There is a good degree of consistency between changes in soil erosion rates across different landform units and the evolution of the dominant driving factors. This reflects marked spatial variations in the region’s response to ecological restoration measures, indicating that future soil and water conservation in the Hehuang Valley should be implemented through zoned and categorized management based on the dominant driving mechanisms of different landform units.
Author Contributions
Conceptualization, M.W. and Q.Z.; methodology, M.W. software, M.W.; validation, M.W. and Q.Z.; formal analysis, M.W.; investigation, W.M. and Q.Z.; resources, Q.Z.; data curation, M.W.; writing—original draft preparation, M.W.; writing—review and editing, W.M.; visualization, M.W.; supervision, Q.Z.; project administration, Q.Z.; funding acquisition, Q.Z. All authors have read and agreed to the published version of the manuscript.
Funding
This research was funded by the National Natural Science Foundation of China (Grant No. 42330502, Change and Risk Assessment of Multi-agent Composite Erosion in the Agro-Pastoral Ecotone of Northern China and Grant No. 42271127, Dynamic Changes and Disaster Response of Alpine Freeze–Thaw Weathering Zone on the Qinghai–Tibet Plateau).
Institutional Review Board Statement
Not applicable.
Informed Consent Statement
Not applicable.
Data Availability Statement
The original datasets used in this study were obtained from the sources detailed in Section 2.2. The processed data generated during this study are not publicly available due to project-related restrictions but can be obtained from the corresponding author upon reasonable request.
Acknowledgments
The authors sincerely appreciate the assistance provided by the research team members during the preparation of this manuscript. We also extend our heartfelt gratitude to the anonymous reviewers and the editorial team for their constructive comments and valuable suggestions, which have greatly improved the quality of this manuscript.
Conflicts of Interest
The authors declare no conflicts of interest.
References
- Shi, S.; Zheng, W.; Han, J.; Zhan, X.; Wang, F. Dominance of human activities in reducing soil erosion on the Loess Plateau. J. Hydrol. 2025, 662, 133835. [Google Scholar] [CrossRef] [Scilit]
- Shi, Z.; Wang, L.; Liu, Q.; Zhang, H.; Huang, X.; Fang, N. Soil Erosion: From Comprehensive Control to Ecological Regulation. Bull. Chin. Acad. Sci. 2018, 33, 198–205. [Google Scholar]
- Leng, S.; Feng, R.; Li, R.; Liu, B.; Zheng, F.; Liu, G.; Wang, Z.; Yang, Q.; Fu, B.; Song, C. Key Research Areas and Issues in Soil Erosion and Soil and Water Conservation Science. J. Soil Water Conserv. 2004, 18, 1–6+26. [Google Scholar]
- Soil and Water Conservation Monitoring Centre, Ministry of Water Resources. Achievements and Role of Soil and Water Conservation Monitoring in China. China Soil Water Conserv. 2021, 7, 1–4. [Google Scholar] [CrossRef]
- Ministry of Water Resources of the People’s Republic of China. Bulletin on Soil and Water Conservation from the First National Water Resources Census. China Soil Water Conserv. 2013, 10, 2–3+11. [Google Scholar] [CrossRef]
- Wei, H.; Wang, K.; Ma, Y.; Meng, Q.; Yang, Y.; Liu, M. Exploring the Relationship between Ecosystem Services and Sustainable Development Goals for Ecological Conservation: A Case Study in the Hehuang Valley of Qinghai-Tibet Plateau. Diversity 2024, 16, 553. [Google Scholar] [CrossRef] [Scilit]
- Cheng, Y.; Zhao, W.; Jiao, J.; Zhang, L.; Cao, X.; Chen, T.; Li, J.; Zhang, Z. Soil conservation effect of cropland use change in the Yellow River-Huangshui River Valley over the past 20 years. Sci. Soil Water Conserv. 2023, 21, 55–63. [Google Scholar] [CrossRef]
- Bayouli, O.T.; Zhang, W.C.; Bayouli, H.T. Combining RUSLE model and the vegetation health index to unravel the relationship between soil erosion and droughts in southeastern Tunisia. J. Arid Land 2023, 15, 1269–1289. [Google Scholar] [CrossRef] [Scilit]
- Wang, T.; Lu, Z.; Ning, J.; Fu, B.; Xin, R.; Huang, N.; Zhao, B. Temporal and Spatial Characteristics of Soil Erosion in Typical Counties of Black Soil Region Based on RUSLE. Bull. Soil Water Conserv. 2023, 43, 227–234. [Google Scholar] [CrossRef]
- Cheng, Y. Analysis of Erosion-Induced Sediment Yield Characteristics and Dam Construction Requirements in the Hehuang Valley. Master’s Thesis, Northwest A&F University, Xianyang, China, 2023. [Google Scholar]
- Du, M.; Zhao, J.; Yang, J.; Ding, Y.; Liu, W.; Li, G.; Wang, Z.; Zhao, L. A Study on the Spatiotemporal Variations in Soil Erosion in the Huangshui River Basin Based on MODIS and Landsat Data. Bull. Soil Water Conserv. 2022, 42, 131–138. [Google Scholar] [CrossRef]
- Chen, T.; Jiao, J.; Wang, H.; Zhao, C.; Lin, H. Progress in Research on Soil Erosion in Qinghai-Tibet Plateau. Acta Pedol. Sin. 2020, 57, 547–564. [Google Scholar]
- Li, Z.S.; Yang, L.; Wang, G.L.; Hou, J.; Xin, Z.B.; Liu, G.H.; Fu, B.J. The management of soil and water conservation in the Loess Plateau of China: Present situations, problems, and counter-solutions. Acta Ecol. Sin. 2019, 39, 7398–7409. [Google Scholar] [CrossRef] [Scilit]
- Chen, C.L.; Zhao, G.J.; Mu, X.M.; Tian, P.; Liu, L.K. Spatial-temporal change of soil erosion in Huangshui Watershed based on RUSLE model. J. Soil Water Conserv. 2021, 35, 73–79. [Google Scholar]
- Xu, E.; Zhang, H. Change pathway and intersection of rainfall, soil, and land use influencing water-related soil erosion. Ecol. Indic. 2020, 113, 106281. [Google Scholar] [CrossRef] [Scilit]
- Xu, Y.; Sun, H.; Ji, X. Spatial-temporal evolution and driving forces of rainfall erosivity in a climatic transitional zone: A case in Huaihe River Basin, eastern China. Catena 2021, 198, 104993. [Google Scholar] [CrossRef] [Scilit]
- Zhao, W.T.; Cheng, Y.Z.; Jian, J.S.; Jiao, J.Y.; Cheng, C.W.; Li, J.J.; Chen, T.D. Water erosion changes on the Qinghai-Tibet Plateau and its response to climate variability and human activities during 1982–2015. Catena 2023, 229, 107207. [Google Scholar] [CrossRef] [Scilit]
- Yin, S.Q.; Xue, X.C.; Yue, T.Y.; Xie, Y.; Gao, G. Spatiotemporal distribution and return period of rainfall erosivity in China. Trans. Chin. Soc. Agric. Eng. 2019, 35, 105–113. [Google Scholar]
- Qin, W.; Zhu, Q.K.; Zhang, Y. Soil erosion assessment of small watershed in Loess Plateau based on GIS and RUSLE. Trans. Chin. Soc. Agric. Eng. 2009, 25, 157–163. [Google Scholar]
- Sun, X.; Jiao, J.; Wang, H.; Li, J.; Chen, T.; Zhao, W.; Cheng, Y. Land-use changes and their cold and hot spot distributions in the Hehuang Valley from 1980 to 2020. Bull. Soil Water Conserv. 2022, 42, 327–334. [Google Scholar] [CrossRef]
- Zhang, W.; Xie, Y.; Liu, B. Rainfall erosivity estimation using daily rainfall amounts. Sci. Geogr. Sin. 2002, 22, 705–711. [Google Scholar] [CrossRef] [Scilit]
- Williams, J.; Renard, K.; Dyke, P. EPIC: A new method for assessing erosion’s effect on soil productivity. J. Soil Water Conserv. 1983, 38, 381–383. [Google Scholar] [CrossRef] [Scilit]
- Liu, B.Y.; Nearing, M.A.; Risse, L.M. Slope gradient effects on soil loss for steep slopes. Trans. ASAE 1994, 37, 1835–1840. [Google Scholar] [CrossRef] [Scilit]
- Cai, C.; Ding, S.; Shi, Z.; Huang, L.; Zhang, G.Y. A Study on the Prediction of Soil Erosion in Small Catchments Using the USLE Model and the IDRISI Geographical Information System. J. Soil Water Conserv. 2000, 14, 19–24. [Google Scholar] [CrossRef]
- Benavidez, R.; Jackson, B.; Maxwell, D.; Norton, K. A review of the (Revised) Universal Soil Loss Equation ((R)USLE): With a view to increasing its global applicability and improving soil loss estimates. Hydrol. Earth Syst. Sci. 2018, 22, 6059–6086. [Google Scholar] [CrossRef] [Scilit]
- Weng, X.; Zhang, B.; Zhu, J.; Wang, D.; Qiu, J. Assessing land use and climate change impacts on soil erosion caused by water in China. Sustainability 2023, 15, 7865. [Google Scholar] [CrossRef] [Scilit]
- Tang, J.; Li, W. Spatiotemporal Changes in Soil Erosion in the Qinghai Section of the Yellow River from 2000 to 2018. Henan Sci. Technol. 2022, 41, 117–122. [Google Scholar]
- Jiang, G.; Kang, J.; Cao, G.; Chen, K.; Cao, S. Study on soil erosion of Lancang River Basin in Qinghai based on RUSLE model. Plateau Sci. Res. 2022, 6, 1–13. [Google Scholar]
- Chen, X.F. Evaluation of the Current Status of Soil Erosion in the Qinghai Lake Basin Based on the USLE Model. Master’s Thesis, Qinghai Normal University, Xining, China, 2012. [Google Scholar]
- Gou, F.; Liang, W.; Yan, J.; Sun, S.; Chen, Z.; Zhang, W.; Ji, Q.; Wang, F. Decrease in Erosion-Induced Soil Organic Carbon as a Result of Vegetation Restoration in the Loess Plateau, China. J. Geophys. Res. Biogeosci. 2022, 127, e2022JG006917. [Google Scholar] [CrossRef] [Scilit]
- Wu, J.; Li, S.; Shi, P.; Yang, W. Spatiotemporal variation of soil water erosion and influencing factors in eastern region of agro-pastoral ecotone in northern China. Bull. Soil Water Conserv. 2025, 45, 320–332. [Google Scholar]
- Yan, J.; Wang, S.; Feng, J.; He, H.; Wang, L.; Sun, Z.; Zheng, C. New 30-m resolution dataset reveals declining soil erosion with regional increases across Chinese mainland (1990–2022). Remote Sens. Environ. 2025, 323, 114681. [Google Scholar] [CrossRef] [Scilit]
- Shan, L.; Xu, B. A Discussion on Issues Relating to the "Conversion of Farmland to Forests (and Grasslands)" Programme on the Loess Plateau in the New Era. Bull. Soil Water Conserv. 2019, 39, 295–297. [Google Scholar]
- Zou, Y.; Huang, X.; She, D. A Bibliometric Analysis of the Environmental Effects of Silt-Trapping Dams on the Loess Plateau Based on the Web of Science Database. Chin. J. Soil Water Conserv. 2021, 19, 126–131. [Google Scholar]
- Chen, Y.; Han, J.; Jiao, J.; Xu, Q.; Chen, T.; Li, J.; Wang, N.; Bai, L. A review on the layouts of rainwater storage and drainage measures in small watersheds. Sci. Soil Water Conserv. 2023, 21, 132–143. [Google Scholar]
- Feng, L.; Wang, W.; Guo, M.; Shi, Q.; Guo, W.; Lou, Y.; Kang, H.; Chen, Z. Effects of grass density on the runoff hydraulic characteristics and sediment yield in gully headcut erosion processes. Hydrol. Process. 2022, 36, e14643. [Google Scholar] [CrossRef] [Scilit]
- Shi, Q.; Wang, W.; Feng, L. Response of the Headcut Erosion Process to Flow Energy Variation in the Loess Gully Region of China. Water 2022, 14, 3038. [Google Scholar] [CrossRef] [Scilit]

Disclaimer/Publisher’s Note: The statements, opinions and data contained in all publications are solely those of the individual author(s) and contributor(s) and not of MDPI and/or the editor(s). MDPI and/or the editor(s) disclaim responsibility for any injury to people or property resulting from any ideas, methods, instructions or products referred to in the content. |
© 2026 by the authors. Licensee MDPI, Basel, Switzerland. This article is an open access article distributed under the terms and conditions of the Creative Commons Attribution (CC BY) license.