


Abstract
This study presents an integrated methodological framework for environmental assessment in copper mining, combining Life Cycle Assessment (LCA), a screening-level Planetary Boundaries (PB) assessment, and scenario-based optimization. A screening-level assessment is understood as a preliminary evaluation based on available operational and environmental data, designed to identify the main environmental hotspots and prioritize areas requiring further investigation, rather than provide a fully detailed assessment of all environmental impacts. The main objective is to describe how these complementary approaches can be integrated to identify environmental hotspots across mining technological processes and support the prioritization of potential improvement measures. The framework incorporates process-level environmental assessment based on life cycle inventory data, the evaluation of selected planetary boundary indicators, and the development of optimization scenarios using documented technological and operational improvements. Its practical applicability is demonstrated through a case study of the Rosia Poieni copper mine in Romania. The LCA uses operational data provided by the mining company, including diesel and electricity consumption, water consumption, and material inputs. These data were used to establish the life cycle inventory and calculate the corresponding environmental indicators, including process-specific greenhouse gas (GHG) emissions. Complementary information from company and environmental reports was used for the assessment of land-system change and biosphere integrity. The case study resulted in an estimated baseline GHG emission intensity of 1.916 kg CO2-eq/kg Cu. The main process-level contributors were loading (0.810 kg CO2-eq/kg Cu), drilling and blasting (0.550 kg CO2-eq/kg Cu), and transportation (0.470 kg CO2-eq/kg Cu). The PB assessment further identified environmental pressures associated with atmospheric aerosol loading, freshwater change, land-system change, and biosphere integrity. Additionally, the optimization scenarios indicated potential GHG emission reductions of 15–25% for drilling and blasting, 15–30% for loading, and 25–45% for transportation. These values represent indicative improvement scenarios rather than predictions of site-specific operational performance. Overall, the study demonstrates how the proposed integrated framework can structure environmental information, identify priority processes, and support preliminary environmental decision-making towards more sustainable copper mining.
1. Introduction
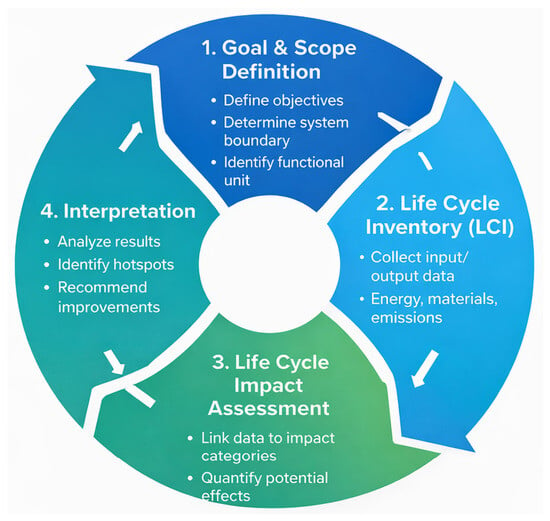
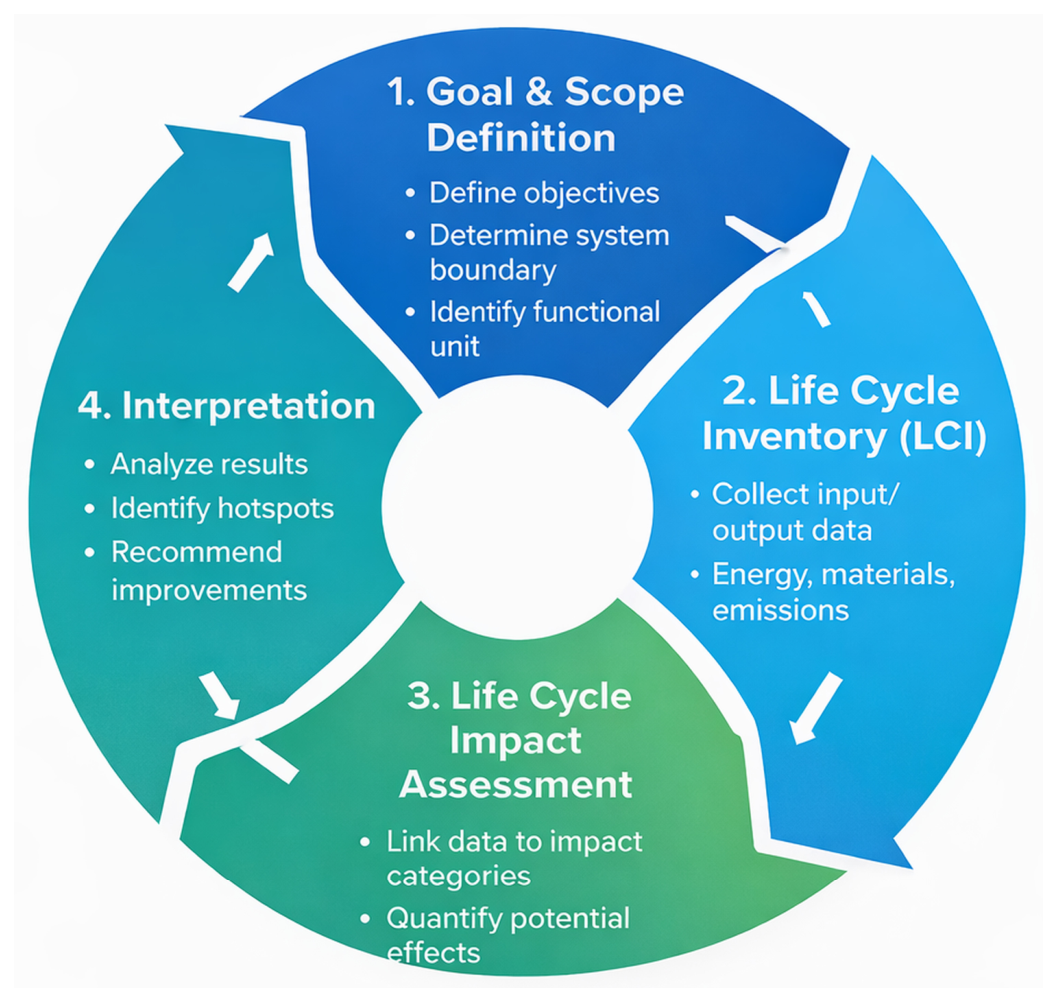
Life Cycle Assessment (LCA) is an internationally recognized methodological framework for systematically quantifying environmental impacts associated with a product, process, or service throughout its life cycle. Based on standardized procedures established by ISO 14040 and ISO 14044, this framework provides a structured basis for identifying environmental hotspots and supporting informed decisions related to production and resource management [1,2]. It consists of four interconnected phases (Figure 1): (1) goal and scope definition, (2) life cycle inventory (LCI), (3) life cycle impact assessment (LCIA), and (4) interpretation. These phases are applied iteratively to ensure consistency between the study objectives, system boundaries, inventory data, impact assessment, and interpretation of the results [3].
Figure 1.
Life cycle assessment framework.
In the mining sector, this approach has been increasingly applied to evaluate the environmental performance of mineral extraction and processing systems. Previous studies have examined energy consumption, greenhouse gas emissions, water use, material consumption, and waste generation as key contributors to the environmental profile of mining operations. Such assessments have also enabled the identification of technological hotspots and the comparison of alternative extraction and processing strategies.
In copper production, environmental assessments have particularly focused on the substantial energy and fuel requirements associated with extraction, material handling, transportation, comminution, and mineral processing. The results reported in the literature indicate that the relative contribution of individual processes can vary depending on ore grade, mining method, processing technology, energy source, and site-specific operational conditions. This variability highlights the importance of process-level assessment when identifying opportunities for environmental improvement.
Despite the increasing application of this methodology in mining, fewer studies have combined process-level environmental assessment with a broader sustainability perspective capable of linking identified hotspots to environmental limits and subsequent optimization measures. The present study addresses this gap by integrating process-level LCA with a screening-level Planetary Boundaries assessment and a scenario-based optimization approach.
Together, these stages enable decision-makers to understand where and how environmental burdens occur, supporting more sustainable design, production, and resource management strategies.
Within the extractive industries, Life Cycle Assessment has become an increasingly relevant approach for evaluating the environmental implications of mining activities. Mining operations are associated with substantial energy and material consumption, greenhouse gas emissions, and land disturbance, highlighting the need for systematic approaches to assess and reduce their environmental footprint [4].
Recent research has also emphasized the importance of multidimensional approaches to climate performance assessment, demonstrating that climate-related challenges extend beyond emission indicators to include energy systems, transport, agriculture, and land-use interactions [5].
In this context, LCA can support the identification of environmentally significant processes and inform strategies aimed at improving resource efficiency and reducing environmental burdens associated with mining activities [6].
In recent research, life cycle-based approaches have increasingly been integrated with circular economy principles to assess the environmental implications and trade-offs associated with circular interventions. Frameworks combining life cycle assessment with strategies such as material reuse, recycling, and product redesign have been proposed to provide a more comprehensive evaluation of environmental performance within industrial systems [7]. Similar applications have extended the methodology to energy systems, where environmental impacts associated with energy production, conversion, and consumption can be systematically quantified across different stages of the system [8].
At the global level, comparative assessments of mining sites have combined life cycle-based environmental evaluation with indicators addressing environmental risks and governance, providing a broader perspective on the sustainability implications of mineral extraction [9]. Such integrated approaches highlight the relevance of harmonized assessment frameworks for evaluating environmental pressures associated with resource extraction while also considering the broader governance and socio-economic context.
Beyond conventional life cycle-based environmental assessments, recent research has explored the integration of Life Cycle Assessment (LCA) with the Planetary Boundaries (PB) framework to evaluate environmental impacts in relation to the Earth’s ecological limits. The integration of planetary boundaries into LCA has been proposed as a means of assessing the absolute environmental sustainability of products and systems [10]. Subsequent methodological developments have established approaches for linking life cycle impact assessment indicators to planetary boundary processes and the Earth’s safe operating space [11]. The practical application of PB-based methodologies in industrial decision-making has also been demonstrated [12].
Recent reviews have examined the different approaches available for incorporating planetary boundaries into LCA, including absolute environmental sustainability assessment, PB-based normalization, and PB-based weighting. These studies also highlight methodological challenges related to indicator selection, the allocation of safe operating spaces, and the harmonization of assessment approaches [13]. Further research has explored the development and future perspectives of planetary boundaries and absolute sustainability within LCA [14]. Collectively, these studies demonstrate the growing methodological interest in connecting life cycle-based environmental assessments with global ecological limits, while highlighting the need to clarify the scope and interpretation of PB-related indicators in practical applications.
In summary, Life Cycle Assessment has evolved from a purely analytical tool into a strategic decision-support system that integrates sustainability considerations into industrial design, mining, and policy planning. By capturing environmental interactions across all life cycle stages, LCA contributes to reducing resource depletion, emissions, and ecological degradation, paving the way for more sustainable production and consumption patterns.
The concept of planetary boundaries defines nine critical limits that must be maintained to ensure humanity’s long-term development and well-being.
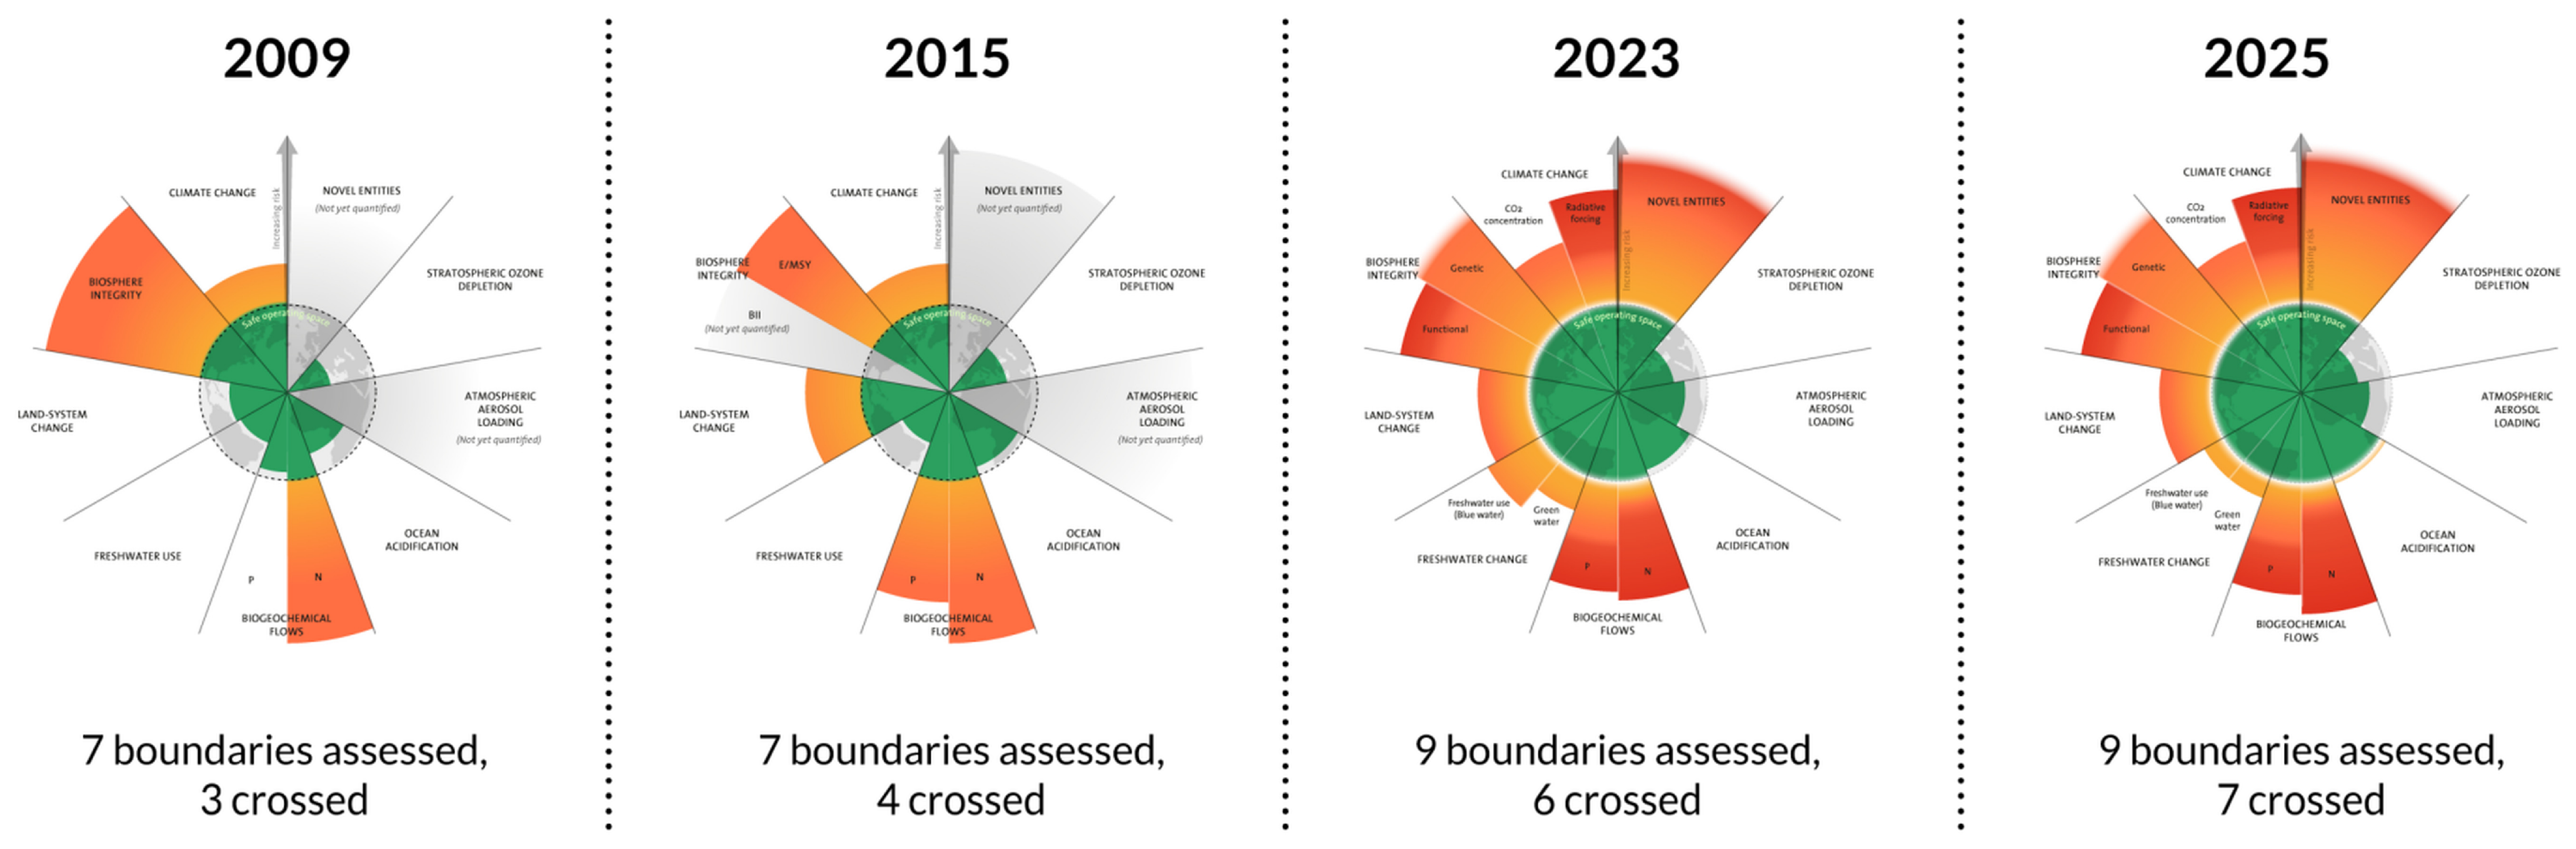
Humanity’s relationship with the Earth system is now pressing into territory that we once assumed was safe and stable. The “planetary boundaries” framework (Figure 2) developed by Johan Rockström and colleagues in 2009 identifies nine key Earth-system processes that regulate the planet’s stability and resilience.
Figure 2.
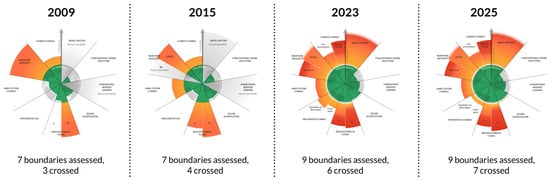
The evolution of the planetary boundaries’ framework. Source: Licenced under CC BY-NC-ND 3.0 (Credit: Azote for Stockholm Resilience Centre, Stockholm University [15].
The colors represent the status of the planetary boundaries in relation to their safe operating space. Green indicates that the boundary remains within the safe operating space, while yellow to orange indicates increasing environmental pressure and a growing risk of transgression. Red represents a boundary that has been transgressed, indicating a high level of environmental risk. The grey areas indicate boundaries that were not yet quantified in the respective assessments. Overall, the figure illustrates the progressive deterioration of the Earth’s environmental status, with the number of transgressed boundaries increasing from 3 in 2009 to 7 in 2025.
The idea is that crossing these boundaries risks triggering abrupt, non-linear environmental change, shifting the planet into a state less conducive to human well-being.
The planetary-boundaries framework provides a science-based understanding of the safe operating space for humanity, clarifying how human activities interact with critical Earth-system processes [15]. Across several boundaries, the evidence shows that humanity has already transgressed biophysical limits, heightened the risk of destabilizing Earth-system functions and reduced the resilience that supports human development. The following synthesis outlines the status of each boundary and draws on contemporary scholarship to interpret what these trends imply for the future.
Climate change remains one of the most critical boundaries. Anthropogenic greenhouse gas emissions and aerosol perturbations have disrupted Earth’s radiative balance, resulting in ongoing global warming and profound shifts in climate dynamics. Updated assessments indicate that humanity now operates beyond the safe operating space for climate stability, increasing the likelihood of abrupt or irreversible changes [15,16]. Scenario modelling further shows that without strong integrated mitigation pathways, climate pressures will continue to intensify through mid-century [17].
The novel entities boundary captures the rapid proliferation of synthetic chemicals, micro- and nano-plastics, persistent organic pollutants, genetically modified organisms, and other anthropogenic compounds whose long-term risks remain poorly understood. The global release of such substances is widely considered to exceed society’s capacity to monitor and manage them safely [18]. Although quantifying a precise global threshold remains difficult, emerging evidence strongly suggests a systemic transgression of this boundary.
Stratospheric ozone depletion stands out as a success story of global environmental governance. International agreements, most notably the Montreal Protocol, have led to significant reductions in ozone-depleting substances, resulting in a slow but steady recovery of the ozone layer. While ozone concentrations have not returned to pre-1980 levels, this boundary is considered within safe limits, demonstrating that coordinated global action can reverse planetary degradation [15].
The boundary for atmospheric aerosol loading concerns aerosol concentrations that affect climate, cloud formation, and human health. Although regional aerosol burdens remain problematic, globally, the boundary has not yet been exceeded. Nonetheless, regional hotspots, combined with the complex role aerosols play in masking warming, underscore the need for improved monitoring and modelling [17].
Ocean acidification is driven by the ocean’s absorption of anthropogenic CO2, which reduces pH and carbonate-ion availability. These chemical shifts threaten marine organisms, particularly calcifies such as corals and shellfish, and jeopardize the stability of ocean ecosystems. Current trends place this boundary close to its safe limit, with the potential for transgression if global emissions remain high [15,16].
Human disruption of biogeochemical flows, particularly nitrogen and phosphorus, represents another major transgression. Synthetic fertilizers, wastewater, and agricultural runoff introduce large quantities of reactive N and P into ecosystems, fueling eutrophication, dead zones, and biodiversity loss. The boundary for biogeochemical flows was identified as exceeded in early assessments and continues to worsen [16]. These disruptions also connect with consumption patterns, highlighting the need for sustainable lifestyles compatible with Earth-system limits [19].
The freshwater change boundary addresses alterations to surface water, groundwater, soil moisture, and the broader hydrological cycle. Human withdrawals, river diversion, and pollution have driven many regions beyond safe limits. New assessments confirm that the planetary freshwater boundary has been transgressed, posing escalating risks to food security, ecosystem health, and socio-economic stability [16].
Through land-system change, deforestation, agricultural expansion, and urbanization have transformed natural ecosystems and reduced Earth’s capacity to regulate climate and maintain biodiversity. Critical biomes have lost forest cover beyond safe thresholds, contributing to cascading ecological decline [15]. Downscaled analyses show that allocating fair national land-use limits requires transparent criteria that consider capacity, equity, and historical responsibility [20].
Biosphere integrity, encompassing genetic diversity and functional biodiversity, represents one of the most severely breached boundaries. Accelerating extinction rates, habitat loss, and declines in ecological functions undermine the resilience of global ecosystems. As biodiversity is foundational to Earth-system stability, this transgression carries particularly profound implications [15,18].
Understanding and operationalizing these boundaries requires methodological pluralism. Integrated assessment models, Earth-system models, environmental footprints, and socio-economic allocation frameworks each illuminate different dimensions of the problem [17,21]. Environmental footprints, for example, help translate planetary thresholds into actionable indicators for product supply chains and national consumption [15]. Similarly, performance-assessment approaches grounded in planetary boundaries allow organizations and regions to measure their environmental impacts relative to global limits [22].
At the policy level, contemporary scholarship argues for bounded sustainability, an understanding of development that aligns human well-being with the hard constraints of Earth-system processes. This implies shifting economic metrics away from unbounded growth and restructuring governance systems to remain within planetary limits [22]. Recognizing that planetary boundaries are both biophysical and socio-political constructs, scholars highlight the need for institutional change, equitable allocation of responsibilities, and transformations in consumption and production [18,20].
Looking ahead, scenario-based analyses show that without rapid, integrated action across sectors, energy, land use, consumption, and governance, most planetary boundaries will continue to move in the wrong direction [17]. Yet the successful recovery of the ozone layer demonstrates that coordinated international governance can restore damaged Earth-system processes. The challenge now is scaling such cooperation across all boundaries to ensure a stable and resilient Earth for future generations.
Several of the planet-regulating processes are already operating beyond their safe limits. Others remain within safe boundaries but are dangerously close to tipping points. Crucially, these boundaries are interconnected: crossing one can erode the resilience of others. The framework emphasizes that it is not enough to address each process in isolation, the Earth system is integrative and complex.
Human civilization has flourished during the last ~10,000 years in the stable climatic and ecological conditions of the Holocene epoch.
The planetary-boundaries framework argues that if we push critical Earth-system processes too far, we risk emerging into a new state less favorable for human development and well-being. The thresholds defined are not purely technical limits, but conservative, risk-averse estimates intended to give humanity a margin of safety [23].
However, despite the increasing application of LCA to mining and mineral processing, further methodological integration is needed to connect process-level environmental hotspots with broader sustainability limits. Existing studies commonly assess energy consumption, greenhouse gas emissions, and other environmental impacts, while fewer approaches integrate these results with a Planetary Boundaries perspective to provide a structured screening of multiple environmental pressures at the level of individual mining processes [10,11,13,14].
Against this background, this study applies a Life Cycle Assessment (LCA) framework to the Roșia Poieni copper mine in Romania to evaluate the environmental pressures associated with its main extraction, processing, and waste-management activities. The study follows the principles of ISO 14040 and ISO 14044 and complements the LCA with a screening-level assessment based on selected Planetary Boundaries (PBs) [1,2]. The approach is used to identify process-level environmental hotspots, benchmark the estimated greenhouse gas emission intensity against reported international mining operations, and examine potential emission reductions through process-specific optimization scenarios. The main contribution of the study is the integration of ISO-based LCA, a Planetary-Boundaries screening matrix, process-level hotspot identification, and scenario-based optimization within a site-specific assessment of a Romanian copper mine. This provides a structured basis for identifying priority processes and evaluating potential pathways for improving the environmental performance of copper production under data-constrained conditions.
2. Materials and Methods
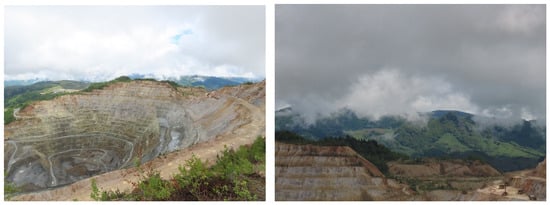
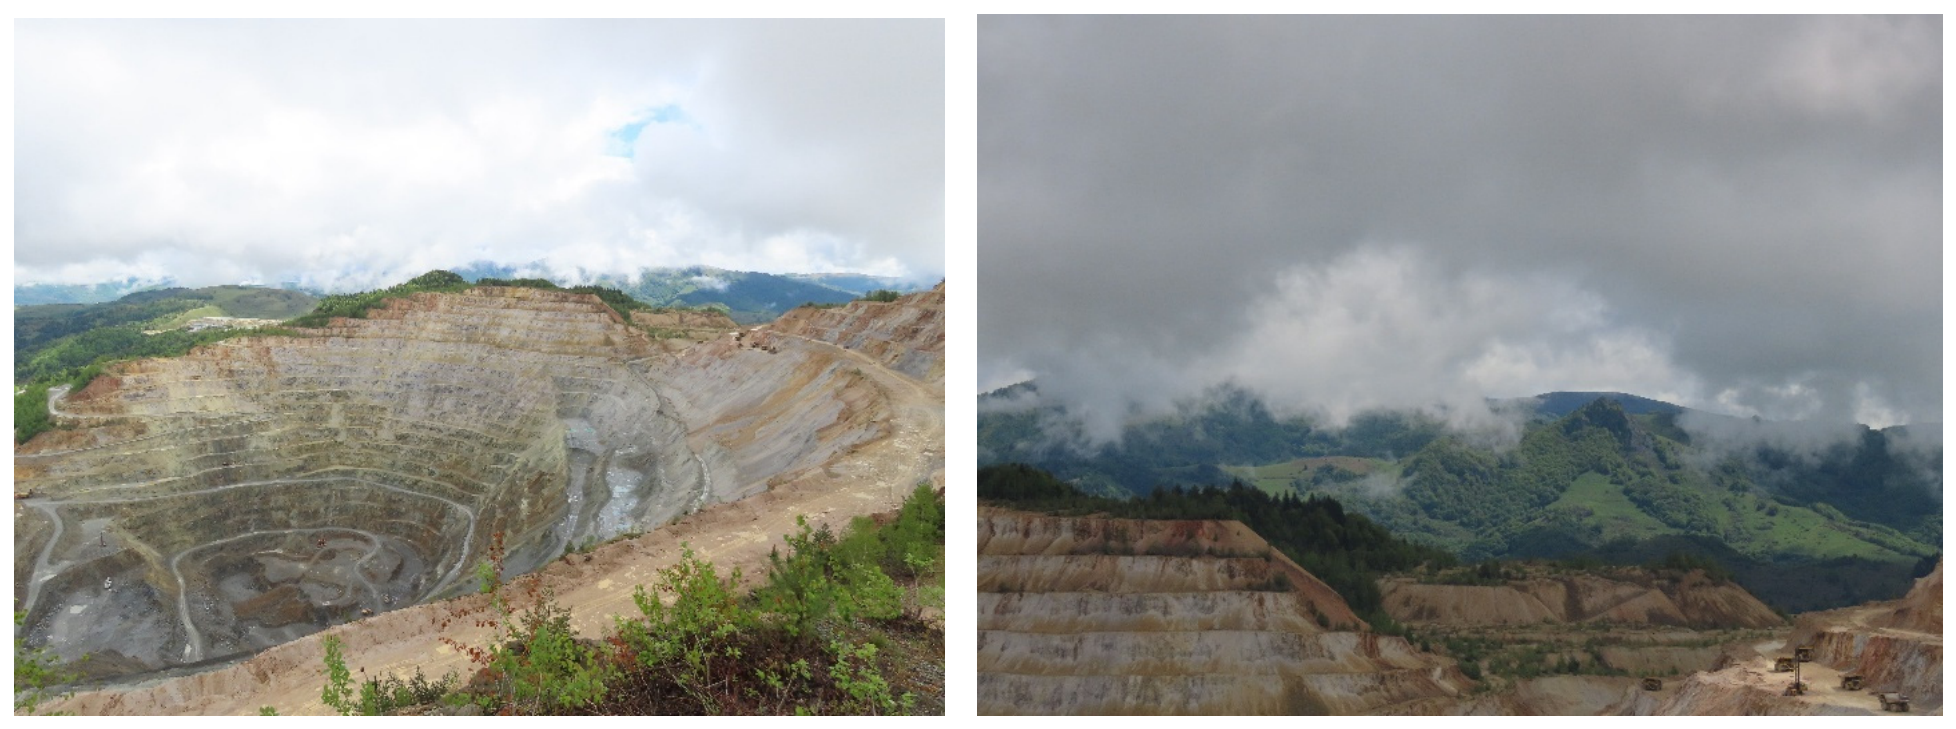
Rosia Poieni (Figure 3) is situated in the Apuseni Mountains, a mountain range that is part of the larger Carpathian Mountain system in western Romania. The Rosia Poieni mining objective covers an area of 50 km2 and is situated on the territory of Lupsa commune, Alba County, in the area Poieni, Virsii, Curmatura peaks, and the southern slope of the Valley Aries, and from a geographical point of view, it falls within the structural unit Metaliferi Mountains. The region is characterized by its rugged terrain and rich mineral resources [24].
Figure 3.
Rosia Poieni copper mine. Photo credit: Rodica Cujba Stepanek.
The mining operations at Rosia Poieni have raised significant environmental and social concerns. The dumping of mining waste into the surrounding valleys has led to the creation of a vast settling basin, which has expanded significantly over the years. This basin has become a significant environmental concern, as the acidic sludge contains various metals that pose a risk to the environment and local communities.
2.1. Technological Flow
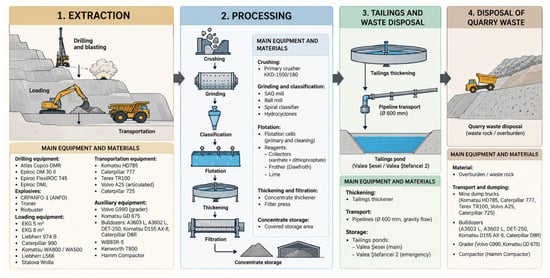
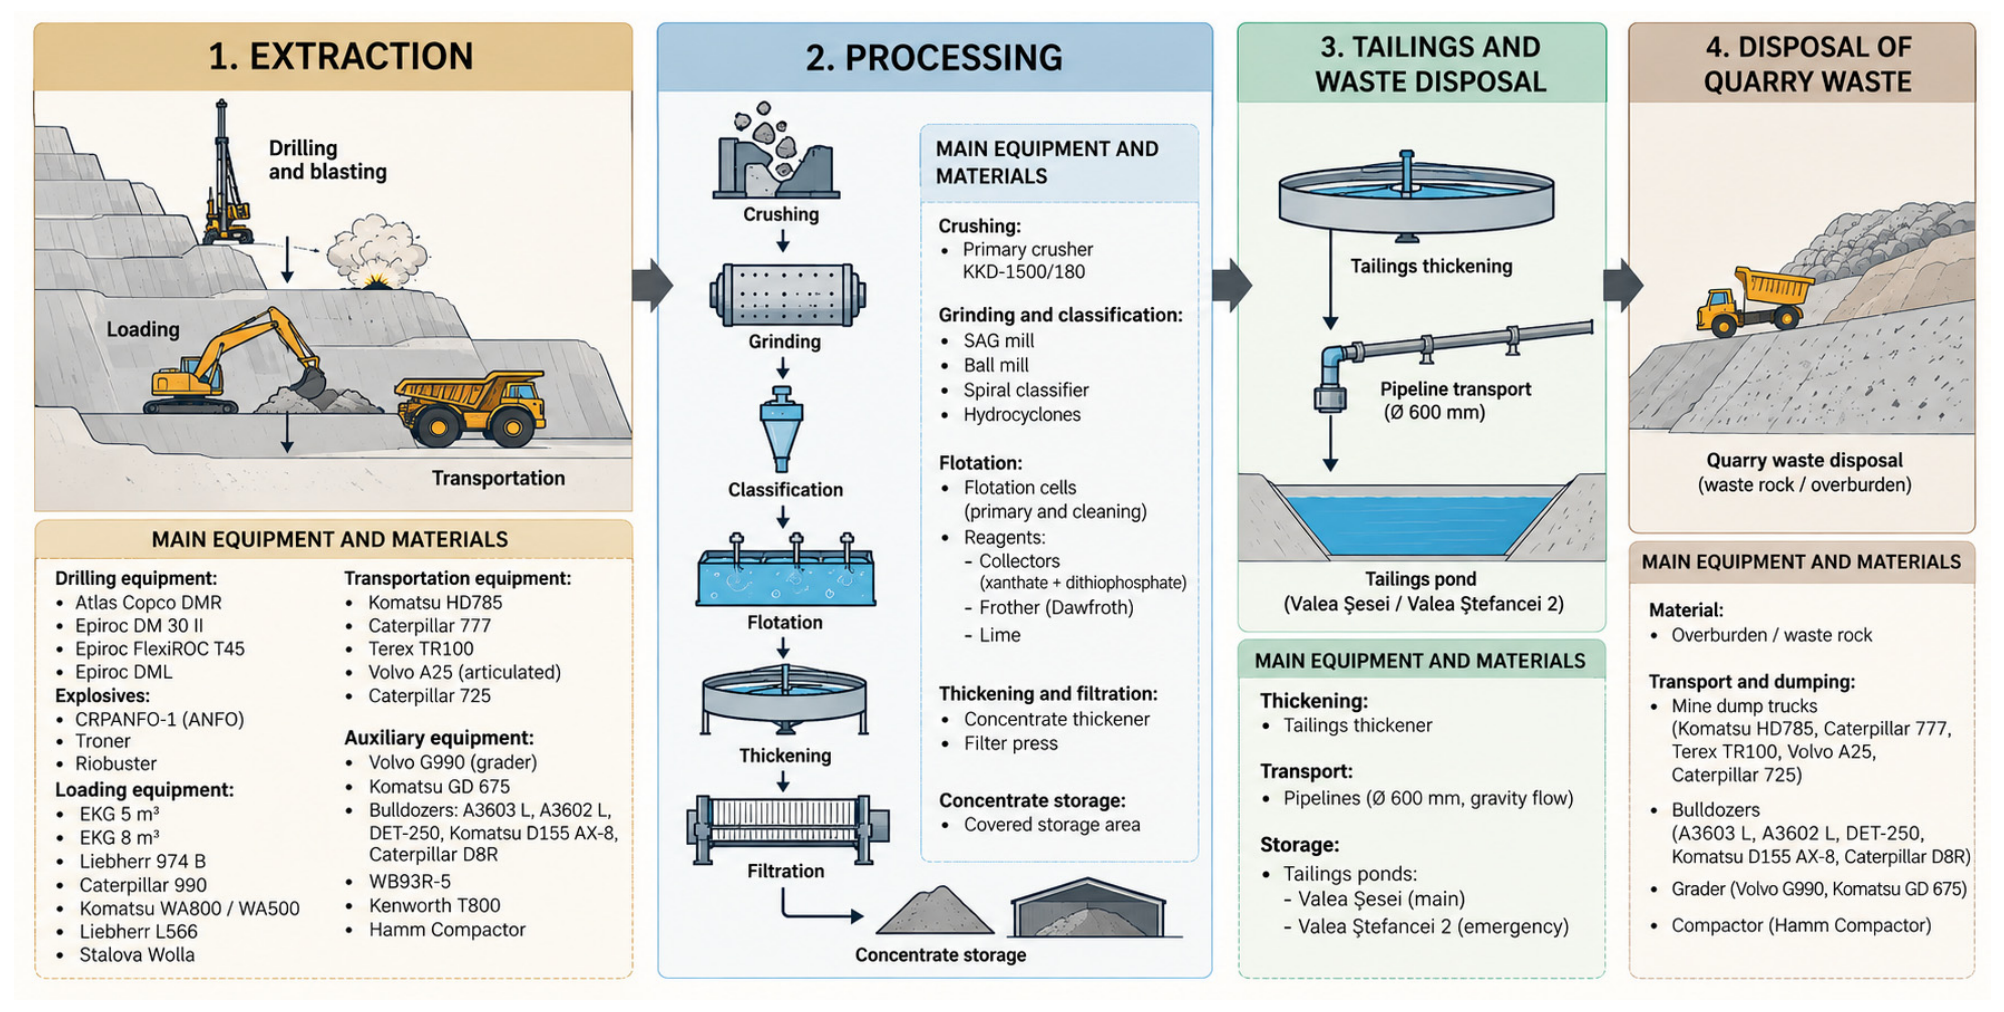
The main exploitation activities at the Rosia Poieni Copper Mine are structured around three technological stages: extraction, processing, and waste management [24]. Each stage (Figure 4) involves distinct technical operations that collectively define the environmental footprint of the mining process.
Figure 4.
Methods of copper ore exploitation at Rosia Poieni.
These operations can affect land systems, freshwater ecosystems, and long-term soil and water quality in the surrounding environment. The drilling and blasting stage are particularly relevant because it directly modifies the rock mass and influences fragmentation, the subsequent loading and crushing operations, and the overall efficiency of the mining process. For the Rosia Poieni open-pit mine, previous studies have demonstrated that the selection and optimization of drilling diameter, explosive charge distribution, and stemming parameters can influence blasting performance and limit the effects of blasting on the rock massif and the surrounding environment [25,26].
2.2. LCA Methodology and Assessment Approach
A Life Cycle Assessment (LCA) was conducted to evaluate the environmental performance of the Rosia Poieni technological flow, following the framework of ISO 14040 and ISO 14044 standards [1,2]. The main goal of the Life Cycle Assessment (LCA) for the Rosia Poieni copper mine is to evaluate and quantify the environmental impacts associated with copper production and related processes across the mine’s life cycle from resource extraction to waste management.
This LCA aims to:
- Identify key environmental hotspots in the mining and processing chain (energy use, tailings management, emissions, water pollution).
- Support decision-making for improving sustainability performance and guiding future operational or rehabilitation strategies.
- Provide a scientific basis for comparing alternative technologies, waste management practices, or remediation options.
The analysis was structured around three main exploitation activities:
- Extraction of mining mass.
- Processing of copper ore.
- Tailing and waste disposal.
Each activity was assessed for its relative contribution to five selected Planetary Boundaries (PBs), using a semi-quantitative scoring system ranging from 1 (lowest impact) to 6 (highest impact). The scoring was based on a combination of measured data (e.g., fuel use, water consumption, emission factors) and literature-derived characterization factors relevant to mining operations.
Out of the nine planetary boundaries, five were selected for this case study:
- Climate Change—due to significant CO2 and CH4 emissions from fuel combustion and energy use in mining and processing.
- Atmospheric Aerosol Loading—relevant because of dust emissions from drilling, blasting, hauling, and tailings management.
- Freshwater Change—reflecting the high-water demand of flotation processes and the risk of water contamination.
- Land-System Change—considering the large surface alteration caused by open-pit excavation and tailings storage facilities.
- Biosphere Integrity—capturing biodiversity loss and ecosystem degradation resulting from land disturbance and pollution.
The remaining planetary boundaries were excluded from the quantitative assessment due to limitations in the availability of site-specific data.
Planetary Boundaries (PBs). The scale from 1 to 6 was chosen to capture a progressive gradient of environmental pressure, from negligible influence to critical exceedance of the safe operating space. For each planetary boundary, the available process-specific data were compared with the corresponding reference intervals defined in Table 1 and assigned a score from 1 to 6, the individual scores were then summed to obtain the total impact score.
Table 1.
Rating methodology for LCA Matrix.
Where direct quantitative data were unavailable for a specific planetary boundary, the score was assigned based on the documented characteristics of the technological activity and supporting literature evidence, and was therefore treated as a screening-level estimate rather than a direct measurement.
The grades are based on reference intervals, which group the total impact score into defined ranges. These intervals were determined according to the distribution of possible total scores across the selected planetary boundaries.
Each boundary was assigned an impact value, and the sum of these values produces a total impact score. The total possible score, therefore, ranges from a minimum of 5 (if each boundary scores 1) to a maximum of 30 (if each score 6).
To categorize results into comparable grades, the total range (5–30) was divided into six approximately equal intervals, each corresponding to one impact level:
This approach facilitates a consistent screening-level comparison of environmental pressure across the assessed technological activities under conditions of incomplete data.
The assessment of the nine Planetary Boundaries within mining systems requires the selection of specific environmental indicators and corresponding reference criteria. Table 2 presents the proposed indicators, the data required for their assessment, the reference values or conditions used for comparison, and the principles for assigning scores on the six-level scale. As the environmental pressures associated with each boundary differ, the assessment criteria are adapted to their specific characteristics. Data availability and reliability are also considered separately, allowing the identification of directly measured, calculated, secondary, partially available and unavailable data. Where insufficient information is available, the corresponding boundary is reported as ND (No Data), without assigning an environmental performance score.
Table 2.
Assessment Parameters and Scoring Criteria for the Planetary Boundaries.
The environmental indicators and reference values presented in Table 2 provide the basis for assessing the nine Planetary Boundaries within the mining system. To ensure a consistent and transparent evaluation, each boundary is assigned a score according to predefined assessment principles (1–6), while the availability and quality of the underlying data are classified into five categories (D1–D5). The corresponding scoring criteria and data-availability interpretation are detailed in Table 3.
Table 3.
Scoring Principles and Data-Availability Criteria for the Assessment of Planetary Boundaries.
Due to data availability and methodological limitations, the Life Cycle Assessment (LCA) for the Rosia Poieni case study was primarily focused on emission-related data. The most consistent and accessible datasets corresponded to greenhouse gas emissions and other air pollutants generated throughout the mining and processing stages. However, recognizing that environmental performance cannot be fully represented by emissions alone, the final evaluation and grading were adjusted to also reflect additional impact aspects. These include material and resource use, water consumption, and the type and intensity of the exploitation process (such as the scale of blasting operations, ore-to-waste ratio, and processing efficiency).
By integrating these complementary factors into the final assessment, the study ensures a more balanced representation of the mine’s overall environmental footprint. Although quantitative precision was limited for some parameters, the qualitative consideration of these aspects supports a more holistic interpretation of the LCA results within the planetary boundaries framework. This approach demonstrates how LCA can remain meaningful even under partial data constraints, as long as methodological transparency and contextual adjustments are applied.
To evaluate whether the greenhouse gas (GHG) emissions associated with the Rosia Poieni copper mine can be considered high or low compared to international standards, a benchmarking analysis was carried out using officially reported emissions data from several major copper mining operations worldwide. The selected examples (Table 4) include projects with verified disclosures, such as Kamoa–Kakula (DRC), Antofagasta Minerals (Chile), Codelco (Chile), Freeport-McMoRan’s Cerro Verde (Peru), KAZ Minerals (Kazakhstan), and others, all of which publicly report their emissions intensities in sustainability or climate reports.
Table 4.
Official emissions data for copper mines and projects.
Based on reported global performance data, a BAT-oriented benchmark was developed based on the lowest reported emission intensities and the associated energy- and emission-reduction practices observed in modern copper mining operations. This BAT benchmark serves as a reference point for comparison between global average emissions from copper mining and the performance estimated for Rosia Poieni. The comparison provides a context for understanding whether Rosia Poieni’s emission levels align with current industry best practice, fall within the global average, or indicate opportunities for decarbonization and operational improvement.
The process-level greenhouse gas (GHG) emission estimates presented in this study are based on a combination of official corporate sustainability disclosures, the peer-reviewed life cycle assessment (LCA) literature [35], and industry technical reports. These sources include sustainability and climate reports from major copper producers such as Antofagasta Minerals, Codelco, Freeport-McMoRan (Cerro Verde), Kutcho Copper, and Ivanhoe Mines (Kamoa–Kakula), as well as recognized academic studies and guidance from international organizations such as the International Copper Association (ICA), International Council on Mining and Metals (ICMM), and the Intergovernmental Panel on Climate Change (IPCC) [36,37,38].
While these sources collectively provide a robust foundation for estimating total mining emissions, several limitations affect the precision of process-level (step-by-step) results:
- Most mining companies report aggregate Scope 1 and Scope 2 emissions but rarely disaggregate them by mining sub-processes such as drilling, hauling, or crushing. Consequently, detailed process-level data were inferred from peer-reviewed studies and representative mine energy balance models.
- Some reference studies focus on underground copper operations, which differ significantly from open-pit mines like Rosia Poieni in both energy intensity and emission distribution. Adjustments were therefore applied to align emission ratios with open-pit operating conditions [35].
- Where site-specific data on electricity mix or fuel type were unavailable, standardized emission factors were used [38]. This may introduce variability depending on national energy grids or the use of renewables.
- Process-step estimates were scaled to ensure consistency with the total mining-phase intensity, reflecting the average across globally reported open-pit copper operations.
- Given the limited availability of process-level data, the estimated uncertainty of the process-level emission values was considered to be approximately ±15–20%, mainly reflecting differences in equipment efficiency, haul distance, and ore hardness. This range is used as an indicative uncertainty estimate for the screening-level assessment rather than as a statistically derived confidence interval. Overall, these data provide a framework for comparing the Rosia Poieni mine’s GHG performance with global averages and best available techniques (BAT) (Table 5), recognizing that some degree of estimation was required due to gaps in publicly available process-level reporting.Table 5. Best available technique indicators for process-level emissions.
Based on compiled official reports and peer-reviewed data, the low-emission benchmark, represented by modern and energy-efficient operations such as Kamoa–Kakula (Ivanhoe Mines), achieve emission intensities as low as 0.16 t CO2-eq per t Cu. These results reflect the implementation of state-of-the-art technologies, including high-grade ore processing, electric or hybrid haulage systems, optimized comminution circuits, and a substantial reliance on renewable electricity.
The global average across major copper producers (Codelco, Antofagasta, Freeport-McMoRan) remains significantly higher at approximately 2.37 t CO2-eq per t Cu, reflecting conventional open-pit methods, diesel-based haulage, and variable grid emission factors.
3. Results and Discussion
The data used in the Planetary Boundaries assessment were obtained from different sources, depending on the indicator considered. The primary operational data, including diesel and electricity consumption and other relevant process parameters, were provided directly by the mining company and used to calculate process-specific GHG emissions for PB1 (Climate Change). Data concerning land occupation for PB8 (Land System Change) and biodiversity-related information for PB9 (Biosphere Integrity) were obtained from company and environmental reports. The remaining indicators were assessed using the corresponding operational information and environmental data available for the study, as specified in Table 6. All data were adapted to the scope of the screening-level assessment.
Table 6.
Planetary boundaries used for the LCA Matrix.
The application of the proposed scoring procedure is illustrated for the transportation stage under PB1—Climate Change. The same assessment principle is independently applied to each selected Planetary Boundary and mining activity, using the corresponding environmental indicators and reference values. Following completion of the life cycle inventory (LCI), the operational data collected for this process were used to calculate the associated greenhouse gas (GHG) emissions. The assessment considers direct emissions from diesel combustion, upstream emissions associated with fuel production and supply, and emissions related to equipment manufacturing.
Step 1. Calculation of total annual emissions
Total annual emissions (Etotal) are calculated by aggregating direct emissions (Edirect) upstream emissions (Eupstream) and equipment manufacturing emissions (Eequipment):
Step 2. Conversion to the functional unit
Total annual emissions are normalized by the annual ore production (Pannual), expressed in tonnes of ore per year, to obtain the specific GHG emission intensity (IGHG):
Step 3. Comparison with the BAT reference interval
The calculated emission intensity (IGHG) is compared with the minimum (BATmin) and maximum (BATmax) values of the corresponding BAT reference interval.
When the calculated value falls within the reference interval, its relative position is determined as:
For values exceeding the upper BAT reference limit, the percentage deviation is calculated as:
Step 4. Assignment of the environmental score
The final environmental performance score (S) is assigned according to the calculated relative position or percentage deviation, following the six-level classification presented in Table 1:
Accordingly, the transportation stage receives a score ranging from 1 to 6, depending on its calculated GHG emission intensity relative to the BAT reference interval. This procedure ensures that the final score is derived from the calculated environmental indicator rather than assigned through subjective judgment.
The procedure described above is repeated for all five selected Planetary Boundaries and each activity included in the mining system. The resulting individual scores are presented in the calibration matrix (Table 7), where each activity is characterized by five separate Planetary Boundary scores. The cumulative score is calculated by summing these individual values, providing an aggregated screening-level indicator of the environmental pressures associated with each activity. For example, the blasting activity obtains a cumulative score of 26, resulting from the sum of its individual scores: PB1 (5), PB4 (5), PB7 (4), PB8 (6), and PB9 (6).
Table 7.
Case study assessment result.
The Planetary Boundaries assessment complements the LCA results by providing an additional basis for prioritizing environmental hotspots. The aggregated scores in Table allow the comparison of mining activities according to their relative environmental pressure, while the individual boundary scores help identify the main environmental dimensions associated with each activity. These findings were considered together with the LCA results when selecting the optimization measures discussed in the following section, ensuring that the proposed improvements address both emission-related impacts and broader environmental pressures.
The calibration matrix illustrates the distribution of emission-related environmental pressures across the main technological activities of the copper production system. Due to the limited availability of site-specific data, the calibration was performed primarily using available emission data. Therefore, the resulting scores represent a screening-level assessment of the environmental pressures associated with each activity and should not be interpreted as a comprehensive quantification of all environmental pressures.
The results indicate a differentiated distribution of environmental pressures across the technological flow. Blasting records the highest cumulative score (26), followed by crushing (24), transportation (22), and grinding (21). These activities therefore represent the main emission-related hotspots identified by the calibration matrix. Loading presents a cumulative score of 18, while flotation and drilling obtain scores of 17 and 16, respectively. Gravitational transport also records a score of 16. Lower cumulative scores are observed for thickening (14), quarry-waste storage (14), and filtration (13).
Overall, the calibration results indicate that the highest emission-related pressures are associated with the extraction and primary processing stages, particularly blasting and crushing, followed by transportation and grinding. These activities can therefore be considered priority areas for further assessment and potential environmental optimization. The matrix provides a screening-level basis for linking the technological flow with the selected Planetary Boundaries, while recognizing that the results are constrained by the availability of emission data.
Optimization Opportunities for Environmental Impact Reduction
Following the Life Cycle Assessment (LCA) of the Rosia Poieni mining operation, a potential optimization process was developed to identify measures capable of reducing the overall environmental impact. The proposed optimization framework is grounded in a comparative analysis of advanced methodologies and best practices reported across the recent scientific literature. Studies on predictive blasting strategies have demonstrated how data-driven approaches can significantly improve cost efficiency and reduce operational risks, offering valuable guidance for refining drilling and blasting activities within the mine’s extraction phase [39]. Further insights from machine learning-based energy optimization research highlight the potential for reducing fuel consumption and enhancing overall energy efficiency across mining operations, providing a benchmark for modernizing the mine’s processing and transportation systems [39,40]. Optimization principles applied to open-pit design, waste management, and equipment selection, as successfully implemented in the Jbel Tirremi project, serve as an additional reference for improving material handling and tailings management strategies [41,42]. The integration of sensor technologies, as emphasized in recent reviews, also supports improved monitoring, safety, and real-time decision-making throughout the technological flow [42]. Foundational work on simulation and optimization in open-pit mining further reinforces the value of computational tools for evaluating multiple operational scenarios and identifying the most efficient configurations [43,44]. Collectively, these sources establish a solid scientific basis for implementing optimized, technology-enhanced solutions across the mine’s full operational chain.
The optimization process was examined for each major operational stage: Drilling and Blasting, Loading, Transportation, Crushing and Grinding, Belt Conveyor Transport, and Waste Storage (including tailings management and pumping). Each stage was analyzed in terms of its energy demand, emission potential, and resource efficiency.
The analysis draws on published studies that have demonstrated effective technological and operational improvements in similar mining contexts. For instance, energy-efficient blasting designs and high-efficiency electric drilling rigs have been shown to reduce both fuel use and emissions at the extraction stage. Likewise, the introduction of in-pit crushing and conveying (IPCC) systems and optimized haul truck scheduling has been reported to significantly lower greenhouse gas emissions and operational costs compared to conventional haulage systems.
This comparative approach provides a foundation for proposing site-specific optimization strategies for the Rosia Poieni mine, aligning the results of the LCA with practical measures for improved environmental performance and operational efficiency.
For each mining or processing activity i (drilling, blasting, transportation), the optimized emission intensity after implementing an efficiency or decarbonization measure is computed as:
where
- Ei,baseline = baseline emission intensity (kg CO2-eq per kg Cu).
- ri = reduction fraction = (assumed reduction %)/100.
- Ei,optimized = emission intensity after optimization.
- The 1 represents the entire baseline emission—100% of the original amount.
This formula simply scales the original (baseline) emission by the proportion of emissions remaining after implementing the improvement.
The formula reflects a linear proportional reduction model, appropriate for screening-level assessments where efficiency measures reduce energy or fuel use in direct proportion to emissions.
This study evaluates potential reductions in energy use and greenhouse gas (GHG) emissions across key open-pit mining processes using scenario-based assumptions derived from the published literature. Due to the strong site-specific dependence of mining operations, including ore properties, mine geometry, equipment selection, and electricity mix, no single average reduction value is reported in the literature for most processes.
Instead, published studies typically report ranges of energy or fuel reductions obtained under specific operational or technological changes. In this work, such reported ranges were compiled for each process, and conservative mid-range or lower-bound values were selected to define realistic improvement scenarios. These values do not represent measured performance at a specific site, but rather plausible reductions consistent with documented operational experience.
Where electrification or renewable electricity supply is involved, energy-use reductions and GHG emission reductions are treated separately. Energy reductions reflect improvements in operational efficiency, while GHG reductions additionally depend on the carbon intensity of the electricity supply. To avoid overestimation, this study does not assume full electrification or zero-carbon electricity, but rather partial deployment and transitional power systems.
Direct emissions from diesel combustion were distinguished from upstream emissions associated with electricity generation, using source-specific emission factors. The assessment adopted emission factors of 2.68 kg CO2/L for direct diesel combustion, 0.60 kg CO2/L for upstream diesel emissions, and 0.27 kg CO2/kWh for electricity generation, representative of the Romanian electricity mix. The optimization scenarios apply literature-derived reduction ranges to the relevant process activities and energy inputs. Consequently, the estimated emission reductions are indicative and depend on both the assumed efficiency improvements and the emission characteristics of the energy sources involved. In particular, reductions in electricity consumption translate into lower greenhouse gas emissions according to the carbon intensity of the electricity mix, whereas reductions in diesel consumption affect both direct combustion and upstream fuel-related emissions.
The resulting emission values therefore represent indicative scenario outcomes, intended to support comparative assessment and sensitivity analysis rather than to predict site-specific performance. This approach is consistent with established life cycle assessment practice for mining systems, where transparency of assumptions and use of ranges are preferred over fixed or universal reduction factors.
All reduction values represent assumed scenario ranges based on literature-reported improvements and should be interpreted as indicative rather than predictive.
The optimized ranges presented in Table 8 were obtained by applying the minimum and maximum reduction percentages assumed for each activity to its corresponding baseline emission intensity. The lower value represents the application of the higher reduction percentage, while the upper value corresponds to the lower reduction percentage. For example, the drilling and blasting range (0.413–0.468) results from applying the assumed 15–25% reduction to the baseline value of approximately 0.550. Similarly, the transportation range (0.258–0.353) results from applying a 25–45% reduction to a baseline value of approximately 0.470.
Table 8.
Optimization scenario for Rosia Poieni copper mine—estimated emission reductions.
Potential overlaps between optimization measures were considered when establishing the reduction ranges. Therefore, the individual contributions of measures were not summed directly. Instead, the ranges represent an indicative combined reduction potential for each activity, accounting for interactions between related measures. For example, improvements in rock fragmentation may generate benefits in both blasting and subsequent comminution stages. This approach aims to avoid double-counting and provides a more realistic representation of potential environmental improvements.
The largest relative reduction potentials are associated with mobile equipment, particularly loading and haulage operations. In these processes, improvements are driven primarily by operational measures (operator behavior, dispatching, and idle reduction), with additional GHG mitigation achievable through partial electrification. However, the table indicates that energy-use reductions and GHG reductions are not equivalent, as the latter depend on the carbon intensity of the electricity supply.
Drilling and blasting show moderate but consistent reduction potential, mainly through improved fragmentation, which generates indirect benefits by lowering downstream energy demand in loading and comminution. Similarly, crushing and grinding exhibits meaningful energy-reduction potential due to the inherently high energy intensity of comminution, although achievable gains depend strongly on ore hardness and circuit configuration.
Processes such as belt conveying and tailings pumping present lower absolute emissions but still offer incremental efficiency gains through targeted technical measures, particularly where slurry volumes or conveying conditions are favorable. Overall, the table illustrates that meaningful emission reductions in open-pit mining are achieved not through a single intervention, but through the combined and interacting effects of multiple operational and technological improvements, applied conservatively within documented performance ranges.
4. Conclusions
The main objective of this study was to demonstrate the applicability of an integrated methodological framework combining Life Cycle Assessment (LCA), a screening-level Planetary Boundaries (PB) assessment, process-level hotspot identification, and scenario-based analysis. Applied to a copper mining operation, the framework provides a structured approach for evaluating environmental pressures, identifying priority processes, and exploring potential improvement pathways. The assessment follows ISO 14040 and ISO 14044 principles, while the PB component serves as a screening tool rather than a quantitative measurement of planetary-boundary exceedance.
The estimated baseline greenhouse gas emission intensity was approximately 1.916 kg CO2-eq per kg Cu. Loading was identified as the largest contributor, accounting for 0.810 kg CO2-eq/kg Cu (42.3%), followed by drilling and blasting at 0.550 kg CO2-eq/kg Cu (28.7%) and transportation at 0.470 kg CO2-eq/kg Cu (24.5%). Crushing and grinding, waste storage, and belt conveyor transport contributed 3.7%, 0.7%, and 0.2%, respectively. These results identify mobile equipment, blasting activities, and material transportation as the main GHG emission hotspots.
The PB screening identified relevant environmental pressures associated with climate change, atmospheric aerosol loading, freshwater change, land-system change, and biosphere integrity. These findings demonstrate the importance of considering multiple environmental dimensions alongside GHG emissions. However, given the qualitative and semi-quantitative nature of some indicators and the limitations of available data, the results should be interpreted as an indication of relative environmental pressures rather than evidence of planetary-boundary exceedance.
The scenario-based optimization analysis indicated potential opportunities for reducing environmental impacts through improved blasting practices, more efficient loading and haulage, partial electrification, optimized conveyor systems, energy-efficient comminution, and improved tailings management. The estimated reduction ranges are based on literature-derived assumptions and represent illustrative scenarios rather than verified site-specific improvements. Their practical implementation would require further assessment of technical feasibility, operational conditions, and economic constraints. Overall, the integrated framework provides a screening-level decision-support approach for identifying environmental hotspots and prioritizing potential improvements in copper mining, particularly under conditions of limited site-specific data. Further research should focus on improving inventory data, refining uncertainty analysis, and evaluating the technical and economic feasibility of the identified optimization measures.
Author Contributions
Conceptualization, R.C., M.L. and C.D.; methodology, R.C.; validation, R.C., M.L. and C.D.; formal analysis, R.C.; investigation, R.C.; resources, R.C.; data curation, R.C.; writing—original draft preparation, R.C.; writing—review and editing R.C.; visualization, R.C.; supervision, M.L. and C.D. All authors have read and agreed to the published version of the manuscript.
Funding
This research received no external funding.
Institutional Review Board Statement
Not applicable.
Informed Consent Statement
Not applicable.
Data Availability Statement
The original contributions presented in this study are included in the article. Further inquiries can be directed to the corresponding author.
Acknowledgments
The article processing charge was supported by the University of Petrosani.
Conflicts of Interest
The authors declare no conflicts of interest.
References
- ISO 14040:2006; Environmental Management—Life Cycle Assessment—Principles and Framework. ISO: Geneva, Switzerland, 2006.
- ISO 14044:2006; Environmental Management—Life Cycle Assessment—Requirements and Guidelines. ISO: Geneva, Switzerland, 2006.
- Klöpffer, W.; Grahl, B. Life Cycle Assessment (LCA): A Guide to Best Practice; Wiley-VCH: Weinheim, Germany, 2014; pp. 1–396. [Google Scholar] [CrossRef] [Scilit]
- Azadi, M.; Northey, S.A.; Ali, S.H.; Edraki, M. Transparency on greenhouse gas emissions from mining to enable climate change mitigation. Nat. Geosci. 2020, 13, 100–104. [Google Scholar] [CrossRef] [Scilit]
- Sarıışık, G.; Göncü, B.; Özkan, Y. An Explainable and Multidimensional Climate Performance Index: Integrating Statistical Validation and Machine Learning-Based Structural Diagnostics. Sustainability 2026, 18, 8336. [Google Scholar] [CrossRef] [Scilit]
- Farjana, S.H.; Mahmud, M.A.P.; Huda, N. Life Cycle Assessment for Sustainable Mining; Elsevier: Amsterdam, The Netherlands, 2021. [Google Scholar] [CrossRef] [Scilit]
- Hagedorn, W.; Greiff, K.; Pauliuk, S. A Framework for the Environmental Assessment of Circular Interventions to Steel Products; Universitätsbibliothek der RWTH Aachen: Aachen, Germany, 2025. [Google Scholar]
- San Miguel, G.; Cerrato, M. Life Cycle Sustainability Assessment of the Spanish Electricity: Past, Present and Future Projections. Energies 2020, 13, 1896. [Google Scholar] [CrossRef] [Scilit]
- Becker, F.; Scholl, C.; Rüttinger, L.; Ackern, P.V.; Rechlin, A.; Priester, M.; Schöning, N.; Vogt, R.; Kämper, C. Comparative Analysis of Case Studies for Mining Sites Worldwide: OekoRess II: Working Report on Environmental Hazards and Impacts, Governance Challenges and Indicators. 2020. Available online: https://www.umweltbundesamt.de/en/publikationen/comparative-analysis-of-case-studies-for-mining (accessed on 16 January 2026).
- Hussein, Z.; Benetto, E.; Saidani, M. Integrating planetary boundaries into safe and sustainable by design framework: A systematic literature review. Sustain. Prod. Consum. 2025, 60, 64–77. [Google Scholar] [CrossRef] [Scilit]
- Ryberg, M.; Owsianiak, M.; Clavreul, J.; Mueller, C.; Sim, S.; King, H.; Hauschild, M. How to bring absolute sustainability into decision-making: An industry case study using a Planetary Boundary-based methodology. Sci. Total Environ. 2018, 634, 1406–1416. [Google Scholar] [CrossRef] [Scilit] [PubMed]
- Devecchi, S.; Reppas-Chrysovitsinos, E.; Tromer Dragsdahl, A.L.S.; Pizzol, L.; Semenzin, E.; Zabeo, A.; Hristozov, D.; Rydberg, T. Planetary Boundaries and Absolute Sustainability in Life Cycle Assessment—Past, present, and future. Integr. Environ. Assess. Manag. 2026, vjag150, Advance online publication. [Google Scholar] [CrossRef] [Scilit] [PubMed]
- Paulillo, A.; Sanyé-Mengual, E. Approaches to incorporate Planetary Boundaries in Life Cycle Assessment: A critical review. Resour. Environ. Sustain. 2024, 17, 100169. [Google Scholar] [CrossRef] [Scilit]
- Devecchi, S.; Reppas-Chrysovitsinos, E.; Dragsdahl, A.L.T.S.; Pizzol, L.; Semenzin, E.; Zabeo, A.; Hristozov, D.; Ryberg, M.; Owsianiak, M.; Richardson, K.; et al. Development of a life-cycle impact assessment methodology linked to the Planetary Boundaries framework. Ecol. Indic. 2018, 88, 250–262. [Google Scholar] [CrossRef] [Scilit]
- Steffen, W.; Richardson, K.; Rockström, J.; Cornell, S.E.; Fetzer, I.; Bennett, E.M.; Biggs, R.; Carpenter, S.R.; de Vries, W.; de Wit, C.A.; et al. Sustainability. Planetary boundaries: Guiding human development on a changing planet. Science 2015, 347, 1259855. [Google Scholar] [CrossRef] [Scilit] [PubMed]
- Sadat Mousavi, H.S.; Rahimi, M.; Ghorbani, M. A Look at Planetary Boundaries: Current Status and Implications of Their Breach for Humanity. Zist Sepehr Stud. Mag. 2024, 17, 125–130. [Google Scholar]
- van Vuuren, D.P.; Doelman, J.C.; Schmidt Tagomori, I.; Beusen, A.H.W.; Cornell, S.E.; Röckstrom, J.; Schipper, A.M.; Stehfest, E.; Ambrosio, G.; van den Berg, M.; et al. Exploring pathways for world development within planetary boundaries. Nature 2025, 641, 910–916. [Google Scholar] [CrossRef] [Scilit] [PubMed]
- Brand, U.; Muraca, B.; Pineault, É.; Sahakian, M.; Schaffartzik, A.; Novy, A.; Streissler, C.; Haberl, H.; Asara, V.; Dietz, K.; et al. From planetary to societal boundaries: An argument for collectively defined self-limitation. Sustain. Sci. Pract. Policy 2021, 17, 264–291. [Google Scholar] [CrossRef] [Scilit]
- Dittrich, M.; Liebich, A.; Ewers, B.; Kathan, A.; Schoer, K.; Müller, J. Limits to Consumption: Sustainable Consumption Considering Planetary Boundaries; Umweltbundesamt: Dessau, Germany, 2024. [Google Scholar] [CrossRef]
- Dao, H.; Friot, D. Planetary Boundaries: Designing (fair?) limits to assess performance at the country level. Front. Sustain. Resour. Manag. 2025, 4, 1537031. [Google Scholar] [CrossRef] [Scilit]
- Fang, K.; Heijungs, R.; De Snoo, G.R. Understanding the complementary linkages between environmental footprints and planetary boundaries in a footprint–boundary environmental sustainability assessment framework. Ecol. Econ. 2015, 114, 218–226. [Google Scholar] [CrossRef] [Scilit]
- Dionizio Leite, P.; Hourneaux Junior, F. Planetary boundaries as a way of assessing environmental performance: A methodological approach proposal. Rev. Adm. UFSM 2024, 17, e7. [Google Scholar] [CrossRef] [Scilit]
- Hedlund-de Witt, A. Rethinking Sustainable Development: Considering How Different Worldviews Envision “Development” and “Quality of Life”. Sustainability 2014, 6, 8310–8328. [Google Scholar] [CrossRef] [Scilit]
- Cujba, R.S.; Lazăr, M. Copper Mining’s Green Revolution—Sustainable Techniques and Technologies Shaping the Future. Min. Rev. 2024, 30, 32–50. [Google Scholar] [CrossRef] [Scilit]
- Toderas, M. Optimization study of blasting operations in Roşia Poieni open pit mine, Romania. Min. Mineral. Depos. 2021, 15, 43–55. [Google Scholar] [CrossRef] [Scilit]
- Toderas, M. Explosive Charge Distribution: A Parameter for evaluating the Blasting Results in Rosia Poieni Open Pit Mining. Adv. Chall. Sci. Technol. 2023, 2, 1–34. [Google Scholar] [CrossRef] [Scilit]
- Ivanhoe Mines Announces Updated Greenhouse Gas Assessment Confirming Kamoa-Kakula Copper Complex as the World’s Lowest Carbon-emitting Major Copper Mine. 2023. Available online: https://www.ivanhoemines.com/wp-content/uploads/20231102-GHG-emissions-update-and-Inga-II-update-VF.pdf (accessed on 19 January 2026).
- KAZ Minerals—Climate/Sustainability Disclosures (Company Website). 2024. Available online: https://www.kazminerals.com/sustainability/environment/climate-change (accessed on 22 January 2026).
- Antofagasta Minerals—Sustainability Report Page 68. 2024. Available online: https://www.antofagasta.co.uk/media/4799/antofagasta-sustainability-report-2024.pdf (accessed on 1 February 2026).
- Cerro Verde—2023 Sustainability Report Page 92. 2023. Available online: https://www.cerroverde.pe/assets/img/publicaciones/Sustainability-Report-2023.pdf (accessed on 5 February 2026).
- Codelco—Sustainability Report Page 7. 2024. Available online: https://www.codelco.com/prontus_codelco/site/docs/20250610/20250610162815/250717_codelco_alta.pdf (accessed on 13 February 2026).
- Kutcho Copper Demonstrates Low Project Life GHG Emissions. 2023. Available online: https://kutcho.ca/wp-content/uploads/2023/02/Kutcho_News-Release_2023-02-14.pdf (accessed on 18 February 2026).
- Rio Tinto—Climate Reporting. Scope 1, 2 and 3 Emissions Calculation and Climate Methodology. 2024. Available online: https://www.riotinto.com/en/invest/reports (accessed on 25 February 2026).
- Liwanag, A. Beyond the Grid—Copper’s Decarbonization Focus Shifts Toward Mines; S&P Global Market Intelligence: New York, NY, USA, 2025; Available online: https://www.spglobal.com/market-intelligence/en/news-insights/research/2025/09/beyond-the-grid-coppers-decarbonization-focus-shifts-toward-mines (accessed on 3 March 2026).
- Norgate, T.E.; Haque, N. Energy and greenhouse gas impacts of mining and mineral processing operations. J. Clean. Prod. 2010, 18, 266–274. [Google Scholar] [CrossRef] [Scilit]
- ICMM. Tailings Management-Good Practice Guide; International Council on Mining and Metals (ICMM): London, UK, 2025; Available online: https://www.icmm.com/website/publications/pdfs/innovation/2025/tailings-management-good-practice-guide-2nd.pdf?cb=94652 (accessed on 5 March 2026).
- IEA. Global Critical Minerals Outlook 2024; IEA: Paris, France, 2024; Available online: https://www.iea.org/reports/global-critical-minerals-outlook-2024 (accessed on 10 March 2026).
- IPCC. 2021: Summary for Policymakers. In Climate Change 2021: The Physical Science Basis. Contribution of Working Group I to the Sixth Assessment Report of the Intergovernmental Panel on Climate Change; Masson-Delmotte, V., Zhai, P., Pirani, A., Connors, S.L., Péan, C., Berger, S., Caud, N., Chen, Y., Goldfarb, L., Gomis, M.I., et al., Eds.; IPCC: Geneva, Switzerland, 2021; Available online: https://www.ipcc.ch/report/ar6/wg1/downloads/report/IPCC_AR6_WGI_SPM_final.pdf (accessed on 10 April 2026).
- Fattahi, H.; Ghaedi, H.; Jahed Armaghani, D. Enhancing blasting efficiency: A smart predictive model for cost optimization and risk reduction. Resour. Policy 2024, 97, 105261. [Google Scholar] [CrossRef] [Scilit]
- Parvathareddy, S.; Yahya, A.; Amuhaya, L.; Ravi, S.; Suglo, R. Transforming mining energy optimization: A review of machine learning techniques and challenges. Front. Energy Res. 2025, 13, 1569716. [Google Scholar] [CrossRef] [Scilit]
- Surya, S.; Srinadh, V.; Tripathi, S.; Saxena, K.; Inumula, K.M.; Quraishi, S.J. Energy Consumption Optimization in Mining Operations via Machine Learning Techniques. J. Mines Met. Fuels 2025, 73, 2675–2686. [Google Scholar] [CrossRef] [Scilit]
- Cherai, M.; Rddad, L.; Azougay, A.; Khafouri, A.; Adardor, S.; Talbi, F. Optimized Open-Pit Design, Waste Management, and Equipment Selection for the Jbel Tirremi Fluorite Deposit, Morocco. Earth Syst. Environ. 2026, 10, 1863–1884. [Google Scholar] [CrossRef] [Scilit]
- Mohan, H.; Avchar, A. A state-of-the-art review on the applications of sensors in the mining industry. Disaster Adv. 2025, 18, 209–215. [Google Scholar] [CrossRef] [Scilit]
- Upadhyay, S.; Askari Nasab, H.; Tabesh, M.; Badiozamani, M. Simulation and optimization in open pit mines. In Proceedings of the Applications of Computers and Operations Research in Mineral Industry—37th APCOM, Fairbanks, AK, USA, 23–27 May 2015; pp. 242–244. [Google Scholar]
- Demir Şahin, D.; Eker, H. Environmental Assessment of Blasting in a Copper Quarry. Sylwan 2025, 38, 62–98. [Google Scholar] [CrossRef] [Scilit]
- Nunes, R.A.; De Tomi, G.F.C. Technological Innovation to Support the Decision-Making Process for Open Pit Mining: The Application of Technological Models and Semi-Mobile In-Pit Crushing and Conveying Scenario’s Evaluation. Doctoral Dissertation, University of São Paulo, São Paulo, SP, Brazil, 2019. [Google Scholar]
- Moreau, K.; Laamanen, C.; Bose, R.; Shang, H.; Scott, J.A. Life cycle assessment to demonstrate how automation improves the sustainability performance of an underground mining operation. J. Sustain. Min. 2020, 19, 4. [Google Scholar] [CrossRef] [Scilit]
- Nikbin, R.; Bagherpour, R.; Purhamadani, E.; Taherinia, A. Enhancing sustainability in mining by reducing hauling energy consumption through optimization of distance and slope with semi-mobile in-pit crushers and conveyors. Sci. Rep. 2025, 15, 22119. [Google Scholar] [CrossRef] [Scilit] [PubMed]
- Kittipongvises, S.; Chavalparit, O.; Sutthirat, C. Greenhouse Gases and Energy Intensity of Granite Rock Mining Operations in Thailand: A Case of Industrial Rock-Construction. Environ. Clim. Technol. 2016, 18, 64–75. [Google Scholar] [CrossRef] [Scilit]
- Aydogdu, K.; Duzgun, S.; Yaylaci, E.D.; Aranoglu, F. A Systems Engineering Approach to Decarbonizing Mining: Analyzing Electrification and CO2 Emission Reduction Scenarios for Copper Mining Haulage Systems. Sustainability 2024, 16, 6232. [Google Scholar] [CrossRef] [Scilit]
- Mannheim, V.; Kruszelnicka, W. Energy-Model and Life Cycle-Model for Grinding Processes of Limestone Products. Energies 2022, 15, 3816. [Google Scholar] [CrossRef] [Scilit]
- Xia, W.; Geng, Y.; Zhao, C.; Tao, M.; Qiu, X. Towards Sustainable Minerals for Energy Transition: LCA Insights from an Open-Pit Molybdenum—Copper Mine. Sustainability 2025, 17, 4849. [Google Scholar] [CrossRef] [Scilit]
- Kawalec, W.; Król, R.; Suchorab, N. Regenerative Belt Conveyor versus Haul Truck-Based Transport: Polish Open-Pit Mines Facing Sustainable Development Challenges. Sustainability 2020, 12, 9215. [Google Scholar] [CrossRef] [Scilit]

Disclaimer/Publisher’s Note: The statements, opinions and data contained in all publications are solely those of the individual author(s) and contributor(s) and not of MDPI and/or the editor(s). MDPI and/or the editor(s) disclaim responsibility for any injury to people or property resulting from any ideas, methods, instructions or products referred to in the content. |
© 2026 by the authors. Licensee MDPI, Basel, Switzerland. This article is an open access article distributed under the terms and conditions of the Creative Commons Attribution (CC BY) license.